This is Naked Capitalism fundraising week. 1468 donors have already invested in our efforts to combat corruption and predatory conduct, particularly in the financial realm. Please join us and participate via our donation page, which shows how to give via check, credit card, debit card, or PayPal. Read about why we’re doing this fundraiser, what we’ve accomplished in the last year, and our current goal, more original reporting.
Yves here. New York City not all that long ago showed year-to-year declines in rental prices (as opposed to soft price cuts via landlord concessions) due to an apartment building boom putting a lot of new units on the market. But the Covid-19 rent reductions are another matter entirely.
Even though the outlook for New York City is particularly grim due to the loss of revenues from commuters and tourists, the idea that the “work at home” new normal will survive Covid-19 is overstated. A recent Wall Street Journal compilation of interview finding with major company CEOs found that overwhelmingly they viewed remote working a negative for their business. They saw the loss of informal interaction as a major cost, and most also believed productivity was lower. So expect to see an eventual return to offices. But will those offices be in the same major urban centers?
By Wolf Richter, editor at Wolf Street. Originally published at Wolf Street
The combination of work-from-anywhere, ridiculously expensive rents, and coronavirus-fears associated with being on crowded elevators in apartment towers, is doing a job on the rental market in San Francisco. And not just in San Francisco, but also in New York, Seattle, Boston, San Jose, Los Angeles, Washington DC, Denver, and other expensive big-city rental markets. But it’s hitting San Francisco, the most expensive rental market, the hardest.
In some other markets, rents are skyrocketing. So here we go with our roller-coaster ride through the cities.
San Francisco rents in free-fall but still ridiculously crazy expensive.
The median asking rent for one-bedroom apartments in San Francisco plunged by 6.9% in September from August, after having plunged by 5.0% in August from July, to $2,830. This brings the five-month decline since April to 19%, and the 12-month decline to 20%, according to data from Zumper’s Rent Report. From the peak in June 2019 – which had eked past by a hair the prior high of October 2015 – the median asking rent for 1-BR apartments has plunged 24%!
For 2-BR apartments in San Francisco, the median asking rent plunged by 6.6% in September from August, after having plunged by 3.3% in August from July, to $3,800, bringing the five-month decline since April to 16% and the 12-month decline to 20%. And 24% from the peak in October 2015.
To convert this plunge from percentages into fiat, so to speak, the median asking rent for a 2-BR apartment has plunged by $950 from September a year ago, and by $1,200 from the peak in October 2015. This is no longer a rounding error.
These median asking rents do not include concessions, such as “one month free” or “two months free” or “free parking for a year” and the like. These concessions have the effect of drastically lowering the rent further. “Two-months free” lowers the rent over the 14-month period by 16%. Concessions, instead of rent cuts, allow landlords to show the monthly rents, as they’re spelled out in the lease, without the concessions, to their now very nervous banks.
Despite this huge drop in rents, in terms of cities, San Francisco remains the most ridiculously crazy-expensive rental market in the US. But in terms of zip codes, there are a handful of zip codes in Manhattan and in Los Angeles that are more expensive than the most expensive zip code in San Francisco.
“Free upgrades” is what the people who have decided to stay in San Francisco are now looking for. This is the strategy of shopping around among the soaring vacancies for an apartment with the same rent or even lower rent, but of much higher quality and in a better location. It creates churn. Landlords that lost a tenant to a “free upgrade” now have to price their vacant unit competitively, meaning undercutting other offers. This churn and the high vacancies explain the rapid reaction of the market to the current situation. The City of Boom and Bust always. And now is the bust.
After New York City re-opened, rents plunged.
Similar to San Francisco, New York City is losing part of its work-from-anywhere crowd that would rather work from a nicer bigger cheaper place further away, or even from a house they’d just bought in the suburbs, leading to surging vacancies, aggressive pricing, and lots of concessions.
The median asking rent for 1-BR apartments dropped 3.7% in September from August, to $2,830, after having dropped 4.9% in August from July, and is down 12.5% year-over-year.
For 2-BR apartments, the median asking rent dropped 1.6% in the month, after having plunged 5.0% in the prior month, and is down 11.3% year-over-year. In New York, peak-asking-rent occurred in March 2016, and asking rents have since plunged 23% for 1-BR apartments and 25% for 2-BR apartments.
Landlords are aggressively offering concessions in New York City, and tenants are aggressively shopping for “free upgrades.” Things are moving and churning.
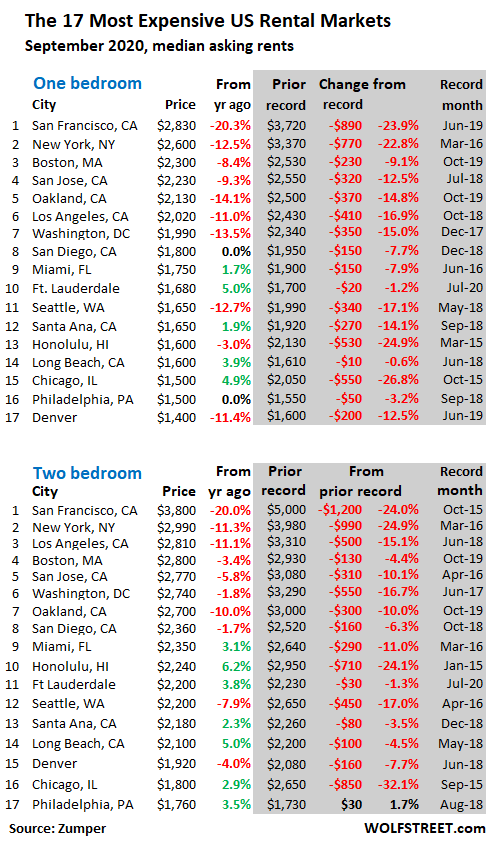
The 17 most expensive rental markets.
The table below shows the 17 most expensive major rental markets by median asking rents, based on Zumper’s data. The more expensive, the bigger the drops. The table shows September rent and the year-over-year percentage. In the shaded area, it shows peak rent and change from peak. Interestingly, Chicago and Honolulu, whose rental markets have gotten crushed over the past few years, appear to have hit bottom:
What’s “median asking rent?”
“Median” means half of the asking rents are higher, and half are lower. “Asking rent” is the advertised rent, a measure of the current market, like a price tag in a store. Asking rent does not measure what tenants are currently paying in rent, such as under rent control. Asking rents do not include concessions.
Zumper collects this data from the Multiple Listings Service (MLS) and other listings in the 100 largest markets, but only for apartment buildings, including new construction. They do not include single-family houses and condos-for-rent.
The 10 cities with the lowest 1-BR rents of the Top 100:
You can work from anywhere and want to save on rent? OK, this list is for you. The cheapest city to rent in among the largest 100 rental markets is Akron, OH. Wichita and Tulsa are second and third cheapest; in all three cities, rents declined. But the list also includes some cities with large rent increases:
| 1-BR rent | Y/Y % | ||
| 1 | Akron, OH | $560 | -5.1% |
| 2 | Wichita, KS | $620 | -3.1% |
| 3 | Tulsa, OK | $650 | -4.4% |
| 4 | Lubbock, TX | $650 | 3.2% |
| 5 | Shreveport, LA | $650 | 6.6% |
| 6 | El Paso, TX | $680 | 6.3% |
| 7 | Tucson, AZ | $730 | 9.0% |
| 8 | Albuquerque, NM | $740 | 5.7% |
| 9 | Lexington, KY | $750 | 1.4% |
| 10 | Tallahassee, FL | $760 | -8.4% |
The 35 Cities with year-over-year declines in 1-BR rents.
Of the 100 cities, 35 had year-over-year declines in median asking rents for 1-BR apartments. San Francisco leads with a 20% plunge, followed by college town Syracuse, NY, with a 14.4% drop. In addition to the outrageously expensive rental markets discussed above, the list also contains six cities in Texas, and cities across the US, but with moderate declines, such as Tulsa and Wichita, that have not participated in the craziness of other rental markets:
| 1-BR rent | Y/Y % | ||
| 1 | San Francisco, CA | $2,830 | -20.3% |
| 2 | Syracuse, NY | $770 | -14.4% |
| 3 | Oakland, CA | $2,130 | -14.1% |
| 4 | Washington, DC | $1,990 | -13.5% |
| 5 | Seattle, WA | $1,650 | -12.7% |
| 6 | New York, NY | $2,600 | -12.5% |
| 7 | Denver, CO | $1,400 | -11.4% |
| 8 | Los Angeles, CA | $2,020 | -11.0% |
| 9 | San Jose, CA | $2,230 | -9.3% |
| 10 | Salt Lake City, UT | $1,000 | -9.1% |
| 11 | Boston, MA | $2,300 | -8.4% |
| 12 | Tallahassee, FL | $760 | -8.4% |
| 13 | Irving, TX | $1,050 | -7.9% |
| 14 | Fort Worth, TX | $1,060 | -7.8% |
| 15 | Pittsburgh, PA | $1,080 | -6.9% |
| 16 | Corpus Christi, TX | $830 | -6.7% |
| 17 | Plano, TX | $1,130 | -5.8% |
| 18 | Madison, WI | $1,130 | -5.8% |
| 19 | Knoxville, TN | $820 | -5.7% |
| 20 | Orlando, FL | $1,220 | -5.4% |
| 21 | Anaheim, CA | $1,630 | -5.2% |
| 22 | Akron, OH | $560 | -5.1% |
| 23 | Louisville, KY | $850 | -4.5% |
| 24 | Tulsa, OK | $650 | -4.4% |
| 25 | Laredo, TX | $800 | -3.6% |
| 26 | Wichita, KS | $620 | -3.1% |
| 27 | Honolulu, HI | $1,600 | -3.0% |
| 28 | Buffalo, NY | $1,060 | -2.8% |
| 29 | Portland, OR | $1,400 | -2.1% |
| 30 | Nashville, TN | $1,270 | -1.6% |
| 31 | Jacksonville, FL | $920 | -1.1% |
| 32 | Arlington, TX | $890 | -1.1% |
| 33 | Aurora, CO | $1,070 | -0.9% |
| 34 | Minneapolis, MN | $1,300 | -0.8% |
| 35 | Providence, RI | $1,540 | -0.6% |
The 34 Cities with 5%-plus year-over-year increases in 1-BR rents.
Rents in September increased on a year-over-year basis in 62 of the 100 rental markets, compared to 35 cities with rent declines. In 34 of those cities, rents increased by over 5%. And in 16 of those cities, rents increased on a year-over-year basis in the double-digits. And in 10 of these cities, rents soared by 15% or more (I threw 14.9%-ers into that basket). The most expensive cities with a double-digit rent increase – Newark ($1,420) and Baltimore ($1,340) – are less than half as expensive as much-reduced-but-still-ridiculously-expensive San Francisco.
| 1-BR rent | Y/Y % | ||
| 1 | Norfolk, VA | $1,020 | 15.9% |
| 2 | Indianapolis, IN | $880 | 15.8% |
| 3 | Cleveland, OH | $1,030 | 15.7% |
| 4 | St Petersburg, FL | $1,270 | 15.5% |
| 5 | Baltimore, MD | $1,340 | 15.5% |
| 6 | Chattanooga, TN | $990 | 15.1% |
| 7 | Detroit, MI | $770 | 14.9% |
| 8 | Des Moines, IA | $850 | 14.9% |
| 9 | Lincoln, NE | $850 | 14.9% |
| 10 | Fresno, CA | $1,080 | 14.9% |
| 11 | Columbus, OH | $890 | 14.1% |
| 12 | Cincinnati, OH | $970 | 12.8% |
| 13 | St Louis, MO | $980 | 12.6% |
| 14 | Newark, NJ | $1,420 | 11.8% |
| 15 | Reno, NV | $1,090 | 11.2% |
| 16 | Bakersfield, CA | $810 | 11.0% |
| 17 | Tucson, AZ | $730 | 9.0% |
| 18 | Spokane, WA | $870 | 8.7% |
| 19 | Rochester, NY | $1,000 | 8.7% |
| 20 | Sacramento, CA | $1,410 | 8.5% |
| 21 | Las Vegas, NV | $1,040 | 8.3% |
| 22 | Chesapeake, VA | $1,180 | 8.3% |
| 23 | Boise, ID | $1,050 | 7.1% |
| 24 | Mesa, AZ | $960 | 6.7% |
| 25 | Shreveport, LA | $650 | 6.6% |
| 26 | New Orleans, LA | $1,450 | 6.6% |
| 27 | El Paso, TX | $680 | 6.3% |
| 28 | Omaha, NE | $850 | 6.3% |
| 29 | Albuquerque, NM | $740 | 5.7% |
| 30 | Durham, NC | $1,110 | 5.7% |
| 31 | Henderson, NV | $1,190 | 5.3% |
| 32 | Tampa, FL | $1,190 | 5.3% |
| 33 | Baton Rouge, LA | $840 | 5.0% |
| 34 | Fort Lauderdale, FL | $1,680 | 5.0% |
For five months, we have seen this move now, and it has been sustained so far, of renters getting out of the most expensive cities, and fewer students are moving back to college towns, and the oil patch is struggling with a double-whammy. Some renters head to cheaper rental markets, others bought a home outside the city center somewhere, and others moved back with mom and dad, leaving behind a vacuum. And landlords who want to fill their vacancies respond quickly to market conditions, by dropping their asking rents.
But the corollary is that this move and likely other factors have sent rents surging in numerous other markets.
The Largest 100 rental markets.
The table below shows the top 100 cities, 1-BR and 2-BR median asking rents in September, and year-over-year changes, in order of 1-BR rents, from most expensive to least expensive. You can search the list via the search function in your browser (if your smartphone clips this 6-column table on the right, hold your device in landscape position):
| 1-BR rent | Y/Y % | 2-BR rent | Y/Y % | ||
| 1 | San Francisco, CA | $2,830 | -20.3% | $3,800 | -20.0% |
| 2 | New York, NY | $2,600 | -12.5% | $2,990 | -11.3% |
| 3 | Boston, MA | $2,300 | -8.4% | $2,800 | -3.4% |
| 4 | San Jose, CA | $2,230 | -9.3% | $2,770 | -5.8% |
| 5 | Oakland, CA | $2,130 | -14.1% | $2,700 | -10.0% |
| 6 | Los Angeles, CA | $2,020 | -11.0% | $2,810 | -11.1% |
| 7 | Washington, DC | $1,990 | -13.5% | $2,740 | -1.8% |
| 8 | San Diego, CA | $1,800 | 0.0% | $2,360 | -1.7% |
| 9 | Miami, FL | $1,750 | 1.7% | $2,350 | 3.1% |
| 10 | Fort Lauderdale, FL | $1,680 | 5.0% | $2,200 | 3.8% |
| 11 | Santa Ana, CA | $1,650 | 1.9% | $2,180 | 2.3% |
| 12 | Seattle, WA | $1,650 | -12.7% | $2,200 | -7.9% |
| 13 | Anaheim, CA | $1,630 | -5.2% | $1,990 | -5.2% |
| 14 | Long Beach, CA | $1,600 | 3.9% | $2,100 | 5.0% |
| 15 | Honolulu, HI | $1,600 | -3.0% | $2,240 | 6.2% |
| 16 | Providence, RI | $1,540 | -0.6% | $1,800 | 9.1% |
| 17 | Chicago, IL | $1,500 | 4.9% | $1,800 | 2.9% |
| 18 | Philadelphia, PA | $1,500 | 0.0% | $1,760 | 3.5% |
| 19 | New Orleans, LA | $1,450 | 6.6% | $1,750 | 7.4% |
| 20 | Atlanta, GA | $1,430 | 1.4% | $1,900 | 5.0% |
| 21 | Newark, NJ | $1,420 | 11.8% | $1,860 | 15.5% |
| 22 | Scottsdale, AZ | $1,410 | 0.7% | $1,980 | 0.5% |
| 23 | Sacramento, CA | $1,410 | 8.5% | $1,650 | 13.8% |
| 24 | Denver, CO | $1,400 | -11.4% | $1,920 | -4.0% |
| 25 | Portland, OR | $1,400 | -2.1% | $1,710 | -3.4% |
| 26 | Baltimore, MD | $1,340 | 15.5% | $1,620 | 14.9% |
| 27 | Minneapolis, MN | $1,300 | -0.8% | $1,910 | 6.1% |
| 28 | Gilbert, AZ | $1,290 | 3.2% | $1,540 | 2.7% |
| 29 | Austin, TX | $1,280 | 2.4% | $1,590 | 1.3% |
| 30 | St Petersburg, FL | $1,270 | 15.5% | $1,710 | 14.0% |
| 31 | Nashville, TN | $1,270 | -1.6% | $1,450 | 0.7% |
| 32 | Chandler, AZ | $1,260 | 4.1% | $1,520 | 7.0% |
| 33 | Dallas, TX | $1,250 | 0.8% | $1,740 | 2.4% |
| 34 | Charlotte, NC | $1,230 | 0.8% | $1,450 | 6.6% |
| 35 | Orlando, FL | $1,220 | -5.4% | $1,400 | -0.7% |
| 36 | Henderson, NV | $1,190 | 5.3% | $1,360 | 0.7% |
| 37 | Tampa, FL | $1,190 | 5.3% | $1,440 | 8.3% |
| 38 | Chesapeake, VA | $1,180 | 8.3% | $1,230 | -1.6% |
| 39 | Richmond, VA | $1,130 | 4.6% | $1,400 | 8.5% |
| 40 | Plano, TX | $1,130 | -5.8% | $1,520 | -5.6% |
| 41 | Madison, WI | $1,130 | -5.8% | $1,360 | -2.9% |
| 42 | Durham, NC | $1,110 | 5.7% | $1,280 | 4.1% |
| 43 | Houston, TX | $1,100 | 2.8% | $1,350 | 1.5% |
| 44 | Reno, NV | $1,090 | 11.2% | $1,400 | 2.9% |
| 45 | Milwaukee, WI | $1,090 | 1.9% | $1,240 | 10.7% |
| 46 | Fresno, CA | $1,080 | 14.9% | $1,320 | 14.8% |
| 47 | Virginia Beach, VA | $1,080 | 0.9% | $1,280 | 4.9% |
| 48 | Pittsburgh, PA | $1,080 | -6.9% | $1,300 | -3.0% |
| 49 | Aurora, CO | $1,070 | -0.9% | $1,430 | -2.1% |
| 50 | Fort Worth, TX | $1,060 | -7.8% | $1,320 | -0.8% |
| 51 | Buffalo, NY | $1,060 | -2.8% | $1,260 | -3.1% |
| 52 | Irving, TX | $1,050 | -7.9% | $1,420 | -0.7% |
| 53 | Boise, ID | $1,050 | 7.1% | $1,240 | 8.8% |
| 54 | Raleigh, NC | $1,040 | 1.0% | $1,230 | 2.5% |
| 55 | Las Vegas, NV | $1,040 | 8.3% | $1,250 | 4.2% |
| 56 | Phoenix, AZ | $1,030 | 2.0% | $1,260 | 0.8% |
| 57 | Cleveland, OH | $1,030 | 15.7% | $1,100 | 14.6% |
| 58 | Norfolk, VA | $1,020 | 15.9% | $1,070 | 8.1% |
| 59 | Salt Lake City, UT | $1,000 | -9.1% | $1,300 | -5.1% |
| 60 | Rochester, NY | $1,000 | 8.7% | $1,210 | 12.0% |
| 61 | Kansas City, MO | $990 | 4.2% | $1,150 | 3.6% |
| 62 | Chattanooga, TN | $990 | 15.1% | $1,120 | 14.3% |
| 63 | St Louis, MO | $980 | 12.6% | $1,270 | 11.4% |
| 64 | Cincinnati, OH | $970 | 12.8% | $1,100 | -11.3% |
| 65 | Colorado Springs, CO | $960 | 0.0% | $1,240 | 3.3% |
| 66 | Mesa, AZ | $960 | 6.7% | $1,200 | 2.6% |
| 67 | Jacksonville, FL | $920 | -1.1% | $1,120 | 8.7% |
| 68 | Anchorage, AK | $900 | 0.0% | $1,200 | 4.3% |
| 69 | San Antonio, TX | $900 | 1.1% | $1,110 | -1.8% |
| 70 | Glendale, AZ | $900 | 1.1% | $1,170 | 10.4% |
| 71 | Arlington, TX | $890 | -1.1% | $1,190 | 6.3% |
| 72 | Columbus, OH | $890 | 14.1% | $1,110 | 2.8% |
| 73 | Indianapolis, IN | $880 | 15.8% | $960 | 7.9% |
| 74 | Spokane, WA | $870 | 8.7% | $1,110 | 11.0% |
| 75 | Des Moines, IA | $850 | 14.9% | $950 | 9.2% |
| 76 | Louisville, KY | $850 | -4.5% | $960 | -1.0% |
| 77 | Memphis, TN | $850 | 4.9% | $900 | 4.7% |
| 78 | Omaha, NE | $850 | 6.3% | $1,090 | 9.0% |
| 79 | Lincoln, NE | $850 | 14.9% | $970 | 2.1% |
| 80 | Baton Rouge, LA | $840 | 5.0% | $940 | 2.2% |
| 81 | Corpus Christi, TX | $830 | -6.7% | $1,050 | -0.9% |
| 82 | Knoxville, TN | $820 | -5.7% | $970 | -2.0% |
| 83 | Bakersfield, CA | $810 | 11.0% | $1,050 | 15.4% |
| 84 | Winston Salem, NC | $800 | 1.3% | $890 | 3.5% |
| 85 | Augusta, GA | $800 | 2.6% | $910 | 7.1% |
| 86 | Laredo, TX | $800 | -3.6% | $890 | -3.3% |
| 87 | Syracuse, NY | $770 | -14.4% | $1,050 | 1.9% |
| 88 | Detroit, MI | $770 | 14.9% | $870 | 14.5% |
| 89 | Greensboro, NC | $760 | 4.1% | $860 | 2.4% |
| 90 | Oklahoma City, OK | $760 | 1.3% | $890 | -3.3% |
| 91 | Tallahassee, FL | $760 | -8.4% | $920 | 2.2% |
| 92 | Lexington, KY | $750 | 1.4% | $900 | -5.3% |
| 93 | Albuquerque, NM | $740 | 5.7% | $920 | 8.2% |
| 94 | Tucson, AZ | $730 | 9.0% | $940 | 6.8% |
| 95 | El Paso, TX | $680 | 6.3% | $820 | 5.1% |
| 96 | Lubbock, TX | $650 | 3.2% | $800 | 6.7% |
| 97 | Shreveport, LA | $650 | 6.6% | $790 | 12.9% |
| 98 | Tulsa, OK | $650 | -4.4% | $820 | 0.0% |
| 99 | Wichita, KS | $620 | -3.1% | $730 | -3.9% |
| 100 | Akron, OH | $560 | -5.1% | $710 | 1.4% |


I think the impact of Covid on our cities and towns (and consequently on property markets) will be a lot more complex than anticipated. Going on anecdote, talking to quite a few people I know in a variety of industries, there is a general assumption that things will not return to ‘normal’, but that most companies are taking a ‘wait and see’ attitude. The only companies being rushed into decisions are those with upcoming rent reviews. I know one major insurer in Dublin that took the decision not to renew one of their two office buildings and so formalised home working for a significant percentage of their staff.
Another factor is investment in home working – I don’t know the legal situation in the US, but here there are general duty of care regulations which means companies are already having to invest to support safe home working for staff – in some cases they are literally just being told to go to Ikea for one of their office desks and chairs and desks and they’ll be reimbursed. In my organisation, they’ve accelerated the purchase of tablets for junior staff who have been struggling with working from home in shared households. Having made this investment, there will likely be less pressure to bring staff back to work if home working is seen to be reasonably productive, especially if money can be saved on office space.
The one good news for organisations, is that it looks like the evidence is that as the disease is mostly aerosol spread, not via fomites, then desk and office sharing seems reasonably safe and viable. I think this will mean that a popular outcome for many organisations would be to have most staff in the office for a fixed number of days a week, and otherwise home-work. This could be the best of all worlds for most companies and staff. It would also make it much more viable for people to move a few hours journey away from their offices, which would fundamentally change commuting patterns.
One thing that has become visible already here is that there is a huge drop in demand for very small apartments close to the main office areas. People are opting for more space (a spare room for home working, for example), over commuting convenience.
A further complication is tax law (maybe not so much for the US, but maybe there are State tax implications?). All the big IT companies in Ireland have told staff who are working from home in other countries that they must return before the end of the year and prove that they reside in Ireland for at least a month. This is related to an unintended output of local tax laws, I’m not sure the details, but its the sort of complication that could be replicated in many countries.
sort of depends on if companies (in the US this extremely wide spread) are using the open office concept, basically this is the cube farm where as many people as possible sit in cubes, with no doors and barely 2-4 four feet apart from neighbors, some times with short mini walls (maybe 4-6 feet tall) or none at all.
needless to say that sort of office space wont work at all
Here in Australia, our Australia Post has just issued corporate-owned laptops to staff currently working from home. Pretty much anyone who isn’t answering calls (management, online services, admin) is working from home right now and apparently into the future.
I don’t know if it means anything or not but I note that of those 17 most expensive major rental markets in the US, that virtually all of them are on or have direct access (not the Democratic type) to the Pacific or Atlantic Oceans. There is Chicago but it is on the Great Lakes. The only exception is Denver, Colorado which I would put down to the climate there.
Interesting observation – most of course started as port cities but have continued to thrive long after shipping stopped being a major generator of jobs.
One explanation could be climate (although of course NY and Chicago have mostly horrible climates), but another could be that port cities are usually more constrained physically, which does tend to drive up the cost of property. Cities like Atlanta or Houston can pretty much sprawl to infinity, which does keep prices down. Also, land holdings in inland plain cities are usually larger and simpler, allowing for simpler large scale developents, as opposed to fragmented and more complicated holdings in older port cities – these can be a nightmare for developers.
These cities are also large immigrant cities.. and that spigot has been cut off for now
I am surprised that the decrease in Boston is so low. There must be a lot of “first month rent free” offers going on right now.
Sigh, the rise in Newark, NJ rents – I’m not sure what that means.
Was hoping parts of NJ with good walkability and access to mass transit would have more affordable housing… I don’t think people are fleeing density, but high real estate costs.
Anecdotally, parts of NJ within commuting distance of NYC are seeing upticks in rent and housing sales. I think PMCs that can work remotely still need to be close enough to go in a few times a week.
The pandemic and the resulting recession is bursting the hottest real estate bubbles.
new yorkers?
It’s awkward to describe Bakersfield & Fresno as ‘hot’ markets-as they have that title locked up in the torrid summers here already, and no denizen living near the coast would’ve waxed poetic about either locale in terms of where to move to pre-Covid, but its all about the Benjamins, or lack of.
Neither city is a good fit from a commuting angle to the coast, and the only thing that makes sense is the feverish interest must be people wanting to get closer to raisin d’être, er grapes of wrath.
San Franciscans will feel at home in Fresno with it’s burgeoning homeless population, while some might consider it a bigger better Tenderloin, and it’s only a couple hours to Yosemite or Kings Canyon from anywhere in the city limits, so there’s that.
I think the real churn will come by summer 2021 when most of the current leases expire. The incentives for existing tenants were pretty good from personal experience and anecdotes in the DC area. Generally most corporate owned apartment buildings here prefer to have leases renew in summer, with tenants agreeing to renew by the spring. That meant they had a ton of renewals come up during a particularly bad time of COVID.
I know for a fact all existing tenants with good payments records were offered a lease renewal with no increase in rent and a discount for paying rent before the first of each month. Many people I know were getting similar renewals in buildings across the immediate area surrounding DC. By next year, those leases are up and I suspect many will move further out. The federal government is slowly realizing that WFH is doable and people are tired of the costs. 2-3 bedroom condos for rent are already going for much lower than normal. I suspect that will really drive costs down by next year.
Memphis rents going up. Apartments have been and continue to come online, but not occupied, no net increase in city’s population, and 12% unemployment. Strange. My personal view is a lot of construction around here is money laundering. If people move into apartments that’s gravy. If not, meh…. someone will sometime or eventually building will be sold.
A note to the author-
Whenever I look over Wolf Street lists of rental markets (from any story regarding rents or building leases) I notice a huge omission and that is any inclusion of cities from the 13th largest MSA (Riverside/San Bernardino) in the US. With a population of over 4.5 million, I would think one of those cities would be included on the lists. It’s not all “LA” after all.
The case of Chicago, Honolulu, and Miami are interesting (increases in past year but decreases from a few years ago). The implication is that the decline in NY, SF, etc is partly a market correction to over-inflated rents. That correction happened years ago in some cities.
The other piece is that these cities have substantial populations of restaurants, bars, retail, arts, etc. Among people I know, those are the folks who have been leaving major cities as they can no longer afford expensive rentals. Meanwhile, landlords can no longer assume that vacancies will be filled by waves of incoming finance/law/etc workers. They have to do more to keep existing tenants, and that includes affordability.
The work from home crowd (myself included), is mostly staying put, and even shopping for deals to upgrade their apartments/houses. In my experience they aren’t the ones who are reshaping the housing market–it’s the folks who are struggling who are.
Had to run an errand in Downtown Tucson yesterday. It included a dropoff at a just-opened coworking space. Man, that place was DEAD. As mentioned here before, I’ve been part of another coworking space, and I know coworking DEAD when I see it.
As it happens, I passed by my former coworking space on the way home. Sotto voce: The building is starting to fall into disrepair. I saw peeling paint and dirt and dust in places that used to be spit-polished.
On to Congress Street, which is the main drag through Downtown Tucson. I fully expected to see tumbleweeds rolling down the middle of the street. It was that quiet.
Oh, did I mention the “space available” signs? Dang, those things were everywhere!
Almost everyone I know that was working in Manhattan has been told that they will be working remotely for an indefinite amount of time. Which makes sense because all of these people said, after working remotely, that they would find another job before getting back on a crumbling subway for an hour commute into a city that has largely lost its luster.
This is good and fascinating data on apts, but how about the market for rental houses? Great swathes of foreclosed SFD’s were hoovered up by hedges and PE. Having evicted the homeowners after 2008, are they now planning to evict tenants? Seems to me that a couple who were both WFH, two-office homes (plus bedrooms as required) would be a good bet, esp for privacy concerns.