Storm Surges in the Bohai Sea: The Role of Waves and Tides
by
 , ,
, ,
Yuanyi Li
1,2,3 ,
,
Huan Feng
4,
Guillaume Vigouroux
5,
Dekui Yuan
2,*,
Guangyu Zhang
2,
Xiaodi Ma
2 and
Kun Lei
1 1
Chinese Research Academy of Environmental Sciences, Beijing 100012, China
2
Department of Mechanics, School of Mechanical Engineering, Tianjin University, Tianjin 300354, China
3
State Key Laboratory of Hydroscience and Engineering, Department of Hydraulic Engineering, Tsinghua University, Beijing 100084, China
4
Department of Earth and Environmental Studies, Montclair State University, Montclair, NJ 07043, USA
5
Department of Physical Geography, Stockholm University, 106 91 Stockholm, Sweden
*
Author to whom correspondence should be addressed.
Water 2020, 12(5), 1509; https://doi.org/10.3390/w12051509
Submission received: 20 April 2020
/
Revised: 14 May 2020
/
Accepted: 20 May 2020
/
Published: 25 May 2020
(This article belongs to the Section Hydraulics and Hydrodynamics)
Abstract
:A storm surge is a complex phenomenon in which waves, tide and current interact. Even though wind is the predominant force driving the surge, waves and tidal phase are also important factors that influence the mass and momentum transport during the surge. Devastating storm surges often occur in the Bohai Sea, a semi-enclosed shallow sea in North China, due to extreme storms. However, the effects of waves on storm surges in the Bohai Sea have not been quantified and the mechanisms responsible for the higher surges that affect part of the Bohai Sea have not been thoroughly studied. In this study, we set up a storm surge model, considering coupled effects of tides and waves on the surges. Validation against measured data shows that the coupled model is capable of simulating storm surges in the Bohai Sea. The simulation results indicate that the longshore currents, which are induced by the large gradient of radiation stress due to wave deformation, are one of the main contributors to the higher surges occurring in some coastal regions. The gently varying bathymetry is another factor contributing to these surges. With such bathymetry, the wave force direction is nearly uniform, and pushes a large amount of water in that direction. Under these conditions, the water accumulates in some parts of the coast, leading to higher surges in nearby coastal regions such as the south coast of the Bohai Bay and the west and south coasts of the Laizhou Bay. Results analysis also shows that the tidal phase at which the surge occurs influences the wave–current interactions, and these interactions are more evident in shallow waters. Neglecting these interactions can lead to inaccurate predictions of the storm surges due to overestimation or underestimation of wave-induced set-up.
1. Introduction
A storm surge is the abnormal variation of sea level caused by extreme meteorological conditions, such as high wind and low pressure [1]. It is a complex phenomenon involving interactions among waves, wind, tide and current. The set-up caused by waves breaking may contribute to the rise of water level during storm surges. However, the generation, propagation and nonlinear behaviors of waves are also related to the tidal phase and the current driven by tide and wind. A number of theoretical and numerical studies on storm surges in coastal oceans have been carried out, and have considered the roles of interactions among surges, waves, current and the meteorological condition in various ways. Prandle and Wolf [1] examined the mechanism of interaction between surge and tide in the Thames River, and suggested that the surge tends to peak during the flood. Tang et al. [2] confirmed that the quadratic bottom friction is significant in the wave–current interaction, and theoretically proved that the interaction substantially reduces the water levels, compared with those obtained without consideration of the wave–current interaction. Mastenbroek et al. [3] and Moon [4] studied the effects of waves on storm surge in terms of wind stress variation due to waves. However, these studies did not consider the influence of mass and momentum transport caused by wave propagation during storm surges.
The momentum transport due to waves can be represented by the wave radiation stress proposed by Longuethiggins and Stewart [5], which can be derived from the wave energy. However, the waves in oceans are often random and obtaining the energy distribution of random waves is difficult. With the development of random wave models based on the action balance equations [6], simulating random waves and considering the momentum transport due to random waves has become feasible. Combining a tide model and a wave model (simulating waves nearshore (SWAN) [7]), Kim et al. [8] and Kim et al. [9] studied the effects of tide and waves on surges in terms of radiation stress. Their studies indicated that the radiation stress could contribute up to 40% of the peak surge water level on the coasts of Korea and Japan during typhoons. By coupling a finite volume ocean model (finite volume community ocean model (FVCOM)) [10] and an unstructured-grid wave model (SWAVE) [11], Yoon and Jun [12] set up a wave-surge coupled model for the south coast of Korea, considering the land dissipation effects on the wind as well as the wave-induced surface drag and the radiation stress. Recently, Marsooli et al. [13] developed a 3D model using the sECOM (estuarine and coastal ocean model) and the MDO (Mellor–Donelan–Oey wave model) with the consideration of radiation stress. Liu et al. [14] studied the inundation in New York City caused by Hurricane Sandy, 2012, using the model coupled with tide, wind, and waves. These studies paved a way to examine the influence of waves on the coastal storm surges.
The Bohai Sea is an inner sea, located in Northern China, which suffers from frequent storm surges. It consists of Liaodong Bay, Bohai Bay, Laizhou Bay and the central basin (Figure 1). The Bohai Sea coast is characterized by a gently varying seabed, which together with its semi-enclosed nature, makes it vulnerable to storm surges [15,16,17]. The Bohai Sea is influenced by continental climate and temperate monsoon. Generally, the wind in winter is stronger than that in summer [18,19] and the annually averaged significant wave height (Hs) is ~0.6 m [20]. As a populated zone in the north and the northeast of China, the region around the Bohai Sea is experiencing a fast social and economic development, with several important ports and metropolises located there. Because of the social and economic importance of this area, the disasters caused by the frequent storm surges that result from the Bohai Sea climatic and physical characteristics have attracted the attention of researchers, the public and the government.
Thus, to protect the coast from flood damage, many studies have simulated the storm surges in the Bohai Sea to investigate their characteristics. Most of these studies have calculated the surge level without considering the effect of waves [21,22,23,24,25]. However, the wave set-up (or set-down) may be obvious, as the water depth in the Bohai Sea is shallow and its bathymetry varies slowly, with an average depth of approximately 18 m and an averaged tidal amplitude of about 2 m. Moreover, the wave propagation is significantly affected by the currents and water depth variations due to flood and ebb tides, thereby altering the transport of mass and momentum induced by waves. Under these conditions, waves are one of the important factors influencing the water movements in this region, and the fluxes of mass and momentum caused by the waves probably have important impacts on the currents and surges. Therefore, it is necessary to quantitatively examine the contribution of waves to the surge in the Bohai Sea, as ignoring the effects of waves on the surge may be problematic in some regions [8,9]. Moreover, previous studies have also suggested that the storm surges in the south of Bohai Bay and Laizhou Bay are more serious [15,16,17,24,26]. However, to the best of our knowledge, there is no study examining the detailed reasons for higher surges in these regions.
In this study, we aim to further understand the role of waves on storm surges in the Bohai Sea using a coupled model that includes tide, wind and waves. The objectives of the study are to: (i) analyze the interactions among tide, waves and current during surge events and discuss the role of these interactions on the occurrence of higher surges in a part of the Bohai Sea; and (ii) quantify the contribution of waves to the surge in such semi-enclosed seas and determine the need to include the effects of waves, tide and wind in surge prediction in such semi-enclosed inner seas. Section 2 gives a detailed description of the model used in this study and presents the validation results. Section 3 shows the results of the surge simulations. In that section, the surge distributions, the wave induced currents and the comparisons between the surges at different tidal phases are examined. Section 4 discusses the advantages and the limits of this study and proposes possible directions for future studies. Finally, Section 5 summarizes the main findings of this study.
2. Materials and Methods
2.1. Numerical Model
The Bohai Sea is a semi-enclosed shallow sea. The horizontal dimensions are far larger than the vertical one. Under these conditions, the horizontal advection dominated by tide is one of the important factors determining the transport of water mass and momentum even during a storm. Thus, it is reasonable to use a depth-integrated 2D model to simulate the water currents and study the characteristics of surges during a storm. In this study, a 2D tidal current model developed by our research group is applied. The tidal current model has been successfully used in several coastal areas [19,30,31,32,33,34,35,36,37]. The governing equations of the model can be derived from the Reynolds Averaged Navier-Stokes (RANS) equations with integration along the depth using the hydrostatic assumption and are written as
where H is the local water depth; ρ is the density of seawater; g is gravity acceleration; p and q are the depth-integrated flux in the x and y directions, respectively (in unit-width); ζ is the water level; U and V are the depth-averaged velocity components in the x and y directions, respectively; β is the momentum correction coefficient caused by the non-uniform distribution of horizontal velocities along the vertical direction; f is the Coriolis Force coefficient (f = 2 ω sin α, where ω is the angular frequency of self-rotation of the earth and α is the local latitude); Ps is the atmospheric pressure on the water surface; τsx and τsy are the wave forces; τwx and τwy are the wind stresses; τbx and τby are the bottom stresses; and ε is the comprehensive eddy diffusion coefficient including the horizontal molecular and eddy viscous diffusions. The equations are solved using the Finite Difference Method (FDM) on staggered rectangle cells. The local water levels and water depths are specified at the centers of the cells and the velocities and fluxes are defined at the middle points of the cell edges.
The generation and propagation of waves in the x and y directions are simulated by SWAN, a third generation spectral wave model [7]. The governing equation of SWAN is the action balance equation written as
where U and V are the depth-averaged velocity components of water in the x and y directions, respectively, which can be obtained from the tidal current model; cx and cy are the group velocity components of waves in x and y directions, respectively; σ and θ are the frequency and direction of waves, respectively; cσ and cθ are the variation rates of σ and θ, respectively; N is the action density spectrum, defined as
and s is a source or sink of wave energy, defined as
where sin is the wind-induced production of wave energy; sds is the wave dissipation due to white capping, breaking and bottom friction; and snl is the nonlinear wave–wave interactions including the quadruplet interaction in the deep water region and the triad interaction in the shallow water region.
The horizontal components of the radiation stress tensor can be calculated based on the wave energy spectrum and are expressed as
where E is the energy density spectrum, which is a function of t, x, y, σ and θ; and m is the ratio of the group velocity over the phase speed.
The wave force required in the tidal current model (see Equations (2) and (3)) are calculated as [6]
2.2. Model Setup
The modelled domain includes the Bohai Sea and the north part of the Yellow Sea (see Figure 1), which covers the area from 117.5° E to 126.0° E in longitude and from 36.5° N to 41.0° N in latitude. The bathymetry in the Bohai Sea was obtained and digitized from the marine chart published by the Navigation Guarantee Department of Chinese Navy Headquarters [38]. The area is discretized into a rectangular grid with a resolution of 1.5′ in longitude and 1.2′ in latitude. The governing equations of both the tidal current and the wave models are solved on this grid. The time step for the tidal current model is 2 min and that for the wave model is 12 min.
The wind data driving the tidal current model and wave model is extracted from the NCEP Climate Forecast System Reanalysis (NCEP CFSR) 6-hourly Products [39], which covers the period of July 1979 to March 2011. The product provides the wind data at 10 m above sea level with a spatial resolution of 0.312° × 0.312° (latitude × longitude). The components of wind speed (u and v) at the computational grid nodes are calculated using linear interpolation. The tidal harmonic constants of nine tidal components (i.e., M2, S2, N2, K2, K1, O1, P1, Q1, and M4) obtained from the OTIS Regional Tidal Solution [40] are used to calculate the time series of water levels along the open boundary (Figure 1). Due to the lack of wave data along the open boundary, all boundaries in the wave model are set as closed boundaries. According to the user manual of SWAN [7], this setting would not affect the accuracy of the wave simulation because the open boundary is far from the Bohai Sea.
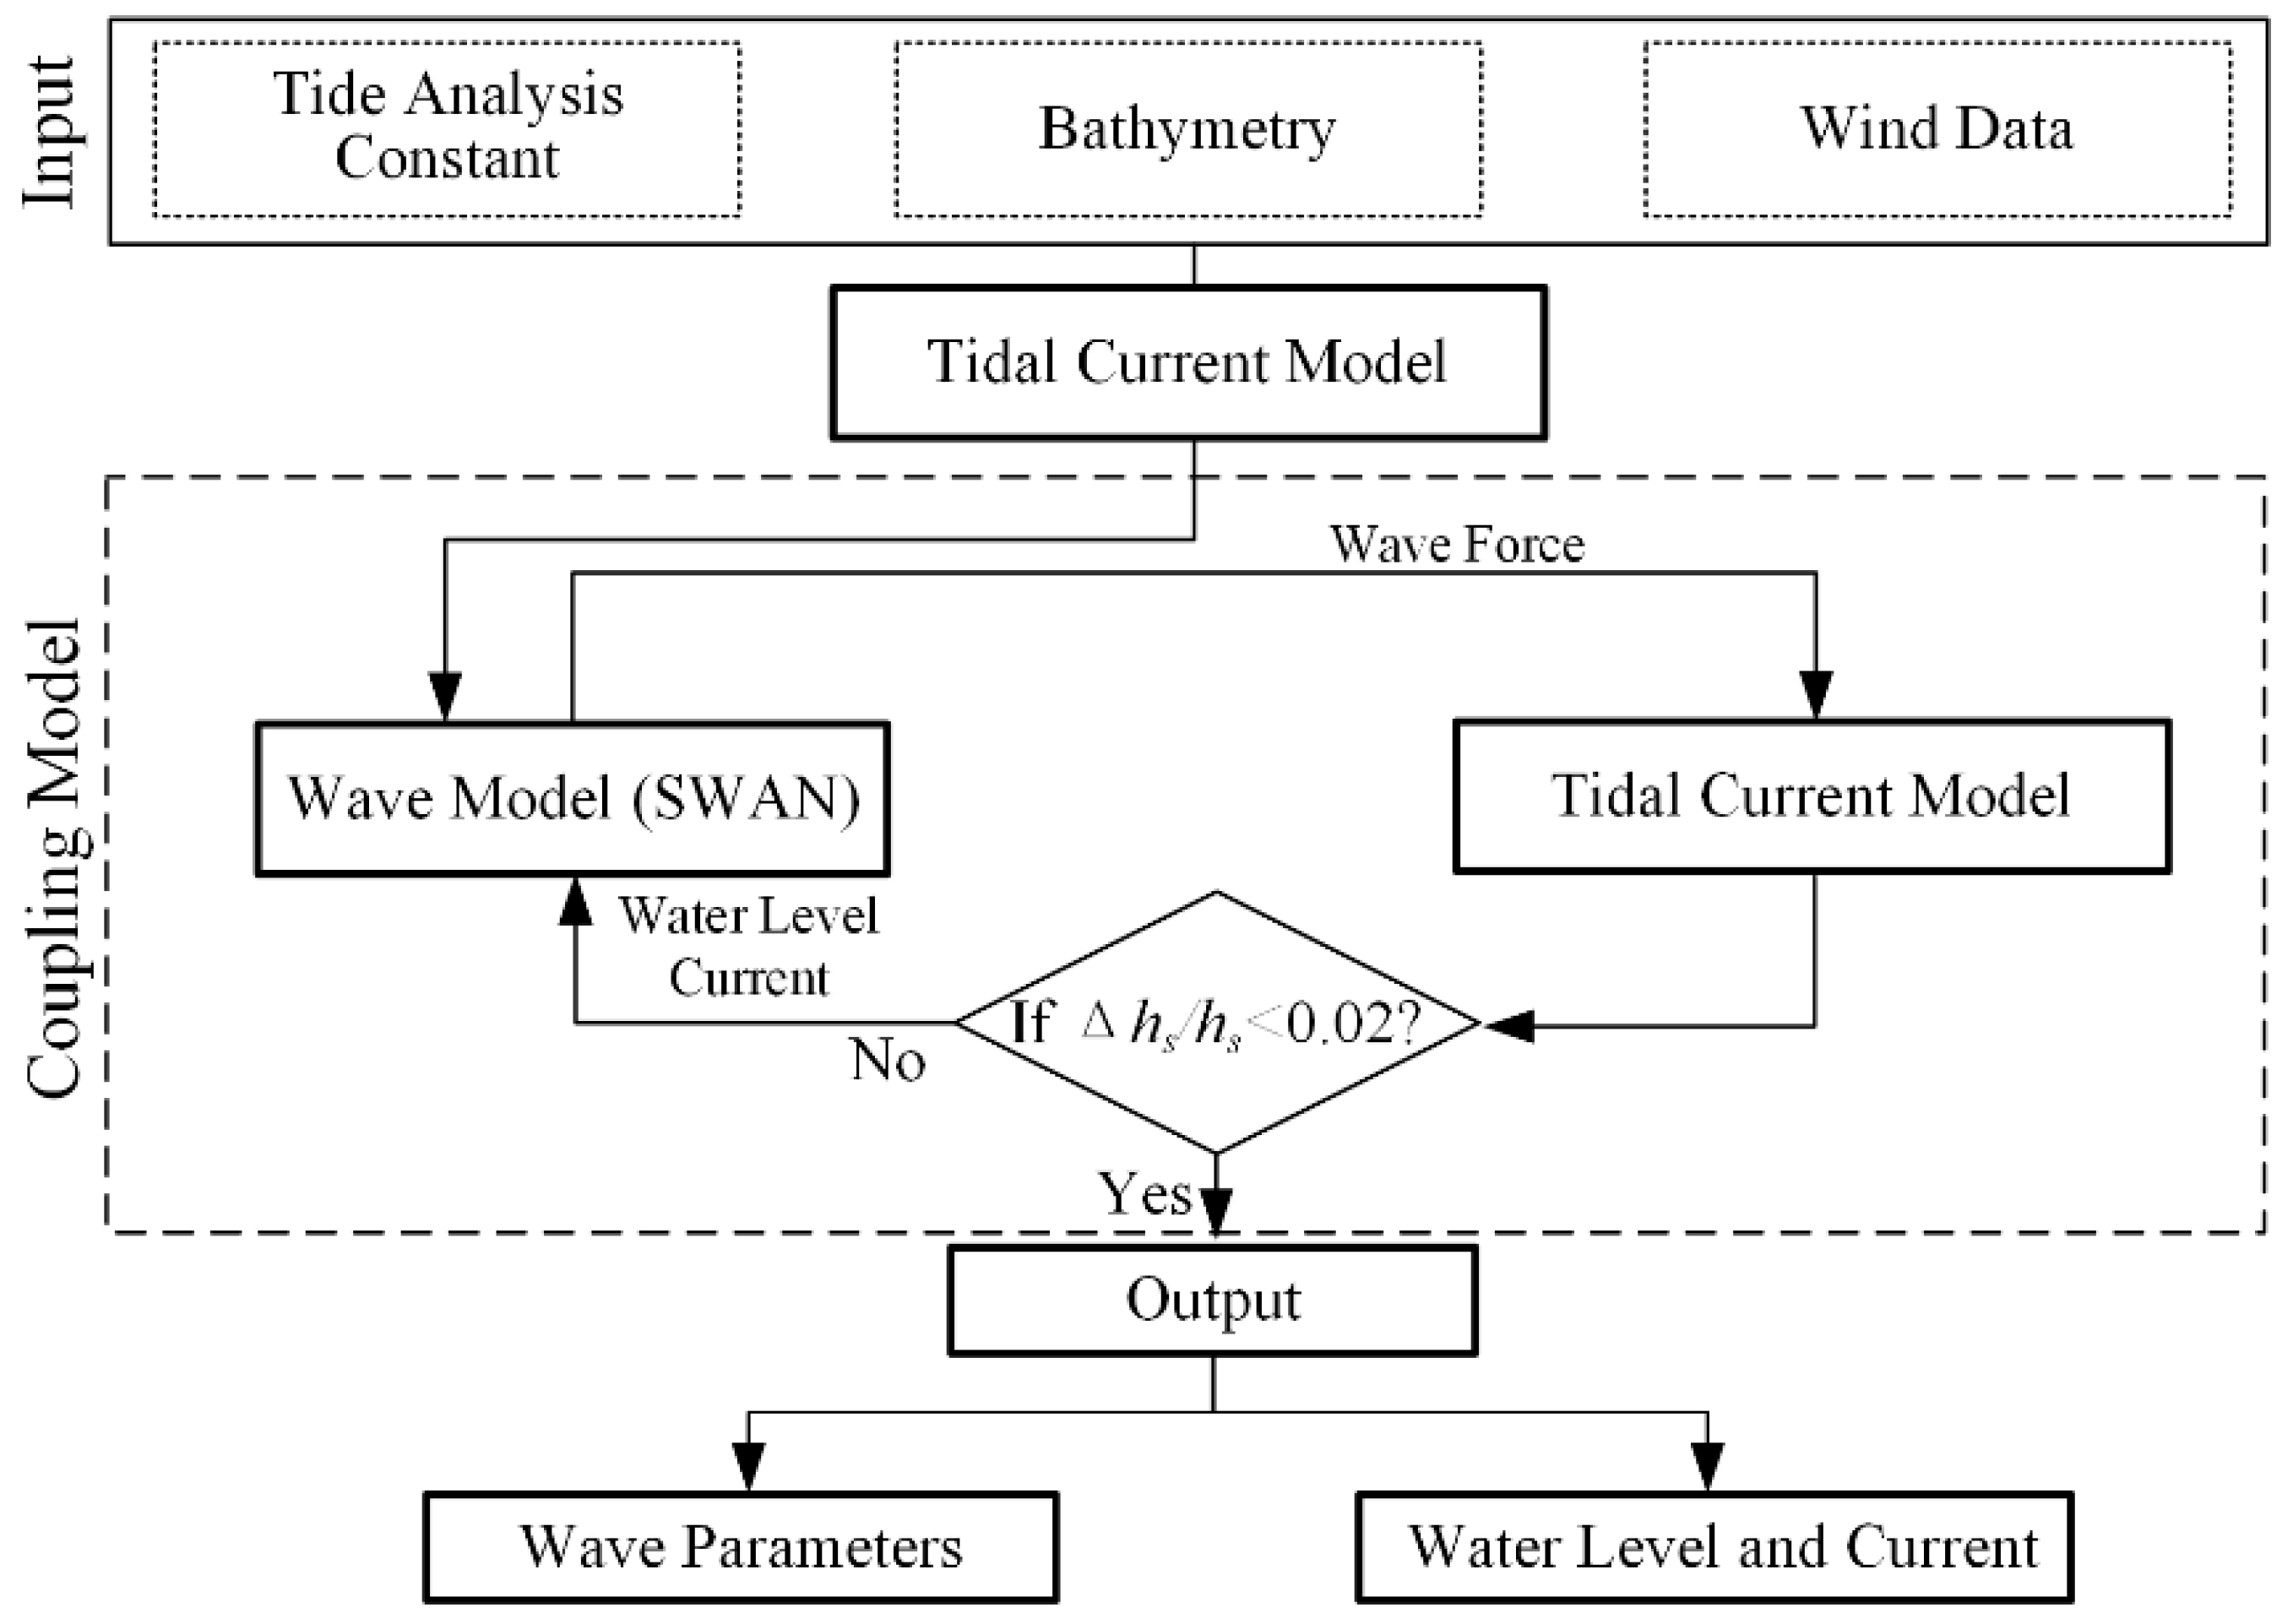
Figure 2 presents the process of coupling the tidal current model and the wave model. Firstly, the tidal current model runs with the inputs of the water level along the open boundary (representing the tidal influence) to calculate the water levels and currents during the entire simulation period (we call it “Model Initialization”). The time series of output from the tidal current model (i.e., water levels and currents during the storm period) during the entire simulation period are then transferred to the wave model through a data interface, and the wave model starts to simulate the wave field and calculates the wave force for the entire simulation period. Since the output of the tidal current model is written every half-hour, the water level and current at the beginning of each half hour are used in the wave simulations without interpolation. After that, the temporal and spatial distributions of the wave force are sent to the tidal current model through another data interface. Using the wave force, the tidal current model recalculates the water current and levels during the entire simulation period. Similar to the wave simulations, the wave force at the beginning of each half hour is used to drive the tidal current model. This corresponds to the 1st iteration phase. With this routine, the iterations continue (2nd iteration and so on) until the relative difference in the wave height between the two successive iterations is smaller than 2%.
To study the impacts of waves and the tide on storm surges and the mechanism of high surges in some regions of the Bohai Sea, we defined seven runs (runs 1 to 7 in Table 1). Each simulation begins with a cold start. The initial water level is set to the average water surface (referred to as a 0-m water level with the positive direction being upward) for the entire model domain and there is no current and wave at the beginning of the simulations. To obtain physically meaningful results, there is a warming period of 15 days in each simulation. This period is used for the simulations of the tidal current model and the wave model in all iterations, therefore all simulations start 15 days prior to the meteorological events described in Table 2.
2.3. Model Validation
The tidal current model used in this study has been successfully applied to various coastal areas in China. In the Bohai Sea, calibrations and validations of the tidal current model without coupling the wave model have also been conducted [19,30,35,37]. The validations suggest that the model-simulated results agree with the field-measured data.
The validation of the wave model is performed based on a well-validated tidal current model. Run 5 is used to validate the wave model. The validated tidal current model provides the water level and current velocity to the wave model, which then simulates the wave generation and propagation in the Bohai Sea (using run 5). In a previous study on the wave characteristics in the Bohai Sea from our group [20], wave heights and periods at 6 stations in the Bohai Sea were used to calibrate and validate the model. The results indicate that the wave model with the calibrated parameters in Lv et al. [20] is capable of simulating the wave processes in the Bohai Sea. Considering this result, we accept these parameters and apply them to our current study.
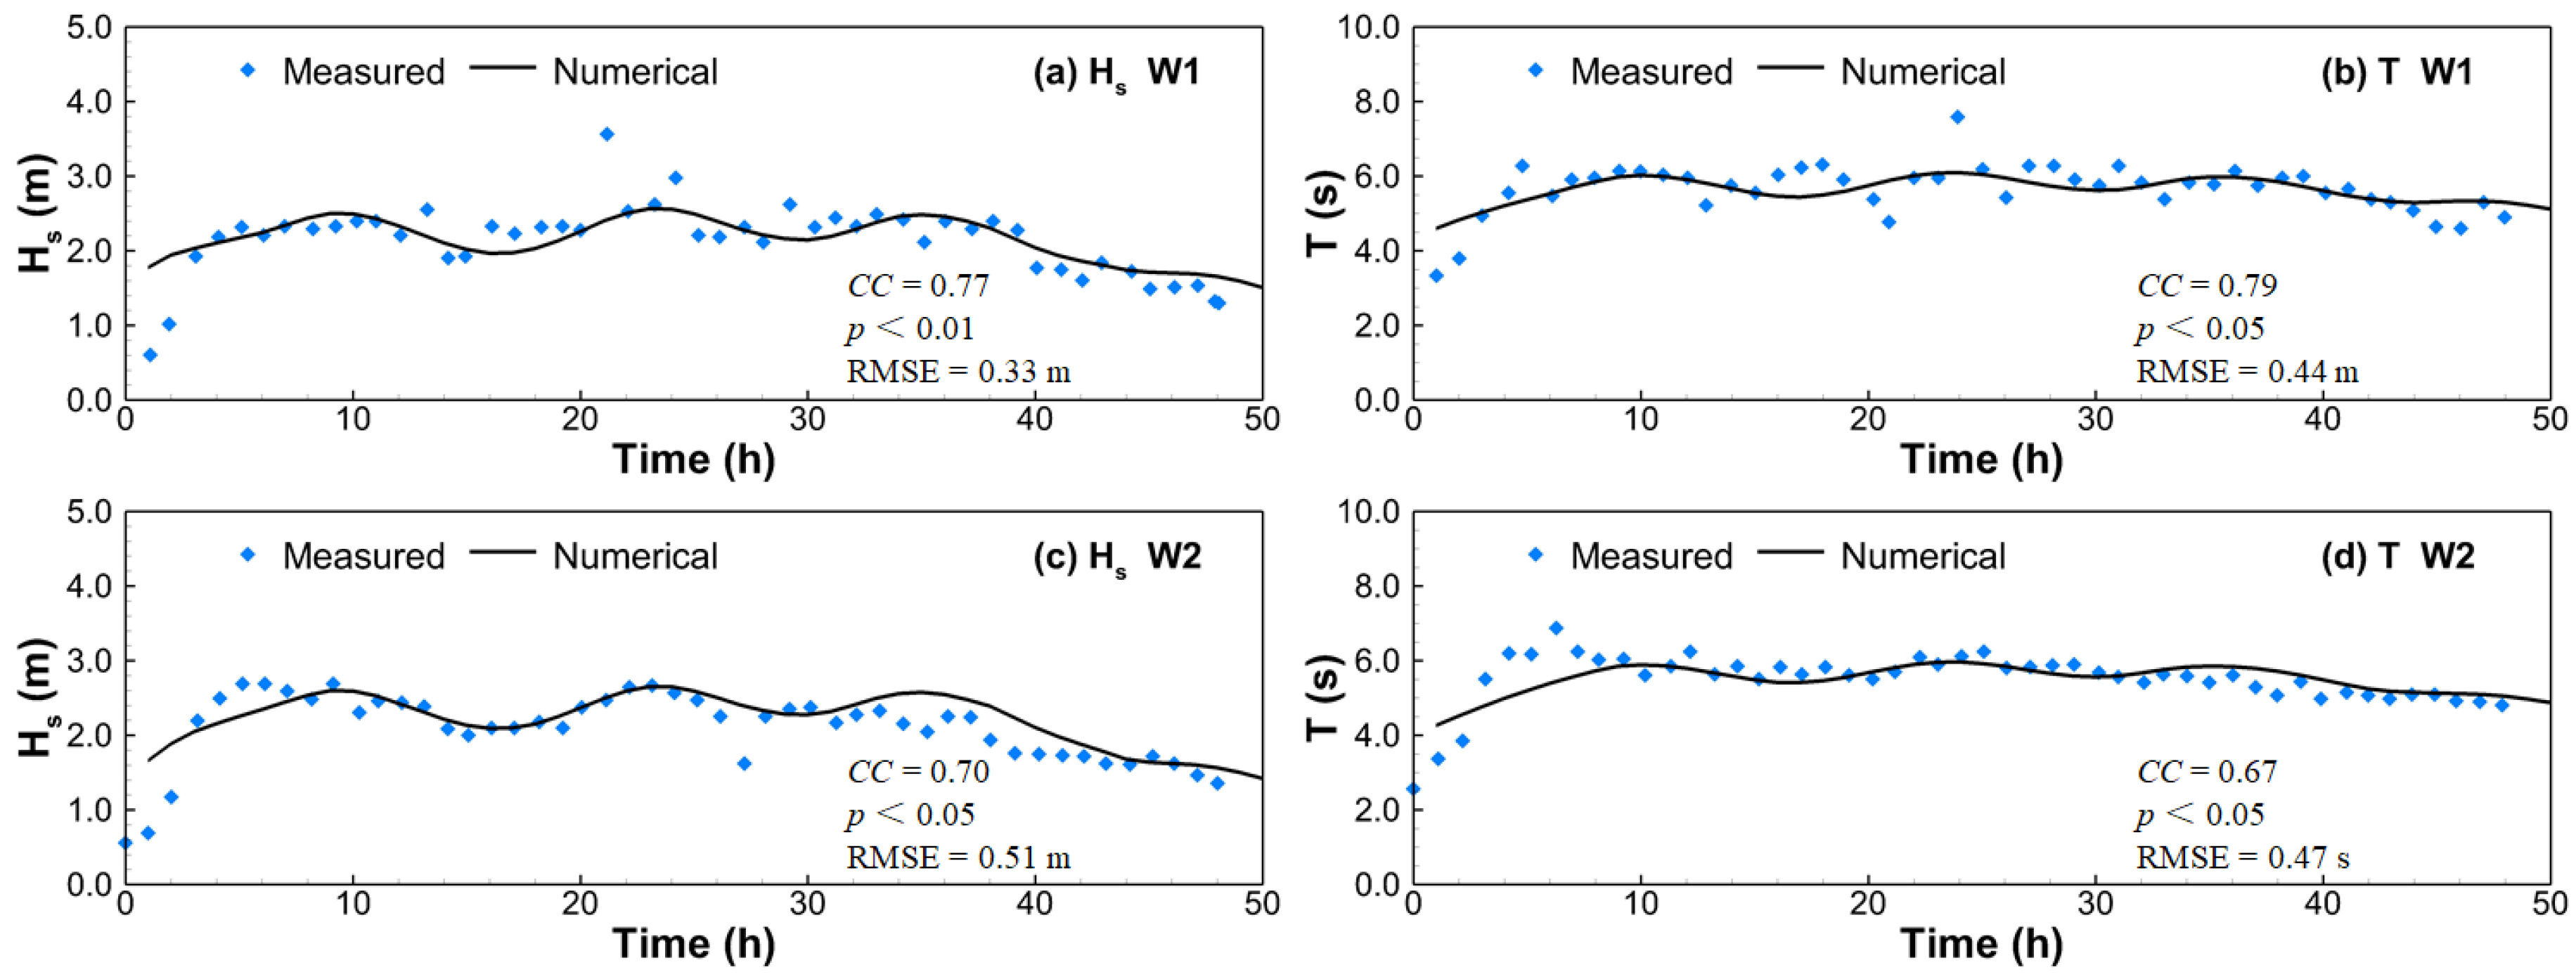
Applying the calibrated parameters, the measured wave periods and significant heights at W1 (with a depth of 5 m) and W2 (with a depth of 7 m) (see Figure 1) near the Huanghua Port in Hebei Province, China, during a storm from 16:00 UTC on 24 November 2003 to 15:00 UTC on 25 November 2003 [27], were used to further validate the wave model. Figure 3 shows the comparison of field-measured and model-simulated significant wave height (Hs) and wave period (T) (output from run 5). The field-measured and model-simulated wave periods and heights are in acceptable agreement in magnitude and variation, with the correlation coefficients (CC) between the model-simulated results and field-data being around or superior to 0.7.
Although the wave force is an output of the wave model and the effect of the wave on the current is not taken into consideration in run 5, the results of this run seem to be consistent with the measured wave data. This suggests that the calculation of wave generation and propagation does not heavily depend on the radiation stress and the first iteration run of the model can achieve a satisfactory description of wave properties. To certify the hypothesis, run 7 was also used to simulate the wave propagation and we found that the relative differences between the outputs of the wave model for the first (run 5) and the second iterations (run 7) are only in the order of 10−3 (Figure 4). This means that the radiation stress does not affect the wave calculation, which agrees with the conclusion by Kim et al. [9] and Yoon and Jun [12].
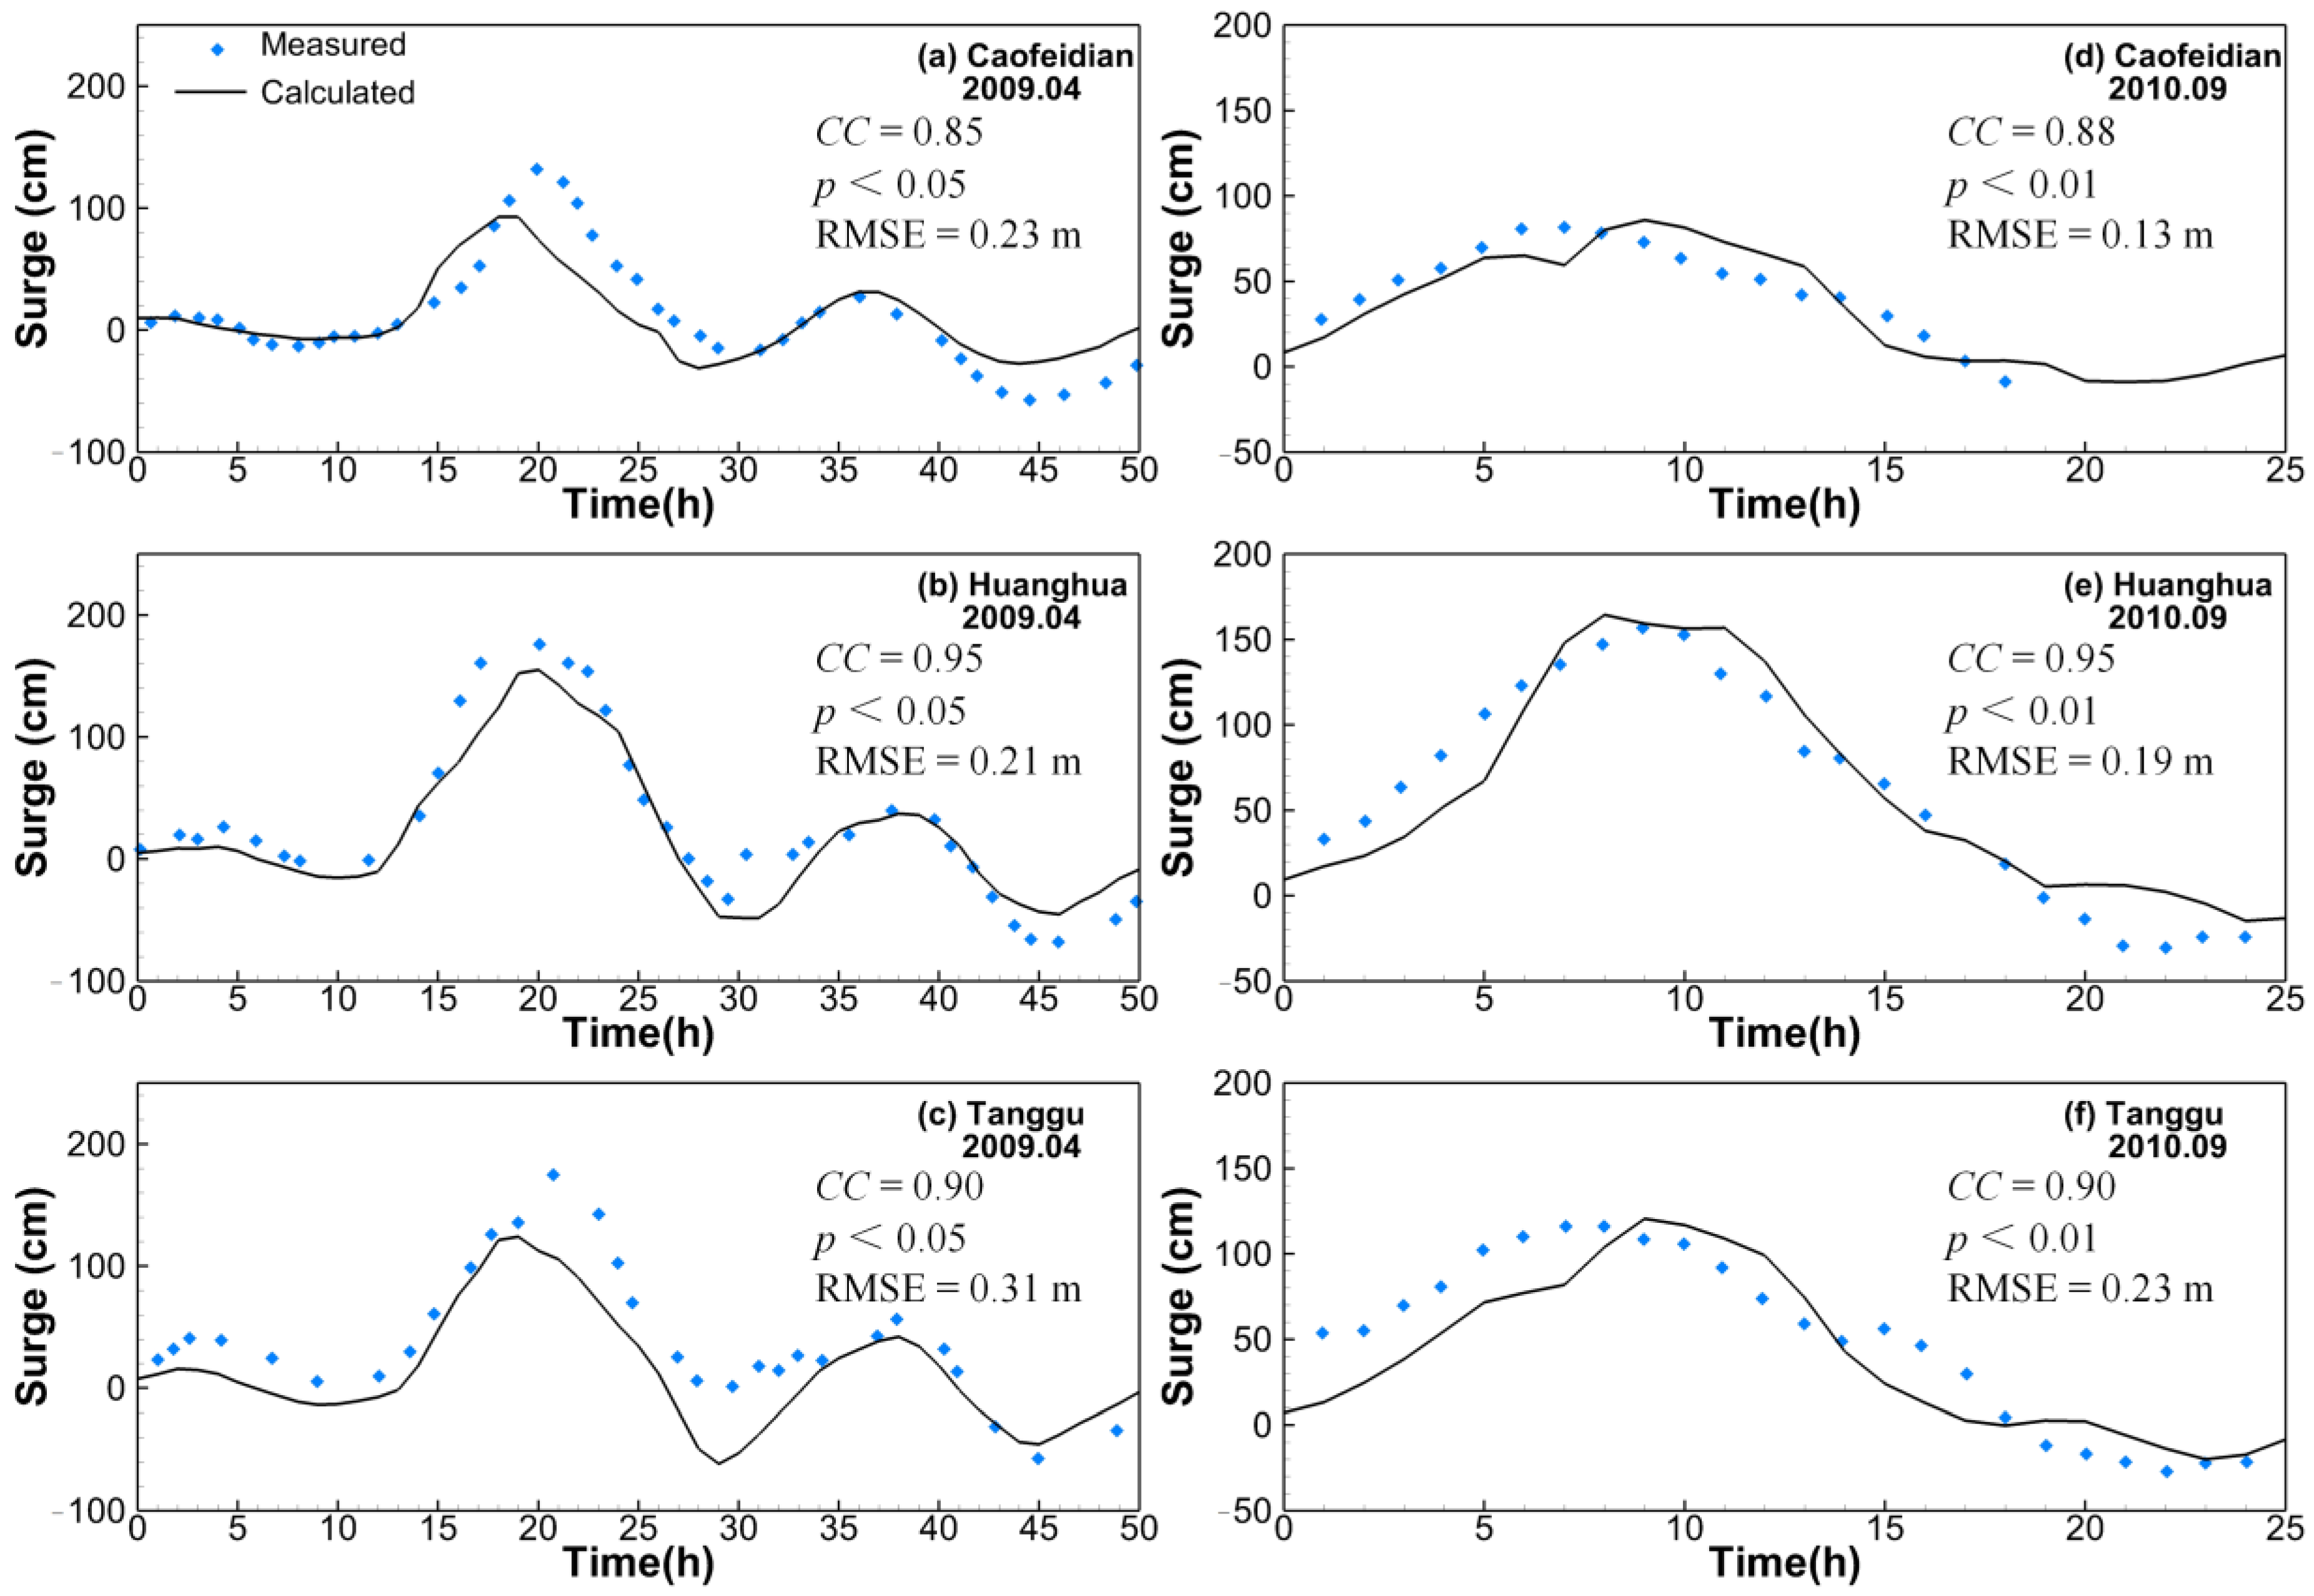
In this study, we focused on the surges caused by cold air invasions. The two meteorological events listed in Table 2 (both dominated by north winds), which caused serious surges in the Bohai Sea, were used to test the performance of the coupled model. Figure 5 shows the comparisons between model-simulated and field-observed temporal variations of surges during the two storms. It can be seen that the storm in 2009 caused two successive surges, with the second surge being weaker than the first, while there was only one surge during the meteorological event in 2010. Both meteorological events showed a succession of a negative surge followed by a positive surge. For the surge of 2009, the first surge maximum is underestimated by the model and the simulated surges peak early at the Tanggu and Caofeidian, which may be the result of inaccurate local bathymetry. However, the temporal variation and magnitude of the simulated surges (run 4, with consideration of the waves) agree generally well with the observed results. This agreement is further supported by the averaged CCs between the simulated and observed surges being 0.90 and 0.91 for the cases in 2009 and 2010, respectively; indicating that the coupled model set up in this study is able to simulate the surge in such a semi-enclosed sea.
3. Results
3.1. Surge Distribution
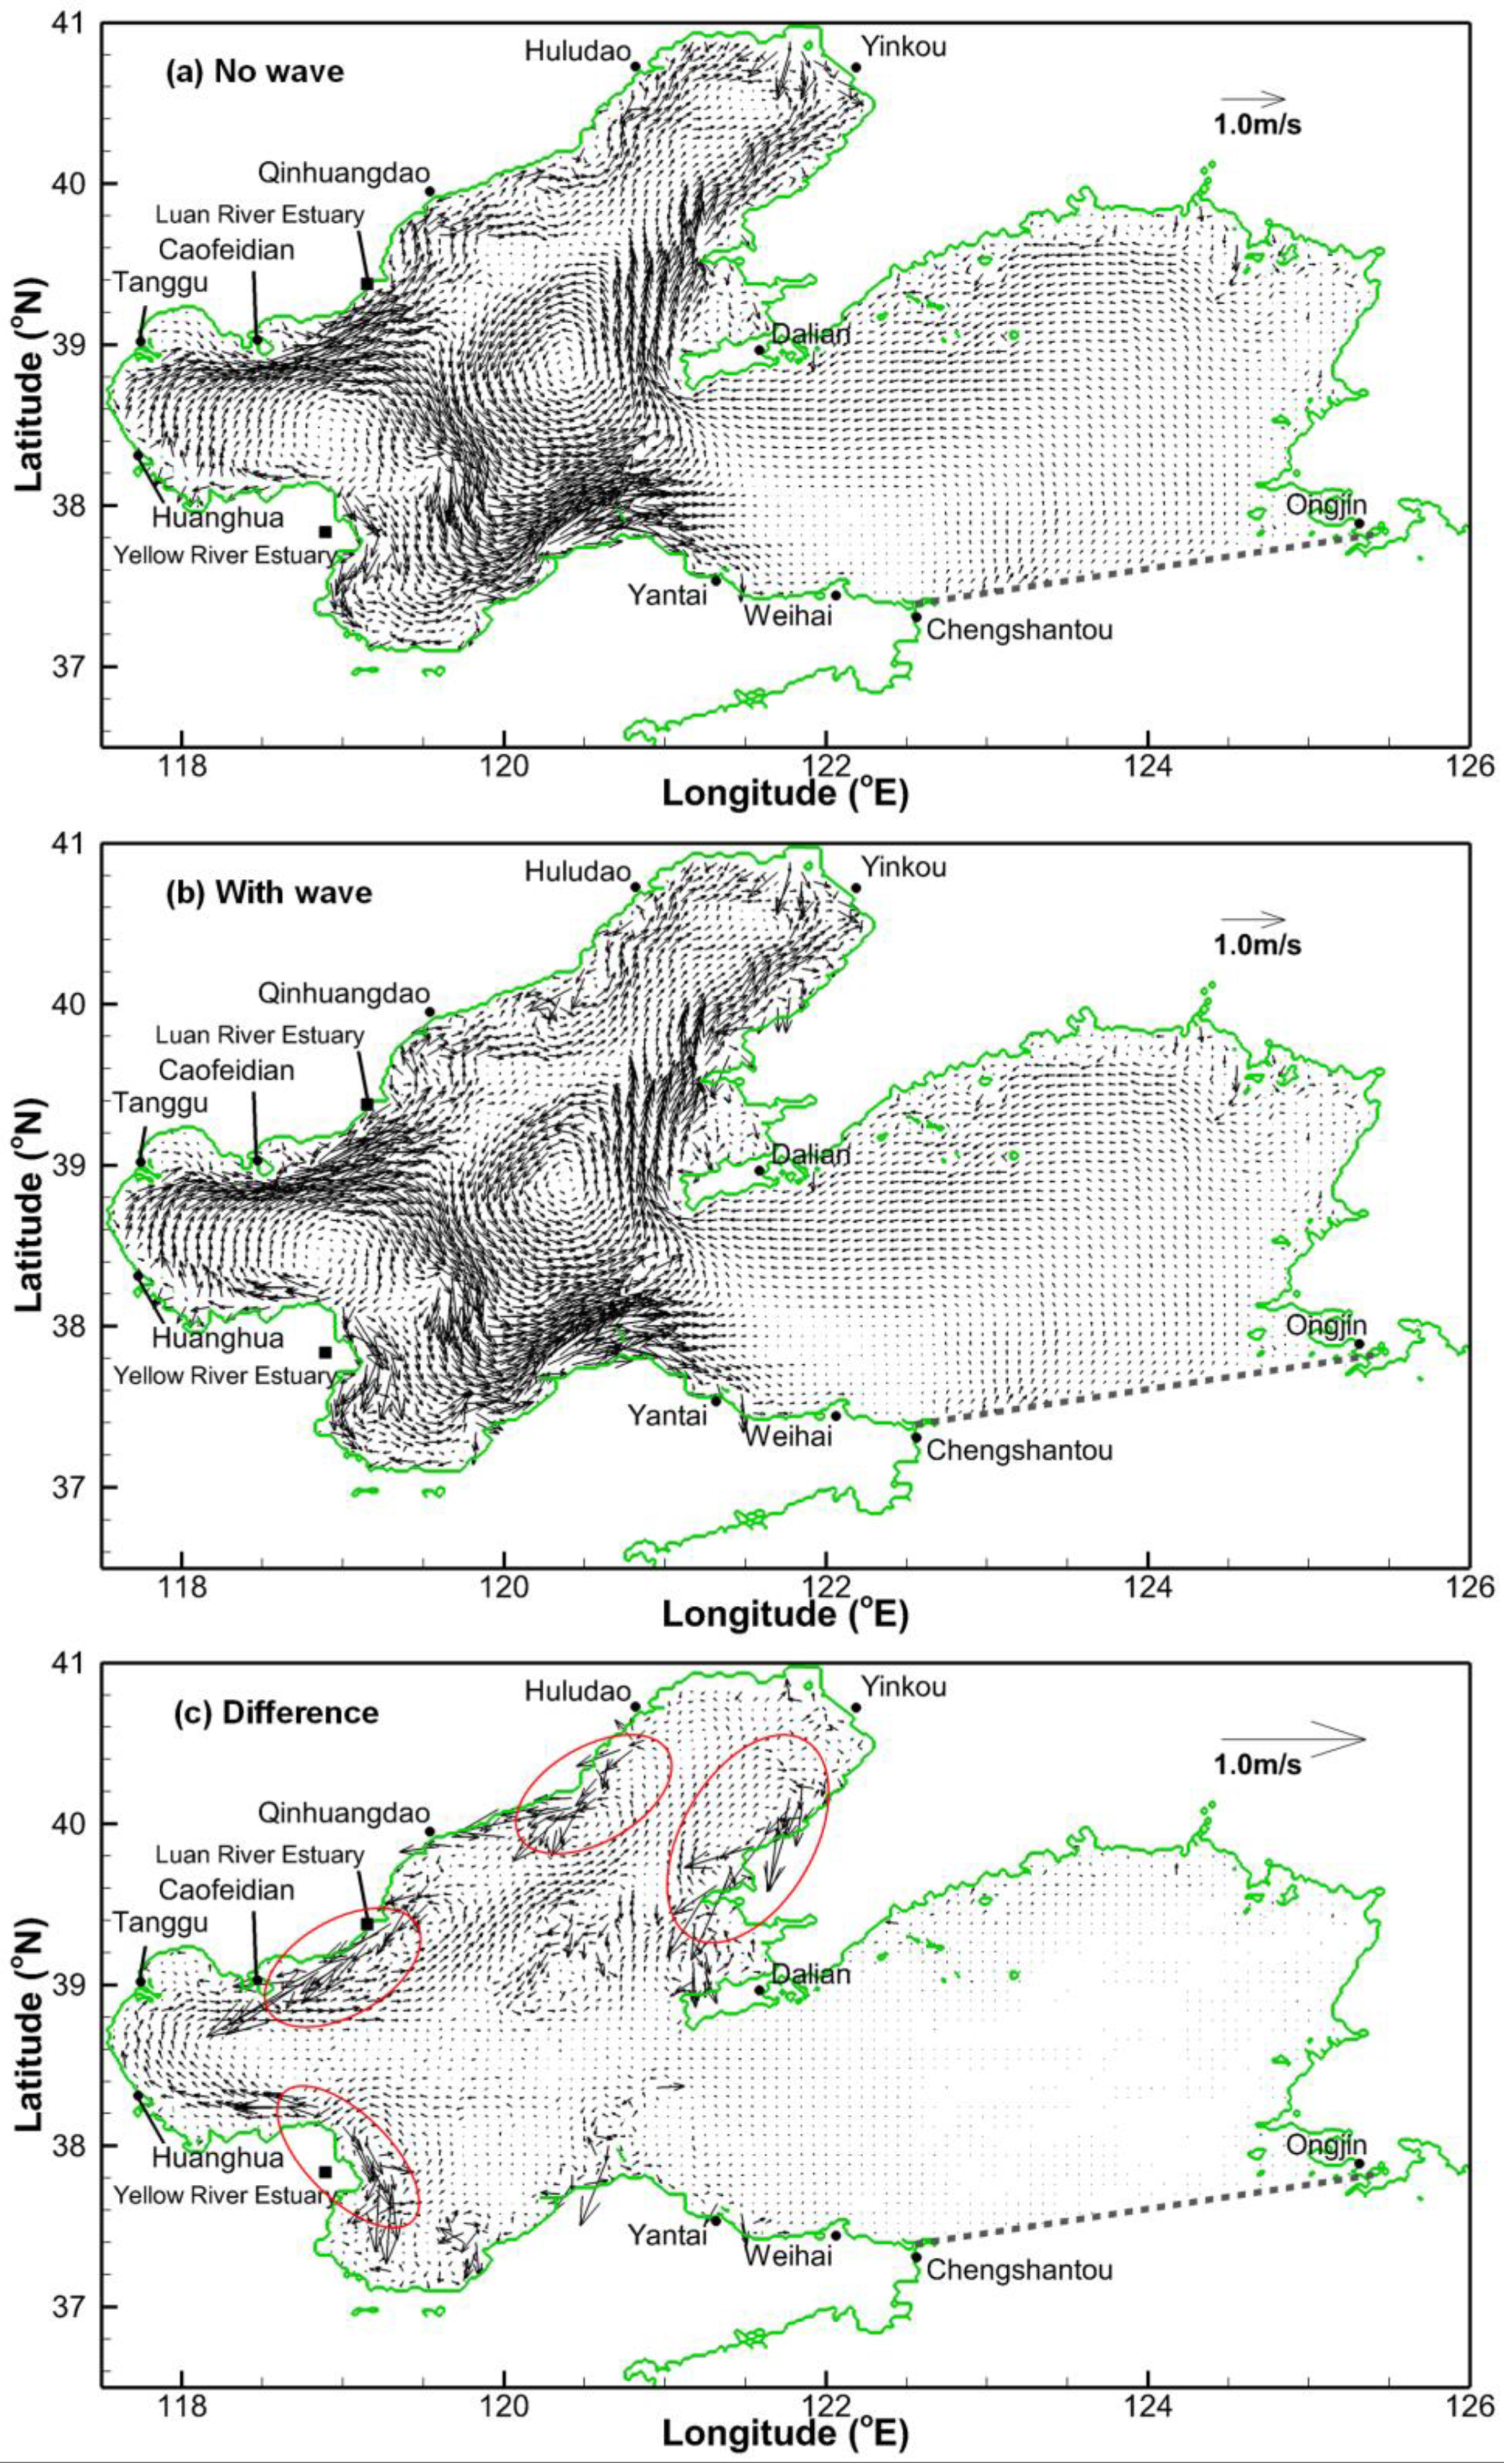
To study the surge distribution and the wave effects on the surge in the offshore region, simulation results of the surge of September 2010 in the Bohai Sea and in the north Yellow Sea were analyzed in detail. Figure 6a,b show the storm surge at the time when the surge in the south part of the Bohai Sea peaks without (run 6) and with (run 4) consideration of wave forces, respectively. The highest surge occurs along the west and south coasts of the Bohai Sea, i.e., the Bohai Bay and the Laizhou Bay, and a serious surge mainly occurs near Huanghua and the Yellow River estuary, where there is a region with shallow water depth even during high tide. The negative storm surge is found in the Liaodong Bay, located in the northern Bohai Sea.
Figure 6c shows the surge difference between runs 4 and 6, which represents the wave-induced set-up (or set-down). It can be seen that the contribution of the wave is obvious in the region near the Yellow River estuary, the south coast of the Bohai Bay and the west and south coast of the Laizhou Bay. Moreover, the wave-induced set-up also occurs near the Luan River estuary. In the central region of the Bohai Sea, the waves mainly contribute to the set-down. In the north part of the Liaodong Bay, the wave-induced set-up is obvious, which indicates that the calculation without consideration of waves (run 6) may overestimate the negative surge and underestimate the water level in the shallow water region.
The wave effects on the surge are more obvious in the shallow water region. Under the influence of waves, the water level tends to rise in the onshore region and decrease in the offshore region. Generally, the wave-induced set-up and set-down in the Bohai Sea range from −0.1 to 0.3 m with the maximum value occurring near the Yellow River estuary and in the Laizhou Sea. In these regions, the wave set-up can be up to 12.5% of the maximum surge. Under north wind conditions, the positive surge occurs in the south of the Bohai Sea and the negative surge occurs in the Liaodong Bay. Compared to the calculations with waves, calculations without waves overestimate the water level decrease caused by the storm in the upwind direction, while they underestimate the water level increase in the downwind direction.
3.2. Wave-Induced Current and High Surges
The surge changes in Figure 6 are due to the mass transport caused by waves. In this subsection, the wave-induced currents are calculated by subtracting the currents driven by tide and wind (run 6) from the results that consider tide, wind and waves (run 4). Figure 7a,b show the currents at the time when the surge in the south part of the Bohai Sea peaks (same time as for Figure 6). Evidently, in the offshore region, the general flow patterns of runs 4 and 6 are similar. There is a circulation in the central basin of the Bohai Sea in both runs. This similarity is confirmed by the small differences in currents between runs 4 and 6 shown in Figure 7c.
The main differences between the two runs appear in onshore regions, especially near the Yellow River estuary, the Luan River estuary, and the west and east coasts of the Liaodong Bay. In these regions, the longshore currents could explain the differences. Indeed, under north wind conditions, the longshore currents in the Liaodong Bay and near the Luan River estuary are almost southward. The longshore currents transport water to the regions that suffer from severe surges, resulting in water accumulating in those regions and a water level relatively higher than that only driven by tides.
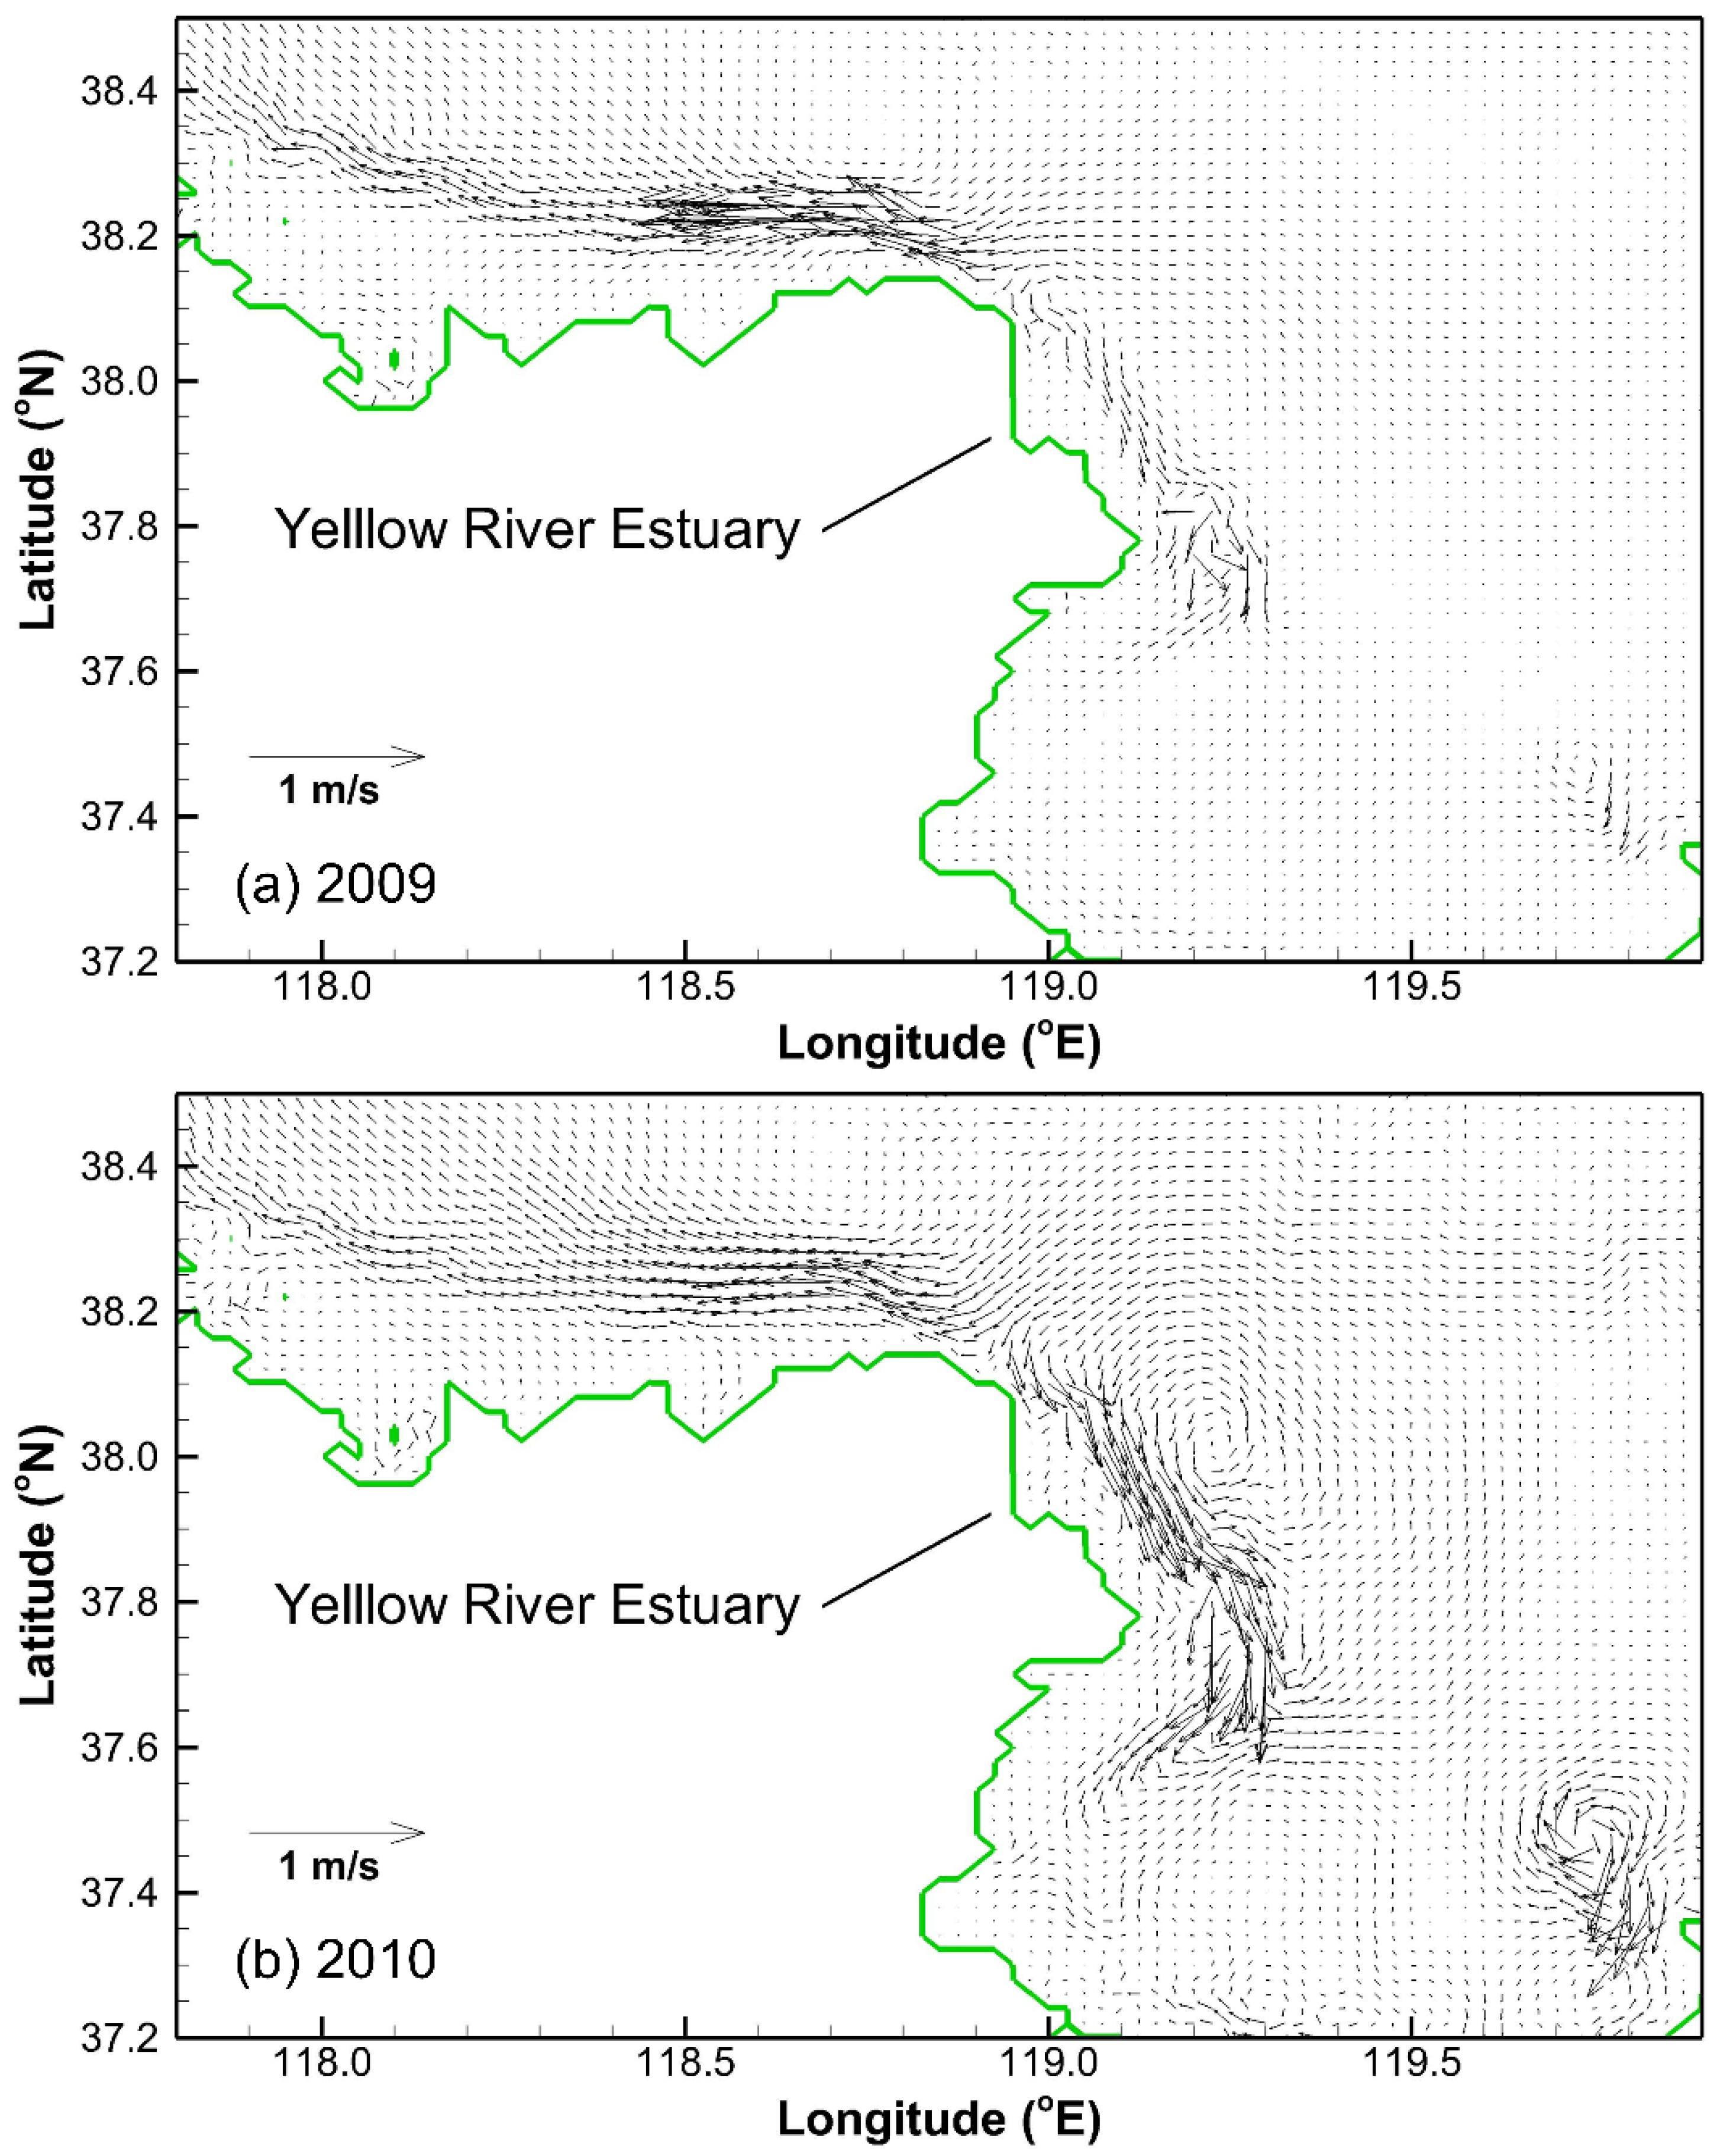
Figure 8 shows the strong longshore currents occurring near the Yellow River estuary at the time when the surges in the south part of the Bohai Sea peaks in 2009 and 2010. The longshore currents in this region are directed towards the south of the Bohai Bay and to the west of the Laizhou Bay. Following the currents, the water is transported from the Yellow River estuary to the south of the Bohai Bay and to the west of the Laizhou Bay, and is accumulated in the shallow water regions of the two bays, resulting in a rise in the water levels. This phenomenon corresponds to the higher surges near the Yellow River estuary, the south of the Bohai Bay and the south and west of the Laizhou Bay.
Based on the comparison of the flow patterns without and with the consideration of waves, and the difference of set-ups in runs 4 and 6, we infer that the formation of the longshore currents is due to radiation stress. In the wave model, the wave breaking is taken into account [7], which contributes to the gradient of wave energy and produces a wave force. Figure 9a,b present the distributions of wave forces at the times when the surge in the south part of the Bohai Sea peaks in 2009 and 2010, respectively. It can be seen that the distributions of wave forces during the two storm surges are similar, with the maximum wave force occurring near the Yellow River estuary in the two cases.
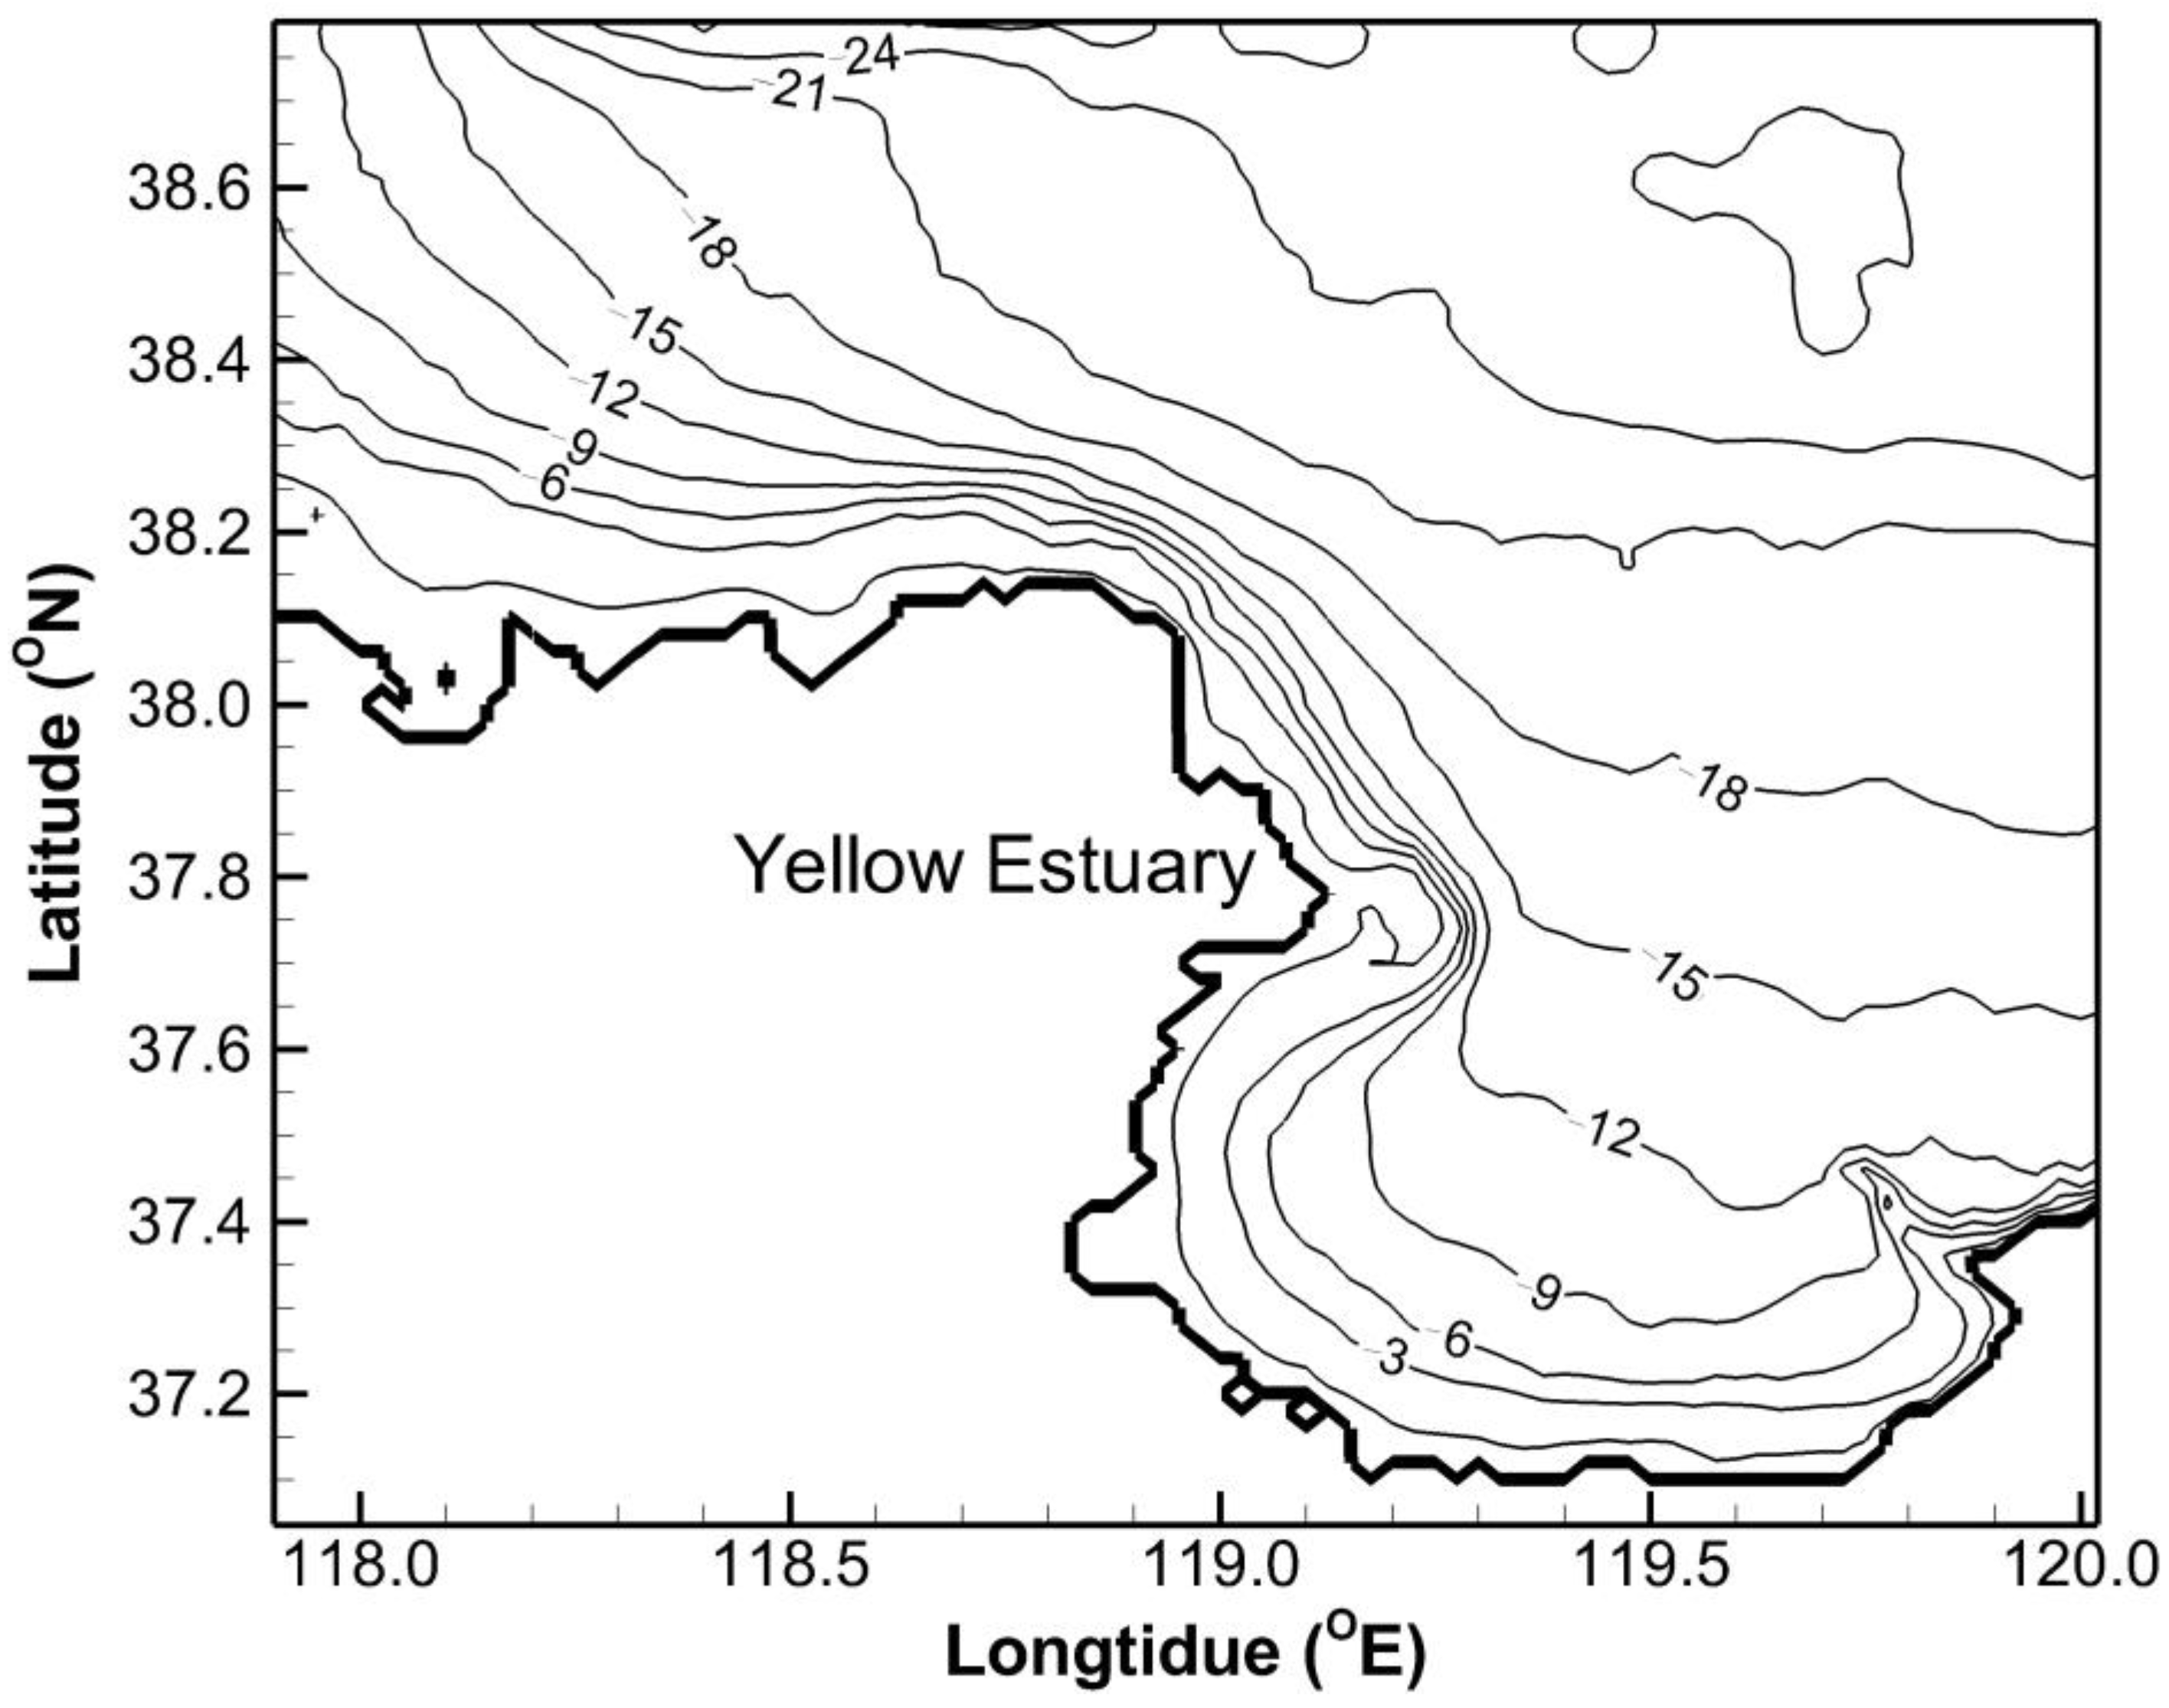
The seabed slope near the Yellow River estuary is rather steep, whereas the seabed slopes in the east and west of the estuary are mild (see Figure 10). As waves from the central basin of the Bohai Bay propagate on the steep seabed, they break quickly in the shallow water area and generate a large gradient of radiation stress that results in significant wave forces near the Yellow River estuary. However, the wave forces on the west and the south of the estuary are weaker due to the milder slopes. Under these conditions, more water is pushed towards the Yellow River estuary resulting in higher water levels near the estuary than in its south-eastern and north-western parts. This also leads to the relatively strong longshore currents, transporting water from the Yellow River estuary to the south of the Bohai Bay and the west of the Laizhou Bay. This is one of the reasons for the higher surges occurring in the south of the Bohai Bay and the west of the Laizhou Bay than that in other parts of these bays.
The water depth becomes gradually shallower from north to south both in the south of the Bohai Bay and in the Laizhou Bay (Figure 1). This bathymetry pattern produces gradual variations of the wave energies and unidirectional wave forces in the two regions (Figure 9). Under the drive of the unidirectional wave forces, the wave-induced currents are southward, further accumulating water in the south of the Bohai Bay and in the Laizhou Bay. Therefore, the water levels additionally rise, which is another reason for the higher surges in these two regions. A similar situation also occurs in the north of the Liaodong Bay. The wave force there is also unidirectional due to the mild slope, but is northward. Under these conditions, the wave-induced currents are northward, opposite to the wind-induced currents. Therefore, the wave-induced currents mitigate the negative surge happening there. This explains the lower negative surge in the north of the Liaodong Bay when considering the wave effects. However, in the central basin, the situation is different as the bathymetry is undulating, especially in the region close to the Bohai Strait (Figure 1), producing random directions of wave forces. With this pattern, the wave force cannot continuously push the water in one direction and thus has no significant effect on the surge in the central basin, as indicated in Figure 6c.
3.3. Relationships between Tide and Surge
The dominant tidal component in the Bohai Sea is M2. For most of the coast around the Bohai Sea, the tidal height ranges from 0 to 2.5 m. Due to flood and ebb tides, the water depth changes significantly when the amplitude of the tide is large enough, which may significantly affect the wave deformation and propagation in shallow water.
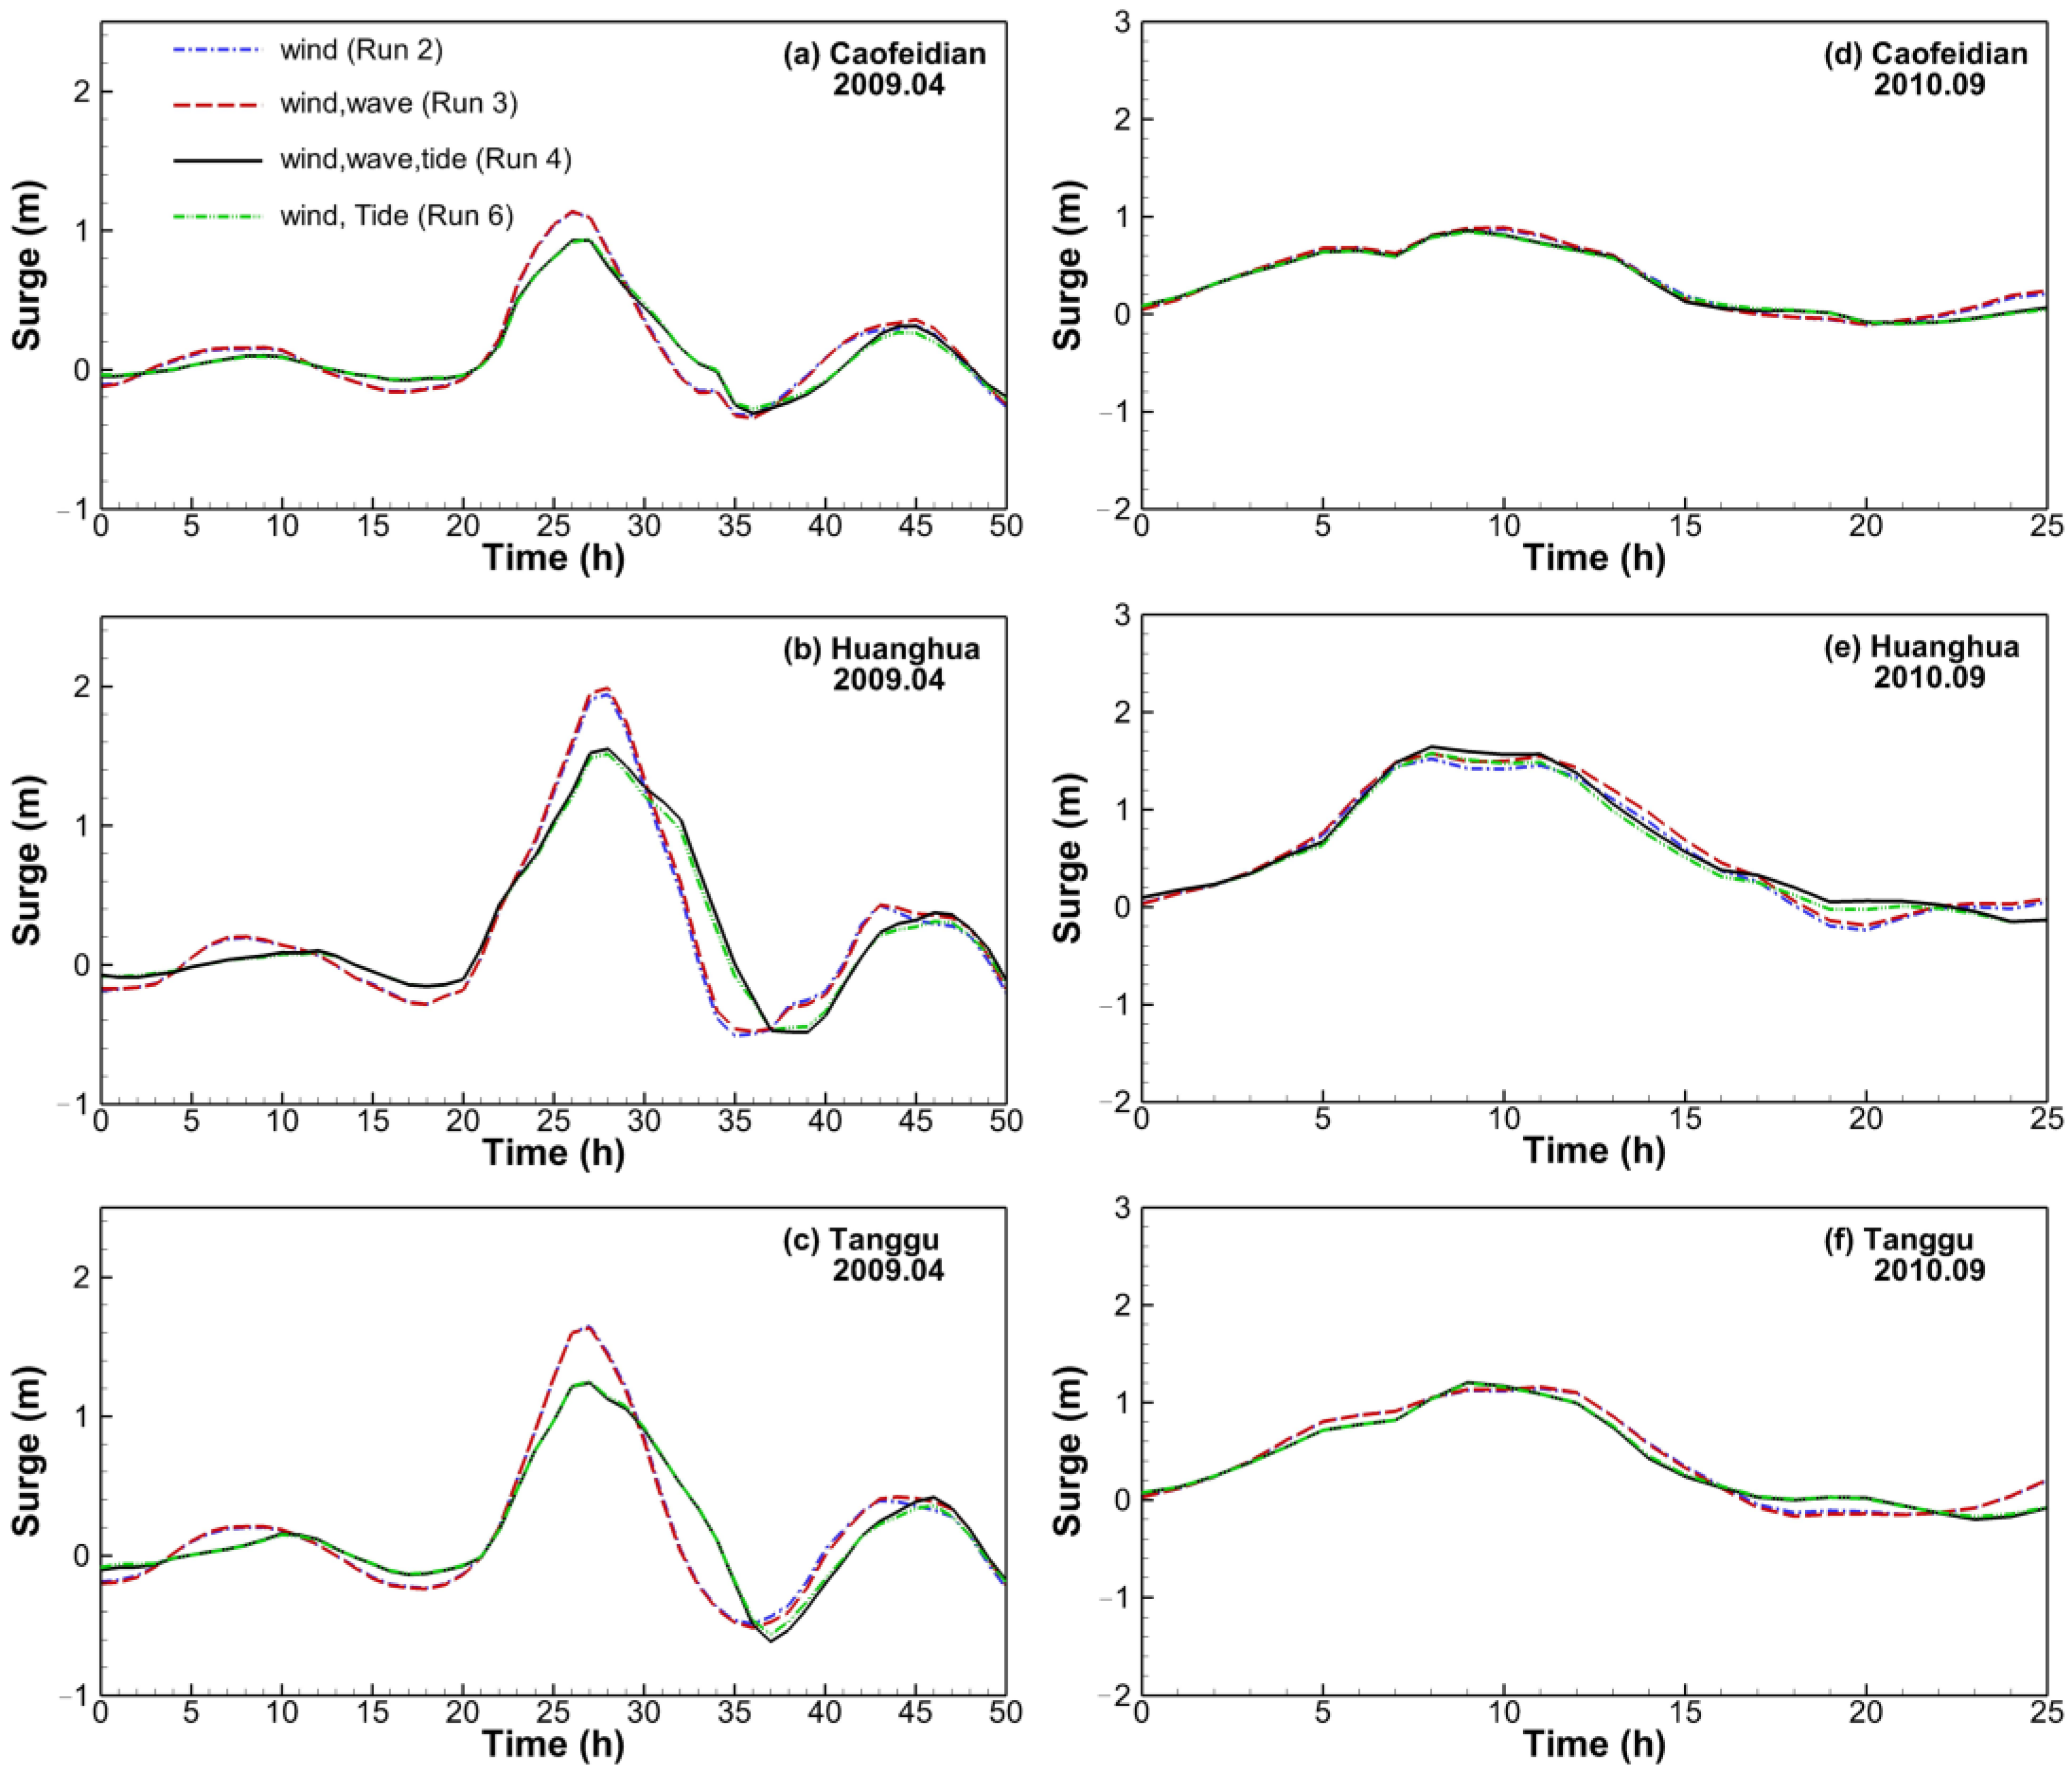
The storm surge events occurring on 13 April 2009 and on 21 September 2010 were simulated using runs 2, 3, 4 and 6, and were analyzed to study the effects of tide on the storm surges and its interaction with waves. The peak surges of the two events occurred during different tidal phases. The peak surge of the event beginning on 13 April 2009 occurred at high tide and that of the event beginning on 21 September 2010 occurred at rising tide (see Figure 11).
Figure 12a–c show the variations of the surges during the storm on 13 April 2009. By comparing the surge levels with tides to those without tides, it can be seen that the peak surges are significantly reduced when considering the influence of the tide, especially at Huanghua and Tanggu. This indicates that methods used to forecast or hindcast the peak water level of a storm surge occurring at high tide by adding the water levels driven by wind (and wave) (i.e., run 2 or run 3) to those driven by tide (run 1) are not suitable for the Bohai Sea. This can be explained by two reasons. Firstly, M2, which is the dominant tidal component in the Bohai Sea, has a wavelength (~600 km) of approximately twice the spatial scale (~300 km) of the Bohai Sea [41]. When the western coast of the Bohai Bay experiences high tide, the water level in the central part of the Bohai Sea and the Bohai Strait is relatively low. Under these conditions, the gravity force hinders the inflow of water from the central basin of the Bohai Sea to the western part of the Bohai Sea. This explains that the peak surges calculated by considering the tide in run 4 are lower than those without tides in runs 2 and 3. Secondly, an increase and decrease of water depth caused by flood and ebb tides is related to wave deformation in shallow water regions. As mentioned above, wave deformation in shallow water regions causes a significant set-up, which raises the water level in the coastal region. However, during high tide, water depth is higher, weakening the wave deformation near the coast and thereby also the longshore currents. If the surge is calculated without considering tidal effects, the water depth at the coast is lower than the real hydrodynamic conditions in which waves propagate. Due to the underestimation of water depth, the modelled wave deformation is overestimated and thereby the calculated set-up becomes more obvious in the coastal region. By comparing the water depth at the three locations, it can be found that the water depths at Huanghua and Tanggu are smaller than that at Caofeidian (Figure 1). The model results show that the tidal amplitudes at Huanghua and Tanggu are larger than that at Caofeidian. As a result, for the surge of 2009, the differences between the peak surge values calculated by runs 3 and 4 vary with the location (Figure 12a–c), with significant differences at Huanghua and Tanggu and a lower difference at Caofeidian.
In contrast, the peak surges at Caofeidian, Huanghua and Tanggu during the storm of September 2010 occurred at rising tide. At this time, the water depths at the three locations were shallower. Under these conditions, the water from the central basin of the Bohai Sea could flow easily into the western Bohai Bay as the water level in the Bohai Bay was equal to or lower than that in the central basin of the Bohai Sea. This explains that the peak surge values calculated under run 2 are similar to those calculated under run 4 (Figure 12d–f). However, it can still be seen that the calculated surges under run 4 are slightly larger than those under runs 2 and 3. This can be attributed to the fact that runs 2 and 3 underestimate longshore currents and set-up led by the wave deformation in the regions of shallow water, where the water depth is overestimated.
The analysis above shows that the tide is an important factor determining the surge. The flood and ebb tides alter the hydrodynamic conditions in which waves propagate and influence the development of the surge. Ignoring tides can lead to overestimation of the surge at rising or high tide, but also to its underestimation at falling or low tide, and therefore, the tide should be considered for surge prediction in the Bohai Sea.
4. Discussion
In this study, we develop a numerical model that couples wave and tidal current models. Both sub-models have been calibrated and the results show that both of them are accurate enough for applications in the Bohai Sea. The validation of the coupled model against field measurements indicates that it is capable of capturing the characteristics of the surge with the effects of waves being considered. This study focuses on the surge caused by cold air invasions from the north but ignores the contributions by the gradient of air pressure that can also contribute to the surge. During cold air invasions, the gradient of air pressure is relatively low [24]. As the Bohai Sea is semi-enclosed and shallow, with an average depth of 18 m, the effects of the air pressure gradient would be negligible compared to those of wind stress [29,42,43]. Therefore, it is reasonable to ignore the air pressure and focus on the effect of wind and its interaction with wave and tide. This could not be ignored in the cases of a typhoon, which creates a large pressure gradient. However, the Bohai Sea seldom suffers from typhoons due to its high latitude.
The comparison between the calculations with (run 4) and without (run 6) waves shows that the waves affect the surge in such a semi-enclosed shallow sea. A limitation of the study is that the effect of waves on water movement are represented by the radiation stress, which is related to the spatial distribution of wave energy. In fact, the wave stress is derived from linear theory [6]. However, the water depth in the Bohai Sea is very shallow and it varies significantly in some regions. Under this condition, the wave behavior usually becomes nonlinear, which is related to Stokes drift and non-hydrostatic pressure, both of which are ignored in this study [44,45]. Moreover, the model used in this study is two-dimensional and it cannot well represent the water flows in the vertical direction caused by the waves in onshore regions, which have a significant effect on the surge. This can also partly explain the small discrepancies between the simulated and observed surges (Figure 5). Future studies should examine and quantify the effect of nonlinear wave behavior on storm surges using a more detailed three-dimensional numerical model.
The case study in this paper, while relatively simple, demonstrates that interactions among waves, tide and current can be important and quantifies the contribution of the wave force on the surge magnitude in the Bohai Sea. By comparing the currents with and without the effects of the wave force, we find that the wave-induced longshore current is a main contributor to the surge around the Yellow River estuary. The result analysis shows that the topography of the seabed is an important factor influencing the wave propagation and deformation, which thereby determines the longshore current and water accumulation. This fact indicates that the higher surges in the south part of the Bohai Bay is the combined results of the topography in these regions and the stronger north wind in the Bohai Sea.
Moreover, by analyzing the model-simulated results of the two surge cases, for which the peak surges occurred at different tidal phases, we uncover the effect of tides on waves and surge. This implies that simply adding the water level rise caused by wind to the tidal water level is not generally suitable to precisely forecast or hindcast the surges in some situations. In shallow seas such as the Bohai Sea, such a method tends to overestimate the peak water level when it occurs at high tide, especially in shallow waters with mild seabed slopes. This method may be able to calculate the real water levels and surges in deep water regions, when the peak surge occurs at lower tide, but it still underestimates the water level in the shallow waters. Therefore, our results show that it is important to take the mutual influences of tide, wind and waves into account to evaluate the risk of a storm surge.
5. Conclusions
In this study, we developed and validated a storm surge model coupling the effects of waves, tide and current, which can improve both our understanding of storm surges and their distributions, and the evaluation of risks linked to storm surges in the Bohai Sea. We summarize the main findings of the study as follows:
The model results show that the wave-induced surge is stronger in shallow waters and could be ignored in offshore regions. Generally, the wave-induced set-down contributes up to 12% of the storm surge and it is in the range of −0.1 to −0.3 m with the maximum occurring near the Yellow River estuary and in the Laizhou Bay.
Under the drive of a north wind, the positive surge takes place in the south of the Bohai Sea and the negative surge takes place in the Liaodong Bay. In the upwind direction, calculations ignoring wave contribution can overestimate the water level decrease caused by a storm.
The longshore currents caused by wave breaking and energy dissipation are important contributors to the surges in shallow water regions. Under north wind conditions, the steep gradient of bathymetry near the Yellow River estuary contributes to the large gradient of wave energy and stronger wave force in this region, pushing the water towards the Yellow River estuary and raising the water level there. This higher water level generates longshore currents flowing into the south of the Bohai Bay and the west of the Laizhou Bay, and thereby amplifying the storm surges in these two regions.
The gently varying seabed in the south of the Bohai Bay and the Laizhou Bay is another factor contributing to the surges in these two bays. With such bathymetry, the wave force in the two bays is unidirectional. Therefore, their water can be continuously driven to the southern shallow water regions, resulting in higher surges in their coastal regions.
Tide also influences the formation of the surge. The flood and ebb tides have significant effects on the wind-induced flows from the outer sea to the bays and on the wave deformation that generates wave set-up and longshore currents along the coast. All of these factors influence the mass transport in the coast. Therefore, it is improper to forecast or hindcast the surges by simply adding the water level rise caused by wind to the tidal water level. The mutual influences of tide, wind and waves should be considered to evaluate the risks of storm surges in such a semi-enclosed shallow sea.
Author Contributions
Conceptualization, Y.L., H.F. and D.Y.; Data curation, Y.L, D.Y., G.Z. and X.M.; Formal analysis, Y.L., G.V. and D.Y.; Funding acquisition, Y.L., D.Y. and K.L.; Methodology, Y.L., H.F., G.V. and D.Y.; Resources, D.Y.; Software, Y.L.; Supervision, H.F. and D.Y.; Validation, Y.L. and G.Z.; Visualization, Y.L. and G.Z.; Writing—original draft, Y.L.; Writing — review and editing, H.F., G.V. and D.Y. All authors have read and agreed to the published version of the manuscript.
Funding
This research was funded by China Research Academy of Environmental Sciences, grant number 2020YSKY-013; National Natural Science Foundation of China, grant number 11872271, and China Scholarship Council.
Acknowledgments
The authors acknowledge the contributions from two anonymous reviewers whose comments and suggestions are very valuable and helped us improve this work.
Conflicts of Interest
The authors declare no conflict of interest.
References
- Prandle, D.; Wolf, J. The interaction of surge and tide in the North Sea and River Thames. Geophys. J. Int. 1978, 55, 203–216. [Google Scholar] [CrossRef] [Green Version]
- Tang, Y.M.; Sanderson, B.; Holland, G.; Grimshaw, R. A numerical study of storm surges and tides, with application to the North Queensland Coast. J. Phys. Oceanogr. 1996, 26, 2700–2711. [Google Scholar] [CrossRef] [Green Version]
- Mastenbroek, C.; Burgers, G.; Janssen, P.A.E.M. The dynamical coupling of a wave model and a storm surge model through the atmospheric boundary layer. J. Phys. Oceanogr. 1993, 23, 1856–1866. [Google Scholar] [CrossRef] [Green Version]
- Moon, I.J. Impact of a coupled ocean wave–tide–circulation system on coastal modeling. Ocean Model. 2005, 8, 203–236. [Google Scholar] [CrossRef]
- Longuethiggins, M.S.; Stewart, R.W. Radiation stress and mass transport in gravity waves, with application to ‘surf-beats’. J. Fluid Mech. 1962, 13, 481–504. [Google Scholar] [CrossRef]
- Holthuijsen, L.H. Waves in Oceanic and Coastal Waters; Cambridge University Press: New York, NY, USA, 2007. [Google Scholar]
- SWAN-Team. SWAN User Manual; Delft University of Technology: Delft, The Netherlands, 2007. [Google Scholar]
- Kim, S.Y.; Yasuda, T.; Mase, H. Numerical analysis of effects of tidal variations on storm surges and waves. Appl. Ocean Res. 2008, 30, 311–322. [Google Scholar] [CrossRef]
- Kim, S.Y.; Yasuda, T.; Mase, H. Wave set-up in the storm surge along open coasts during Typhoon Anita. Coast. Eng. 2010, 57, 631–642. [Google Scholar] [CrossRef]
- Chen, C.; Liu, H.; Beardsley, R.C. An unstructured grid, finite-volume, three-dimensional, primitive equations ocean model: Application to coastal ocean and estuaries. J. Atmos. Ocean. Technol. 2003, 20, 159–186. [Google Scholar] [CrossRef]
- Qi, J.; Chen, C.; Beardsley, R.C.; Perrie, W.; Cowles, G.W.; Lai, Z. An unstructured-grid finite-volume surface wave model (FVCOM-SWAVE): Implementation, validations and applications. Ocean Model. 2009, 28, 153–166. [Google Scholar] [CrossRef]
- Yoon, J.J.; Jun, K.C. Coupled storm surge and wave simulations for the Southern Coast of Korea. Ocean Sci. J. 2015, 50, 9–28. [Google Scholar] [CrossRef]
- Marsooli, R.; Orton, P.M.; Mellor, G.; Georgas, N.; Blumberg, A.F. A Coupled Circulation-Wave Model for Numerical Simulation of Storm Tides and Waves. J. Atmos. Oceanic Technol. 2017, 34, 1449–1467. [Google Scholar] [CrossRef]
- Liu, Z.; Wang, H.; Zhang, Y.J.; Magnusson, L.; Loftis, J.D.; Forrest, D. Cross-scale modeling of storm surge, tide, and inundation in Mid-Atlantic Bight and New York City during Hurricane Sandy, 2012. Estuar. Coast. Shelf Sci. 2020, 233, 17. [Google Scholar] [CrossRef]
- Zhao, P.; Jiang, W. A numerical study of the effects of coastal geometry in the Bohai Sea on storm surges induced by cold-air outbreaks. J. Ocean Univ. China 2011, 10, 9–15. [Google Scholar] [CrossRef]
- Ding, Y.; Wei, H. Research of the influential factors on the simulation of storm surge in the Bohai Sea. Open Mech. Eng. J. 2014, 8, 151–156. [Google Scholar] [CrossRef] [Green Version]
- Ma, X.; Zhang, G.; Yuan, D.; Li, Y. Analysis of the characteristics of storm surges in Tianjin Coastal Area. Adv.Mar. Sci. 2016, 34, 516–522. (In Chinese) [Google Scholar]
- Gao, X. The Change of Wave Dynamic Environment for Bohai Bay in Recent 30 Years; Tianjin University of Sicence and Technology: Tianjin, China, 2013. [Google Scholar]
- Shang, J.; Sun, J.; Tao, L.; Li, Y.; Nie, Z.; Liu, H.; Chen, R.; Yuan, D. Combined effect of tides and wind on water exchange in a semi-enclosed shallow sea. Water 2019, 11, 1762. [Google Scholar] [CrossRef] [Green Version]
- Lv, X.; Yuan, D.; Ma, X.; Tao, J. Wave characteristics analysis in Bohai Sea based on ECMWF wind field. Ocean Eng. 2014, 91, 159–171. [Google Scholar] [CrossRef]
- Xu, J.; Zhang, Y.; Cao, A.; Liu, Q.; Lv, X. Effects of tide-surge interactions on storm surges along the coast of the Bohai Sea, Yellow Sea, and East China Sea. Sci. China Earth Sci. 2016, 59, 1308–1316. [Google Scholar] [CrossRef]
- Zhang, Y.; Leng, Q.; Hu, Z.; Zhu, Z.; Zhang, W.; Bian, S. Study of storm surge numerical simulation in the Bohai Sea. Adv. Mater. Res. 2014, 989–994, 2288–2291. [Google Scholar] [CrossRef]
- Ding, Y.; Ding, L. A numerical simulation of extratropical storm surge and hydrodynamic response in the Bohai Sea. Discret. Dyn. Nat. Soc. 2014, 2014, 1–9. [Google Scholar] [CrossRef] [Green Version]
- Li, D.; Xu, Y.; Bai, L.; Xie, Y.; Wu, D.; He, N. Numerical forecast model of variable zone storm surge for Bohai Bay. J. Tianjin Univ. 2011, 44, 840–846. (In Chinese) [Google Scholar]
- Li, L.; Li, H.; Shi, Y.; Xie, Y. Application of water land combination method to inundated simulation of storm surge. Water Resour. Power 2010, 11, 18. [Google Scholar]
- Zhang, T.; Yu, F.; Dong, J.; Fu, X. Numerical research on effects of mean sea level on storm surge inundation in Huanghua. Mar. Sci. Bull. 2010, 29, 499–503. (In Chinese) [Google Scholar]
- Lin, Q. Numerical Simulation of Sedient Movement in the Coast Area during the Strong Wind; Tianjin University: Tianjin, China, 2004. [Google Scholar]
- Fu, C.; Yu, F.; Wang, P.; Liu, Q.; Dong, J. A study on extratropical storm surge disaster risk assessment at Binhai New Area. Acta Oceanol. Sin. 2013, 35, 55–62. (In Chinese) [Google Scholar]
- Fu, C.; Dong, J.; Wu, S.; Liu, Q.X. Numerical simulation on typical extratropical storm surge in the Bohai Sea. Mar. Forecast. 2011, 28, 1–8. (In Chinese) [Google Scholar]
- Sun, J. Relation Matrix and Its Appliction in the Study on the Water Exchange in the Coast; Tianjin University: Tianjin, China, 2007. [Google Scholar]
- Li, Y.; Yuan, D.; Lin, B.; Teo, F.-Y. A fully coupled depth-integrated model for surface water and groundwater flows. J. Hydrol. 2016, 542, 172–184. [Google Scholar] [CrossRef]
- Sun, J.; Lin, B.; Jiang, G.; Li, K.; Tao, J. Modelling study on environmental indicators in an estuary. Proc. Inst. Civ. Eng. Water Manag. 2014, 167, 141–151. [Google Scholar] [CrossRef]
- Nie, H.; Tao, J. Inversion of dispersion coefficient in water quality model using optimal perturbation algorithm. Appl. Math. Mech. 2009, 30, 703–712. [Google Scholar] [CrossRef]
- Nie, H.; Tao, J. Eco-environmental status of the Bohai Bay and the impact of coastal exploitation. Mar. Sci. Bull. 2009, 11, 81–95. [Google Scholar]
- Sun, J.; Tao, J. Relation matrix of water exchange for sea bays and its application. China Ocean Eng. 2006, 20, 529–544. [Google Scholar]
- Xing, F.W.; Sun, J.; Li, Y.Y.; Yuan, D.K.; Tao, J.H. Numerical simulation of water exchange in Bohai Sea with age and half-life time. In Proceedings of the 35th International Association for Hydro-Environment Engineering and Research World Congress, Chengdu, China, 8–13 September; 2013; pp. 1–7. [Google Scholar]
- Li, Y.; Feng, H.; Yuan, D.; Guo, L.; Mu, D. Mechanism study of transport and distributions of trace metals in the Bohai Bay, China. China Ocean. Eng. 2019, 33, 73–85. [Google Scholar] [CrossRef]
- Navigation Guarantee Department of Chinese Navy Headquarters. Marine Chart of China; China Navigation Publications Press: Beijing, China, 2013. [Google Scholar]
- Saha, S.; Moorthi, S.; Pan, H.-L.; Wu, X.; Wang, J.; Nadiga, S.; Tripp, P.; Kistler, R.; Woollen, J.; Behringer, D.; et al. NCEP Climate Forecast System Reanalysis (CFSR) 6-Hourly Products, January 1979 to December 2010; Computational and Information Systems Laboratory, Ed.; Research Data Archive at the National Center for Atmospheric Research, Computational and Information Systems Laboratory: Boulder, CO, USA, 2010. [Google Scholar]
- Egbert, G.D.; Erofeeva, S.Y. Efficient inverse modeling of barotropic ocean tides. J. Atmos. Ocean. Technol. 2002, 19, 193–204. [Google Scholar] [CrossRef] [Green Version]
- Wang, K.; Fang, G.; Feng, S. A 3-D numerical simulation of M2 tides and tidal currents in the Bohai Sea, the Huanghai Sea and the East China Sea. Acta Oceanol. Sin. 1999, 21, 1–13. (In Chinese) [Google Scholar]
- Feng, S. The Theory of storm surge. In Series Book of Oceanologic and Limnologic Science; Zeng, C., Ed.; Science Press: Beijing, China, 1982. (In Chinese) [Google Scholar]
- Shi, P.; Guo, H. Storm surges of the temperate zone in tanggu and its forecast research. Mar. Forecast Serv. 1984, 1, 33–42. (In Chinese) [Google Scholar]
- Wang, Q.; Kang, H.; Wang, K. Three-dimensional unstructured modelling of wave-induced circulation over a plane and irregular beach. J. Hydrodyn. Ser. B 2016, 28, 219–226. [Google Scholar] [CrossRef]
- Moghimi, S.; Klingbeil, K.; Gräwe, U.; Burchard, H. A direct comparison of a depth-dependent Radiation stress formulation and a Vortex force formulation within a three-dimensional coastal ocean model. Ocean Model. 2013, 70, 132–144. [Google Scholar] [CrossRef]
Figure 1.
Location of the Bohai Sea and the observation stations (wave, water level and current). The orange solid dots represent the wave observation stations [27] and the red dots represent the surge observation stations [28,29].

Figure 2.
Flow chart for coupling the tidal current and wave models.

Figure 3.
Validation of the wave model (run 5). (a) Significant wave height (Hs) at W1. (b) Significant wave period (T) at W1. (c) Significant wave height at W2. (d) Significant wave period at W2.
Figure 3.
Validation of the wave model (run 5). (a) Significant wave height (Hs) at W1. (b) Significant wave period (T) at W1. (c) Significant wave height at W2. (d) Significant wave period at W2.

Figure 4.
Comparison between the wave parameters output from the 1st iteration (run 5, blue dots) and the 2nd iteration (run 7, black line). (a) Significant wave height (Hs) at W1. (b) Significant wave period (T) at W1. (c) Significant wave height at W2. (d) Significant wave period at W2.
Figure 4.
Comparison between the wave parameters output from the 1st iteration (run 5, blue dots) and the 2nd iteration (run 7, black line). (a) Significant wave height (Hs) at W1. (b) Significant wave period (T) at W1. (c) Significant wave height at W2. (d) Significant wave period at W2.

Figure 5.
Comparison between model-simulated and field-measured surges for the cases 1–6 presented in Table 2, respectively. Blue dots: measured [28,29]; blackline: calculated with radiation stress (run 4).

Figure 6.
Wave effects on the surge (at the time step for which the surge in the south Bohai Sea peaks). (a) Surge distribution without waves (run 6). (b) Surge distribution with waves (run 4). (c) Difference between surge distributions with and without waves (surge with waves subtracted by that without waves).

Figure 7.
Wave effect on currents (at the time step for which the surge in the south Bohai Sea peaks). (a) Currents without waves (run 6). (b) Currents with waves (run 4). (c) Difference between currents with and without waves. The red circles in (c) indicate regions with strong longshore currents.
Figure 7.
Wave effect on currents (at the time step for which the surge in the south Bohai Sea peaks). (a) Currents without waves (run 6). (b) Currents with waves (run 4). (c) Difference between currents with and without waves. The red circles in (c) indicate regions with strong longshore currents.

Figure 8.
Longshore currents near the Yellow River estuary (at the time step for which the surge in the south Bohai Sea peaks).
Figure 8.
Longshore currents near the Yellow River estuary (at the time step for which the surge in the south Bohai Sea peaks).

Figure 9.
Wave force distributions in the Bohai Bay during the 2009 (a) and 2010 (b) storms (at the time step for which the surge in the south Bohai Sea peaks). The red rectangles represent the regions with a unidirectional wave force and the orange circles represent the regions with a non-uniform wave force.

Figure 10.
Bathymetry near the Yellow River Estuary, southwest of the Bohai Sea.

Figure 11.
Evolution of surge, tide and total water level during the surge events beginning on 13 April 2009 (panels (a–c)) and on 21 September 2010 (panels (d–f)). The total water levels are calculated using run 4, the tidal levels are calculated using run 1 and the surges are calculated as the difference of water levels between run 4 and run 1.

Figure 12.
Simulated surges at Caofeidian (panels (a,d)), Huanghua (panels (b,e)), and Tanggu (panels (c,f)) during the 2009 event (panels (a–c)) and 2010 events (panel (d–f)) with consideration of wind (run 2, dashed blue line), wind and waves (run 3, dashed red line), wind, waves and tide (run 4, black line) and wind and tide (run 6, dashed green line).


Table 1.
Runs of simulations and the setup for sub-models. √ indicates the sub-model and driving force that are considered. The final output of the run comes from the last used sub-model.
Table 1.
Runs of simulations and the setup for sub-models. √ indicates the sub-model and driving force that are considered. The final output of the run comes from the last used sub-model.
| Run No. | Model Initialization | 1st Iteration | 2nd Iteration | |||||||
|---|---|---|---|---|---|---|---|---|---|---|
| Tidal Current Model | Wave Model | Tidal Current Model | Wave Model | Tidal Current Model | ||||||
| Tide | Wind | Wind | Tide | Wind | Wave | Wind | Tide | Wind | Wave | |
| 1 | √ | |||||||||
| 2 | √ | |||||||||
| 3 | √ | √ | √ | |||||||
| 4 | √ | √ | √ | √ | √ | √ | ||||
| 5 | √ | √ | √ | |||||||
| 6 | √ | √ | ||||||||
| 7 | √ | √ | √ | √ | √ | √ | √ | |||
| 8 | √ | √ | √ | √ | √ | √ | √ | √ | √ | √ |
Table 2.
Meteorological events.
| Case | Location | Time (UTC) | Reference |
|---|---|---|---|
| 1 | Caofeidian | 13 April 2009 19:00–16 April 2009 07:00 | Fu et al. [28] |
| 2 | Huanghua | 13 April 2009 19:00–16 April 2009 07:00 | |
| 3 | Tanggu | 13 April 2009 19:00–16 April 2009 07:00 | |
| 4 | Caofeidian | 20 September 2010 16:00–21 September 2010 17:00 | Fu et al. [29] |
| 5 | Huanghua | 20 September 2010 16:00–21 September 2010 17:00 | |
| 6 | Tanggu | 20 September 2010 16:00–21 September 2010 17:00 |
© 2020 by the authors. Licensee MDPI, Basel, Switzerland. This article is an open access article distributed under the terms and conditions of the Creative Commons Attribution (CC BY) license (http://creativecommons.org/licenses/by/4.0/).
Share and Cite
MDPI and ACS Style
Li, Y.; Feng, H.; Vigouroux, G.; Yuan, D.; Zhang, G.; Ma, X.; Lei, K. Storm Surges in the Bohai Sea: The Role of Waves and Tides. Water 2020, 12, 1509. https://doi.org/10.3390/w12051509
AMA Style
Li Y, Feng H, Vigouroux G, Yuan D, Zhang G, Ma X, Lei K. Storm Surges in the Bohai Sea: The Role of Waves and Tides. Water. 2020; 12(5):1509. https://doi.org/10.3390/w12051509
Chicago/Turabian StyleLi, Yuanyi, Huan Feng, Guillaume Vigouroux, Dekui Yuan, Guangyu Zhang, Xiaodi Ma, and Kun Lei. 2020. "Storm Surges in the Bohai Sea: The Role of Waves and Tides" Water 12, no. 5: 1509. https://doi.org/10.3390/w12051509
Note that from the first issue of 2016, this journal uses article numbers instead of page numbers. See further details here.