Integration of Microwave and Optical/Infrared Derived Datasets from Multi-Satellite Products for Drought Monitoring


1
State Key Laboratory of Remote Sensing Science, Aerospace Information Research Institute, Chinese Academy of Sciences, Beijing 100101, China
2
College of Resources and Environment, University of Chinese Academy of Sciences, Beijing 100049, China
3
College of Information Science and Engineering, Shandong Agricultural University, Taian 271018, China
*
Author to whom correspondence should be addressed.
Water 2020, 12(5), 1504; https://doi.org/10.3390/w12051504
Submission received: 20 April 2020
/
Revised: 20 May 2020
/
Accepted: 20 May 2020
/
Published: 25 May 2020
(This article belongs to the Special Issue Droughts and Floods Assessment and Monitoring Using Remote Sensing and Geospatial Techniques)
Abstract
:Drought is among the most common natural disasters in North China. In order to monitor the drought of the typically arid areas in North China, this study proposes an innovative multi-source remote sensing drought index called the improved Temperature–Vegetation–Soil Moisture Dryness Index (iTVMDI), which is based on passive microwave remote sensing data from the FengYun (FY)3B-Microwave Radiation Imager (MWRI) and optical and infrared data from the Moderate Resolution Imaging Spectroradiometer (MODIS), and takes the Shandong Province of China as the research area. The iTVMDI integrated the advantages of microwave and optical remote sensing data to improve the original Temperature–Vegetation–Soil Moisture Dryness Index (TVMDI) model, and was constructed based on the Modified Soil-Adjusted Vegetation Index (MSAVI), land surface temperature (LST), and downscaled soil moisture (SM) as the three-dimensional axes. The global land data assimilation system (GLDAS) SM, meteorological data and surface water were used to evaluate and verify the monitoring results. The results showed that iTVMDI had a higher negative correlation with GLDAS SM (R = −0.73) than TVMDI (R = −0.55). Additionally, the iTVMDI was well correlated with both precipitation and surface water, with mean correlation coefficients (R) of 0.65 and 0.81, respectively. Overall, the accuracy of drought estimation can be significantly improved by using multi-source satellite data to measure the required surface variables, and the iTVMDI is an effective method for monitoring the spatial and temporal variations of drought.
1. Introduction
Drought is usually a water deficit caused by an imbalance in the water supply and demand due to the lack of precipitation [1,2]. It can be commonly divided into three types: meteorological drought (water shortage caused by the imbalance between precipitation and evaporation amount for a long time), agricultural drought (insufficient soil moisture available to plants) and hydrological drought (the phenomenon when runoff does not reach the standard value or the water level of aquifer drops) [3,4]. Drought can cause serious social and economic impacts, so it is necessary to assess the variations in droughts [5]. An in-depth analysis of the spatial and temporal evolution characteristics of drought can provide a reference for integrated water resource management and drought response [6].
With the development of remote sensing technology, the amount of data is abundant, which can enable the procurement of a large range of land surface information [7,8]. Therefore, remote sensing data have become the main data source for drought monitoring [9]. In recent decades, researchers have developed a number of drought indices to monitor and predict droughts. Land surface temperature (LST) indices, such as the Temperature Condition Index (TCI), were proposed to monitor and assess drought [10]. Under the same energy conditions, the LST will decrease with increasing soil moisture (SM), and vice versa [11]. In addition, several vegetation-based drought indices based on remotely sensed products have also been proposed, including the Perpendicular Vegetation Index (PVI), Anomaly Vegetation Index (AVI), Vegetation Condition Index (VCI), Enhanced Vegetation Index (EVI) and Vegetation Condition Albedo Drought Index (VCADI) [12,13,14,15]. However, the temporal and spatial variations of LST are greatly affected by the atmospheric and environmental conditions and the vegetation index has a delayed response to precipitation or soil water deficit. Thus, some researchers used a combination of vegetation index (VI) and LST for drought monitoring, such as the Vegetation Temperature Condition Index (VTCI) and Temperature Vegetation Dryness Index (TVDI) [16,17,18].
SM is a key factor in drought monitoring because it is related to climate change, evapotranspiration, vegetation coverage, and surface radiation change, especially when SM is reduced, creating conditions conducive to drought occurrence [19,20,21,22,23]. In the study of Amani et al. (2016), the change in SM can affect the reflectance of bare soil, which is more obvious in the near-infrared (NIR) band [24]. Based on this principle, a drought model was established through the NIR-Red spectral reflectance space, which contains not only vegetation information, but also SM information [25]. Some indices are based on such a spectral reflectance space such as the Perpendicular Drought Index (PDI), Modified Perpendicular Drought Index (MPDI) and Second Modified Perpendicular Drought Index (MPDI1) [26,27,28].
Many studies have also found that SM, LST and VI are closely related and interact with each other [29,30,31,32]. Among these variables, SM is the direct expression of drought, but LST and VI are the indirect expressions of drought [33]. Based on these principles, Amani et al. [34] used a three-dimensional space of LST, PVI and SM to construct the Temperature–Vegetation–Soil Moisture Dryness Index (TVMDI), which proved to be suitable to estimate and monitor drought. However, the data used to calculate the TVMDI model are all from the optical and infrared data [35]. Therefore, there are more requirements in terms of the data quality. Although some breakthroughs have been made in recent years, such as the second simulation of the satellite signal in the solar spectrum model, which can correct the errors caused by atmospheric and other factors, optical and infrared data have many limitations, and it is difficult to overcome the shortcomings of demanding data requirements, time scale effects and missing data caused by the impact of the atmospheric environment, such as clouds [36,37]. As a result, the acquired data cannot truly reflect the information of the ground object, which affects the quantity, quality and application scope of the data.
Considering the above problems, this study integrates optical, infrared and microwave sensor data, which have different physical properties, to develop a new operational, real-time drought monitoring method, known as the improved Temperature–Vegetation–Soil Moisture Dryness Index (iTVMDI). To a certain extent, multi-satellite remote sensing data fusion can make up for the shortcomings of a single sensor and make the invisible or unclear features in single sensor data prominent or enhanced [38]. Specifically, this study used passive microwave remote sensing data to replace the original model of the SM parameter to improve the accuracy of SM in the model. Compared with optical data and infrared data, passive microwave remote sensing data have all-day and all-weather capacities, and are relatively less affected by roughness and topography [39,40]. In addition, microwave data have penetrability and can pass through tree shrubs on the ground to directly reach the soil. Whether the ground is a bare soil area or a vegetation area, microwave data can use the difference in the dielectric constants of soil and water to obtain higher accuracy SM data that can be used to monitor SM [41,42].
The purpose of this study is to further explore the fusion of different source data to establish a new and high accuracy drought index, iTVMDI, which is based on FY3B-Microwave Radiation Imager (MWRI) microwave data and Moderate Resolution Imaging Spectroradiometer (MODIS) data in order to determine the drought level to provide a real-time and reliable basis for future disaster prevention and mitigation work.
2. Study Area and Data
2.1. Study Area
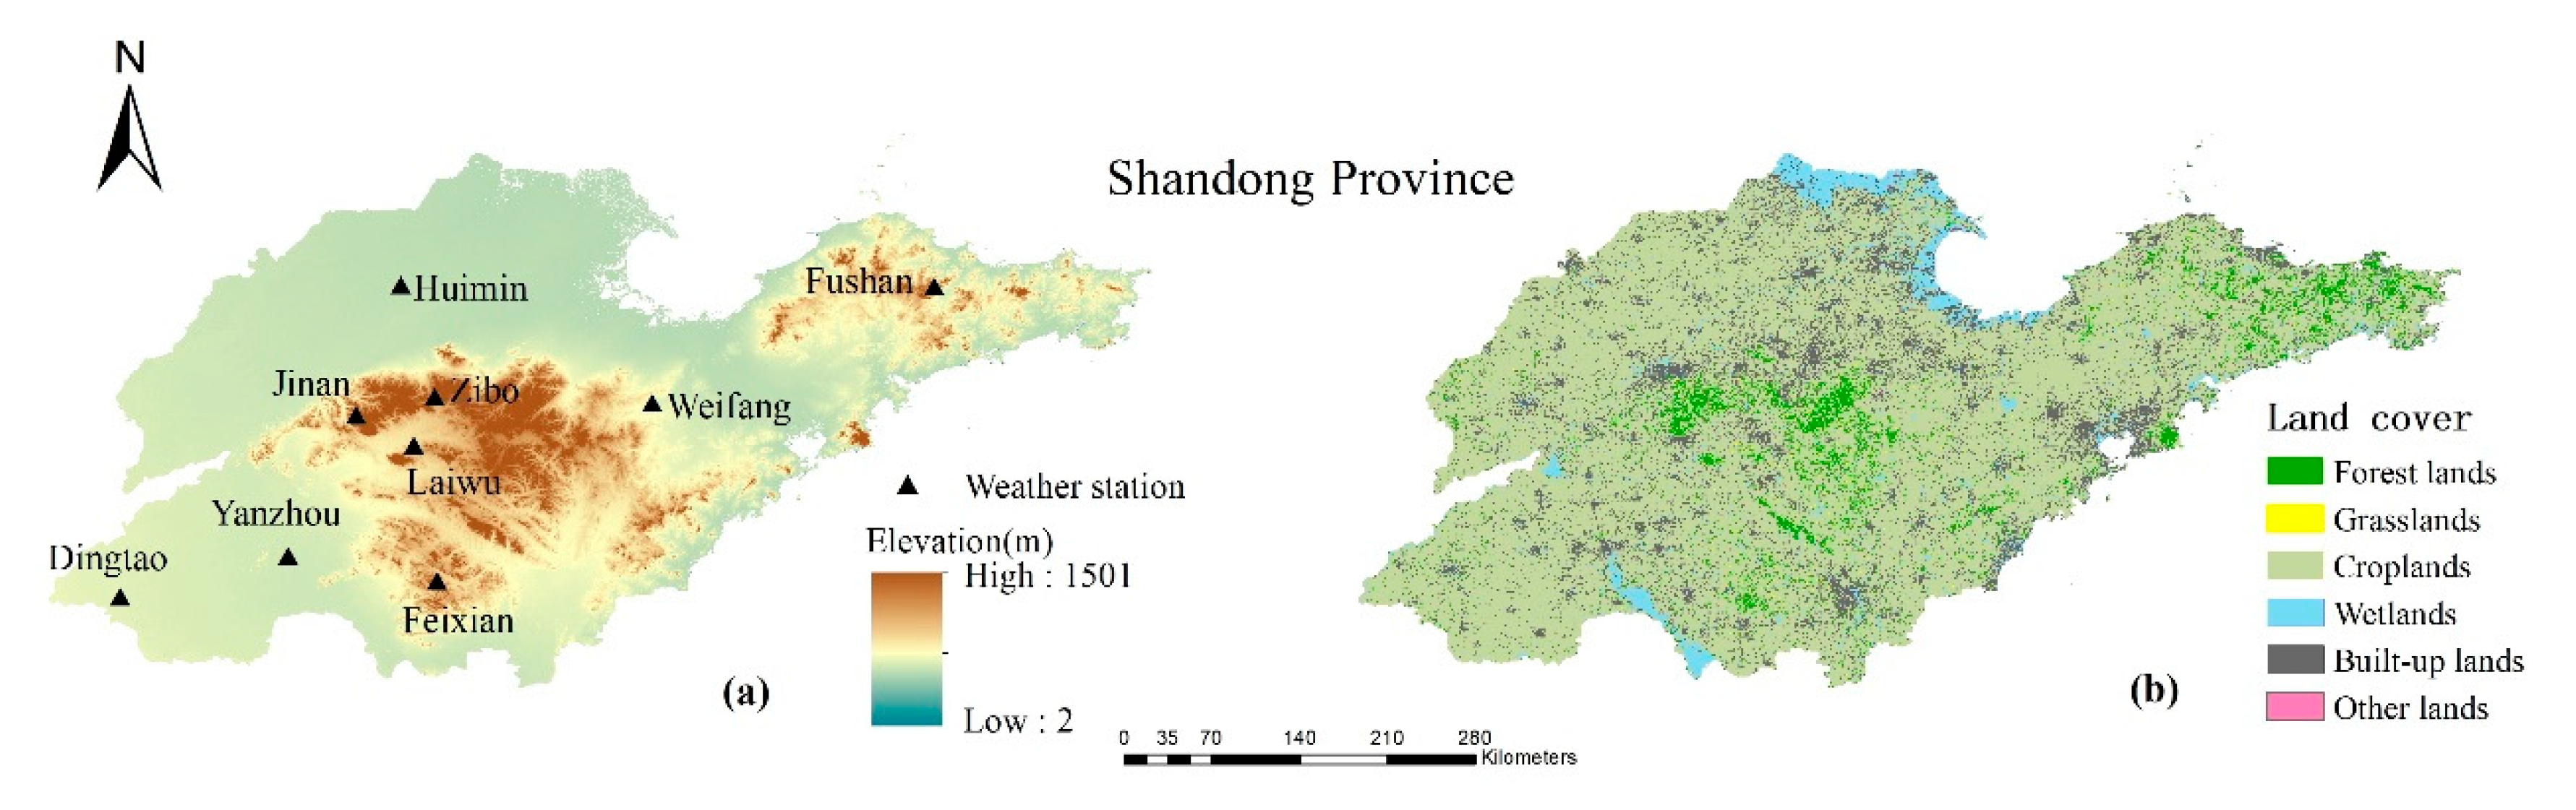
Shandong Province is located in the eastern part of China and the downstream area of the Yellow River, with an area of 158,000 km2. It lies between E 114°09′–E 122°43′ and N 34°22′–N 38°23′. The annual average temperature is between 11–14 °C, and the annual accumulated precipitation is 550–950 mm/year [43]. The research area is very sensitive to climate change due to the fragile ecosystem. In 2016, there was little rainfall in spring, and the precipitation recorded by 70 meteorological stations was the lowest in the same period of history. Crops suffered from water shortages caused by drought during the growing period, which has a seriously negative impact on economic development in the study area. The land types in Shandong Province are mainly divided into forestlands, grasslands, croplands, wetlands, built-up lands and other lands (Figure 1). The main land cover types are built-up lands and croplands. According to the Shandong Statistical Yearbook, by the end of 2015, the land area for construction was 2.8201 million hectares and that of cultivated land was 7.611 million hectares. The total amount of water resources is 22.032 billion cubic meters, of which the total surface water resource is 12.118 billion cubic meters. The main lakes include Weishan Lake and Zhaoyang Lake. The rivers include the Yihe River and Majiahe River.
2.2. Satellite Image Data and Data Preprocessing
The data used in this study include satellite remote sensing data (MODIS, FY-3B-MWRI), GLDAS SM, in situ meteorological data and agricultural statistical data. The dataset is specifically described, as shown below.
2.2.1. MODIS Data
The MODIS data (h27v05) from January to December 2016 used in this study include the MODIS LST product (MOD11A2, collection v006), surface reflectance product (MOD09Q1, collection v006), VI product (MOD13A2, collection v006) and albedo product (MCD43B3, collection v005) downloaded from the NASA Land Processes Distributed Active Archive Center (LP DAAC, https://lpdaac.usgs.gov/). The eight-day gridded level-3 product MOD09Q1 includes NIR and Red bands, with a spatial resolution of 250 m; the spatial resolution of MOD11A2, MOD13A2 and MCD43B3 is 1 km. The MODIS Reprojection Tool (MRT) was used for the projection transformation, resampling and format conversions of these products [44]. Because of the influence of sensor design, atmosphere and other factors when acquiring remote sensing images, there will be considerable noise in the image. Data will be partly missing as a result of clouds, so the acquired image data cannot accurately express the surface conditions. Therefore, it is necessary to reconstruct VI and LST using the Savitzky–Golay filtering method, which is a weighted average algorithm that uses smooth time series data as the moving window, and has been proven to more realistically reflect the growth and change in vegetation [45]. To eliminate deviations in the image space, a median filter that uses the median of neighboring pixels to replace outliers was implemented in the image space. Finally, the VI and LST were obtained for the monthly time scale.
2.2.2. FY3B Soil Moisture Product
Chinese FengYun (FY) series meteorological satellites were designed and manufactured to obtain meteorological observations, weather forecasts, and nautical aviation [46]. The MWRI aboard the FY-3B satellite is an instrument that obtains products by receiving electromagnetic radiation information inversion from both the horizontal and vertical directions for the Earth’s atmosphere and the Earth’s surface. The MWRI daily product of the global SM includes values retrieved by measurements from ascending (daytime) and descending (nighttime) half-orbits [47]. Through verification, it was found that the effective value proportion of ascending data was higher, so only the ascending data were used in this study. The data were downloaded from the National Satellite Meteorological Centre (http://nsmc.org.cn). The data projection is an Equal-Area Scalable Earth Grid (EASE-Grid) with a data format of HDF5 and a spatial resolution of 25 km [48].
2.2.3. Meteorological Data and Agricultural Statistical Data
The meteorological data, including temperature and precipitation data, were provided by the National Meteorological Information Center (http://data.cma.cn/). The monthly average temperature and monthly accumulated precipitation of nine national meteorological stations (Weifang, Zibo, Yanzhou, Huimin, Jinan, Dingtao, Laiwu, Feixian and Fushan) were selected, and the time range was from January to December 2016. The spatial distribution of nine national meteorological stations in Shandong Province is shown in Figure 1. Surface water, effective irrigation area and farmland area are from the Shandong Provincial Bureau of Statistics (http://www.stats-sd.gov.cn/).
2.2.4. GLDAS SM
The global land data assimilation system (GLDAS) is a global offline high-resolution ground simulation system, which drives a variety of offline surface models and combines ground observation data with satellite observation data to generate the optimal field of surface state and flux (https://giovanni.gsfc.nasa.gov/). GLDAS-2.1 is one of the two components of the GLDAS version 2 (GLDAS-2) dataset. The dataset contains many variables, such as albedo, soil temperature, evapotranspiration and SM [49]. The SM content is divided into four grades: 0–10 cm, 10–40 cm, 40–100 cm and 100–200 cm. The use of GLDAS SM data with a depth of more than 10 cm may add some uncertainty to the assessment because FY3B-MWRI SM data can only obtain the land surface SM at 0–5 cm depth [50]. In addition, in many previous studies, the top 10 cm SM data from the surface models was used to verify various satellite SM data [50,51,52,53]. Therefore, 0–10 cm SM data from January to December were selected [54].
3. Methods
3.1. Technical Route
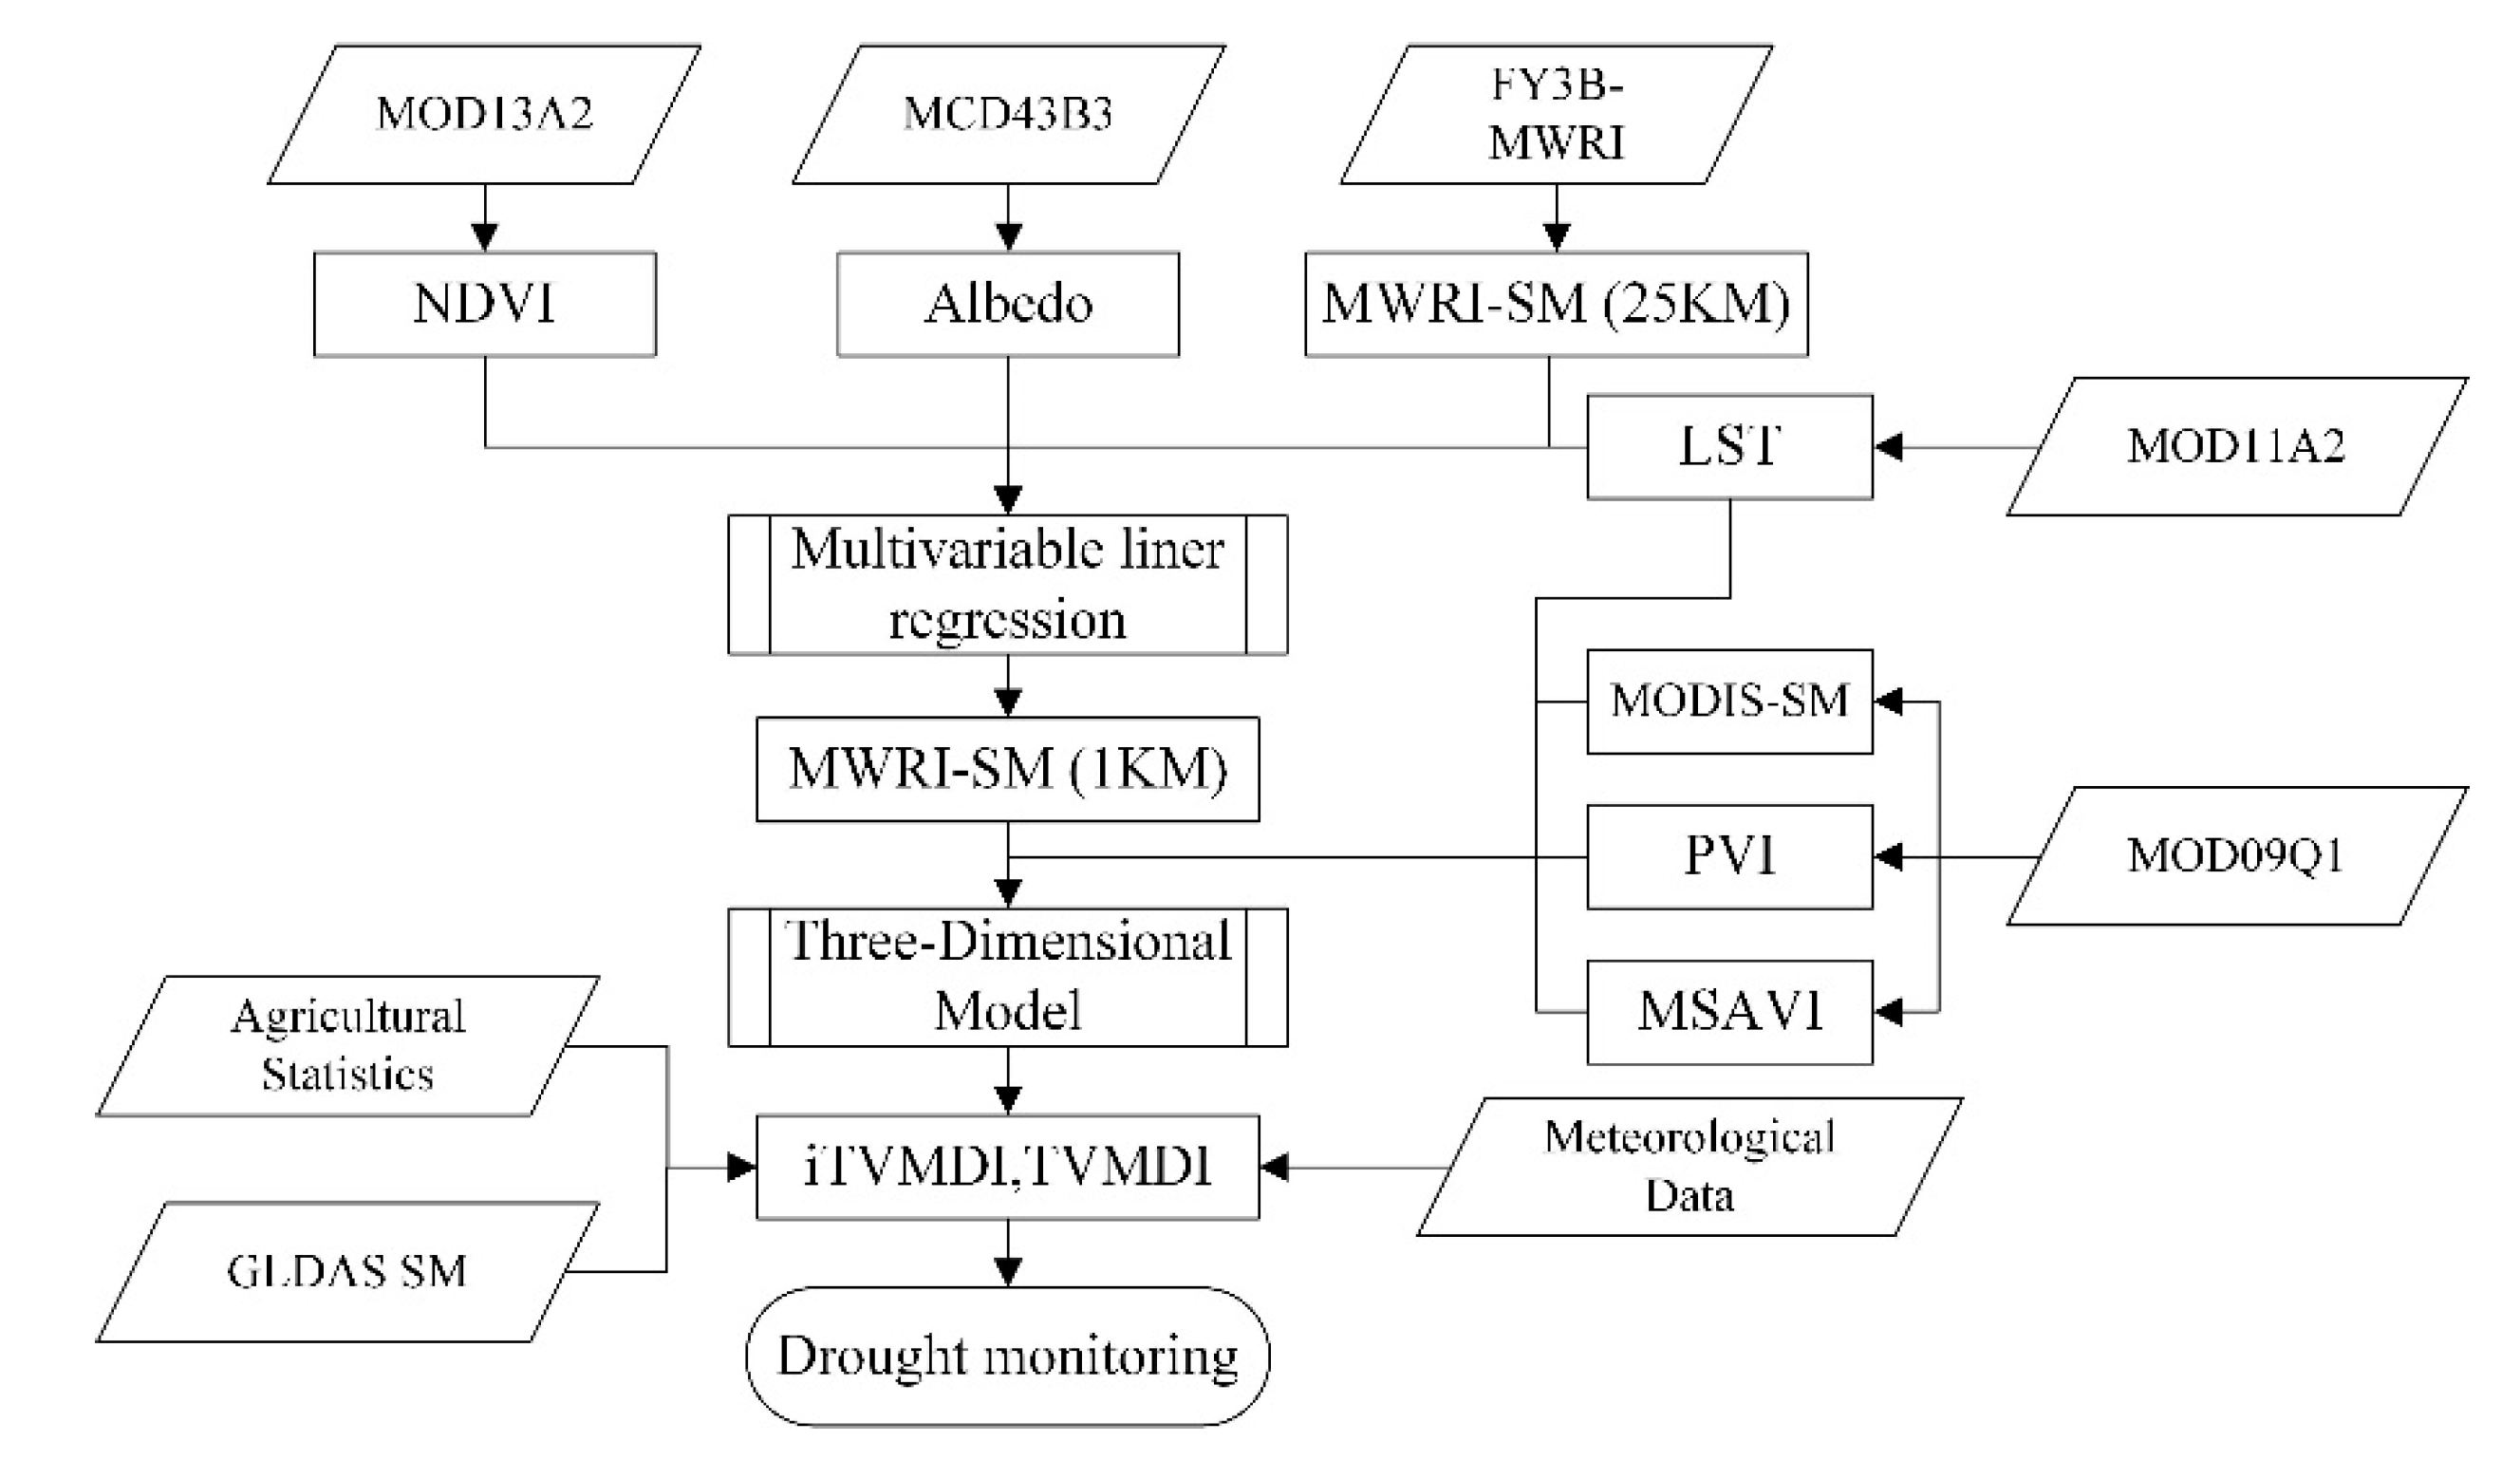
Figure 2 shows the flow chart for the TVMDI improvement, comparison and validation in this study. First, NDVI, LST and albedo with a resolution of 1 km in 2016 and SM data at 25 km were obtained from MODIS and FY3B-MWRI products. Then, we built a linear downscaling model and downscaled the SM data. iTVMDI and TVMDI were calculated using FY3B-MWRI-downscaled SM and MODSI data. In Section 4.1, GLDAS SM is based on a large number of observed data and multiple model simulations, which can represent the measured SM to some extent. Therefore, GLDAS SM was used to verify the accuracy of the results of the two models. We then used meteorological data from nine meteorological stations in 2016 to verify the results of the two models and analyze the response capacity of the two models to meteorological drought (see Section 4.2). Then, we used surface water to test the monitoring capability of the two models for hydrological drought (see Section 4.3). Finally, we used the iTVMDI model to analyze the drought condition of Shandong Province in 2016 (see Section 4.4).
3.2. Improved Temperature–Vegetation–Soil Moisture Dryness Index (iTVMDI)
Amani et al. [34] proposed the concept of the TVMDI, which is based on the relationship among the vegetation, temperature and SM (see Appendix A for further details and calculation formula). The iTVMDI proposed in this study improves the TVMDI model. The TVMDI uses optical and infrared data to calculate the SM, which is largely affected by the data quality. Microwave remote sensing is considered to be the most effective way to obtain SM because of its strong physical mechanism [55]. Compared with the SM data calculated based on the NIR-Red spectral space, the microwave data are not only less affected by the weather, but also have better penetrability, the surface SM data under the vegetation can be obtained, and the higher temporal resolution makes the data more accurate. The FY3B-MWRI SM product uses a dual-channel inversion algorithm that can eliminate the influences of vegetation and roughness, and the inversion model of SM is based on the development of the parameterized microwave radiation model (multifrequency polarization (Qp) model). Therefore, SM derived from passive microwave remote sensing data was used to replace that derived from the optical and infrared data in the original model [56,57].
Since the spatial resolution of FY3B SM data is 25 km, it cannot be directly used to build a model with other data with a resolution of 1 km, so we downscaled the SM data to achieve the same scale for all data [58,59,60]. The downscaling method of multivariate statistical regression is currently one of the most commonly used downscaling methods with a simple calculation form and strong applicability, which can downscale passive microwave low-resolution SM data with the help of remote sensing data [61,62]. The principle of this method is to build a linear relationship between SM and its related variables at low spatial resolution and apply the relationship at a high spatial resolution to obtain high spatial resolution SM [63]. To reduce the dependence of LST, VI and albedo on the external environment and to facilitate comparisons among different regions, a linear model of SM and the normalized difference vegetation index (NDVI), LST and albedo was established, and the formula is as follows:
where is the normalized surface albedo, is the normalized VI, and is the normalized LST. The process of normalization is as follows:
Another improvement is to replace the PVI in the original model with the Modified Soil-Adjusted Vegetation Index (MSAVI). Because PVI is easily affected by the soil background, it is not the best VI for drought monitoring used in the TVMDI [64]. Some VIs, such as the Soil Adjusted Vegetation Index (SAVI) and MSAVI, have been developed to improve the sensitivity of vegetation by considering the influence of the atmosphere and soil effects [65]. By using MSAVI instead of PVI, the impact of the soil background can be effectively eliminated and the shortcomings of some vegetation indices that cannot correctly reflect the real situation of the land surface when the SM is high can be corrected. The MSAVI is calculated as follows:
where and are the reflectance values of the red and NIR bands, respectively.
Therefore, the iTVMDI is constructed in a three-dimensional space integrating normalized LST, normalized downscaled SM and normalized MSAVI, and can be calculated using Equation (6).
4. Results
4.1. Comparisons of Drought Indices and GLDAS SM
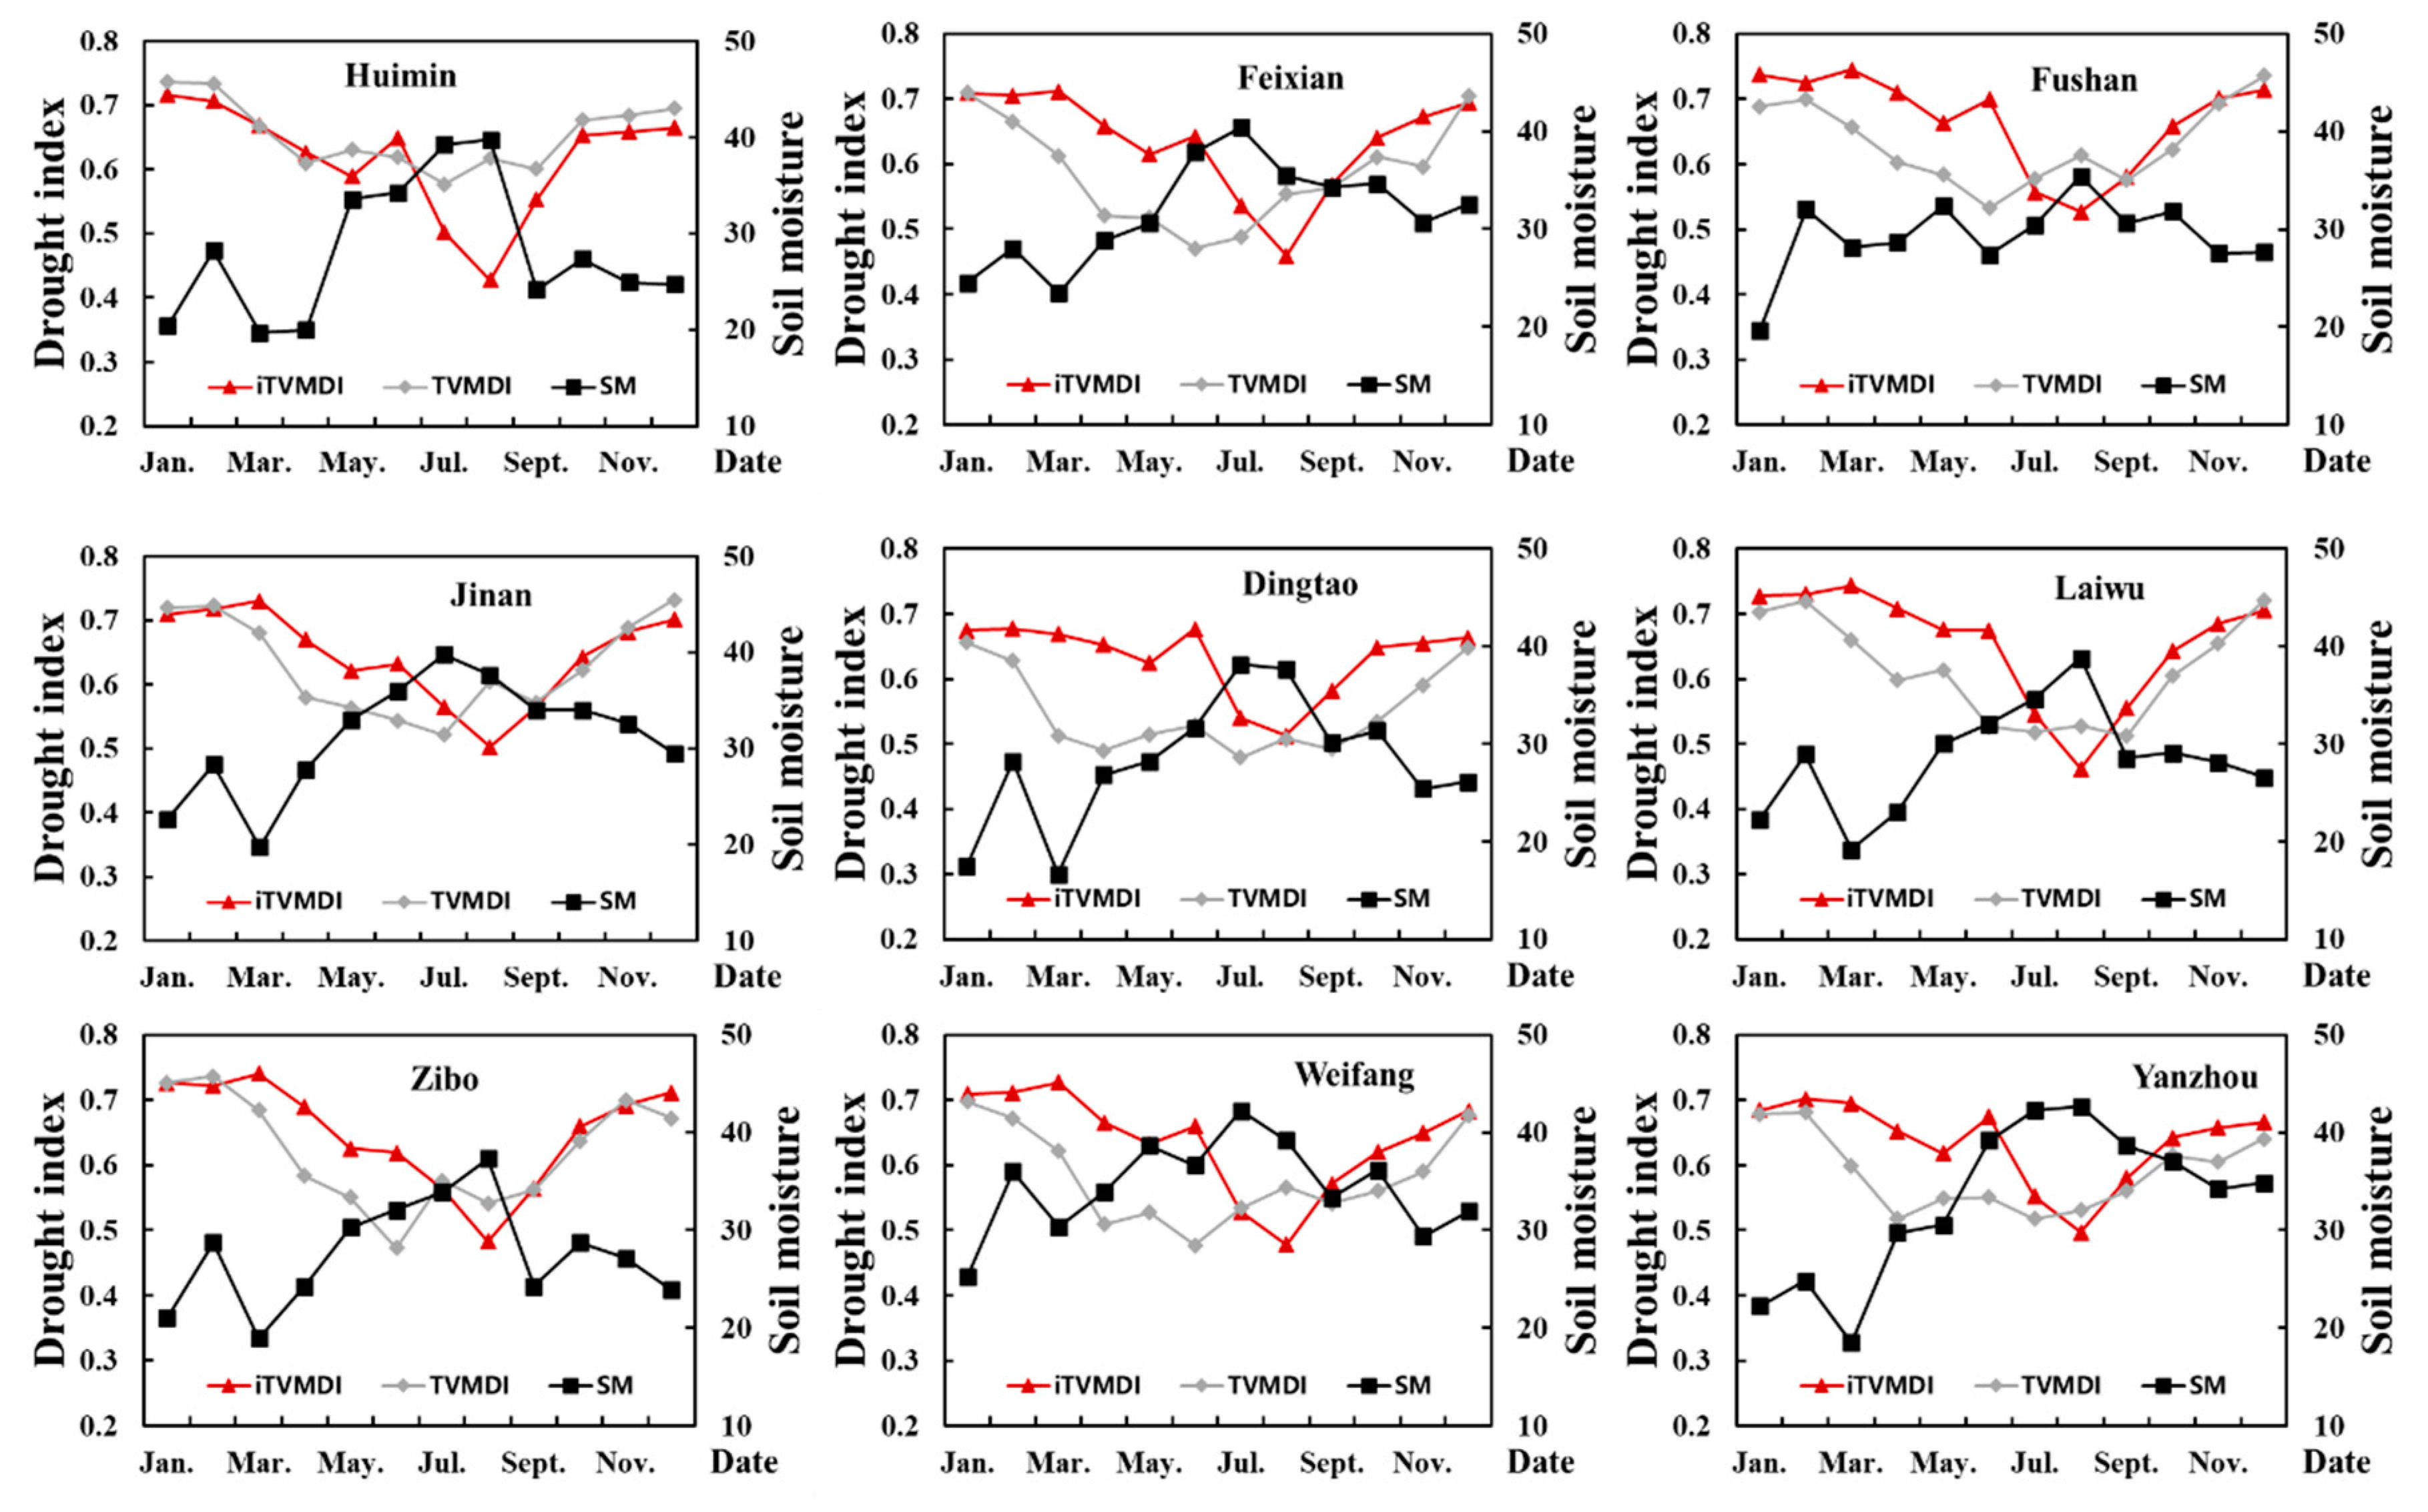
To evaluate the iTVMDI, the correlation coefficient (R) and p-value (P) between the iTVMDI and the GLDAS SM were selected. As shown in Table 1, the correlation coefficients between the SM and iTVMDI can exceed 0.62, with an average correlation coefficient of 0.73 and a significant correlation (P < 0.05). The slope of the fitting line is negative, indicating that they are negatively correlated. The average correlation coefficient between TVMDI and SM is 0.55, which cannot reach the level of the iTVMDI. Among all sites, Huimin, Fushan and Dingtao fail to pass the 0.05 significance test, and have the lowest correlation, with correlation coefficients of 0.49, 0.49 and 0.33, respectively. Therefore, compared with iTVMDI and TVMDI, iTVMDI is more stable than TVMDI. The reason for this is that the iTVMDI is based on microwave data, and the downscaled FY3B SM data are used to replace the NIR-Red spectral space data in the TVMDI model. Although the calculation of TVMDI is very simple and integrates the remote sensing data’s optical and infrared bands, it is easily affected by land cover change, atmosphere and clouds. Therefore, the iTVMDI that is calculated by using the downscaling FY3B SM data is more reasonable. Furthermore, we calculated the monthly variation in GLDAS SM, iTVMDI and TVMDI, as shown in Figure 3. Because the drought index depends not only on SM, but also on VI and LST, the change in the drought index is not exactly the same as that of SM, but there should be a significant correlation between them. It is obvious that iTVMDI is more consistent with this feature than TVMDI.
4.2. Comparisons of Drought Indices and Meteorological Data
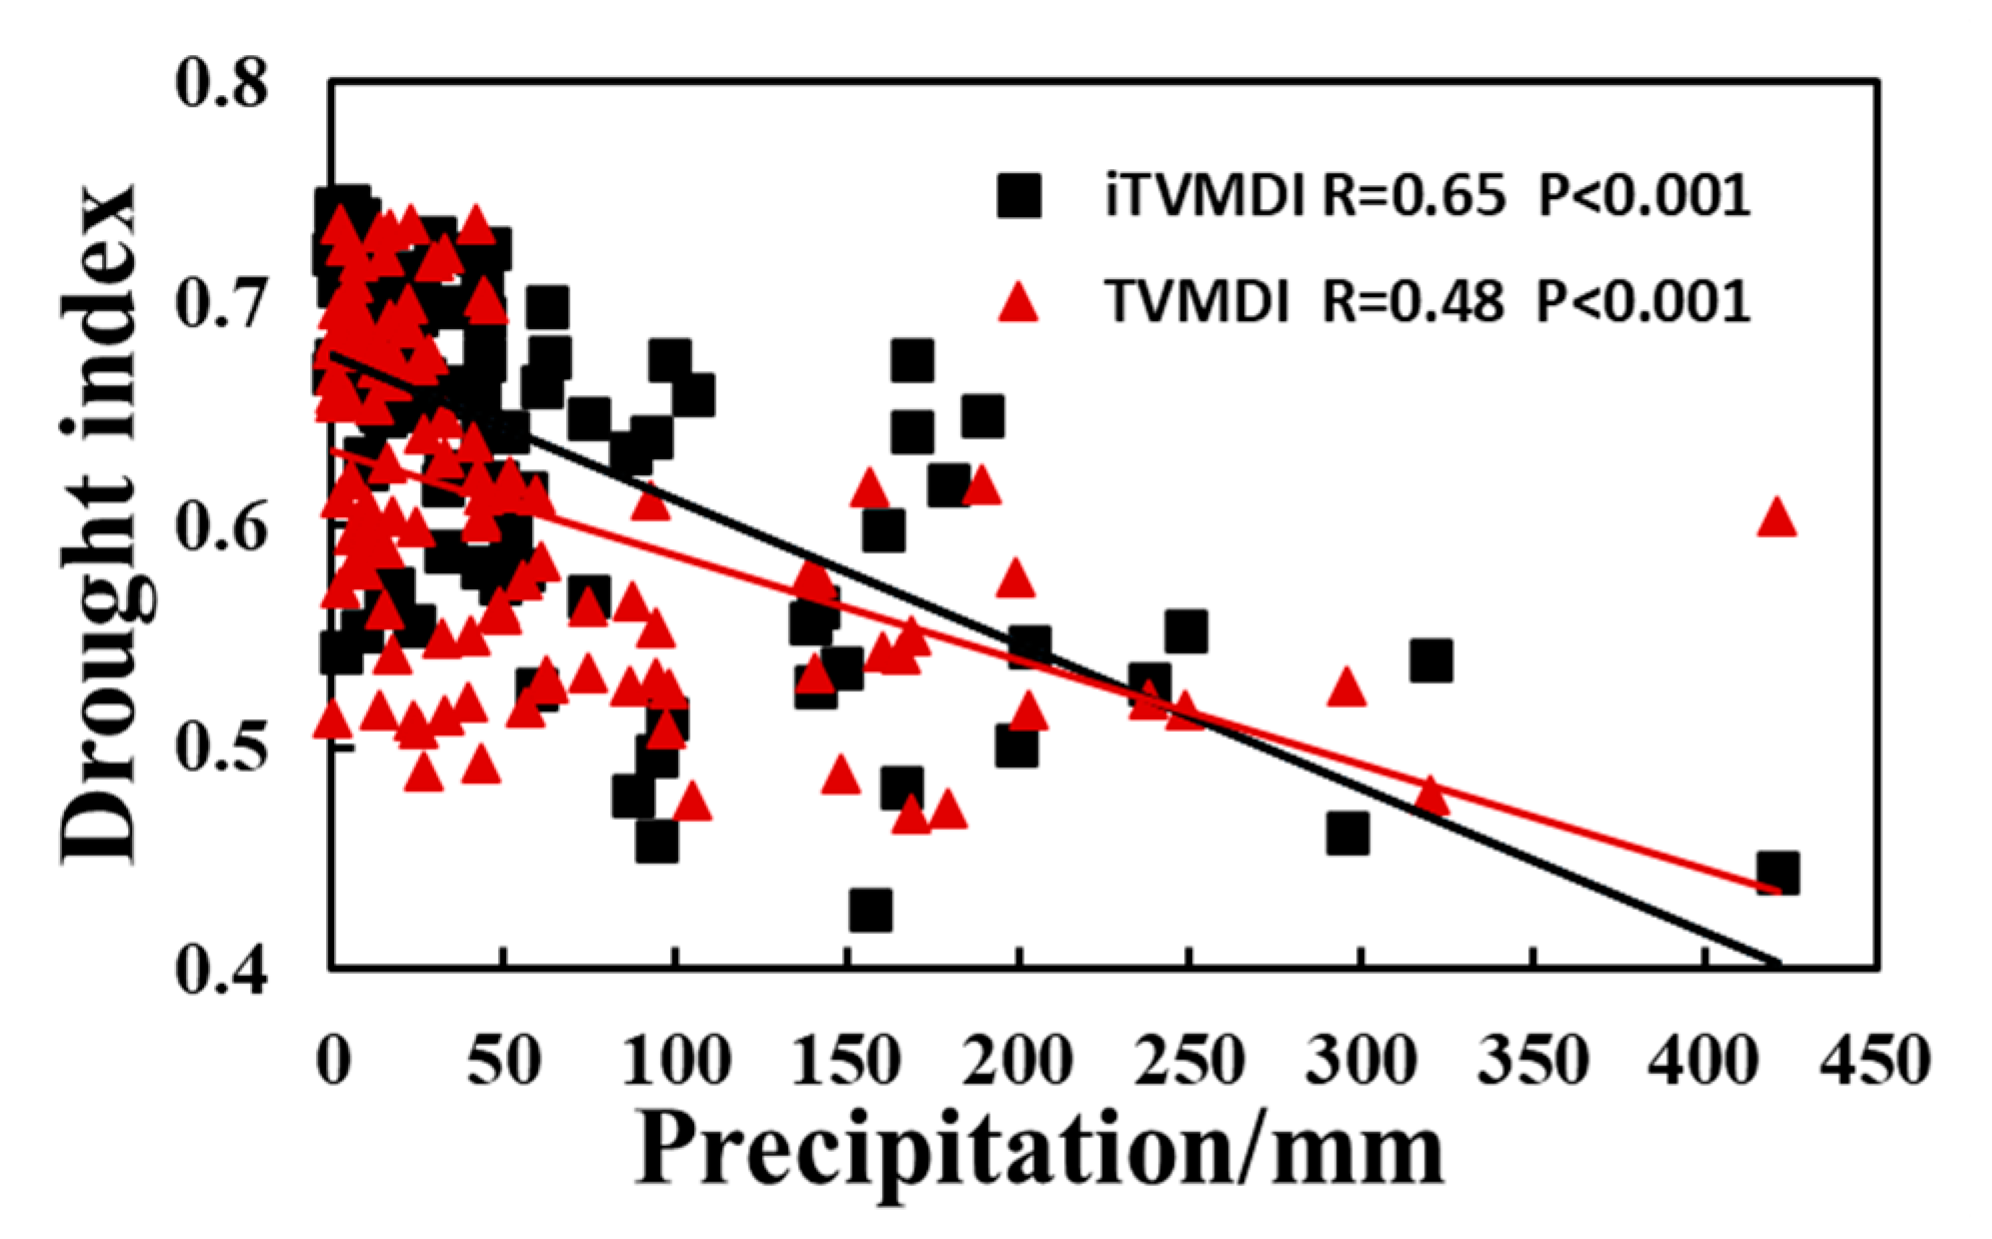
Drought often occurs in months with low precipitation and high temperatures [66]. In this study, the monthly precipitation data from nine weather stations were used to verify the ability of the iTVMDI to monitor meteorological drought. Figure 4 displays scatterplots of drought indices (iTVMDI and TVMDI) and rainfall. The correlation between the iTVMDI and precipitation is higher than that of the TVMDI, and the correlation coefficients R are 0.65 and 0.48 (P < 0.001), respectively. However, the iTVMDI and TVMDI are not strongly correlated with precipitation. The reason may be that the data selected in this study are on a monthly scale. After averaging different situations over a month, some information would be lost.
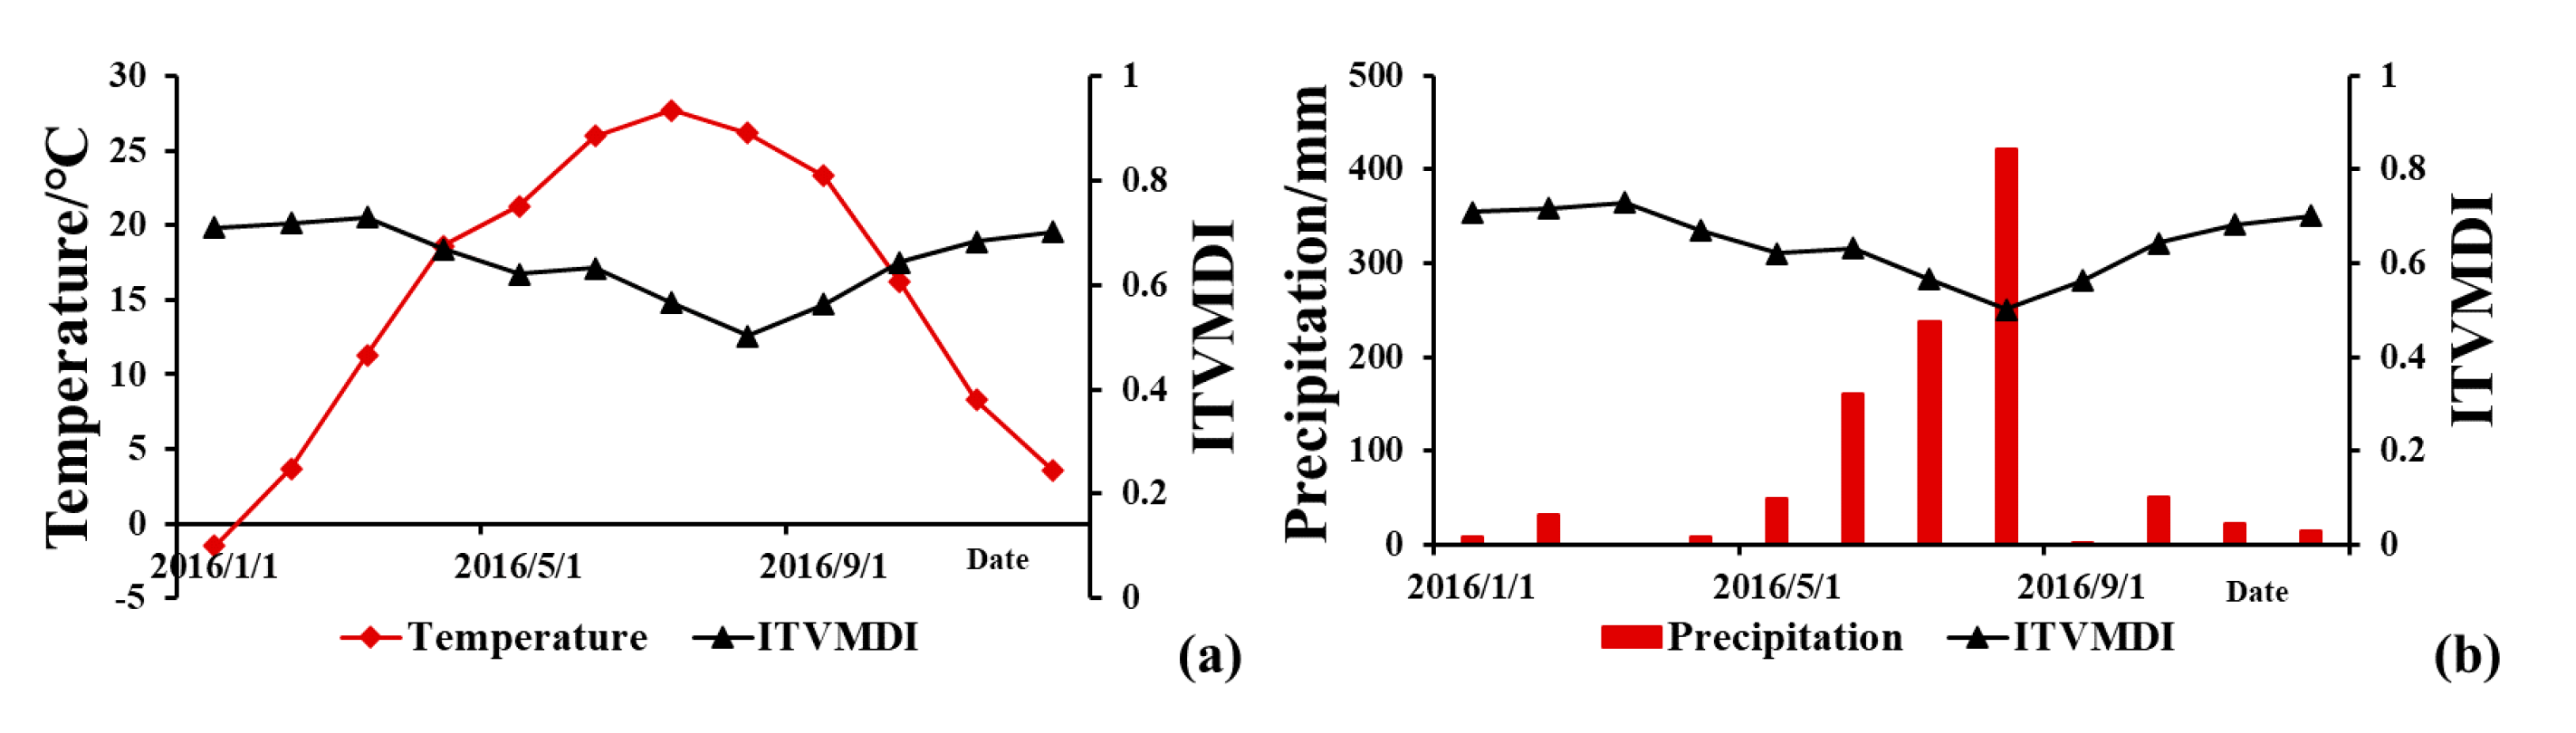
Spring in Shandong usually lasts from March to May. Due to limited rainfall, drought often occurs in spring. Summer is from June to August, which is the monsoon season, and most of the rainfall in Shandong is concentrated in the summer monsoon period. Autumn starts in September and ends in November, and rainfall during this period is similar to that in spring. December to February of the next year is considered to be winter, with precipitation and temperature at their lowest levels in the whole year. The seasonal difference in precipitation in Shandong Province is large. Taking Jinan in Shandong Province as an example, the monthly cumulative precipitation, average temperature and iTVMDI were calculated (Figure 5). The drought index showed a downward trend from winter to summer, and began to rise afterward. In summer, due to the high vegetation coverage, sufficient rainfall and the increase in SM, iTVMDI reached the lowest value at the end of summer (Figure 5b). After summer, the harvesting or withering of vegetation and the decrease in precipitation and SM led to the rapid recovery of the drought index to a high value state.
4.3. Comparisons of Drought Indices with Surface Water Supply
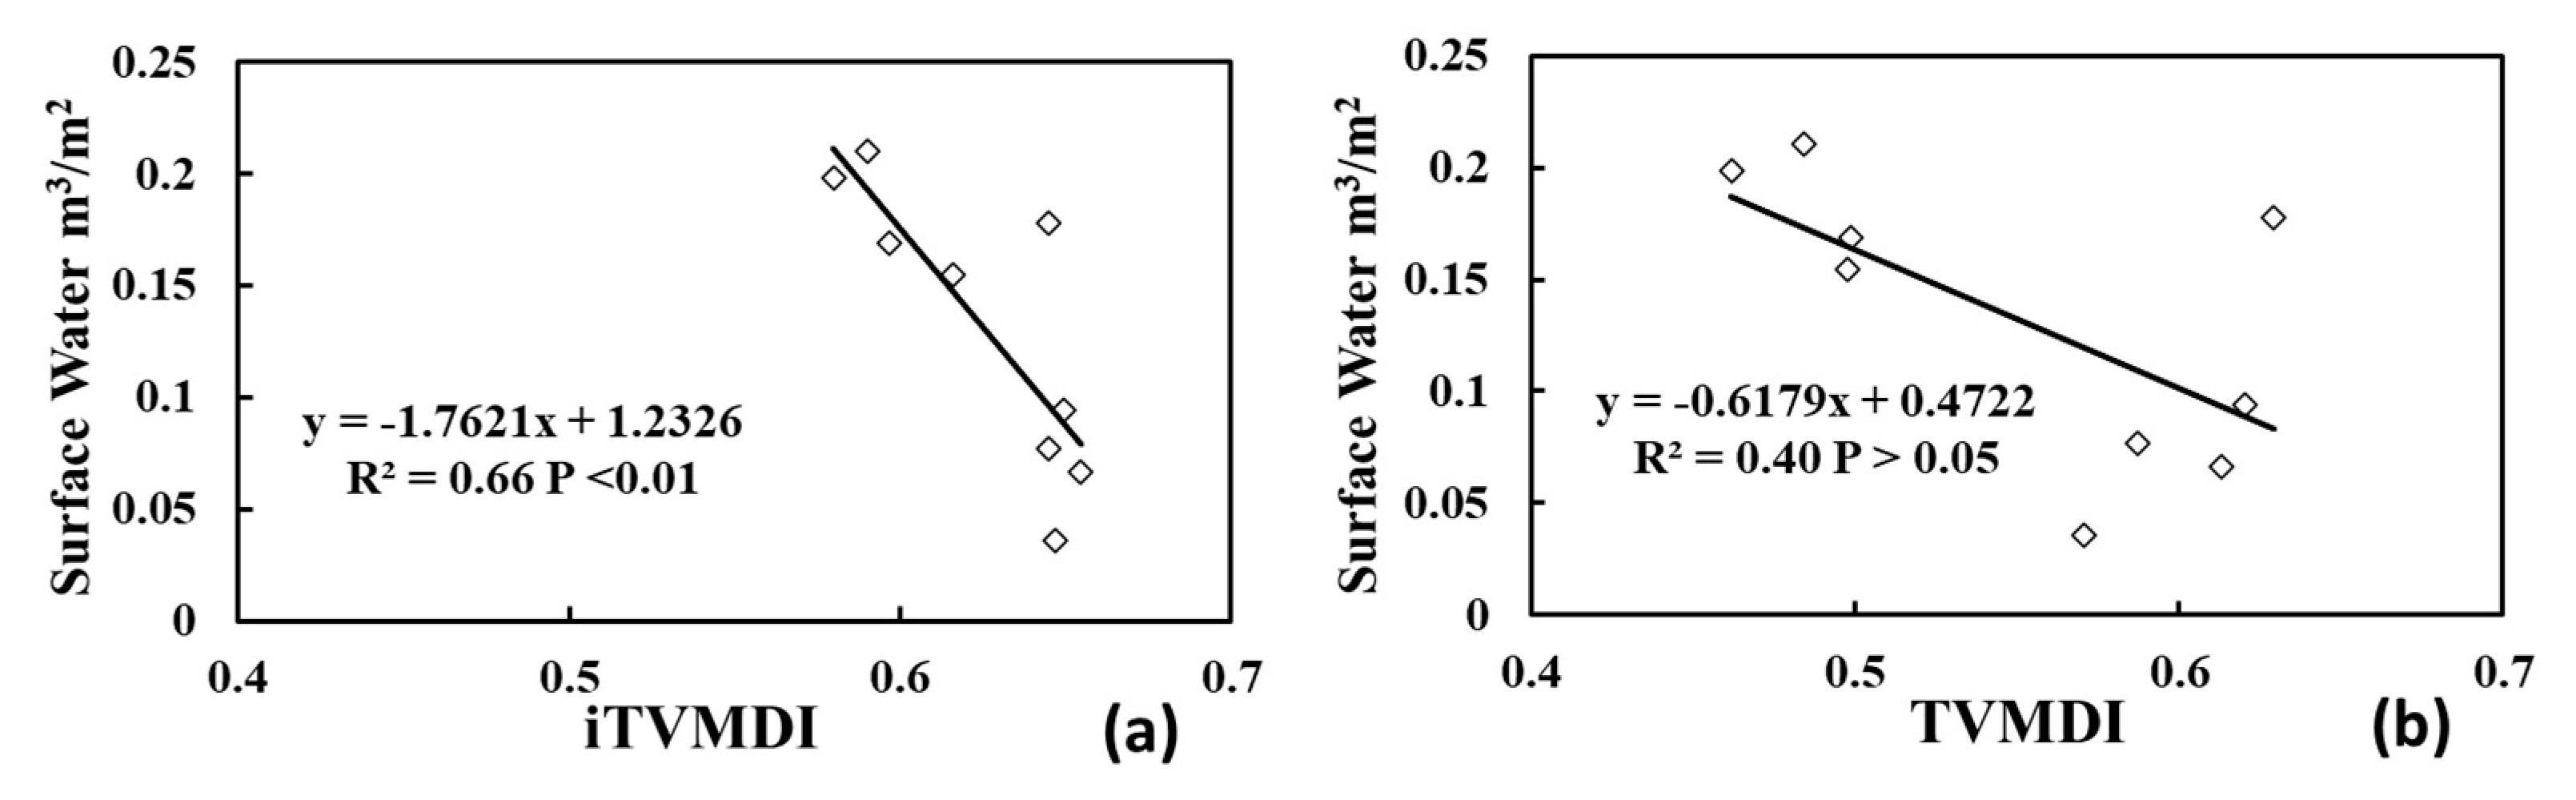
The limited precipitation and SM lead to insufficient runoff, which causes hydrological drought. The increase in the surface water supply will increase the surface water. If the water supply is reduced, the regional temperature will increase, the air will dry, and the evaporation of water will accelerate as long as there is enough water in the soil, the ecological water demand will increase, and the water resources will be reduced [67]. At the same time, the iTVMDI will be increased [68,69]. Therefore, to evaluate the iTVMDI for hydrological drought monitoring, we selected the surface water supply per unit area of nine cities in Shandong Province from the Shandong Statistical Yearbook as auxiliary data and analyzed their correlation with the iTVMDI and TVMDI (Figure 6a). The results showed that the iTVMDI had a significant negative correlation with the surface water (R = −0.81, P < 0.01). With the increase in surface water, the iTVMDI will decrease. By comparing the correlation between TVMDI and surface water (R = −0.63), it can be found that iTVMDI is more sensitive to changes in surface water, which also means it is more accurate. Therefore, it can be concluded that iTVMDI is better than TVMDI in hydrological drought monitoring.
4.4. Drought Monitoring Results in Shandong Province
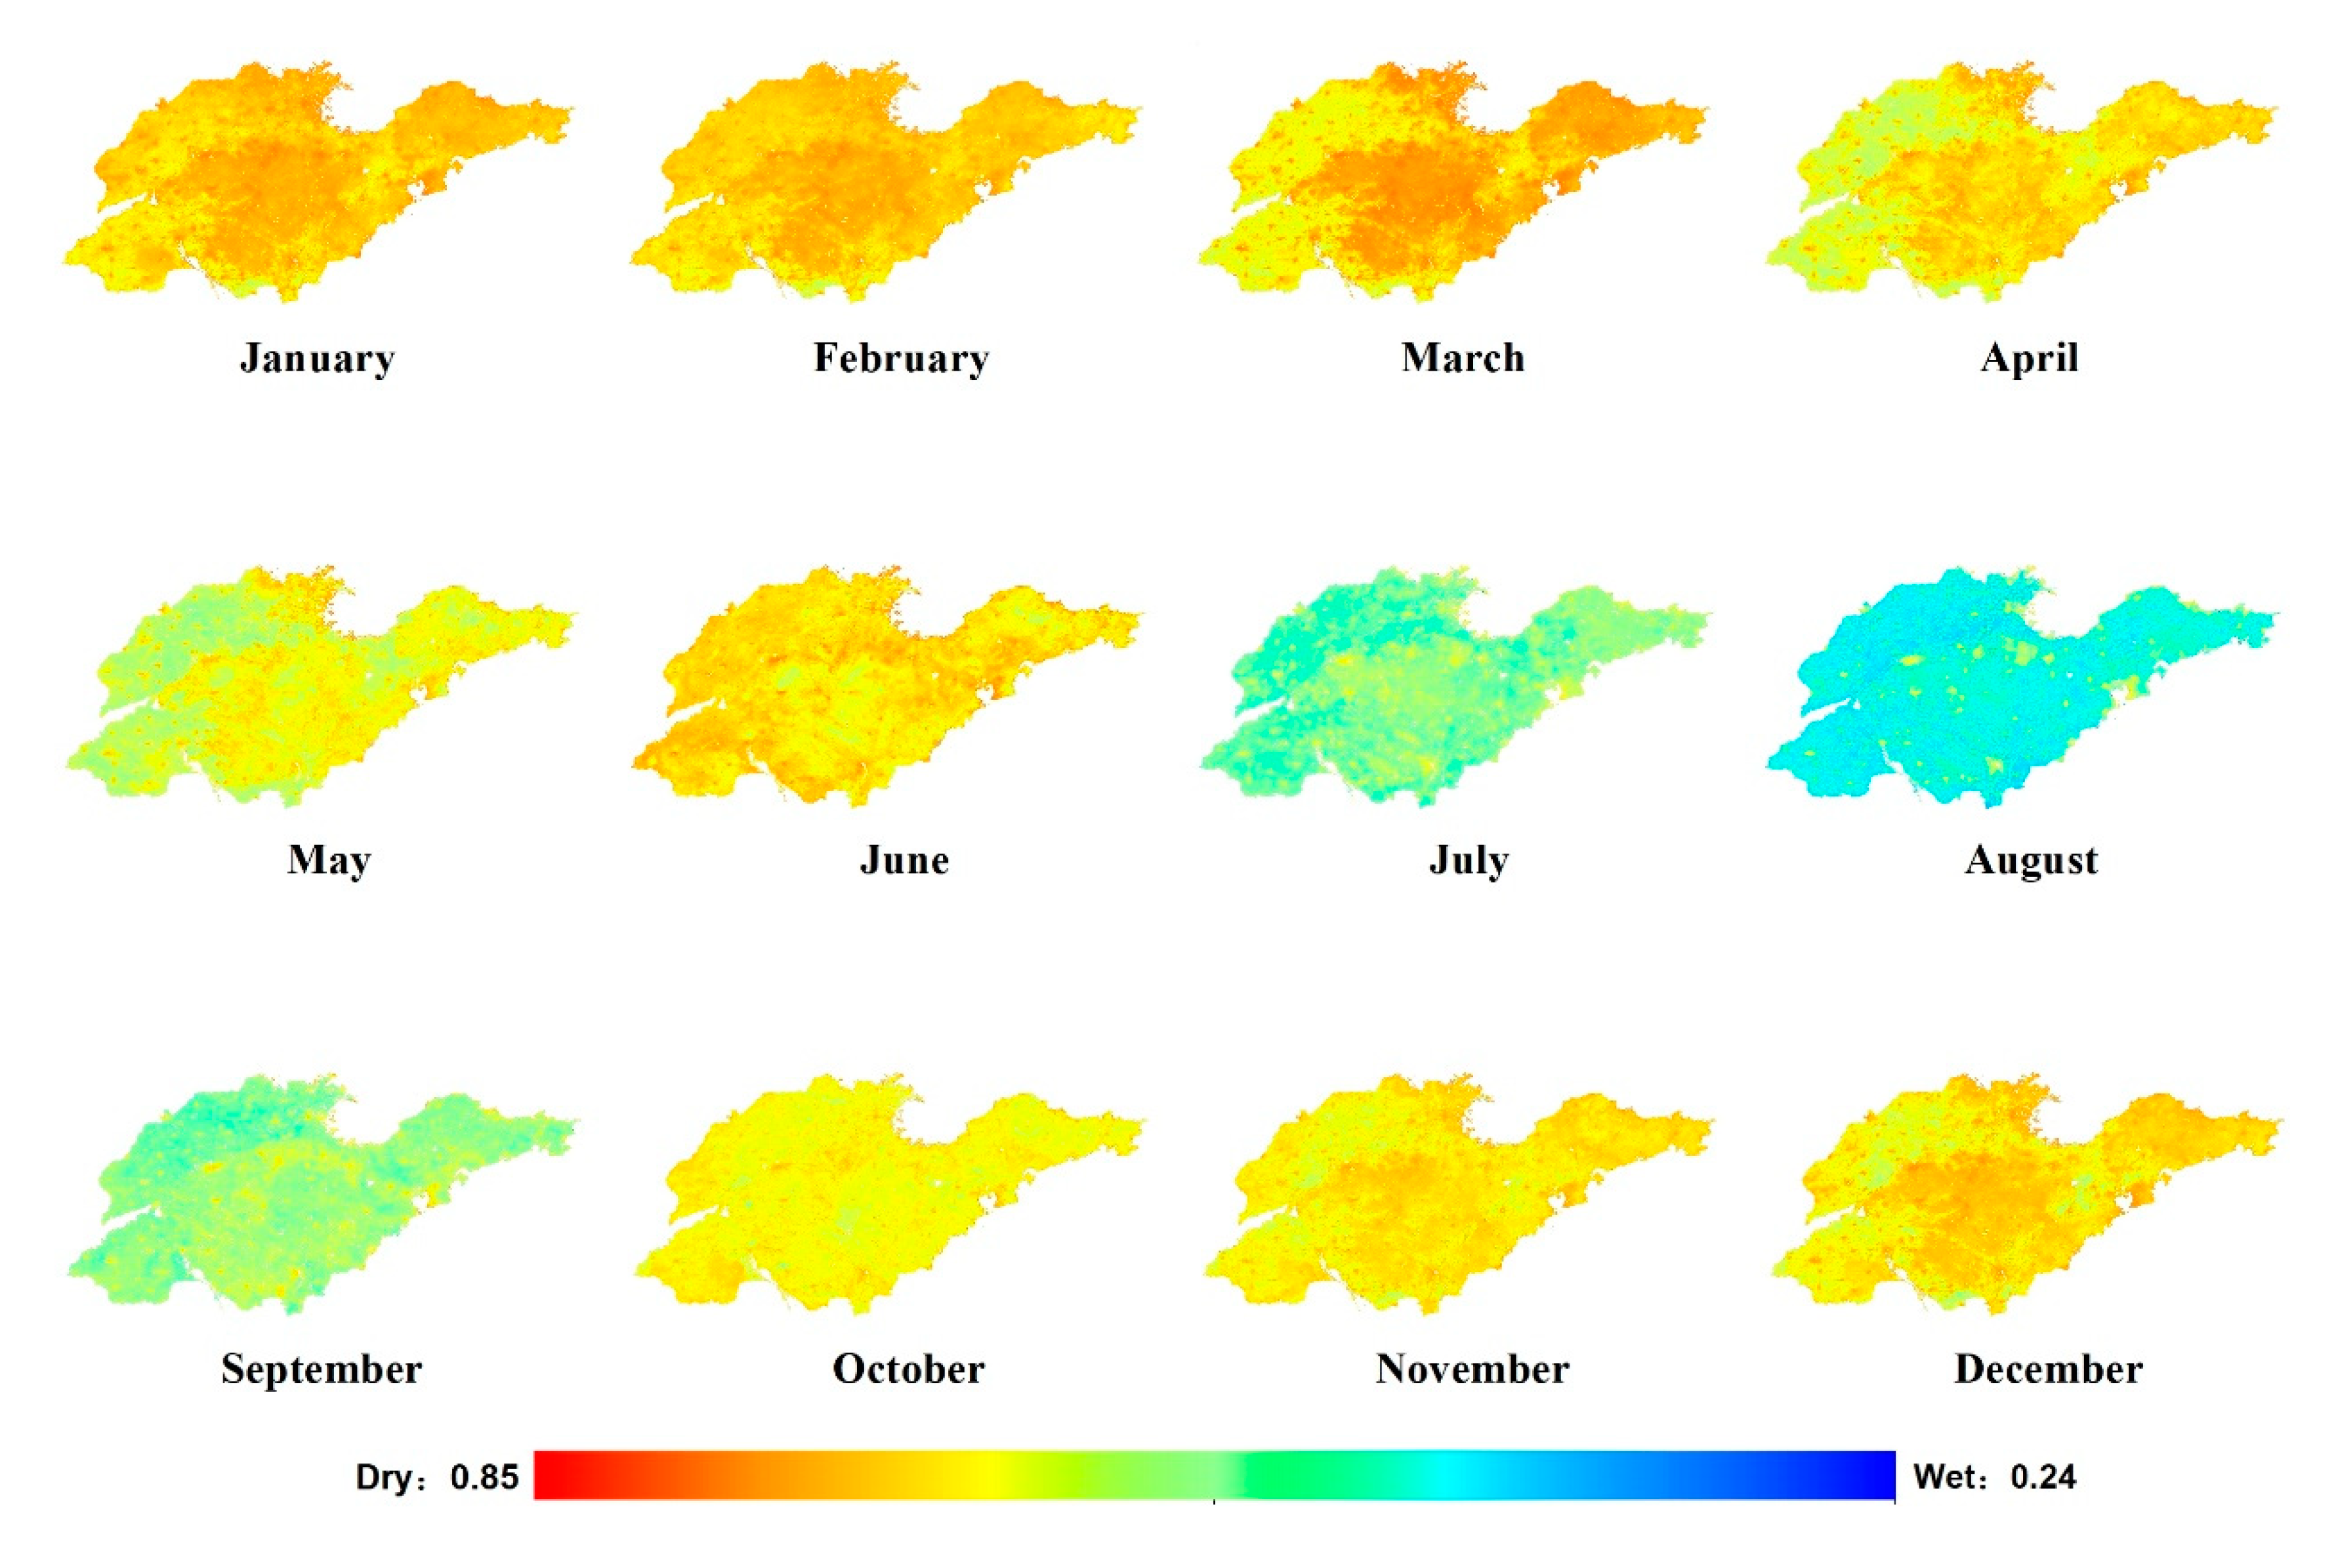
It has been shown, over one year, that the iTVMDI has a relatively accurate drought monitoring capability, so the iTVMDI was used in this paper for drought monitoring in Shandong Province (Figure 7). The iTVMDI range of Shandong Province in 2016 was 0.24–0.85. The higher the value is, the drier the area is. By calculating the average iTVMDI value of each month in Shandong Province, it can be found that the iTVMDI was generally high in January, February and March, and the average iTVMDI of Shandong in those three months could reach 0.70. In particular, in March, the iTVMDI in some areas can reach the highest value of 0.85 in the whole year. According to the meteorological data, from February 14th to April 15th, the average precipitation across the whole province was only 5.0 mm, which was the lowest value in the same period since 1951. In addition, the water consumption of plant growth was large, which led to a rapid decrease in SM. In March, April and May, the high iTVMDI values were mainly distributed in the central and northern parts of Shandong Province, while Dezhou, Liaocheng, Heze, central and eastern Jining, south-central Linyi, and southern Zaozhuang were humid. In June, due to the harvest of winter wheat, the vegetation coverage decreased rapidly. Simultaneously, the temperature rose rapidly. Therefore, the iTVMDI in the northwestern, western and southwestern parts of Shandong Province, which are all plain areas, changed from humid to relatively dry. In July, August and September, it was relatively humid compared with the previous months, likely because of the abundant precipitation and the growth period of vegetation, and the average iTVMDI values were 0.53, 0.47 and 0.55, respectively.
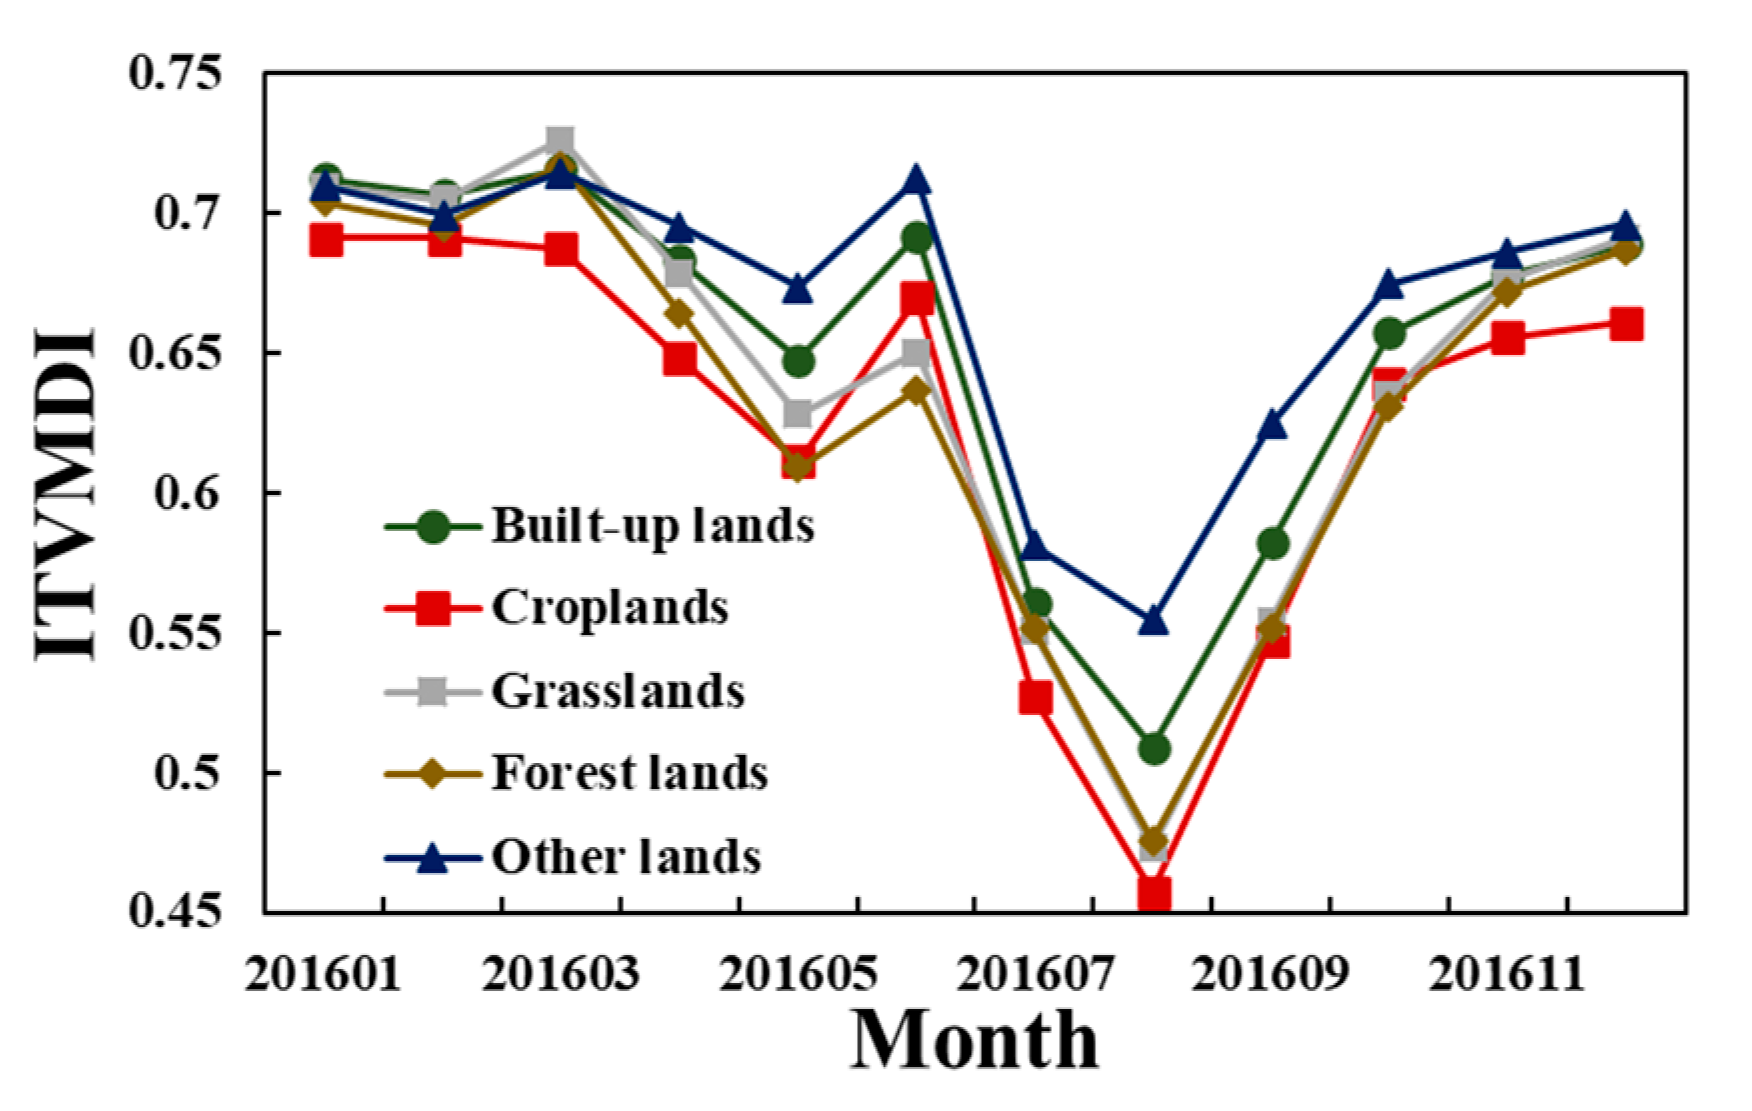
In order to further analyze the drought situation of different land types, we calculated the monthly change in the average iTVMDI of different land types over the whole year (Figure 8). For most of the year, the iTVMDI of croplands was the lowest among all land types. In addition, the iTVMDI of built-up lands and other lands was generally higher than that of other land types, which is also a feature that cannot be clearly shown in the previous drought index maps, and with the increase in LST, the difference observed with other land types was more obvious. This phenomenon mainly occurs because, when the temperature rises, the decrease in surface water of built-up land and other land was accelerated, so compared with other land types, there was less surface water.
5. Discussion
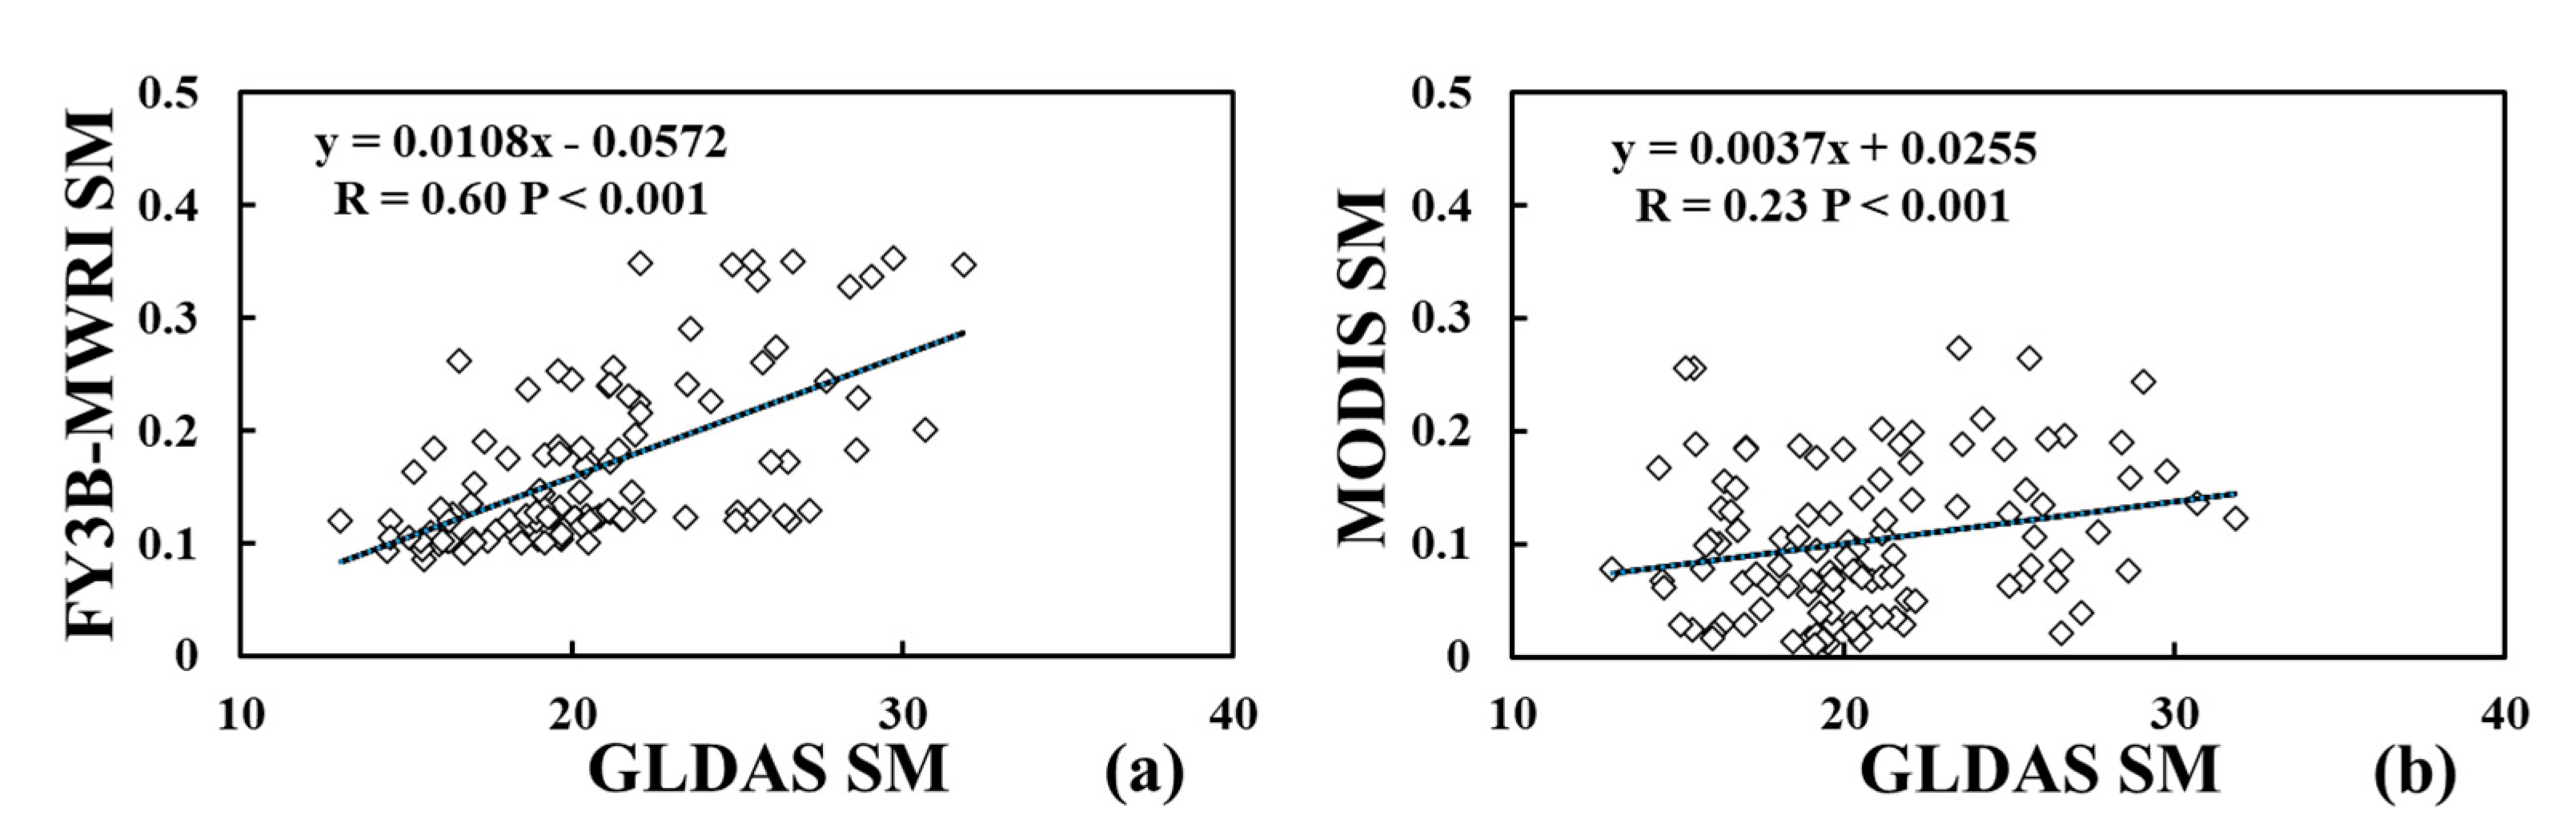
Some studies have shown that an index that combines optical, infrared data with microwave data has a better drought monitoring capability [9,70]. Since the results of the TVMDI depend on the accuracy of the three indices, namely LST, VI and SM, we improved the TVMDI model using SM data derived from FY3B-MWRI to replace the MODIS SM. To further present differences between the iTVMDI and TVMDI, we used GLDAS SM to verify FY3B-MWRI SM and MODIS SM (Figure 9). It can be concluded that the correlation between FY3B-MWRI SM and GLDAS SM is higher than that between MODIS SM and GLDAS SM (P < 0.001), which also shows that the iTVMDI is better at drought monitoring in Shandong Province. The low correlation coefficient may be because the resolution of GLDAS SM (8 km) is inconsistent with the resolution of the two kinds of satellite data (1 km).
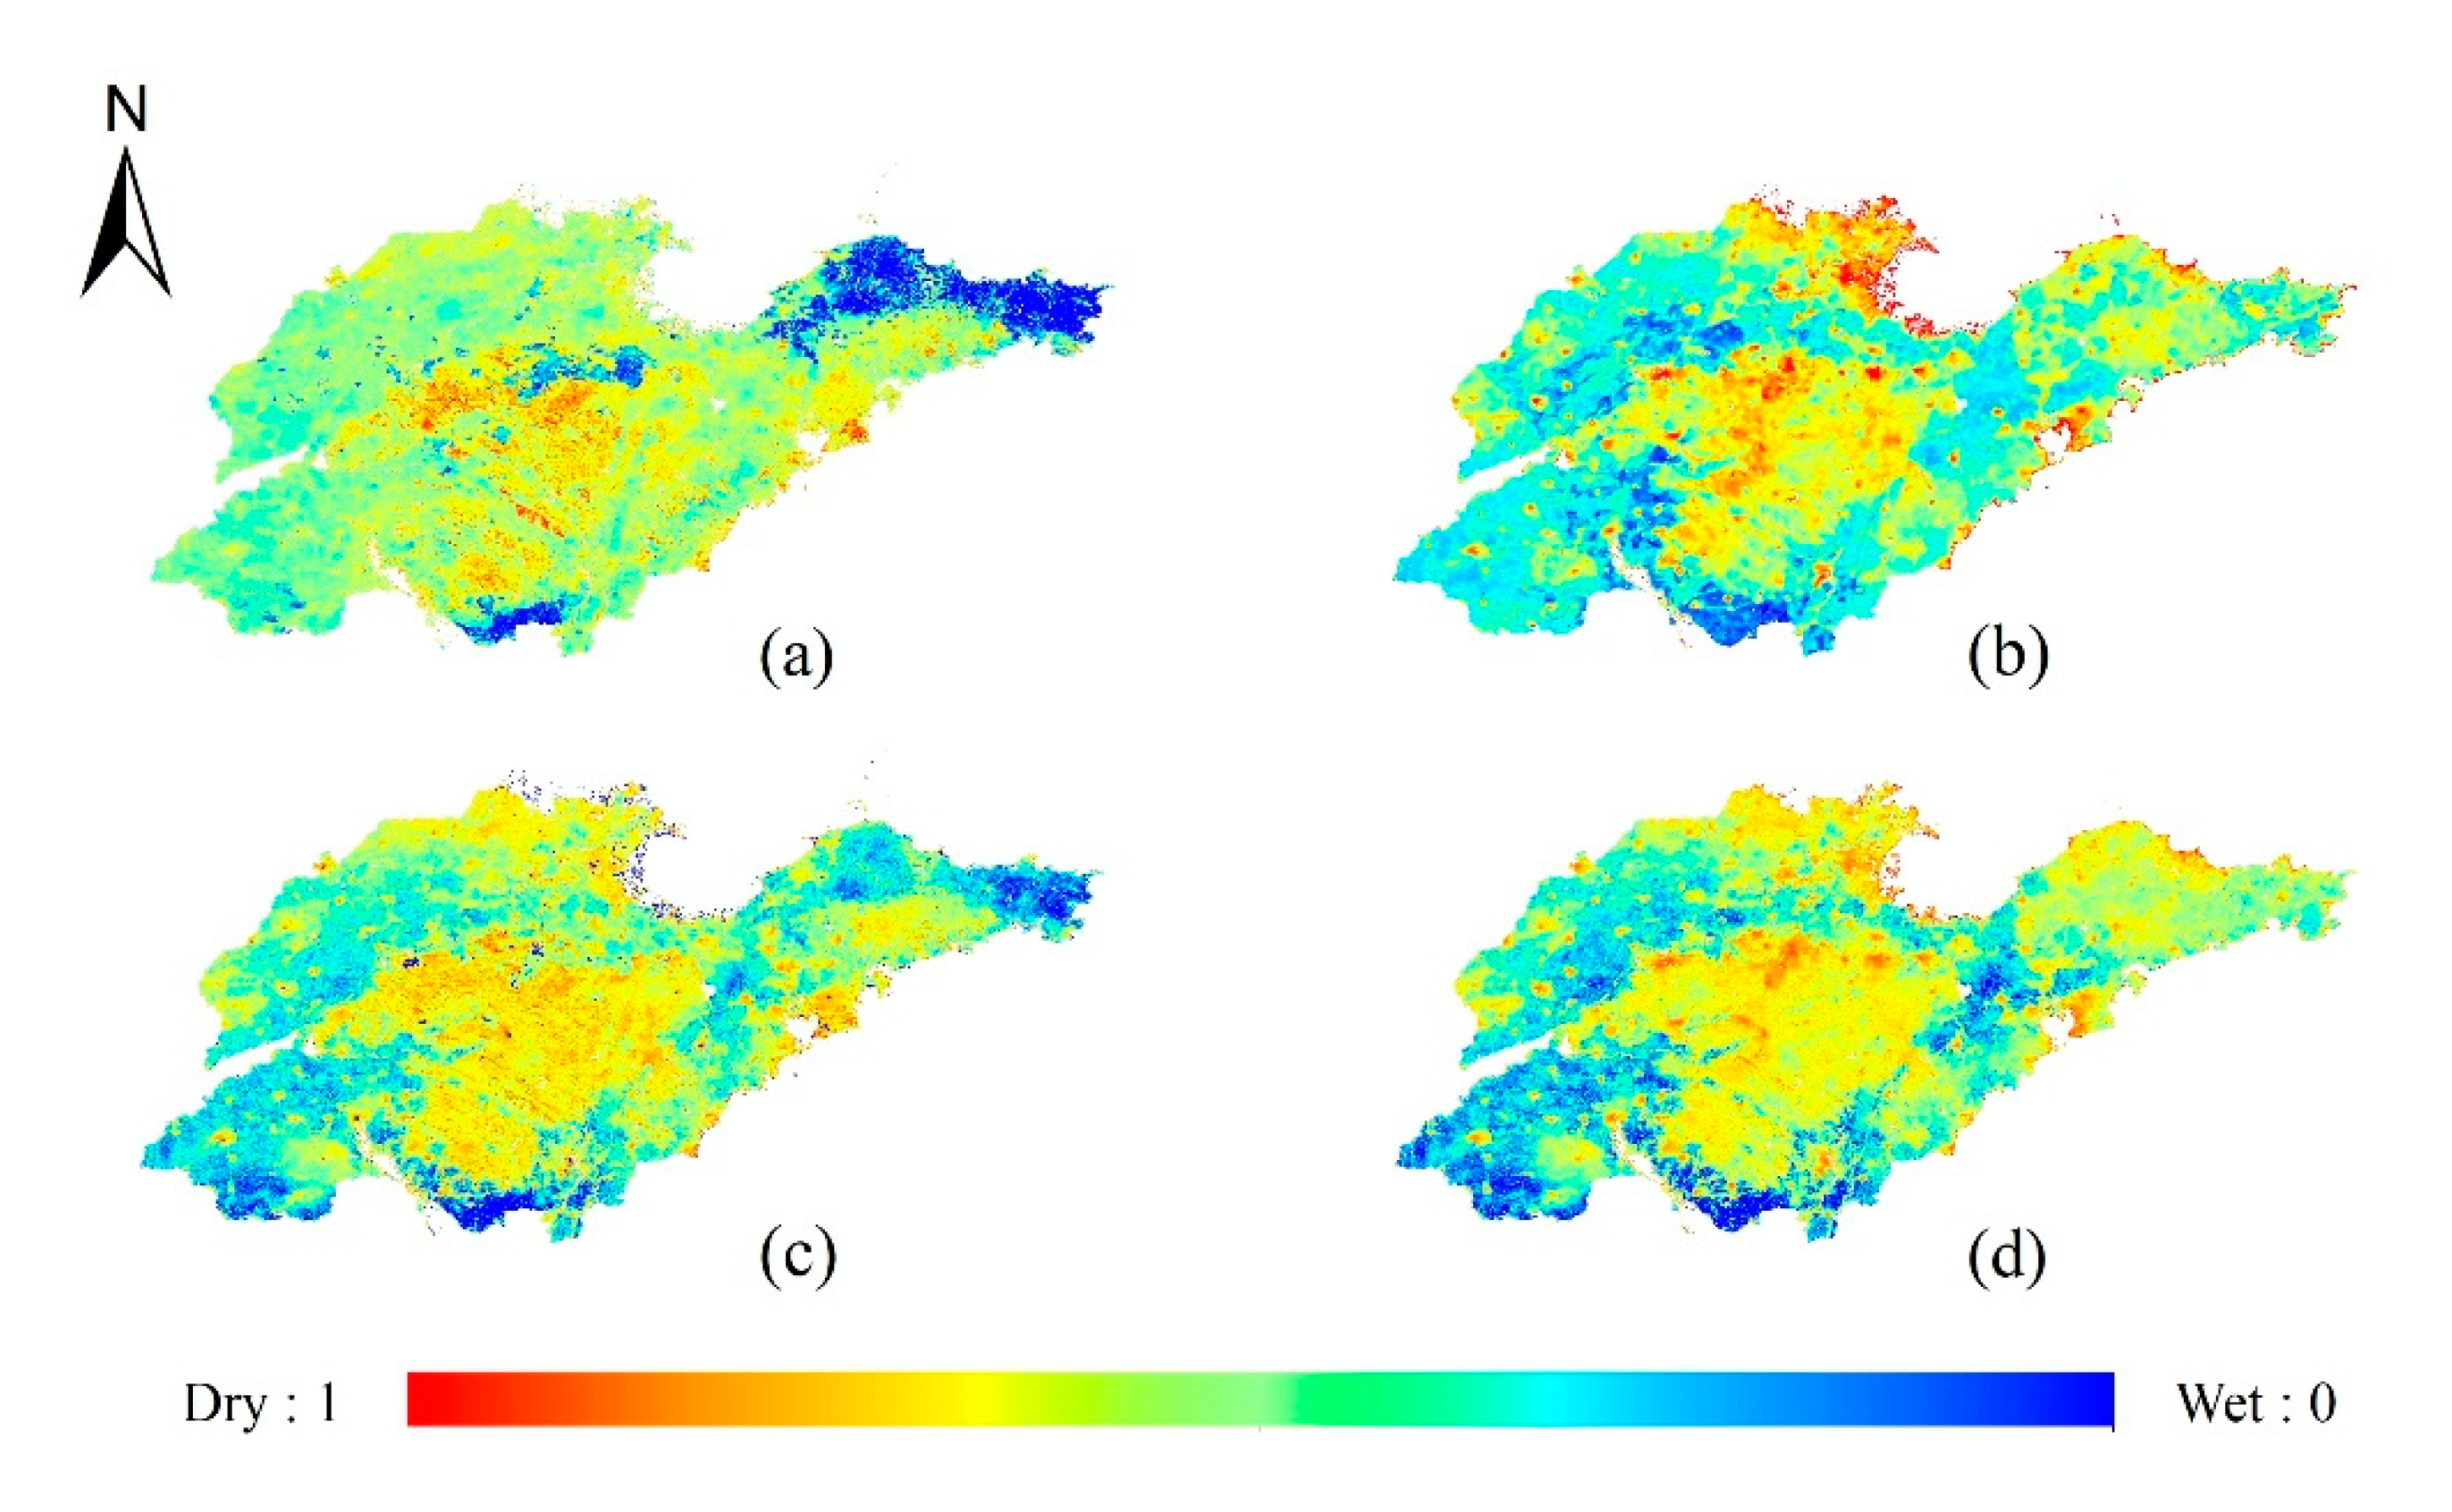
Figure 10 shows the SM in January, calculated using the MODIS NIR-Red band (Figure 10a), the downscaled FY3B SM (Figure 10b), the TVMDI (Figure 10c) and the iTVMDI (Figure 10d). To facilitate a comparison of the differences between the SM calculated using the NIR-Red band feature space, downscaled SM, TVMDI and iTVMDI in Shandong Province, all the calculation results were normalized. There are many differences between the SM data calculated by the MODIS NIR and Red bands and the FY3B-downscaled SM in terms of representing the drought situation in Shandong Province, China (Figure 10a,b). Compared with MODIS SM, the FY3B-downscaled SM can show the differences across different land covers. The TVMDI and iTVMDI show the same drought situations in Shandong Province overall. However, when the iTVMDI shows drought, the land surface actually shows normal or wet conditions because drought conditions are very sensitive to many factors, including the time lag effect between the monthly average iTVMDI and rainfall or surface variables, such as the LST and VI [70].
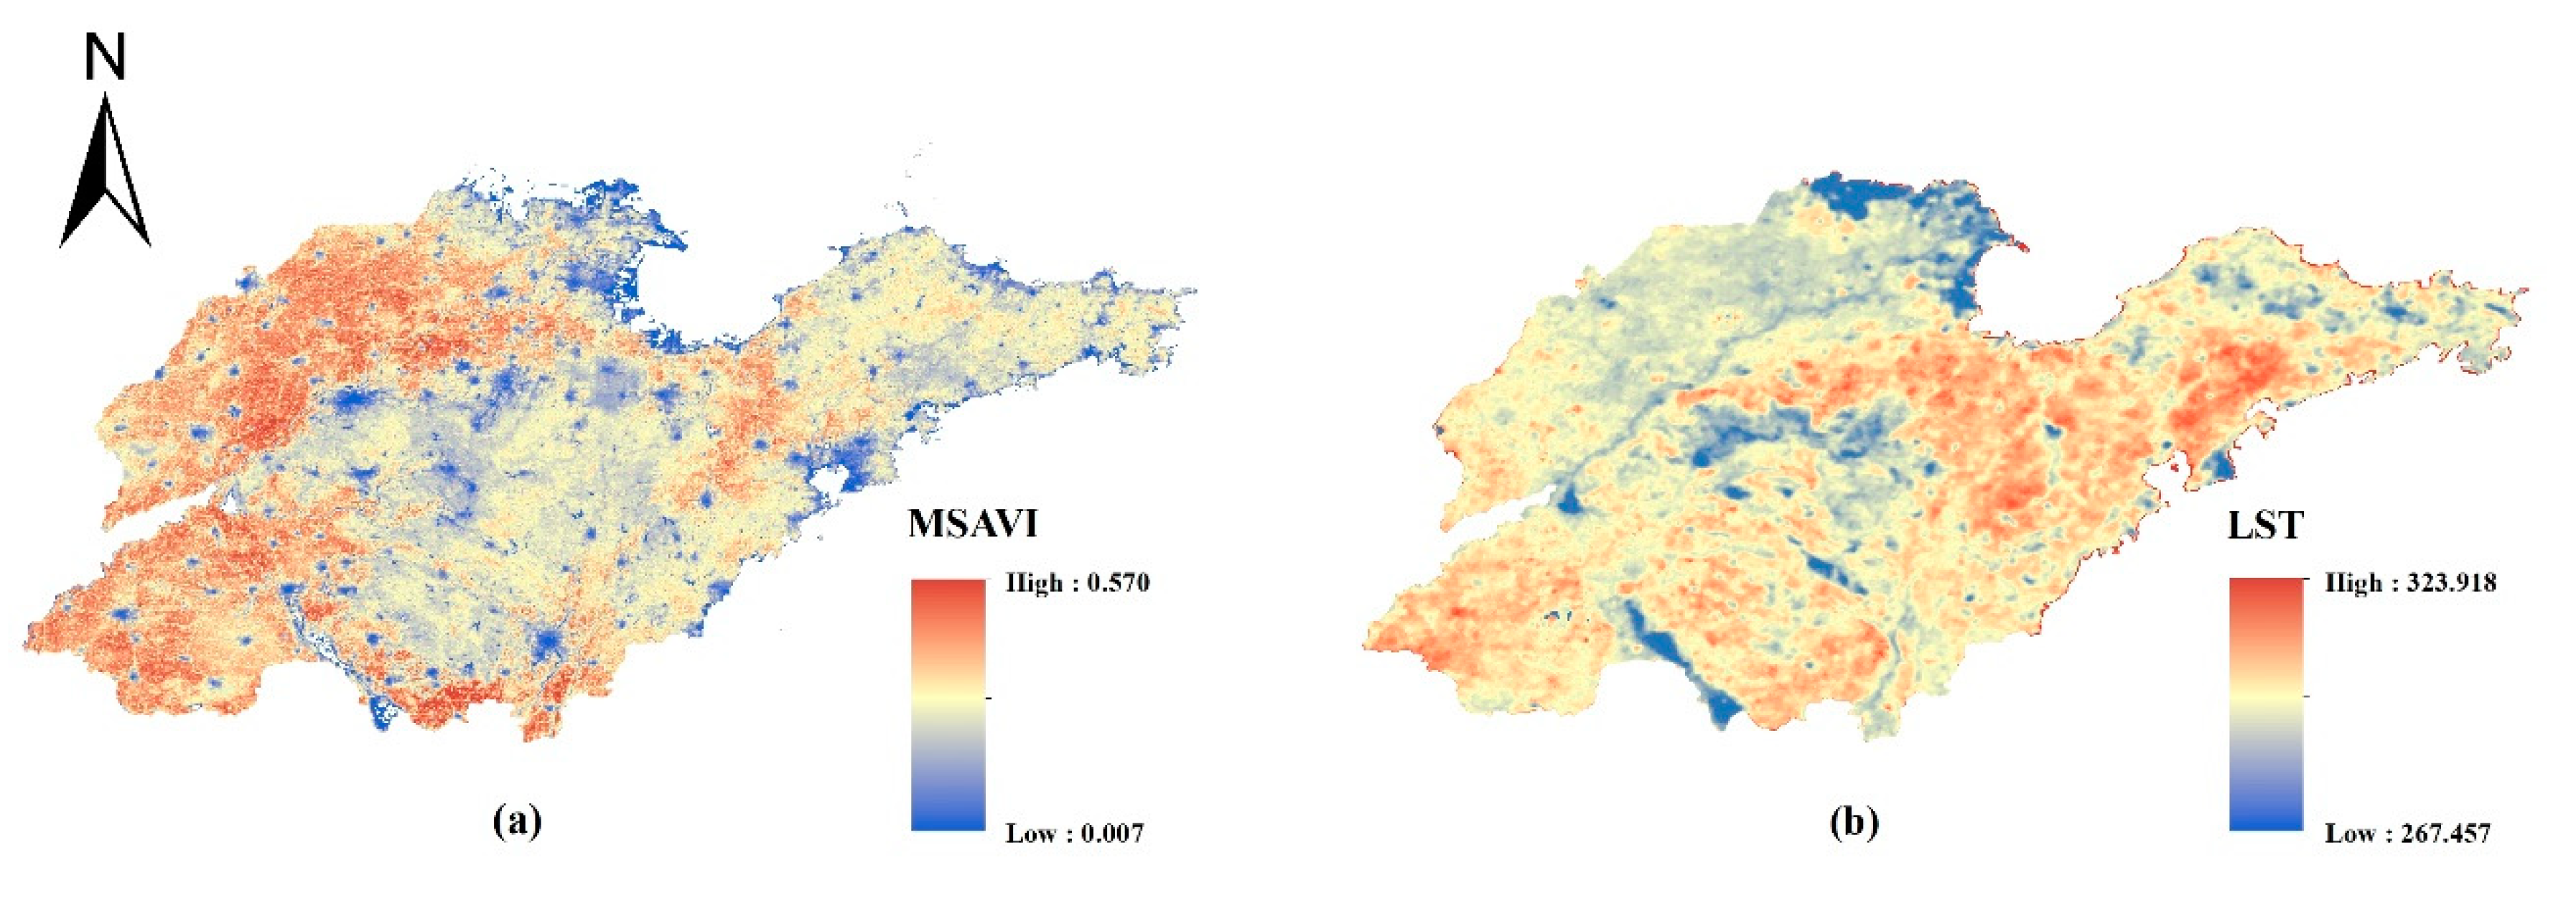
As a major province of grain production, most of Shandong is currently composed of croplands. We calculated the effective irrigated area of each city, which is the total area of paddy fields and irrigated land that are equipped with irrigation projects or equipment and can be irrigated normally, and this is an important index reflecting the drought resistance of cultivated land in China. According to the statistical yearbook data, the effective irrigated areas in Dezhou, Liaocheng, Heze and Jining were 492, 473, 631 and 473 thousand hectares, accounting for 60%, 68%, 66% and 61% of the local agricultural land area, respectively. The proportion of effective irrigated area in these four cities was the highest in the province. Because these areas were also the main production areas of winter wheat, the relatively complete irrigation facilities made the farmland water supply sufficient. The continuous water supply and intensive land use made these areas have relatively high average annual vegetation coverage (Figure 11a). However, it is still necessary to continue to build adequate irrigation measures in farmland areas, especially in Heze, Weifang and Qingdao, where the temperature is higher than in other areas (Figure 11b), in order to replenish groundwater and maintain SM in this area. Further research will continue to focus on drought risks to determine the impact of drought on agricultural productivity and livelihoods [20,71]. In combination with the variation relationship between drought index and measured surface water supply data, the relationship between the available amount of and demand for water resources is calculated in detail to improve the comprehensive utilization rate of water resources, which requires further exploration [72].
6. Conclusions
The TVMDI model is simple and efficient to calculate, but its results depend on SM, VI and LST obtained by optical and infrared remote sensing. Optical remote sensing is susceptible to weather and cannot obtain valid data in the presence of clouds. Microwave remote sensing is considered to be the most promising method of land surface SM remote sensing detection at present, given its short return period and high temporal resolution. In this paper, the original drought monitoring index TVMDI was improved by FY3B microwave remote sensing of SM. A novel drought index, iTVMDI, based on multi-satellite data fusion, was proposed in this study. Compared with the TVMDI model based on optical and infrared data, the iTVMDI model can improve the ability of drought monitoring by integrating optical/infrared data and microwave data. Furthermore, it also shows the potential of multi-source remote sensing data fusion in remote sensing and drought monitoring. In this study, iTVMDI was used to monitor the drought in Shandong Province in 2016, and GLDAS SM was used to verify the monitoring results. In addition, precipitation and surface water were used to assess the monitoring capacity of iTVMDI for meteorological and hydrological drought. The results proved that the iTVMDI model based on microwave data is more accurate, and the iTVMDI is better than TVMDI in meteorological drought and hydrological drought monitoring. Future research includes (1) improving the iTVMDI by using higher resolution microwave remote sensing SM data and (2) evaluating the ability of the iTVMDI for agricultural drought assessment.
Author Contributions
Conceptualization, Z.W. and P.G.; methodology, Z.W.; software, Z.W.; validation, Z.W.; formal analysis, Z.W.; investigation, Z.W.; resources, H.W.; data curation, Z.W.; writing—original draft preparation, Z.W.; writing—review and editing, Z.W., P.G., H.W. and L.W.; visualization, Z.W. and F.T.; supervision, P.G.; project administration, P.G.; funding acquisition, P.G. All authors have read and agree to the published version of the manuscript.
Funding
This research was funded by the Natural Science Foundation of Shandong Province (grant numbers: ZR2015DL003), and the Natural Science Foundation of China (grant numbers: 41501409).
Acknowledgments
The MODIS data used in our study were originally downloaded from the NASA Land Processes Distributed Active Archive Center, located at the U.S. Geological Survey (USGS) Earth Resources Observation and Science (EROS) Center. The surface water data come from the Shandong Statistical Yearbook. The meteorological data come from the National Meteorological Information Center.
Conflicts of Interest
The authors declare no conflict of interest.
Appendix A
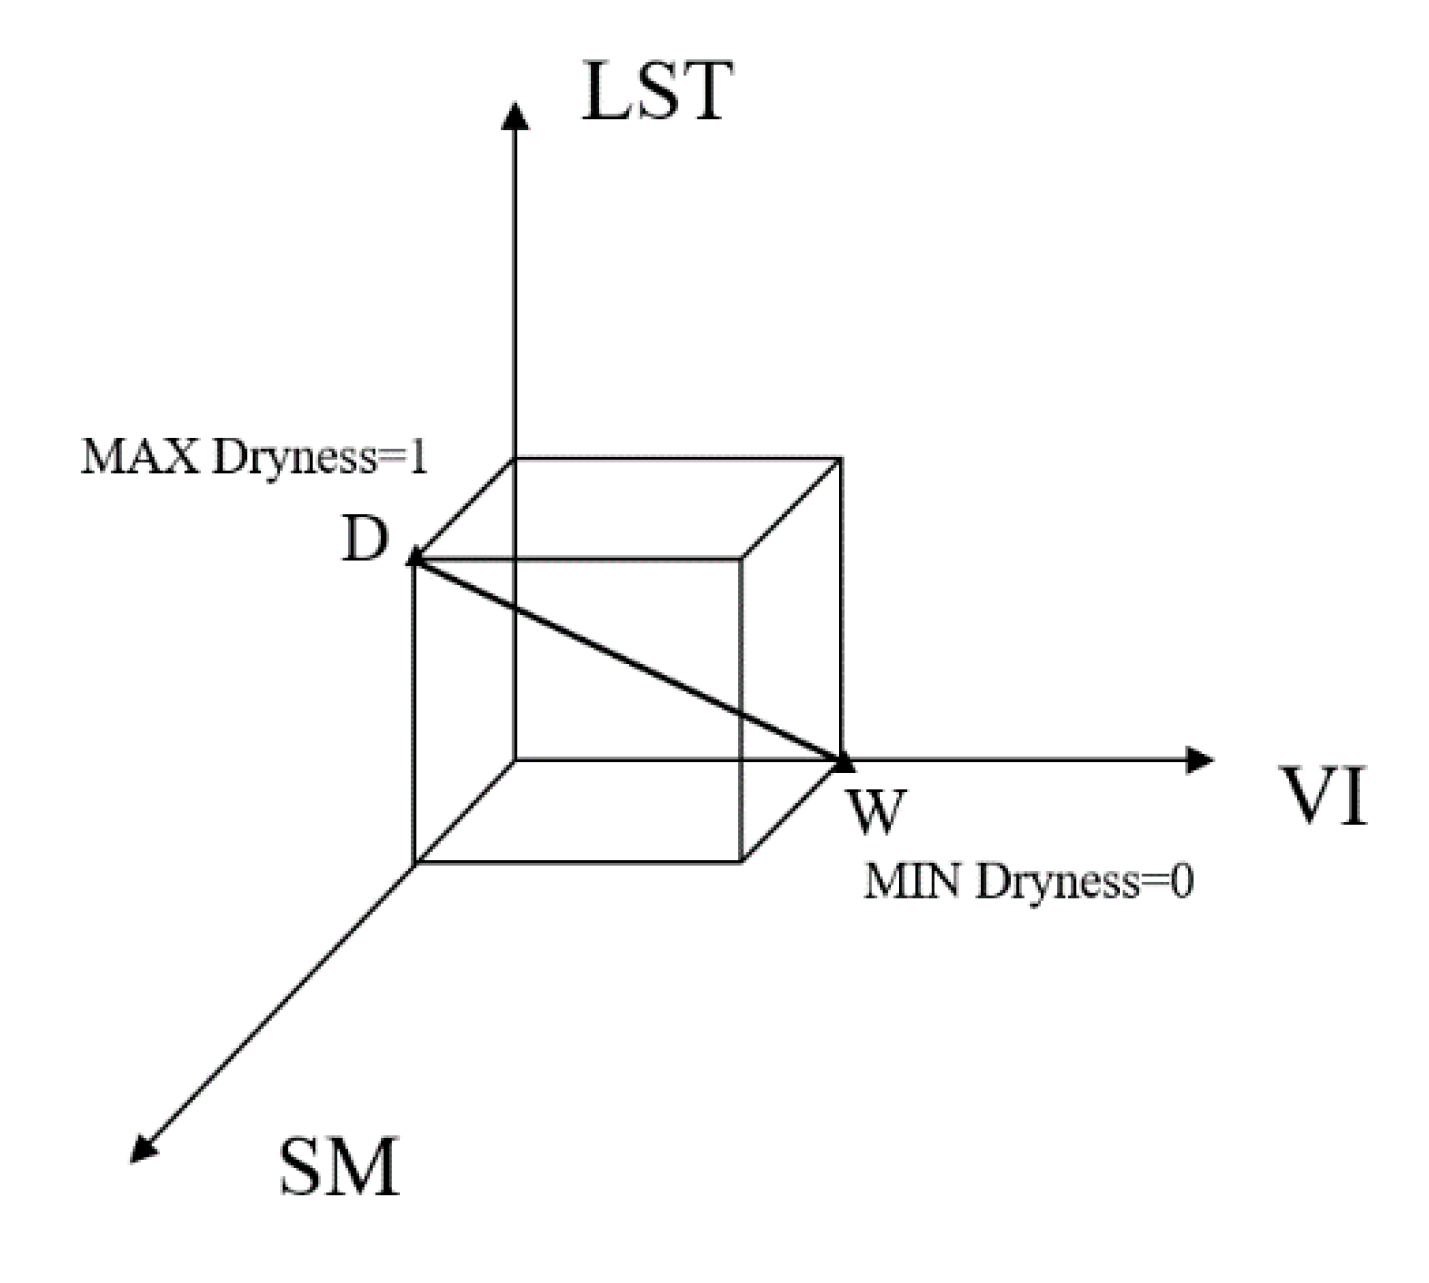
By increasing the SM, the vegetation coverage will increase. As a result, the VI value will rise, and the drought value will usually decrease. Similarly, when SM decreases and LST rises, vegetation will be affected by drought because there is not enough water in the soil. With the increase in LST and the decrease in vegetation cover and SM, drought will be more serious and reach its maximum value of one. As shown in Figure A1, the line segment WD is the spatial representation line of TVMDI, and the point W indicates that the temperature in the region where the pixel is located is the lowest, the vegetation coverage is the highest, the SM content is the highest, and the drought value is the lowest. Notably, the value of the SM axis gradually decreases, because the lower the SM value is, the closer it is to the end with a TVMDI of one (Point D).
Figure A1.
The definition of the TVMDI. TVMDI is based on VI, LST, and SM as the axis of the three-dimensional space. The TVMDI is defined as the square root of the square sum of VI, LST, and SM [34].
Figure A1.
The definition of the TVMDI. TVMDI is based on VI, LST, and SM as the axis of the three-dimensional space. The TVMDI is defined as the square root of the square sum of VI, LST, and SM [34].

The TVMDI is defined as follows:
where SM is calculated as follows:
where and are reflections in the red and NIR bands, respectively, after atmospheric correction, and M and b are the slope and intercept of the linear-fitting formula of the soil line in the NIR-Red feature space, respectively [24,73]. The PVI is defined as follows:
where and are reflections in the red and NIR bands, respectively. a and b refer to the slope and interception of the soil line equation, respectively. In this study, the values of each axis are normalized to the range from zero to so that the drought index is in the range from zero to one, and the normalization formula is as follows:
where represents VI, SM or LST and . The maximum temperature is 349 K, and the minimum is 273 K because temperatures below 273 K are meaningless in drought research.
References
- Yang, X.; Zhang, L.; Wang, Y.; Singh, V.P.; Xu, C.-Y.; Ren, L.; Zhang, M.; Liu, Y.; Jiang, S.; Yuan, F. Spatial and temporal characterization of drought events in china using the severity-area-duration method. Water 2020, 12, 230. [Google Scholar] [CrossRef] [Green Version]
- Martínez-Fernández, J.; González-Zamora, A.; Sánchez, N.; Gumuzzio, A. A soil water based index as a suitable agricultural drought indicator. J. Hydrol. 2015, 522, 265–273. [Google Scholar] [CrossRef]
- Zhang, J.; Mu, Q.; Huang, J. Assessing the remotely sensed drought severity index for agricultural drought monitoring and impact analysis in north china. Ecol. Indic. 2016, 63, 296–309. [Google Scholar] [CrossRef]
- Tadesse, T.; Champagne, C.; Wardlow, B.D.; Hadwen, T.A.; Brown, J.F.; Demisse, G.B.; Bayissa, Y.A.; Davidson, A.M. Building the vegetation drought response index for canada (vegdri-canada) to monitor agricultural drought: First results. GIScience Remote Sens. 2017, 54, 230–257. [Google Scholar] [CrossRef]
- Wang, X.; Hou, X.; Li, Z.; Wang, Y. Spatial and temporal characteristics of meteorological drought in shandong province, china, from 1961 to 2008. Adv. Meteorol. 2014, 2014, 1–11. [Google Scholar] [CrossRef]
- Tran, T.V.; Tran, D.X.; Myint, S.W.; Latorre-Carmona, P.; Ho, D.D.; Tran, P.H.; Dao, H.N. Assessing spatiotemporal drought dynamics and its related environmental issues in the mekong river delta. Remote Sens. 2019, 11, 2742. [Google Scholar] [CrossRef] [Green Version]
- Sun, Z.; Zhu, X.; Pan, Y.; Zhang, J.; Liu, X. Drought evaluation using the grace terrestrial water storage deficit over the yangtze river basin, china. Sci. Total Environ. 2018, 634, 727–738. [Google Scholar] [CrossRef] [PubMed]
- Tuttle, S.E.; Salvucci, G.D. A new approach for validating satellite estimates of soil moisture using large-scale precipitation: Comparing amsr-e products. Remote Sens. Environ. 2014, 142, 207–222. [Google Scholar] [CrossRef]
- Zhang, A.; Jia, G. Monitoring meteorological drought in semiarid regions using multi-sensor microwave remote sensing data. Remote Sens. Environ. 2013, 134, 12–23. [Google Scholar] [CrossRef]
- Jiao, W.; Tian, C.; Chang, Q.; Novick, K.A.; Wang, L. A new multi-sensor integrated index for drought monitoring. Agric. For. Meteorol. 2019, 268, 74–85. [Google Scholar] [CrossRef] [Green Version]
- Zhang, J.; Zhang, Q.; Bao, A.; Wang, Y. A new remote sensing dryness index based on the near-infrared and red spectral space. Remote Sens. 2019, 11, 456. [Google Scholar] [CrossRef] [Green Version]
- Martínez-Fernández, J.; González-Zamora, A.; Sánchez, N.; Gumuzzio, A.; Herrero-Jiménez, C.M. Satellite soil moisture for agricultural drought monitoring: Assessment of the smos derived soil water deficit index. Remote Sens. Environ. 2016, 177, 277–286. [Google Scholar] [CrossRef]
- Huete, A.; Justice, C.; Liu, H. Development of vegetation and soil indices for modis-eos. Remote Sens. Environ. 1994, 49, 224–234. [Google Scholar] [CrossRef]
- Pei, F.; Wu, C.; Liu, X.; Li, X.; Yang, K.; Zhou, Y.; Wang, K.; Xu, L.; Xia, G. Monitoring the vegetation activity in china using vegetation health indices. Agric. For. Meteorol. 2018, 248, 215–227. [Google Scholar] [CrossRef]
- Yao, Y.; Liang, S.; Qin, Q.; Wang, K. Monitoring drought over the conterminous united states using modis and ncep reanalysis-2 data. J. Appl. Meteorol. Climatol. 2010, 49, 1665–1680. [Google Scholar] [CrossRef]
- Liu, Y.; Yue, H. The temperature vegetation dryness index (tvdi) based on bi-parabolic ndvi-ts space and gradient-based structural similarity (gssim) for long-term drought assessment across Ahaanxi province, China (2000–2016). Remote Sens. 2018, 10, 959. [Google Scholar] [CrossRef] [Green Version]
- Lambin, E.F.; Ehrlich, D. The surface temperature-vegetation index space for land cover and land-cover change analysis. Int. J. Remote Sens. 2007, 17, 463–487. [Google Scholar] [CrossRef]
- Zormand, S.; Jafari, R.; Koupaei, S.S. Assessment of pdi, mpdi and tvdi drought indices derived from modis aqua/terra level 1b data in natural lands. Nat. Hazards 2016, 86, 757–777. [Google Scholar] [CrossRef]
- Ghulam, A.; Qin, Q.; Teyip, T.; Li, Z.-L. Modified perpendicular drought index (mpdi): A real-time drought monitoring method. ISPRS J. Photogramm. Remote Sens. 2007, 62, 150–164. [Google Scholar] [CrossRef]
- Pandey, V.; Srivastava, P.K. Integration of microwave and optical/infrared derived datasets for a drought hazard inventory in a sub-tropical region of india. Remote Sens. 2019, 11, 439. [Google Scholar] [CrossRef] [Green Version]
- Peng, J.; Loew, A.; Zhang, S.; Wang, J.; Niesel, J. Spatial downscaling of satellite soil moisture data using a vegetation temperature condition index. IEEE Trans. Geosci. Remote Sens. 2016, 54, 558–566. [Google Scholar] [CrossRef]
- Piles, M.; Camps, A.; Vall-llossera, M.; Corbella, I.; Panciera, R.; Rudiger, C.; Kerr, Y.H.; Walker, J. Downscaling smos-derived soil moisture using modis visible/infrared data. IEEE Trans. Geosci. Remote Sens. 2011, 49, 3156–3166. [Google Scholar] [CrossRef]
- Gruber, A.; Su, C.H.; Zwieback, S.; Crow, W.; Dorigo, W.; Wagner, W. Recent advances in (soil moisture) triple collocation analysis. Int. J. Appl. Earth Obs. Geoinf. 2016, 45, 200–211. [Google Scholar] [CrossRef]
- Amani, M.; Parsian, S.; MirMazloumi, S.M.; Aieneh, O. Two new soil moisture indices based on the nir-red triangle space of landsat-8 data. Int. J. Appl. Earth Obs. Geoinf. 2016, 50, 176–186. [Google Scholar] [CrossRef]
- Ghulam, A.; Qin, Q.; Zhan, Z. Designing of the perpendicular drought index. Environ. Geol. 2007, 52, 1045–1052. [Google Scholar] [CrossRef]
- Sandholt, I.; Rasmussen, K.; Andersen, J. A simple interpretation of the surface temperature/vegetation index space for assessment of surface moisture status. Remote Sens. Environ. 2002, 79, 213–224. [Google Scholar] [CrossRef]
- Zhang, J.; Zhou, Z.; Yao, F.; Yang, L.; Hao, C. Validating the modified perpendicular drought index in the north china region using in situ soil moisture measurement. IEEE Geosci. Remote Sens. Lett. 2015, 12, 542–546. [Google Scholar] [CrossRef]
- Li, Z.; Tan, D. The second modified perpendicular drought index (mpdi1): A combined drought monitoring method with soil moisture and vegetation index. J. Indian Soc. Remote Sens. 2013, 41, 873–881. [Google Scholar] [CrossRef]
- Pablos, M.; Piles, M.; Sánchez, N.; Vall-llossera, M.; Martínez-Fernández, J.; Camps, A. Impact of day/night time land surface temperature in soil moisture disaggregation algorithms. Eur. J. Remote Sens. 2016, 49, 899–916. [Google Scholar] [CrossRef] [Green Version]
- Zhu, X.; Pan, Y.; Wang, J.; Liu, Y. A cuboid model for assessing surface soil moisture. Remote Sens. 2019, 11, 3034. [Google Scholar] [CrossRef] [Green Version]
- Holzman, M.E.; Rivas, R.; Bayala, M. Subsurface soil moisture estimation by vi–lst method. IEEE Geosci. Remote Sens. Lett. 2014, 11, 1951–1955. [Google Scholar] [CrossRef]
- Zhang, D.; Zhou, G. Estimation of soil moisture from optical and thermal remote sensing: A review. Sensors 2016, 16, 1308. [Google Scholar] [CrossRef] [PubMed] [Green Version]
- Ford, T.W.; Quiring, S.M. Comparison of contemporary in situ, model, and satellite remote sensing soil moisture with a focus on drought monitoring. Water Resour. Res. 2019, 55, 1565–1582. [Google Scholar] [CrossRef]
- Amani, M.; Salehi, B.; Mahdavi, S.; Masjedi, A.; Dehnavi, S. Temperature-vegetation-soil moisture dryness index (tvmdi). Remote Sens. Environ. 2017, 197, 1–14. [Google Scholar] [CrossRef]
- Filippa, G.; Cremonese, E.; Migliavacca, M.; Galvagno, M.; Sonnentag, O.; Humphreys, E.; Hufkens, K.; Ryu, Y.; Verfaillie, J.; Morra di Cella, U.; et al. Ndvi derived from near-infrared-enabled digital cameras: Applicability across different plant functional types. Agric. For. Meteorol. 2018, 249, 275–285. [Google Scholar] [CrossRef]
- Zhang, X.; Zhao, J.; Tian, J. A robust coinversion model for soil moisture retrieval from multisensor data. IEEE Trans. Geosci. Remote Sens. 2014, 52, 5230–5237. [Google Scholar] [CrossRef]
- Proud, S.R.; Rasmussen, M.O.; Fensholt, R.; Sandholt, I.; Shisanya, C.; Mutero, W.; Mbow, C.; Anyamba, A. Improving the smac atmospheric correction code by analysis of meteosat second generation ndvi and surface reflectance data. Remote Sens. Environ. 2010, 114, 1687–1698. [Google Scholar] [CrossRef]
- Jiao, T.; Williams, C.A.; Rogan, J.; De Kauwe, M.G.; Medlyn, B.E. Drought impacts on australian vegetation during the millennium drought measured with multisource spaceborne remote sensing. J. Geophys. Res. Biogeosci. 2020, 125. [Google Scholar] [CrossRef]
- Fan, L.; Wigneron, J.P.; Xiao, Q.; Al-Yaari, A.; Wen, J.; Martin-StPaul, N.; Dupuy, J.L.; Pimont, F.; Al Bitar, A.; Fernandez-Moran, R.; et al. Evaluation of microwave remote sensing for monitoring live fuel moisture content in the mediterranean region. Remote Sens. Environ. 2018, 205, 210–223. [Google Scholar] [CrossRef]
- Guo, P.; Shi, J.; Liu, Q.; Du, J. A new algorithm for soil moisture retrieval with l-band radiometer. IEEE J. Sel. Top. Appl. Earth Obs. Remote Sens. 2013, 6, 1147–1155. [Google Scholar] [CrossRef]
- Mladenova, I.E.; Jackson, T.J.; Njoku, E.; Bindlish, R.; Chan, S.; Cosh, M.H.; Holmes, T.R.H.; de Jeu, R.A.M.; Jones, L.; Kimball, J.; et al. Remote monitoring of soil moisture using passive microwave-based techniques—Theoretical basis and overview of selected algorithms for amsr-e. Remote Sens. Environ. 2014, 144, 197–213. [Google Scholar] [CrossRef]
- Wu, S.Y.; Zhou, Q.Y.; Wang, G.; Yang, L.; Ling, C.P. The relationship between electrical capacitance-based dielectric constant and soil water content. Environ. Earth Sci. 2010, 62, 999–1011. [Google Scholar] [CrossRef]
- Zuo, D.; Cai, S.; Xu, Z.; Li, F.; Sun, W.; Yang, X.; Kan, G.; Liu, P. Spatiotemporal patterns of drought at various time scales in shandong province of eastern china. Theor. Appl. Climatol. 2016, 131, 271–284. [Google Scholar] [CrossRef]
- Shao, Y.; Lunetta, R.S.; Wheeler, B.; Iiames, J.S.; Campbell, J.B. An evaluation of time-series smoothing algorithms for land-cover classifications using modis-ndvi multi-temporal data. Remote Sens. Environ. 2016, 174, 258–265. [Google Scholar] [CrossRef]
- Savitzky, A.; Golay, M.J.E. Smoothing and differentiation of data by simplified least squares procedures. Anal. Chem. 1964, 36, 1627–1639. [Google Scholar] [CrossRef]
- Jiang, L.; Wang, P.; Zhang, L.; Yang, H.; Yang, J. Improvement of snow depth retrieval for fy3b-mwri in china. Sci. China Earth Sci. 2014, 57, 1278–1292. [Google Scholar] [CrossRef]
- Wang, G.; Hagan, D.F.T.; Lou, D.; Chen, T. Evaluation of soil moisture derived from fy3b microwave brightness temperature over the tibetan plateau. Remote Sens. Lett. 2016, 7, 817–826. [Google Scholar] [CrossRef]
- Fu, H.; Zhou, T.; Sun, C. Evaluation and analysis of amsr2 and fy3b soil moisture products by an in situ network in cropland on pixel scale in the northeast of china. Remote Sens. 2019, 11, 868. [Google Scholar] [CrossRef] [Green Version]
- Liu, Q.; Zhang, S.; Zhang, H.; Bai, Y.; Zhang, J. Monitoring drought using composite drought indices based on remote sensing. Sci. Total Environ. 2020, 711, 134585. [Google Scholar] [CrossRef]
- Liu, Y.Y.; Dorigo, W.A.; Parinussa, R.M.; de Jeu, R.A.M.; Wagner, W.; McCabe, M.F.; Evans, J.P.; van Dijk, A.I.J.M. Trend-preserving blending of passive and active microwave soil moisture retrievals. Remote Sens. Environ. 2012, 123, 280–297. [Google Scholar] [CrossRef]
- Kim, H.; Parinussa, R.; Konings, A.G.; Wagner, W.; Cosh, M.H.; Lakshmi, V.; Zohaib, M.; Choi, M. Global-scale assessment and combination of smap with ascat (active) and amsr2 (passive) soil moisture products. Remote Sens. Environ. 2018, 204, 260–275. [Google Scholar] [CrossRef]
- Bai, J.; Cui, Q.; Chen, D.; Yu, H.; Mao, X.; Meng, L.; Cai, Y. Assessment of the smap-derived soil water deficit index (swdi-smap) as an agricultural drought index in china. Remote Sens. 2018, 10, 1302. [Google Scholar] [CrossRef] [Green Version]
- Dorigo, W.A.; Scipal, K.; Parinussa, R.M.; Liu, Y.Y.; Wagner, W.; de Jeu, R.A.M.; Naeimi, V. Error characterisation of global active and passive microwave soil moisture datasets. Hydrol. Earth Syst. Sci. 2010, 14, 2605–2616. [Google Scholar] [CrossRef] [Green Version]
- Sure, A.; Dikshit, O. Estimation of root zone soil moisture using passive microwave remote sensing: A case study for rice and wheat crops for three states in the indo-gangetic basin. J. Environ. Manage. 2019, 234, 75–89. [Google Scholar] [CrossRef]
- Liu, L.; Liao, J.; Chen, X.; Zhou, G.; Su, Y.; Xiang, Z.; Wang, Z.; Liu, X.; Li, Y.; Wu, J.; et al. The microwave temperature vegetation drought index ( mtvdi ) based on amsr—E brightness temperatures for long-term drought assessment across china (2003–2010). Remote Sens. Environ. 2017, 199, 302–320. [Google Scholar] [CrossRef]
- Wigneron, J.P.; Laguerre, L.; Kerr, Y.H. A simple parameterization of the l-band microwave emission from rough agricultural soils. IEEE Trans. Geosci. Remote Sens. 2001, 39, 1697–1707. [Google Scholar] [CrossRef]
- Shi, J.; Chen, K.S.; Li, Q.; Jackson, T.J.; O’Neill, P.E.; Tsang, L. A parameterized surface reflectivity model and estimation of bare-surface soil moisture with l-band radiometer. IEEE Trans. Geosci. Remote Sens. 2002, 40, 2674–2686. [Google Scholar]
- Park, S.; Im, J.; Park, S.; Rhee, J. Drought monitoring using high resolution soil moisture through multi-sensor satellite data fusion over the korean peninsula. Agric. For. Meteorol. 2017, 237, 257–269. [Google Scholar] [CrossRef]
- Zhong, A.; Wang, A.; Li, J.; Xu, T.; Meng, D.; Ke, Y.; Li, X.; Chen, Y. Downscaling of passive microwave soil moisture retrievals based on spectral analysis. Int. J. Remote Sens. 2017, 39, 50–67. [Google Scholar] [CrossRef]
- Chen, N.; He, Y.; Zhang, X. Nir-red spectra-based disaggregation of smap soil moisture to 250 m resolution based on oznet in southeastern australia. Remote Sens. 2017, 9, 51. [Google Scholar] [CrossRef] [Green Version]
- Wang, J.; Ling, Z.; Wang, Y.; Zeng, H. Improving spatial representation of soil moisture by integration of microwave observations and the temperature—Vegetation—Drought index derived from modis products. ISPRS J. Photogramm. Remote Sens. 2016, 113, 144–154. [Google Scholar] [CrossRef] [Green Version]
- Fang, B.; Lakshmi, V.; Bindlish, R.; Jackson, T.J. Downscaling of smap soil moisture using land surface temperature and vegetation data. Vadose Zone J. 2018, 17, 1–15. [Google Scholar] [CrossRef] [Green Version]
- Chauhan, N.S.; Miller, S.; Ardanuy, P. Spaceborne soil moisture estimation at high resolution: A microwave-optical/ir synergistic approach. Int. J. Remote Sens. 2010, 24, 4599–4622. [Google Scholar] [CrossRef]
- Richardson, A.J.; Wiegand, C.L. Distinguishing vegetation from soil background information. Photogramm. Eng. Remote Sens. 1977, 43, 1541–1552. [Google Scholar]
- Qi, J.; Chehbouni, A.; Huete, A. A modified soil adjusted vegetation index. Remote Sens. Environ. 1994, 48, 119–126. [Google Scholar] [CrossRef]
- West, H.; Quinn, N.; Horswell, M. Remote sensing for drought monitoring & impact assessment: Progress, past challenges and future opportunities. Remote Sens. Environ. 2019, 232, 111291. [Google Scholar]
- Zhao, G.; Gao, H.; Kao, S.-C.; Voisin, N.; Naz, B.S. A modeling framework for evaluating the drought resilience of a surface water supply system under non-stationarity. J. Hydrol. 2018, 563, 22–32. [Google Scholar] [CrossRef]
- Tweed, S.; Leblanc, M.; Cartwright, I. Groundwater—Surface water interaction and the impact of a multi-year drought on lakes conditions in south-east australia. J. Hydrol. 2009, 379, 41–53. [Google Scholar] [CrossRef]
- Martins, V.S.; Kaleita, A.; Barbosa, C.C.F.; Fassoni-Andrade, A.C.; Lobo, F.d.L.; Novo, E.M.L.M. Remote sensing of large reservoir in the drought years: Implications on surface water change and turbidity variability of sobradinho reservoir (northeast brazil). Remote Sens. Appl. Soc. Environ. 2019, 13, 275–288. [Google Scholar] [CrossRef]
- Cong, D.; Zhao, S.; Chen, C.; Duan, Z. Characterization of droughts during 2001–2014 based on remote sensing: A case study of northeast china. Ecol. Inform. 2017, 39, 56–67. [Google Scholar] [CrossRef]
- Alamgir, M.; Khan, N.; Shahid, S.; Yaseen, Z.M.; Dewan, A.; Hassan, Q.; Rasheed, B. Evaluating severity—Area—Frequency (saf) of seasonal droughts in bangladesh under climate change scenarios. Stoch. Environ. Res. Risk Assess. 2020, 34, 447–464. [Google Scholar] [CrossRef]
- Leasor, Z.T.; Quiring, S.M.; Svoboda, M.D. Utilizing objective drought severity thresholds to improve drought monitoring. J. Appl. Meteorol. Climatol. 2020, 59, 455–475. [Google Scholar] [CrossRef]
- Amani, M.; Mobasheri, M.R. A parametric method for estimation of leaf area index using landsat etm + data. GIScience Remote Sens. 2015, 52, 478–497. [Google Scholar] [CrossRef]
Figure 1.
(a) Elevation map of the Shandong Province with weather station locations and (b) the land cover map of the Shandong Province in China.
Figure 1.
(a) Elevation map of the Shandong Province with weather station locations and (b) the land cover map of the Shandong Province in China.

Figure 2.
Data processing flow diagram to improve the Temperature–Vegetation–Soil Moisture Dryness Index (TVMDI) based on multi-satellite data.
Figure 2.
Data processing flow diagram to improve the Temperature–Vegetation–Soil Moisture Dryness Index (TVMDI) based on multi-satellite data.

Figure 3.
Time series of the 0–10 cm GLDAS SM (kg/m2) and drought indices for nine stations in 2016.
Figure 3.
Time series of the 0–10 cm GLDAS SM (kg/m2) and drought indices for nine stations in 2016.

Figure 4.
Scatterplots between precipitation and drought indices of nine meteorological stations in 2016.
Figure 4.
Scatterplots between precipitation and drought indices of nine meteorological stations in 2016.

Figure 5.
Improved Temperature–Vegetation–Soil Moisture Dryness Index (iTVMDI) and meteorological data in Jinan, Shandong Province, China: (a) temperature and (b) precipitation.
Figure 5.
Improved Temperature–Vegetation–Soil Moisture Dryness Index (iTVMDI) and meteorological data in Jinan, Shandong Province, China: (a) temperature and (b) precipitation.

Figure 6.
The relationship between drought indices and surface water: (a) iTVMDI and (b) TVMDI.

Figure 7.
Monthly iTVMDI map of Shandong Province in 2016.

Figure 8.
Monthly change in the average iTVMDI of different land covers in the whole year.

Figure 9.
Scatterplot of GLDAS SM and two kinds of satellite SM products, (a) FengYun (FY) 3B-Microwave Radiation Imager (MWRI) SM and (b) Moderate Resolution Imaging Spectroradiometer (MODIS) SM.
Figure 9.
Scatterplot of GLDAS SM and two kinds of satellite SM products, (a) FengYun (FY) 3B-Microwave Radiation Imager (MWRI) SM and (b) Moderate Resolution Imaging Spectroradiometer (MODIS) SM.

Figure 10.
The results of drought monitoring in January in Shandong Province, China. All maps were normalized, and the spatial resolution of these maps is 1 km. (a) SM calculated using the NIR-Red spectral space, (b) downscaling results of FY3B SM, (c) TVMDI and (d) iTVMDI.
Figure 10.
The results of drought monitoring in January in Shandong Province, China. All maps were normalized, and the spatial resolution of these maps is 1 km. (a) SM calculated using the NIR-Red spectral space, (b) downscaling results of FY3B SM, (c) TVMDI and (d) iTVMDI.

Figure 11.
(a) A map of the annual average Modified Soil-Adjusted Vegetation Index (MSAVI) for Shandong Province; and (b) the distribution map of the annual average land surface temperature (LST) (k) in Shandong Province after reconstruction.
Figure 11.
(a) A map of the annual average Modified Soil-Adjusted Vegetation Index (MSAVI) for Shandong Province; and (b) the distribution map of the annual average land surface temperature (LST) (k) in Shandong Province after reconstruction.


Table 1.
The relationship between drought indices of nine stations and global land data assimilation system soil moisture (GLDAS SM).
Table 1.
The relationship between drought indices of nine stations and global land data assimilation system soil moisture (GLDAS SM).
| Weather Station | iTVMDI | TVMDI | ||||||
|---|---|---|---|---|---|---|---|---|
| a(Slope) | b(Intercept) | R | P | a(Slope) | b(Intercept) | R | P | |
| Huimin | −0.0085 | 0.8565 | −0.71 | 0.010 | −0.0036 | 0.7562 | −0.49 | 0.10 |
| Feixian | −0.0107 | 0.9757 | −0.70 | 0.010 | −0.0095 | 0.8852 | −0.61 | 0.03 |
| Fushan | −0.0117 | 1.0125 | −0.62 | 0.030 | −0.0053 | 0.7861 | −0.33 | 0.29 |
| Jinan | −0.0099 | 0.9531 | −0.82 | 0.001 | −0.0087 | 0.8996 | −0.68 | 0.02 |
| Dingtao | −0.0063 | 0.8080 | −0.73 | 0.006 | −0.0048 | 0.6832 | −0.49 | 0.11 |
| Laiwu | −0.0132 | 1.0307 | −0.81 | 0.001 | −0.0090 | 0.8695 | −0.61 | 0.03 |
| Zibo | −0.0115 | 0.9663 | −0.77 | 0.003 | −0.0091 | 0.8711 | −0.58 | 0.04 |
| Weifang | −0.0107 | 1.0049 | −0.66 | 0.010 | −0.0090 | 0.8924 | −0.60 | 0.04 |
| Yanzhou | −0.0059 | 0.8291 | −0.74 | 0.005 | −0.0043 | 0.7289 | −0.58 | 0.04 |
© 2020 by the authors. Licensee MDPI, Basel, Switzerland. This article is an open access article distributed under the terms and conditions of the Creative Commons Attribution (CC BY) license (http://creativecommons.org/licenses/by/4.0/).
Share and Cite
MDPI and ACS Style
Wang, Z.; Guo, P.; Wan, H.; Tian, F.; Wang, L. Integration of Microwave and Optical/Infrared Derived Datasets from Multi-Satellite Products for Drought Monitoring. Water 2020, 12, 1504. https://doi.org/10.3390/w12051504
AMA Style
Wang Z, Guo P, Wan H, Tian F, Wang L. Integration of Microwave and Optical/Infrared Derived Datasets from Multi-Satellite Products for Drought Monitoring. Water. 2020; 12(5):1504. https://doi.org/10.3390/w12051504
Chicago/Turabian StyleWang, Zhengdong, Peng Guo, Hong Wan, Fuyou Tian, and Linjiang Wang. 2020. "Integration of Microwave and Optical/Infrared Derived Datasets from Multi-Satellite Products for Drought Monitoring" Water 12, no. 5: 1504. https://doi.org/10.3390/w12051504
Note that from the first issue of 2016, this journal uses article numbers instead of page numbers. See further details here.