Glacier Changes and Their Linkage to the Climate-Topographic Context in the Borohoro Mountains, Tian Shan 1977–2018


Department of Geography, Texas State University, San Marcos, TX 78666, USA
Water 2020, 12(5), 1502; https://doi.org/10.3390/w12051502
Submission received: 6 March 2020
/
Revised: 14 May 2020
/
Accepted: 21 May 2020
/
Published: 24 May 2020
(This article belongs to the Section Hydrology)
Abstract
:Against the backdrop of climate change and socio-ecological sustainability, studying glacier changes provides essential knowledge to the basic water needs and security for regions and populations under such threats, such as Central Asia. Little attention has focused on glaciers in the northern periphery of the Chinese Tian Shan. This study aims to map a recent glacier inventory and examine the glacier area shrinkage and surface elevation change for the central massif of the Borohoro Mountains in the past 41 years. Using declassified Hexagon images (1977), Landsat 5 TM (1994 and 2007), Sentinel 2A (2018) and altimetry data from the Ice, Cloud and Land Elevation Satellite (ICESat) over 2003–2009 with the 30-m Shuttle Radar Topography Mission (SRTM) digital elevation model, multi-temporal glacier fluctuations and the influence of topographic and climatic factors were investigated. Results show that the glacier area decreased from 287.5 ± 8.2 km2 in 1977 to 215.8 ± 4.1 km2 in 2018, at a rate of 0.61 ± 0.01% year−1. Glacier disintegration has led to a gradual increase in the number of glaciers and reached 224 glaciers in 2018. The shrinkage was at the highest rate during the 1994–2007 period and the smallest during 1977–1994. Glacier size, hypsometry, and median, maximum, and range of elevation are the most significantly correlated parameters with the relative area change. The surface elevation changes from two of the largest glaciers revealed a stronger thinning on the southern slope compared to the northern slope. These observations of glacier loss are primarily driven by the marked warming trend since the 1970s and confirmed with the overall pattern of glacier retreat in the Tian Shan from previous studies.
1. Introduction
As reported in the Intergovernmental Panel on Climate Change (IPCC) special report, mountain surface air temperatures show warming at an average rate of 0.3 ± 0.2 °C/decade, outpacing the global average warming rate of 0.2 ± 0.1 °C/decade [1]. This enhanced warming has induced changes to elements and processes in the atmosphere, hydrosphere and biosphere in the mountain environment, and perhaps most prominently, in the cryosphere (glaciers, snow cover, and permafrost) that has responded sensitively to the changing climate. Scientific evidence has reached a coherent conclusion that global warming has caused an overall mountain glacier recession since the Little Ice Age (~1850AD), with an accelerated rate entering the 21st century [2,3,4]. Among major mountain areas in the world, the High Mountain Asia (HMA) represents the highest concentration of glaciers outside of the polar regions and exemplifies heterogeneous glacier mass budget with a contrasting pattern within the region [5]. The HMA contains the headwater of many large rivers such as Brahmaputra, Indus, Syr Darya, Amu Darya, Mekong, Ganges, Yellow and Yangtze Rivers. Knowing the glacier fluctuations in this key region is essential because of their importance to the water supply for over a billion people downstream and their further contribution to sea level rise and impacts on global circulation to a larger extent.
In the most northern periphery of the HMA lies the Tian Shan mountains which run approximately 2500 km across Kazakhstan, Kyrgyzstan, Uzbekistan, and Xinjiang Uyghur Autonomous Region of China. The mountain ranges are among the most glaciated landscapes of Eurasia and possess a total of 15,953 glaciers covering 15,416 km2 [6,7]. Previous work has revealed that glacier shrinkage has been observed across different ranges of the Tian Shan [8]. Farinotti et al. [9] used different independent approaches and estimated that the overall decrease in total glacier mass from 1961 to 2012 to be 27 ± 15% in the Tian Shan, which is about four times as much as the global average. Due to the high continentality, the region is characterized by an arid and semi-arid climate, with limited mean annual precipitations [8,10,11]. The retreating glaciers at first increase glacier runoff due to higher melt rates and provide significant water supply for the ecosystem and socioeconomic uses, but sustained area loss, as projected in many studies [9,12,13,14,15], leads to declining melt area and glacier runoff. Furthermore, the eastern portion of the Tian Shan (equivalent to Chinese Tian Shan) and the western Tian Shan are both recognized as the World Heritage Site, which signifies its natural, societal, and aesthetic values and the need for a better understanding of its changes.
Despite the vast spatial coverage and the importance of glaciers in its natural and social systems, continuous ground-based observations of glacier status and change have been limited in the Tian Shan, mostly due to the inaccessibility. The Chinese Urumqi Glacier No.1 and Kyrgyz Tsentralniy Tuyuksuyskiy Glacier are the only two reference glaciers in the whole of Central Asia with more than 30 years of ongoing glaciological mass-balance measurements, according to the World Glacier Monitoring Service (https://wgms.ch/products_ref_glaciers/). Most existing studies have relied on the abundance of secondary data sources including global glacier inventory such as Global Land Ice Measurements from Space (GLIMS) [16], the first and second Chinese Glacier Inventory (CGI) [17,18], historical topographic maps, and multi-temporal and multispectral satellite data, e.g., [6,19,20,21,22,23]. As quality and accessibility could be an issue for the inventory data and topographic maps, remotely sensed images are among the most commonly used and effective sources in detecting glacier changes. Admittedly, the spatial resolution of the legacy images for historical times may often be too coarse, but the declassification of U.S. military intelligence satellites images (e.g., Corona and Hexagon) by the U.S. Geological Survey (USGS) since 1992 has shed light on high resolution and extending the time back to the 1960s and 1970s [22,24,25,26]. Few studies have utilized the declassified images in the Chinese Tian Shan.
The focus of this study is on the Borohoro Mountains, a range located in the northern periphery of the Chinese Tian Shan. A number of publications on recent glacier changes have targeted regions of different sizes in the Kyrgyz/Kazakh part, for example, the Ala Archa [27], the Ili-Kungöy [20,22], and the Terskey Ala-Too [6,28], and the central and eastern part of the Chinese Tian Shan, e.g., [29,30,31,32]. Less attention has been paid to the Borohoro. Monitoring glaciers at multiple time intervals with the best available remotely sensed data of the region will fill the gap in current literature and provide fundamental knowledge about how glaciers have responded to climate change and possible future trends. Overall, the study aims to (1) generate an updated inventory of glaciers for the central Borohoro Mountains as of 2018; (2) reveal the temporal changes of glacier extents between 1977, 1994, 2007, and 2018, and (3) examine the potential effects of climatic and topographic factors to their changes in the past four decades.
2. Study Area
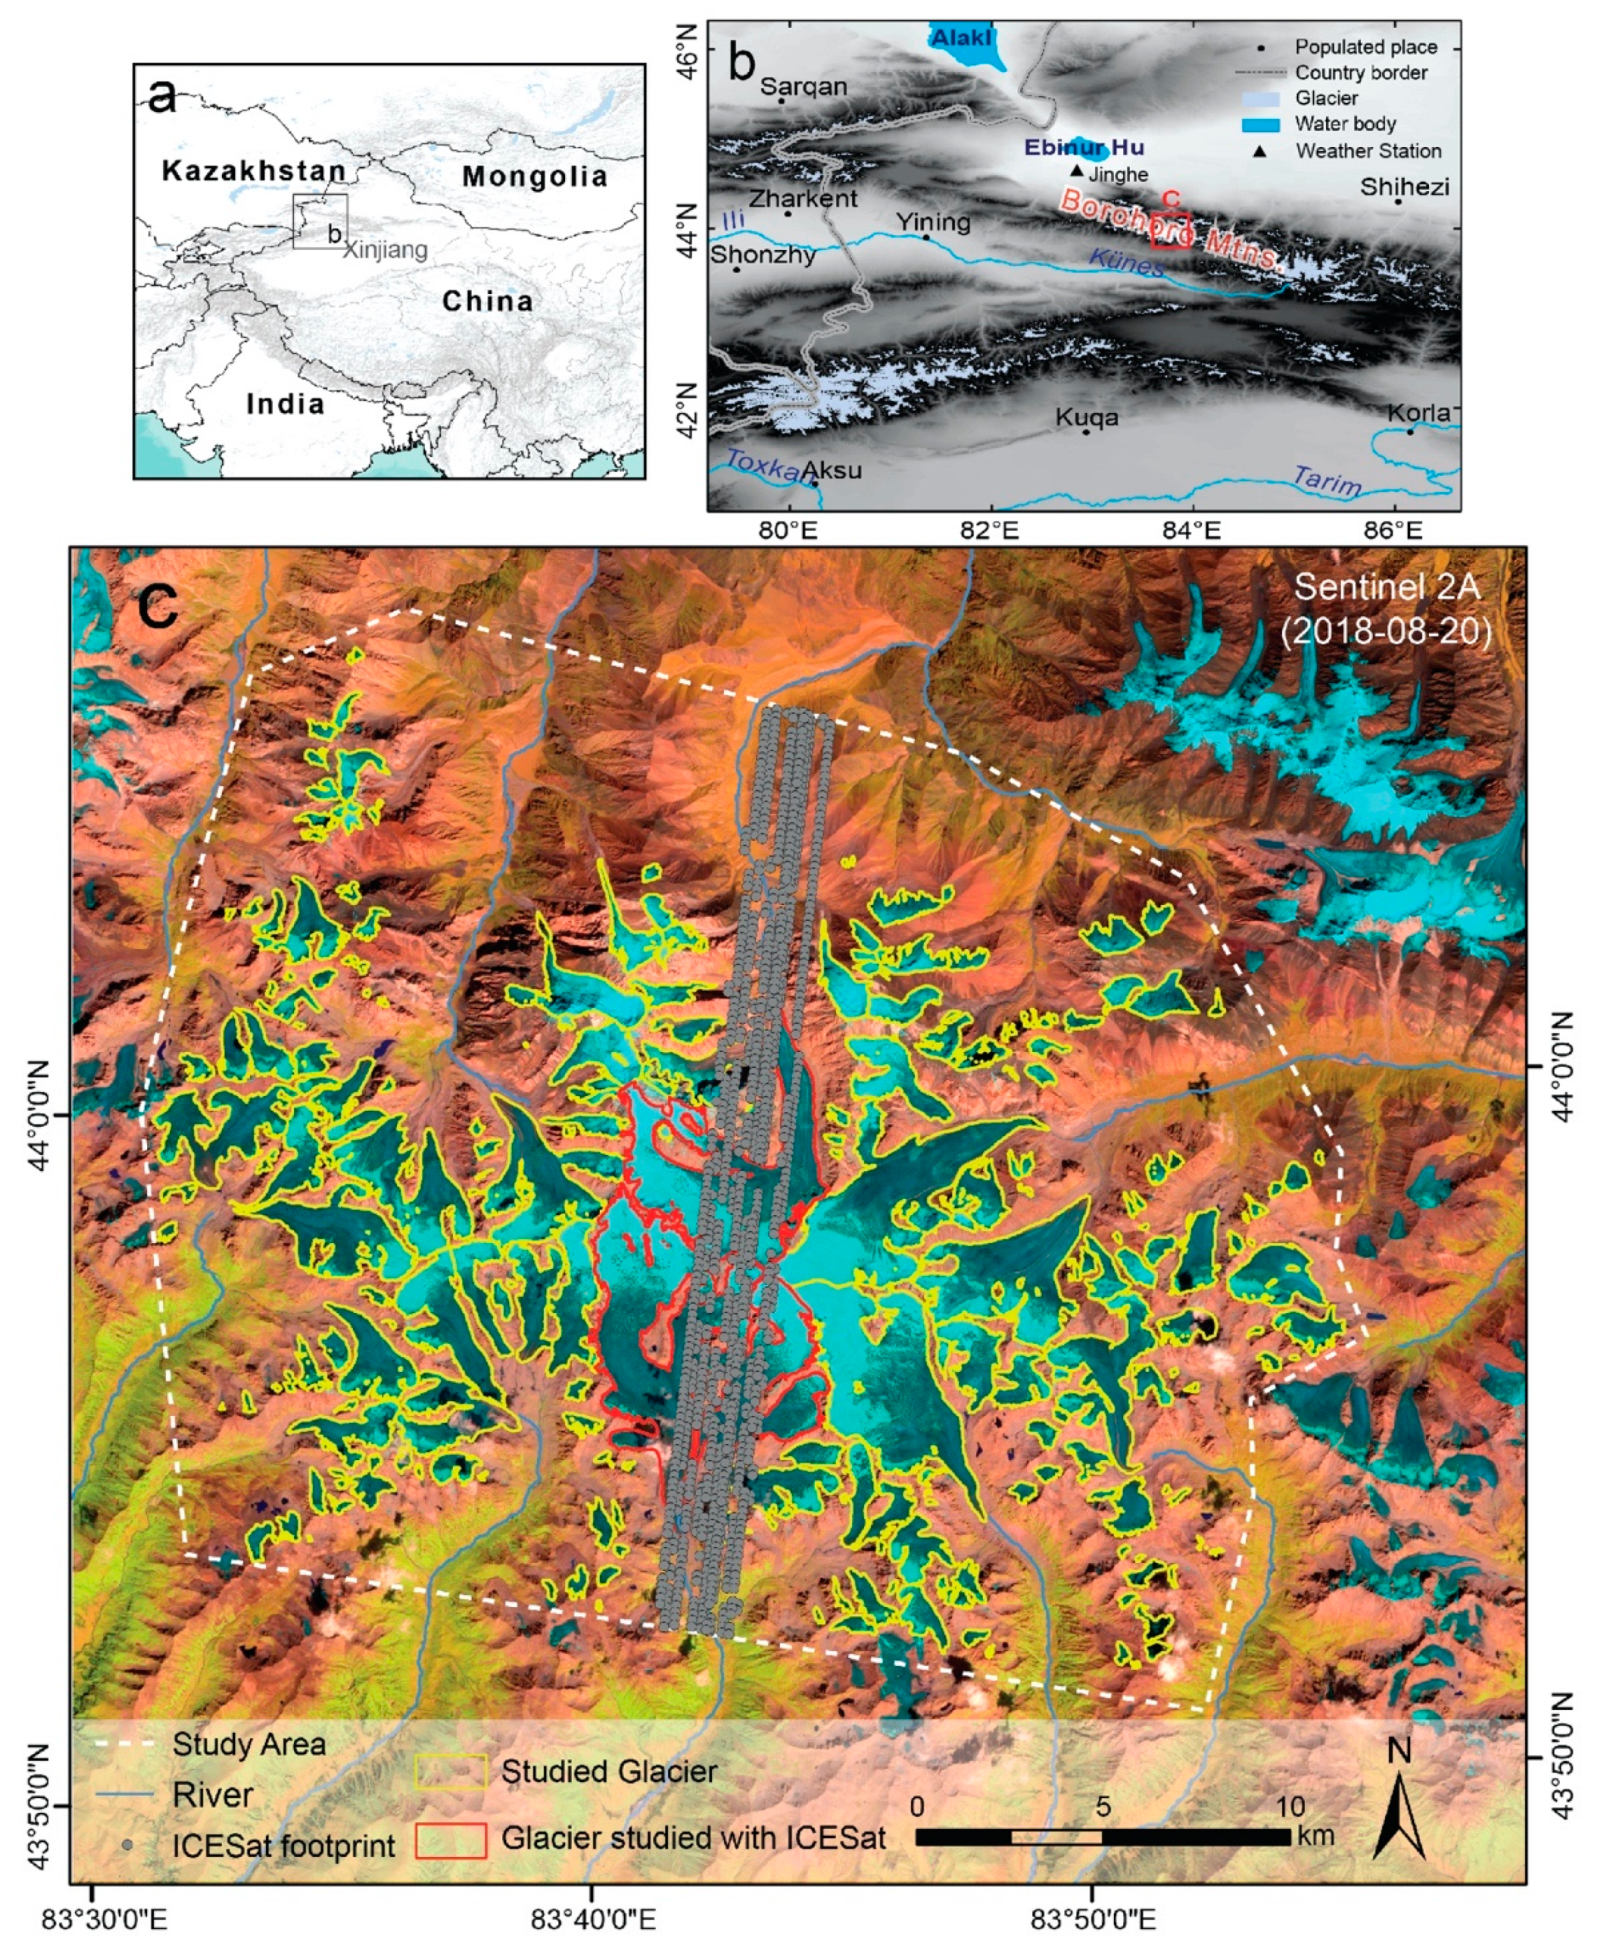
The Tian Shan, located in the hinterland of Eurasia, is a gigantic mountain range that originated from one of the largest intra-continental orogens in the world in the Paleozoic (~360–205 Ma) [33]. The modern landscapes were built by episodic faulting and uplift during the Cenozoic (~65 Ma) but have continued to be modified up until today [34]. To its south lie the Tibet-Pamir Plateau and the Tarim Basin, and to the north are the Junggar Basin and the Altai Mountains. The mountain ranges across the Tian Shan are characterized by diverse geology, topography, climate, and vegetation in its intervening mountains and valleys. The Borohoro Mountains are located at the northwestern periphery of the eastern Tian Shan (also the Chinese Tian Shan), with greener forests/steppes in the Ili Valley to the south and the drier oasis-desert ecosystem to the north (Figure 1). The bedrock of the mountain is mainly made of Late Carboniferous (305–300 Ma) granites and metamorphics, from the Borohoro pluton [33]. The glacier-capped mountain elevations range from 3000 m to 4700 m in the studied region. Ridgelines of the Borohoro divides two major river basins in Xinjiang, China: the Ili River Basin to the south and the Junggar Inland Basin to the north [18]. Meltwater from glaciers contributes significantly to the runoff of hundreds of tributaries in these basins. The Jinghe River, a glacier-fed river adjacent to the Borohoro, was estimated to receive 74% of annual runoff that occurs in summer, a time when glacier ablation is high [35]. Indeed, glaciers comprise a key component in sustaining lives and the economy for this water-deficient region of Central Asia.
Due to its central location on the Eurasia landmass, a typical arid continental climate dominates the Borohoro. But, like most places in the Tian Shan, the striking topographic relief gives a variety of vertical climatic zones and associated landscape belts that ultimately transition into nival belts at the highest reach [36]. The prevailing wind of the mid-latitude westerlies delivers moisture from the Caspian Sea to the mountains. The southern flank of the Borohoro receives relatively high precipitation because the westward opening of the Ili Valley facilitates the entrance of moisture-laden air masses. The northern flank connects to a rain shadow region formed by the Dzungarian Alatau mountains in the west, and thus has less precipitation. In this range of the Tian Shan, precipitation occurs mostly in summer caused by convective events and has been increasing over the past decades [8,11]. The annual temperature variation is pronounced, creating strong seasonality. Under the control of the Siberian High, winter is featured with cold-dry climate. According to the closest meteorological station, the Jinghe station, which is situated at 320 m a.s.l. and approximately 100 km northwest of the studied glaciers (Figure 1b), the mean annual precipitation and average air temperature are 251.9 mm and 7.8 °C, respectively [37]. However, detailed climatological data are sparse at higher elevations.
3. Materials and Methods
3.1. Satellite Data
Three criteria were applied when selecting satellite images for the study area: (1) the acquisition time around the end of the ablation season (late August and September), (2) minimal seasonal snow, and (3) minimal cloud cover. Only a limited number of images are qualified. Four images were selected from the declassified Hexagon imagery, Landsat 5 TM, and Sentinel 2A collections, covering a temporal range of four decades and spaced with similar time intervals (1977–1994–2007–2018) (Table 1). They were obtained from the USGS web server (earthexplorer.usgs.gov). The 30 m Shuttle Radar Topography Mission (SRTM) digital elevation model (DEM) was also downloaded from the USGS for orthorectification and extraction of topographic parameters (Table 1).
The Sentinel 2A image of 20 August 2018 shows the best quality at the latest time and thus was used for producing the most recent inventory of glaciers in the Borohoro. It was also used as a base image for co-registration of other images. The short repeat interval (10 days at the equator) and high resolution (10 m in the visible and near-infrared bands, 20 m in the shortwave infrared bands) of the scenes has shown advanced glacier extraction since its launch in 2015 [38,39]. Two Landsat scenes (30 m resolution) are both from Landsat 5 TM Level-1TP collection, acquired on 22 August 1994 and 10 August 2007, respectively. These radiometrically and geometrically corrected images, with minimum influence from snow and cloud and in the similar time of the ablation season, can greatly help to reduce uncertainties in the extraction of glaciers. The co-registration root-mean-square errors (RMSE) to the base image for 1994 and 2007 Landsat 5 images, respectively, are 15.6 m and 14.5 m using 32 and 35 ground control points (GCPs). The Hexagon KH-9 image is from the declassified archive of the U.S. reconnaissance satellite KH-9 operated from 1973 to 1980, and some images are previously scanned and available to download free of charge by USGS. The selected film was acquired on 26 September 1977, extending the temporal coverage to the 1970s comparable to the time when the first Chinese Glacier Inventory [17] was compiled. The size of the film is 9 × 18 inch, covering a footprint at 125 × 250 km2 with a resolution of ~8 m. Because of no terrain correction, the Hexagon image needs to be orthorectified and co-registered. A subset of the film was generated for the Borohoro study area, and following a commonly used two-steps approach [26,40,41], the subset was applied with the first step of projective transformation using GCPs and the SRTM DEM and then the second step of a spline adjustment in ArcGIS. The RMSE of the co-registration using 60 GCPs is calculated as ~1 m. All of the above images were cropped to the study area and projected into the World Geodetic System (WGS) 1984 Universal Transfer Mercator (UTM) Zone 44N in ArcGIS Pro.
3.2. Glacier Mapping
A semi-automated approach was applied to extract glacier boundaries and assisted with the use of band combinations (11-8-4 for Sentinel 2A MSI and 7-4-3 for Landsat 5 TM) and Google Earth imagery. As the 20 August 2018 Sentinel 2A image is at a higher resolution (10 m) and contains almost no impact from snow and cloud, it was used to generate a baseline inventory of glaciers in the Borohoro at the first step. After resampling the 20 m shortwave infrared (SWIR) band (Band 11) to 10 m using bilinear interpolation, the MIS4/MIS11 (red/SWIR) band ratio was applied to effectively and efficiently distinguish glaciers from other surface features [38]. A threshold value of 1.8 for the ratio was determined to be the best after visually inspecting the results of multiple testing values. Then a median filter of 3 × 3 kernel size was used to smooth out the isolated pixels and fuzzy boundaries generating a binary image that was converted to a vector layer. The above image processing steps were performed in ERDAS Imagine® (Hexagon AB, Stockholm, Sweden). Manual adjustments are necessary to remove or modify the misclassified polygons and were conducted with the false color composite image underlaid in ArcGIS Pro. Major sources of misclassification come from proglacial lakes, shadows and glacial fronts where debris-cover exists occasionally. To separate polygon vectors into individual glacier entities, the mountain ridgelines were first derived using the drainage basin function with a reversed SRTM DEM, and then they were manually corrected especially at the upper part of glaciers to ensure the consistency with the outlines of the glacier inventory data (e.g., GLIMS www.glims.org/MapsAndDocs/guides.html). Glacier outlines of 1977, 1994, and 2007 were manually delineated from the Hexagon and Landsat 5 TM scenes, assuming the upper glacier divides did not change much during the investigated period. Major challenges in manual mapping occurred with the shadow problems and over-exposure (in Hexagon film), and were visually checked back and forth in Google Earth and the Sentinel 2A imagery.
Topographic information of each glacier entity was extracted by applying analysis tools in ArcGIS Pro. Glaciers of an area <0.02 km2 were eliminated to reduce the potential error of misinterpreted snow patches. In cases of a separated glacier during the investigated time period, multiple features were treated as one joint feature in correspondence with the pre-fragmentation extent. Parameters of each glacier, including area, minimum, maximum, and median elevation, elevation range, mean slope, mean aspect, and hypsometric integral (HI), were calculated based on the 2018 glacier outlines obtained and the 30 m SRTM DEM. In particular, the median elevation is the altitude dividing the glacier area (map area) into two equal areas; the mean aspect is calculated as the directional mean of the aspect from each raster cell within the glacier boundary. Descriptive statistics and quantitative relationships between the change of the glacier area and these parameters were explored.
3.3. Estimation of Elevation Change
To detect the interannual changes of the glacier surface elevation, data from the Ice, Cloud and Land Elevation Satellite (ICESat) were used and obtained from the U.S. National Snow and Ice Data Center (NSIDC; https://nsidc.org/data/icesat/data.html) (Table 1). The Geoscience Laser Altimeter System (GLAS) on board measured time series of surface elevation along its repeat-track orbits two or three times a year for the period of 2003–2009 [42]. Laser pulses were sent to sample elevations within a diameter of 70 m footprint spaced 172 m along the track [43]. In HMA, studies have been applied to GLAS/ICESat data to understand the elevation/mass/volume changes of glaciers [15,44,45]. In the studied Borohoro region, one track passed over two of the largest glaciers, as shown in Figure 1. But since the repeated track patterns did not overlap exactly, the comparison of ICESat elevations can only be achieved by using a reference elevation. In particular, the GLAS/ICESat Global Land Surface Altimetry HDF5 data (GLAH14, release 33) were used to compare with the 1 arcsec (~30 m) SRTM DEM, which represents elevations acquired in February 2000. Before differencing the two elevations, the ICESat values, which are referred to the TOPEX/POSEIDON Ellipsoid, need to be converted to the same ellipsoid of the SRTM data, which is the WGS84 Ellipsoid based on EGM96 Geoid, using the following formula proposed by [46]:
ICESat elevation = ICESat measurement − EGM96 Geoid − 0.7,
The 0.7 m is the vertical offset estimated between the two ellipsoids. When using the calculated ICESat elevation to subtract the SRTM elevation, dh can be obtained to represent the surface elevation change over time between the DEM source date (2000) and the ICESat acquisition time, with negative indicates thinning, positive indicates thickening and zero means no change. Elevation differences that exceed a threshold of 100 m (|dh| > 100 m) were excluded as outliers, as suggested in previous studies [44,47]. The filtered on-glacier data were further divided into two zones, the accumulation zone and the ablation zone, roughly separated by the transient snowline using the end of ablation season image of the 2018 Sentinel 2A [48].
3.4. Climate Data
To assess the impact of changing climate on glaciers, the 0.5° × 0.5° gridded, monthly University of Delaware air temperature and precipitation V5.01 dataset (provided by esrl.noaa.gov/psd) [49] was used because no station-based climate data are available in the study area. The latitude/longitude grid that overlaps most with the study area is centered at 43.75° N, 83.75° E (Table 1). Time series of monthly and annual average air temperature (T) and total precipitation (P) from 1900 to 2017 were retrieved for examining the climatic trends concerning the glacier changes.
3.5. Uncertainty Assessment
Sources of uncertainty and error in mapping glacier outlines are embedded in the mapping methods (either automated or manual) and issues such as co-registration of images and the use of the various satellite datasets with different resolutions and different clouds, seasonal snow, shadow, and debris cover conditions. It is crucial to include the error when reporting results [50,51]. Previous studies have suggested different methods to perform error analysis, including both qualitative and quantitative approaches [50]. The lack of higher resolution data in this study area prevented a qualitative comparison and the identification of misinterpretation in the derived outlines. But a statistical extrapolation method, the buffer method [41,52], was adopted here to estimate the uncertainty for each glacier. A buffer size of 5 m (half of a pixel) was applied to the 2018 Sentinel 2A glaciers; half of the RMSE values (15.6 m and 14.5 m) from the co-registration of Landsat 5 images to the Sentinel 2A base image were used for 1994 and 2007 outlines, respectively; and an uncertainty value of 10 m from the literature [41] was used for the Hexagon results. After calculation, the precision was determined as ~1.9%, ~2.6%, ~2.5%, and ~2.9% for 2018 Sentinel 2A, 2007 Landsat 5, 1994 Landsat 5, and 1977 Hexagon glaciers, respectively. When reporting multi-temporal changes of glacier areas, the error propagation (e) as in Equation (2) was applied to estimate the uncertainty from different sources (e1 and e2):
Uncertainties in the ICESat altimetry data primarily come from the system inconsistency between campaigns, the atmospheric interference, and possible terrain roughness within footprints [50]. Studies have shown that elevation biases are of centimeters to decimeter level during the lifetime of ICESat, which can be neglected [47]. By filtering the dh with a cutoff threshold of ±100 m, it helps to reduce the outliers of those footprints on clouds. Moreover, the surface heights were sampled on the large glaciers, as in this case, they may not be as variable as over the small glaciers because of the less rugged terrain.
4. Results
4.1. Glacier Characteristics
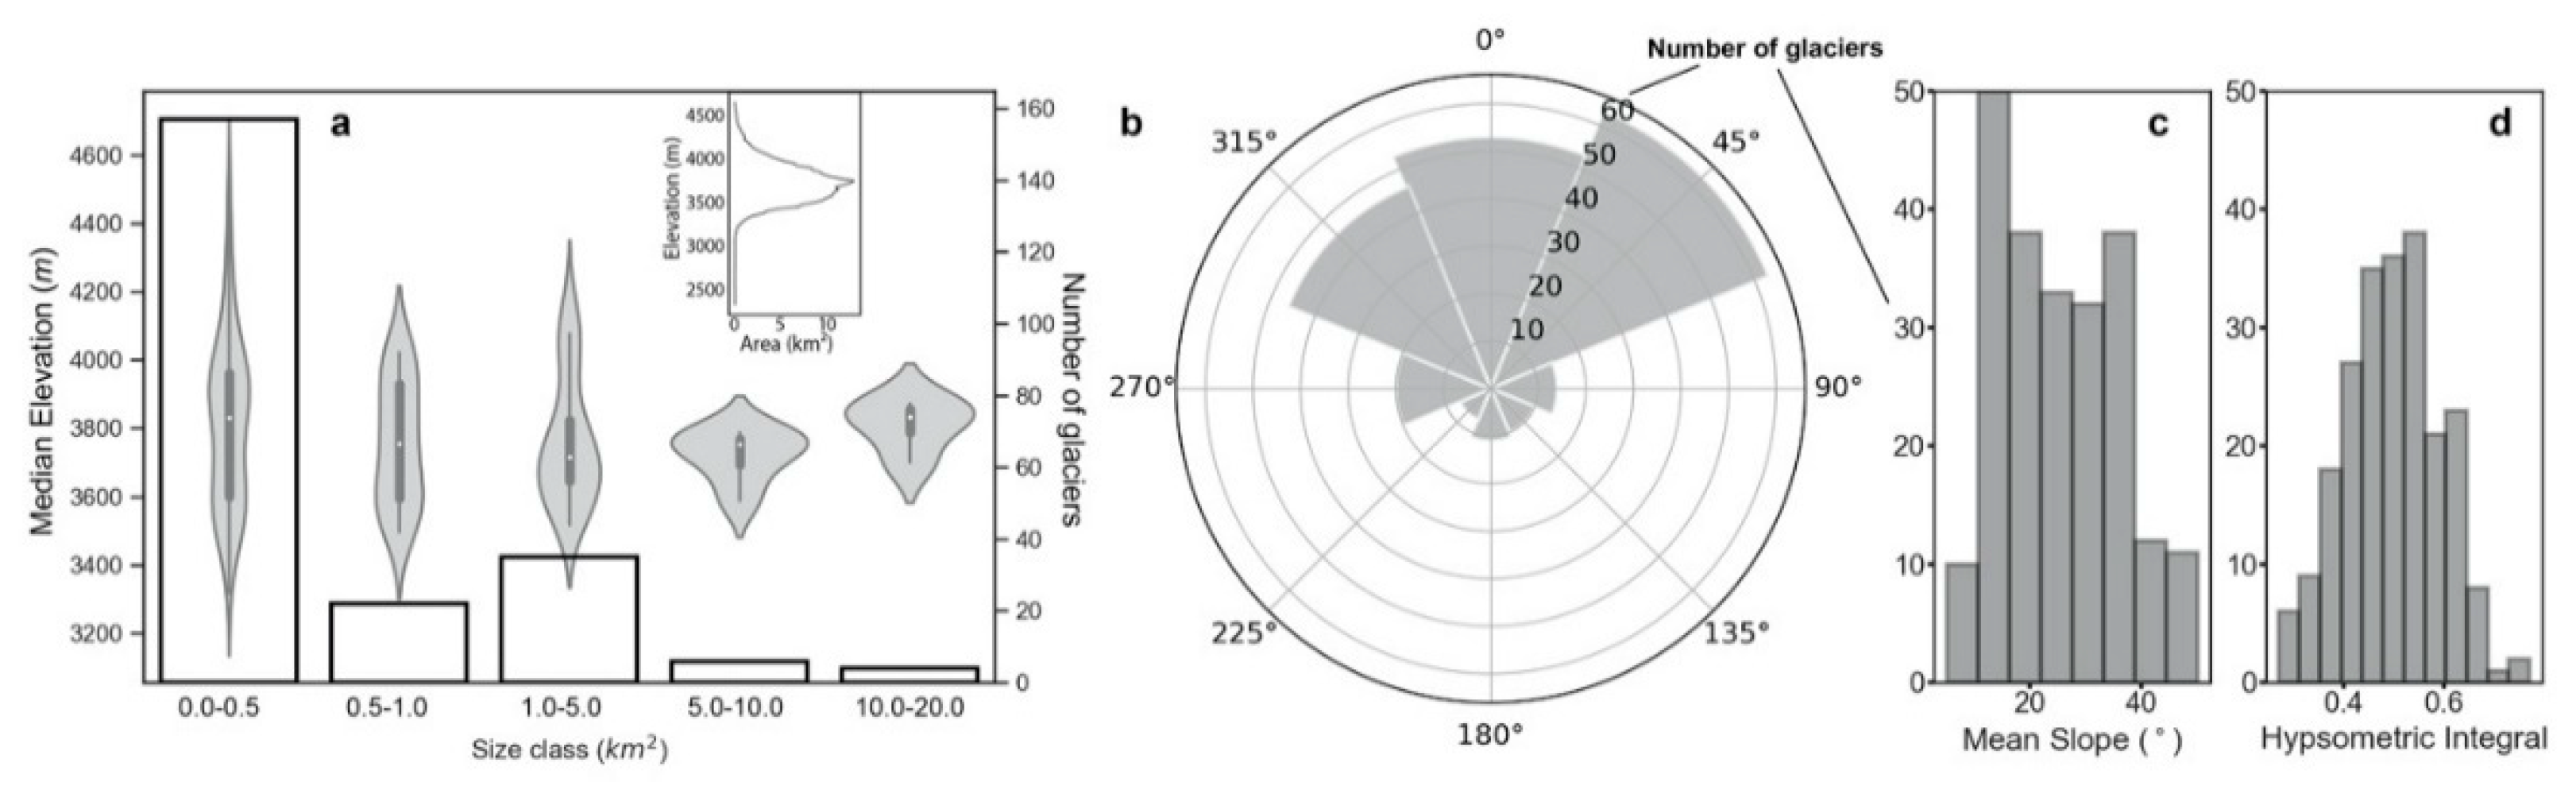
Based on the mapping from the 2018 Sentinel 2A base image, I identified 224 glaciers larger than 0.02 km2, which had a total area of 215.8 ± 4.1 km2 in the study area; 70% of the glaciers are smaller than 0.5 km2, while only 10 out of 224 glaciers are larger than 5 km2, comprising 47.5% of the total area (Table 2; Table S1). The largest one reached 17.8 km2, and along with the next three largest glaciers (15.5 km2, 14.3 km2, and 13.8 km2), they form the central massif of the area. The average glacier size is approximately 1.0 km2, which is similar to other published results in regions across the Tian Shan, e.g., 0.8 km2 in the Jinghe River Basin in 2004 [37], 0.8 km2 in Ala Archa in 2003 [27], 1.0 km2 in the eastern Terskey Ala-Too in 2003 [6], and 1.5 km2 in the Sary-Jaz River Basin in 2010 [53]. Small glaciers with a size <1 km2 outnumbered other size classes in this mid-latitude mountain range (Figure 2).
The lowest altitude that a glacier tongue reached is 2345 m a.s.l., while the highest peak of a glacier is 4680 m a.s.l. The hypsometric distribution (Figure 2a inset) suggests that most glacierized areas are concentrated in elevations ranging from 3600 m–3800 m a.s.l. As the median elevation is commonly used to estimate the balanced-budget equilibrium line altitude (ELA) [54], it is adopted in describing the altitudinal location of individual glaciers and later used in the topographic analysis, instead of using the mean elevation. The median elevation ranges from 3316 m to 4527 m a.s.l., with an average of 3797 m a.s.l. (Table 2). Across different glacier size classes, the smallest glaciers (0–0.5 km2) have a wide spread of their median elevations but a narrow elevation range, while the elevation range of the large glaciers (>5 km2) is much wider but their median elevation is similarly distributed (Figure 2a).
Other topographic parameters also reflect the characteristics of glaciers in the region. The mean aspect represents the orientation direction of each glacier, expressed using the azimuth angle. When the aspect is aggregated into eight compass directions, it is clear that most glaciers are generally facing north, including northwest (315°), north (0°), and northeast (45°) (Figure 2b). However, the largest glaciers are generally oriented toward the east (91.7°) (Table 2). The mean slope of all glaciers is 25.2°, but almost half of them are steeper than 30° (Figure 2c). The slope becomes gentler as the glacier size increases (Table 2), similar to other studies [40,55]. The hypsometric integral (HI) ranges 0–1 and indicates the shape of the hypsometric curve, with large values for a convex shape and small values for a concave shape. The HI values are normally distributed with a mean of 0.5, and the average HI is nearly the same across size classes (Figure 2d and Table 2).
4.2. Temporal Changes of Glacier Areas
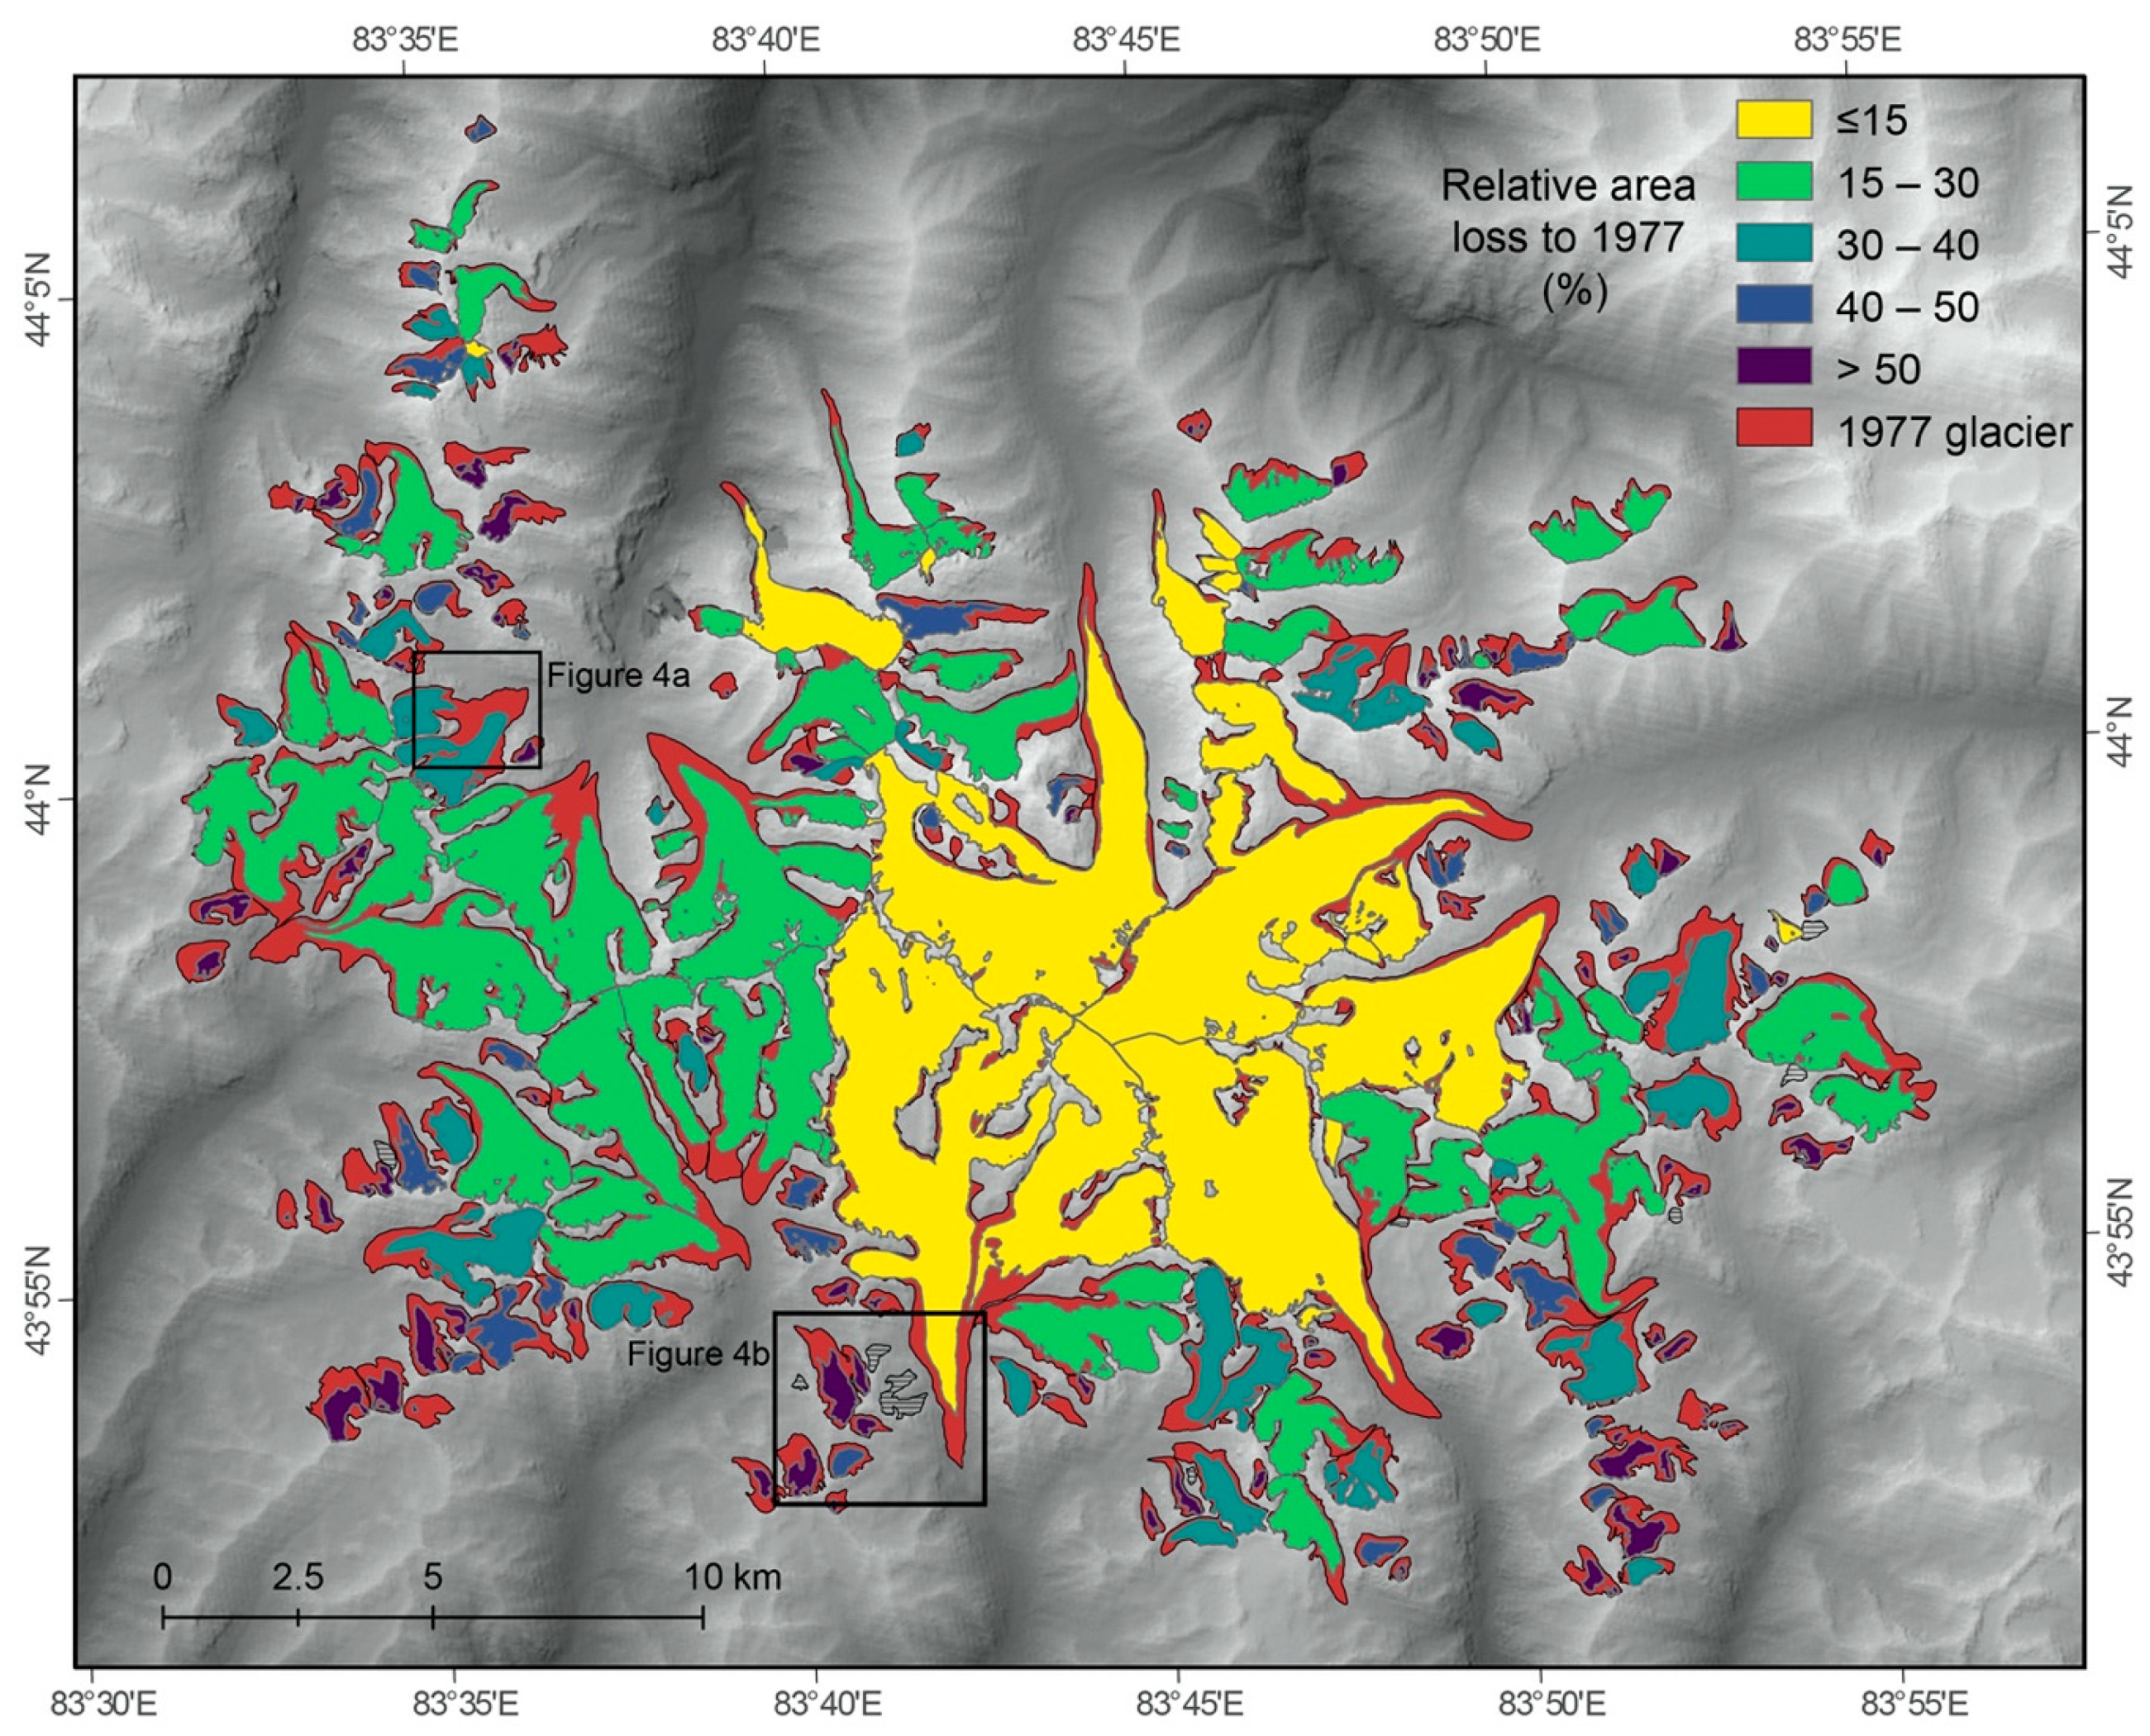
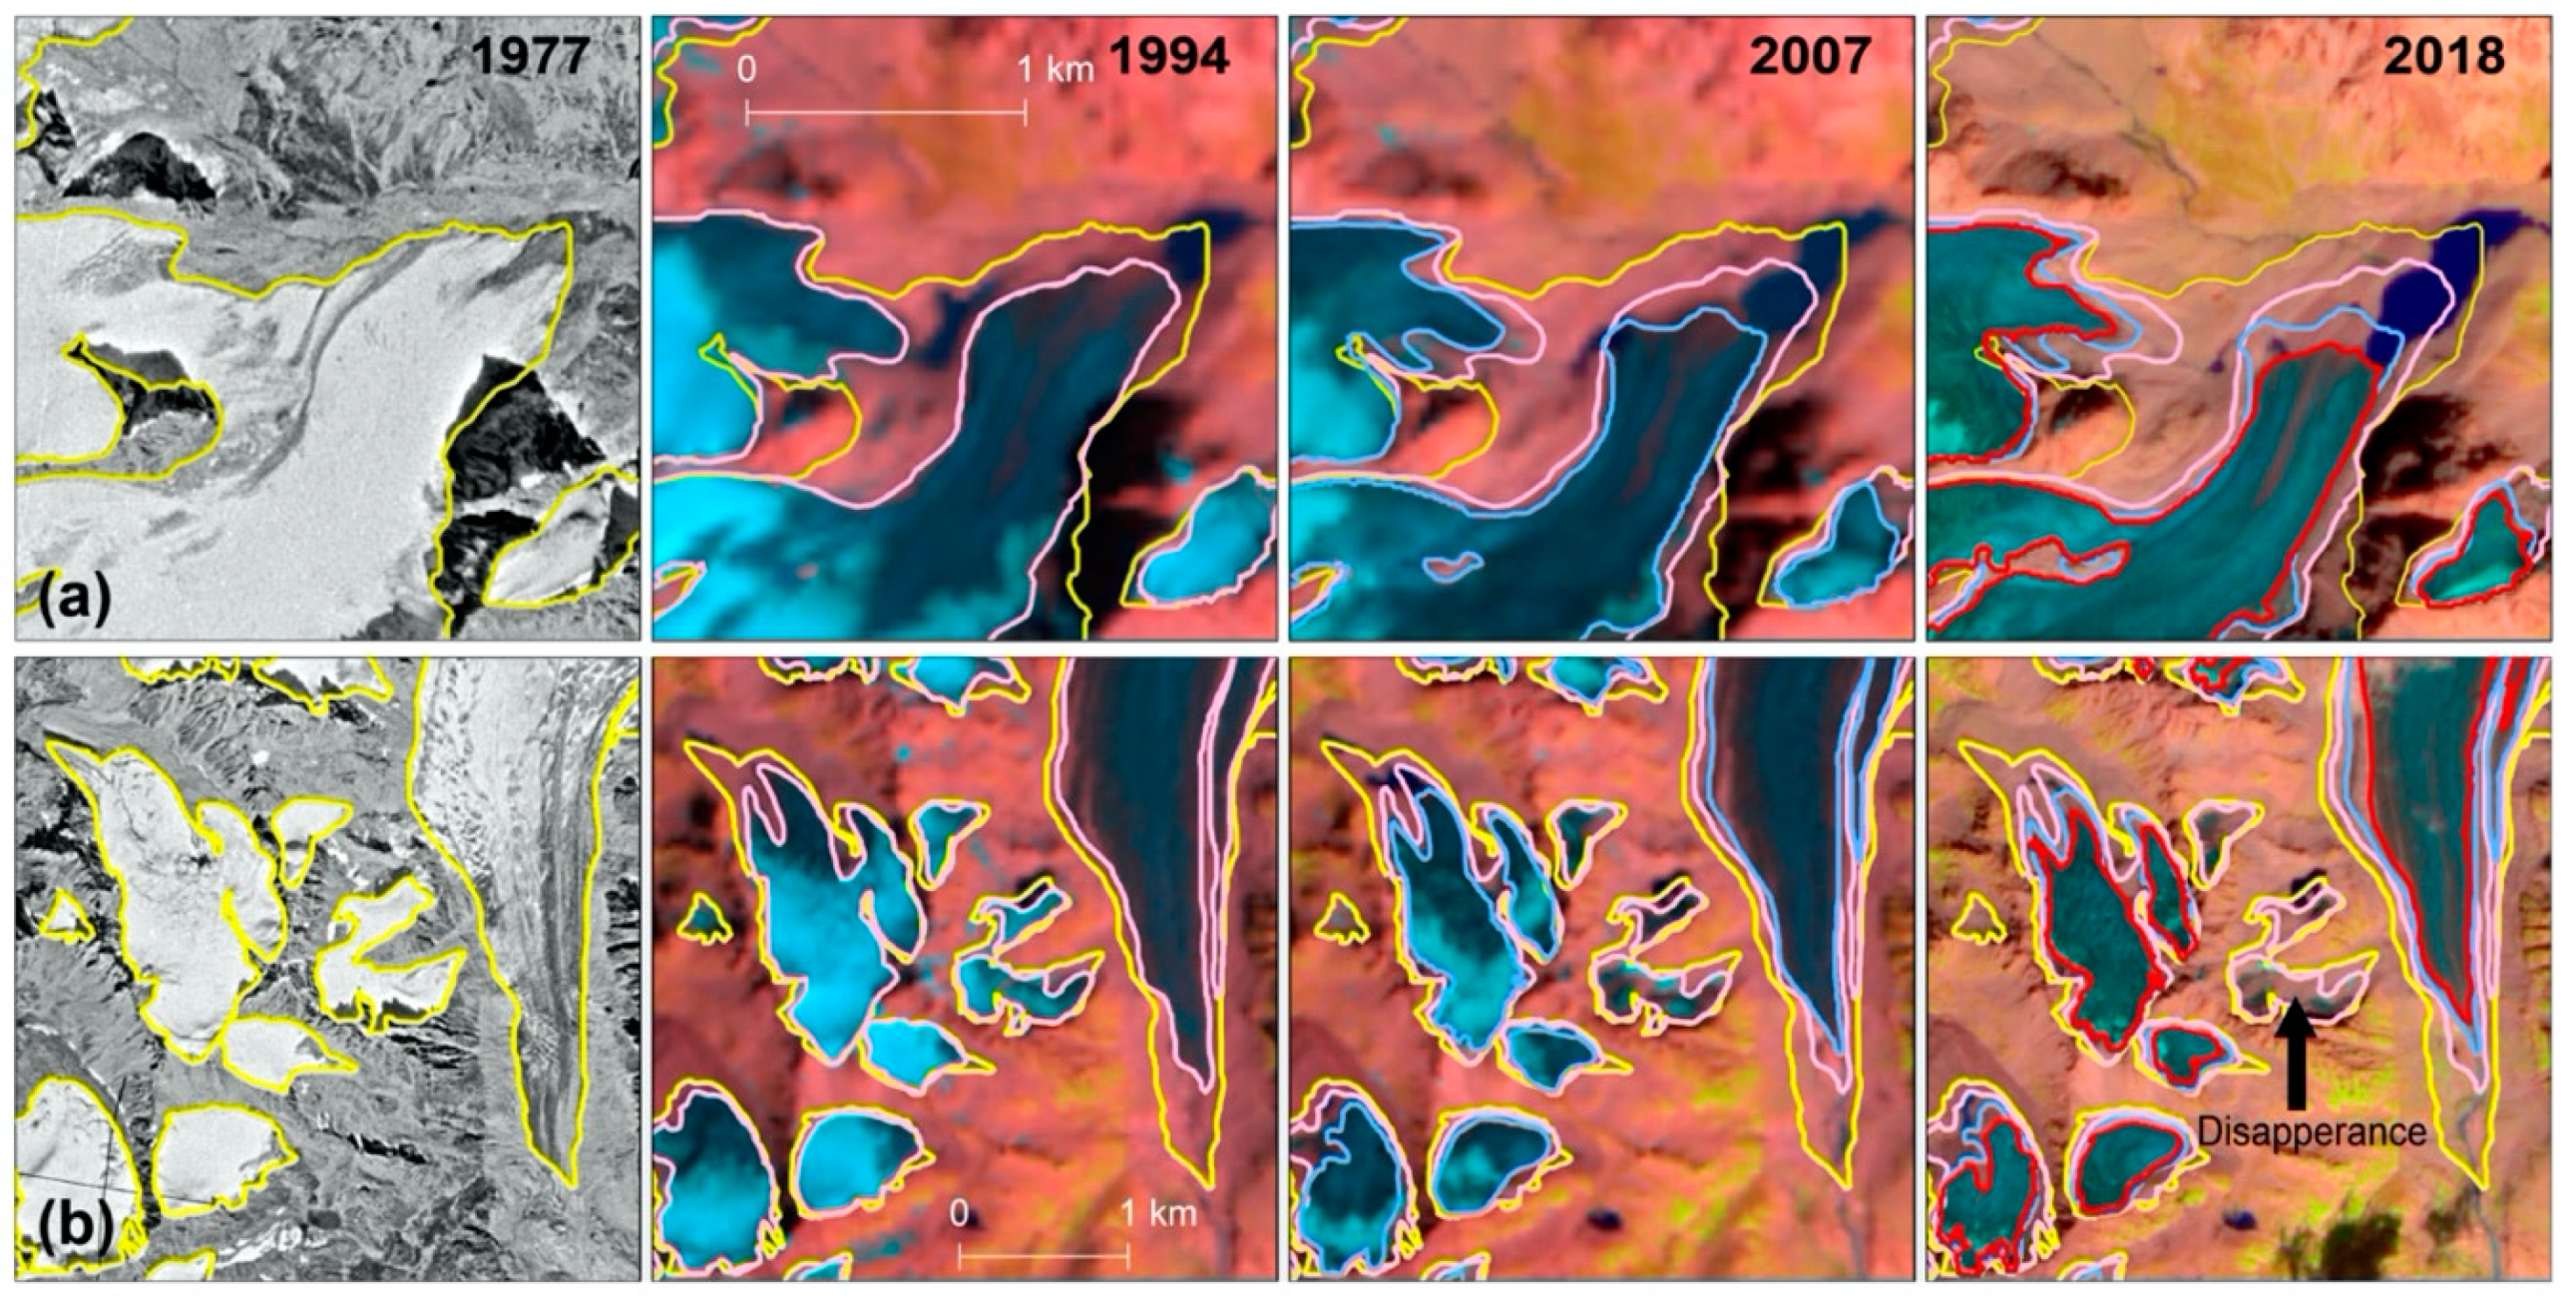
The temporal sequence of glacier area changes has been investigated for 1977, 1994, 2007, and 2018, and heterogeneous extent and rate of change are found during different periods of these past 41 years (Figure 3). From 1977 to 2018, the total area of glaciers decreased from 287.5 ± 8.2 km2 to 215.8 ± 4.1 km2, by 71.6 ± 9.2 km2 (24.9 ± 3.2%). During three sub-periods, it decreased 25.0 ± 10.5 km2 (8.7 ± 3.7%) from 1977 to 1994, then 30.8 ± 8.9 km2 (11.7 ± 3.4%) from 1994 to 2007, and 15.8 ± 7.3 km2 (6.8 ± 3.1%) from 2007 to 2018. The rate of recession is the highest (0.90 ± 0.07% year−1) for 1994–2007 and slowest (0.51 ± 0.03% year−1) for 1977–1994. The number of observed glaciers increased from 200 in 1977 to 224 in 2018, primarily due to the disintegration from large ice bodies to smaller entities (Table 3). As the glacial extent has been shrinking in the time series, new developments of land features, such as exposed rocks, water channels, debris cover, and proglacial lakes, can be observed with a comparison of satellite images most commonly in areas adjacent to glacier boundary (Figure 4a). The sequence of images also revealed that at some places small glaciers gradually disappeared in the past decades (Figure 4b).
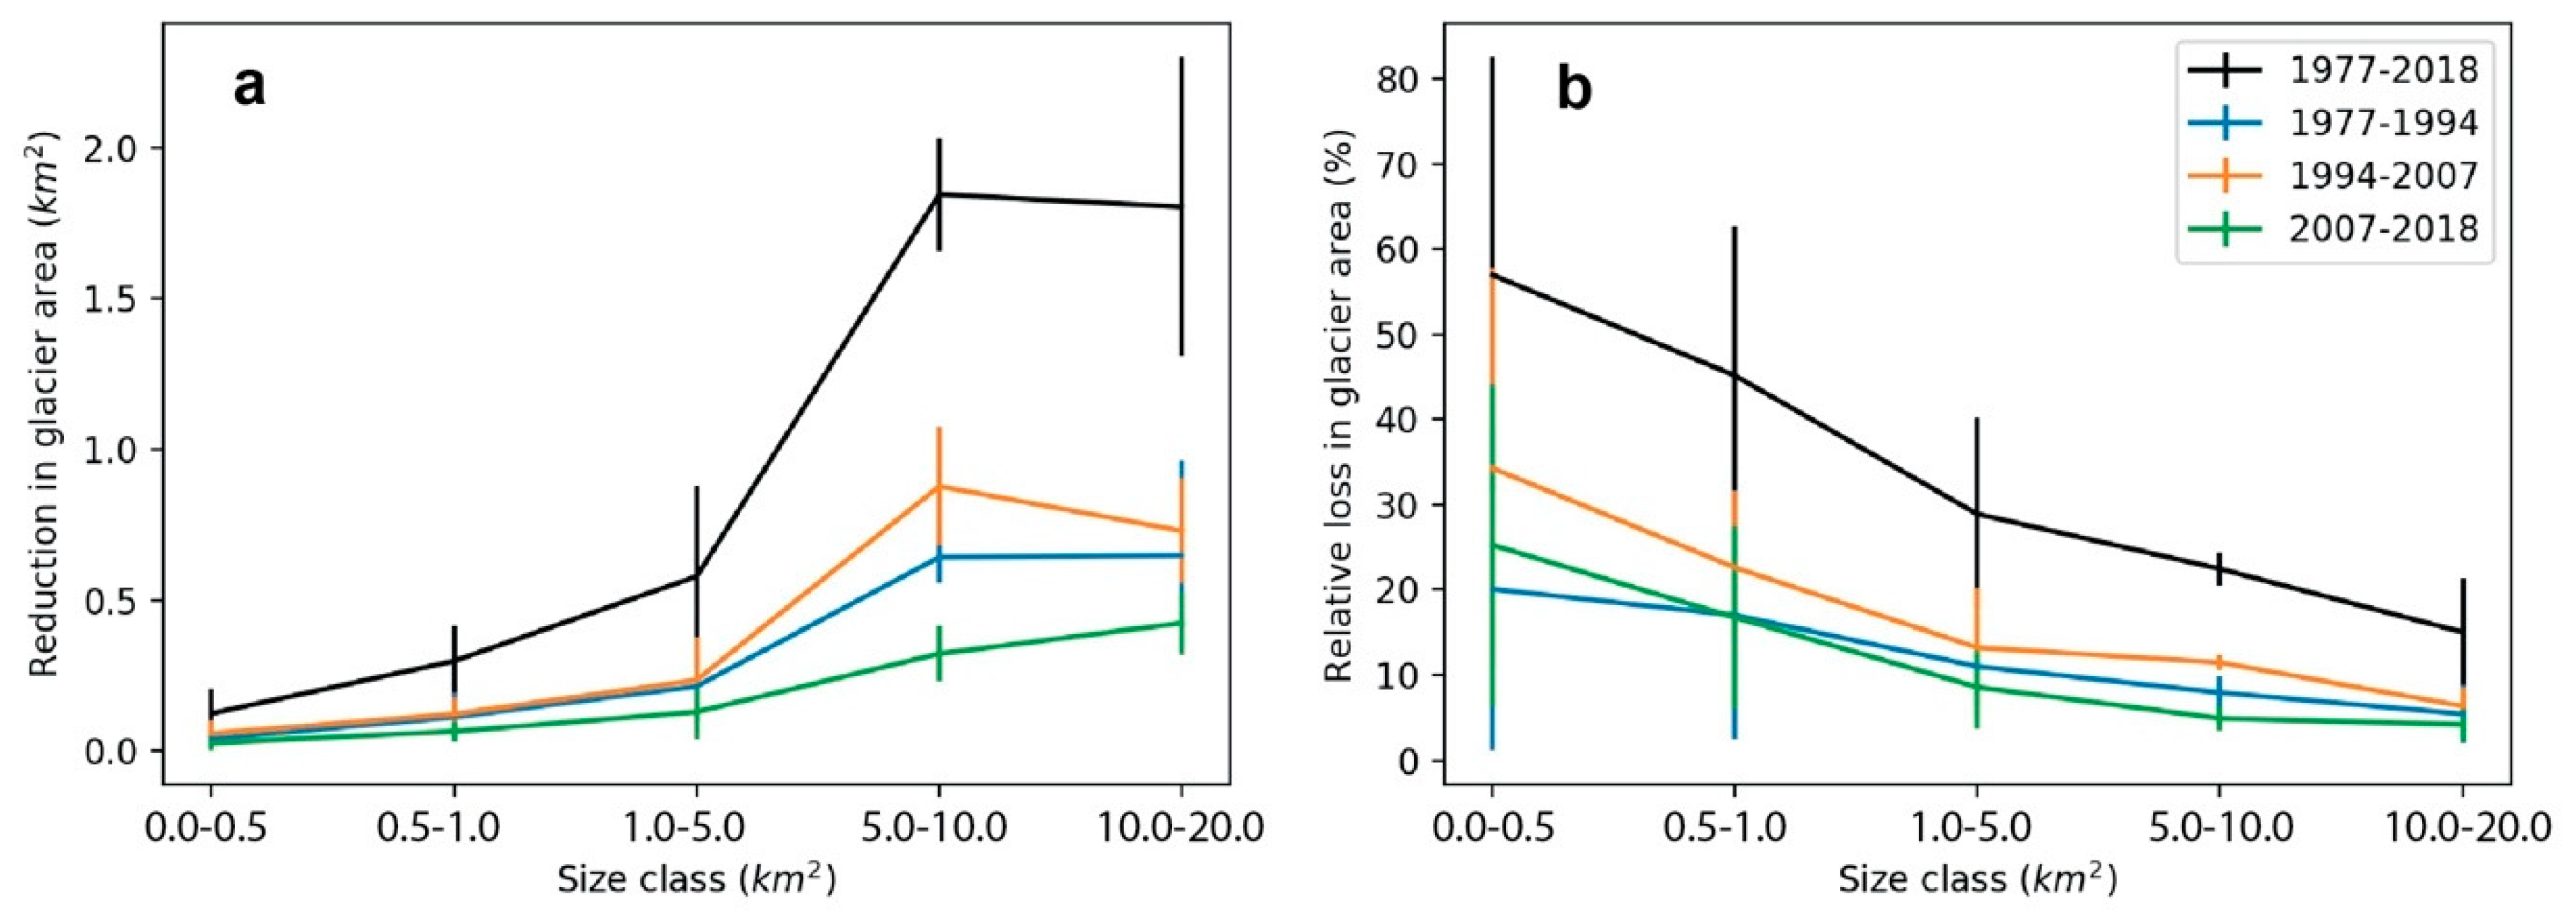
The absolute and relative area changes were further examined by glacier size classes as defined in 1977 (Figure 5). In cases of disintegration, the sum of the fragmented glacier areas in the later period was used to compare with the area of the glacier in an earlier year. It is shown that the large glaciers (>5 km2) had the greatest absolute area shrinkage (Figure 5a), while their relative percentage of change was the smallest among all size classes during any investigated time period (Figure 5b). The small glaciers (<1 km2) collectively contributed little to the total area loss, but the relative change was averaged to more than 50% between 1977 and 2018. They also expressed high variability in relative area loss, with a few with 100% loss in the smallest class (<0.5 km2), meaning a complete disappearance at some point in the past 41 years. The relative change is consistently higher in 1994–2007 than 1977–1994 and 2007–2018 for all size classes (Figure 5b).
4.3. Glacier Change and Topographic Factors
Topographic characteristics of individual glaciers, such as size, elevation, slope, aspect, and hypsometry, may influence the magnitude of glacier changes, e.g., [56,57,58,59]. As the change was defined as the loss from 1977 glaciers to the 2018 glaciers, the total number of 200 glaciers in 1977 was used to extract the topographic factors, including size, minimum, maximum, and median elevation, elevation range, mean slope, hypsometric integral, and the sine and cosine terms of the aspect [57,60]. It should be noted that for cases of disintegrated glaciers from 1977 to 2018, a merge rule of summing was applied to obtain the correspondent area in 2018 (a merge rule of averaging for other parameters); while for cases of disappeared glaciers from 1977 to 2018, a 100% relative area change was assigned.
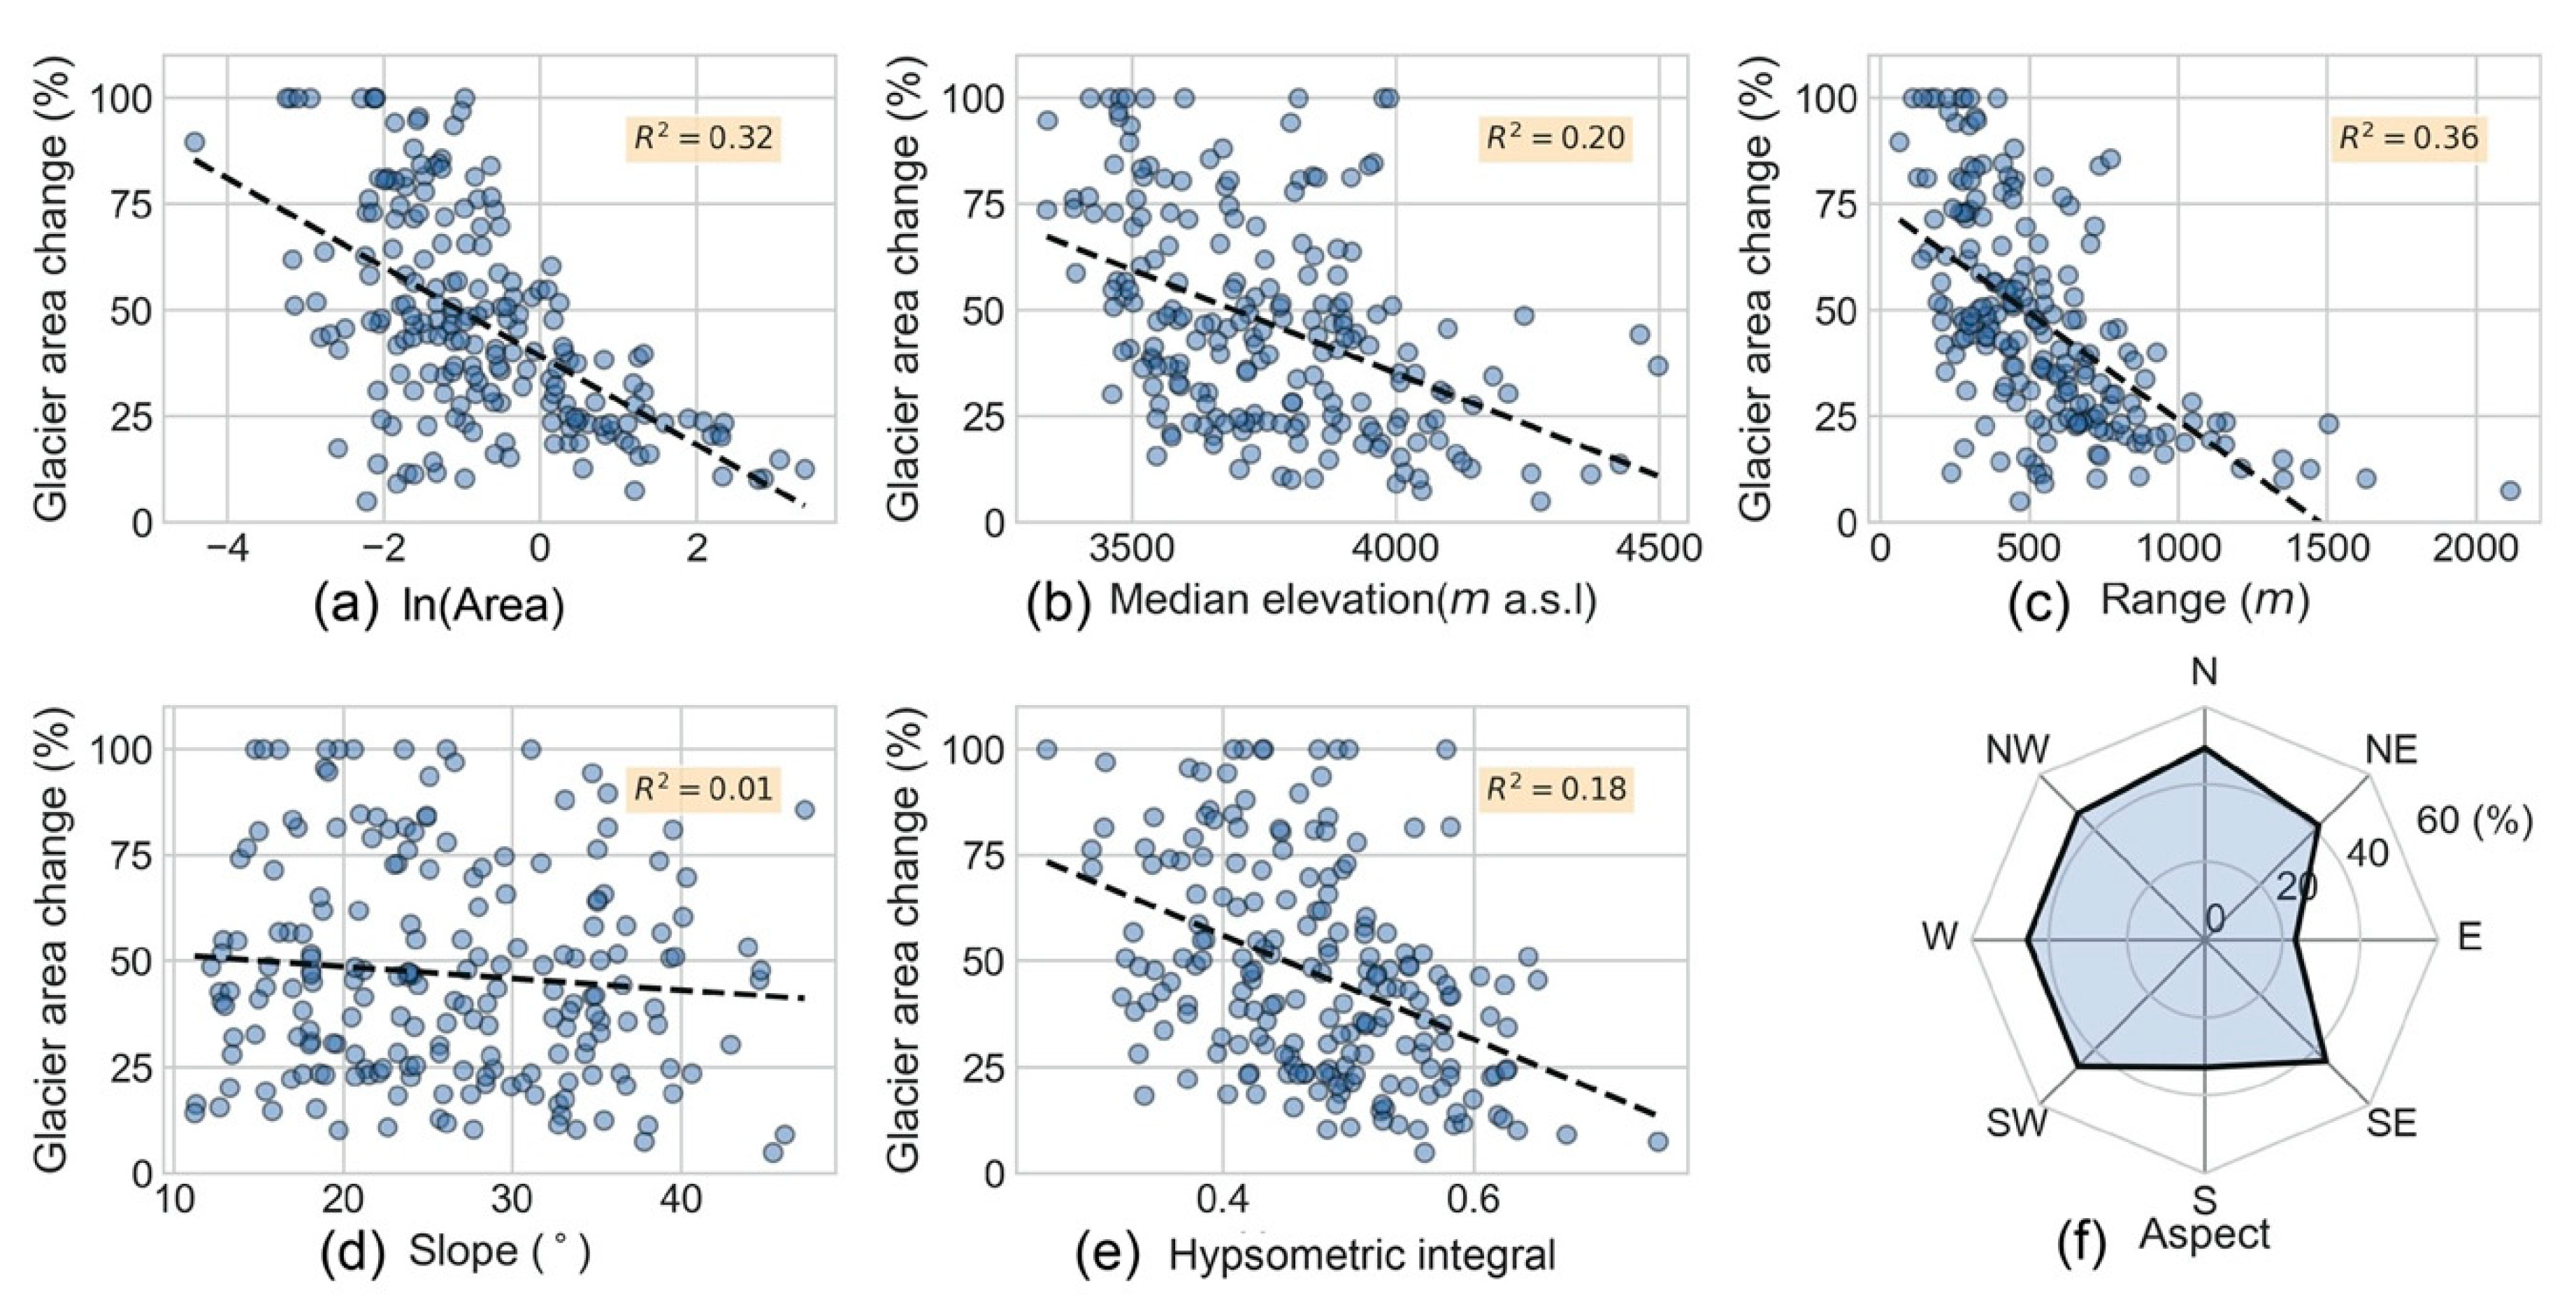
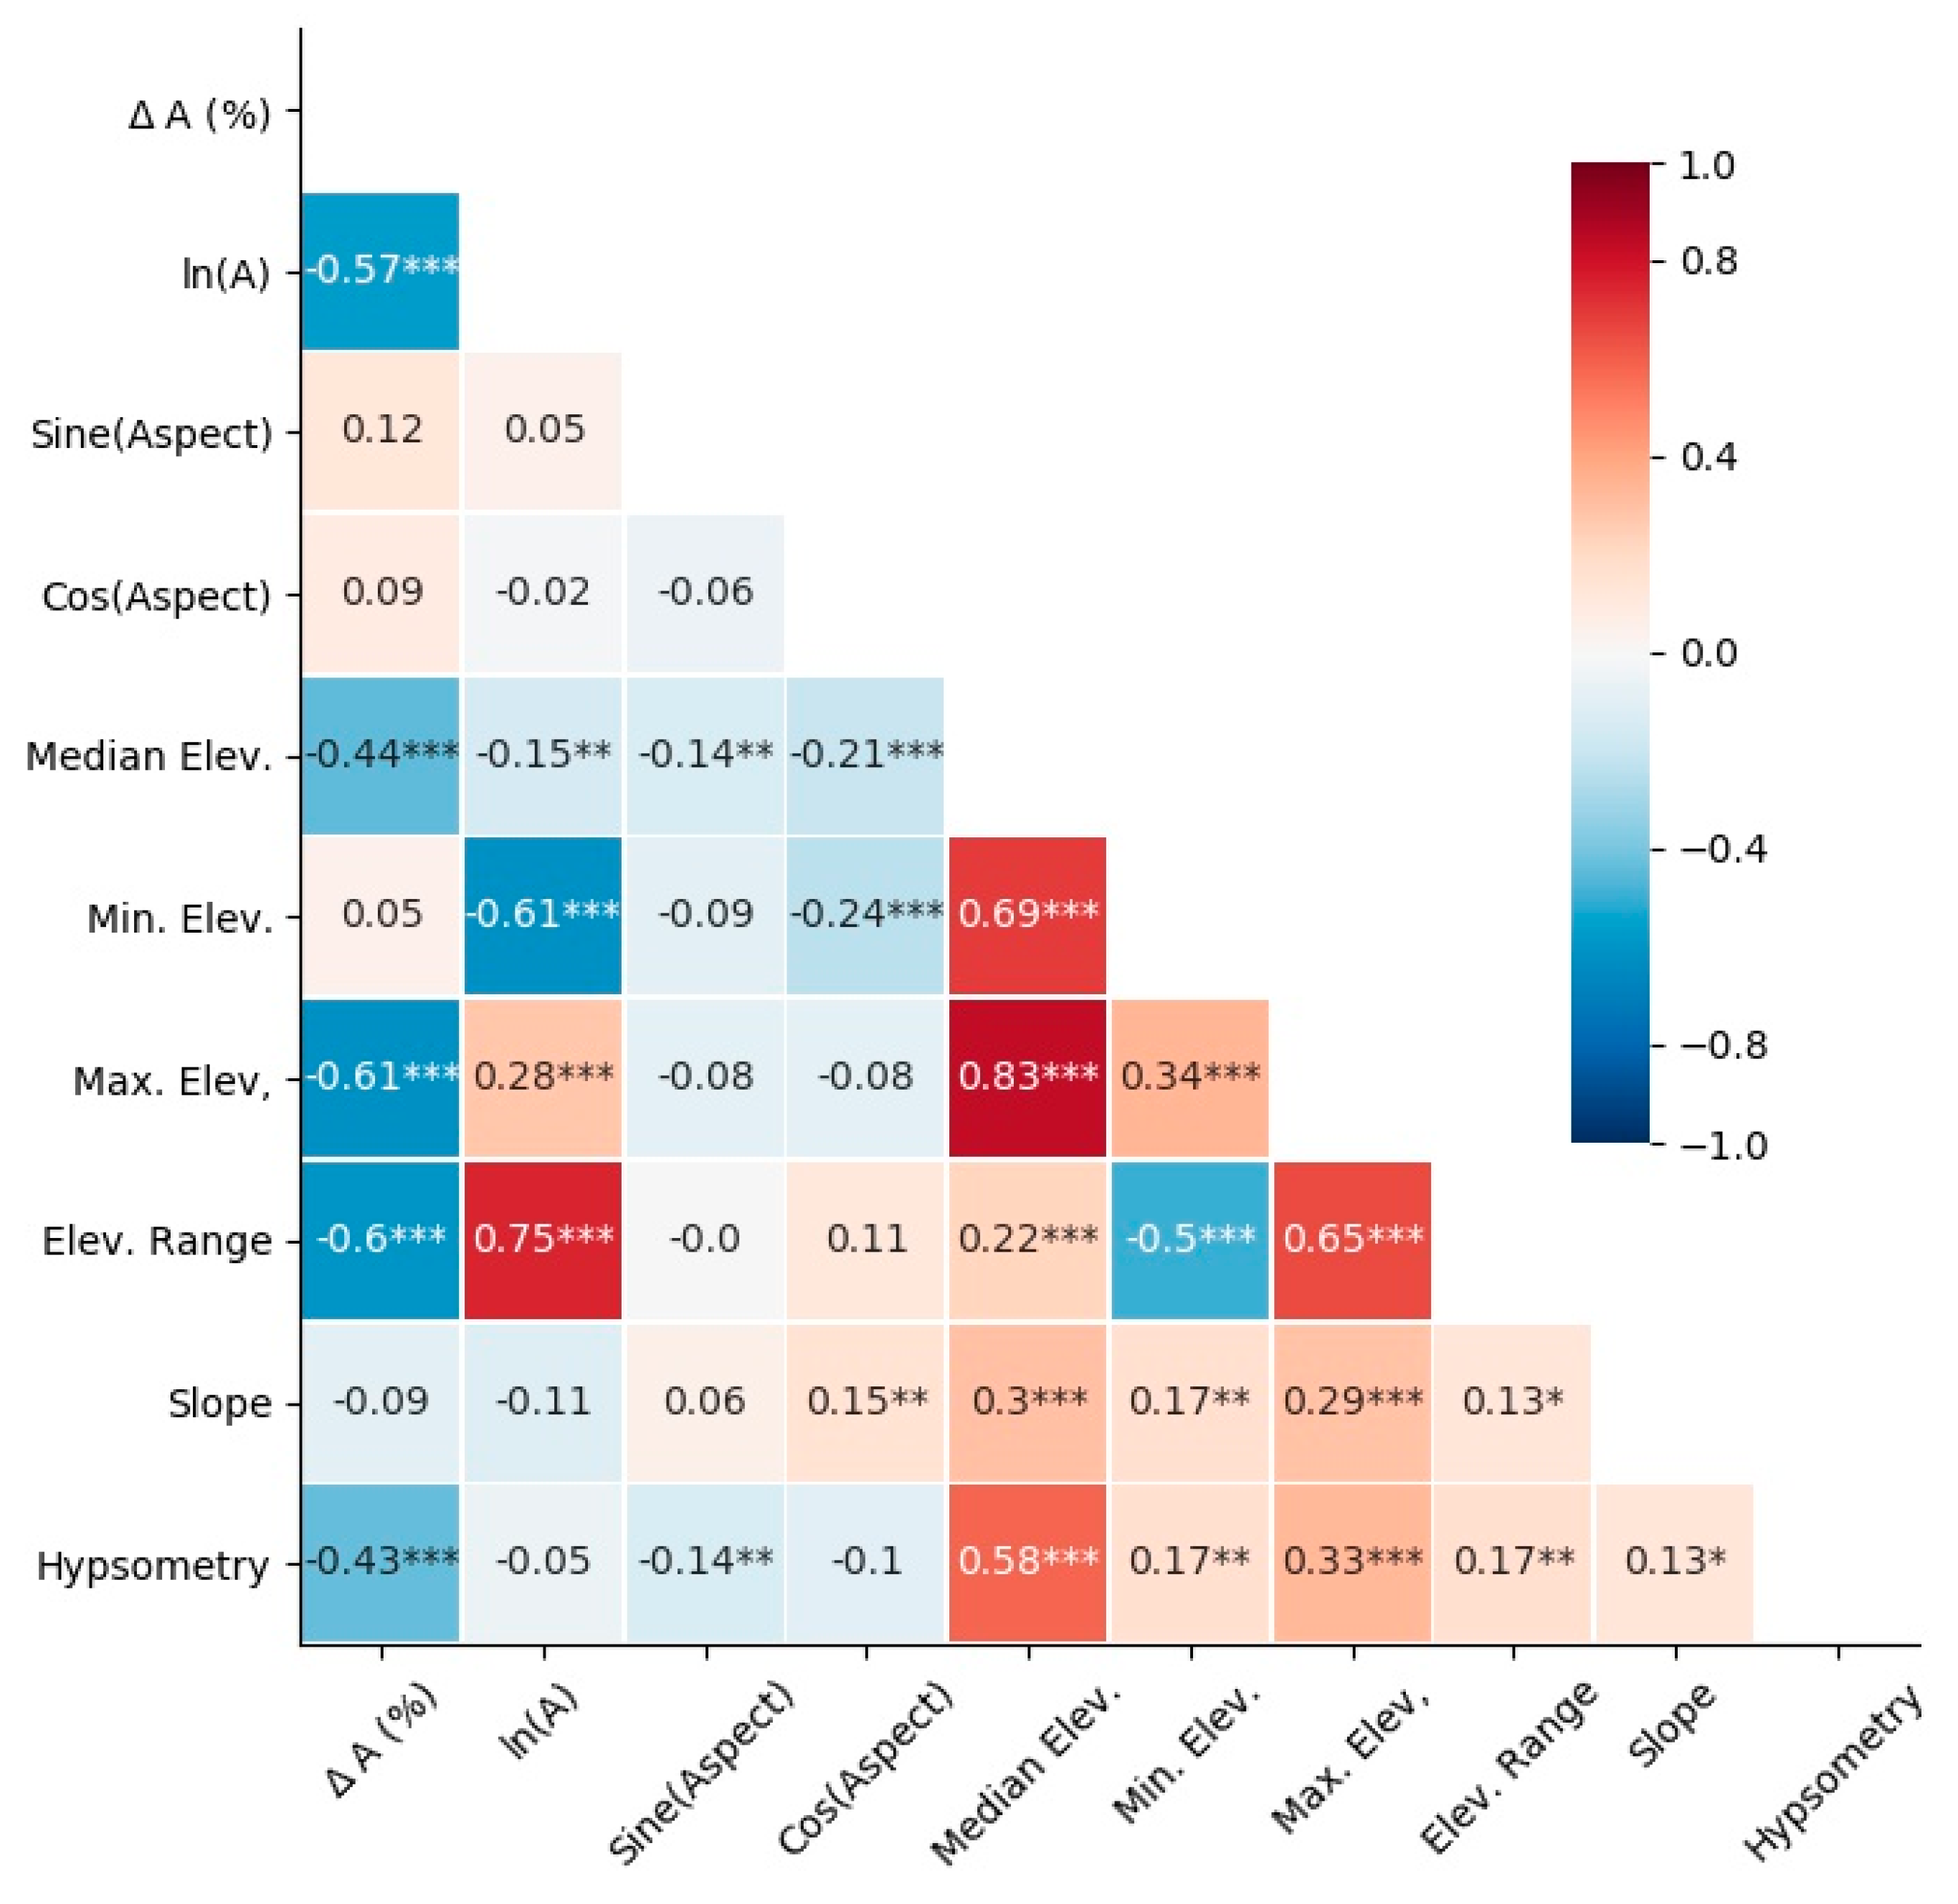
For all glaciers in the study area, the relative reduction in area has a significant negative correlation with the size, indicating that small glaciers tend to lose more than the large ones (Figure 6a). The relative area change is also negatively correlated with the median elevation, elevation range, and hypsometry (Figure 6b,c,e). The relationship between mean slope and the percent of change is slightly negative, but not significant (Figure 6d). East-facing glaciers experienced less proportional shrinkage compared to the glaciers with other orientations (Figure 6f). Pearson correlation analysis was performed on the relative area change (∆A), the natural logarithm transformed area (ln(A), to normalize the distribution), and eight other factors as mentioned above. Results show that ln(A), median elevation, maximum elevation, elevation range, and hypsometry were negatively correlated with ∆A and significant at the 99% confidence interval (p < 0.01), while other factors are not significant (p > 0.1) (Figure 7). When examining the interaction between factor pairs, some strong collinearities are shown. For example, the area was significantly positively correlated with the elevation range (r = 0.75, p < 0.01) and maximum elevation (r = 0.28, p < 0.01), and the median elevation was strongly correlated with other elevation-dependent variables (min., max., and range), slope, and hypsometry (p < 0.01) (Figure 7).
4.4. Glacier Surface Elevation Changes
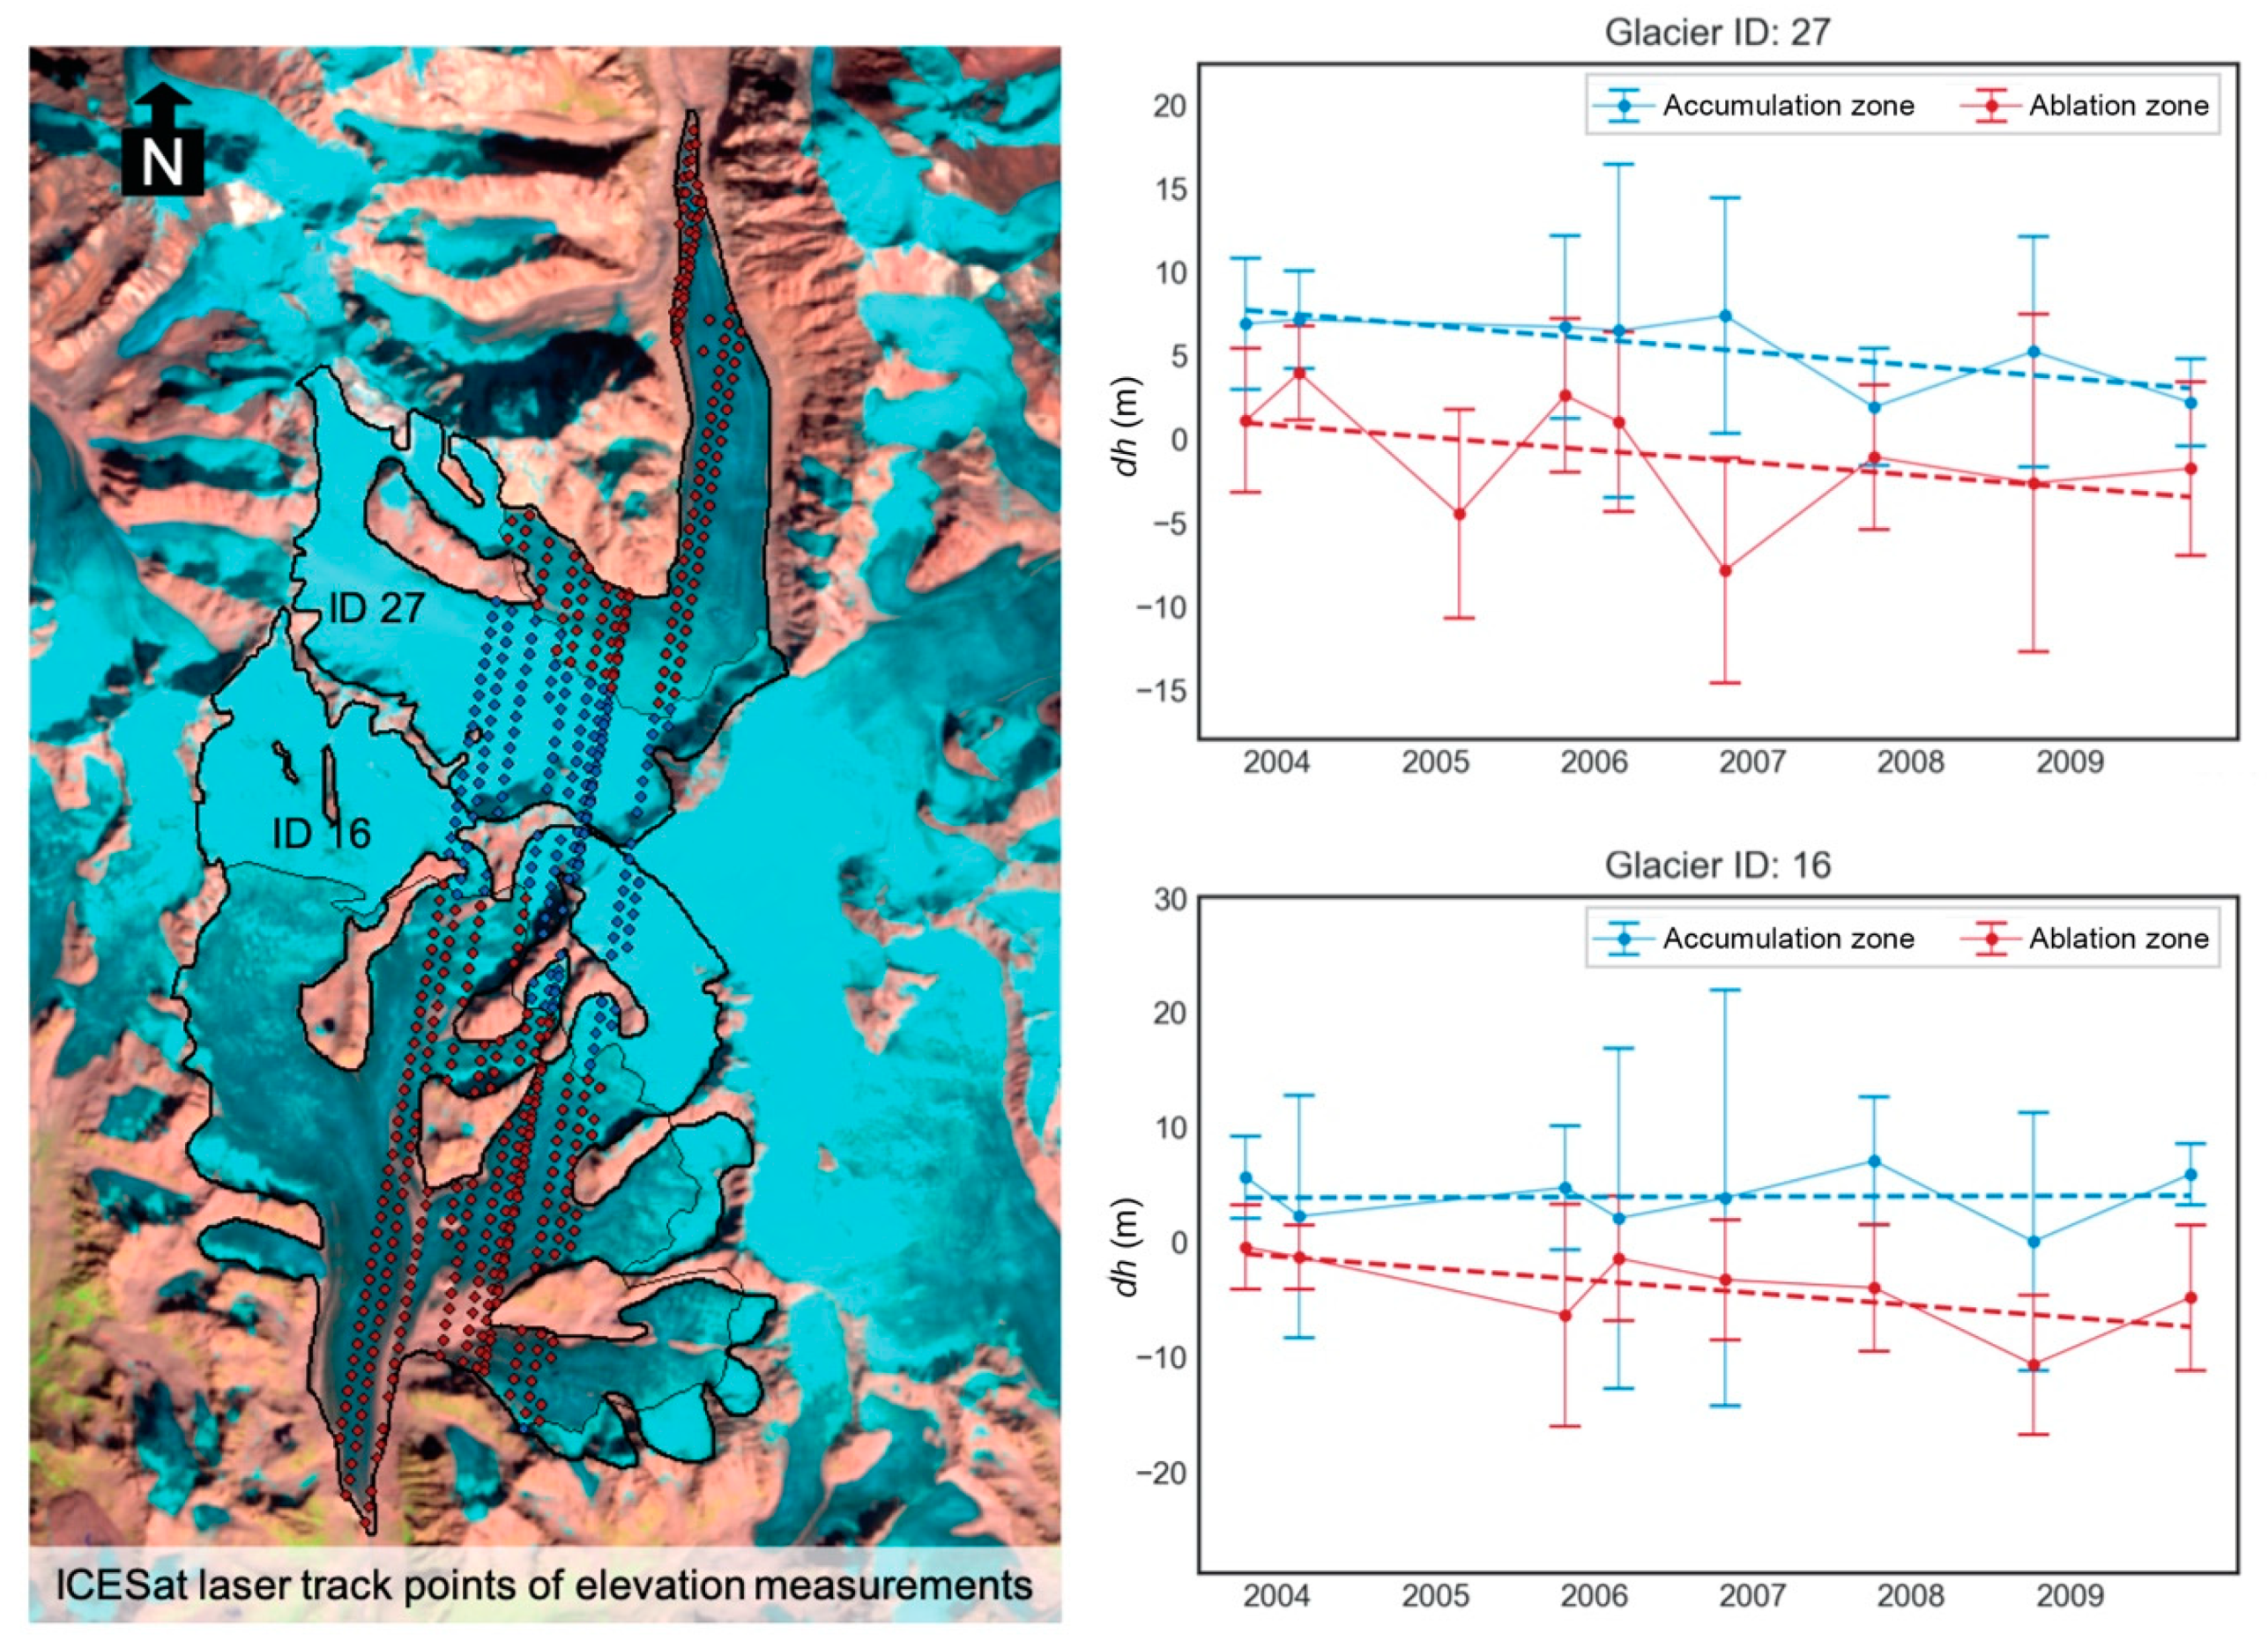
A total of 224 footprints of ICESat surface elevation measurements fell within the extent of the two largest glaciers (ID-27 and ID-16) in the study area during its operation period of 2003–2009. The dh obtained from differencing the ICESat elevations with the 2000 SRTM DEM values is indicative of thinning (dh < 0) or thickening (dh > 0) of the glacier surface. Table 4 summarizes the results of the average elevation change rate (m year−1) and the number of laser footprints for different elevation bins at each laser period. At lower altitudes of 3000–3500 m a.s.l., all of the change rate was negative, ranging from −2.02 m year−1 to −0.56 m year−1. While most (133 out of 224) footprints landed within 3500–4000 m a.s.l., the change rate was slightly positive in the early years, i.e., 2003, 2004, and 2005, and slightly negative in the later years, i.e., 2006–2009 except almost zero change (rate = 0.03 m year−1) in 2007. At the highest elevation interval of 4000–4500 m a.s.l., although the number of footprints only adds to 24 in total, four of the five periods with data resulted in a positive rate of change, with a range from 0.23 m year−1 to 2.52 m year−1, indicating a gain of surface elevation close to the head of glaciers. The negative value of −0.65 m year−1 occurred when calculating the rate using the autumn 2006 data, and it may be related to a strong ablation season in that year or avalanche occurrence in steep and rugged terrains.
The gradient in the elevation change rate is also demonstrated by differentiating the ablation zone at the lower elevations and the accumulation zone at the higher elevations, separated by the transient snow line as an approximation of the ELA (Figure 8). In general, the dh values were averaged as positives in the accumulation zone, while they are mostly negative in the ablation zone for both glacier ID-27 and glacier ID-16 during the period of 2003–2009. The overall trends through the time series went downslope for both zones of the glaciers, basically translating into more loss of thickness in the ablation zone and less accumulation in the accumulation zone as time progressed (Figure 8). It should also be noted that the south-facing glacier ID-16 showed a more significant absolute thickness loss compared to the north-facing glacier ID-27, at both ablation and accumulation zones. Considering the inter-annual elevation trends derived from all dh values with a linear fitting, the accumulation zone of the ID-27 experienced a higher thinning rate (−0.783 m year−1) than that of the ID-16 (−0.031 m year−1), while the ablation zone of the ID-16 is reducing its thickness at a higher rate (−1.064 m year−1) than the ID-27 (−0.742 m year−1). However, it would be difficult and farfetched to compare the mass budget changes of the two glaciers in the period because the datasets of the ICESat sampling are not balanced between the accumulation and the ablation parts and not extensive enough to cover the full scope of glaciers.
4.5. Climatic Trends
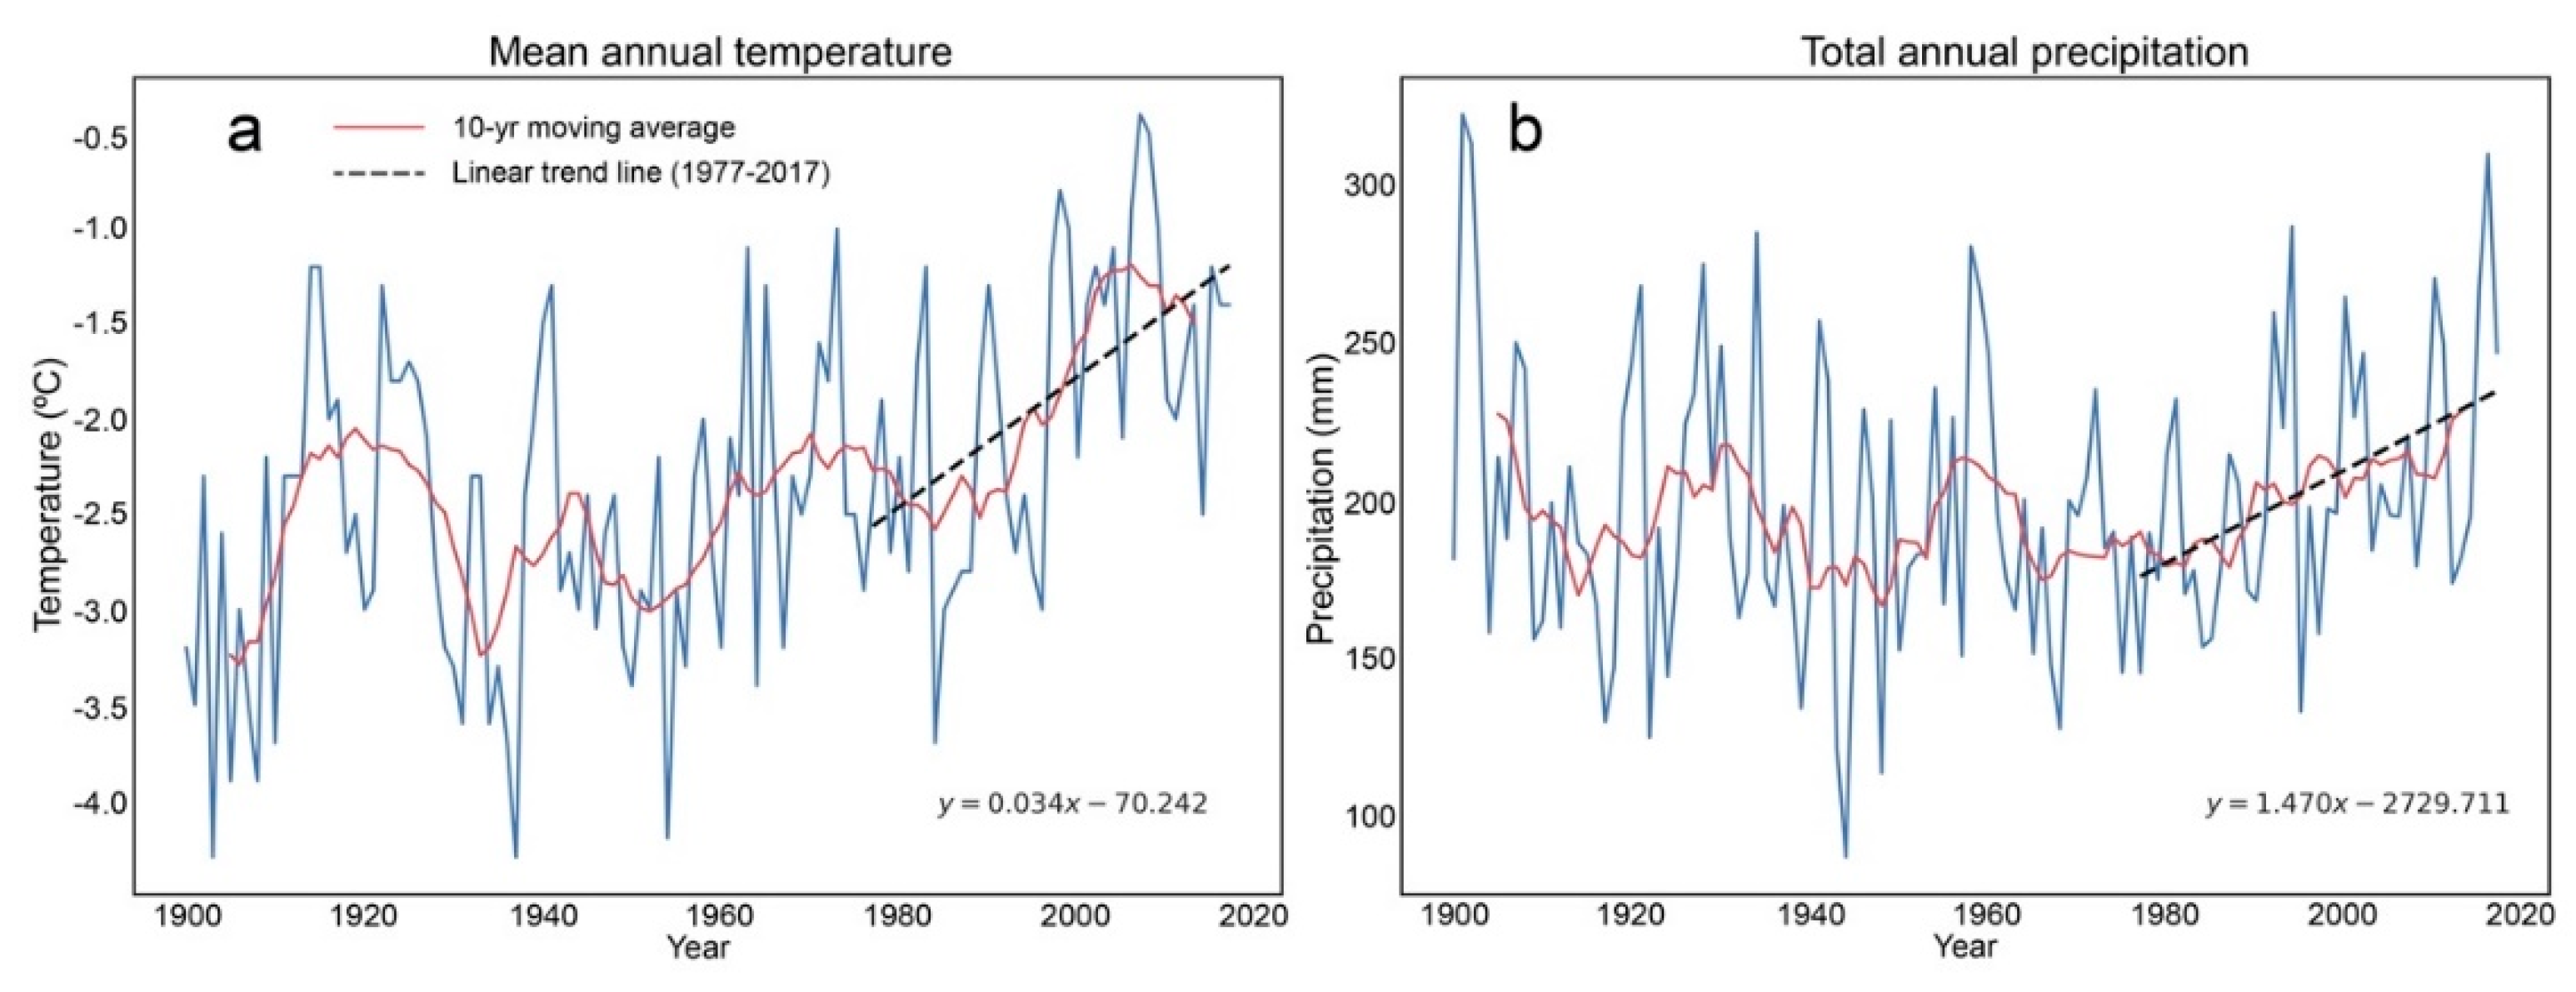
Because no weather station data are available in the study area, the most recent version of the University of Delaware dataset of air temperature and precipitation at the grid (43.75° N, 83.75° E) that covers the target region was used to reflect the trends of climate between 1900 and 2017 [49]. As shown in Figure 9a, the mean annual temperature (MAT) was the coldest at the beginning of the twentieth century and then fluctuated with positive and negative trends throughout the century. The overall trend of MAT is increasing, and the 1977–2017 period, which overlaps closely with the investigated glacier change period, showed a significant positive trend coefficient (0.03 °C year−1) using linear regression (Figure 9a). Regarding the total annual precipitation (TAP), it can be observed that the variability was higher for the first half of the century than the second half (Figure 9b). The 10-year smoothed average helped to identify a gently increasing trend of TAP since the 1970s, and the trend analysis using linear regression for 1977–2017 resulted in an increasing rate of precipitation of approximately 1.5 mm per year (Figure 9b).
5. Discussion
5.1. Comparison with Glacier Inventory Data
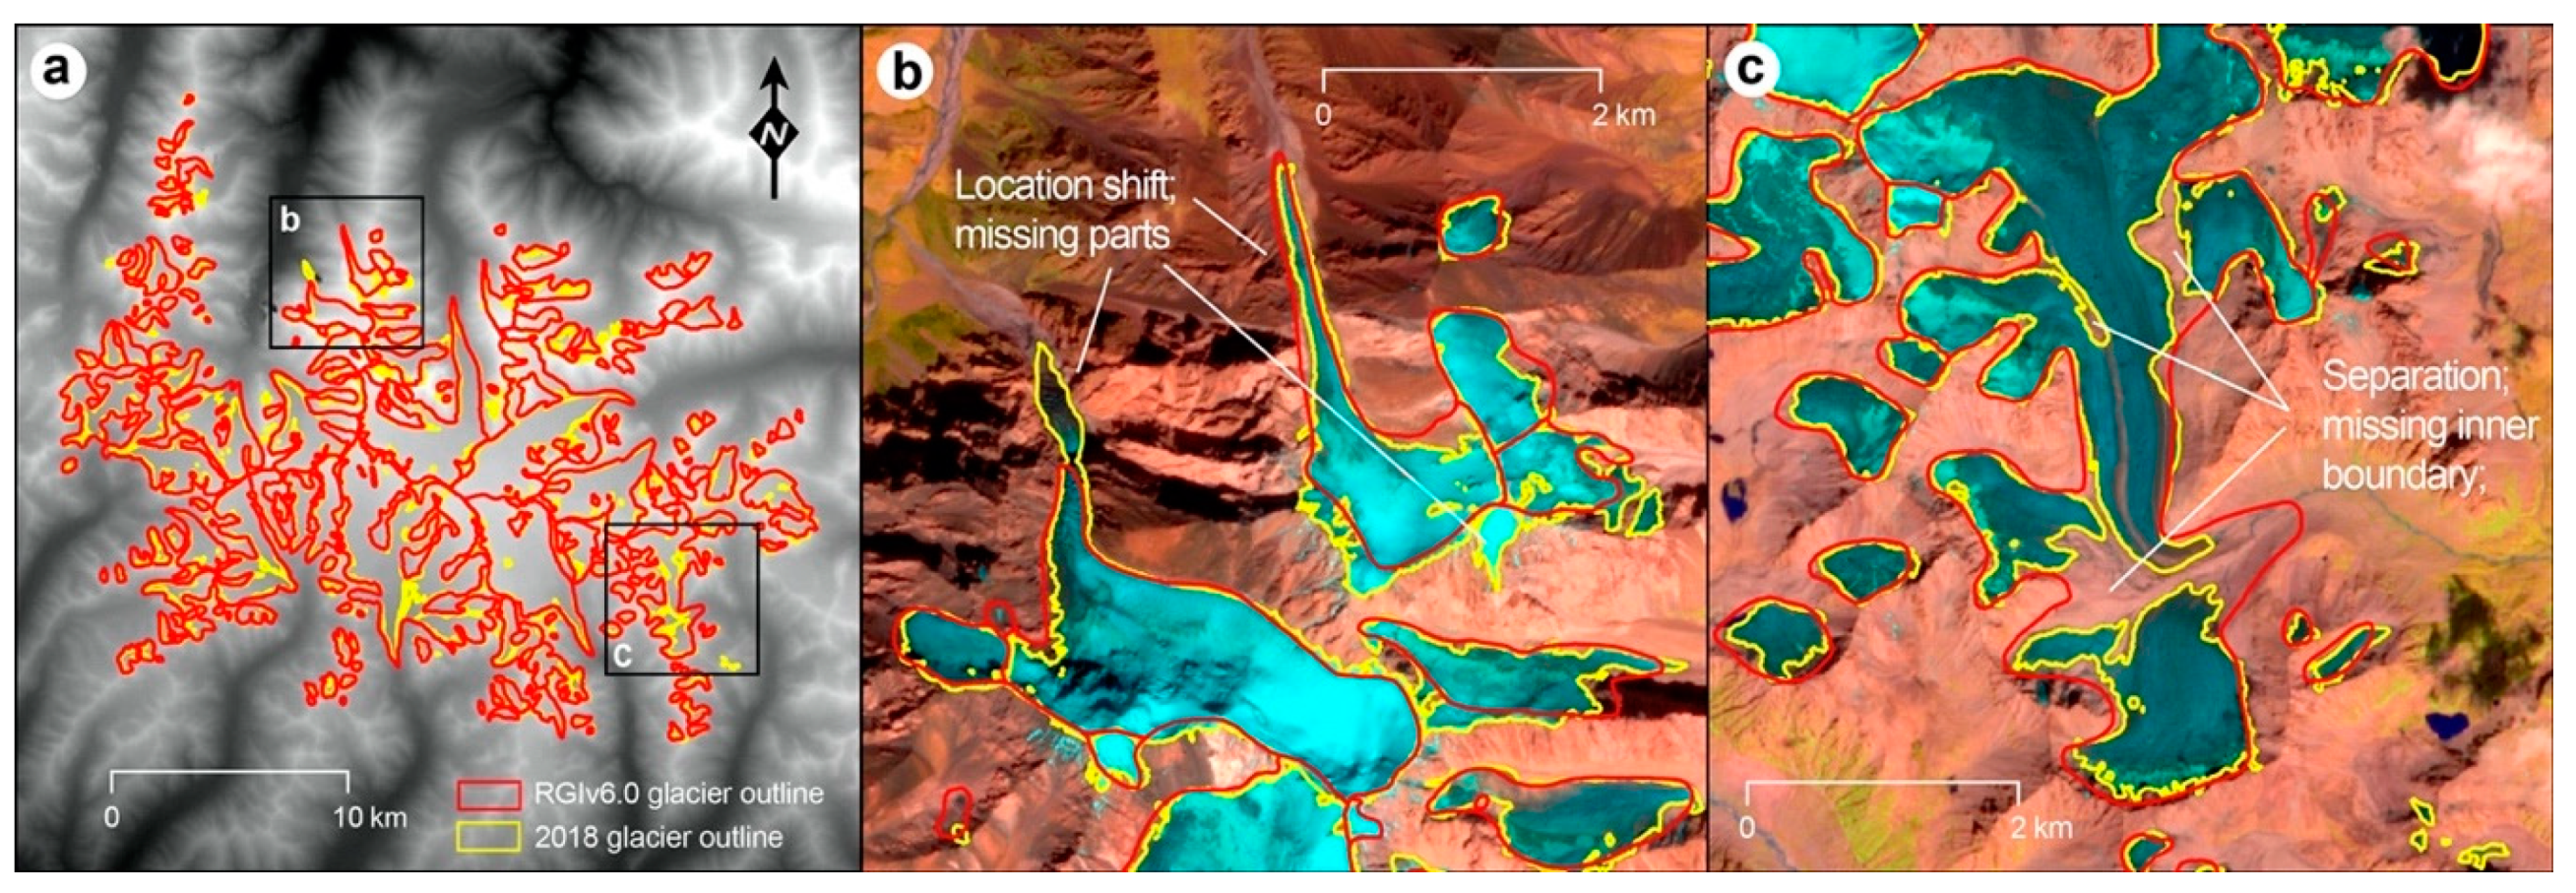
The 2018 inventory of glaciers at the central massif of the Borohoro Mountains was generated using a reproducible, time-efficient semi-automated procedure based on the Sentinel 2A imagery [38]. To compare and cross-check with the most recent, publicly available glacier inventory data, the glacier outlines of the new 2018 inventory were overlaid with outlines of the second Chinese Glacier Inventory (2nd-CGI) [18] (Figure 10a). The 2nd-CGI was released in December 2014 by the Chinese Academy of Sciences and was an updated version of the first CGI completed in 2002 [17]. The primary data sources for the 2nd-CGI glaciers were Landsat TM and the Enhanced Thematic Mapper Plus (ETM+) images from 2006–2010. The Randolph Glacier Inventory version 6.0 (RGIv6.0) and the GLIMS database incorporated the 2nd-CGI data into their world glacier inventories, making it readily and freely accessible to a broader audience. A direct comparison of the 2018 results of this study with the counterparts extracted from the RGIv6.0 demonstrated a larger coverage of 236.1 km2 in the RGIv6.0, by 8.6% (or 20.3 km2) larger than the 2018 extent. When comparing the RGIv6.0 extent with the mapping from the 2007 Landsat TM image, the total area decreased similarly, with a minor overestimation (~5 km2) in the RGIv6.0 dataset. However, the number of glaciers was found to be significantly different among datasets. The inventory from this study contains 224 glaciers in 2018 and 221 glaciers in 2007, while the RGIv6.0 possesses 176 entities. There may be two reasons for the variation in the number of glaciers. The first is that the methods applied to divide ice polygons may be different, as well as uncertainties in the use of different elevation data in deriving basin boundaries; the second possibility is that some small glaciers are missing from the compilation of the 2nd-CGI, as seen in Figure 10b,c. The disintegration also contributed to the increase of the count of ice bodies in recent years, but is not sufficient to explain a difference of 45 glaciers in the 2007 inventory vs. the RGIv0.6 data since they were sampled around the same time.
The advent of Sentinel 2A since 2015 has benefited glacier mapping with its short repeat interval and high-resolution imagery, e.g., [38,39,40,58], however, it has not yet been utilized often in creating glacier data across the Tian Shan. As the high temporal resolution gives a better opportunity of obtaining cloud-free and snow-free images, the finer spatial resolution should allow a more accurate mapping, especially for regions dominated by small glaciers, like the Borohoro Mountains. As illustrated in Figure 10, despite that glacier area loss during ~2007 (RGIv6.0 data acquisition) and 2018 (the current mapping), a better quality of the 2018 outlines shows a more precisely digitized boundary with details along the edge, nunataks, and in shadows. Also, the very small glaciers (e.g., <0.1 km2) that might not be detectable when using Landsat TM/ETM+ can be recognized now, although they may not affect much the total mapped glaciated area.
5.2. Comparison with Other Regions across the Tian Shan
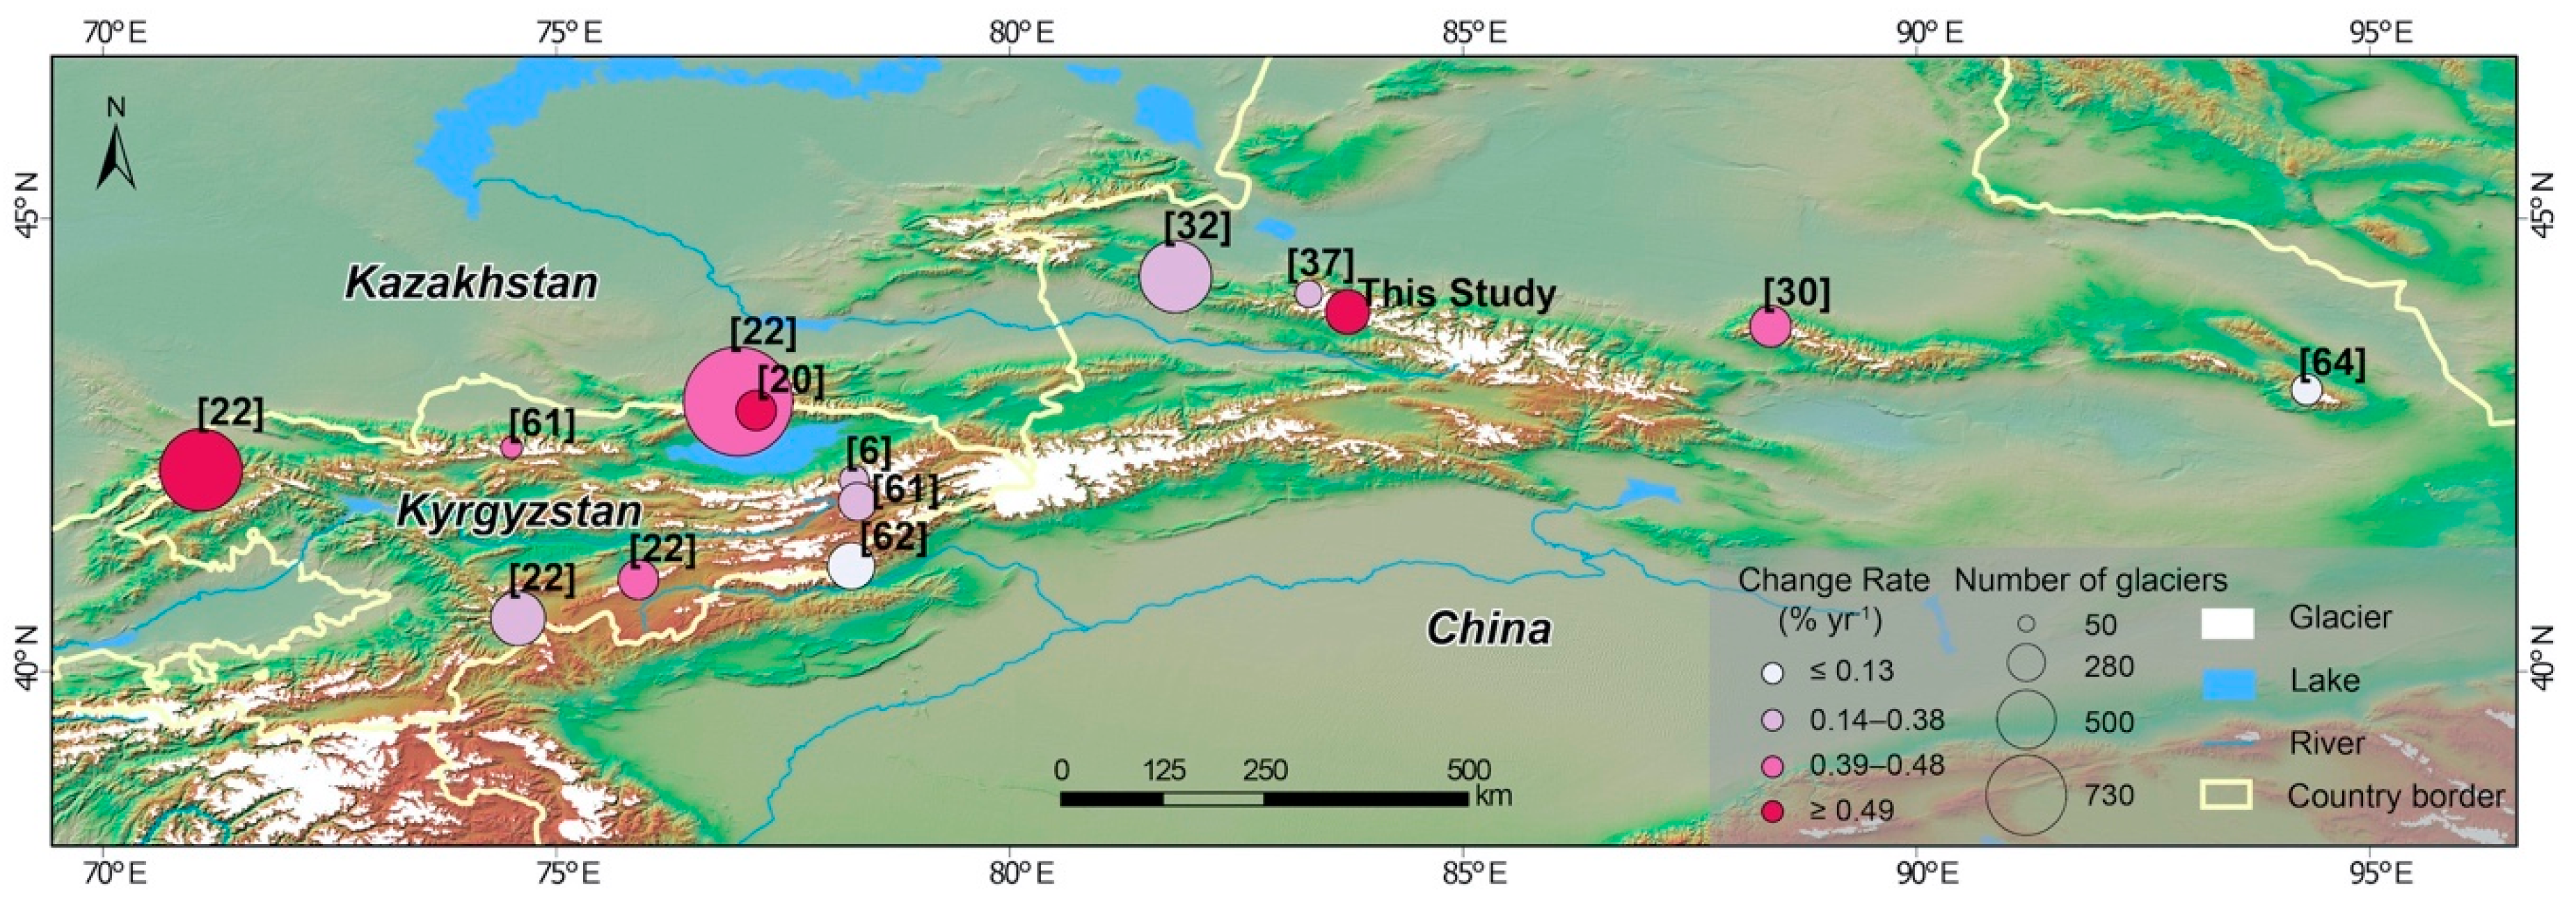
The results of the areal and surface elevation change of glaciers in the Borohoro Mountains are consistent with an expected and widely published trend of glacier retreat in the most recent decades across the Tian Shan range. The retreat of the 200 glaciers in 1977 was quantified with a loss of 24.9 ± 3.2% (0.61 ± 0.01% year−1) of the total area in 41 years onward to 2018. Although it is difficult to compare the rate with different time frames and different sizes of glaciers, this magnitude of change is among the highest reported in many parts of the Tian Shan (Table 5; Figure 11). Previous studies reported that the strongest annual area shrinkage (0.38–0.76% year−1) occurred in the outer ranges of the Tian Shan or in peripheral, low-elevation ranges near the densely populated forelands [8]. For examples, in northern and western Tian Shan, Narama et al. [22] examined four mountain regions and found the most dramatic change occurred in the outer regions, with 19% change during ~1970–2000 (~0.63% year−1); Bolch [20] used the Soviet Glacier Inventory and the Landsat scenes for the Zailiyskiy and Kungey Alatau valleys in the northern Tian Shan and found a decrease of >32% between 1955 and 1999 (~0.72% year−1). In the inner ranges where glaciers are larger and at higher elevations, studies found them stayed relatively stable with smaller area shrinkage rates (0.15–0.40% year−1), in regions like the Terskey Alatau, the Akshiirak and Ala Archa, and the Aksu River Basin [6,8,53,61,62]. The Borohoro is located at the northern periphery of the eastern Tian Shan and is in line with the broader pattern of where glacier area loss is faster.
With four time slices selected in this study, it revealed that the 1994–2007 period had the highest rate of change (0.90 ± 0.07% year−1), followed by 0.62 ± 0.06% year−1 during 2007–2018 and 0.51 ± 0.03% year−1 during 1977–1994. Meltwater from glaciers in the Borohoro Mountains flows into tributaries of the Jinghe River system within the Ebinur Lake Basin in Xinjiang, China. Previous studies estimated a shrinkage rate of glacier area of 0.37% year−1 in the Ebinur Lake Basin [32] and of 0.38% year−1 in the Jinghe river basin during 1964–2004 [37] (Table 5). The higher rate of glacier retreat in Borohoro during 1977–2018 could be a result of accelerated ablation trend after the 1970s [8]. Comparing the first and second CGIs, Che et al. [63] reported a change rate of 0.72% year−1 for the sub-region that contains the Borohoro Mountains, which is similar to my result, but the quality issues (e.g., distortion, location shift, and missing parts) in the first CGI might have sacrificed the accuracy of the estimation to some extent.
5.3. Influence of Topo-Climatic Factors
Within the study area, the glacier area loss in the past 41 years ranges from a minimum of 4.9% to complete disappearances (100%). The vast variability in the degree of individual glacier recession was suggested to be largely dependent on the topographic and climatic conditions, e.g., [57,59,65,66]. According to the results of this study, the average loss of area in three small size classes (<0.5 km2, 0.5–1.0 km2, and 1.0–5.0 km2) is drastically lower than that of the other two large size classes (5.0–10.0 km2 and >10.0 km2), but the relative rates of recession are much higher for small glaciers (Figure 5). The four largest glaciers located in the central massif lost 12.0% on average from 1977 to 2018, which is converted to 0.29% per year. Such relatively stable recession can be attributed to the type and topographic characteristics of these glaciers. Large compound valley glaciers that originate from the extensive accumulation area, often joined by multiple tributaries, occupy the highest elevations in the range and flow downstream to a narrow tongue. Where the topography of their accumulation area is gentle and frequently replenished by snowfall, the surface extent might not shrink significantly, but the thickness could be thinning. Some studies have shown that sublimation is observed as a major mass loss for some glaciers in the semiarid and arid environments [67,68]. Reduction in the area is mostly found in the frontal areas, even though the occasional debris cover might slow the ablation [26,69]. Small glaciers (usually <1 km2) resulted in a rapid recession, and half of them had lost more than 48.8% of its area from 1977 to 2018. The markedly retreated glaciers are generally located along the periphery of the Borohoro massif, and more are found on the southern slope than the northern slope. Existing publications have claimed that the mid-latitude small glaciers are subject to strong retreat and are prone to give a sensitive response to the warming climate, and in fact, many have already vanished in the last century, e.g., [13,70,71].
The morphology of a glacier has a significant influence on its responsiveness to the changing climate. The area and elevation-related factors (minimum, maximum, median, and range) of a glacier are interconnected because they both tie closely to the intrinsic type of the glacier: large compound glaciers are more likely to occupy a larger range of elevations and have a high peak and a low front; while small hanging glaciers range small altitudinal band but may exist as a survivor at various altitudinal locations, depending on the surrounding topography. The aspect of individual glaciers did not correlate well with their glacier area change, but the overall spatial pattern as shown in Figure 3 depicted a higher level of loss on the southern side of the major divide than on the northern side. The hypsometric integral was found to be a significant negative correlation (r = −0.43, p < 0.01) with the area change of glaciers, meaning glaciers that possess a convex profile (more areas distributed at higher elevations) in the cumulative elevation-area plot resulted in less retreat, while glaciers with a concave profile (more areas distributed at lower elevations) experienced a greater retreat. The hypsometry was suggested to be used for making a reasonable first-order estimation of the mass-balance sensitivity of glaciers without in situ measurements [72]. Overall, glacier topomorphology, such as area, elevation, and hypsometry, might be important factors to the retreat rates of glaciers in the Borohoro, but to determine a more accurate assessment on the pattern of glacier loss, field measurements or adequate models would be necessary.
Reductions in glacier area and lowering of the glacier surface elevation are the outcome of a negative glacier mass balance, which is ultimately driven by the change in the synoptic climatic pattern and local meteorological conditions. The regional climatic trend in Central Asia was confirmed with rising temperatures since the 1970s by a number of studies, e.g., [8,11,73,74]. The IPCC Fourth Assessment Report (AR4) reported decadal trend coefficients between +0.1 and +0.2 °C and a pronounced warming in winter season based on nearly all meteorological stations for Central Asia (35–50° N, 40–75° E) [75], but the inconsistency and lack of stations at high elevations may cause some difficulties in the estimations. Haag et al. [11] examined the climate of Central Asia (35–45° N, 65–80° E) using the Climatic Research Unit Timeseries (CRU TS) v. 4.01 dataset between 1950–2016 and found that the mean annual temperatures increased at a rate of 0.28 °C per decade, with the maximum rate of 0.32 °C per decade in winter. Five meteorological stations most adjacent to the study area revealed a rate of temperature increase of 0.31 °C/decade over 1959–2005, and the rate accelerated to 0.54 °C/decade during the last 15 years [32]. For the studied Borohoro region, an increase of 0.3 °C per decade was observed in the mean annual temperature from 1977 to 2017, very similar to the previously reported values. This uniform, continuous temperature increase in the last few decades can be considered as the major driver of the ongoing glacier recession. It has been suggested that a weakening Siberian anticyclone system might have caused such a change in temperature [76]. Precipitation often shows marked spatial heterogeneity and thus the trends in precipitation are quite different across ranges of the Tian Shan. The total annual precipitation showed an insignificant or decreased trend in the central and western Tian Shan, e.g., [8,53,73], whereas an increasing trend is commonly found in the eastern and northern ranges, e.g., [11,64,77]. The precipitation in Borohoro experienced a steady upward trend in 1977–2017 with a rate of about 150 mm/decade. A weakening and displaced Siberian anticyclone can strengthen the advection of the mid-latitude westerlies into the peripheral Tian Shan [73], thus causing increased precipitation. In the Jinghe River Basin, orographic thunderstorms are dominant in summer while winter is cold and dry [37]. A major proportion of rain versus snowfall precipitation, together with the rising temperature, leads to unfavorable conditions for the glacier mass budget and accelerates the ablation processes. In addition, it is also important to note the existence of the response time of glaciers to climate signals because, counting such delays, the level of glacier’s retreat is likely to be retained in the near future even if the warming trend was stopped or decelerated.
6. Conclusions
In this work, glacier changes during the past 41 years in the Borohoro Mountains, Tian Shan, were examined with declassified Hexagon image, Landsat 5 TM, Sentinel 2A, SRTM DEM, and GLAS/ICESat remote-sensing data. A total of 200 glaciers in the study area which covered 287.5 ± 8.2 km2 in 1977 shrank by 71.6 ± 9.2 km2 (0.61 ± 0.01% year−1) by 2018, with an increase to a total of 224 glaciers due to fragmentation. Among three sub-periods of 1977–2018, the rate of glacier area change was found the fastest (0.90 ± 0.07% year−1) in 1994–2007. The rates are similar to the published results for the peripheral and eastern ranges of the Tian Shan, where glaciers experienced a more rapid recession than those in the inner ranges. Small glaciers (<1 km2) take up 80% of the 2018 glacier inventory of the region. The inverse relationship between the glacier size and shrinkage rate suggests that small glaciers are more sensitive and vulnerable to a warming climate, in agreement with findings of many studies worldwide. An individual glacier’s median, maximum, and range of elevation, and its hypsometry also showed significant correlations with the rate of retreat, but it could be difficult to determine the degree of their influence due to the collinearity among the factors. However, apparently the aspect of the cirques did not influence the rate of glacier shrinking in the studied period of time. The ICESat dataset that crossed two of the largest glaciers in the Borohoro helped to reveal the surface elevation change from 2003 to 2009, which showed thinning at both accumulation and ablation zones. The climatic conditions in the last 41 years are remarkably different from the early 20th century. Both increases in mean annual temperature and total annual precipitation were clearly shown in the gridded climate dataset for this area as well as in other research of nearby regions. However, most of the precipitation arrives in summer, which is unfavorable for glacier growth. While the meso- or synoptic scale of the weather system, i.e., the interplay of the Siberian High and the westerlies, may have caused the trends in the climatic variables, it is reasonable to interpret that the warming temperatures are the major driver of glacier recession and such recession is very likely to continue in forthcoming decades.
Supplementary Materials
The following are available online at https://www.mdpi.com/2073-4441/12/5/1502/s1: Table S1: Attributes of glaciers in the 2018 inventory, based on the Sentinel 2A image and 30-m SRTM digital elevation model.
Funding
This research received no external funding.
Acknowledgments
The author is thankful to USGS, NASA, and NSIDC for providing the Hexagon, Landsat, and Sentinel satellite images, SRTM digital elevation model, U of Delaware gridded climate dataset, and the GLAS/ICESat data for free. UDel_AirT_Precip data are provided by the NOAA/OAR/ESRL PSL, Boulder, Colorado, USA, from their Web site at https://psl.noaa.gov/. Student assistants, Kate Landers and Aidan McLendon, helped on digitizing glacier outlines and thus are much appreciated. The author also wants to acknowledge the Department of Geography at Texas State University for providing work space and laboratory facilities. Comments and suggestions from three reviewers greatly helped in regard to the quality of the manuscript and are much appreciated.
Conflicts of Interest
The author declares no conflict of interest.
References
- IPCC (Intergovernmental Panel on Climate Change). IPCC Special Report on the Ocean and Cryosphere in a Changing Climate; IPCC (Intergovernmental Panel on Climate Change): Geneva, Switzerland, 2019; Available online: https://www.ipcc.ch/report/srocc/ (accessed on 10 January 2020).
- Moon, T. Saying goodbye to glaciers. Science 2017, 356, 580–581. [Google Scholar] [CrossRef] [PubMed]
- Solomina, O.N.; Bradley, R.S.; Jomelli, V.; Geirsdottir, A.; Kaufman, D.S.; Koch, J.; McKay, N.P.; Masiokas, M.; Miller, G.; Nesje, A.; et al. Glacier fluctuations during the past 2000 years. Quat. Sci. Rev. 2016, 149, 61–90. [Google Scholar] [CrossRef] [Green Version]
- Zemp, M.; Frey, H.; Gärtner-Roer, I.; Nussbaumer, S.U.; Hoelzle, M.; Paul, F.; Haeberli, W.; Denzinger, F.; Ahlstrøm, A.P.; Anderson, B.; et al. Historically unprecedented global glacier decline in the early 21st century. J. Glaciol. 2015, 61, 745–762. [Google Scholar] [CrossRef] [Green Version]
- Farinotti, D. Asia’s glacier changes. Nat. Geosci. 2017, 10, 621–622. [Google Scholar] [CrossRef]
- Kutuzov, S.; Shahgedanova, M. Glacier retreat and climatic variability in the eastern Terskey–Alatoo, inner Tien Shan between the middle of the 19th century and beginning of the 21st century. Glob. Planet. Chang. 2009, 69, 59–70. [Google Scholar] [CrossRef]
- Shi, Y. Glaciers and Related Environments in China; Science Press: Beijing, China, 2008. [Google Scholar]
- Sorg, A.; Bolch, T.; Stoffel, M.; Solomina, O.; Beniston, M. Climate change impacts on glaciers and runoff in Tien Shan (Central Asia). Nat. Clim. Chang. 2012, 2, 725–731. [Google Scholar] [CrossRef]
- Farinotti, D.; Longuevergne, L.; Moholdt, G.; Duethmann, D.; Molg, T.; Bolch, T.; Vorogushyn, S.; Guntner, A. Substantial glacier mass loss in the Tien Shan over the past 50 years. Nat. Geosci. 2015, 8, 716–722. [Google Scholar] [CrossRef]
- Bolch, T. Asian glaciers are a reliable water source. Nature 2017, 545, 161. [Google Scholar] [CrossRef] [Green Version]
- Haag, I.; Jones, P.D.; Samimi, C. Central Asia’s changing climate: How temperature and precipitation have changed across time, space, and altitude. Climate 2019, 7, 1–19. [Google Scholar] [CrossRef] [Green Version]
- Pritchard, H.D. Asia’s shrinking glaciers protect large populations from drought stress. Nature 2019, 569, 649–654. [Google Scholar] [CrossRef]
- Huss, M. Extrapolating glacier mass balance to the mountain-range scale: The European Alps 1900–2100. Cryosphere 2012, 6, 713–727. [Google Scholar] [CrossRef] [Green Version]
- Zhao, L.; Ding, R.; Moore, J.C. Glacier volume and area change by 2050 in high mountain Asia. Glob. Planet. Chang. 2014, 122, 197–207. [Google Scholar] [CrossRef]
- Li, J.; Li, Z.; Zhu, J.-J.; Li, X.; Xu, B.; Wang, Q.-J.; Huang, C.; Hu, J. Early 21st century glacier thickness changes in the Central Tien Shan. Remote Sens. Environ. 2017, 192, 12–29. [Google Scholar] [CrossRef] [Green Version]
- Raup, B.; Racoviteanu, A.; Khalsa, S.J.S.; Helm, C.; Armstrong, R.; Arnaud, Y. The GLIMS geospatial glacier database: A new tool for studying glacier change. Glob. Planet. Chang. 2007, 56, 101–110. [Google Scholar] [CrossRef]
- Shi, Y.; Liu, C.; Kang, E. The glacier inventory of China. Ann. Glaciol. 2009, 50, 1–4. [Google Scholar] [CrossRef] [Green Version]
- Guo, W.; Liu, S.; Xu, J.; Wu, L.; Shangguan, D.; Yao, X.; Wei, J.; Bao, W.; Yu, P.; Liu, Q.; et al. The second Chinese glacier inventory: Data, methods and results. J. Glaciol. 2015, 61, 357–372. [Google Scholar] [CrossRef] [Green Version]
- Aizen, V.B.; Aizen, E.M.; Surazakov, A.B.; Kuzmichenok, V.A. Assessment of glacial area and volume change in Tien Shan (Central Asia) during the last 150 years using geodetic, aerial photo, ASTER and SRTM data. Ann. Glaciol. 2006, 43, 202–213. [Google Scholar] [CrossRef] [Green Version]
- Bolch, T. Climate change and glacier retreat in northern Tien Shan (Kazakhstan/Kyrgyzstan) using remote sensing data. Glob. Planet. Chang. 2007, 56, 1–12. [Google Scholar] [CrossRef]
- Gardner, A.S.; Moholdt, G.; Cogley, J.G.; Wouters, B.; Arendt, A.A.; Wahr, J.; Berthier, E.; Hock, R.; Pfeffer, W.T.; Kaser, G.; et al. A reconciled estimate of glacier contributions to sea level rise: 2003 to 2009. Science 2013, 340, 852–857. [Google Scholar] [CrossRef] [Green Version]
- Narama, C.; Kaab, A.; Duishonakunov, M.; Abdrakhmatov, K. Spatial variability of recent glacier area changes in the Tien Shan Mountains, Central Asia, using Corona (similar to 1970), Landsat (similar to 2000), and ALOS (similar to 2007) satellite data. Glob. Planet. Chang. 2010, 71, 42–54. [Google Scholar] [CrossRef]
- Pieczonka, T.; Bolch, T.; Junfeng, W.; Shiyin, L. Heterogeneous mass loss of glaciers in the Aksu-Tarim Catchment (Central Tien Shan) revealed by 1976 KH-9 Hexagon and 2009 SPOT-5 stereo imagery. Remote Sens. Environ. 2013, 130, 233–244. [Google Scholar] [CrossRef] [Green Version]
- Pieczonka, T.; Bolch, T. Region-wide glacier mass budgets and area changes for the Central Tien Shan between ~1975 and 1999 using Hexagon KH-9 imagery. Glob. Planet. Chang. 2015, 128, 1–13. [Google Scholar] [CrossRef]
- Schmidt, S.; Nüsser, M. Changes of high altitude glaciers from 1969 to 2010 in the Trans-Himalayan Kang Yatze Massif, Ladakh, Northwest India. Arct. Antarct. Alp. Res. 2012, 44, 107–121. [Google Scholar] [CrossRef]
- Bhambri, R.; Bolch, T.; Chaujar, R.K.; Kulshreshtha, S.C. Glacier changes in the Garhwal Himalaya, India, from 1968 to 2006 based on remote sensing. J. Glaciol. 2011, 57, 543–556. [Google Scholar] [CrossRef] [Green Version]
- Aizen, V.B.; Kuzmichenok, V.A.; Surazakov, A.B.; Aizen, E.M. Glacier changes in the central and northern Tien Shan during the last 140 years based on surface and remote-sensing data. Ann. Glaciol. 2006, 43, 202–213. [Google Scholar] [CrossRef] [Green Version]
- Khromova, T.; Nosenko, G.; Kutuzov, S.; Muraviev, A.; Chernova, L. Glacier area changes in Northern Eurasia. Environ. Res. Lett. 2014, 9, 015003. [Google Scholar] [CrossRef] [Green Version]
- Li, B.; Zhu, A.X.; Zhang, Y.; Pei, T.; Qin, C.; Zhou, C. Glacier change over the past four decades in the middle Chinese Tien Shan. J. Glaciol. 2006, 52, 425–432. [Google Scholar] [CrossRef] [Green Version]
- Li, K.; Li, Z.; Wang, C.; Huai, B. Shrinkage of Mt. Bogda glaciers of eastern Tian Shan in Central Asia during 1962–2006. J. Earth Sci. 2016, 27, 139–150. [Google Scholar] [CrossRef]
- Shangguan, D.; Liu, S.; Ding, Y.; Ding, L.; Xu, J.; Jing, L. Glacier changes during the last forty years in the Tarim Interior River basin, northwest China. Prog. Nat. Sci. 2009, 19, 727–732. [Google Scholar] [CrossRef]
- Wang, L.; Li, Z.; Wang, F.; Edwards, R. Glacier shrinkage in the Ebinur lake basin, Tien Shan, China, during the past 40 years. J. Glaciol. 2014, 60, 245–254. [Google Scholar] [CrossRef] [Green Version]
- Wang, M.; Zhang, J.; Zhang, B.; Liu, K.; Chen, Y.; Zheng, Y. Geochronology and geochemistry of the Borohoro pluton in the northern Yili Block, NW China: Implication for the tectonic evolution of the northern West Tianshan orogen. J. Asian Earth Sci. 2018, 153, 154–169. [Google Scholar] [CrossRef]
- Xiao, W.; Windley, B.F.; Allen, M.B.; Han, C. Paleozoic multiple accretionary and collisional tectonics of the Chinese Tianshan orogenic collage. Gondwana Res. 2013, 23, 1316–1341. [Google Scholar] [CrossRef]
- Wang, Y.; Liu, Z.; Yao, J.; Bayin, C.; Zhu, Y. Hydrological Response of Runoff to Climate Change of Typical Tributaries in Ebinur Lake Basin of Xinjiang. Water Resour. 2018, 45, 160–168. [Google Scholar] [CrossRef]
- Zhang, B.; Mo, S.; Wu, H.; Xiao, F. Digital spectra and analysis of altitudinal belts in Tianshan Mountains, China. J. Mt. Sci. 2004, 1, 18–28. [Google Scholar] [CrossRef]
- Wang, L.; Li, Z.; Wang, F.; Li, H.; Wang, P. Glacier changes from 1964 to 2004 in the Jinghe River Basin, Tien Shan. Cold Reg. Sci. Technol. 2014, 102, 78–83. [Google Scholar] [CrossRef]
- Paul, F.; Winsvold, S.H.; Kääb, A.; Nagler, T.; Schwaizer, G. Glacier remote sensing using Sentinel-2. part II: Mapping glacier extents and surface facies, and comparison to Landsat 8. Remote Sens. 2016, 8, 575. [Google Scholar] [CrossRef] [Green Version]
- Kääb, A.; Winsvold, S.; Altena, B.; Nuth, C.; Nagler, T.; Wuite, J. Glacier Remote Sensing Using Sentinel-2. Part I: Radiometric and Geometric Performance, and Application to Ice Velocity. Remote Sens. 2016, 8, 598. [Google Scholar] [CrossRef] [Green Version]
- Das, S.; Sharma, M.C. Glacier changes between 1971 and 2016 in the Jankar Chhu Watershed, Lahaul Himalaya, India. J. Glaciol. 2019, 65, 13–28. [Google Scholar] [CrossRef] [Green Version]
- Bolch, T.; Yao, T.; Kang, S.; Buchroithner, M.F.; Scherer, D.; Maussion, F.; Huintjes, E.; Schneider, C. A glacier inventory for the western Nyainqentanglha range and the Nam Co Basin, Tibet, and glacier changes 1976–2009. Cryosphere 2010, 4, 419–433. [Google Scholar] [CrossRef] [Green Version]
- Zwally, H.J.; Schutz, R.; Hancock, D.; Dimarzio, J. GLAS/ICESat L2 Global Land Surface Altimetry Data (HDF5), Version 33; NASA National Snow and Ice Data Center DAAC: Boulder, CO, USA, 2014. [Google Scholar] [CrossRef]
- Schutz, B.E.; Zwally, H.J.; Shuman, C.A.; Hancock, D.; DiMarzio, J.P. Overview of the ICESat mission. Geophys. Res. Lett. 2005, 32, L21S01. [Google Scholar] [CrossRef] [Green Version]
- Treichler, D.; Kääb, A.; Salzmann, N.; Xu, C.Y. Recent glacier and lake changes in High Mountain Asia and their relation to precipitation changes. Cryosphere 2019, 13, 2977–3005. [Google Scholar] [CrossRef] [Green Version]
- Ke, L.; Ding, X.; Song, C. Heterogeneous changes of glaciers over the western Kunlun Mountains based on ICESat and Landsat-8 derived glacier inventory. Remote Sens. Environ. 2015, 168, 13–23. [Google Scholar] [CrossRef]
- Zhang, G.; Xie, H.; Kang, S.; Yi, D.; Ackley, S.F. Monitoring lake level changes on the Tibetan Plateau using ICESat altimetry data (2003–2009). Remote Sens. Environ. 2011, 115, 1733–1742. [Google Scholar] [CrossRef]
- Treichler, D.; Kääb, A. ICESat laser altimetry over small mountain glaciers. Cryosphere 2016, 10, 2129–2146. [Google Scholar] [CrossRef] [Green Version]
- Pelto, M. Utility of late summer transient snowline migration rate on Taku Glacier, Alaska. Cryosphere 2011, 5, 1127–1133. [Google Scholar] [CrossRef]
- Willmott, C.J.; Matsuura, K. Terrestrial Air Temperature and Precipitation: Monthly and Annual Time Series (1900–2017). 2018. Available online: http://climate.geog.udel.edu/~climate/html_pages/d (accessed on 3 October 2019).
- Paul, F.; Bolch, T.; Briggs, K.; Kääb, A.; McMillan, M.; McNabb, R.; Nagler, T.; Nuth, C.; Rastner, P.; Strozzi, T.; et al. Error sources and guidelines for quality assessment of glacier area, elevation change, and velocity products derived from satellite data in the Glaciers_cci project. Remote Sens. Environ. 2017, 203, 256–275. [Google Scholar] [CrossRef] [Green Version]
- Paul, F.; Barrand, N.E.; Baumann, S.; Berthier, E.; Bolch, T.; Casey, K.; Frey, H.; Joshi, S.P.; Konovalov, V.; Le Bris, R.; et al. On the accuracy of glacier outlines derived from remote-sensing data. Ann. Glaciol. 2013, 54, 171–183. [Google Scholar] [CrossRef] [Green Version]
- Granshaw, F.D.; Fountain, A.G. Glacier change (1958–1998) in the North Cascades National Park Complex, Washington, USA. J. Glaciol. 2006, 52, 251–256. [Google Scholar] [CrossRef] [Green Version]
- Osmonov, A.; Bolch, T.; Xi, C.; Kurban, A.; Guo, W. Glacier characteristics and changes in the Sary-jaz river basin (Central Tien Shan, Kyrgyzstan)—1990–2010. Remote Sens. Lett. 2013, 4, 725–734. [Google Scholar] [CrossRef] [Green Version]
- Braithwaite, R.J.; Raper, S.C.B. Estimating equilibrium-line altitude (ELA) from glacier inventory data. Ann. Glaciol. 2009, 50, 127–132. [Google Scholar] [CrossRef] [Green Version]
- Li, Y.; Li, Y. Topographic and geometric controls on glacier changes in the central Tien Shan, China, since the Little Ice Age. Ann. Glaciol. 2014, 55, 177–186. [Google Scholar] [CrossRef] [Green Version]
- Garg, P.K.; Shukla, A.; Jasrotia, A.S. Influence of topography on glacier changes in the central Himalaya, India. Glob. Planet. Chang. 2017, 155, 196–212. [Google Scholar] [CrossRef]
- Li, Y.; Li, Y.; Lu, X.; Harbor, J. Geomorphometric Controls on Mountain Glacier Changes Since the Little Ice Age in the Eastern Tien Shan, Central Asia. Ann. Am. Assoc. Geogr. 2017, 107, 284–298. [Google Scholar] [CrossRef]
- Pan, C.G.; Pope, A.; Kamp, U.; Dashtseren, A.; Walther, M.; Syromyatina, M.V. Glacier recession in the Altai Mountains of Mongolia in 1990–2016. Geogr. Ann. Ser. A Phys. Geogr. 2018, 100, 185–203. [Google Scholar] [CrossRef]
- Scherler, D.; Bookhagen, B.; Strecker, M.R. Hillslope-glacier coupling: The interplay of topography and glacial dynamics in High Asia. J. Geophys. Res. Earth Surf. 2011, 116, F02019. [Google Scholar] [CrossRef]
- Evans, I.S. Local aspect asymmetry of mountain glaciation: A global survey of consistency of favoured directions for glacier numbers and altitudes. Geomorphology 2006, 73, 166–184. [Google Scholar] [CrossRef]
- Aizen, V.B.; Kuzmichenok, V.A.; Surazakov, A.B.; Aizen, E.M. Glacier changes in the Tien Shan as determined from topographic and remotely sensed data. Glob. Planet. Chang. 2007, 56, 328–340. [Google Scholar] [CrossRef]
- Liu, S.; Ding, Y.; Shangguan, D.; Zhang, Y.; Li, J.; Han, H.; Wang, J.; Xie, C. Glacier retreat as a result of climate warming and increased precipitation in the Tarim river basin, northwest China. Ann. Glaciol. 2006, 43, 91–96. [Google Scholar] [CrossRef] [Green Version]
- Che, Y.; Zhang, M.; Li, Z.; Wang, S.; Du, M.; Wang, P.; Wang, J.; Zhou, P. Quantitative evaluation of glacier change and its response to climate change in the Chinese Tien Shan. Cold Reg. Sci. Technol. 2018, 153, 144–155. [Google Scholar] [CrossRef]
- Wang, Y.; Hou, S.; Liu, Y. Glacier changes in the Karlik Shan, eastern Tien Shan, during 1971/72–2001/02. Ann. Glaciol. 2009, 50, 39–45. [Google Scholar] [CrossRef] [Green Version]
- Shi, Y.F.; Ren, J.W. Glacier recession and lake shrinkage indicating a climatic warming and drying trend in central Asia. Ann. Glaciol. 1990, 14, 261–265. [Google Scholar]
- Owen, L.A.; Finkel, R.C.; Barnard, P.L.; Ma, H.Z.; Asahi, K.; Caffee, M.W.; Derbyshire, E. Climatic and topographic controls on the style and timing of Late Quaternary glaciation throughout Tibet and the Himalaya defined by Be-10 cosmogenic radionuclide surface exposure dating. Quat. Sci. Rev. 2005, 24, 1391–1411. [Google Scholar] [CrossRef]
- Aizen, V.B.; Aizen, E.M.; Nikitin, S.A. Glacier regime on the northern slope of the Himalaya (Xixibangma glaciers). Quat. Int. 2002, 97, 27–39. [Google Scholar] [CrossRef]
- Rupper, S.; Roe, G. Glacier changes and regional climate: A mass and energy balance approach. J. Clim. 2008, 21, 5384–5401. [Google Scholar] [CrossRef]
- Bahr, D.B.; Pfeffer, W.T.; Sassolas, C.; Meier, M.F. Response time of glaciers as a function of size and mass balance: 1. Theory. J. Geophys. Res. Solid Earth 1998, 103, 9777–9782. [Google Scholar] [CrossRef]
- Grudd, H. Small glaciers as sensitive indicators of climatic fluctuations. Geogr. Ann. Ser. A 1990, 72, 119–123. [Google Scholar] [CrossRef]
- Meier, M.F.; Dyurgerov, M.B.; McCabe, G.J. The health of glaciers: Recent changes in glacier regime. Clim. Chang. 2003, 59, 123–135. [Google Scholar] [CrossRef]
- De Angelis, H. Hypsometry and sensitivity of the mass balance to changes in equilibrium-line altitude: The case of the Southern Patagonia Icefield. J. Glaciol. 2014, 60, 14–28. [Google Scholar] [CrossRef] [Green Version]
- Aizen, V.B.; Aizen, E.M.; Melack, J.M.; Dozier, J. Climatic and hydrologic changes in the Tien Shan, central Asia. J. Clim. 1997, 10, 1393–1404. [Google Scholar] [CrossRef]
- Chen, F.-H.; Chen, J.-H.; Holmes, J.; Boomer, I.; Austin, P.; Gates, J.B.; Wang, N.-L.; Brooks, S.J.; Zhang, J.-W. Moisture changes over the last millennium in arid central Asia: A review, synthesis and comparison with monsoon region. Quat. Sci. Rev. 2010, 29, 1055–1068. [Google Scholar] [CrossRef]
- Cruz, R.V.; Harasawa, H.; Lal, M.; Wu, S. Chapter 10 Asia: Climate Change 2007: Impacts. In Adaptation and Vulnerability IPCC Fourth Assessment Report: Working Group II Report; Cambridge University Press: Cambridge, UK, 2007; pp. 469–506. [Google Scholar]
- Böhner, J. General climatic controls and topoclimatic variations in Central and High Asia. Boreas 2006, 35, 279–295. [Google Scholar] [CrossRef]
- Song, S.; Bai, J. Increasing winter precipitation over arid central Asia under global warming. Atmosphere 2016, 7, 1–13. [Google Scholar] [CrossRef] [Green Version]
Figure 1.
The location and extent of the study area. (a) the general location of (b) in Central Asia; (b) the Borohoro study area (red box) relative to the Tian Shan in Xinjiang, China; (c) the mapped glaciers and footprints of Ice, Cloud and Land Elevation Satellite (ICESat) altimetry data within the focused spatial extent (dashed line). The background is from the Sentinel 2A satellite image acquired on 20 August 2018 in false color composite.

Figure 2.
(a) Distribution of the median elevation of glaciers by size classes (the violin plot) and the number of glaciers in each class (the bar plot); the inset shows the overall hypsometric distribution of glaciers; (b) the distribution of glaciers by mean aspect (summed to eight directions); (c) histogram of mean slope; (d) histogram of hypsometric integral. The sample is 224 glaciers derived in 2018.

Figure 3.
Relative glacier area change (%) between 1977 and 2018 in the study region. The red layer, which represents the glacier extent in 1977, is underlain 2018 glaciers color-filled with various degrees of glacier loss. The hatched glaciers represent the ones that have disappeared in the period of 1977–2018.

Figure 4.
Examples of satellite images and outlines of shrinking glaciers in the Borohoro Mountain (see Figure 3 for location) for 1977 (yellow)—Hexagon image, 1994 (pink)—Landsat 5 TM, 2004 (blue)—Landsat 5 TM, and 2018 (red)—Sentinel 2A. (a) illustrates fragmented entities, newly exposed bedrocks and proglacial lakes, and change of debris cover; (b) illustrates significant reduction in area and a complete disappearance of small glaciers.

Figure 5.
Error-bar plots of glacier area change by class size in absolute term (a) and in relative term (b). The bar length above and below the line represents one standard deviation from the group mean.
Figure 5.
Error-bar plots of glacier area change by class size in absolute term (a) and in relative term (b). The bar length above and below the line represents one standard deviation from the group mean.

Figure 6.
Relative change in glacier area (1977–2018) plotted against the natural logarithm of the glacier size (a), median elevation (b), elevation range (c), mean slope (d), hypsometric integral (e), and aspect (f).
Figure 6.
Relative change in glacier area (1977–2018) plotted against the natural logarithm of the glacier size (a), median elevation (b), elevation range (c), mean slope (d), hypsometric integral (e), and aspect (f).

Figure 7.
Correlation matrix for the relative area change (1977–2018) and nine topographic factors of glaciers. ln(A) is the natural logarithm transformation of glacier area. * indicates significance at the 0.1 level (p < 0.1); ** indicates significance at the 0.05 level (p < 0.05); *** indicates significance at the 0.01 level (p < 0.01).

Figure 8.
Distribution of ICESat footprints within different parts of glaciers (red: the ablation zone; blue: the accumulation zone) and elevation difference (dh) trends in the period of 2003–2009 for glacier ID-27 (upper panel) and glacier ID-16 (lower panel).
Figure 8.
Distribution of ICESat footprints within different parts of glaciers (red: the ablation zone; blue: the accumulation zone) and elevation difference (dh) trends in the period of 2003–2009 for glacier ID-27 (upper panel) and glacier ID-16 (lower panel).

Figure 9.
Mean annual temperature (a) and total annual precipitation (b) from 1900 to 2017 from the University of Delaware gridded climate dataset. Red curves represent 10-year smoothed average values. Linear trends are indicated by the black dashed lines for the period after 1977.
Figure 9.
Mean annual temperature (a) and total annual precipitation (b) from 1900 to 2017 from the University of Delaware gridded climate dataset. Red curves represent 10-year smoothed average values. Linear trends are indicated by the black dashed lines for the period after 1977.

Figure 10.
Comparison of glacier outlines from the Randolph Glacier Inventory version 6.0 (RGIv6.0) dataset (red) and the 2018 mapping from this study (yellow). (a) The overall layout in the study area, with reference to (b) an example in the north and (c) another example in the southeast.
Figure 10.
Comparison of glacier outlines from the Randolph Glacier Inventory version 6.0 (RGIv6.0) dataset (red) and the 2018 mapping from this study (yellow). (a) The overall layout in the study area, with reference to (b) an example in the north and (c) another example in the southeast.

Figure 11.
Spatial pattern of glacier recession rates of the Tian Shan in the referenced literature (in brackets) in correspondence with the data presented in Table 5.
Figure 11.
Spatial pattern of glacier recession rates of the Tian Shan in the referenced literature (in brackets) in correspondence with the data presented in Table 5.


Table 1.
Information for satellite data, digital elevation model (DEM) and climate data used in this study.
Table 1.
Information for satellite data, digital elevation model (DEM) and climate data used in this study.
| Satellite | Sensor | Path/Row or Tile No. | Date | Spatial Resolution (m) | Source |
|---|---|---|---|---|---|
| Hexagon/KH-9 | - | - | 26 September1977 | ~8 | U.S. Geological Survey (USGS) |
| Landsat 5 | TM | 145/29 | 22 August 1994 | 30 | USGS |
| Landsat 5 | TM | 145/29 | 10 August 2007 | 30 | USGS |
| Sentinel 2A | MSI | T44TQP | 20 August 2018 | 10, 20 | USGS |
| Shuttle Radar Topography Mission (SRTM) DEM | - | - | February 2000 | ~30 | USGS |
| Ice, Cloud, and Land Elevation Satellite (ICESat)-GLAH14 | - | 2003–2009 | - | National Snow and Ice Data Center (NSIDC) | |
| U Delaware Air Temperature and Precipitation | 43.75° N, 83.75° E (grid center) | Monthly, January 1900–December 2017 | 0.5° × 0.5° (lat. × long.) | National Oceanic and Atmospheric Administration (NOAA) | |
Table 2.
Glacier characteristics for the Borohoro study area based on 2018 Sentinel 2A image and SRTM DEM.
Table 2.
Glacier characteristics for the Borohoro study area based on 2018 Sentinel 2A image and SRTM DEM.
| Properties | Size Class (km2) | |||||
|---|---|---|---|---|---|---|
| Total | 0.0–0.5 | 0.5–1.0 | 1.0–5.0 | 5.0–10.0 | 10.0–20.0 | |
| Number of glaciers | 224 | 157 | 22 | 35 | 6 | 4 |
| Total Area (km2) | 215.8 ± 4.1 | 23.3 ± 0.1 | 16.3 ± 0.1 | 73.6 ± 1.0 | 41.3 ± 1.5 | 61.3 ± 1.8 |
| Average Median Elevation (m) | 3797 ± 231 | 3813 ± 251 | 3754 ± 181 | 3760 ± 187 | 3721 ± 76 | 3809 ± 77 |
| Average Elevation Range (m) | 429 ± 285 | 307 ± 168 | 593 ± 201 | 711 ± 317 | 844 ± 139 | 1221 ± 220 |
| Average Min. Elevation (m) | 3585 ± 230 | 3656 ± 205 | 3507 ± 132 | 3407 ± 226 | 3344 ± 65 | 3176 ± 90 |
| Average Max. Elevation (m) | 4014 ± 284 | 3962 ± 282 | 4100 ± 245 | 4117 ± 261 | 4188 ± 158 | 4397 ± 187 |
| Average Mean Slope (°) | 25.2 ± 10.6 | 28.3 ± 10.3 | 22.2 ± 7.4 | 16.9 ± 7.1 | 12.7 ± 2.2 | 10.7 ± 1.6 |
| Average Aspect (°) | 5.0 ± 68.7 | 0.3 ± 60.6 | 18.7 ± 39.6 | 7.8 ± 93.0 | 1.1 ± 69.9 | 91.7 ± 26.9 |
| Average Hypsometric Integral | 0.5 ± 0.10 | 0.5 ± 0.10 | 0.4 ± 0.08 | 0.5 ± 0.09 | 0.5 ± 0.05 | 0.5 ± 0.07 |
Table 3.
Glacier area changes during 1977–2018 and in-between periods of 1977–1994, 1994–2007, and 2007–2018.
Table 3.
Glacier area changes during 1977–2018 and in-between periods of 1977–1994, 1994–2007, and 2007–2018.
| Year | No. | Total Area (km2) | Period | ΔA (km2) | ΔA (%) | ΔA/year (%) |
|---|---|---|---|---|---|---|
| 1977 | 200 | 287.5 ± 8.2 | 1977–2018 | 71.6 ± 9.2 | 24.9 ± 3.2 | 0.61 ± 0.01 |
| 1994 | 218 | 262.5 ± 6.6 | 1977–1994 | 25.0 ± 10.5 | 8.7 ± 3.7 | 0.51 ± 0.03 |
| 2007 | 221 | 231.7 ± 6.0 | 1994–2007 | 30.8 ± 8.9 | 11.7 ± 3.4 | 0.90 ± 0.07 |
| 2018 | 224 | 215.8 ± 4.1 | 2007–2018 | 15.8 ± 7.3 | 6.8 ± 3.1 | 0.62 ± 0.06 |
Table 4.
Average glacier surface elevation change rate and ICESat laser point count at different elevation bins in the Borohoro study area. Rates are calculated as the annual change between 2000 and the date cited in the first column.
Table 4.
Average glacier surface elevation change rate and ICESat laser point count at different elevation bins in the Borohoro study area. Rates are calculated as the annual change between 2000 and the date cited in the first column.
| Acquisition Date | 3000–3500 m a.s.l. | 3500–4000 m a.s.l. | 4000–4500 m a.s.l. | |||
|---|---|---|---|---|---|---|
| Rate (m year−1) | Count | Rate (m year−1) | Count | Rate (m year−1) | Count | |
| 20 October 2003 | −0.90 | 5 | 0.14 | 17 | 2.52 | 3 |
| 20 February 2004 | −0.56 | 22 | 0.19 | 18 | - | 0 |
| 25 October 2005 | −2.02 | 10 | 0.29 | 15 | - | 0 |
| 25 February 2006 | −0.75 | 6 | −0.21 | 19 | 0.23 | 4 |
| 28 October 2006 | −1.01 | 7 | −0.14 | 17 | −0.65 | 5 |
| 6 October 2007 | −1.15 | 6 | 0.03 | 18 | 1.09 | 7 |
| 7 October 2008 | −1.80 | 7 | −0.76 | 21 | - | 0 |
| 4 October 2009 | −1.04 | 4 | −0.39 | 8 | 0.66 | 5 |
Table 5.
Results of glacier shrinkage in the Tian Shan from literature discussed in Section 5.2.
Table 5.
Results of glacier shrinkage in the Tian Shan from literature discussed in Section 5.2.
| Location | Investigated Period | Number/Total Area (km2) of Glaciers | Change Rate (% year−1) | Reference |
|---|---|---|---|---|
| Eastern Terskey Alatau | 1965–2003 | 109/120 in 1965 | 0.32 | [6] Kutuzov and Shahgedanova 2009 |
| Zailiyskiy and Kungey | 1955–1999 | 192/243.5 in 1955 | 0.72 | [20] Bolch 2007 |
| Pskem | ~1970–2000 | 525/168.7 in 2007 | 0.63 | [22] Narama et al., 2010 |
| Ili-Kungoy | ~1970–2000 | 735/564.2 in 2007 | 0.40 | |
| At-Bashy | ~1970–2000 | 192/95.7 in 2007 | 0.40 | |
| SE-Fergana | ~1970–2000 | 306/171.7 in 2007 | 0.30 | |
| Bogeda | 1962–2006 | 203/144.1 in 1962 | 0.48 | [30] Li et al., 2016 |
| Ebinur Lake Basin | 1964–2004 | 446/366.3 in 2004 | 0.37 | [32] Wang et al., 2014 |
| Jinghe River Basin | 1964–2004 | 91/77.4 in 2004 | 0.38 | [37] Wang et al., 2014 |
| Akshiirak | 1977–2003 | 178/317.6 in 2003 | 0.32 | [61] Aizen et al., 2007 |
| Ala Archa | 1981–2003 | 48/36.31 in 2003 | 0.46 | |
| Aksu River Basin | 1963–1999 | 247/1760.7 in 1963 | 0.10 | [62] Liu et al., 2006 |
| Karlik | 1971/72–1992 | 122/126 in 1972 | 0.13 | [64] Wang et al., 2009 |
| 1992–2001/02 | ?/122.7 in 1992 | 0.27 | ||
| Borohoro | 1977–2018 | 224/215.8 in 2018 | 0.61 | This study |
© 2020 by the author. Licensee MDPI, Basel, Switzerland. This article is an open access article distributed under the terms and conditions of the Creative Commons Attribution (CC BY) license (http://creativecommons.org/licenses/by/4.0/).
Share and Cite
MDPI and ACS Style
Li, Y. Glacier Changes and Their Linkage to the Climate-Topographic Context in the Borohoro Mountains, Tian Shan 1977–2018. Water 2020, 12, 1502. https://doi.org/10.3390/w12051502
AMA Style
Li Y. Glacier Changes and Their Linkage to the Climate-Topographic Context in the Borohoro Mountains, Tian Shan 1977–2018. Water. 2020; 12(5):1502. https://doi.org/10.3390/w12051502
Chicago/Turabian StyleLi, Yanan. 2020. "Glacier Changes and Their Linkage to the Climate-Topographic Context in the Borohoro Mountains, Tian Shan 1977–2018" Water 12, no. 5: 1502. https://doi.org/10.3390/w12051502
Note that from the first issue of 2016, this journal uses article numbers instead of page numbers. See further details here.