Article

The First Video Witness of Coastal Boulder Displacements Recorded during the Impact of Medicane “Zorbas” on Southeastern Sicily

by
Giovanni Scicchitano
1,
Giovanni Scardino
2,*,
Sebastiano Tarascio
1,
Carmelo Monaco
3,4,5,
Giovanni Barracane
6,
Giuseppe Locuratolo
6,
Maurilio Milella
6,
Arcangelo Piscitelli
6,
Gianfranco Mazza
7 and
Giuseppe Mastronuzzi
2
1
Studio Geologi Associati T.S.T.–Via Etnea n.169, 95030 Pedara, Italy
2
Dipartimento di Scienze della Terra e Geoambientali, Università degli Studi di Bari Aldo Moro, 70121 Bari, Italy
3
Dipartimento di Scienze Biologiche, Geologiche e Ambientali, Università degli Studi di Catania, 95129 Catania, Italy
4
CRUST-Interuniversity Center for 3D Seismotectonics with Territorial Applications, 66100 Chieti Scalo, Italy
5
Istituto Nazionale di Geofisica e Vulcanologia, Osservatorio Etneo, 95131 Catania, Italy
6
Environmental Surveys S.r.l. Academic Spin-Off Università degli Studi di Bari Aldo Moro, 74121 Taranto, Italy
7
Area Marina Protetta del Plemmirio, 96100 Siracusa, Italy
*
Author to whom correspondence should be addressed.
Water 2020, 12(5), 1497; https://doi.org/10.3390/w12051497
Submission received: 4 May 2020 / Revised: 20 May 2020 / Accepted: 21 May 2020 / Published: 23 May 2020
(This article belongs to the Special Issue Relative Sea-Level Changes and their Impact on Coastal Zones)

Abstract

:
Over the last few years, several authors have presented contrasting models to describe the response of boulders to extreme waves, but the absence of direct observation of movements has hindered the evaluation of these models. The recent development of online video-sharing platforms in coastal settings has provided the opportunity to monitor the evolution of rocky coastlines during storm events. In September 2018, a surveillance camera of the Marine Protected Area of Plemmirio recorded the movement of several boulders along the coast of Maddalena Peninsula (Siracusa, Southeastern Sicily) during the landfall of the Mediterranean tropical-like cyclone (Medicane) Zorbas. Unmanned autonomous vehicle (UAV) photogrammetric and terrestrial laser scanner (TLS) surveys were performed to reconstruct immersive virtual scenarios to geometrically analyze the boulder displacements recorded in the video. Analyses highlighted that the displacements occurred when the boulders were submerged as a result of the impact of multiple small waves rather than due to a single large wave. Comparison between flow velocities obtained by videos and calculated through relationships showed a strong overestimation of the models, suggesting that values of flow density and lift coefficient used in literature are underestimated.

1. Introduction

Mediterranean hurricanes, also called Mediterranean Tropical Like Cyclones (TLCs) or medicanes, are warm-core cyclones that develop over the Mediterranean Sea [1,2,3] with characteristics similar to tropical cyclones. Such storms are constituted by rotating cloud systems characterized by gale force winds, severe precipitation, and a low pressure center, accompanied by a spiral pattern of thunderstorms [4,5,6,7]. Two specific areas appear to be the favored locations for medicane genesis: the western Mediterranean [2,8] and the central Mediterranean–Ionian Sea [9,10]. During the last decades, the impacts of medicanes along the coasts of Mediterranean basin have strongly influenced the human settlements, causing a lot of damage and casualties [6,11]. Moreover, several authors predict that, in the next future, climate changes could modify medicanes, decreasing the frequency of their occurrence but increasing the strength of their impacts [4,12,13]. In the last 10 years, two different medicanes made landfall along the coast of Southeastern Sicily; the first one occurred in 2014 and was called Qendresa, and the second occurred in 2018 and was called Zorbas.
In September 2018, Medicane Zorbas impacted the Ionian coasts of Southeastern Sicily and was registered along the coasts of Apulia, Basilicata, and Calabria with minor energy [14]. Evidence of this storm event was observed along the rocky coast of the Maddalena Peninsula (Siracusa, southeastern Sicily; Figure 1), where a surveillance camera of the Marine Protected Area of Plemmirio recorded several boulder displacements that occurred inside an ancient Greek quarry. This coastal sector is characterized by the presence of important boulder fields, interpreted as evidence of the impact of severe storms and tsunami events in the past [15,16]. Since 2009, the ancient quarry has been intensely monitored, using several survey techniques, to identify and analyze boulder displacements with the main purpose to verify if storm waves could be responsible for the movement of boulders which have been attributed to tsunami events [15].
A determination if storm or tsunami waves were responsible for the boulder displacements on coastal area has been the object of considerable debate. Several studies agree that severe storms are generally able to displace most of the small boulders found along coastlines all over the world [17,18,19,20,21,22]. Some authors proposed that, although boulder displacements occur both during storm and tsunami events, the main cause for movements of the biggest boulders are probably tsunami [15,23]. In contrast, other studies ascribe storms the capability to detach and transport the boulders [24]. A new debate has been recently opened on the number of tsunami events reconstructed for the Mediterranean Sea. Marriner et al. [25] consider this number strongly overestimated, contesting the attribution to tsunami of most of the field evidences described in the literature, and suggesting that cyclical periods of increased storminess, driven by late Holocene climate changes, would be responsible for them. Vött et al. [26] replied to this theory disputing the tsunami DB and the statistical analyses used by Marriner et al. [25], confirming the reliability of the literature in the definition of tsunami events occurred in the Mediterranean Sea.
The Mediterranean basin, due to the lack extreme events such as cyclones, has been considered an excellent area for studies aimed to describe tsunami events [27]. In the absence of observatories, the analytical approach for the study boulder displacements has been the application of different hydrodynamic models (e.g., references [28,29,30,31,32]) to estimate the main features of the wave responsible for the dislocation (Typology, Wave Height, Wave flow velocity). To apply these models it is fundamental to acquire high-resolution data of the boulders (size, volume and mass), but it is also very important to reconstruct (i) the scenario in which the movement occurred (joint bounded or subaerial/submerged); (ii) the typology of movement (sliding, rolling/overturning, saltation/lifting); and (iii) the entity of displacement. These parameters are often very complicated to deduct by field evidence [33,34]. Up to the present, all the studies started from the assumption that the different position of a boulder, after and before an extreme marine event, represents the effect of a single wave impact [20,30,35]. For these reasons, until now, it has been very difficult to test the reliability of the hydrodynamic models in the description of the natural processes.
The aim of this work is to overcome this problem through the analyses of video recorded along the Maddalena Peninsula. Given that video witness has never been used before to analyze boulder displacements, we defined a methodology to reconstruct immersive scenarios, useful for georeferencing the images recorded in the video and to accurately measure, from them, several important parameters such as the wave heights at time of impacts and the wave flows at time of displacements. This kind of approach let us accurately test hydrodynamic equations, showing a significant overestimation of them, probably due to an underestimation of important parameter, such as seawater flow density and lift coefficient [31,32,36,37].
Furthermore, the work provides evidence about the dynamics of boulder movements, suggesting that single wave impacts are unlikely to be responsible for displacements, which normally occur as a result of multiple waves impact, generating a turbulent flow able to nullify frictions. In addition, our work shows that some boulders, previously interpreted as deposited by a tsunami event, have never been displaced in 10 years of monitoring, and so accord with the hypothesis that only tsunamis could be responsible for the deposition of boulders with particular features as dimension and shape.

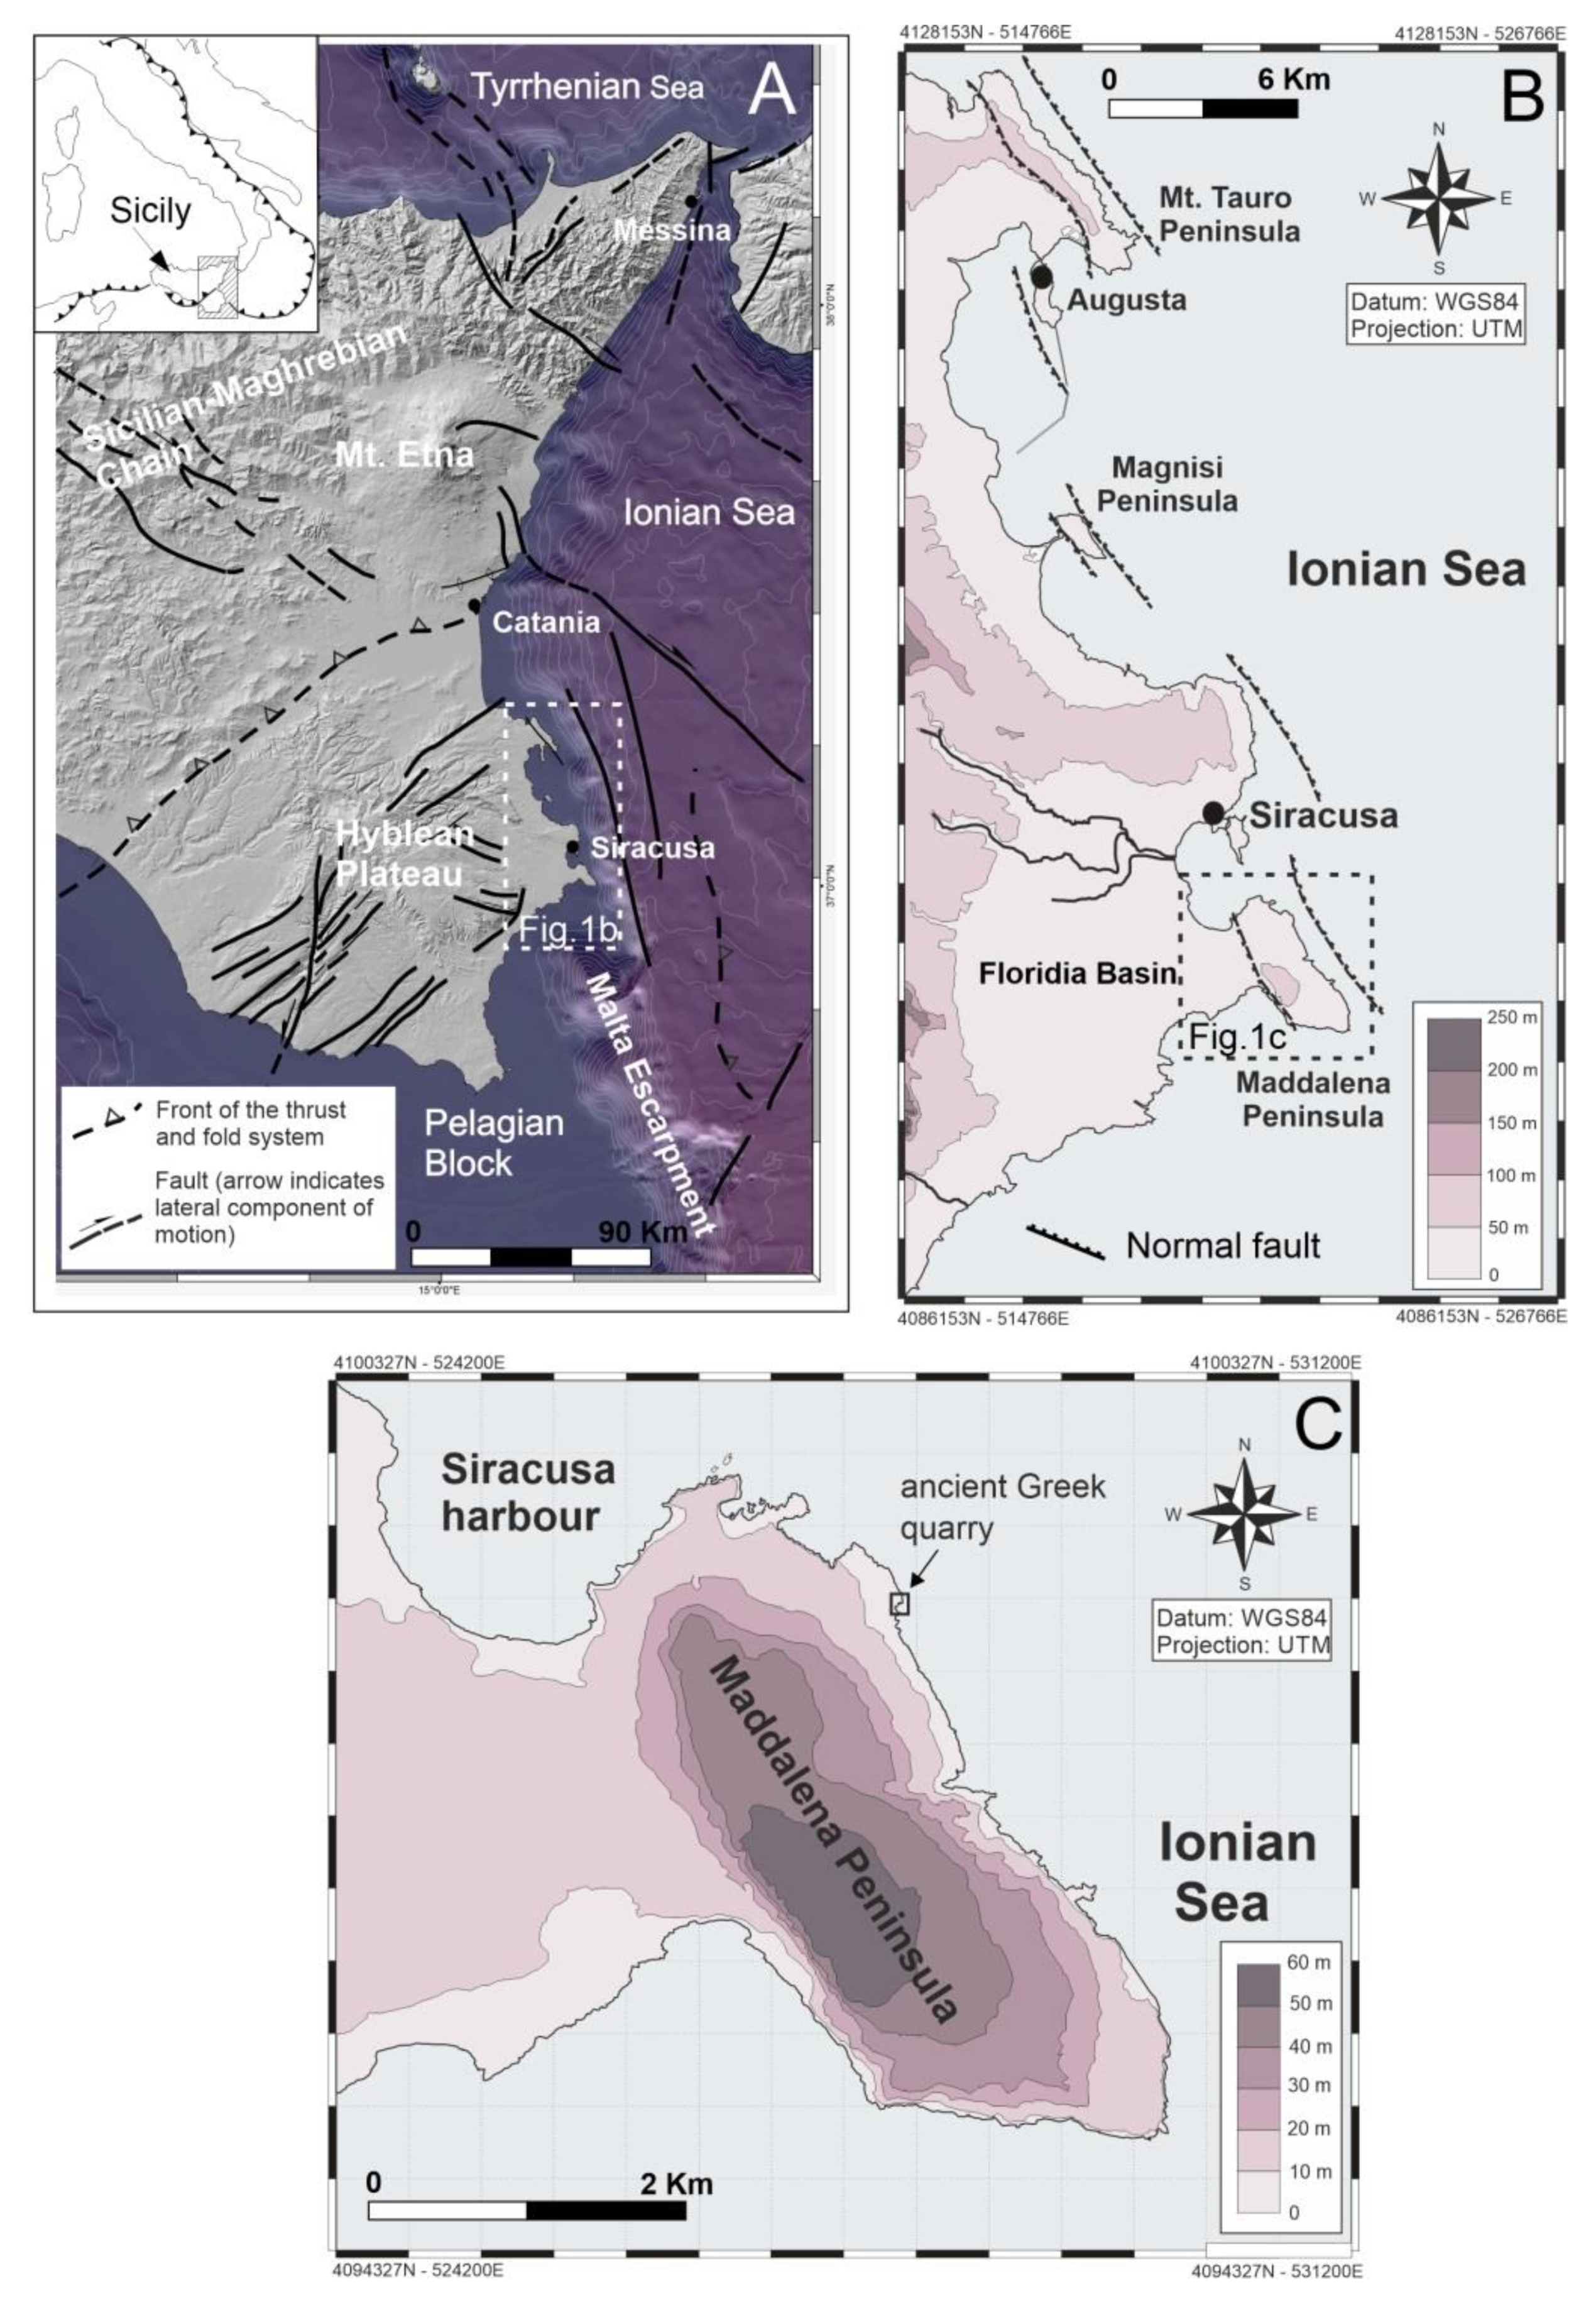
2. Geological Settings

Southeastern Sicily (Figure 1A) is part of the emerged portion of the Pelagian Block, the foreland domain of the Neogene-Quaternary Sicilian Collision Zone [38]. It is mostly formed by the Hyblean Plateau that along the Ionian coastline is dissected by a system of Quaternary normal faults bounding NNW–SSE oriented horst and graben structures [39]. The Maddalena Peninsula, constituted by a Neogene-Quaternary calcareous succession, is one of the horst structures located along the Ionian coast of southeastern Sicily (Figure 1B). The whole area lies at the footwall of a large normal fault system that, since the Middle Pleistocene, has reactivated the Malta Escarpment [40], a large Mesozoic boundary separating the Pelagian Block from the Ionian oceanic domain to the East [41,42,43].
Southeastern Sicily is one of the most seismically active areas of the central Mediterranean. It is characterized by a high level of crustal seismicity producing earthquakes with intensities of up to XI–XII Mercalli-Cancani-Sieberg (MCS) and M ~7, such as the 1169, 1693, and 1908 events [44,45,46] and related tsunami [15,16,47,48,49]. Being located along a collisional belt, at the footwall of a normal fault system, the analyzed coastal area has experienced vertical deformation that, combined with sea-level changes, has been recorded by several orders of Middle-Upper Quaternary marine terraces and palaeo-shorelines [40,50,51,52]. However, since the Late Pleistocene the Maddalena Peninsula (Figure 1C) was tectonically stable, as inferred from the elevation of the MIS 5.5 terraces [53] but lightly uplifting in the Holocene [54,55,56,57]. According to Anzidei et al. [58], during the last few decades, Global Positioning System (GPS) data and Glacial Isostatic Adjustment (GIA) models indicated current weak subsidence at rates close to 1 mm/yr. This is relevant considering that the area is undergoing heavy coastal retreat and so is exposed to severe storms associated with high-waves, also as a consequence of the global sea-level rise [59,60,61,62].
The Ionian coast of Southeastern Sicily, between the towns of Augusta and Siracusa, is characterized by the occurrence of anomalous calcareous and calcarenitic boulders. Scicchitano et al. [15] performed direct observations on these boulders (distance from the coastline, size and weight), together with statistical analysis of the storm regime of the area and hydrodynamic estimations, to verify if tsunami or storm waves were responsible for their detachment and transport. Radiocarbon age determinations of marine organisms encrusting the blocks, compared to historical catalogues, suggested that, in the last 1000 years, the largest earthquakes with local sources (e.g., the 1169, 1693, and 1908 events) could have triggered tsunami waves that displaced the largest boulders occurring in the area. Other evidence of these tsunami events were found along the coasts of Southeastern Sicily, inside several lagoons [63,64,65] and in coastal deposits [48].
Along Maddalena Peninsula, boulder deposits usually occur on large surfaces gently sloping towards the sea, bordered by high cliffs up to 5 m, formed by Pleistocene depositional terraces or rock platforms dissecting Neogene sub-horizontal, well-stratified, and fractured limestones. The surveillance camera detected boulder displacements inside an ancient Greek quarry located in the northern sector of the Maddalena Peninsula, whose floor has been partially submerged by Holocene sea level rise (up to 40 cm [54]). Boulders located inside the quarry were surveyed with terrestrial laser scanner (TLS) techniques in order to estimate, through the use of a specific hydrodynamic equation [30], the inland penetration limit of the tsunami responsible for the deposition of the block [16]. The two biggest boulders surveyed inside the quarry were represented by a boulder of about 13 ton in weight, previously attributed to a tsunami impact [15], and a boulder of about 41 ton displaced in January 2009 by a storm. Hydrodynamic analyses performed by several authors reveal that coasts of Southeastern Sicily can be affected by severe storm which generate waves able to detach large blocks from the coastal edge and transport them inland [15,16,19,24,66,67].
For the Ionian coast of Sicily, significant spectral wave height (Hm0) and peak period (Tp), recorded during the last 18 years by the Catania buoy (RON—Rete Ondametrica Nazionale; www.idromare.com [68]), are available (Figure 2A). Wave data recorded by the Catania buoy indicated that the most severe storm, which occurred on 2 February 1996, was characterized by significant spectral wave height (Hm0) of about 6.2 m and peak period Tp = 11.3 s. According to Inglesi et al. [69], the return value Hm0 (50) corresponding to a return period of 50 years in the Catania sector do not exceed 6.24 m. A monitoring operated at the quarry located on Maddalena Peninsula indicated that the main boulder displacements have occurred as result of three distinct storms that occurred in 2009, 2014, and 2018. The events of 2014 and 2018 were two medicanes, called Qendresa and Zorbas, respectively. Qendresa formed on 5 November and rapidly intensified two days later, reaching peak intensity on 7 November. It directly hit Malta in the afternoon and then crossed the Eastern coast of Sicily on 8 November. Later, the cyclone weakened significantly and dissipated over Crete on 11 November. Measurements taken by the ondametric buoy of Crotone and Catania (RON—Rete Ondametrica Nazionale; www.idromare.com [68,70]; Figure 2B), during the passage of Qendresa, show values of significant spectral wave height Hm0 of about 4 m. Medicane Zorbas emerged into the Aegean Sea, moved westward to reach the center of Ionian sea, then inverted its track, moving over northwestern Turkey. Although Zorbas did not affect southeastern Sicily directly, as in the case of Medicane Qendresa, its impact induced similar effects, as recorded by satellite data in off-shore (significant wave height Hs of about 4.1 m) (source AVISO satellite altimetry, credits CLS/CNES [71]). Another relevant effect induced by Zorbas was a storm surge, up to 1m above, detected by the tide gauge sited inside Catania harbor (Figure 2C) and also observed in the video recorded in the Maddalena Peninsula.

3. Material and Methods

In 2003, the technicians of the Marine Protected Area of Plemmirio installed 10 surveillance stations along the coasts of Maddalena Peninsula with the aim to detect illegal fishing operations and to monitoring sea conditions. One of these stations was positioned in proximity of the ancient Greek quarry sited in the northern sector of the Maddalena Peninsula (Figure 3A). The stations are mounted 9 m high on a pole (Figure 3B) and equipped with a HDTV camera (Figure 3C) with 30x optical zoom framing the coastal area (lens 4.3–129 mm; F1.6–4.7; horizontal field of view: 65.6°–2.0°; vertical field of view: 39.0°–1.2°).
During 28 September 2019, the camera recorded about 4 h of video during the Medicane Zorbas. Analyses of this video identified 28 boulder movements inside the quarry. Some of these boulders were already present, and they had been attributed both to tsunami and storm events [15]. The others were detached from the submerged area and transported inland during the Medicane Zorbas. In order to proceed with the analysis of the videos extracted from the Control Center Data Base (resolution 1920 × 1080, frame rate of 25 fps, 50 Hz), it has been necessary to reconstruct a detailed and accurate immersive virtual scenario of the quarry and of the boulders, pre and post the impact of Medicane Zorbas.
In 2009, the northern sector of the Maddalena Peninsula was surveyed using Terrestrial Laser Scanner (TLS) techniques in order to reconstruct the morpho-topographic features of the quarry and of the boulders inside it [16]. The survey was performed by scanning the area from four different points, located on the top of the quarry and from two other points sited inside it. The complete TLS dataset was treated and analyzed by using HDS Cyclone software in order to remove any outliers such as vegetation or anthropogenic features. Then, a dense cloud of points was generated permitting the reconstruction of a 3D model of the quarry and of the boulders present in it. Moreover, since the acquisition of TLS data, we started to monitor the boulder positions inside the quarry by surveying after every storm event, through RTK-GPS techniques, benchmarks located on boulders reconstructed with TLS. In January 2015, a few months after the Medicane Qendresa (8 September 2014), we performed UAV photogrammetric surveys of the quarry to detect the position of the boulders displaced during the Medicane. The results convinced us to replace TLS with UAV photogrammetry techniques (cheaper than TLS and with similar resolution and accuracy) to monitor boulder movements occurring inside the quarry. With this aim, we performed surveys in 2016–2018.
A pre-impact virtual immersive scenario has been modelled combining cloud points reconstructed with TLS in 2009 with the cloud points detected with the UAV photogrammetric surveys performed on 2017. This scenario was used to detect in the video morphological features, such as the edges of the quarry, useful as benchmarks to geometrically analyze, through specific software, the images recorded in the video showing boulder movements. To reconstruct the post-impact virtual immersive scenario we performed, three days after the impact of the Medicane Zorbas, an UAV photogrammetric survey (Figure 3D) of the quarry area together with a proximity photogrammetric survey of the new boulders displaced on the coast.
Geographic Information System (GIS) analyses of the products of previous and recent surveys let us identify most of the boulders appearing in the recorded video (the others have probably been fragmented into smaller blocks). The video has been analyzed by Tracker (https://physlets.org/tracker/ [73]), a video analysis and modelling software built on the Open Source Physics (OSP, Doug Brown, Cabrillo College, California, U.S.) Java framework. Distance between specific features clearly visible in the video, as for example quarry edges, holes, and fractures, were inserted as a spatial reference in Tracker. Once defined, the spatial reference, tagging in each frame of the video objects in motion (boulders, waves, and flows), the software is able to calculate velocity and accelerations. We focused our analyses on the estimation of the flow velocity at time boulder movements occurred.
From the assessment of boulder features, we have calculated, through the hydrodynamic equations of Nandasena et al. [32], the flow needed to start the movements of the blocks analyzed in the videos. Flow values estimated trough video analyses were compared with those calculated with the Nandasena et al. [32] model in order to evaluate the possible discrepancies.

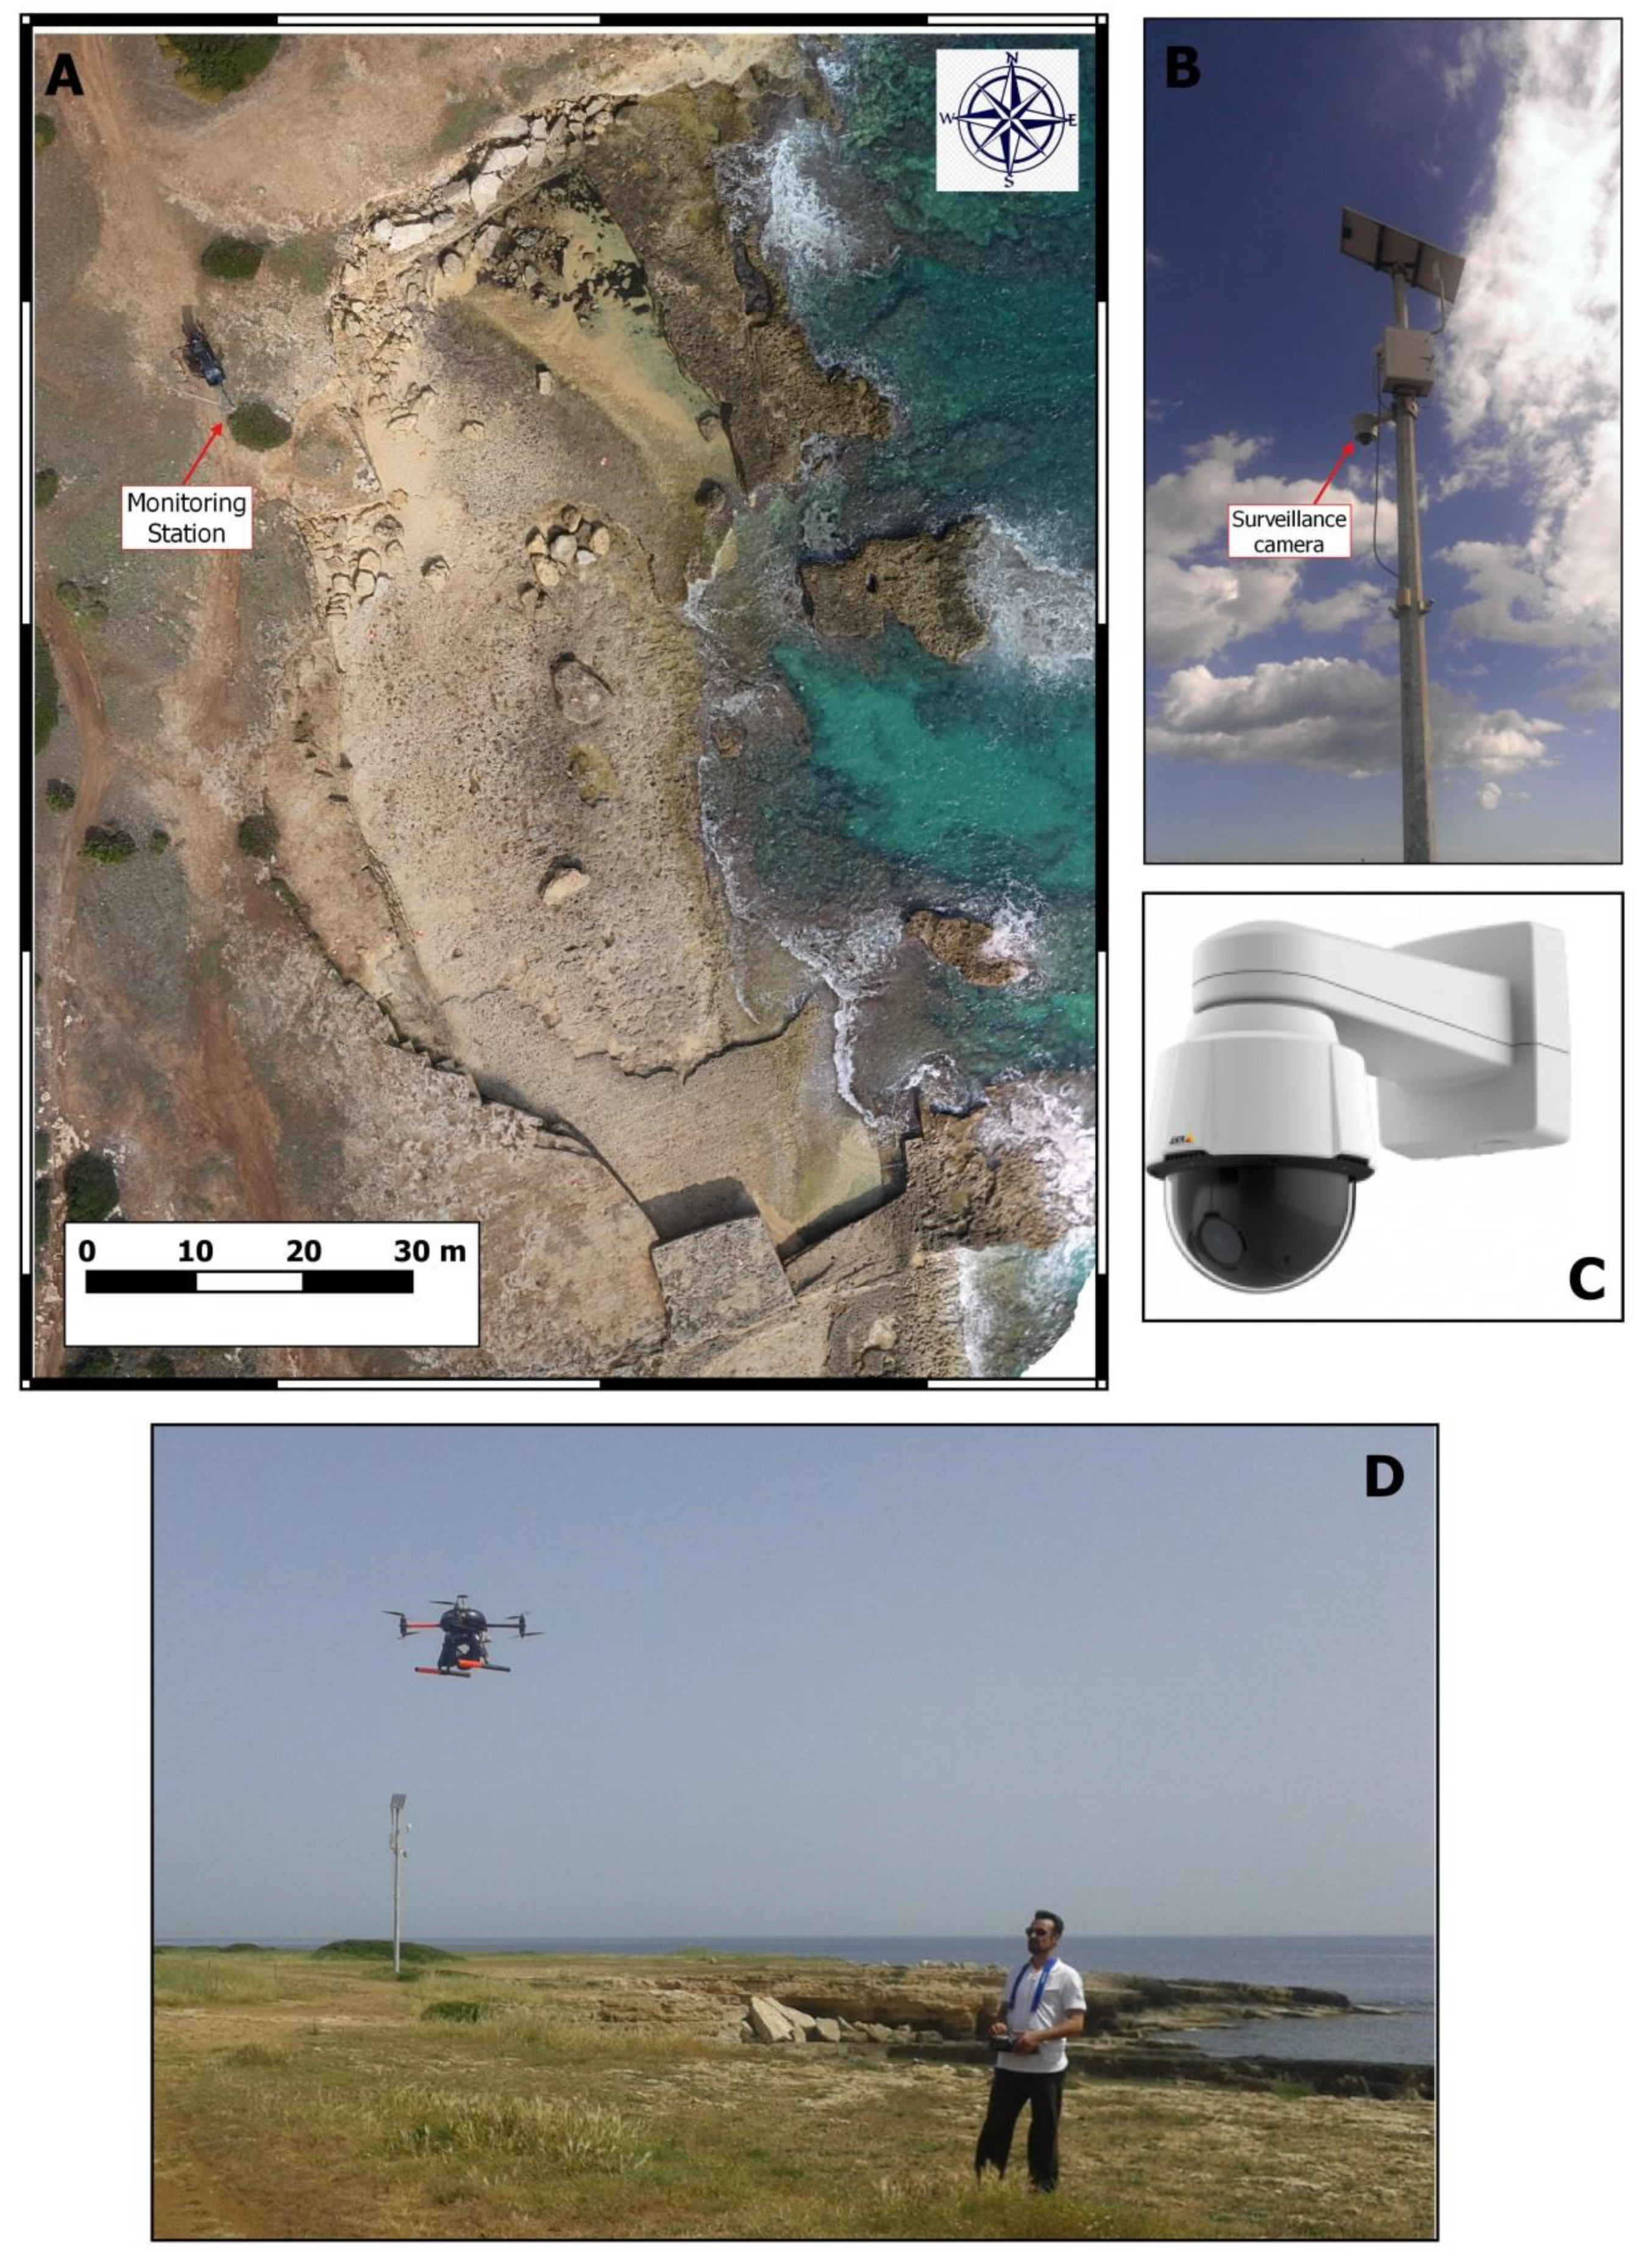
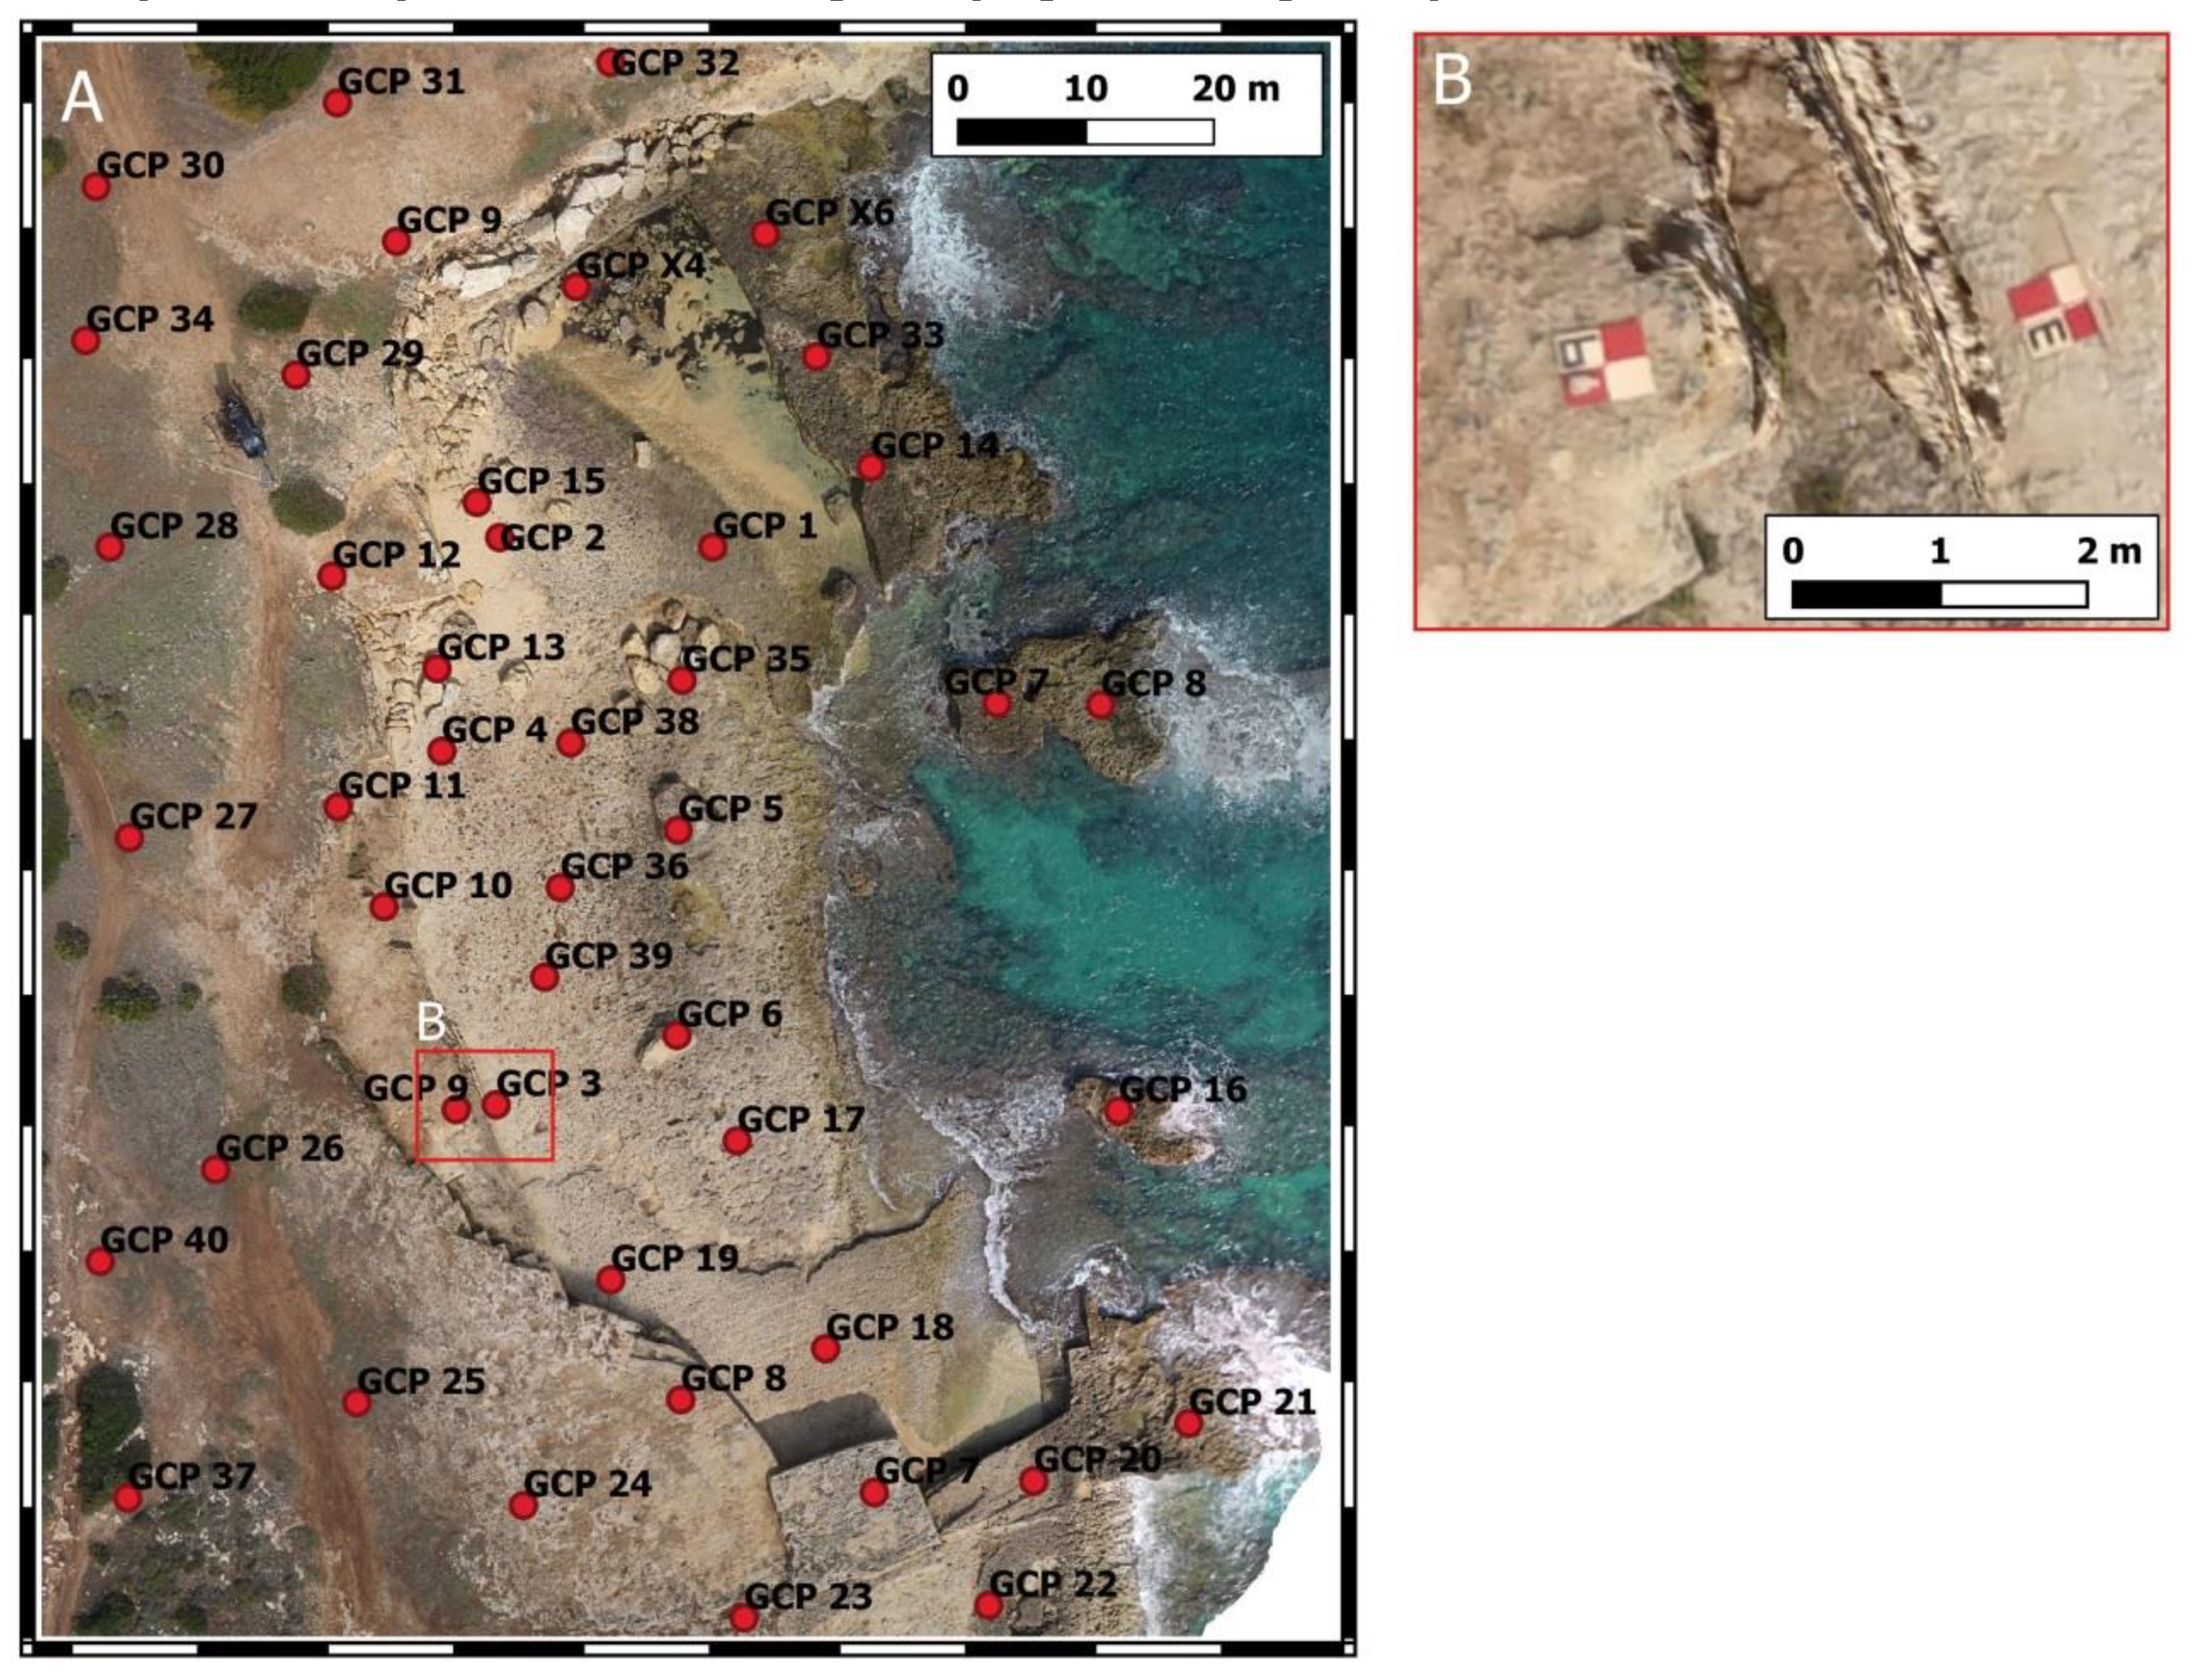
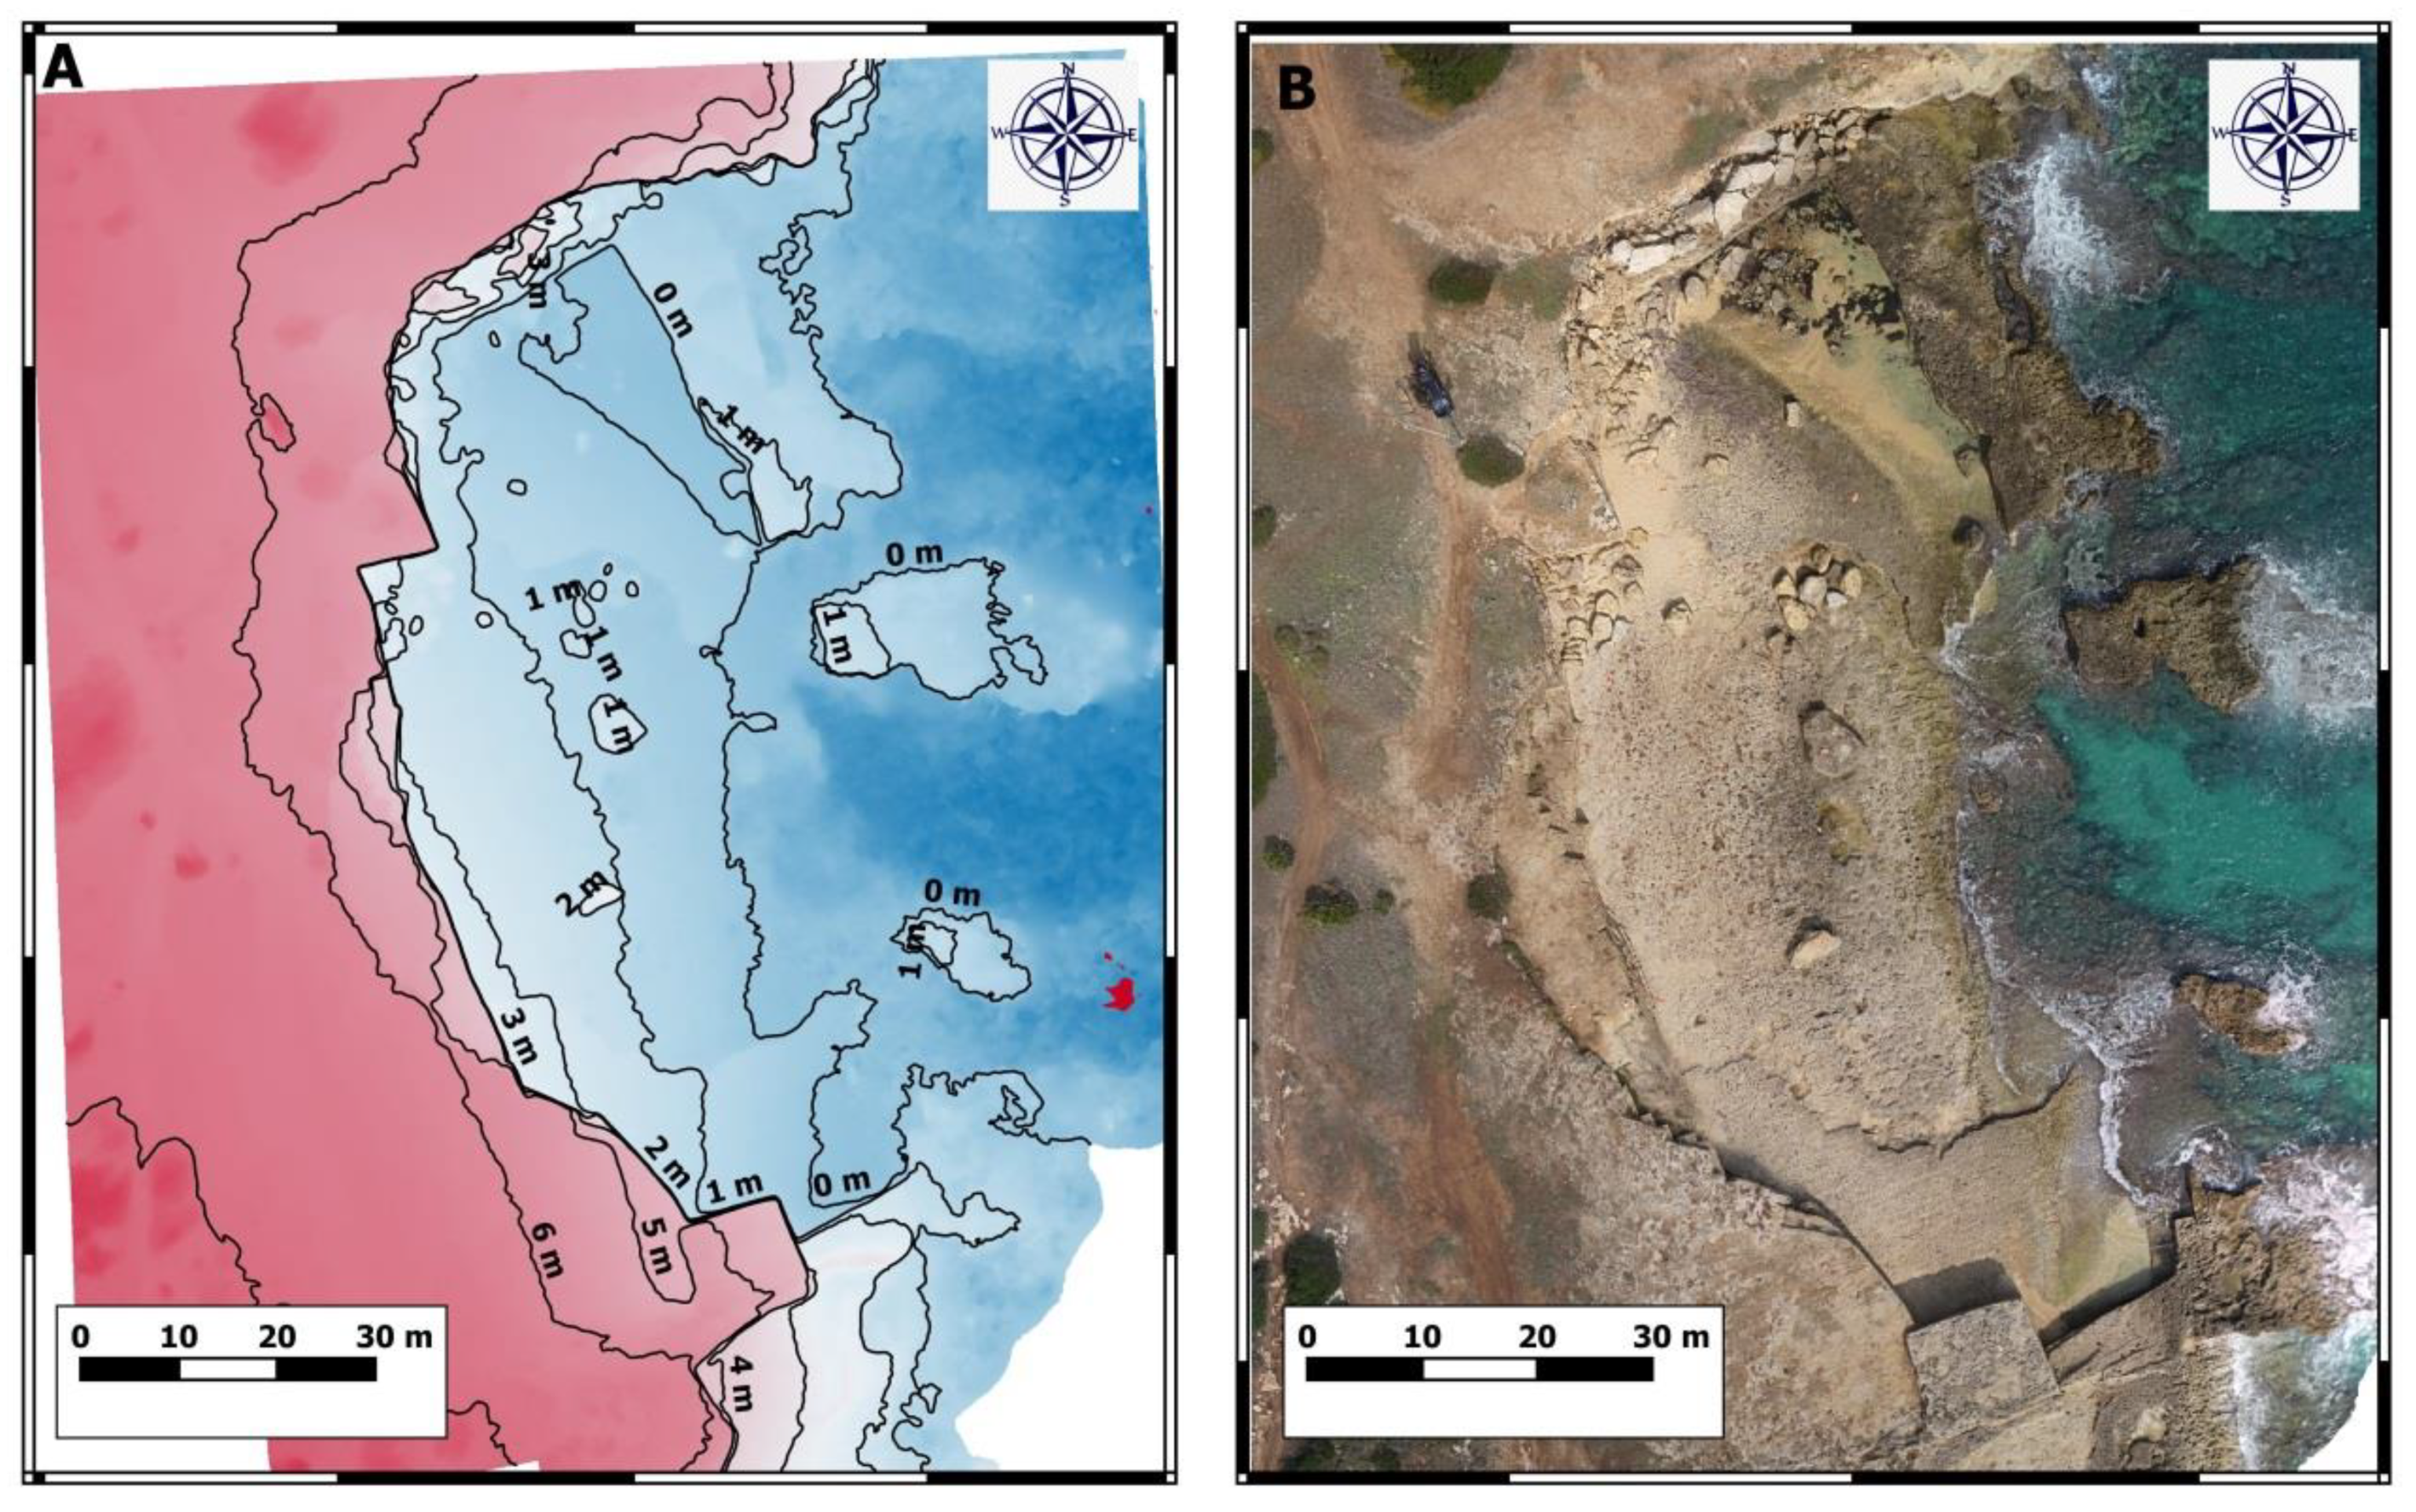
3.1. UAV Data and GIS Analyses

The use of Unmanned Autonomous Vehicles (UAV), better known as drones, in various fields of geoscience has increased during the last five years. In coastal geomorphology studies, UAV photogrammetry techniques have been applied for flood estimation [58,74] and for boulder field monitoring [20,21]. Since 2015, the area of study has been seasonally monitored with UAV photogrammetry surveys in order to detect boulder movements inside the Greek quarry sited in Maddalena Peninsula. Considering the large number of boulders displaced during the impact of the storm generated by the Medicane Zorbas, we performed an UAV survey three days after the storm. The survey was performed with a Multicopter NT4 Airvision (Studio Geologi Associati T.S.T., Catania, Italy) (Figure 3), equipped with an High Definition camera (resolution 24Mpx, lens 16 mm, f3, 5–5, 6), that flew at 30m of altitude, during four distinct flights, with a speed of 1.5 m/s.
In order to obtain an accurate georeferencing of the UAV data, we used the ground control point (GCP) net installed in 2015 and composed of 40 benchmarks regularly spaced along the quarry area (Figure 4A). Benchmarks positions were surveyed with real-time kinematic (RTK) GPS performing 1 h of acquisition for each point of the net. Colored markers, visible from 30 m of altitude, were placed on the benchmarks (Figure 4B) before realizing the flights. A total of 152 pictures were collected and processed using Agisoft Photoscan Professional software version 1.4.0 (St. Petersburg, Russia) to obtain a high-resolution digital elevation model (DEM, 2 cm grid cell; Figure 5A) and orthophotographs (1 cm/pxl; Figure 5B).
These two products were integrated into the general Geo Data Base developed in 2009 and composed by (i) orthophotos and DEM obtained by TLS (2009) and UAV surveys (2015–2018); (ii) orthophotos provided by Regione Sicilia (2007, 2008, 2013); (iii) RTK-GPS data of boulder positions and displacements (2009–2018); and (iv) a 3D model of all boulders dislocated inside the quarry since 2009. Morpho-topographic surveys were performed every year and interpreted in the GIS environment (QGIS) through the digitalization of all the main morphological features such as boulders, fractures, detached part of coastline, score marks and sediment accumulations. These features have been compared with those extracted from the orthophotographs and DEM obtained in the previous year to identify boulder movements or other changes in coastal landscape. As it is possible to observe in Figure 6, several boulders were displaced in the studied area for effects of the impact of Medicane Zorbas; some of these were already in the area and moved from their original position, while others were detached from the infralittoral zone and deposited on the coastline.

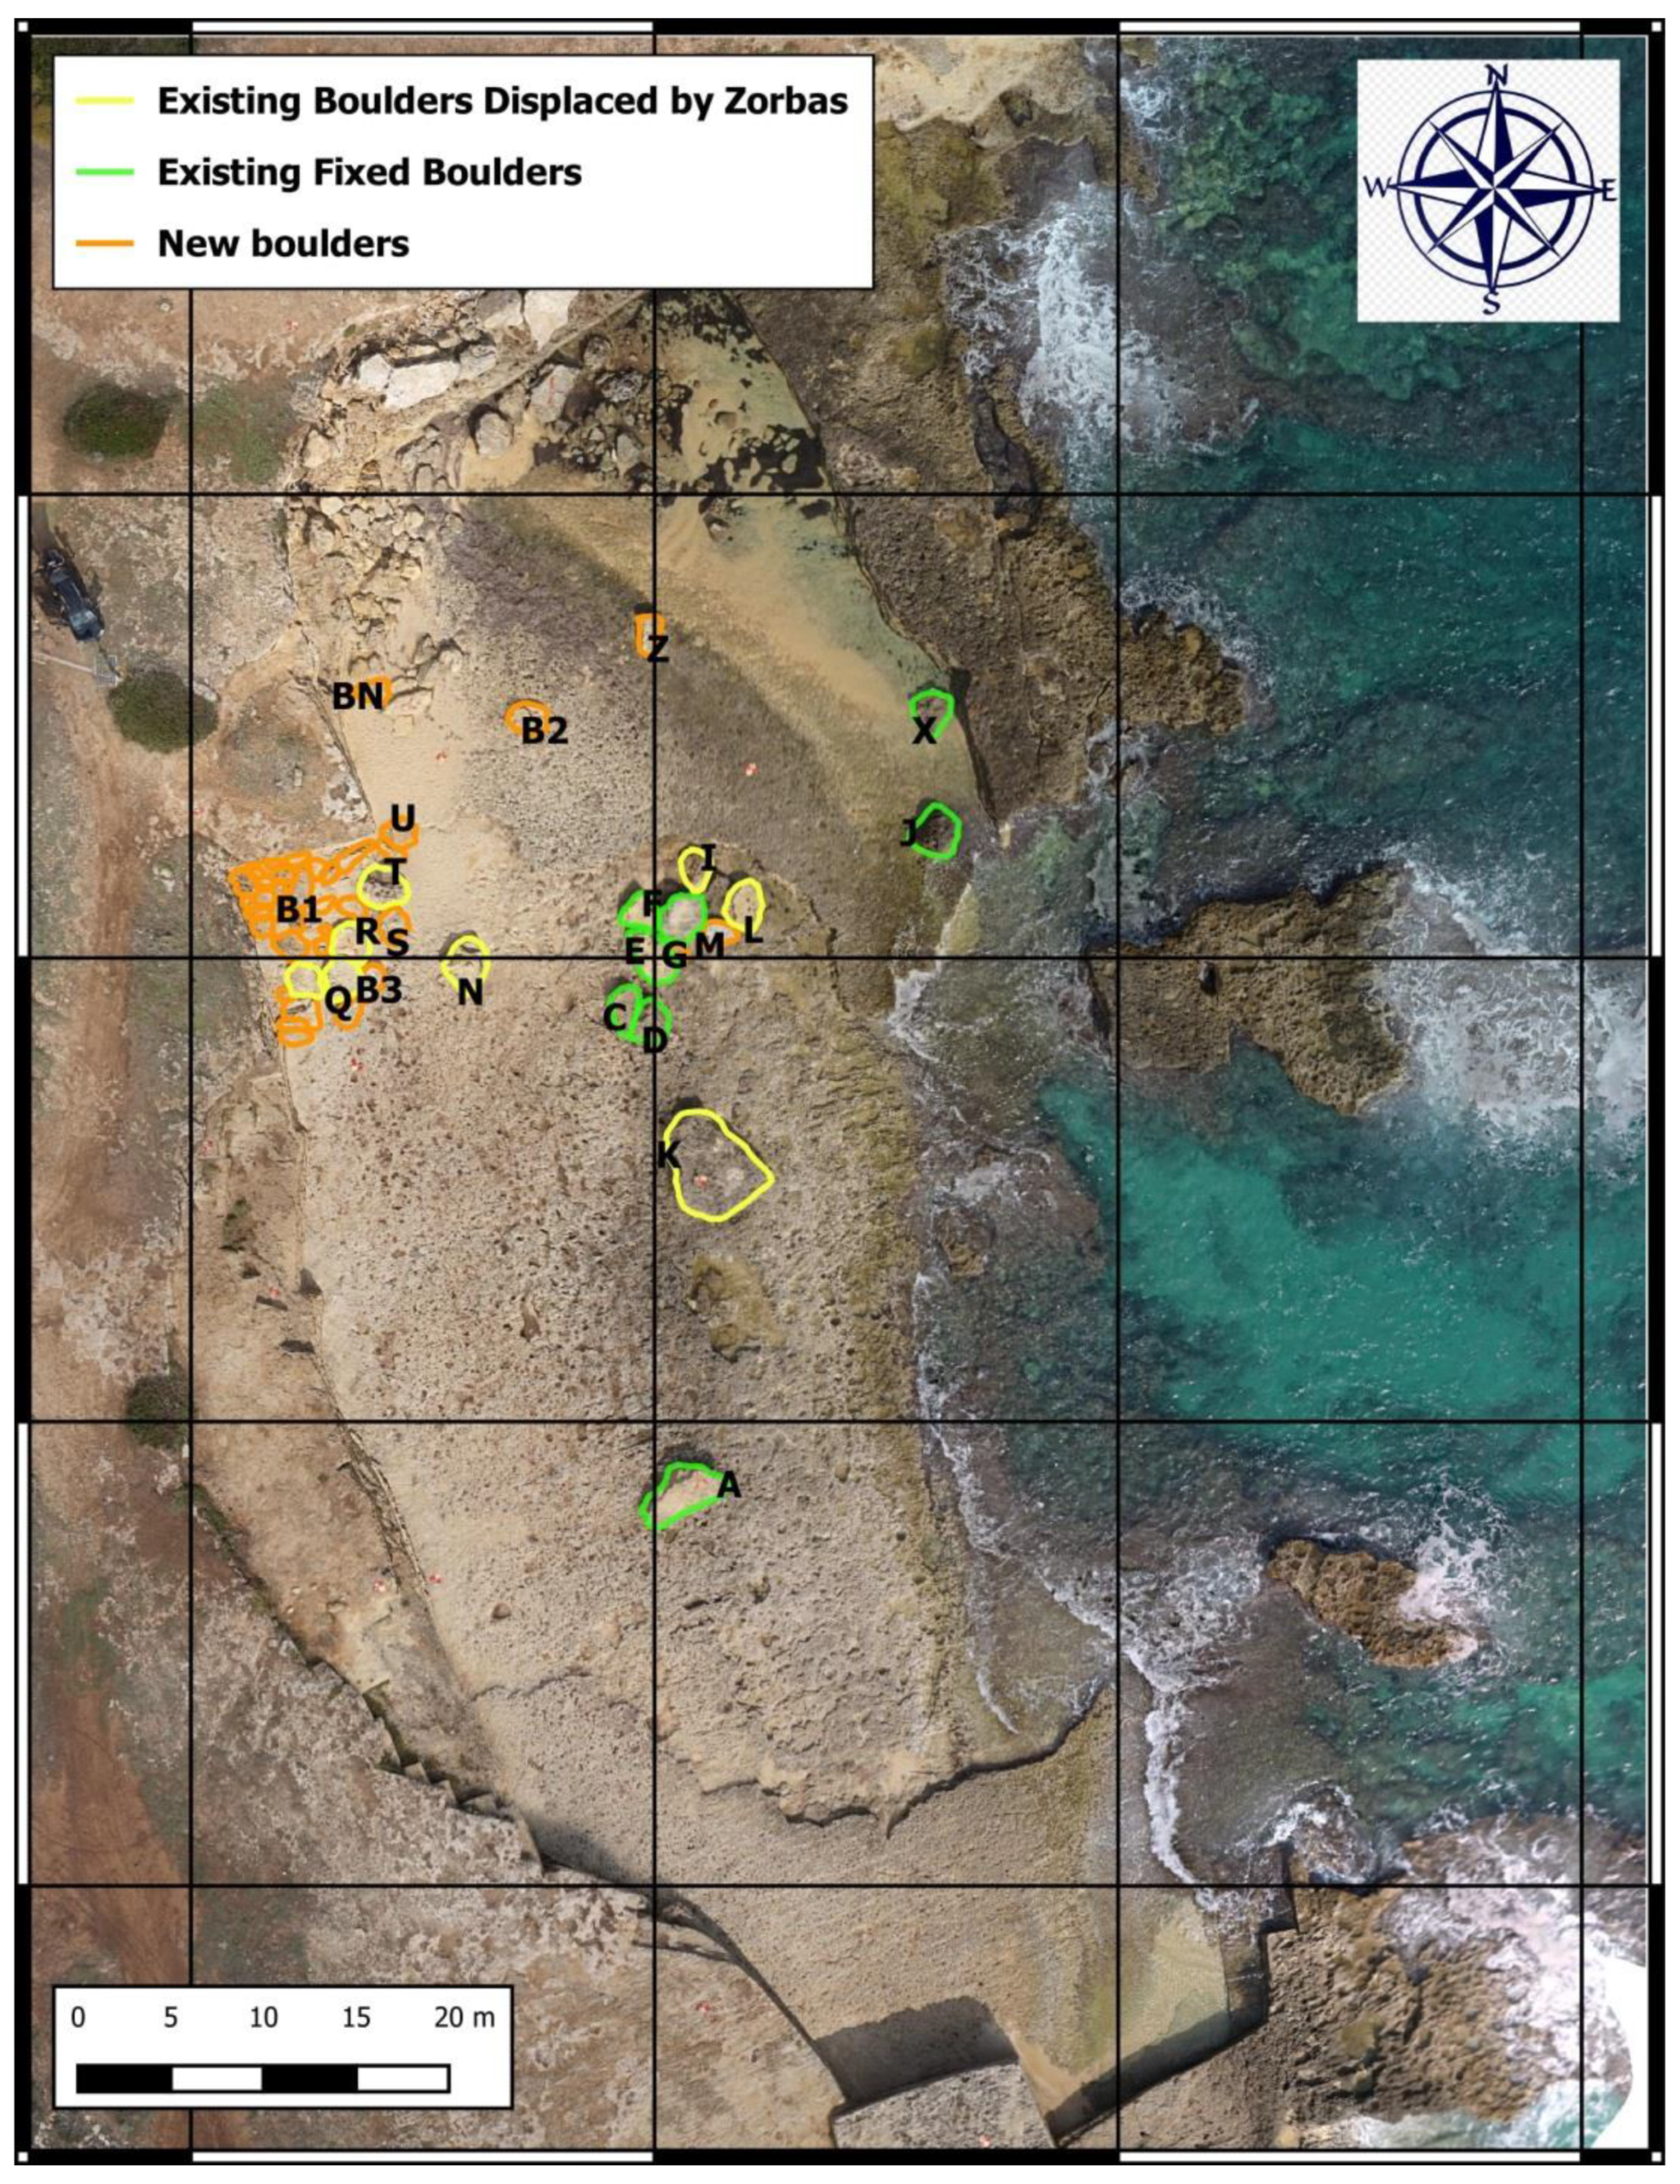
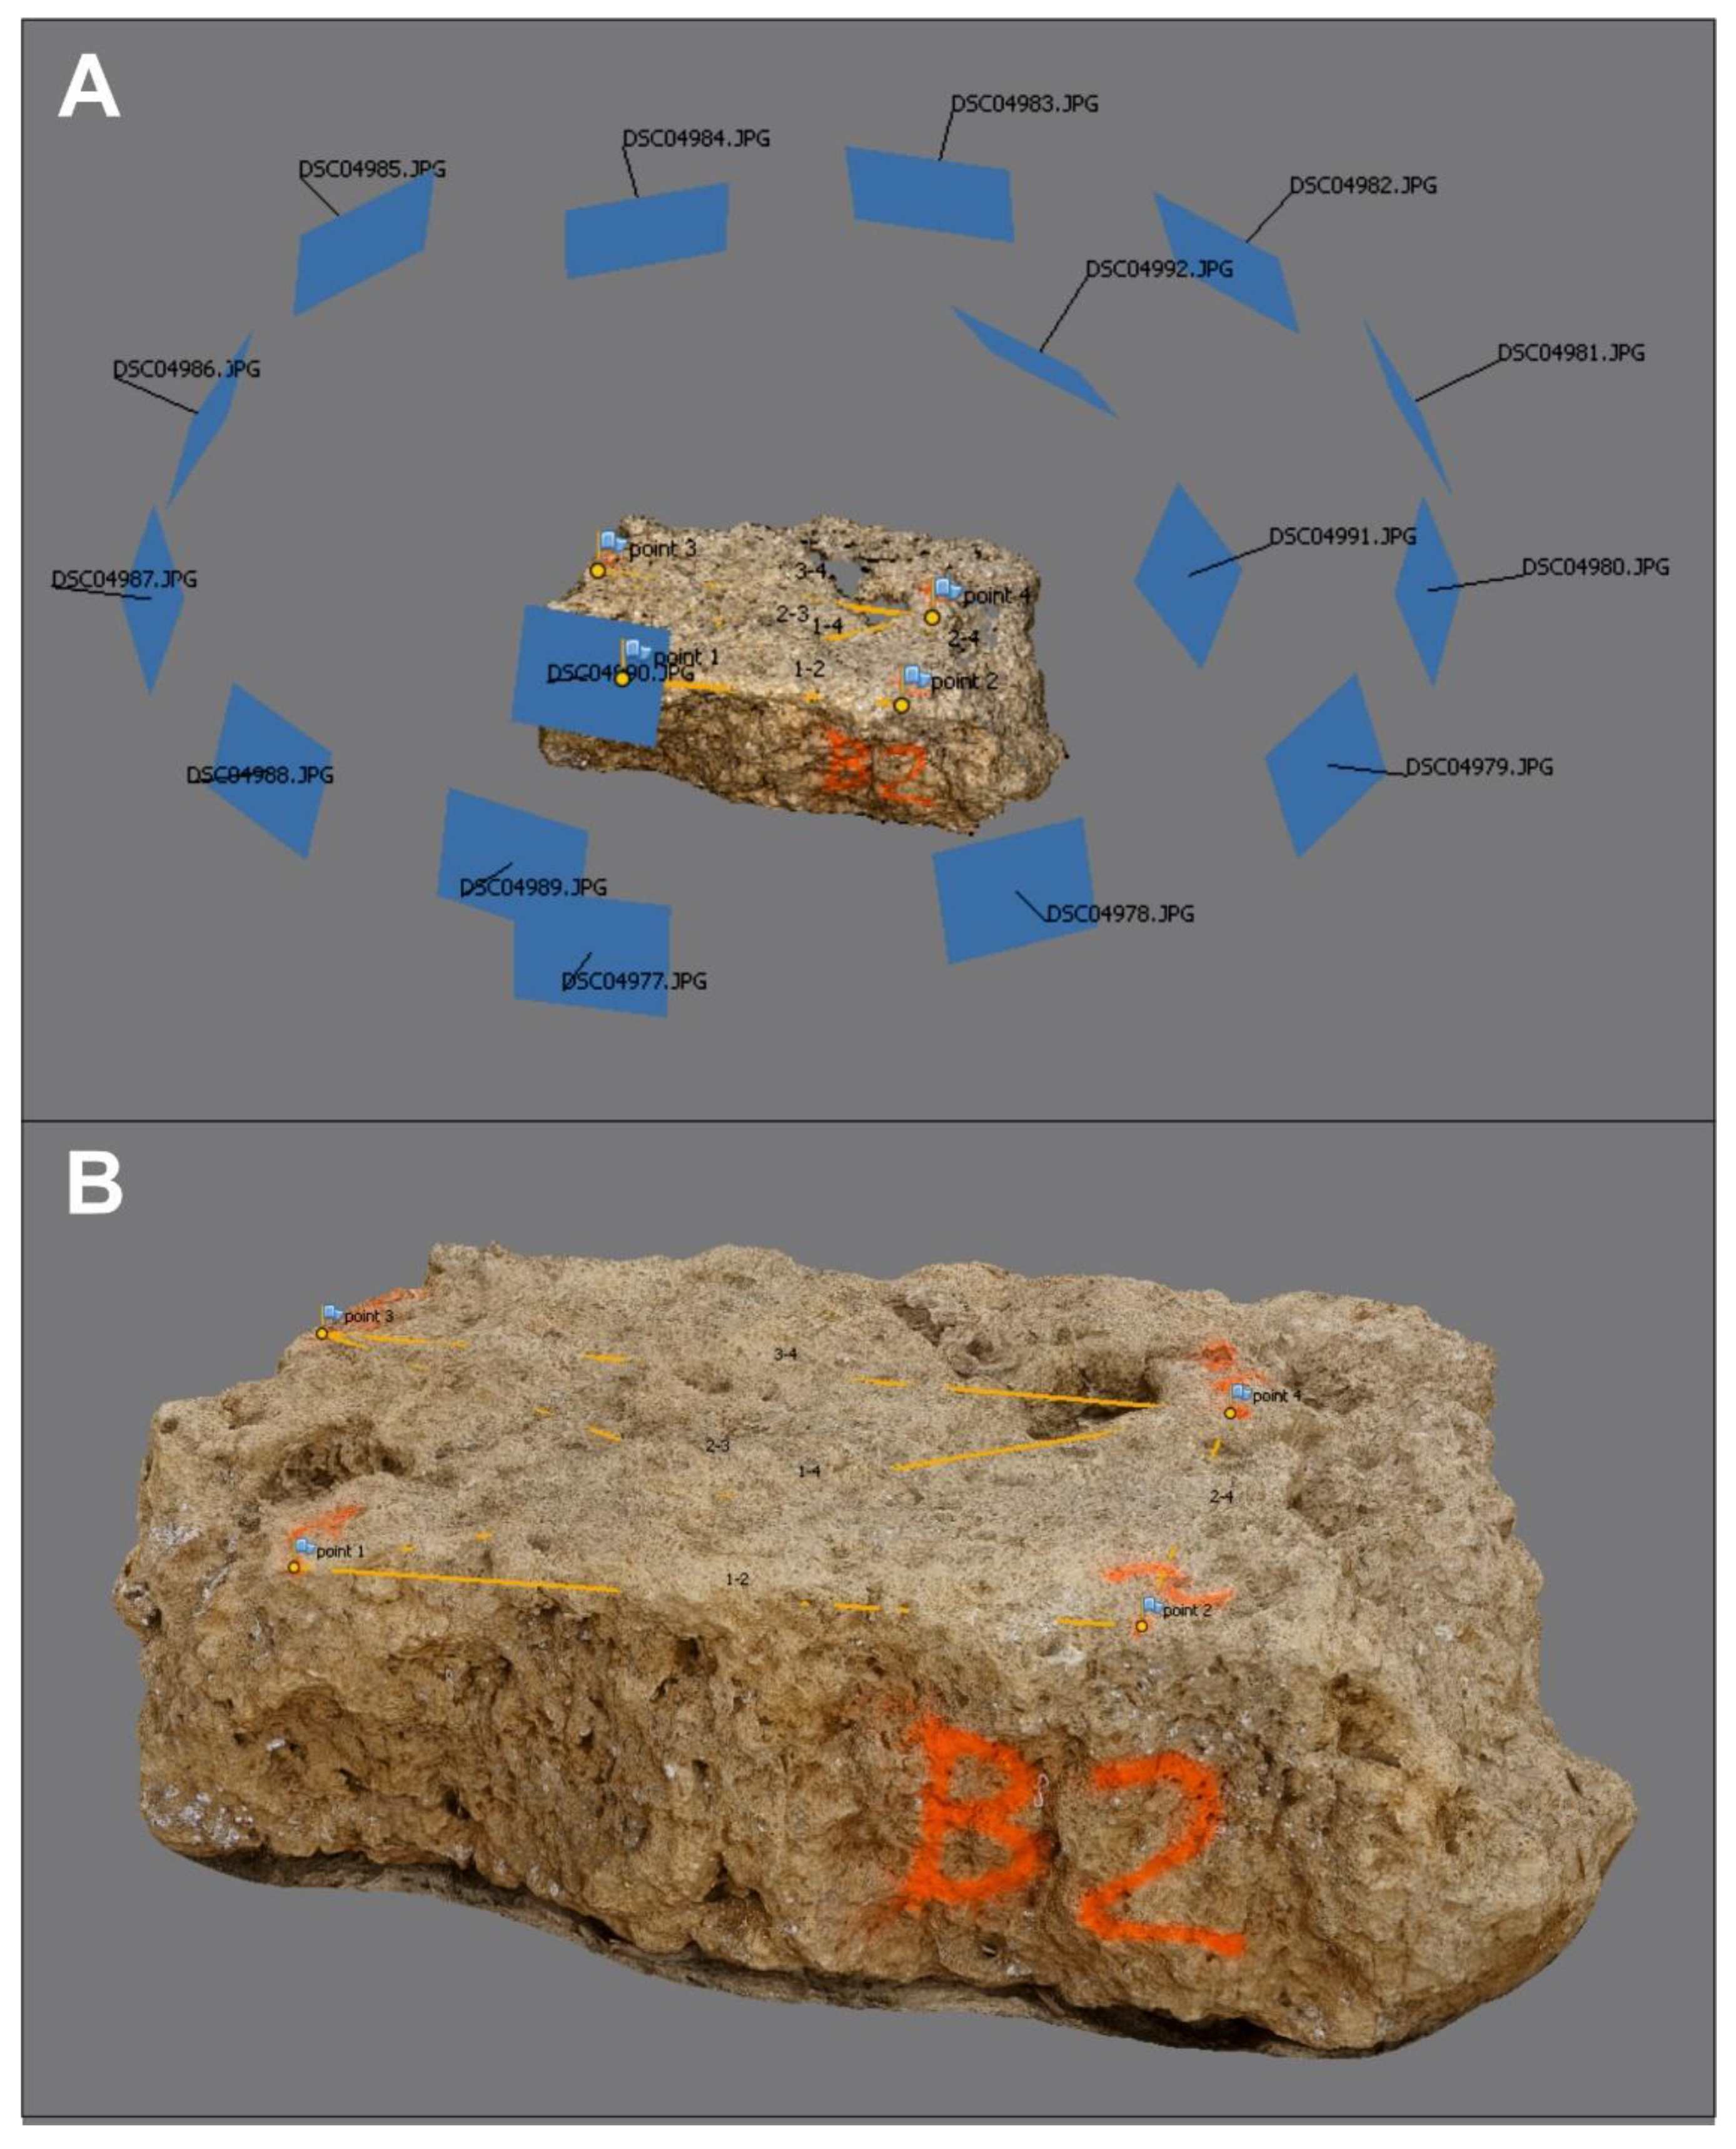
3.2. Boulders Survey
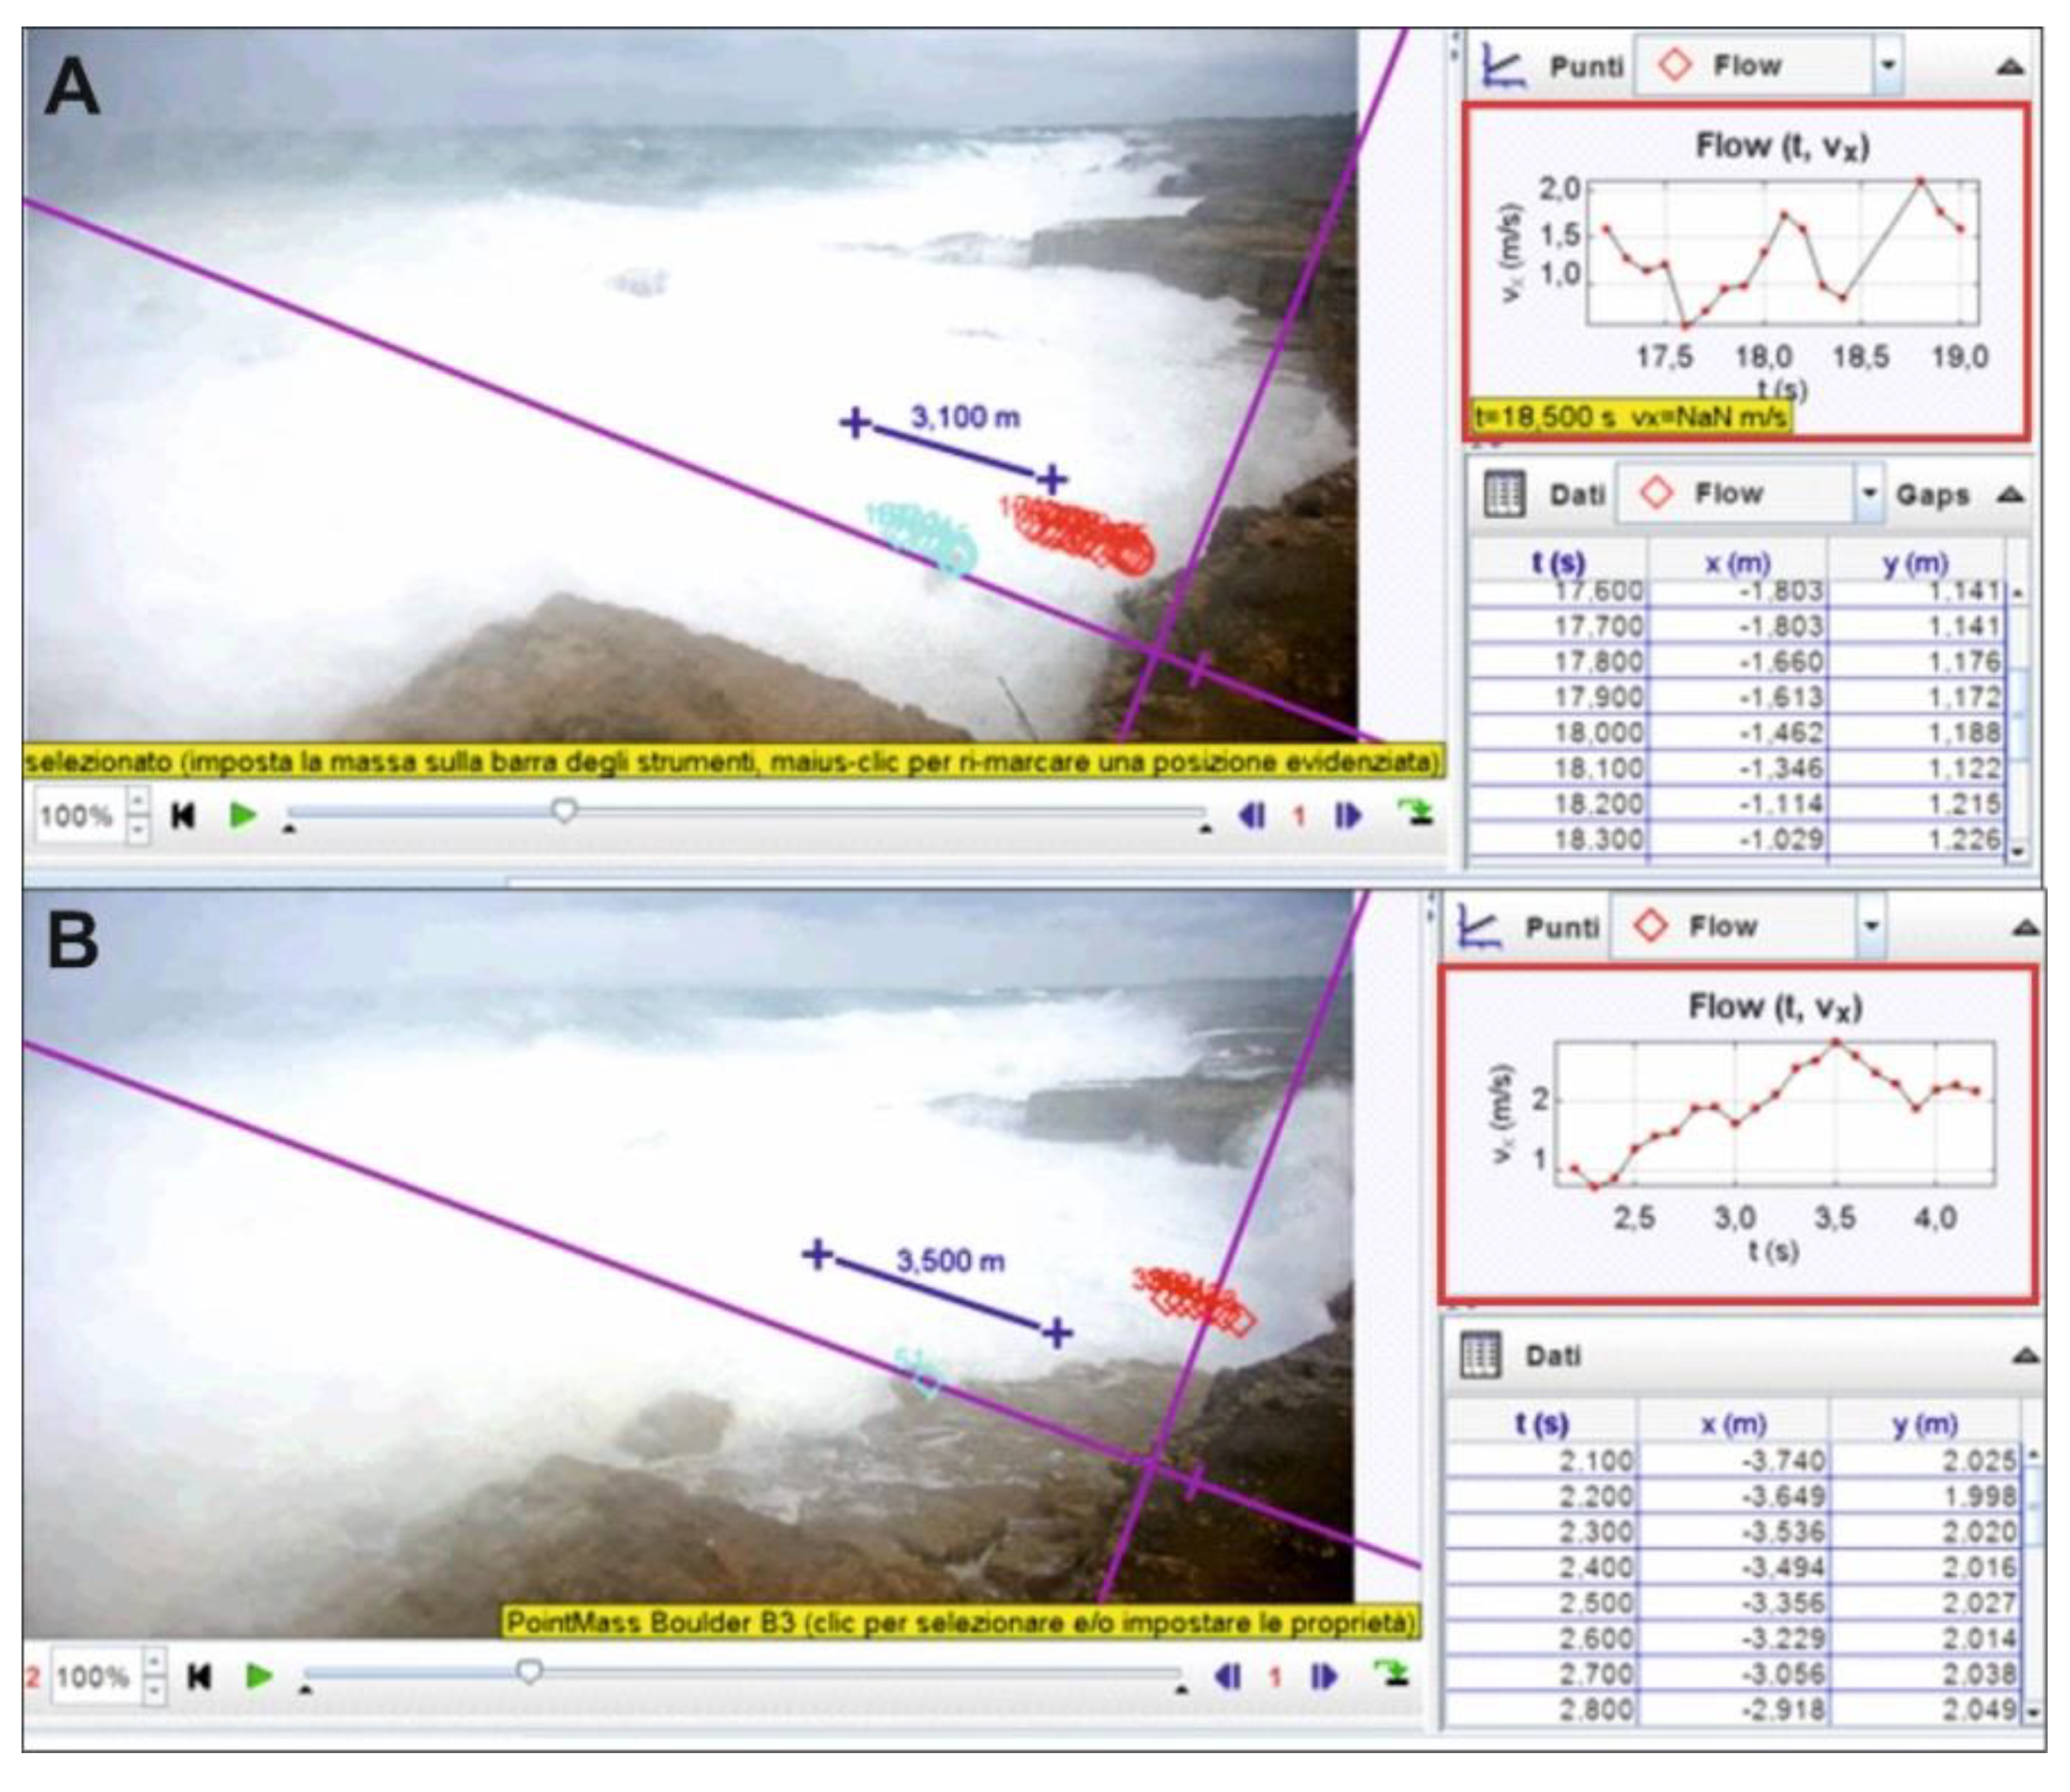
Once identified in the most recent orthophoto, the new boulders dispersed on the coastline by the impact of Medicane Zorbas have been surveyed with photogrammetry techniques to accurately calculate volume, dimension, and organic encrustations. Pictures were collected with an High Definition camera (resolution 24Mpx, lens 16 mm, f3,5-5,6). Around each boulder, 38 benchmarks were positioned on the boulders and surveyed with a total station for georeferencing the reconstructions of the blocks. Pictures and Benchmarks were processed in Agisoft Photoscan Professional software version 1.4.0 (Figure 7A) to obtain high-resolution 3D surface of the boulders and then post processed in Rhino 6 (Rhino Software 6, Mc Neel Europe, Barcellona, Spain) to close holes and missed surface and generate the final 3d model (Figure 7B). Determination of bulk density was carried out on rock samples collected from the surveyed boulders. The volume of rock samples was determined through the Instantaneous Water Immersion Method [75]. The mass of each boulder was estimated as the product of boulder’s density and volume. Density was assigned to each boulder on the basis of results of bulk density measurements as well as considering its thickness and lithology (Table 1).

3.3. Video Editing

More than 7 h of consecutive video recorded on 28 September 2019 were analyzed, detecting 28 distinct boulder movements occurred in the Greek quarry (Table 2). In particular, we focused on five boulders, for which a reliable identification in field and in the orthophoto was possible. Boulders B2, B3, B4, and BN were not present on the coastline before the impact of Zorbas. Boulder K is a very large block, about 41 ton in weight, first displaced by a storm in 2009 and moved again by the two medicanes (2014 and 2018). Videos highlighted the wave impacts on the Greek quarry and showed the boulder movement that occurred in subaerial/submerged scenario. In the video frames, the moment of boulder movements is visible, which occurred with a clear wet surface caused by a continuous wave flow impacting. At the moment of boulder movement, wave flow assumed a turbulent motion with main directions from SE and E, with subsequent backwash flow detected in different directions.
Video analysis has been performed by means of Tracker software (Doug Brown, Cabrillo College, CA, USA) using as metric reference the measures of the quarry borders detected by TLS data and some other specific features recognizable on the bedrock of the quarry (Figure 8). Metric references were selected very close to the boulders displaced in the video in order to avoid issues related to perspective distortion that could induce significant errors in the measurements of flow velocity. Videos were acquired with a frequency of 25 fps; detecting a fixed point on the boulders in each frame, it was possible to assess the wave flow velocity, wave period, wave height, velocity, and acceleration of boulders when they start to move. For boulders B2, B3, B4, and BN, we selected the movement showing highest values of flow velocity as reported in Table 3. Boulder K moved just one time, but, unfortunately, the presence of strong turbulence at that time did not permit us to evaluate the flow for each frame of the video. In this case, velocity was calculated considering distance and time between two clearly visible frames.

3.4. Hydrodynamic Models

In the last few years, several hydrodynamic models have been proposed by different authors to describe boulders displacement in coastal areas as result of the propagation of an extreme wave [28,29,31,32,36,76]. Nandasena et al. [32], in particular, elaborated a model to calculate the flow velocity needed to start the movement of a boulder for various dynamics of movement (sliding, rolling/overturning, saltation/lifting) and different pre-settings conditions of the boulder (the joint-bounded-JB, subaerial/submerged-SB). At the present, the main limit for applying Nandasena et al. [32] to field evidence has been that the dynamics of the movements were not certain but reconstructed comparing the final position of a boulder with the previous position.
As exposed in the videos editing, the final position of the boulders, displaced during the Medicane Zorbas, is never related to a single wave impact, but it is the result of several different movements that occurred in different directions and with different amplitudes. In this case, we overcome this problem because, through the recorded video, it was possible to extract, for each movement, certain information about the original position and pre-setting condition of the boulder and the dynamics of the movement. Moreover, from video editing, we obtained values of flow velocity at the time of movement of the boulders that could be directly compared with values estimated by Nandasena et al. [32] model. This model has been applied to the five considered boulders in relation to five specific movements recorded in the video (Table 3), in subaerial/submerged scenario:
sliding
u 2 = 2 ( ρ s / ρ w 1 ) gc ( μ s cos θ + sin θ ) C d ( c / b ) + μ s C l
rolling/overturning
u 2 = 2 ( ρ s / ρ w 1 ) gc ( cos θ + ( c / b ) sin θ ) C d ( c 2 / b 2 ) + C l
saltation/lifting
u 2 = 2 ( ρ s / ρ w 1 ) gc ( cos θ ) C l
in joint-bounded scenario
saltation/lifting
u 2 = 2 ( ρ s / ρ w 1 ) gc ( cos θ + μ s sin θ ) C l
where
  • u is the flow velocity needed to start the boulder movement;
  • ρ s is the density of the boulder;
  • ρ w is the density of the water (equal to 1025 kg/m3);
  • g is the gravity acceleration;
  • μ s is the coefficient of static friction;
  • θ is the angle of the bed slope at the pre-transport location in degrees;
  • C d is the drag coefficient (equal to 1.5);
  • a b c are the axis of the boulder, with the convention a > b > c;
  • C l is the lift coefficient (equal to 0.178).
Although some authors attributed to the wave flow the same density value for the seawater [28,29,31,32], recent work [77] has demonstrated that flow density, resulting from a mix of seawater and sediments, should be estimated as follow:
ρ m = ( f s ρ s ) + ( f w + ρ w )
where ρ m is the average density of the seawater and sediment mix, fw is the seawater fraction by volume between 0 and 1, fs is the sediment fraction by volume between 0 and 1, ρ w is the density of clear seawater (1.025 g/cm3), ρ s is the sediment density, and fw + fs = 1.

4. Results

Since 2009, the coast of Maddalena Peninsula has been impacted by several storms, three of which induced boulder displacements inside a Greek quarry and two, in particular, were Medicane events (Qendresa 2014; Zorbas 2018). on 13 January 2009, an intense storm displaced the biggest boulder (K, about 41 ton in weight) about 9 m inland, which was also moved during Medicanes Qendresa and Zorbas (Figure 9). Analyses of orthophotos provided by Regione Sicilia for (2007, 2008) revealed that the boulder K was broken from the coastline between August 2017 and August 2018. Field survey suggested that it occurred as a result of erosional process (Figure 9B) and not in response to the direct impact of a wave. Although the storm in 2009 was able to induce the biggest displacement to boulder K, if compared with movements during Medicane (Figure 9C), it did not dislocate many other boulders (only four more small boulders were moved during the storm). In contrast, Qendresa and Zorbas displaced a larger number of small boulders but were able to move boulder K only for short distance (about 1 m for each event).
The two medicanes transported inland dozens of small blocks, ranging in weight between 1 ton and 2 ton, eroded from the external edge of the coastline (Figure 10) and dispersed on the coastal area up to the external walls of the quarry located about 33 m landward. The most relevant boulder deposit was detected in the NW corner of the quarry and it is mainly composed by imbricated boulders lying on a coarse sand of about 40 cm thick. Analyses of the video showed that this berm was the result of boulder accumulation by the action of wave impacts, but mostly due to a turbulent flow, running along the base of the quarry, that moved the boulders along a path parallel to the coastline. The video highlighted that this flow, reaching flow velocity values of up to 4 m/s, was nourished by the strongest waves, hitting the wall of the quarry, and triggered by the topography gently sloping toward the north (about 0.58°).
By video analysis, it was possible to observe the movement of the boulders in relation to the wave flow impacting, highlighting that a surface wetted by a significant number of waves allowed the movement of the boulders. Both sliding, rolling/overturning, and saltation lifting movements were observed in video records, and the main displacements were observed during great wave flow impacting on the shore platform, with Eastern and Southeastern directions, characterized by a minimum flow of 1.2 m/s and a maximum flow of 4 m/s. Considering the relationships of Nandasena et al. [32], the wave flow needed for boulders movements has been assessed, obtaining wave flow values for subaerial/submerged scenario span from 1.96–4.78 m/s in sliding, 3.75–9.73 m/s in rolling/overturning, 5.64–12.63 m/s in saltation lifting and wave flow values in joint bounded scenario span from 5.8–12.76 m/s (Figure 11). In particular, focus was given on boulders BN, B2, B3, B4, K (Figure 12) in submerged scenario, selecting the five most clearly visible movements (one video for each boulder, see Table 3 and Supplementary Materials Video S1: Boulder B2; Video S2: Boulder B3; Video S3: Boulder B4; Video S4: Boulder BN; Video S5: Boulder K) in order to estimate the wave flow in combination with type of boulder movement. These boulders present volume values spanning from 0.37 m3 to 0.83 m3 with masses estimated between 763 kg and 1689 kg. In each one, sliding, rolling/overturning, saltation/lifting movements were detected by video records in combination with fragmentation as well. For the boulder K, about 41 ton in weight, a movement with a displacement of 1 m between 16:31–16:32 UTC was detected (Figure 13). Although the great turbulence at the time of displacement did not permit us to calculate flow velocity in each single frame of the video, we estimated the flow considering the time that the wave spent to run across the distance existing between the edge of the quarry and the boulder K.

5. Discussions

The Medicane Zorbas caused a very strong storm, characterized by high values of surges and wave height, able to dissipate a lot of flow energy on the coastal zones. The energy dissipated on Maddalena Peninsula was sufficient to move coastal boulders of relevant weight, up to 41 tons. Up to the present, the studies of boulders movements were carried out through a definition of pre and post impact scenarios after the event (e.g., references [19,20,21,22,30,75]), but in this work, for the first time, it was possible not only to directly observe how the boulders movements occur, but also to accurately measure some important parameter, as the flow velocity at time of boulder displacement, useful to compare the hydrodynamic model with natural process. From a general analysis of the videos, although all the displaced boulders were already present on the coastline, 90% of the movement occurred only when the boulders were completely submerged by water flows. Single wave impact is rarely responsible of boulder displacements (three cases out of 28), highlighting that it is not correct to connect unique wave height and boulder movements. According to Cox et al. [34], it appears more reasonable that boulder displacements along the coastline occur due to the effects of multiple waves. In our videos, it is evident that multiple waves set up a continuous and turbulent water flow on the coastal area, causing flooding able to submerge the boulders that start the movement.
During the storm on Maddalena Peninsula, flooding generated by multiple waves impact was amplified by a temporary storm surge inducted by the effects of Medicane. The towns of Marzamemi and Santa Croce Camerina, located about 40 km south of the Maddalena Peninsula, registered severe flooding inside the harbor with a sea level increased up to 1 m. In addition, on 28 September 2018, the tide gauge located inside the harbor of Catania recorded anomalous values of sea level—up to 15 cm above normal (Figure 2C). This effect was estimated also in Maddalena Peninsula through a comparison between pre-impact immersive scenario, reconstructed from TLS and UAV photogrammetric data, and images extracted from the videos. This analysis let us reconstruct an increase of water column in Maddalena Peninsula of about 50 cm (Figure 14).
In any case, the main contribution to the flooding that submerged the boulders in the Greek quarry sited in the Maddalena Peninsula is related to the impact of multiple waves, up to nine associated with the displacement of the biggest boulders, which sometimes reached the highest level of the quarry’s wall (4 m height). Furthermore, for the boulder K, which is the biggest displaced by the storm, the movement occurred only when 9 multiple waves (wave heights span 0.22–1.3 m in video records) generated a great flow impacted the shore. For boulder K, the Engel and May [36] relationship provides wave height at breaking point needed to start the movement, equal to 11.56 m, much greater than what recorded both by satellite data in off-shore (Hs of about 4.1 m) (source AVISO satellite altimetry, credits CLS/CNES [71]) and by video analysis on the shore-platform.
In the videos, we detected 28 distinct boulders movements; for 10 of these, it was not possible to calculate flow velocity because, at the time of their occurrence, turbulence was too intense to detect certain points in the video images. Moreover, boulders B1, B1_F, and BT were not recognized in field, so we cannot apply the Nandasena et al. [32] model to these boulders. For these reasons we focused our analyses on four little boulders (B2, B3, B4, BN), for which movements occurred through dynamics of sliding, rolling/overturning and saltation/lifting, and one big boulder of 41 tons (boulder K), displaced by a turbulent wave flow. Knowledge of the boulder features, obtained by TLS (K) and photogrammetric (B2, B3, B4, BN) surveys, permitted us to assess the flow needed to displace the boulders for each three types of movements by means of the hydrodynamic equations of Nandasena et al. [32], while the video records allowed us to determine the wave flow velocity at the moment of starting movement with software Tracker. Flow velocity assessed through software Tracker is subjected to relative error dependent on perspective distortion and frames sampling. This error ranges in value between 15% in case of clearly visible flows and 50% in case of turbulent flows that do not permit to identify reference points in the frame of the video. Although the use of a flow meter located inside the quarry could contribute to better evaluate flow velocity, the absence of solid points to anchor the instruments does not permit us to use this technique. For this reason, video editing was the most suitable tool for estimating the wave flow velocity in this case of study.
We selected for each boulder the movements with the highest value of flow velocity measured in the video and compared these values with those calculated with the Nandasena et al. [32] model. Comparison shows that the models provide flow values greater than those measured on the video at the starting movements. The discrepancy is probably related to the fact that the Nandasena et al. [32] model considers equal the flow velocity required to move a boulder in a subaerial and submerged scenario, while evidence highlighted from the analyses of the videos suggested that it is easiest for multiple waves to move a submerged boulder. This could be explained considering that a wave flow able to move a boulder owns a density that is different than normal seawater because it is made by a mix of seawater and sediments. In the literature, the standard density value of seawater is attributed at the wave flow, while the recent work of Terry and Malik [77] has demonstrated that the correct density value is due to the mix of seawater and sediments.
We made different evaluations of the flow velocity based on the Nandasena et al. [32] model considering the different ρ m values (Table 4) in function of sands fraction. Although assessment of model flow, considering a 20% sand fraction with 80% of seawater fraction, shows a better fitting between calculated and observed flow velocity values in hydrodynamic relationships, and they still show an important disagreement (Figure 15).
Another parameter that has probably to be redefined is the lift coefficient. The friction forces encountered by the wave flow are conditioned by this coefficient that in literature is equal to 0.178. Recent work by Rovere et al. [37] and Cox et al. [34] show that the value of lift coefficient used in literature was underestimated. We used Nandasena et al. [32] equations to estimate the value of lift coefficient necessary to fill the gap existing between flow velocities calculated, included of density correction, with those observed in the video. In the specific case of the Maddalena Peninsula, we estimated a corrected lift coefficient equal to 1.4.
Another consideration on Boulder A (Figure 9A,B) located in the Southern area of the quarry. This boulder of about 19 ton in weight was interpreted in Scicchitano et al. [16,54] as the result of the impact of a past tsunami event. Although it is much smaller than Boulder K (41 ton in weight), it was not displaced during the three storms that occurred in last 10 years. Boulder A is resulted in the same position (measured with centimetric accuracy trough RTK-GPS and TLS techniques) since the beginning of monitoring in 2007. In the same period Boulder K, that is double in weight, was displaced at least two times (Figure 9). Analyses of the videos, together with comparison of the 3D model of the boulders, suggested that the axis orientation and the contact surface geometry between boulders and bedrock play an important role in the displacements of boulder. Boulder K exposed its longer axis to the main wave impact direction (from East), while Boulder A face has been showed the same direction with the shorter axis. Moreover, the face of the Boulder A, directly in contact with the surface of the quarry, is flat and very regular (it was probably part of the quarry detached and transported inland by an extreme event), resulting in high value of friction. In contrast, the surface of Boulder K is heavily karstified and exposes several erosional polls up to 1 m of diameter and 40 cm depth. These characteristics led to the water flow, induced by the impact of multiple waves, to generate turbulences below Boulder K that are minimized for Boulder A. These considerations support the hypothesis that a tsunami could be reasonably responsible of the displacement of Boulder A [15,16].
Last but not least, analyses of the three storms that impacted Maddalena Peninsula in 2009, 2014 and 2018, suggest that, although medicanes generated wave heights compatible with the annual storm regime of the area (Figure 2A), their impacts produced major effects. Qendresa and Zorbas displaced dozens of blocks up to 2 ton in weight in the quarry of Maddalena Peninsula; most of these were eroded from the coastline and transported landward. The 2009 storm dislocated only one boulder that, although is the biggest located inside the quarry, at that time, it was lying very close to sea in a very unstable position (Figure 9). Major effects produced by medicanes could be explained by the storm surges (up to 1 m in the case of Zorbas) that they induced on coastal area as registered by the tide gauge of Catania and observed in the video recorded on Maddalena Peninsula. As a consequence, coastal areas are probably more vulnerable to the impact of medicanes than to common storms, and this appears more significant when taking into account the theories claiming that, in the future, medicanes will increase in strength in response to climate changes [12,13,78].

6. Conclusions

The dynamics of boulder displacements, in response to the impact of a storm event, are always a difficult aspect to study due to the lack of evidence about the modality of the movements. Although surveys pre and post events allow analysis the entity of boulders displacements, video records represent the best solution for a deeper comprehension of the dynamics correlated to this natural process. In this study, we present the first known video records of boulder displacements, which occurred inside an ancient costal quarry located in the Maddalena Peninsula (Siracusa). Using different techniques of survey and remote sensing, we reconstructed pre and post immersive virtual scenario that were used to geometrically analyze the video and to calculate flow velocity and wave heights at the time of boulder displacements. General observations, together with comparison between data measured in the video and calculated with hydrodynamic model, suggested us the following conclusions:
(1)
Boulder displacements occur mainly in submerged scenario, as consequence of flooding generated by the impact of a series of waves. Although some hydrodynamic models equal the flow velocity necessary to move a boulder in sub-aerial and submerged scenario, our evidence suggest they should probably be described with different specific equations.
(2)
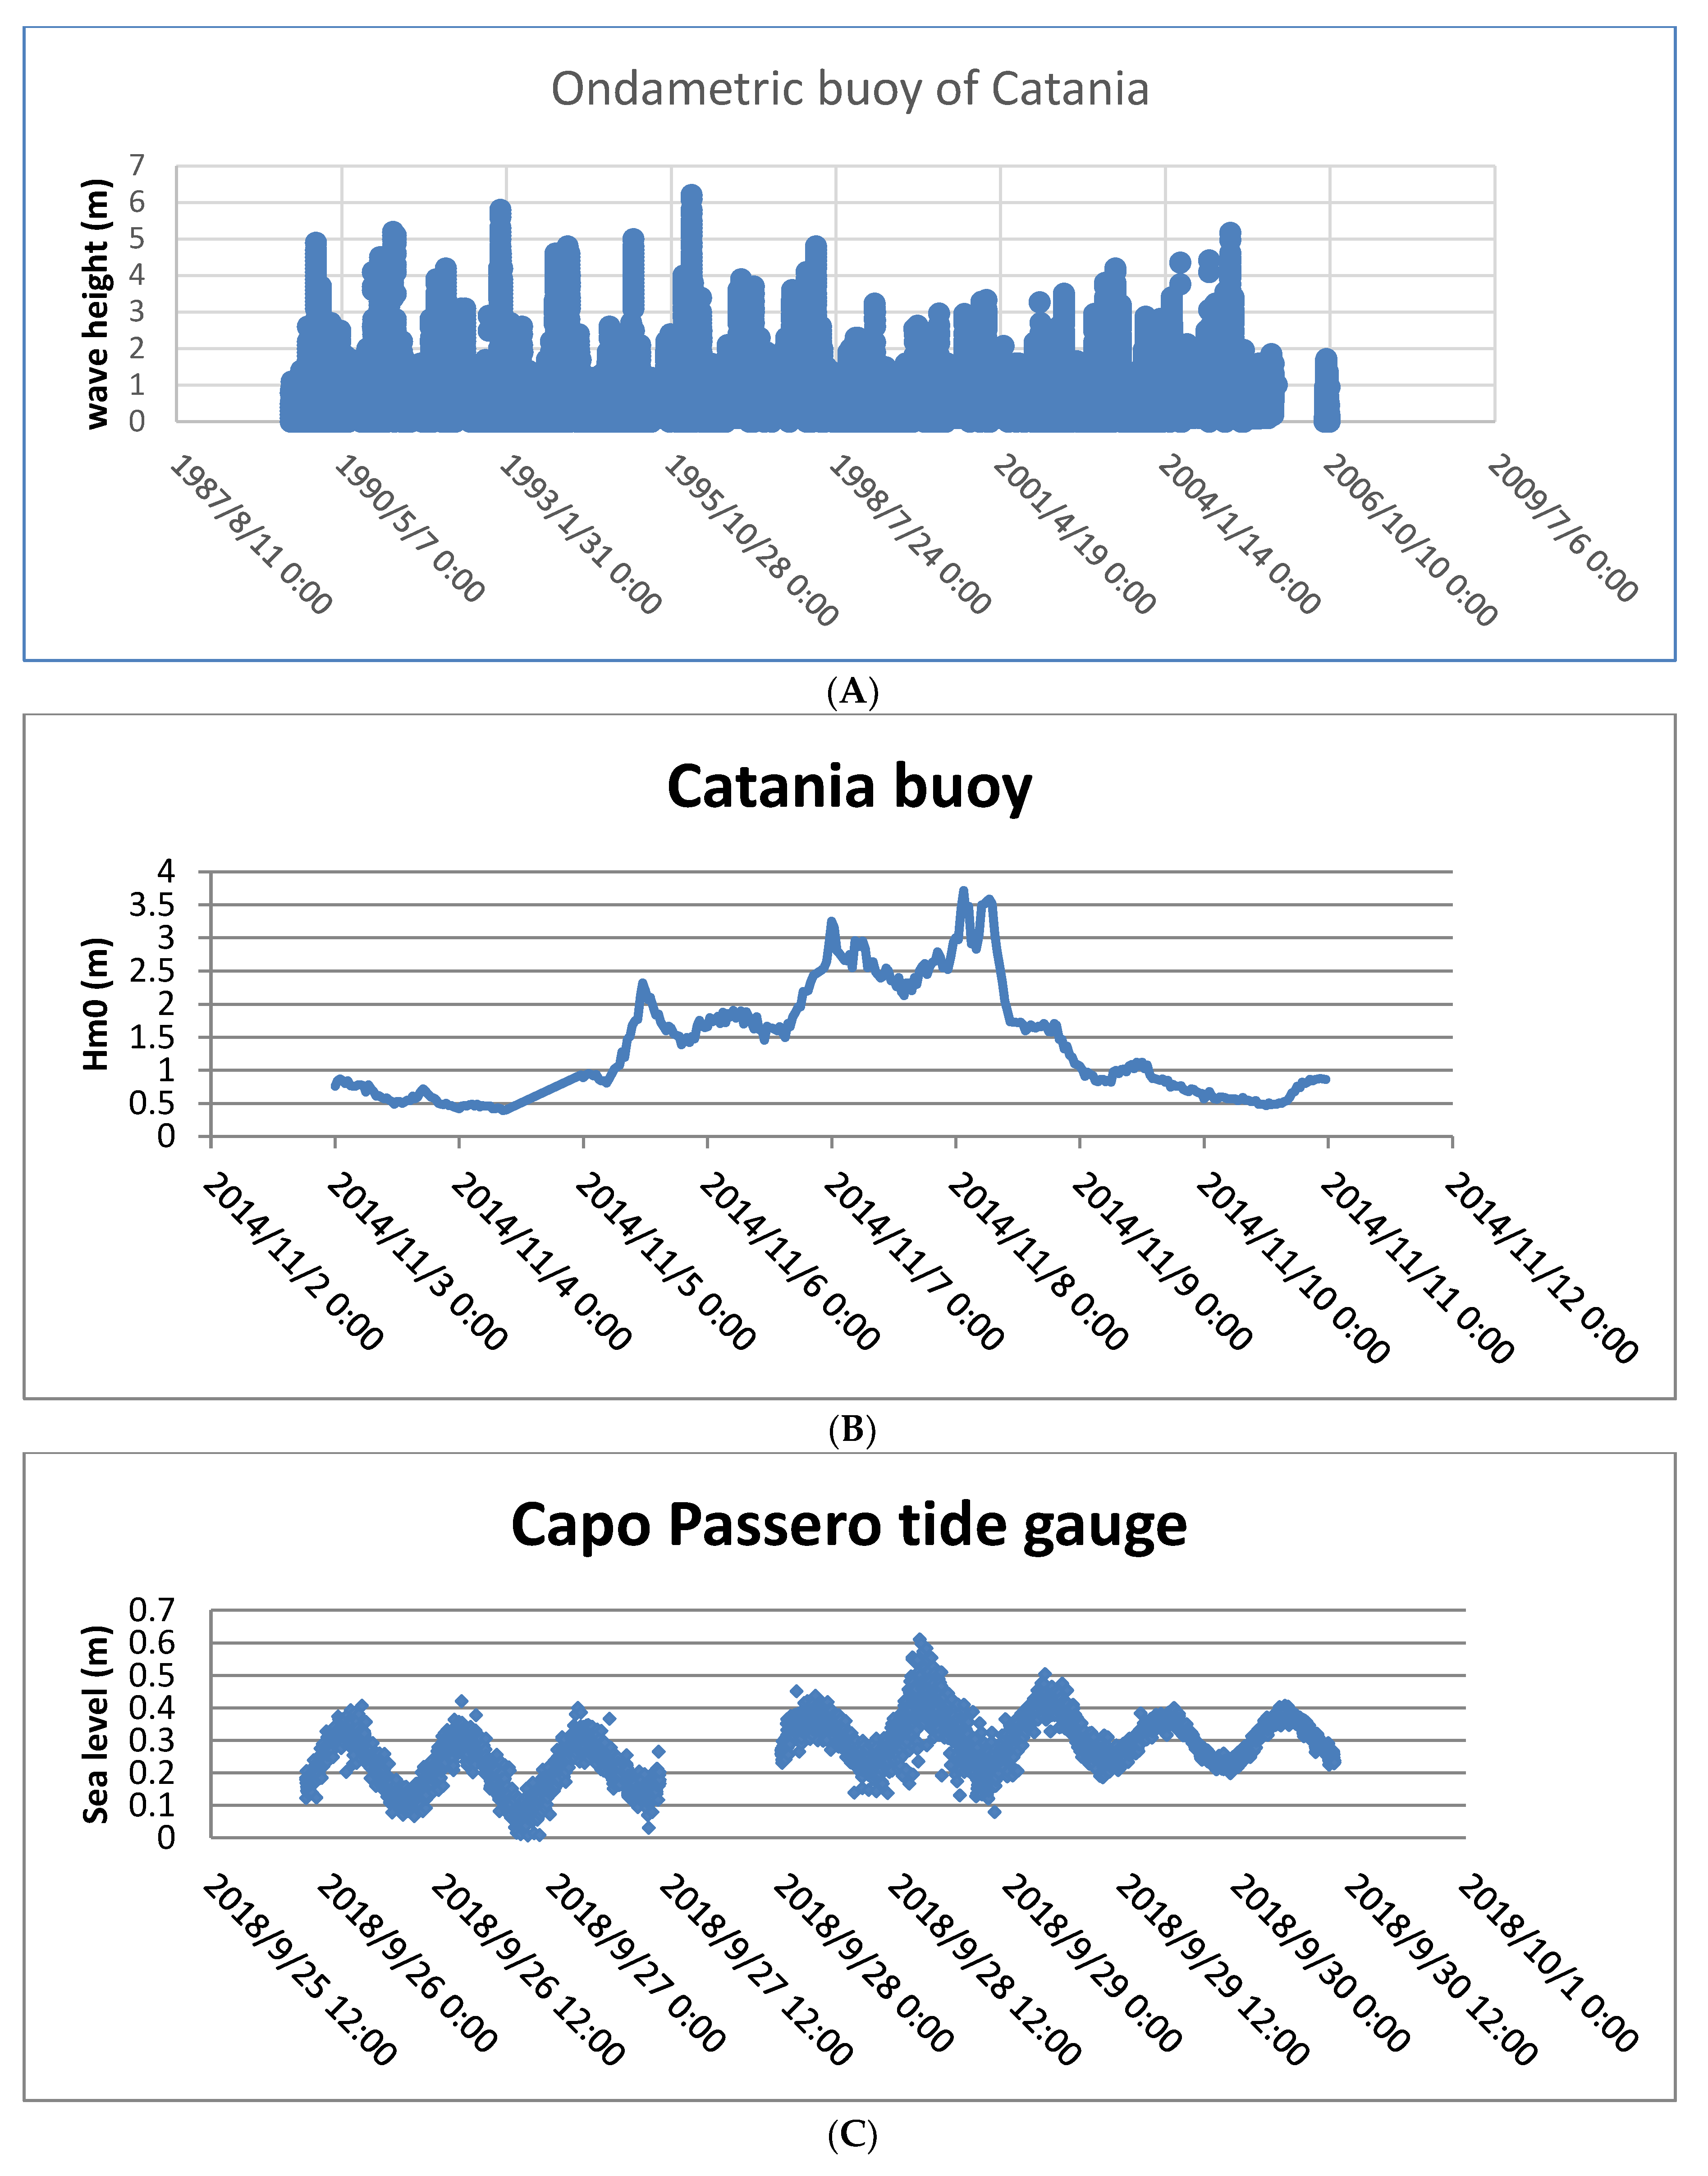
Movements occur for the impact of multiple small waves rather than of a singular big one; in any case, the possibility that a singular big wave could displace a boulder is not excluded at all, but it is probably more attributable to tsunami events. Multiple waves generate a continuous flow that nullifies friction forces, triggering the boulder displacements. Modelling through the Engel and May [36] approach results in wave height values (11.56 m) much higher than those recorded by satellite data in off-shore (Hs of about 4.1 m) and by video analysis on the shore platform (0.22–1.3 m). This confirms that single impact models provide values of wave heights strongly overestimated, respect to the natural process.
(3)
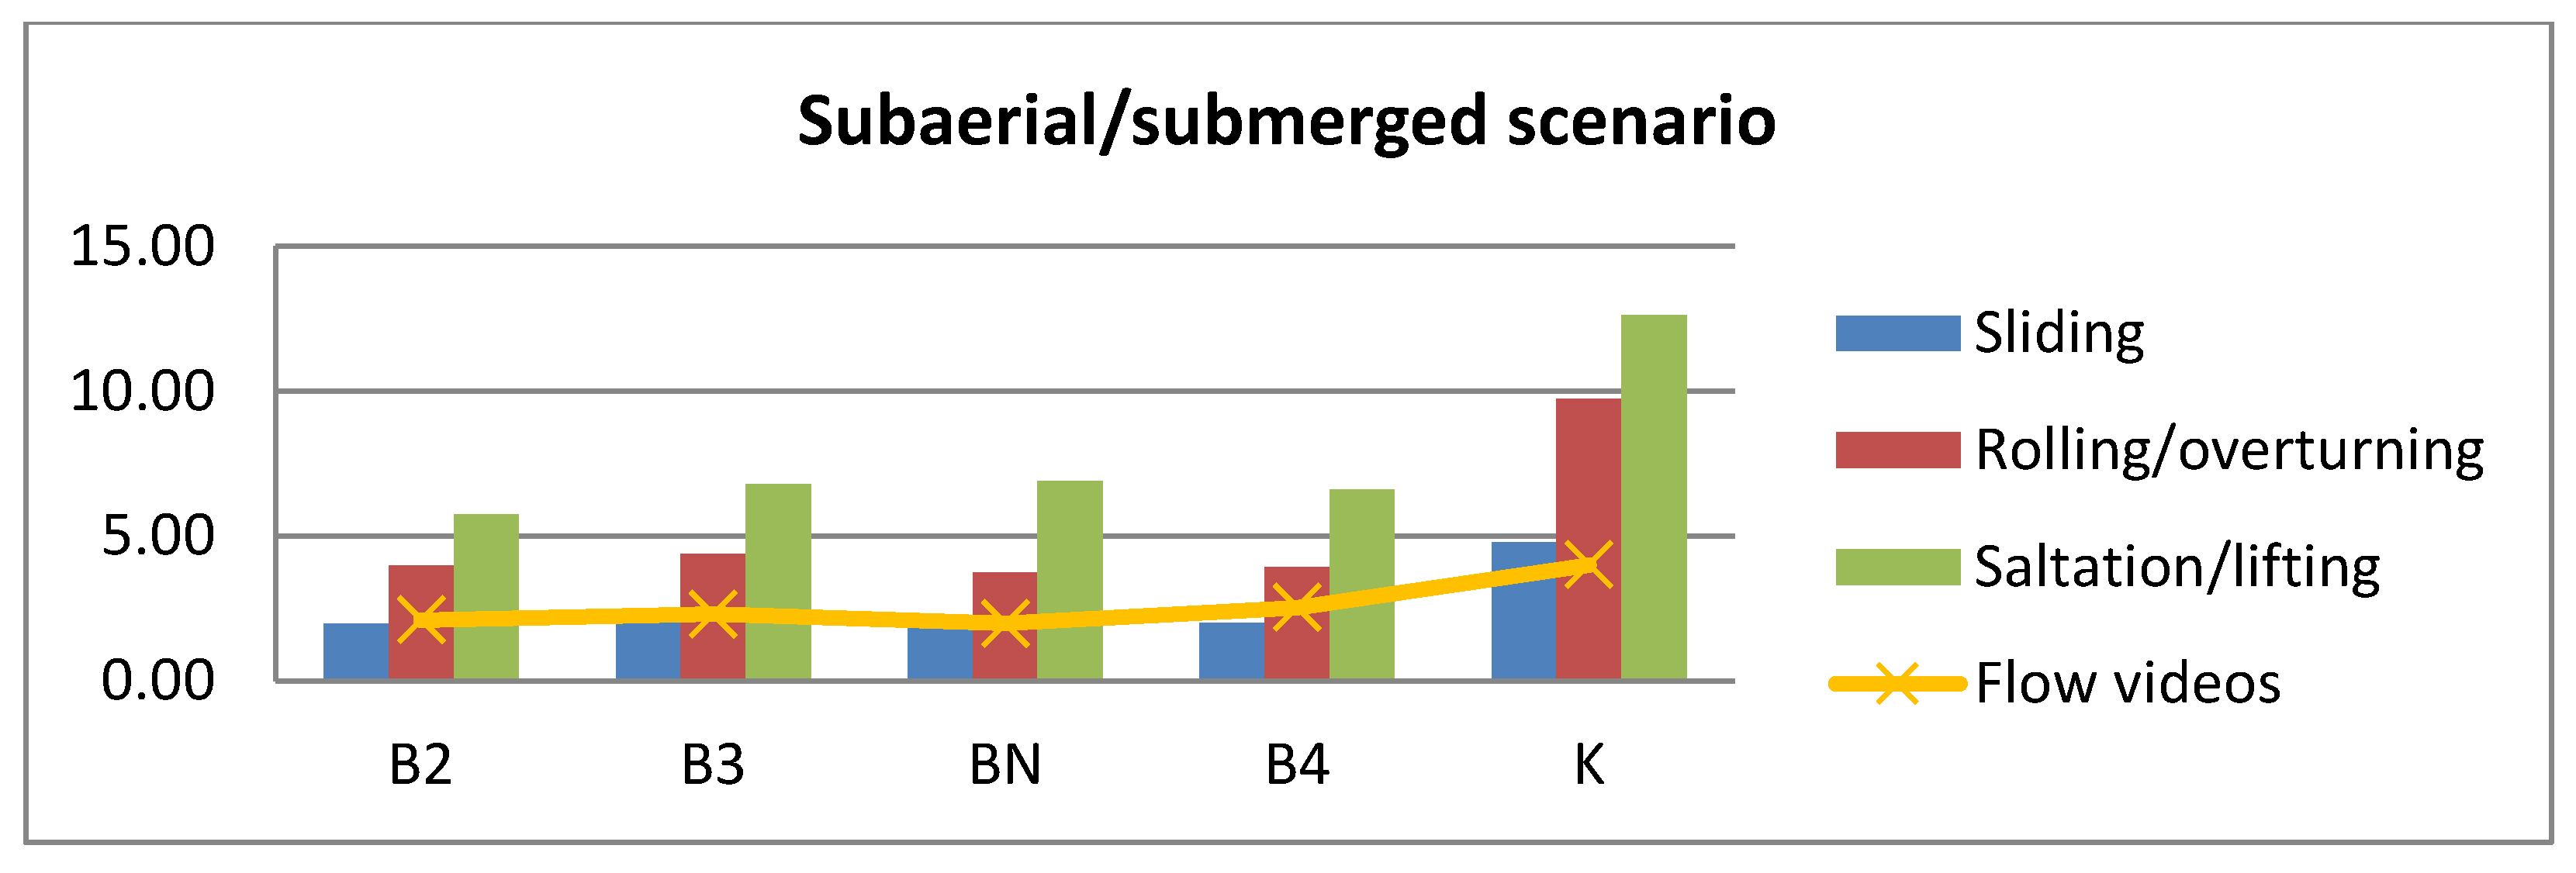
Analyses performed for five displacements, in particular, let us compare values of flow velocity estimated from videos with those calculated through Nandasena et al. [32] model for the same boulders. Comparison shows a strong overestimation of the model, enforcing the thesis that sub-aerial and submerged scenarios have to be treated with different equations and suggesting that the values of flow density and lift coefficient used in literature are underestimated. For the case of the boulders movements occurred in the Maddalena Peninsula, we estimated a value of flow density of about 1140 kg/m3, according to Terry and Malik [77] and a different value of lift coefficient according to Rovere et al. [37] and Cox et al. [34].
(4)
Considerations on a big boulder not displaced by the impact of the storm in 2009 or by the impact of the two medicanes—Qendresa (2014) and Zorbas (2018)—suggest that a tsunami could be reasonably responsible for the deposition of the boulders [15,16]. This seems to confirm that, although some authors considered overestimated the number of tsunami reconstructed for Mediterranean Sea [25], it is possible to define field evidence and methodological analyses to discern tsunami and storm events [26].
Analyses of the monitored data suggest that medicanes produce greater effects than common storms; this is probably due to the flooding they induce on the coastal areas and represents an important aspect to investigate to properly assess the vulnerability of the coasts.

Supplementary Materials

The following are available online at https://www.mdpi.com/2073-4441/12/5/1497/s1, Video S1: Boulder B2; Video S2: Boulder B3; Video S3: Boulder B4; Video S4: Boulder BN; Video S5: Boulder K.

Author Contributions

Conceptualization: G.S. (Giovanni Scicchitano), G.S. (Giovanni Scardino), G.M. (Giuseppe Mastronuzzi), A.P., M.M., and C.M.; Data curation: G.S. (Giovanni Scicchitano), G.S. (Giovanni Scardino), G.B., and G.L.; Formal analysis: G.S. (Giovanni Scicchitano), G.S. (Giovanni Scardino), and A.P.; Funding acquisition: G.M. (Giuseppe Mastronuzzi) and G.S. (Giovanni Scicchitano); Investigation: G.S. (Giovanni Scicchitano), S.T., G.M. (Gianfranco Mazza), G.S. (Giovanni Scardino), G.M. (Giuseppe Mastronuzzi), A.P., and M.M.; Methodology: G.S. (Giovanni Scicchitano), G.S. (Giovanni Scardino), G.M. (Giuseppe Mastronuzzi), and A.P.; Project administration: G.S. (Giovanni Scicchitano) and G.M. (Giuseppe Mastronuzzi); Resources: G.M. (Giuseppe Mastronuzzi), G.S. (Giovanni Scicchitano), A.P., M.M., and G.M. (Gianfranco Mazza); Software: G.B. and G.L.; Visualization: G.S. (Giovanni Scicchitano) and G.S. (Giovanni Scardino); Writing—original draft: G.S. (Giovanni Scicchitano), G.S. (Giovanni Scardino), and G.M. (Giuseppe Mastronuzzi); Writing—review and editing: G.S. (Giovanni Scicchitano), G.S. (Giovanni Scardino), G.M. (Giuseppe Mastronuzzi), M.M., C.M., and G.M. (Gianfranco Mazza). All authors have read and agreed to the published version of the manuscript.

Funding

Field operations were supported by Studio Geologi Associati T.S.T. (Catania, Italy) that provided survey instruments (UAV, GPS RTK, Total Station) and technical support.

Acknowledgments

Many thanks are due to Marine Protected Area of Plemmirio (SR, Italy) for providing the video recorded from surveillance camera and for its logistic support during the survey operation with the UAV. Thanks are also due to Dott.ssa Antonia Scicchitano of Sialab s.r.l. (Avola) for the analyses of boulders density. This study has motivated by discussion at the workshops of MOPP-MEDFLOOD (INQUA project 1603P) held in Siracusa in September 2018.

Conflicts of Interest

The authors declare no conflict of interest. The funders had no role in the design of the study; in the collection, analyses, or interpretation of data; in the writing of the manuscript, or in the decision to publish the results.

References

  1. Ernst, J.A.; Matson, M. A Mediterranean Tropical Storm? Weather 1983, 38, 332–337. [Google Scholar] [CrossRef]
  2. Reale, O.; Atlas, R. Tropical Cyclone—Like Vortices in the Extratropics: Observational Evidence and Synoptic Analysis. Weather Forecast. 2001, 16, 7–34. [Google Scholar] [CrossRef]
  3. Jansà, A. Miniciclons a la Mediterrània. IX Jornades Meteorol. Eduard Fontserè Assoc. Catalana Meteorol. (ACAM) Barc. 2003, 9, 75–85. [Google Scholar]
  4. Fita, L.; Romero, R.; Luque, A.; Emanuel, K.; Ramis, C. Analysis of the environments of seven Mediterranean tropical-like storms using an axisymmetric, nonhydrostatic, cloud resolving model. Nat. Hazards Earth Syst. Sci. 2007, 7, 41–56. [Google Scholar] [CrossRef]
  5. Miglietta, M.M.; Laviola, S.; Malvaldi, A.; Conte, D.; Levizzani, V.; Price, C. Analysis of tropical-like cyclones over the Mediterranean Sea through a combined modeling and satellite approach. Geophys. Res. Lett. 2013, 40, 2400–2405. [Google Scholar] [CrossRef]
  6. Cavicchia, L.; von Storch, H.; Gualdi, S. Mediterranean Tropical-Like Cyclones in Present and Future Climate. J. Clim. 2014, 27, 7493–7501. [Google Scholar] [CrossRef] [Green Version]
  7. Nastos, P.T.; Karavana-Papadimou, K.; Matsangouras, I.T. Tropical-like cyclones in the Mediterranean: Impacts and composite daily means and anomalies of synoptic conditions. In Proceedings of the 14th International Conference on Environmental Science and Technology, Rhodes, Greece, 3–5 September 2015. [Google Scholar]
  8. Cioni, G.; Malguzzi, P.; Buzzi, A. Thermal structure and dynamical precursor of a Mediterranean tropical-like cyclone. Q. J. R. Meteorol. Soc. 2016, 142, 1757–1766. [Google Scholar] [CrossRef]
  9. Moscatello, A.; Miglietta, M.M.; Rotunno, R. Observational analysis of a Mediterranean “hurricane” over south-eastern Italy. Weather 2008, 63, 306–311. [Google Scholar] [CrossRef]
  10. Pytharoulis, I.; Craig, G.C.; Ballard, S.P. The hurricane-like Mediterranean cyclone of January 1995. Meteorol. Appl. 2000, 7, 261–279. [Google Scholar] [CrossRef]
  11. Bakkensen, L.A. Mediterranean Hurricanes and Associated Damage Estimates. J. Extrem. Events 2017, 4, 1750008. [Google Scholar] [CrossRef]
  12. Lionello, P.; Giorgi, F. Winter precipitation and cyclones in the Mediterranean region: Future climate scenarios in a regional simulation. Adv. Geosci. 2007, 12, 153–158. [Google Scholar] [CrossRef] [Green Version]
  13. Lionello, P.; Conte, D.; Marzo, L.; Scarascia, L. The contrasting effect of increasing mean sea level and decreasing storminess on the maximum water level during storms along the coast of the Mediterranean Sea in the mid 21st century. Glob. Planet. Chang. 2017, 151, 80–91. [Google Scholar] [CrossRef]
  14. Portmann, R.; González-Alemán, J.J.; Sprenger, M.; Wernli, H. Medicane Zorbas: Origin and impact of an uncertain potential vorticity streamer. Weather Clim. Dyn. Discuss. 2019, 2019, 1–30. [Google Scholar]
  15. Scicchitano, G.; Monaco, C.; Tortorici, L. Large boulder deposits by tsunami waves along the Ionian coast of south-eastern Sicily (Italy). Mar. Geol. 2007, 238, 75–91. [Google Scholar] [CrossRef]
  16. Scicchitano, G.; Pignatelli, C.; Spampinato, C.R.; Piscitelli, A.; Milella, M.; Monaco, C.; Mastronuzzi, G. Terrestrial Laser Scanner techniques in the assessment of tsunami impact on the Maddalena peninsula (south-eastern Sicily, Italy). Earthplanets Space 2012, 64, 889–903. [Google Scholar] [CrossRef] [Green Version]
  17. Vacchi, M.; Rovere, A.; Zouros, N.; Firpo, M. Assessing enigmatic boulder deposits in NE Aegean Sea: Importance of historical sources as tool to support hydrodynamic equations. Nat. Hazards Earth Syst. Sci. 2012, 12, 1109–1118. [Google Scholar] [CrossRef] [Green Version]
  18. Shah-Hosseini, M.; Morhange, C.; De Marco, A.; Wante, J.; Anthony, E.J.; Sabatier, F.; Mastronuzzi, G.; Pignatelli, C.; Piscitelli, A. Coastal boulders in Martigues, French Mediterranean: Evidence for extreme storm waves during the Little Ice Age. Z. Geomorphol. 2013, 57, 181–199. [Google Scholar] [CrossRef]
  19. Biolchi, S.; Furlani, S.; Antonioli, F.; Baldassini, N.; Causon Deguara, J.; Devoto, S.; Di Stefano, A.; Evans, J.; Gambin, T.; Gauci, R.; et al. Boulder accumulations related to extreme wave events on the eastern coast of Malta. Nat. Hazards Earth Syst. Sci. 2016, 16, 737–756. [Google Scholar] [CrossRef] [Green Version]
  20. Biolchi, S.; Furlani, S.; Devoto, S.; Scicchitano, G.; Korbar, T.; Vilibic, I.; Sepic, J. The origin and dynamics of coastal boulders in a semi-enclosed shallow basin: A northern Adriatic case study. Mar. Geol. 2019, 411, 62–77. [Google Scholar] [CrossRef]
  21. Biolchi, S.; Denamiel, C.; Devoto, S.; Korbar, T.; Macovaz, V.; Scicchitano, G.; Vilibić, I.; Furlani, S. Impact of the October 2018 Storm Vaia on Coastal Boulders in the Northern Adriatic Sea. Water 2019, 11, 2229. [Google Scholar] [CrossRef] [Green Version]
  22. Piscitelli, A.; Milella, M.; Hippolyte, J.-C.; Shah-Hosseini, M.; Morhange, C.; Mastronuzzi, G. Numerical approach to the study of coastal boulders: The case of Martigues, Marseille, France. Quat. Int. 2017, 439, 52–64. [Google Scholar] [CrossRef]
  23. Mastronuzzi, G.; Sansò, P. Large boulder accumulations by extreme waves along the Adriatic coast of southern Apulia (Italy). Quat. Int. 2004, 120, 173–184. [Google Scholar] [CrossRef]
  24. Barbano, M.S.; Pirrotta, C.; Gerardi, F. Large boulders along the south-eastern Ionian coast of Sicily: Storm or tsunami deposits? Mar. Geol. 2010, 275, 140–154. [Google Scholar] [CrossRef]
  25. Marriner, N.; Kaniewski, D.; Morhange, C.; Flaux, C.; Giaime, M.; Vacchi, M.; Goff, J. Tsunamis in the geological record: Making waves with a cautionary tale from the Mediterranean. Sci. Adv. 2017, 3, e1700485. [Google Scholar] [CrossRef] [Green Version]
  26. Vött, A.; Bruins, H.J.; Gawehn, M.; Goodman-Tchernov, B.N.; De Martini, P.M.; Kelletat, D.; Mastronuzzi, G.; Reicherter, K.; Röbke, B.R.; Scheffers, A.; et al. Publicity waves based on manipulated geoscientific data suggesting climatic trigger for majority of tsunami findings in the mediterranean—Response to ‘tsunamis in the geological record: Making waves with a cautionary tale from the mediterranean’ by marriner et al. (2017). Z. Geomorphol. 2019, 62, 7–45. [Google Scholar]
  27. Mastronuzzi, G.; Pignatelli, C.; Sansò, P. Boulder fields: A valuable morphological indicator of palaeotsunami in the Mediterranean sea. Z. Geomorphol. NF 2006, 146, 173–194. [Google Scholar]
  28. Nott, J. Tsunami or Storm Waves? Determining the Origin of a Spectacular Field of Wave Emplaced Boulders Using Numerical Storm Surge and Wave Models and Hydrodynamic Transport Equations. J. Coast. Res. 2003, 19, 348–356. [Google Scholar]
  29. Nott, J. Waves, coastal boulder deposits and the importance of the pre-transport setting. Earth Planet. Sci. Lett. 2003, 210, 269–276. [Google Scholar] [CrossRef]
  30. Pignatelli, C.; Sansò, P.; Mastronuzzi, G. Evaluation of tsunami flooding using geomorphologic evidence. Mar. Geol. 2009, 260, 6–18. [Google Scholar] [CrossRef]
  31. Nandasena, N.A.K.; Paris, R.; Tanaka, N. Numerical assessment of boulder transport by the 2004 Indian ocean tsunami in Lhok Nga, West Banda Aceh (Sumatra, Indonesia). Comput. Geosci. 2011, 37, 1391–1399. [Google Scholar] [CrossRef]
  32. Nandasena, N.A.K.; Paris, R.; Tanaka, N. Reassessment of hydrodynamic equations: Minimum flow velocity to initiate boulder transport by high energy events (storms, tsunamis). Mar. Geol. 2011, 281, 70–84. [Google Scholar] [CrossRef]
  33. Milella, M.; Scardino, G.; Piscitelli, A.; De Giosa, F.; Locuratolo, G.; Barracane, G. Experimental determination of the friction coefficient for estimating sea storm induced megaboulders movements. Alp. Mediterr. Quat. 2018, 31, 27–30. [Google Scholar]
  34. Cox, R.; Ardhuin, F.; Dias, F.; Autret, R.; Beisiegel, N.; Earlie, C.S.; Herterich, J.G.; Kennedy, A.; Paris, R.; Raby, A.; et al. Systematic Review Shows That Work Done by Storm Waves Can Be Misinterpreted as Tsunami-Related Because Commonly Used Hydrodynamic Equations Are Flawed. Front. Mar. Sci. 2020, 7, 7. [Google Scholar] [CrossRef]
  35. Mastronuzzi, G.; Pignatelli, C. The boulder berm of Punta Saguerra (Taranto, Italy): A morphological imprint of the Rossano Calabro tsunami of April 24, 1836? Earthplanets Space 2012, 64, 829–842. [Google Scholar] [CrossRef] [Green Version]
  36. Engel, M.; May, S.M. Bonaire’s boulder fields revisited: Evidence for Holocene tsunami impact on the Leeward Antilles. Quat. Sci. Rev. 2012, 54, 126–141. [Google Scholar] [CrossRef]
  37. Rovere, A.; Casella, E.; Harris, D.L.; Lorscheid, T.; Nandasena, N.A.K.; Dyer, B.; Sandstrom, M.R.; Stocchi, P.; D’Andrea, W.J.; Raymo, M.E. Giant boulders and Last Interglacial storm intensity in the North Atlantic. Proc. Natl. Acad. Sci. USA 2017, 114, 12144–12149. [Google Scholar] [CrossRef] [Green Version]
  38. Grasso, M.; Lentini, F. Sedimentary and tectonic evolution of the eastern Hyblean Plateau (southeastern Sicily) during late Cretaceous to Quaternary time. Palaeogeogr. Palaeoclimatol. Palaeoecol. 1982, 39, 261–280. [Google Scholar] [CrossRef]
  39. Cultrera, F.; Barreca, G.; Scarfì, L.; Monaco, C. Fault reactivation by stress pattern reorganization in the Hyblean foreland domain of SE Sicily (Italy) and seismotectonic implications. Tectonophysics 2015, 661, 215–228. [Google Scholar] [CrossRef]
  40. Bianca, M.; Monaco, C.; Tortorici, L.; Cernobori, L. Quaternary normal faulting in southeastern Sicily (Italy): A seismic source for the 1693 large earthquake. Geophys. J. Int. 1999, 139, 370–394. [Google Scholar] [CrossRef] [Green Version]
  41. Scandone, P.; Patacca, E.; Radoicic, R.; Ryan, W.B.F.; Cita, M.B.; Rawson, M.; Chezar, H.; Miller, E.; McKenzie, J.; Rossi, S. Mesozoic and Cenozoic Rocks from Malta Escarpment (Central Mediterranean). AAPG Bull. 1981, 65, 1299–1319. [Google Scholar]
  42. Makris, J.; Nicolich, R.; Weigel, W. A seismic study in the Western Ionian Sea. Ann. Geophys. 1986, 4, 665–678. [Google Scholar]
  43. Catalano, R.; Doglioni, C.; Merlini, S. On the Mesozoic Ionian Basin. Geophys. J. Int. 2001, 144, 49–64. [Google Scholar] [CrossRef] [Green Version]
  44. Baratta, M. I Terremoti d’Italia: Saggio di Storia, Geografia e Bibliografia Sismica Italiana; Fratelli Bocca: Torino, Italy, 1901; p. 984. [Google Scholar]
  45. Postpischl, D.C. Catalogo dei Terremoti Italiani Dall’Anno 1000 al 1980; Postpischl, D., Ed.; Consiglio Nazionale Delle Ricerche, Progetto Finalizzato Geodinamica, Sottoprogetto Rischio Sismico e Ingegneria Sismica: Bologna, Italy, 1985; p. 239. [Google Scholar]
  46. Boschi, E.; Guidoboni, E.; Ferrari, G.; Valensise, G.; Gasperini, P. Catalogo dei forti terremoti in Italia dal 461 a.C. al 1990; ING-SGA: Bologna, Italy, 1997; p. 644. [Google Scholar]
  47. Tinti, S.; Maramai, A.; Graziani, L. The New Catalogue of Italian Tsunamis. Nat. Hazards 2004, 33, 439–465. [Google Scholar] [CrossRef]
  48. Scicchitano, G.; Costa, B.; Di Stefano, A.; Longhitano, S.G.; Monaco, C. Tsunami and storm deposits preserved within a ria-type rocky coastal setting (Siracusa, SE Sicily). Z. Geomorphol. Suppl. Issues 2010, 54, 51–77. [Google Scholar] [CrossRef] [Green Version]
  49. Gerardi, F.; Smedile, A.; Pirrotta, C.; Barbano, M.S.; Martini, P.M.D.; Pinzi, S.; Gueli, A.M.; Ristuccia, G.M.; Stella, G.; Troja, S.O. Geological record of tsunami inundations in Pantano Morghella (south-eastern Sicily) both from near and far-field sources. Nat. Hazards Earth Syst. Sci. 2012, 12, 1185–1200. [Google Scholar] [CrossRef] [Green Version]
  50. Di Grande, A.; Raimondo, W. Linee di costa pliopleistoceniche e schema litostratigrafico del Quaternario siracusano. Geol. Romana 1982, 21, 279–309. [Google Scholar]
  51. Ferranti, L.; Antonioli, F.; Mauz, B.; Amorosi, A.; Dai Pra, G.; Mastronuzzi, G.; Monaco, C.; Orrù, P.; Pappalardo, M.; Radtke, U.; et al. Markers of the last interglacial sea-level high stand along the coast of Italy: Tectonic implications. Quat. Int. 2006, 145, 30–54. [Google Scholar] [CrossRef]
  52. Ferranti, L.; Antonioli, F.; Anzidei, M.; Monaco, C.; Stocchi, P. The timescale and spatial extent of vertical tectonic motions in Italy: Insights from relative sea-level changes studies. J. Virtual Explor. 2010, 36, 36. [Google Scholar] [CrossRef]
  53. Dutton, A.; Scicchitano, G.; Monaco, C.; Desmarchelier, J.M.; Antonioli, F.; Lambeck, K.; Esat, T.M.; Fifield, L.K.; McCulloch, M.T.; Mortimer, G. Uplift rates defined by U-series and 14C ages of serpulid-encrusted speleothems from submerged caves near Siracusa, Sicily (Italy). Quat. Geochronol. 2009, 4, 2–10. [Google Scholar] [CrossRef]
  54. Scicchitano, G.; Antonioli, F.; Berlinghieri, E.F.C.; Dutton, A.; Monaco, C. Submerged archaeological sites along the Ionian coast of southeastern Sicily (Italy) and implications for the Holocene relative sea-level change. Quat. Res. 2008, 70, 26–39. [Google Scholar] [CrossRef]
  55. Scicchitano, G.; Spampinato, C.R.; Antonioli, F.; Anzidei, M.; Presti, V.L.; Monaco, C. Comparing ancient quarries in stable and slowly uplifting coastal area located in Eastern Sicily, Italy. Geogr. Fis. Din. Quat. 2018, 41, 81–92. [Google Scholar]
  56. Scicchitano, G.; Berlinghieri, E.F.C.; Antonioli, F.; Spampinato, C.R.; Monaco, C. Sacred Landscapes and Changing Sea Levels: New Interdisciplinary Data from the Early Neolithic to the Present in South-Eastern Sicily. In Under the Sea: Archaeology and Palaeolandscapes of the Continental Shelf; Bailey, G.N., Harff, J., Sakellariou, D., Eds.; Coastal Research Library, Springer International Publishing: Cham, Switzerland, 2017; pp. 233–253. ISBN 978-3-319-53160-1. [Google Scholar]
  57. Spampinato, C.R.; Costa, B.; Di Stefano, A.; Monaco, C.G.; Scicchitano, G. The contribution of tectonics to relative sea-level change during the Holocene in south-eastern Sicily coastal area: New data from boreholes. Quat. Int. 2011, 232, 214–227. [Google Scholar] [CrossRef]
  58. Anzidei, M.; Scicchitano, G.; Tarascio, S.; de Guidi, G.; Monaco, C.; Barreca, G.; Mazza, G.; Serpelloni, E.; Vecchio, A. Coastal retreat and marine flooding scenario for 2100: A case study along the coast of Maddalena peninsula (southeastern Sicily). Geogr. Fis. Din. Quat. 2018, 41, 5–16. [Google Scholar]
  59. Le Cozannet, G.; Nicholls, R.J.; Hinkel, J.; Sweet, W.V.; McInnes, K.L.; Van de Wal, R.S.W.; Slangen, A.B.A.; Lowe, J.A.; White, K.D. Sea Level Change and Coastal Climate Services: The Way Forward. J. Mar. Sci. Eng. 2017, 5, 49. [Google Scholar] [CrossRef] [Green Version]
  60. IPCC Climate Change 2014: Synthesis Report. Contribution of Working Groups I, II and III to the Fifth Assessment Report of the Intergovernmental Panel on Climate Change; Core Writing Team; Pachauri, R.K.; Meyer, L.A. (Eds.) IPCC: Geneva, Switzerland, 2014; p. 151. [Google Scholar]
  61. IPCC Special Report on the Ocean and Cryosphere in a Changing Climate; Pörtnerd, H.-O.; Robertsv, C.; Masson-Delmottep, V.; Zhaim, P.; Tignore, M.; Poloczanskak, E.; Mintenbeck, K.; Alegría, A.; Nicolai, M.; Okem, A.; et al. (Eds.) 2019; in press. [Google Scholar]
  62. Vecchio, A.; Anzidei, M.; Serpelloni, E.; Florindo, F. Natural Variability and Vertical Land Motion Contributions in the Mediterranean Sea-Level Records over the Last Two Centuries and Projections for 2100. Water 2019, 11, 1480. [Google Scholar] [CrossRef] [Green Version]
  63. Smedile, A.; De Martini, P.M.; Pantosti, D.; Bellucci, L.; Del Carlo, P.; Gasperini, L.; Pirrotta, C.; Polonia, A.; Boschi, E. Possible tsunami signatures from an integrated study in the Augusta Bay offshore. Mar. Geol. 2011, 281, 1–13. [Google Scholar] [CrossRef]
  64. De Martini, P.M.; Barbano, M.S.; Smedile, A.; Gerardi, F.; Pantosti, D.; Del Carlo, P.; Pirrotta, C. A unique 4000 year long geological record of multiple tsunami inundations in the Augusta Bay (eastern Sicily, Italy). Mar. Geol. 2010, 276, 42–57. [Google Scholar] [CrossRef] [Green Version]
  65. De Martini, P.M.; Barbano, M.S.; Pantosti, D.; Smedile, A.; Pirrotta, C.; Del Carlo, P.; Pinzi, S. Geological evidence for paleotsunamis along eastern Sicily (Italy): An overview. Nat. Hazards Earth Syst. Sci. 2012, 12, 2569–2580. [Google Scholar] [CrossRef]
  66. Scardino, G.; Piscitelli, A.; Milella, M.; Sansò, P.; Mastronuzzi, G. Tsunami fingerprints along the Mediterranean coasts. Rend. Lincei 2020, 1–17. [Google Scholar] [CrossRef]
  67. Fago, P.; Pignatelli, C.; Piscitelli, A.; Milella, M.; Venerito, M.; Sansò, P.; Mastronuzzi, G. WebGIS for Italian tsunami: A useful tool for coastal planners. Mar. Geol. 2014, 355, 369–376. [Google Scholar] [CrossRef]
  68. Available online: www.idromare.com (accessed on 1 April 2015).
  69. Inglesi, R.; Corsini, S.; Guiducci, F.; Arseni, A. Statistical analysis of extreme waves on the Italian coasts from 1989 to 1999. Boll. Geofis. Teor. Appl. 2000, 41, 315–337. [Google Scholar]
  70. RON ISPRA. Available online: http://dati.isprambiente.it/dataset/ron-rete-ondametrica-nazionale/ (accessed on 4 May 2020).
  71. MSS: Aviso+. Available online: https://www.aviso.altimetry.fr/en/data/products/auxiliary-products/mss.html (accessed on 4 May 2020).
  72. RETE MAREOGRAFICA NAZIONALE—HOMEPAGE. Available online: https://mareografico.it/ (accessed on 4 April 2020).
  73. Tracker Video Analysis and Modeling Tool for Physics Education. Available online: https://physlets.org/tracker/ (accessed on 4 May 2020).
  74. Casella, E.; Rovere, A.; Pedroncini, A.; Stark, C.P.; Casella, M.; Ferrari, M.; Firpo, M. Drones as tools for monitoring beach topography changes in the Ligurian Sea (NW Mediterranean). Geo-Mar. Lett. 2016, 36, 151–163. [Google Scholar] [CrossRef]
  75. Pepe, F.; Corradino, M.; Parrino, N.; Besio, G.; Presti, V.L.; Renda, P.; Calcagnile, L.; Quarta, G.; Sulli, A.; Antonioli, F. Boulder coastal deposits at Favignana Island rocky coast (Sicily, Italy): Litho-structural and hydrodynamic control. Geomorphology 2018, 303, 191–209. [Google Scholar] [CrossRef]
  76. Imamura, F.; Goto, K.; Ohkubo, S. A numerical model for the transport of a boulder by tsunami. J. Geophys. Res. Ocean. 2008, 113, 113. [Google Scholar] [CrossRef]
  77. Terry, J.P.; Malik, S.A. Reconsidering the seawater-density parameter in hydrodynamic flow transport equations for coastal boulders. New Zealand J. Geol. Geophys. 2020, 1–8. [Google Scholar] [CrossRef]
  78. Marcos, M.; Jordà, G.; Gomis, D.; Pérez, B. Changes in storm surges in southern Europe from a regional model under climate change scenarios. Glob. Planet. Chang. 2011, 77, 116–128. [Google Scholar] [CrossRef]
Figure 1. Geological settings of Southeastern Sicily. (A) Tectonic sketch map of the Sicilian Collision Zone in eastern Sicily (from Cultrera et al. [39], modified). (B) Position of the Maddalena Peninsula area along the Ionian coast of southeastern Sicily. (C) Morphological map of the Maddalena Peninsula showing the location of the study area (box).
Water 12 01497 g001
Figure 2. Meteo-marine features recorded in Southeastern Sicily. (A) Data of significant spectral wave heights Hm0 recorded by ondametric buoy of Catania (1986–2006). (B) Wave height Hm0 recorded by Catania buoy (RON) during Medicane Qendresa. (C) Sea level recorded by tide gauge of Capo Passero (ISPRA [72]) during Medicane Zorbas.
Water 12 01497 g002
Figure 3. (A) Orthophoto (Resolution 1cm/pxl) of ancient Greek quarry located in the northern sector of the Maddalena Peninsula, the arrow shows the Monitoring Station. (B) Monitoring Station mounted on pole at 9 m height. (C) HDTV camera. (D) Unmanned Autonomous Vehicle (UAV) survey operations in the studied area, the pole with Monitoring Station is also visible.
Water 12 01497 g003
Figure 4. (A) Ground control point (GCP) net installed in 2015 and composed of 40 benchmarks regularly spaced along the quarry area. (B) Detail of the colored markers positioned on the ground.
Water 12 01497 g004
Figure 5. (A) High-resolution digital elevation model (2 cm grid cell). (B) Orthophotographs (resolution 1 cm/pxl) reconstructed by UAV photogrammetric survey.
Water 12 01497 g005
Figure 6. Boulders edited in Quantum Geographic Information System (QGIS) from the Orthophoto reconstructed after the impact of Medicane Zorbas; the boulders already present on the coastline and displaced by Zorbas are marked in yellow, the boulders detached from the coastline and dispersed on the shore-platform by Zorbas are marked in orange, and the boulders not displaced by Zorbas are marked in green.
Water 12 01497 g006
Figure 7. (A) Pictures (blue rectangles) and benchmarks (light blue flags) processed in Agisoft Photoscan Professional software version 1.4.0. (B) Three-dimensional model of boulder B2 reconstructed with Rhino 6.
Water 12 01497 g007
Figure 8. Editing analysis of video frames during boulder movements through Tracker software. (A) Rolling of boulder B2 at hour 15:02:00 UTC; (B) movement of boulder B3 at hour 16:16:00 UTC. In the red box diagrams are showed the flow velocity estimations marked for each frame of the video.
Water 12 01497 g008
Figure 9. Boulders displacements during storm events; (A) Position of Boulders K and A from 2007 to 2018. (B) Position of Boulders K and A on 2008. (C) Displacements of Boulder K for the impact of the storms.
Water 12 01497 g009
Figure 10. Boulders displaced by the impact of medicanes Qendresa and Zorbas; the rectangle marks the area where boulders have been detached from the coastline, and the arrow indicates the direction of the flow generating boulder deposit on the edge of the quarry.
Water 12 01497 g010
Figure 11. Flow needed to move the boulders assessed with Nandasena et al. [32] relationships and flow obtained by video editing.
Water 12 01497 g011
Figure 12. Morpho-topography of the shore-platform showing the boulders features assessed through photogrammetric (B2, B3, B4, BN) and Terrestrial Laser Scanner (TLS) (K) surveys.
Water 12 01497 g012
Figure 13. Boulder displacements after a strong wave flow; in green, boulders with volume less than 1 m3 in blue boulders with volume between 1-5 m3, in red boulders with volume greater than 5 m3.
Water 12 01497 g013
Figure 14. Flooding generated by Zorbas on the coastal area of the quarry evaluated through the video frames in condition of minimum turbulences.
Water 12 01497 g014
Figure 15. Flow needed to move the boulders, evaluated using Nandasena et al. [32] relationships, included correction for values of water flow density, compared with flow derived by video analysis.
Water 12 01497 g015
Table 1. Boulder features detected through photogrammetry surveys and laboratory analysis.
IDVolume (m3)Density (kg/m3)Masses (kg)a-Axis (m)b-Axis (m)c-Axis (m)a-Axis Direction
BN0.3672080763.361.80.950.3N110E
B20.70520801466.41.51.170.42N120E
B30.82820401689.121.90.960.45N210E
B40.56920701177.831.570.970.4N190E
D2.28320404657.322.41.951
F1.46120402980.442.11.90.6N354E
H3.37720406889.082.62.40.9
L0.8920401815.62.51.60.5N338E
N4.03120408223.243.22.21.15N281E
J3.36720406868.682.22.11.25
X1.6120403284.42.21.950.7
K18.782220041320.45.85.181.3N159E
Table 2. Results of video analyses of boulder displacements detected in the Maddalena Peninsula.
No.Video Time FrameBoulderMovement DynamicsFound in FieldFlow u (m/s)
114:21:37.221–14:21:50.945B1SlidingNO
214:29:32.769–14:29:44.885B1Sliding/overturningNO2.012
314:31:08.964–14:31:13.264B1OverturningNO1.71
414:33:11.857–14:33:16.157B1SaltationNO1.29
514:35:32.948–14:35:36.648B1_FOverturningNO1.588
614:41:13.447–14:41:15.147B1OverturningNO2.113
715:01:18.471B1SaltationNO
815:02:17.148–15:02:18.948B2OverturningNO2.101
915:14:57.718-15:15:04.118B2OverturningNO1.687
1015:51:53.464B1_FSaltationNO1.783
1115:52:46.083B2SaltationYES2.101
1215:57:57.546–15:58:02.145B3SlidingYES
1315:59:05.542–15:59:07.342B3SlidingYES2.58
1415:59:16.666B3SlidingYES
1516:05:17.440–16:05:24.040B3OverturningYES1.663
1616:08:04.024–16:08:34.941B3Overturning/SlidingYES2.331
1716:16:17.351–16:16:23.504B3OverturningYES1.305
1816:16:57.984–16:17:05.536BNOverturningYES1.981
1916:18:08.880–16:18:13.080B3Overturning/SlidingYES
2016:26:28.971B3Overturning/SlidingYES
2116:28:04.317–16:28:14.854BTOverturningNO1.345
2216:28:30.688–16:28:44.506BTOverturningNO2.269
2316:31:27.882B3OverturningYES
2416:31:30KSlidingYES4
2517:41:35.526B4SaltationYES
2617:42:45.483–17:42:52.613B4SaltationYES
2717:49:26.616–17:49:36.252B4OverturningYES
2818:16:30B4SlidingYES2.525
Table 3. Boulder detected by video editing, selected for flow velocity comparison with hydrodynamic models.
BoulderInstant Time (Hour UTC)Maximum Flow Observed in the Videos (m/s)
B215:01:592.1 ± 0.42
B316:26:132.33 ± 0.5
BN18:16:271.98 ± 0.11
B416:17:492.53 ± 1.34
K*16:30:084 ± 2.25
Table 4. The Terry and Malik [77] relationship between seawater fraction (fw) and sand fraction (fs) connected to the average density of the seawater and sediment mix ( ρ m ).
fwfs ρ m ( kg / m 3 )
101025
0.90.11082.5
0.80.21140
0.70.31197.5
0.60.41255
0.50.51312.5
0.40.61370
0.30.71427.5
0.20.81485
0.10.91542.5

