Geochemical Assessment of Potential Sources for Nitrate in the Wasia Aquifer, Al Kharj Area, Central Saudi Arabia

 , , , and
Abstract
:1. Introduction
2. Background
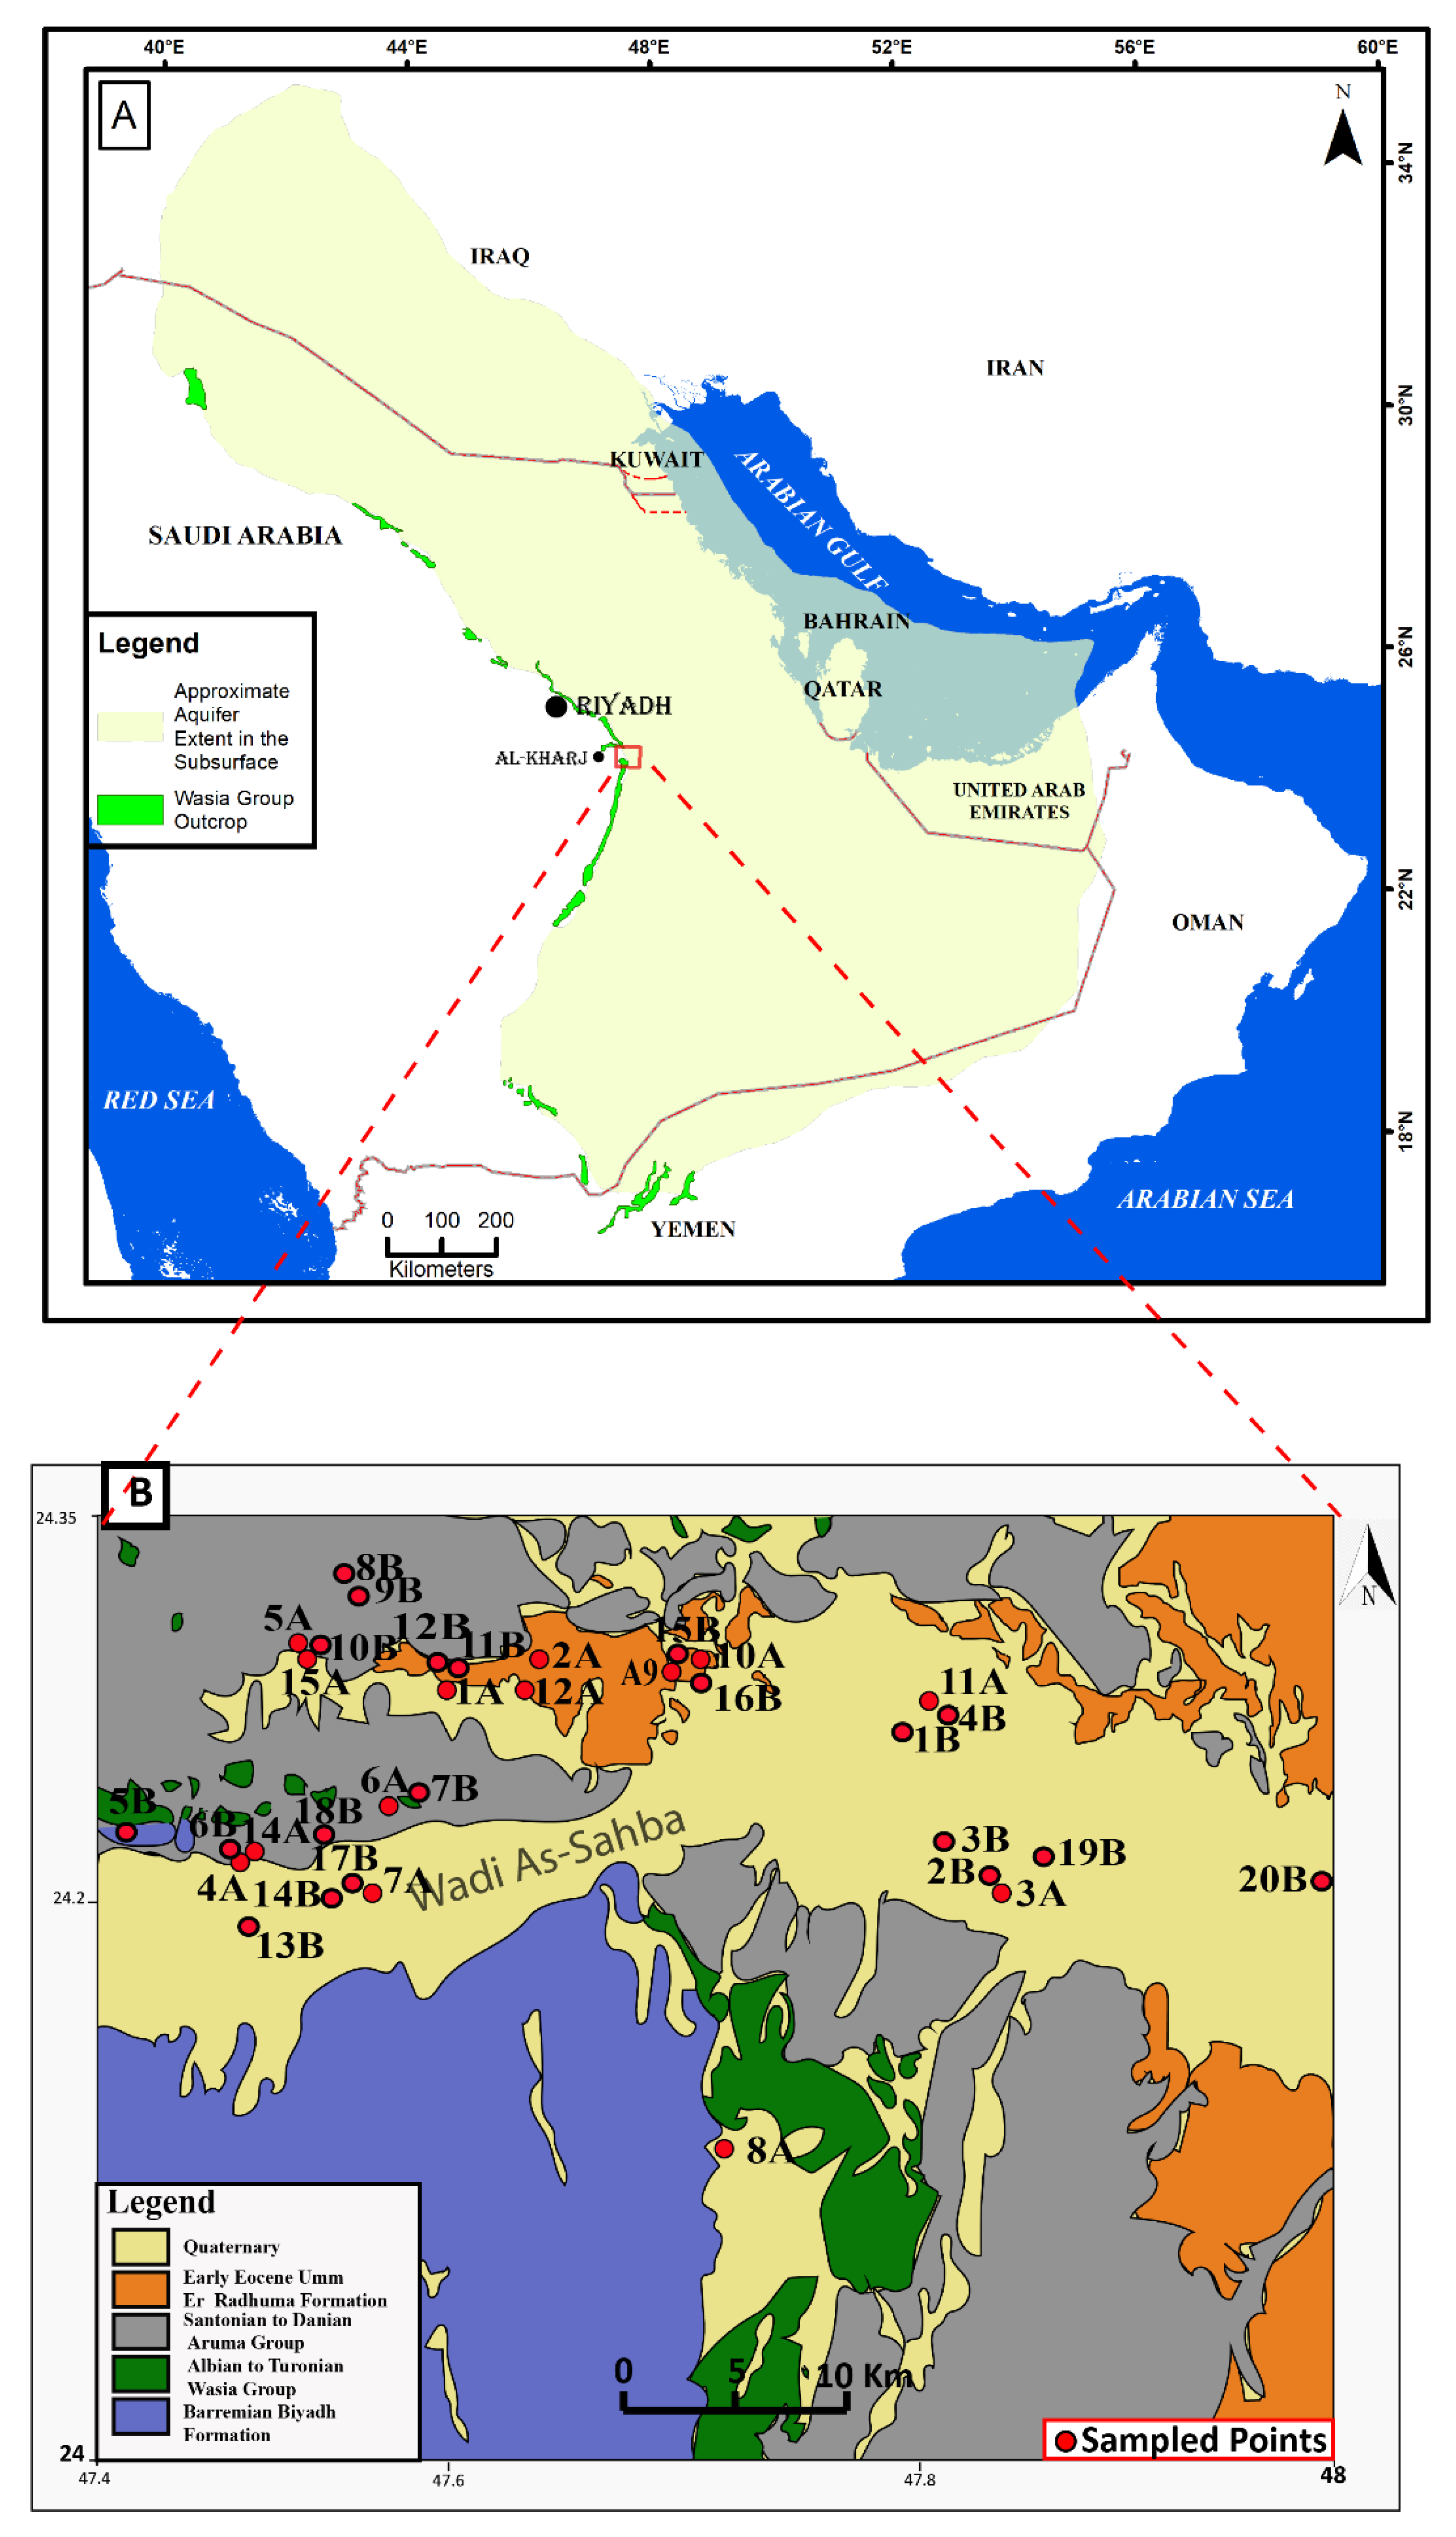
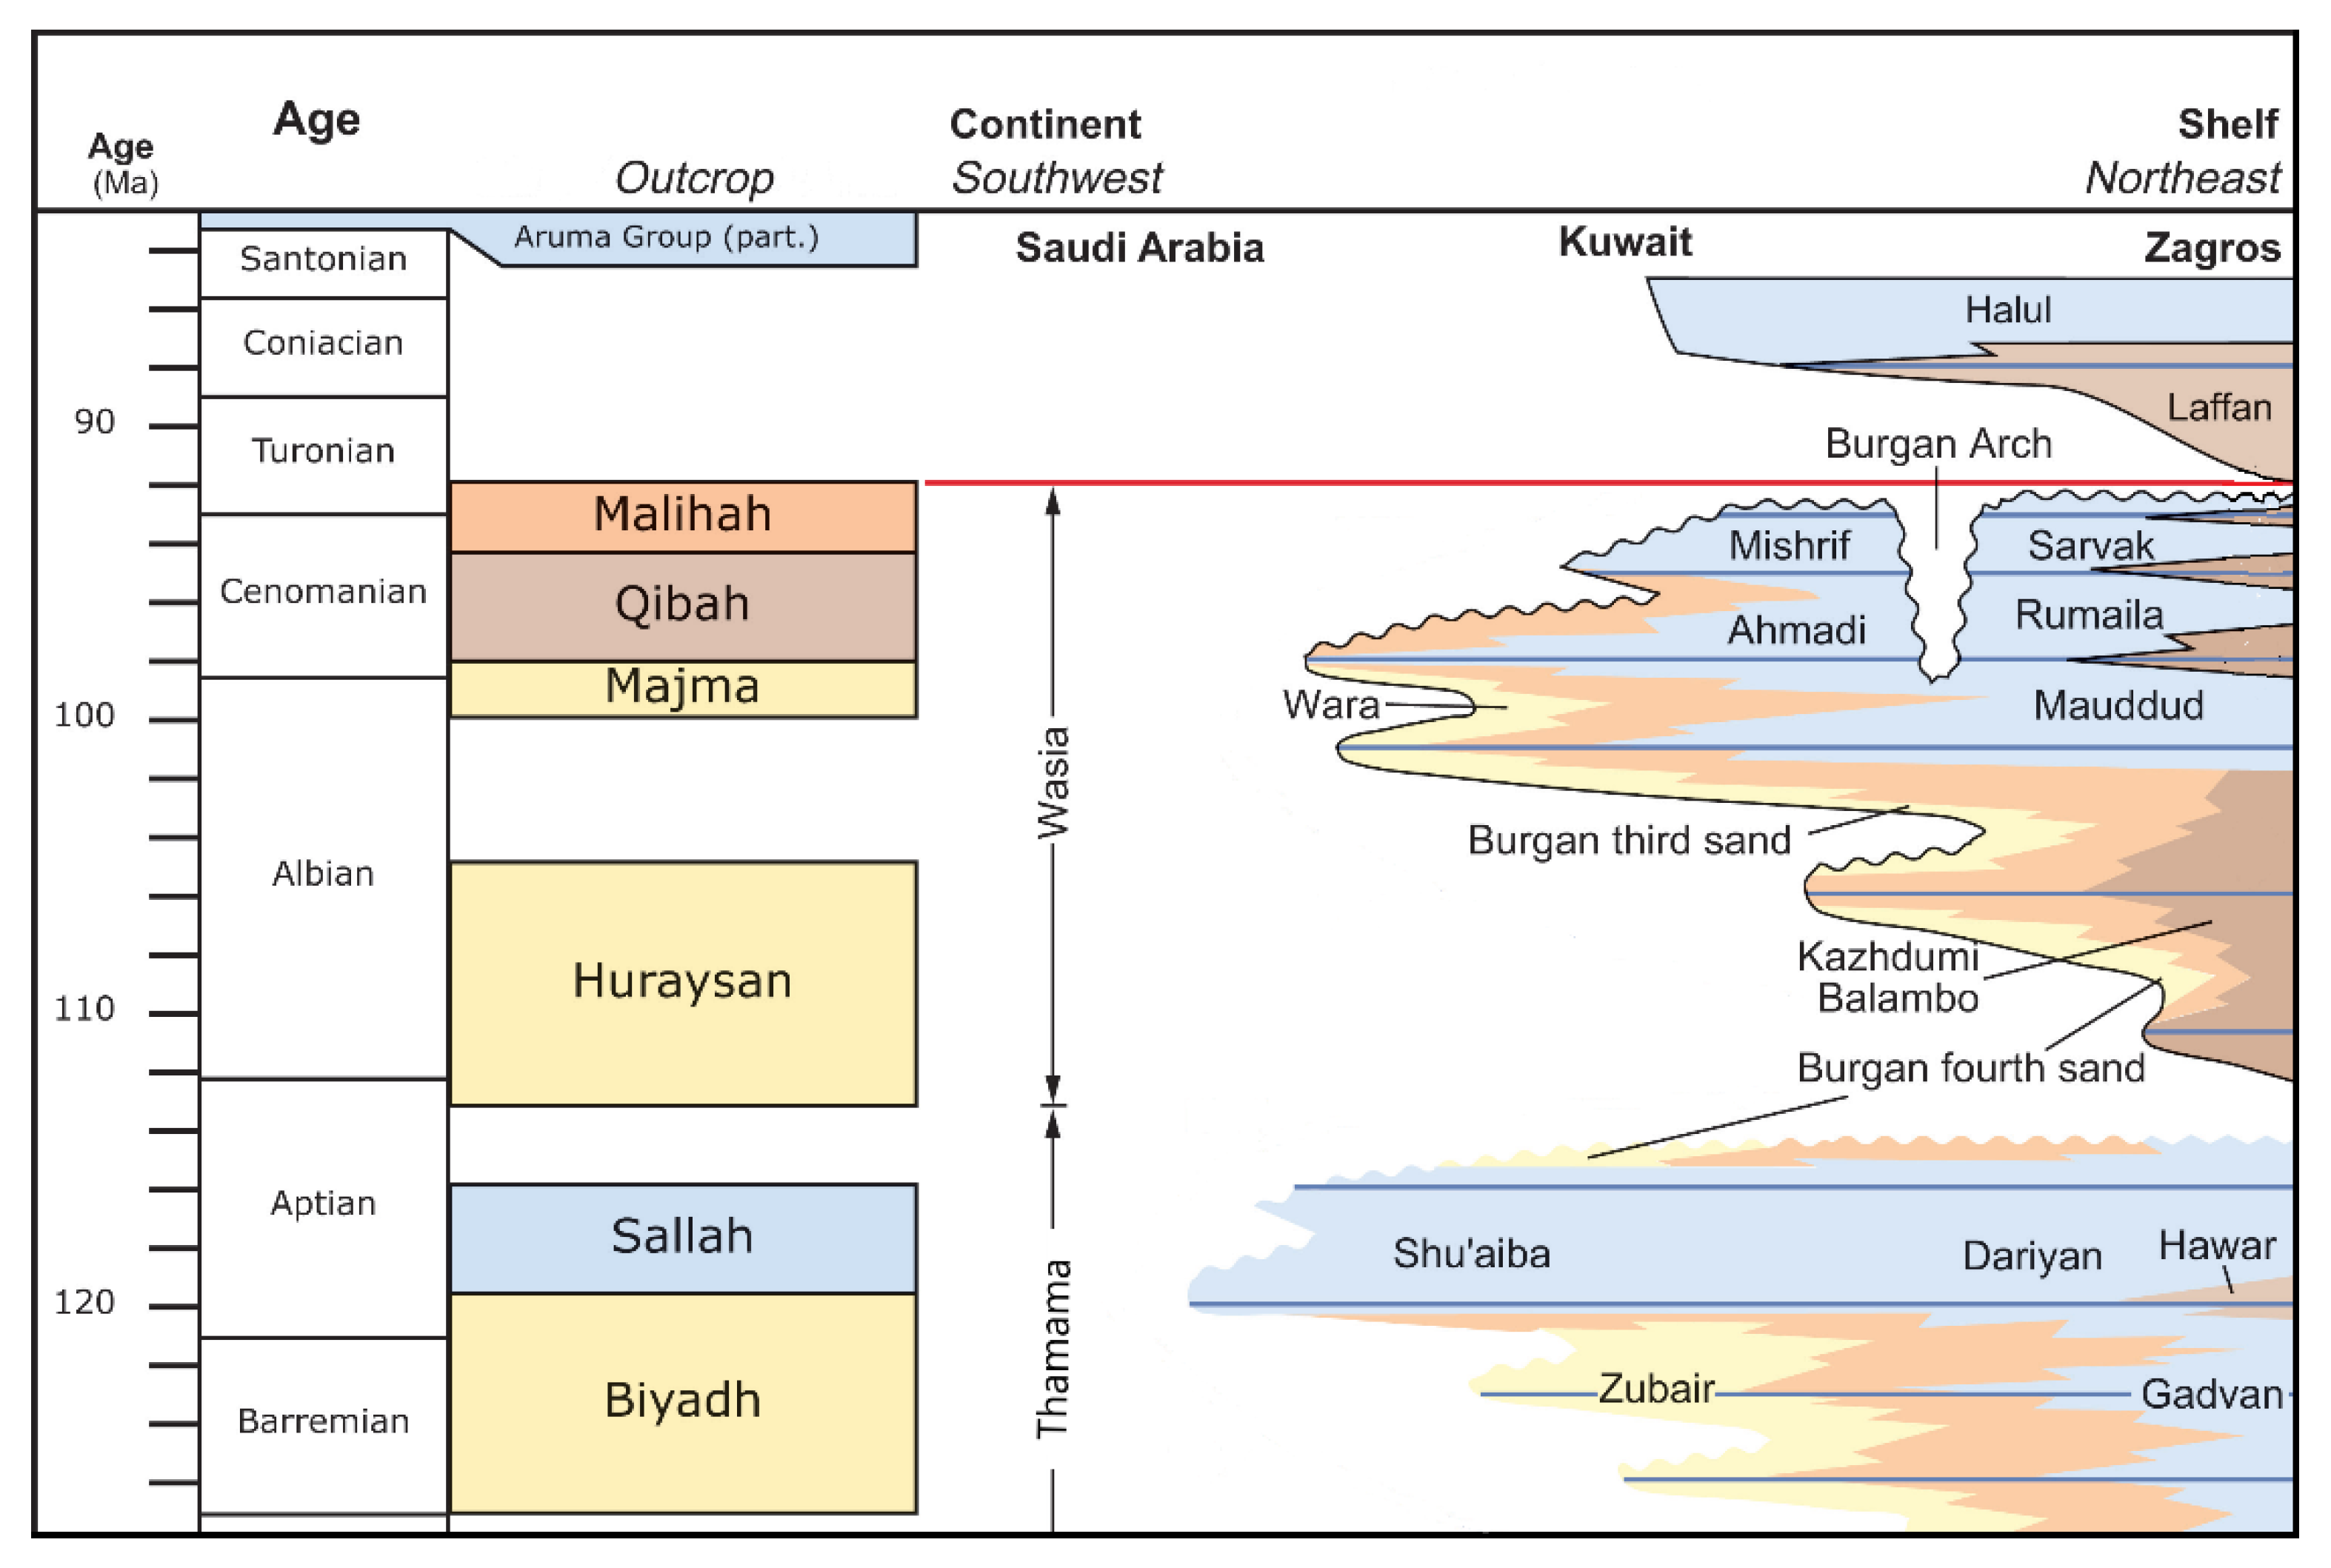
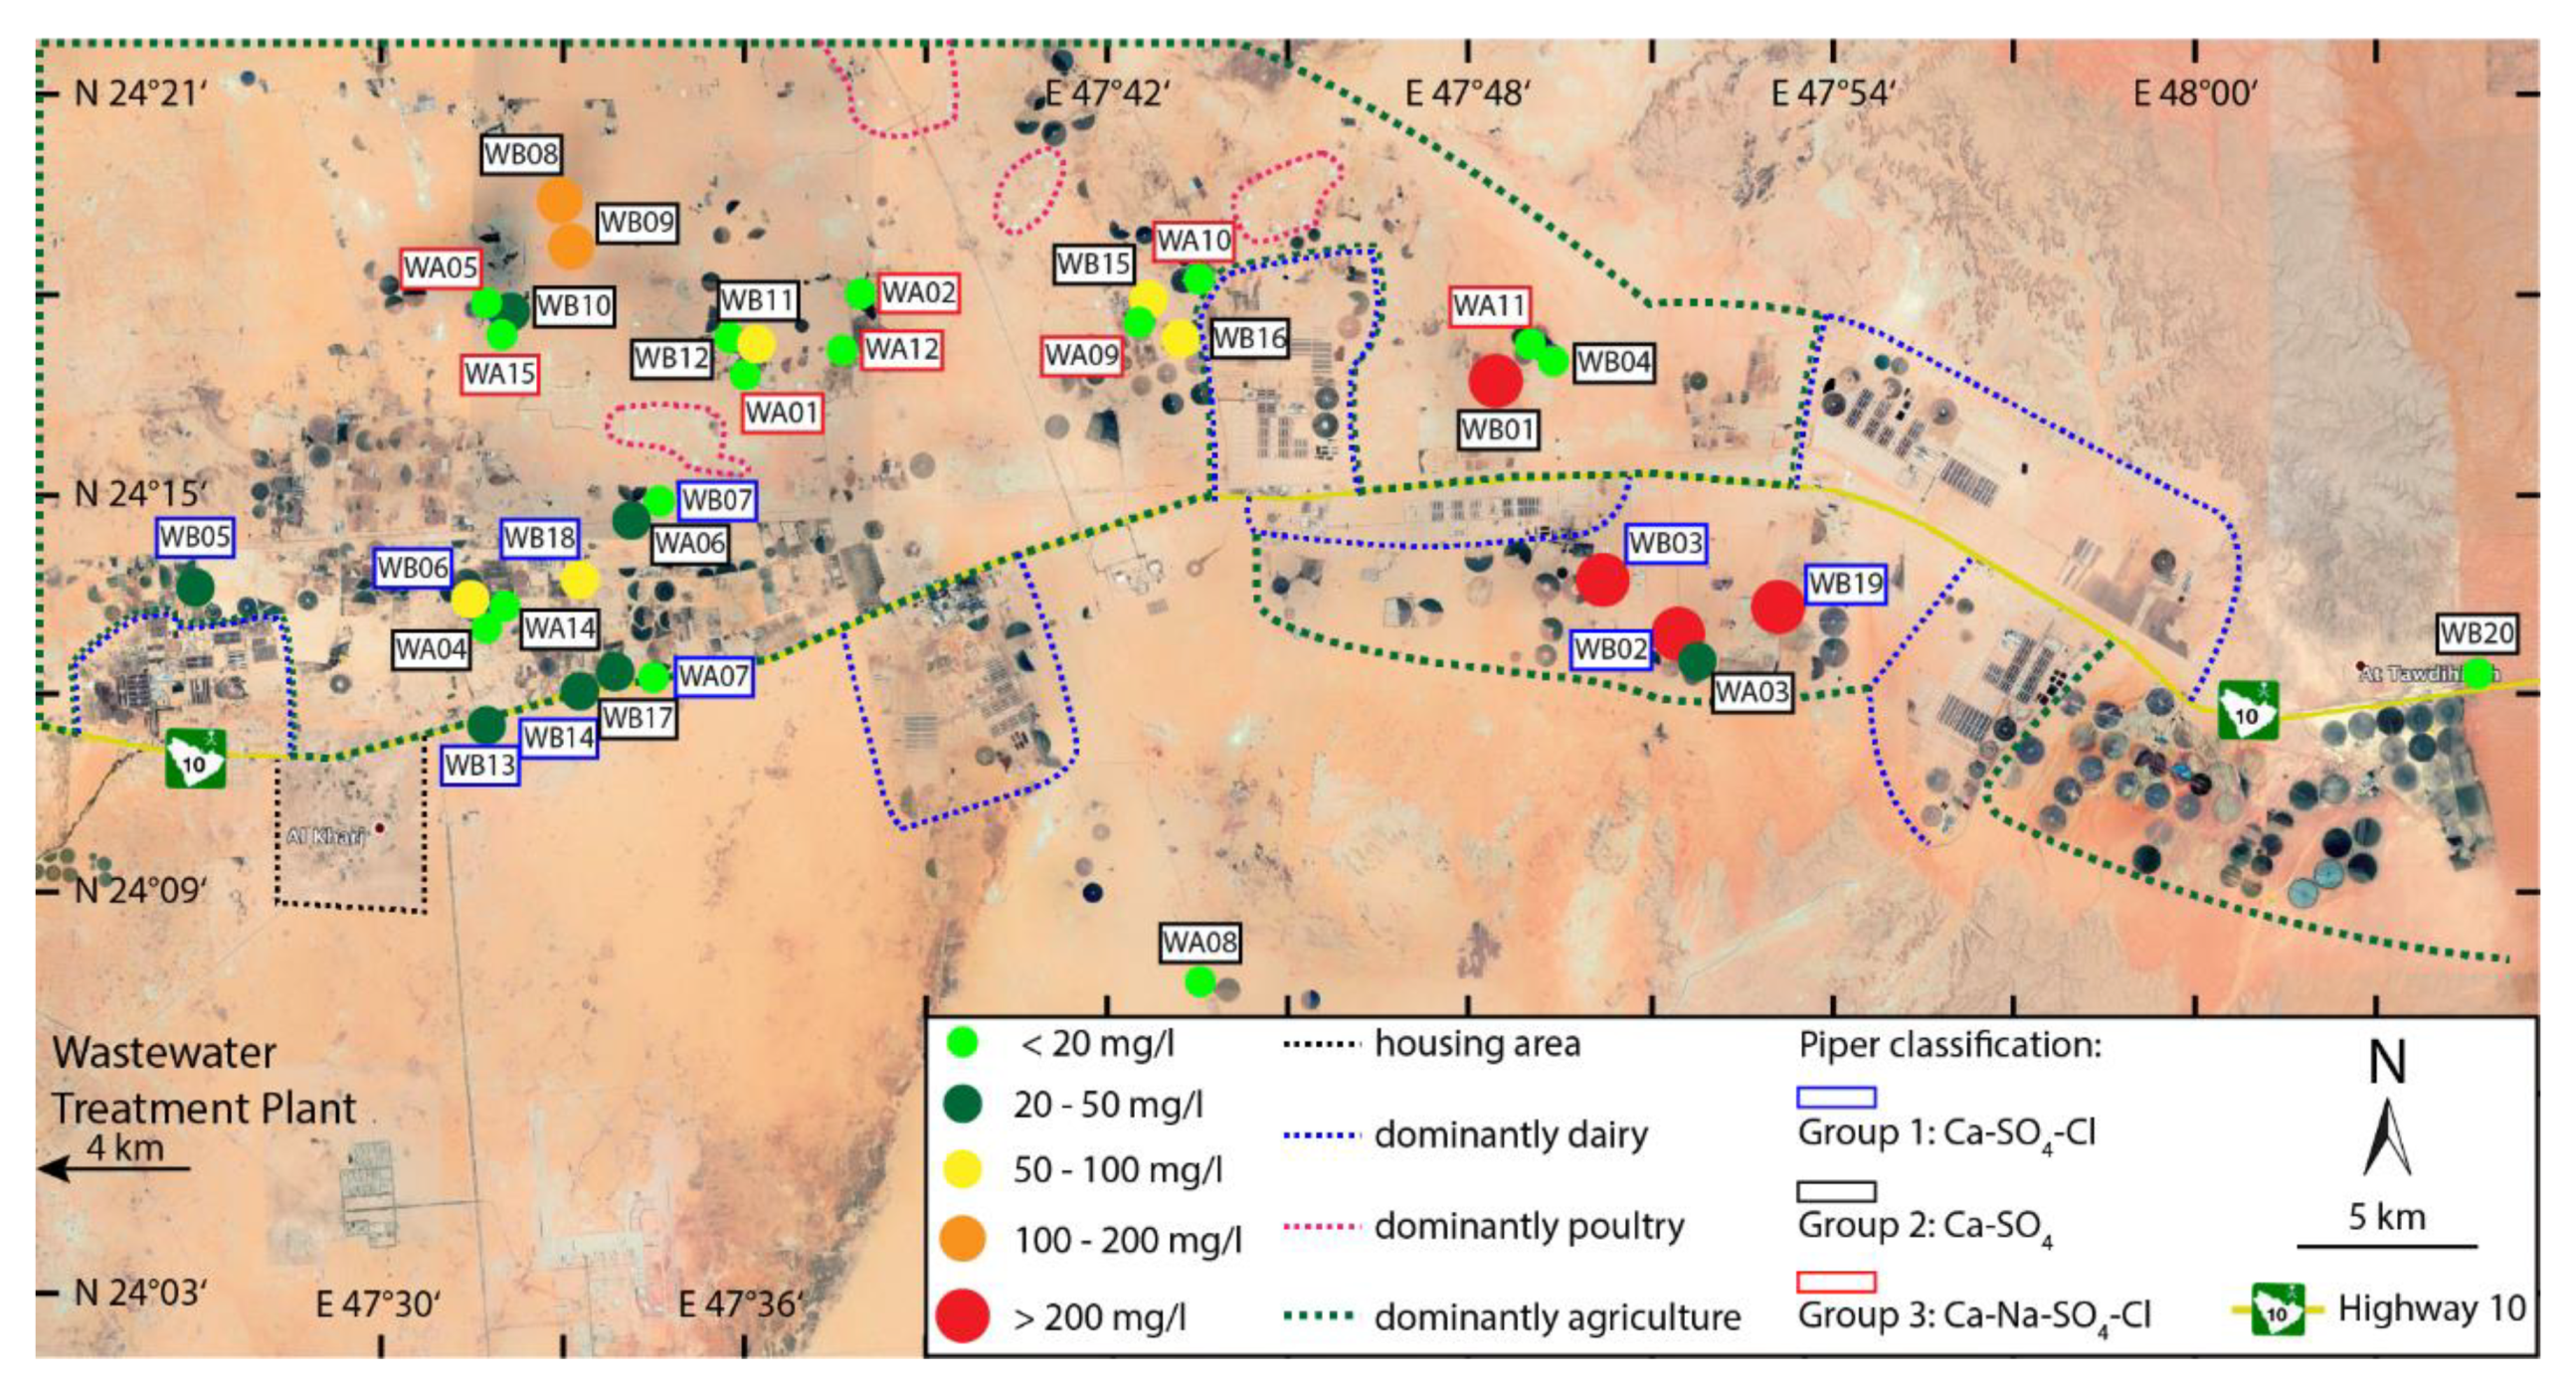
2.1. Location and Geology
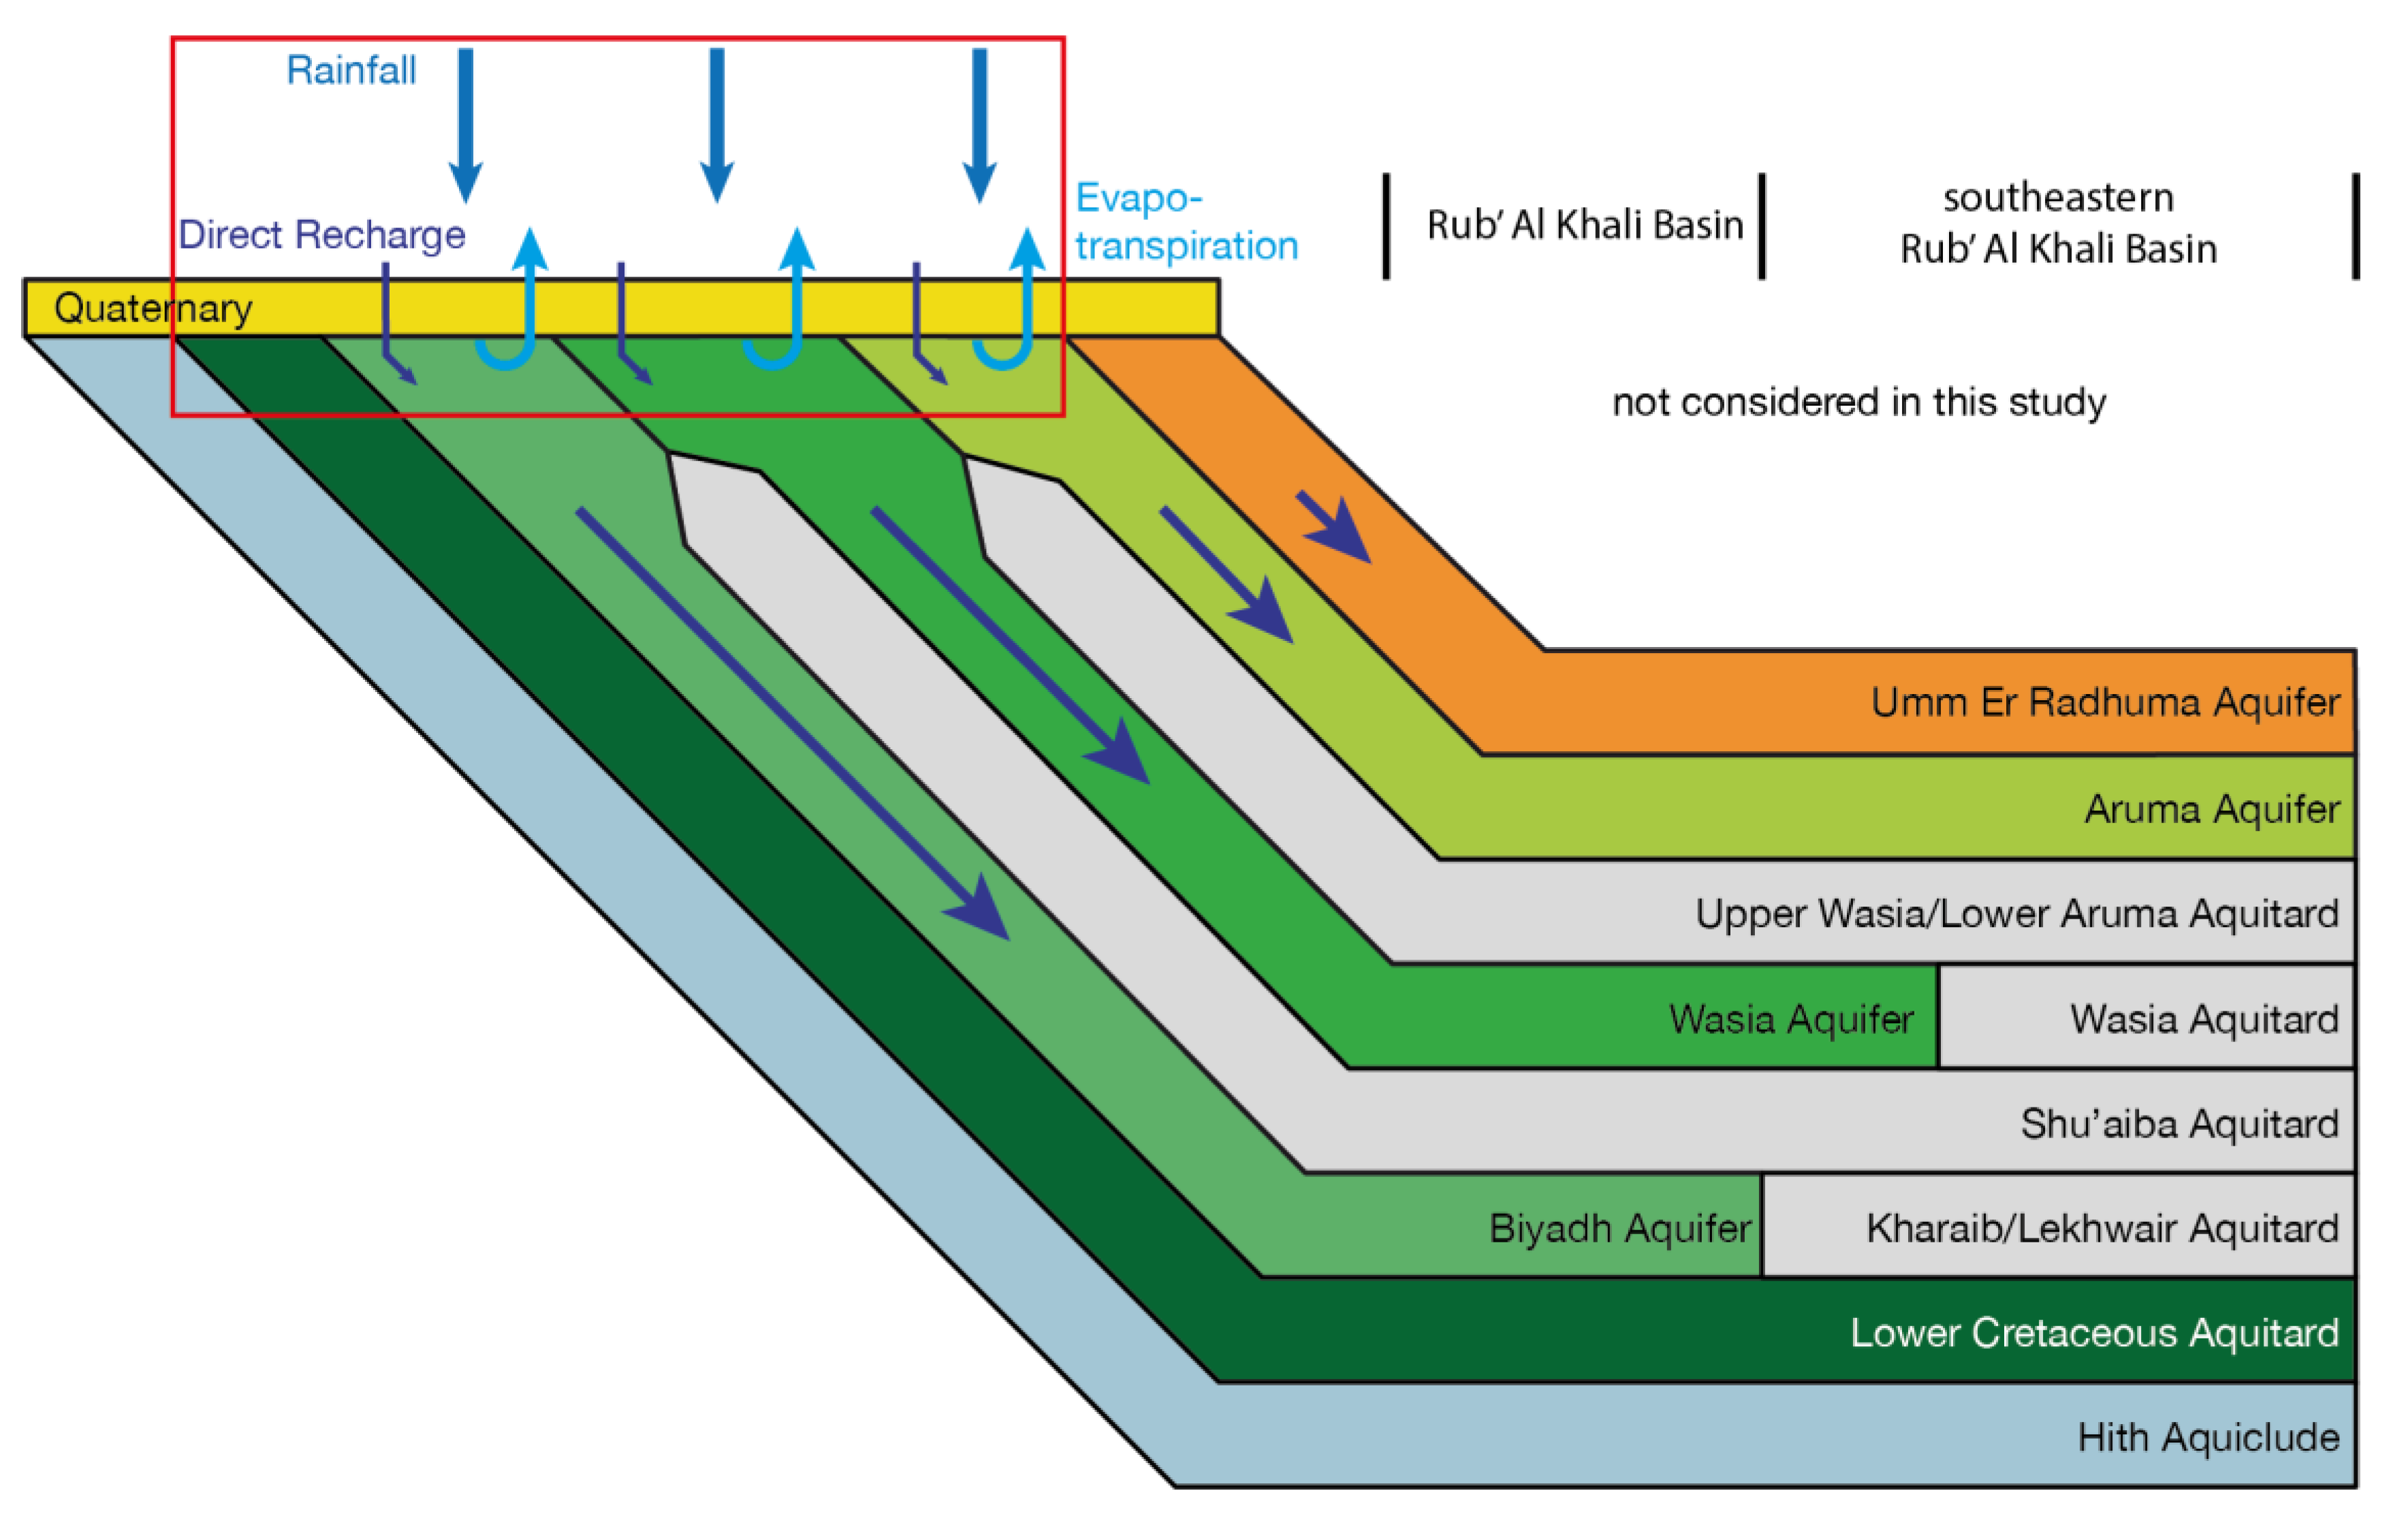
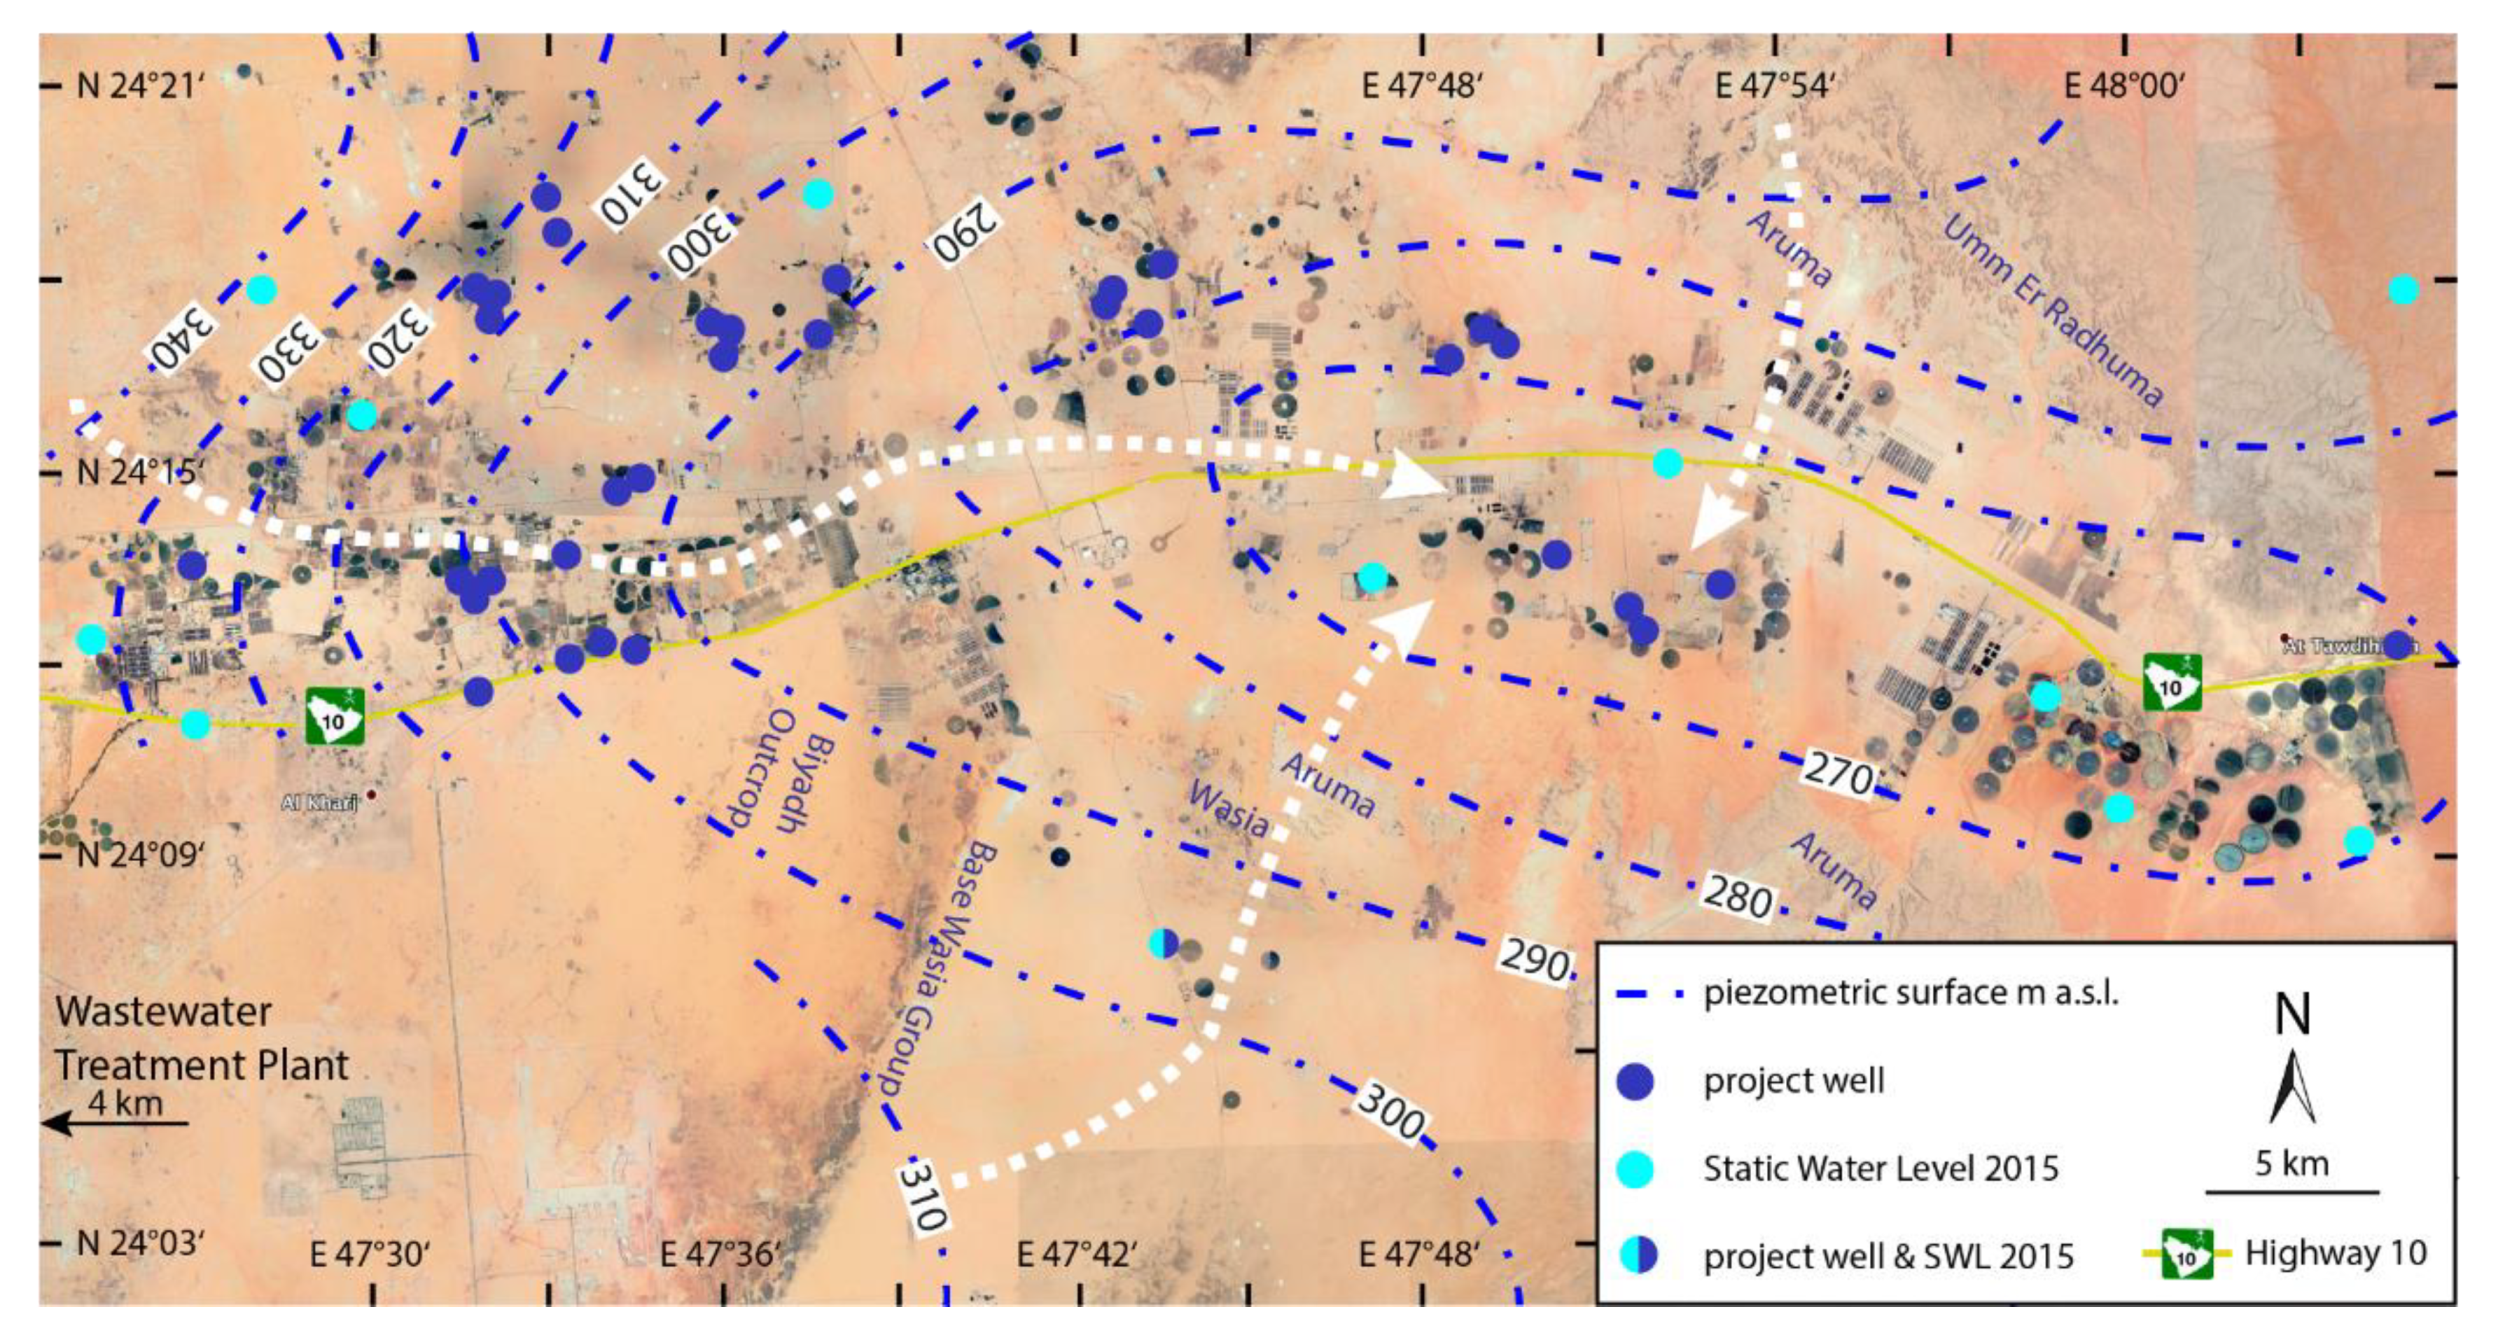
2.2. Hydrogeology
3. Methodology
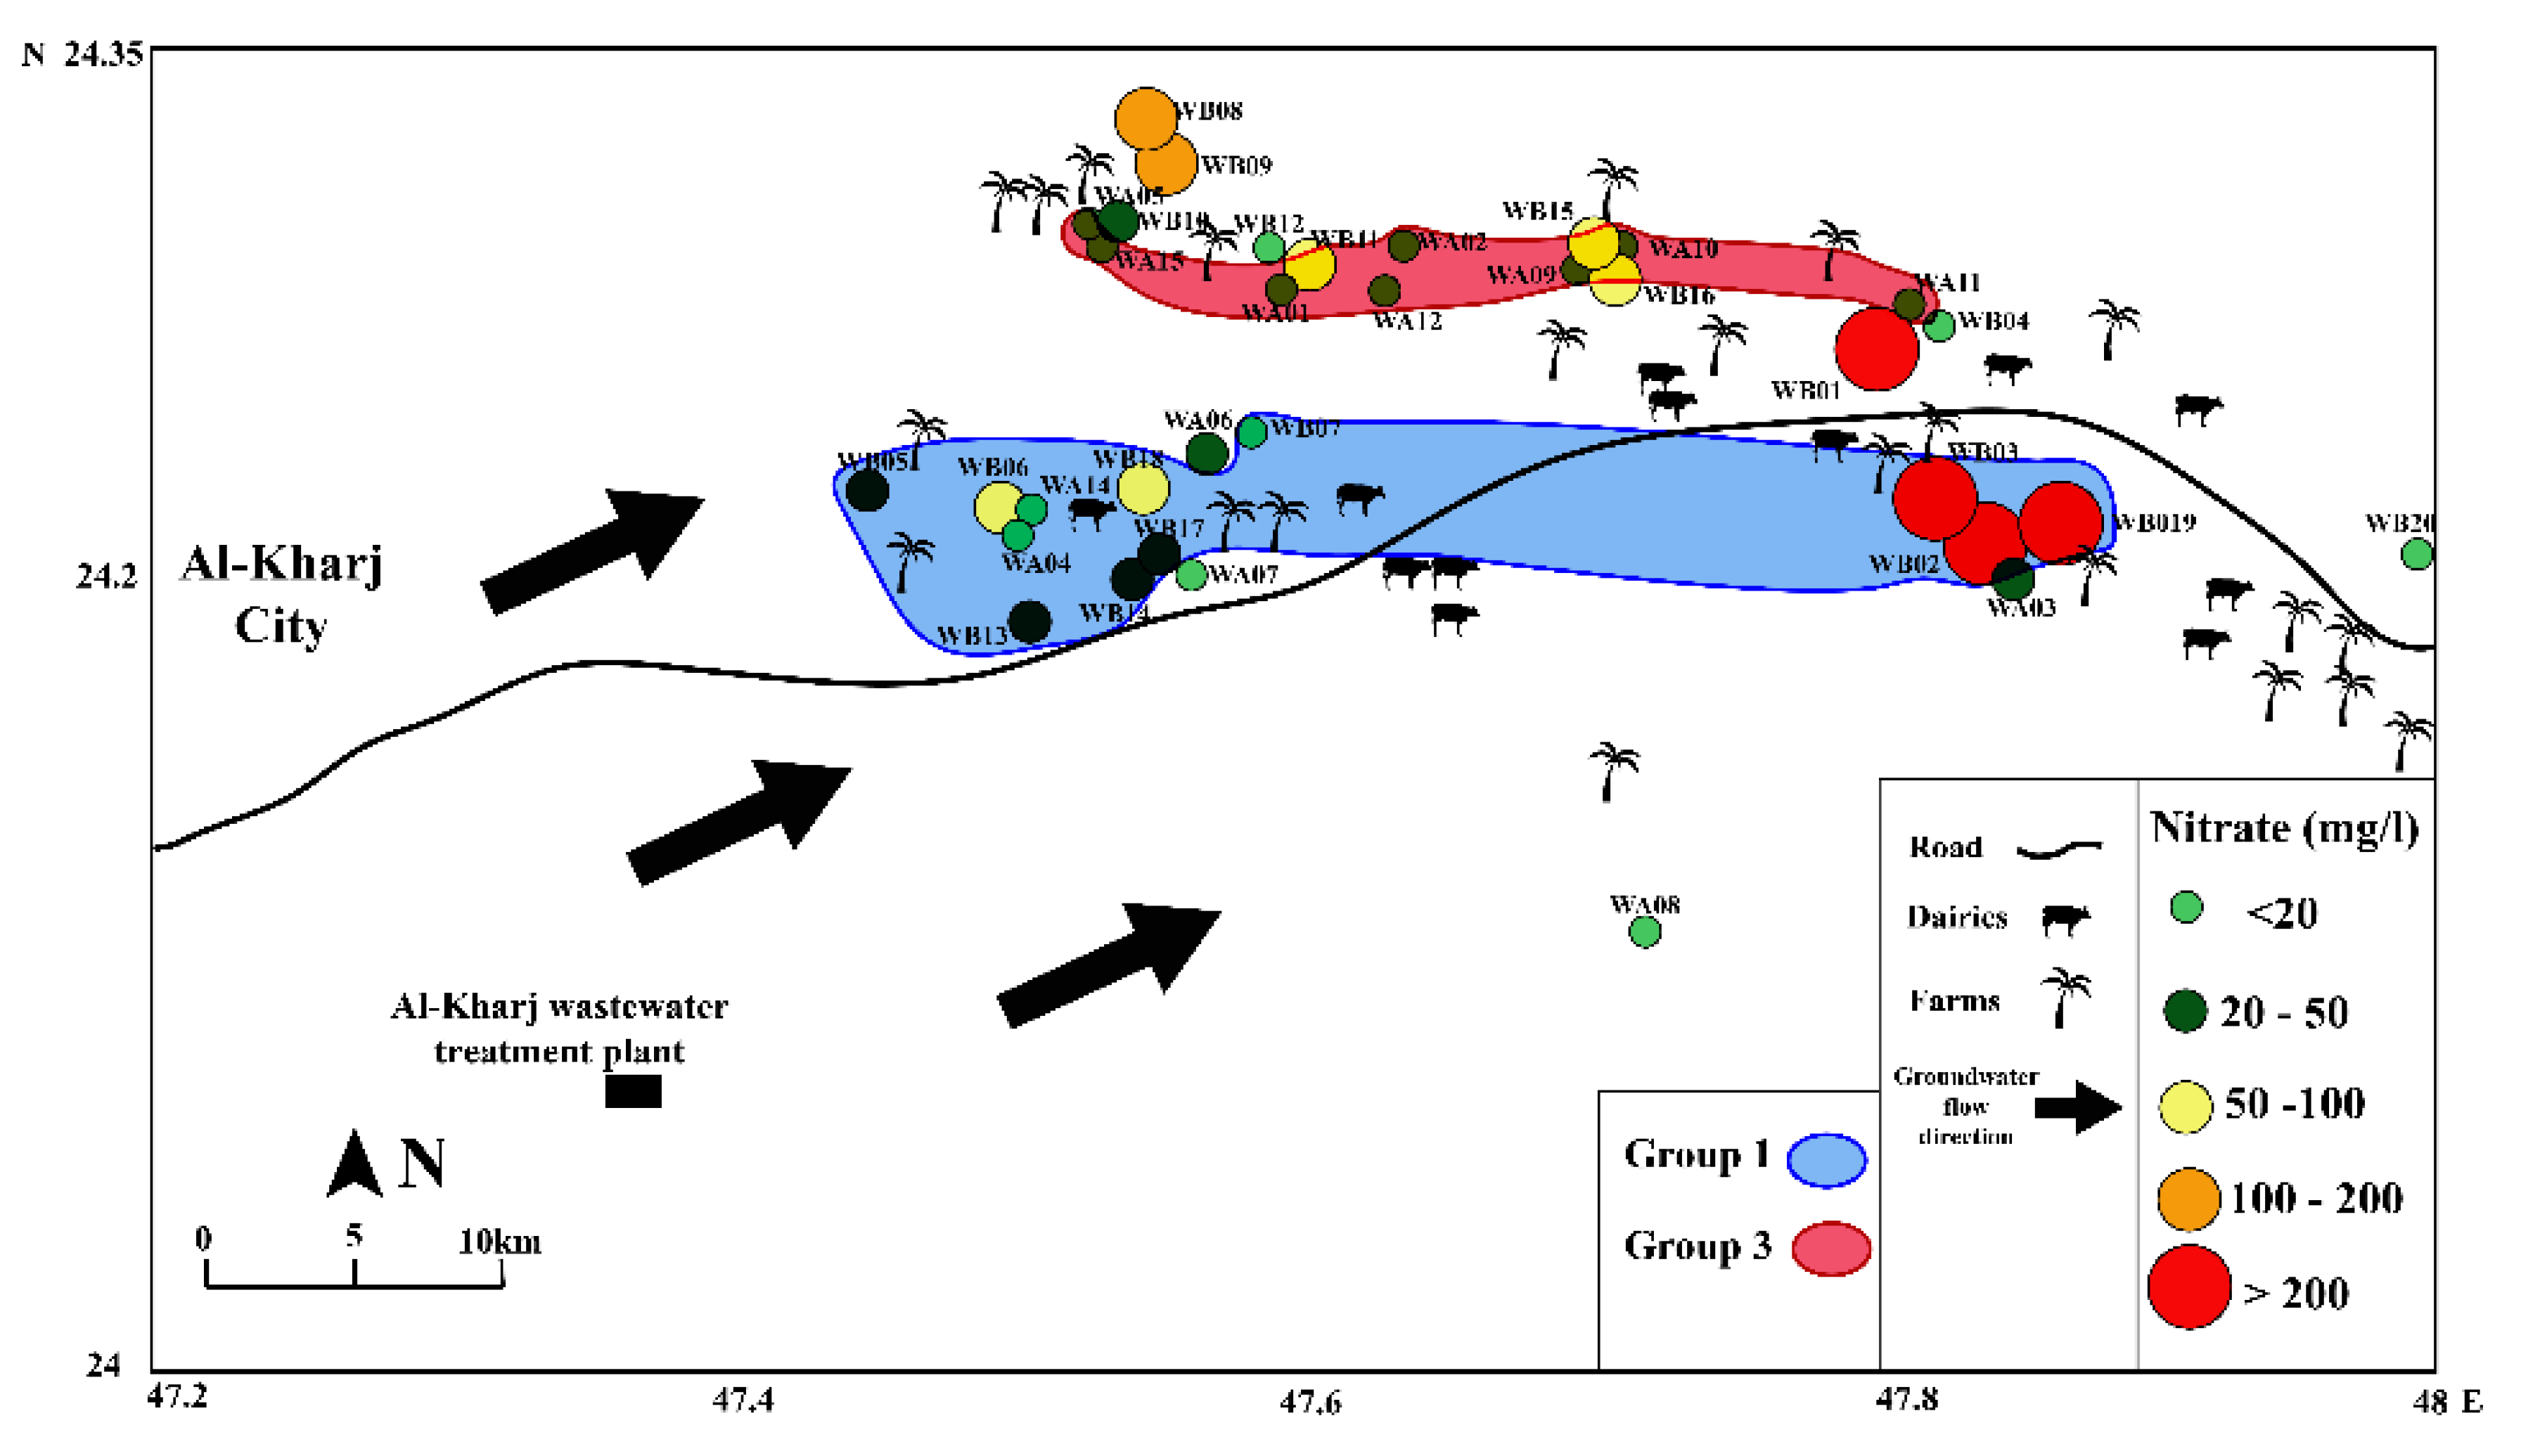
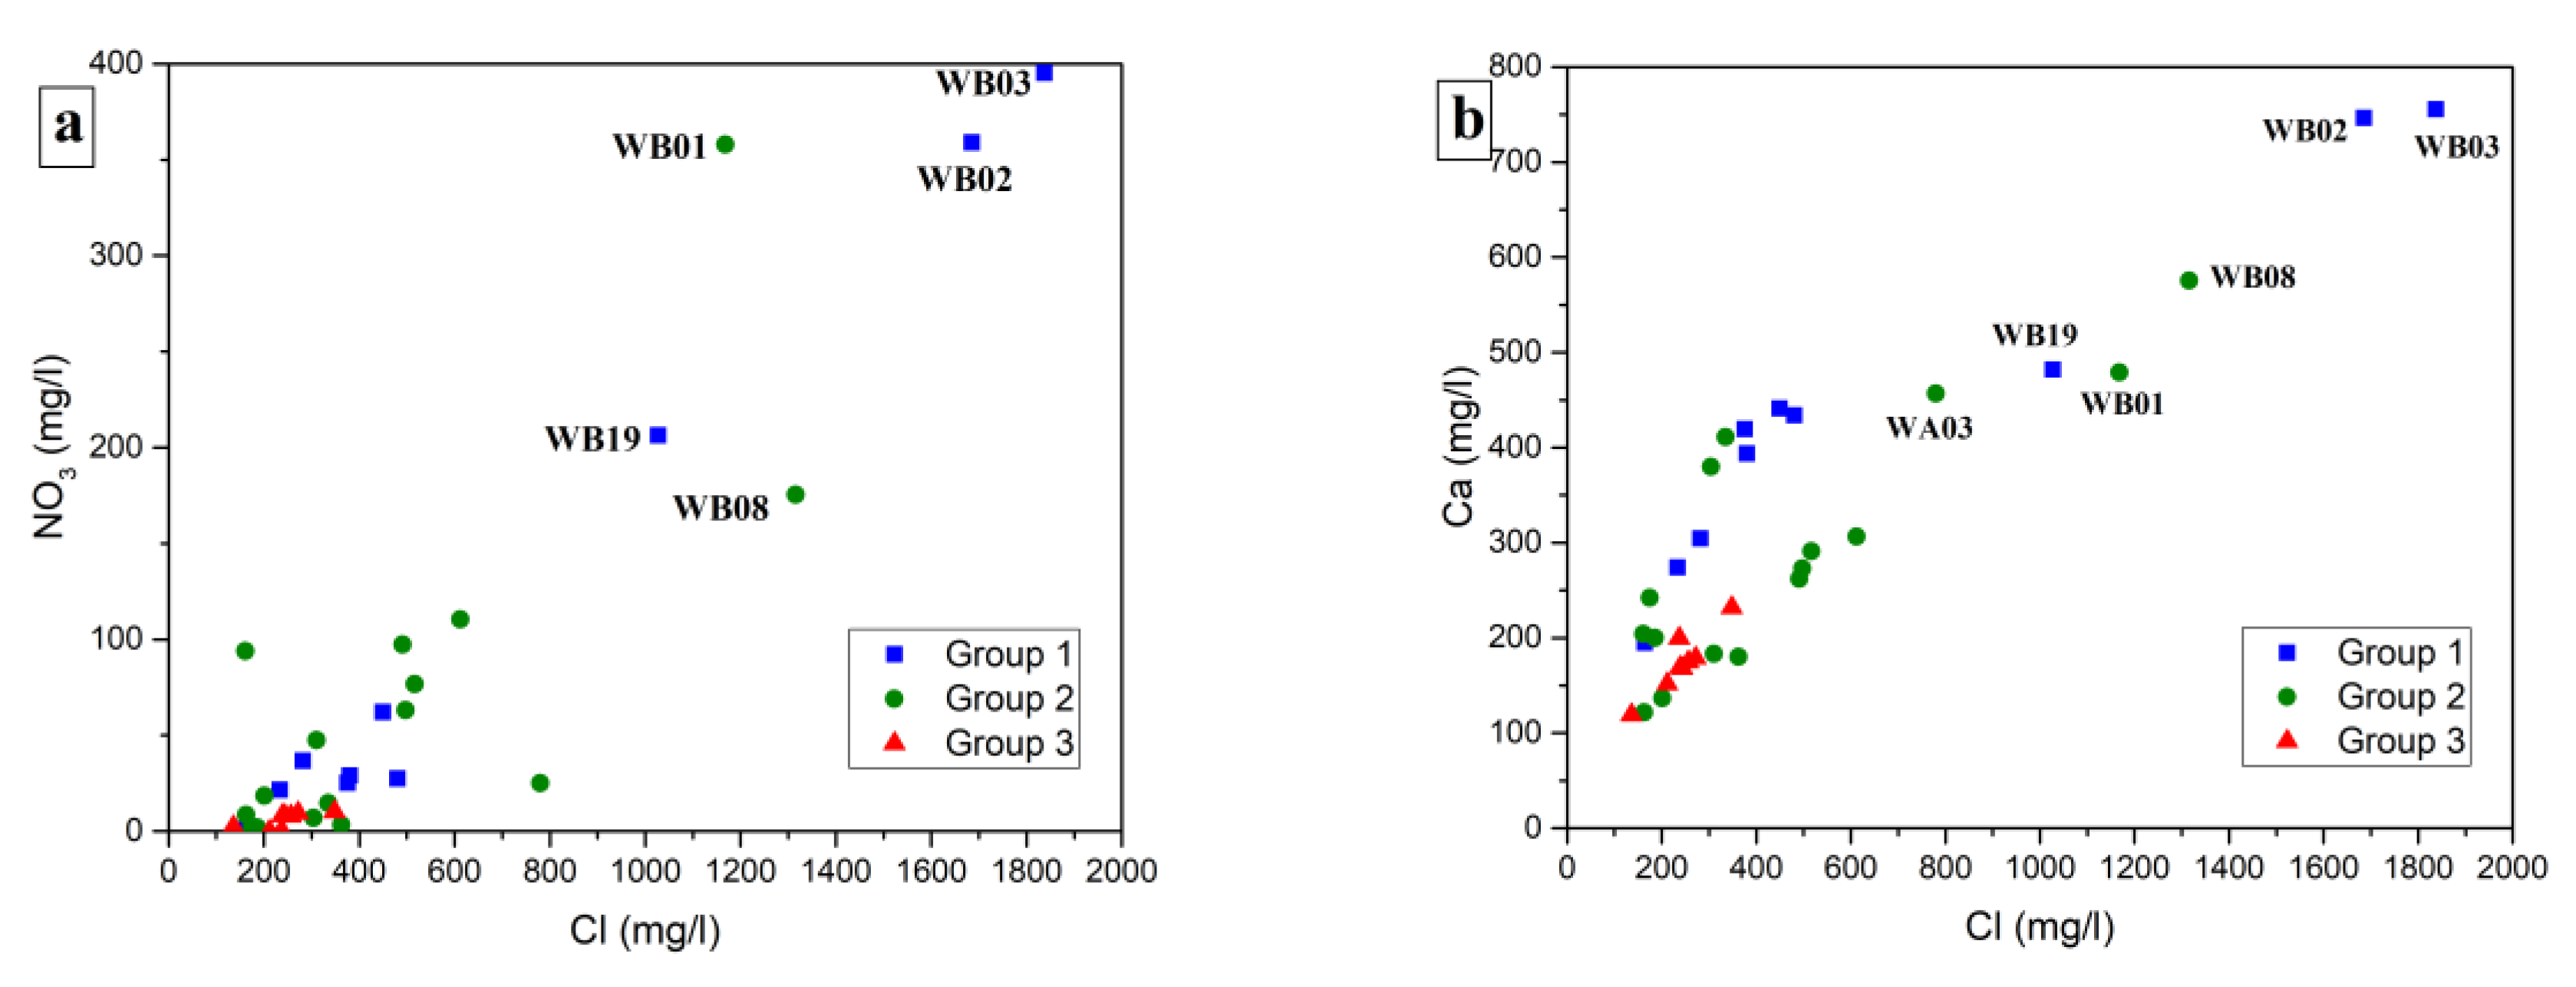
4. Results
5. Discussion
5.1. Tritium for Recent Recharge Assessment
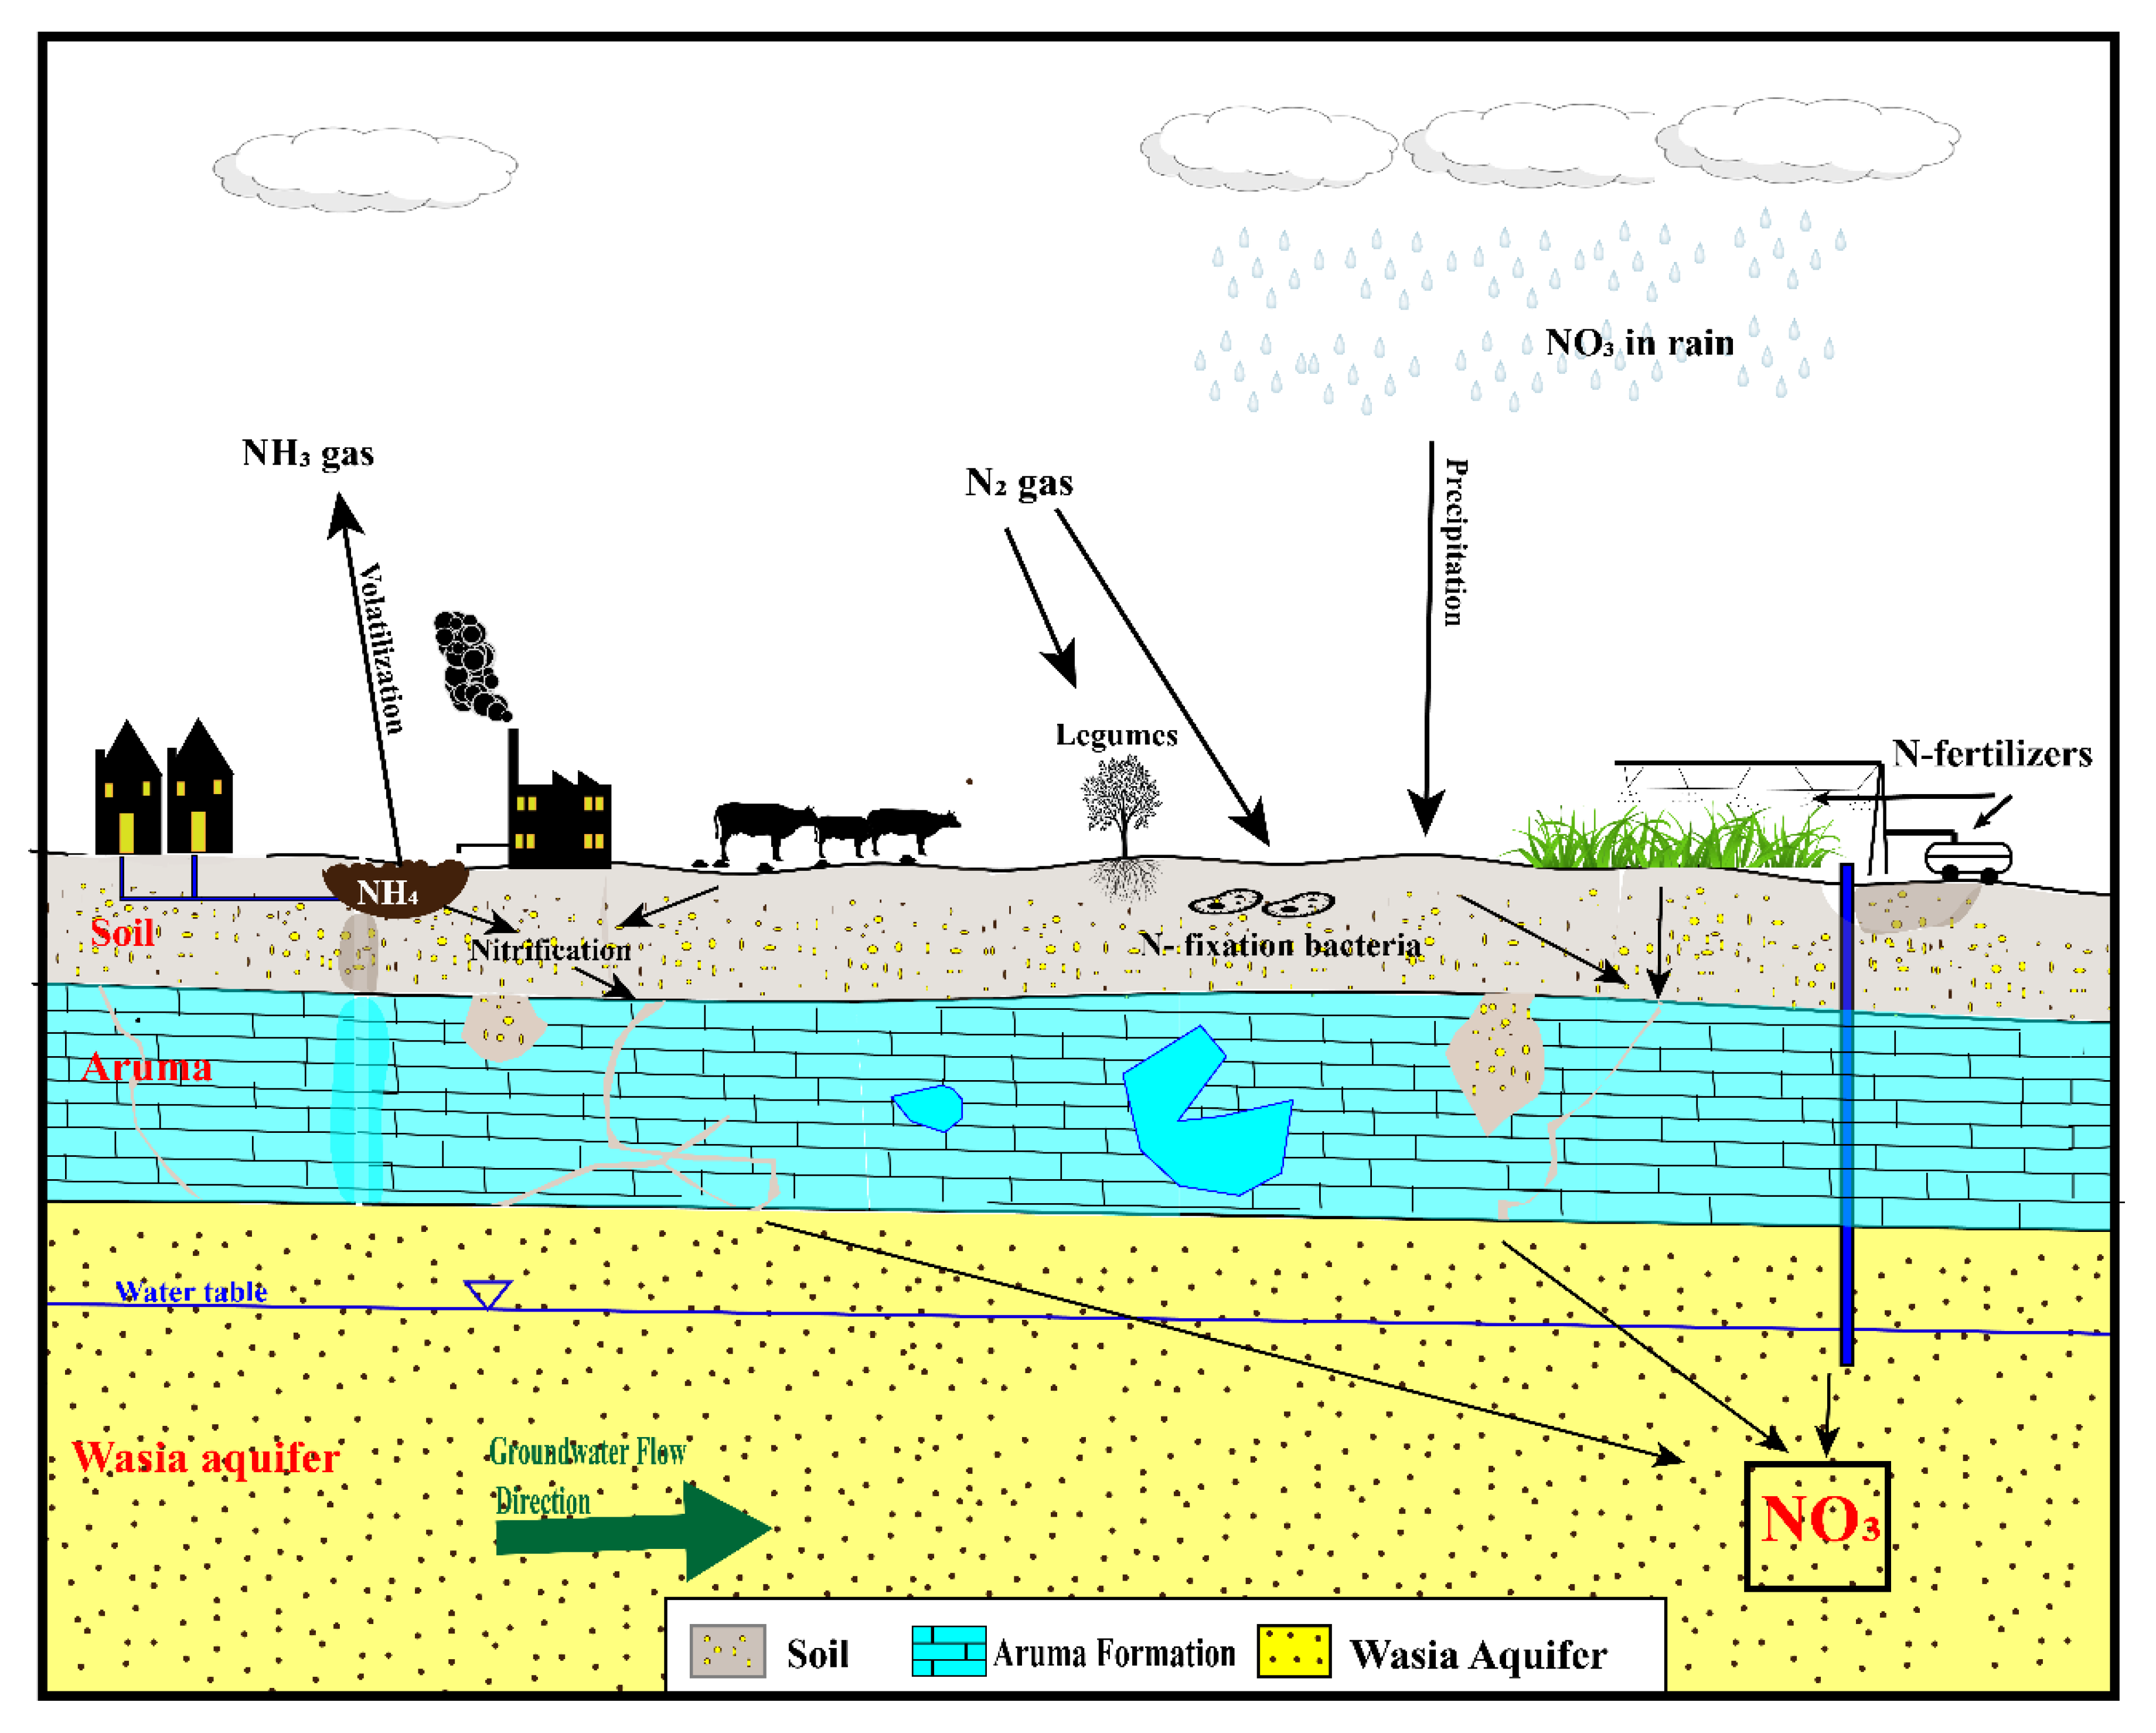
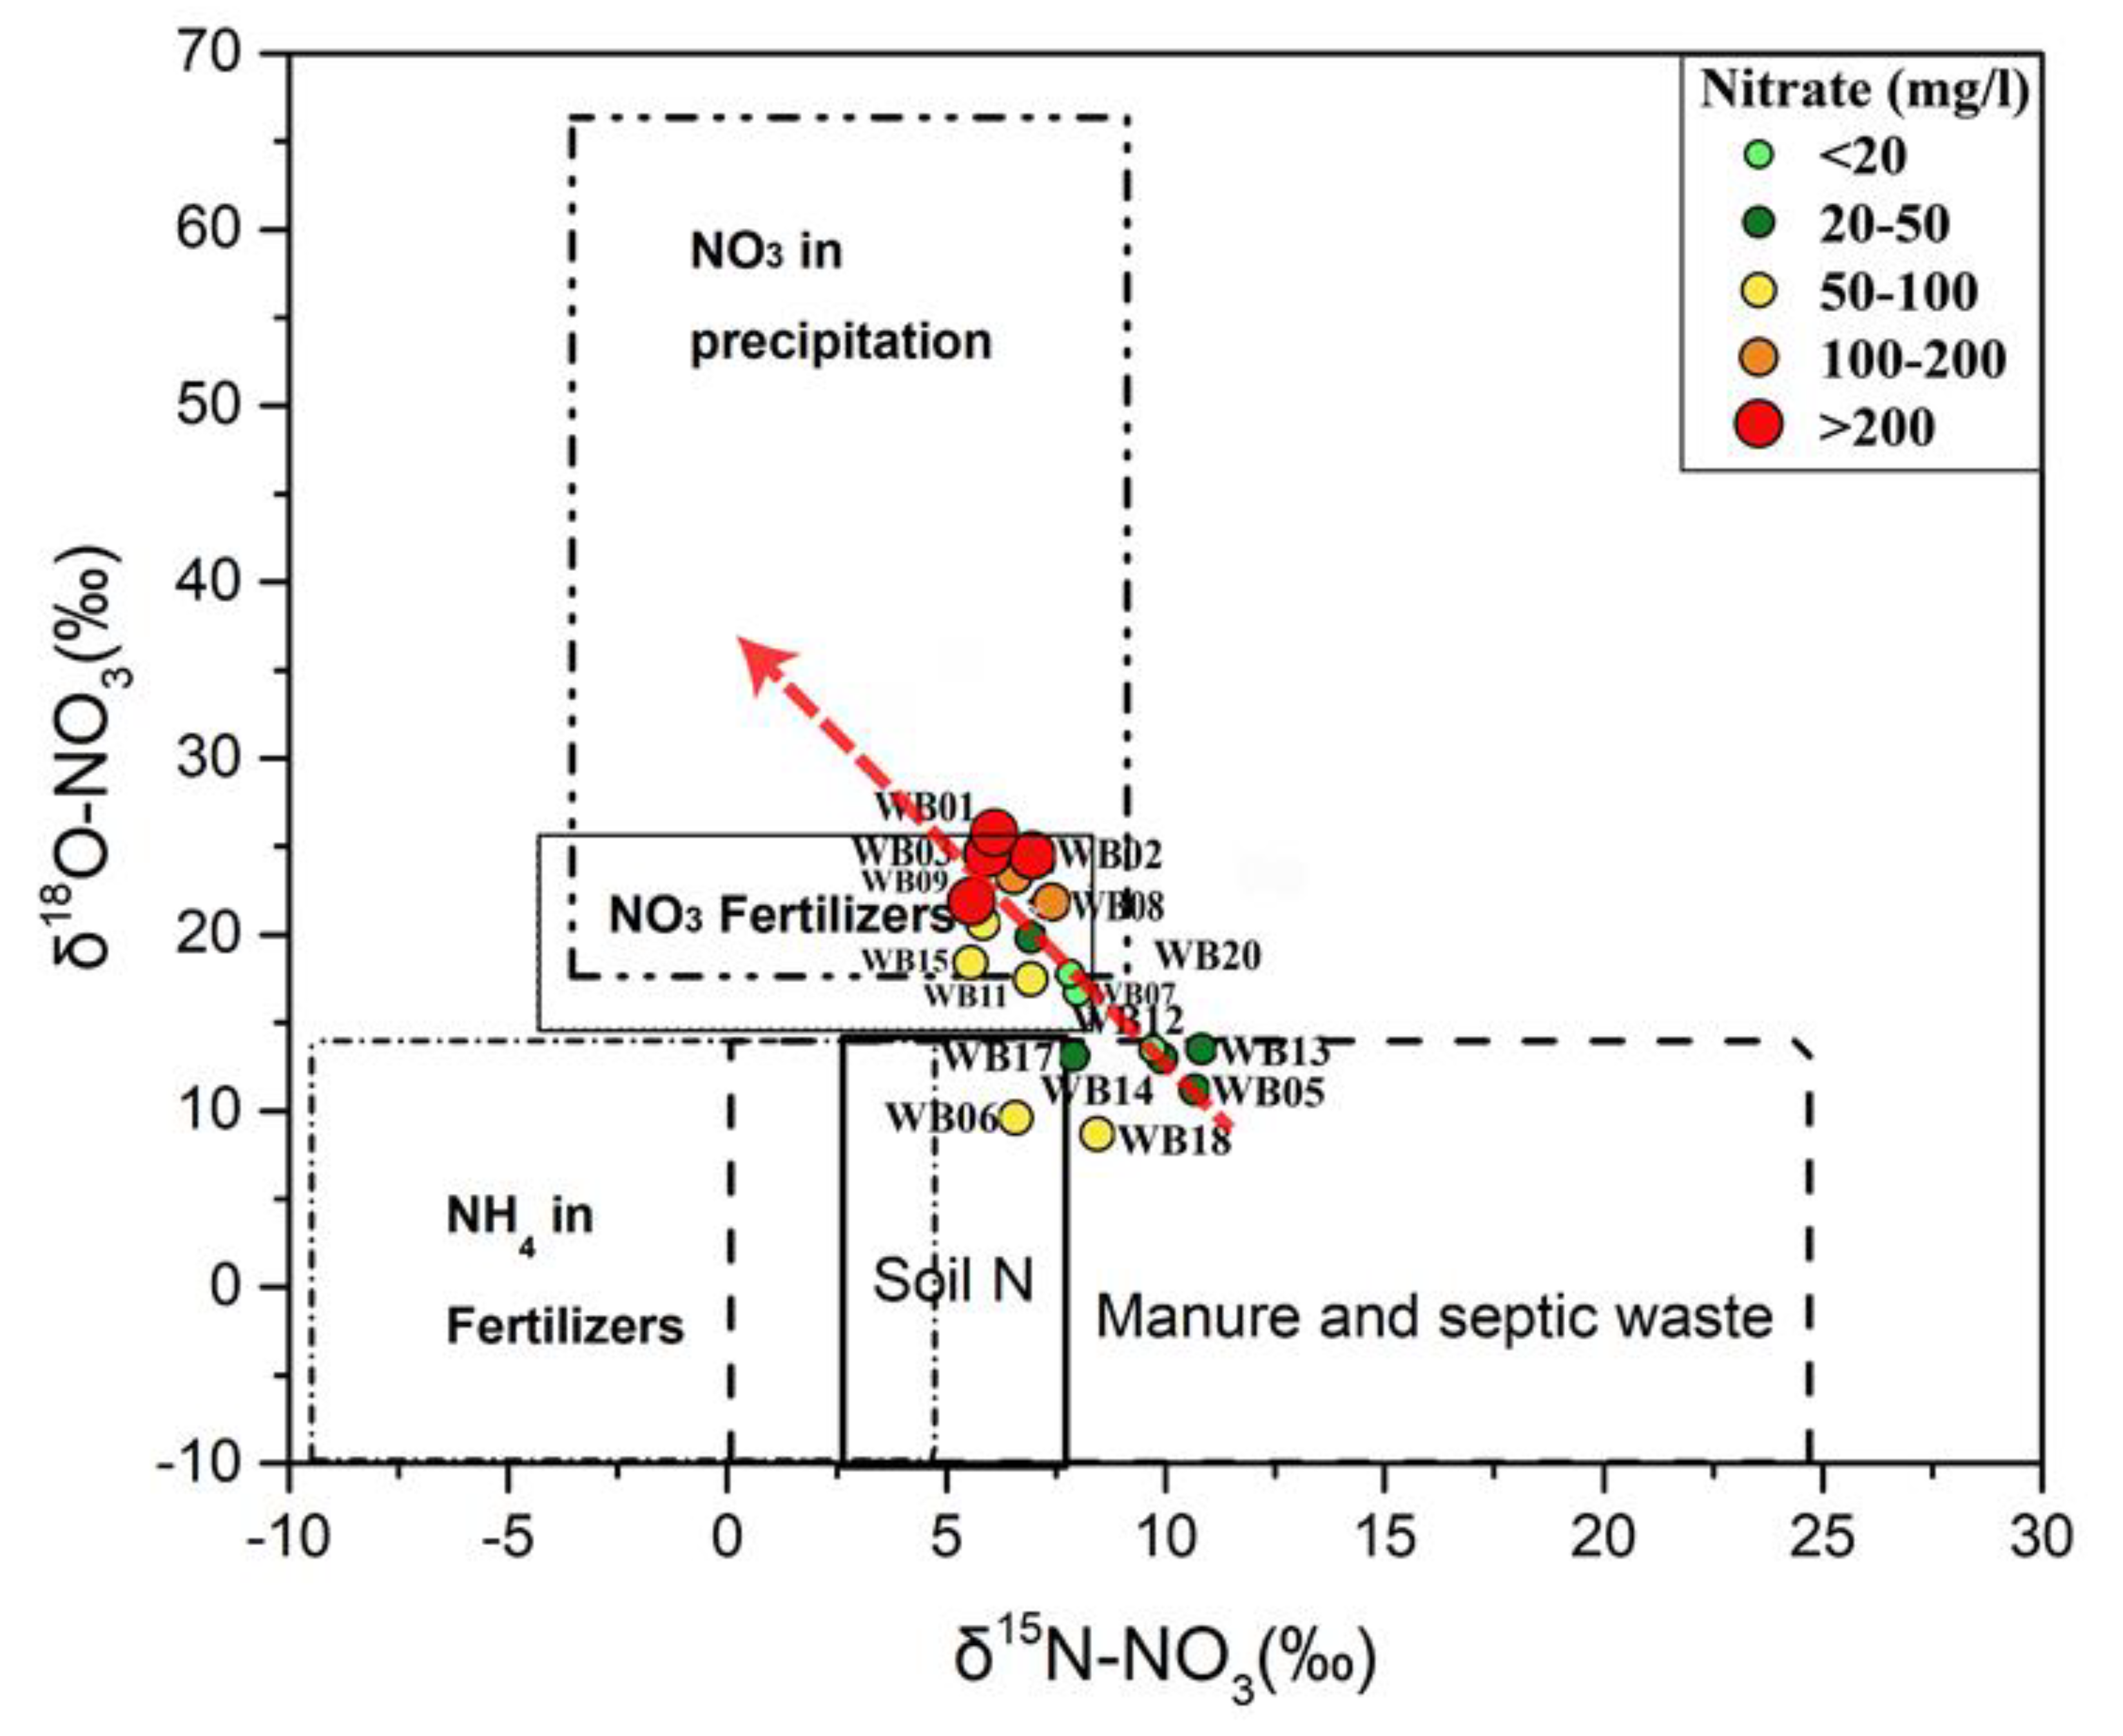
5.2. Possible Sources of Nitrate
5.2.1. Fertilizers
5.2.2. Atmospheric Deposition
5.2.3. Nitrogen from Animal and Human Waste (Manures)
5.2.4. Nitrogen from Rocks
5.2.5. Soil Nitrogen
5.3. Estimating N Fluxes
5.4. Wasia Aquifer: Mixing Model and Nitrate Provenance
6. Conclusions
Author Contributions
Funding
Acknowledgments
Conflicts of Interest
References
- Widory, D.; Kloppmann, W.; Chery, L.; Bonnin, J.; Rochdi, H.; Guinamant, J.L. Nitrate in groundwater: An isotopic multi-tracer approach. J. Contam. Hydrol. 2004, 72, 165–188. [Google Scholar] [CrossRef] [PubMed]
- Postma, D.; Boesen, C.; Kristiansen, H.; Larsen, F. Nitrate reduction in an unconfined sandy aquifer: Water chemistry, reduction processes, and geochemical modeling. Water Resour. Res. 1991, 27, 2027–2045. [Google Scholar] [CrossRef]
- Stadler, S.; Osenbrück, K.; Knöller, K.; Suckow, A.; Sültenfuß, J.; Oster, H.; Himmelsbach, T.; Hötzl, H. Understanding the origin and fate of nitrate in groundwater of semi-arid environments. J. Arid Environ. 2008, 72, 1830–1842. [Google Scholar] [CrossRef]
- Hem, J.D. Study and Interpretation the Chemical of Natural of Characteristics Water, 3rd ed.; USGS: Alexandria, Egypt, 1985; Volume 2254, ISBN 2254. [Google Scholar]
- Stadler, S. Investigation of Natural Processes Leading to Nitrate Enrichment in Aquifers of Semi-Arid Regions; University of Karlsruhe: Karlsruhe, Germany, 2006. [Google Scholar]
- Kendall, C.; Elliott, E.M.; Wankel, S.D. Tracing anthropogenic inputs of nitrogen to ecosystems. In Stable Isotopes in Ecology and Environmental Science, 2nd ed.; Michener, R., Lajtha, K., Eds.; Blackwell Publishing Ltd.: Oxfordshire, UK, 2007; Chapter 12; pp. 375–449. [Google Scholar]
- Addiscott, T.M.; Whitmore, A.P.; Powlson, D.S. Farming, Fertilizers and the Nitrate Problem; CAB International CABI: Wallingford, UK, 1991; ISBN 0851986587. [Google Scholar]
- Wakida, F.T.; Lerner, D.N. Non-agricultural sources of groundwater nitrate: A review and case study. Water Res. 2005, 39, 3–16. [Google Scholar] [CrossRef]
- Canter, L.W. Nitrates in Groundwater; CRC Press Inc.: Boca Raton, FL, USA, 1997. [Google Scholar]
- Holloway, J.M.; Dahlgren, R.A. Nitrogen in rock: Occurrences and biogeochemical implications. Glob. Biogeochem. Cycles 2002, 16, 1118. [Google Scholar] [CrossRef]
- Alfaifi, H.J.; Abdelfatah, M.S.; Abdelrahman, K.; Zaidi, F.K.; Ibrahim, E.; Alarifi, N.S. Groundwater Management Scenarios for the Biyadh-Wasia Aquifer Systems in the Eastern Part of Riyadh Region, Saudi Arabia. J. Geol. Soc. India 2017, 89, 669–674. [Google Scholar] [CrossRef]
- Ministry of Agriculture and Water (MAW). Water Atlas of Saudi Arabia. In Ministry of Agriculture and Water in Cooperation with the Saudi Arabian-United Sates Joint Commission on Economic Cooperation; MAW: Riyadh, Saudi Arabia, 1984. [Google Scholar]
- Al-Omran, A.M.; Aly, A.A.; Al-wabel, M.I. Hydrochemical characterization of groundwater under agricultural land in arid environment: A case study of Al Kharj, Saudi Arabia. Arab. J. Geosci. 2016. [Google Scholar] [CrossRef]
- Zaidi, F.K.; Mogren, S.; Mukhopadhyay, M.; Ibrahim, E. Evaluation of groundwater chemistry and its impact on drinking and irrigation water quality in the eastern part of the Central Arabian graben and trough system, Saudi Arabia. J. Afr. Earth Sci. 2016, 120, 208–219. [Google Scholar] [CrossRef]
- Alharbi, T.G.; Zaidi, F.K. Hydrochemical classification and multivariate statistical analysis of groundwater from Wadi Sahba area in central Saudi Arabia. Arab. J. Geosci. 2018, 11, 643. [Google Scholar] [CrossRef]
- GTZ/DCO. Detailed Water Resources Studies of Wasia-Biyadh and Aruma Aquifers—Groundwater Model and Water Management; Gesellschaft für Technische Zusammenarbeit, Dornier Consulting, Ministry of Water and Electricity: Riyadh, Saudi Arabia, 2013.
- GTZ/DCO. Detailed Water Resources Studies of Wasia-Biyadh and Aruma Aquifers—Phase I Completion Report; Gesellschaft fur Technische Zusammenarbeit, Dornier Consulting, Ministry of Water and Electricity: Riyadh, Saudi Arabia, 2009. [Google Scholar]
- Mayer, B.; Boyer, E.W.; Goodale, C.; Jaworski, N.A.; Van Breemen, N.; Howarth, R.W.; Seitzinger, S.; Billen, G.; Lajtha, K.; Nadelhoffer, K. Sources of nitrate in rivers draining sixteen watersheds in the northeastern US: Isotopic constraints. Biogeochemistry 2002, 57, 171–197. [Google Scholar] [CrossRef]
- Wells, E.R.; Krothe, N.C. Seasonal fluctuation in δ15N of groundwater nitrate in a mantled karst aquifer due to macropore transport of fertilizer-derived nitrate. J. Hydrol. 1989, 112, 191–201. [Google Scholar] [CrossRef]
- Clark, I.D.; Fritz, P. Environmental Isotopes in Hydrogeology; CRC press: Boca Raton, FL, USA, 1997. [Google Scholar]
- Fetter, C.W. Applied Hydrogeology, 4th ed.; Pearson Education, Inc.: Harlow, UK, 2014; ISBN 9781292022901. [Google Scholar]
- Almazroui, M. Calibration of TRMM rainfall climatology over Saudi Arabia during 1998–2009. Atmos. Res. 2011, 99, 400–414. [Google Scholar] [CrossRef]
- Powers, R.W.; Ramirez, L.F.; Redmond, C.D.; Elberg, E.L.J. Geology of the Arabian Peninsula Sedimentary Geology of Saudi Arabia. U.S. Geol. Surv. Prof. Pap. 1966, 560, 154. [Google Scholar]
- Sharief, F.A.; Magara, K.; Abdulla, H.M. Depositional system and reservoir potential of the Middle Cretaceous Wasia Formation in central-eastern Arabia. Mar. Pet. Geol. 1989, 6, 303–315. [Google Scholar] [CrossRef]
- Keller, M.; Bohnsack, D.; Koch, R.; Hinderer, M.; Hornung, J.; Al-Ajmi, H.; Abu Amarah, B.A. Outcrop Analog Studies of the Wasia-Biyadh and Aruma Aquifers in the Kingdom of Saudi Arabia. In Siliciclastic Reservoirs of the Arabian Plate; Al Anzi, H.R., Rahmani, R.A., Steel, R.J., Soliman, O.M., Eds.; AAPG Memoir: Tulsa, OK, USA, 2019; Volume 116, pp. 317–382. [Google Scholar]
- BRGM. Hydrogeological Investigations of the Al Wasia Aquifer in the Eastern Province of Saudi Arabia; Ministry of Agriculture and Water, Water Resources Development Department: Riyadh, Saudi Arabia, 1976; p. 109.
- Bazuhair, A.S.A. Optimum Aquifer Yield of Four Aquifers in AI-Kharj Area, Saudi Arabia. Earth Sci. 1989, 2, 12. [Google Scholar] [CrossRef] [Green Version]
- Edgell, H.S. Aquifers of Saudi Arabia and their geological framework. Arab. J. Sci. Eng. 1997, 22, 3–31. [Google Scholar]
- ARAMCO. A Study of the Wasia Aquifer in Eastern Saudi Arabia; Aramco: Riyadh, Saudi Arabia, 1960; p. 128. [Google Scholar]
- Birkle, P. Geochemical fingerprinting of hydraulic fracturing fluids from Qusaiba Hot Shale and formation water from Paleozoic petroleum systems, Saudi Arabia. Geofluids 2016, 16, 565–584. [Google Scholar] [CrossRef] [Green Version]
- GTZ/DCO. Detailed Water Resources Studies of Wajid and Overlying Aquifers—Environmental Isotopes; Gesellschaft für Technische Zusammenarbeit, Dornier Consulting, Ministry of Water and Electricity: Riyadh, Saudi Arabia, 2009.
- McIlvin, M.R.; Altabet, M.A. Chemical conversion of nitrate and nitrite to nitrous oxide for nitrogen and oxygen isotopic analysis in freshwater and seawater. Anal. Chem. 2005, 77, 5589–5595. [Google Scholar] [CrossRef]
- WHO (World Health Organization). Guidelines for drinking-water quality. WHO Chron. 2011, 4, 104–108. [Google Scholar]
- Michelsen, N.; Reshid, M.; Siebert, C.; Schulz, S.; Knöller, K.; Weise, S.M.; Rausch, R.; Al-Saud, M.; Schüth, C. Isotopic and chemical composition of precipitation in Riyadh, Saudi Arabia. Chem. Geol. 2015, 413, 51–62. [Google Scholar] [CrossRef]
- Kendall, C.; McDonnell, J.J. Isotope Tracers in Catchment Hydrology; Elsevier: Amsterdam, The Netherlands, 1998; p. 839. [Google Scholar]
- Vengosh, A.; Heumann, K.G.; Juraske, S.; Kasher, R. Boron isotope application for tracing sources of contamination in groundwater. Environ. Sci. Technol. 1994, 28, 1968–1974. [Google Scholar] [CrossRef]
- Helvaci, C. Borates. In Encyclopedia of Geology; Selley, R.C., Cocks, L.R.M., Plimer, I.R., Eds.; Elsevier: Amsterdam, The Netherlands, 2005; Volume 3, pp. 510–522. [Google Scholar]
- WHO. Guidelines for Drinking-Water Quality, 4th ed.; Incorporating the First Addendum; WHO: Geneva, Switzerland, 2017; p. 540. ISBN 978-92-4-154995-0. [Google Scholar]
- Alabdula’aly, A.I.; Khan, M.A. Chemistry of rain water in Riyadh, Saudi Arabia. Arch. Environ. Contam. Toxicol. 2000, 39, 66–73. [Google Scholar] [CrossRef] [PubMed]
- Meiklejohn, B.Y.J. Iron and the Nitrifying Bacteria. Microbiology 1953, 8, 58–65. [Google Scholar] [CrossRef] [PubMed] [Green Version]
- Qian, G.; Hu, X.; Li, L.; Ye, L.; Lv, W. Effect of iron ions and electric field on nitrification process in the periodic reversal bioelectrocoagulation system. Bioresour. Technol. 2017, 244, 382–390. [Google Scholar] [CrossRef] [PubMed]
- Le Nindre, Y.M.; Vaslet, D.; Maddah, S.S.; Al-Husseini, M.I. Stratigraphy of the Valanginian? To early Paleocene succession in central Saudi Arabia outcrops: Implications for regional Arabian sequence stratigraphy. GeoArabia 2008, 13, 51–86. [Google Scholar]
- Keeney, D.; Olson, R.A. Sources of Nitrate to Ground Water; Taylor & Francis: Abingdon-on-Thames, UK; London, UK, 1986; Volume 16, ISBN 1064338860. [Google Scholar]
- Alabdula’aly, A.; Al-Rehaili, A.M.; Al-Zarah, A.I.; Khan, M.A. Assessment of nitrate concentration in groundwater in Saudi Arabia. Environ. Monit. Assess. 2010, 161, 1–9. [Google Scholar] [CrossRef] [PubMed]
- Al-Mutaz, I.S. Water resources development in Riyadh, Saudi Arabia. Desalination 1987, 64, 193–202. [Google Scholar] [CrossRef]


| Biyadh | |||
|---|---|---|---|
| Hydraulic Property | Source | Value Range | Average Value |
| Transmissivity, T | [26] | 1.7 × 10⁻³–9.0 × 10⁻² m2/s | 3.3 × 10⁻² m2/s |
| [27] | 1.26 × 10⁻³–7.0 × 10⁻² m2/s | 3.6 × 10⁻² m2/s | |
| [28] | 1.5 × 10⁻²–9.7 × 10⁻² m2/s | n/a | |
| Hydraulic conductivity, K | [26] | 2.5 × 10⁻⁴–4.5 × 10⁻⁴ m/s | 3.0 × 10⁻⁴ m/s |
| [27] | 3.3 × 10⁻⁵–3.0 × 10⁻⁴ m/s | 19 × 10−4 m/s | |
| Storage coefficient, S | [26] | 2.3 × 10⁻⁴–9.0 × 10⁻⁴ | 4.9 × 10⁻⁴ |
| [27] | n/a | 3.2 × 10⁻² | |
| [28] | n/a | 2.0 × 10⁻⁴ | |
| Specific yield, Sy | [26] | - | 5–15% (estimated) |
| Porosity, Φ | [25] | 1.1–36% | 23.3% |
| [26] | 19–40% | 31% | |
| [29] | 7–37% | 30% | |
| Permeability, k | [25] | 0.2–12,678 mD | 1698 mD |
| [26] | 240–11,100 mD | 2500 mD | |
| [29] | 2000–27,000 mD | 4500 mD | |
| Wasia | |||
| Transmissivity, T | [26] | 1.7 × 10⁻³–9.0 × 10⁻² m2/s | 3.3 × 10⁻² m2/s |
| [27] | n/a | 3.2 × 10⁻² m2/s | |
| [28] | 1.5 × 10⁻²–9.7 × 10⁻² m2/s | n/a | |
| Hydraulic conductivity, K | [26] | 2.5 × 10⁻⁴–4.5 × 10⁻⁴ m/s | 3.0 × 10⁻⁴ m/s |
| [27] | 1.5 × 10⁻⁴–4.9 × 10⁻⁴ m/s | 3.2 × 10⁻⁴ m/s | |
| Storage coefficient, S | [26] | 2.3 × 10⁻⁴–9.0 × 10⁻⁴ | 4.9 × 10⁻⁴ |
| [27] | n/a | 2.3 × 10⁻⁷ | |
| [28] | n/a | 2.0 × 10⁻⁴ | |
| Specific yield, Sy | [26] | - | 5–15% (estimated) |
| Porosity, Φ | [25] | 3.3–41.3% | 29.46% |
| [26] | 19–40% | 31% | |
| [29] | 7–37% | 30% | |
| Permeability, k | [25] | 0.7–15,388 mD | 2994 mD |
| [26] | 240–11,100 mD | 2500 mD | |
| [29] | 2000–27,000 mD | 4500 mD | |
| Well | pH | T | EC | TDS | TH | Na+ | K+ | Mg2+ | Ca2+ | HCO3− | F− | Cl− | NO2− | Br− | NO3− | SO42− | PO43− | Li | B | Co | Mn | V | Zn | Fe | As | Ni | Cu | Mo | 3H | δ15N | δ18O | Water Type |
|---|---|---|---|---|---|---|---|---|---|---|---|---|---|---|---|---|---|---|---|---|---|---|---|---|---|---|---|---|---|---|---|---|
| Units | °C | µS/cm | mg/L | mg/L | mg/L | mg/L | mg/L | mg/L | mg/L | mg/L | mg/L | mg/L | mg/L | mg/L | mg/L | mg/L | µg/L | µg/L | µg/L | µg/L | µg/L | µg/L | µg/L | µg/L | µg/L | µg/L | µg/L | ± 0.8 T.U. | AIR ± 0.5‰ | VSMOW ± 1‰ | ||
| WB01 | 7.3 | 31.9 | 6809 | 5860 | 1850 | 433 | 4.19 | 159 | 479 | 188 | 1.8 | 1170 | ND | 5.5 | 358 | 1330 | ND | 0.9 | 1150 | 0.81 | 3.05 | 3.24 | 5.52 | 3040 | 0.23 | 0.51 | 1.65 | 7.39 | <0.8 | 5.9 | 25.8 | Ca–SO4 |
| WB02 | 7.5 | 32.5 | 8007 | 7330 | 2740 | 359 | 4.43 | 212 | 747 | 77.0 | 1.7 | 1690 | ND | 5.9 | 359 | 974 | ND | ND | 449 | 1.10 | 4.24 | 3.87 | 3.32 | 4120 | 0.27 | ND | 1.72 | 4.05 | <0.8 | 7.1 | 24.2 | Ca–SO4–Cl |
| WB03 | 7.6 | 30.5 | 8673 | 7710 | 2890 | 462 | 6.97 | 244 | 756 | 89.0 | 1.8 | 1840 | ND | 6.0 | 395 | 1190 | ND | ND | 783 | 1.00 | 8.83 | 2.60 | ND | 4050 | 0.21 | 0.44 | 2.74 | 3.71 | 0.98 | 5.8 | 24.6 | Ca–SO4–Cl |
| WB04 | 7.6 | 36.9 | 2317 | 1990 | 686 | 123 | 6.36 | 57.3 | 180 | 161 | 1.2 | 362 | ND | 2.6 | 3.26 | 405 | ND | 0.5 | 328 | 0.41 | 88.2 | 0.15 | 1.96 | 1140 | ND | 0.92 | 11.15 | 2.96 | <0.8 | - | - | Ca–SO4 |
| WB05 | 7.6 | 28.4 | 3684 | 3370 | 1540 | 158 | 3.30 | 121 | 419 | 147 | 1.4 | 375 | ND | 2.3 | 25.3 | 1290 | ND | 0.5 | 465 | 0.54 | 4.33 | 2.30 | ND | 1870 | 0.09 | ND | 0.35 | 3.48 | <0.8 | 10.7 | 11.2 | Ca–SO4–Cl |
| WB06 | 7.8 | 27.6 | 4246 | 3930 | 1670 | 207 | 5.69 | 138 | 441 | 118 | 1.6 | 449 | ND | 2.4 | 62.0 | 1440 | ND | 0.5 | 469 | 0.55 | 8.29 | 0.35 | 48.8 | 1990 | ND | ND | 2.75 | 6.78 | <0.8 | 6.6 | 9.5 | Ca–SO4–Cl |
| WB07 | 7.9 | 31.9 | 1811 | 1580 | 734 | 67.0 | 1.98 | 60.1 | 195 | 150 | 1.5 | 164 | ND | ND | 4.97 | 558 | ND | 0.5 | 273 | 2.17 | 2.57 | 1.26 | ND | 702 | ND | 1.43 | 0.82 | 4.06 | <0.8 | 8.0 | 16.7 | Ca–SO4–Cl |
| WB08 | 7.9 | 30.3 | 7585 | 6260 | 2160 | 552 | 10.9 | 177 | 576 | 187 | 1.8 | 1320 | ND | 5.5 | 175 | 1630 | ND | 0.9 | 1430 | 1.34 | 22.2 | 3.04 | ND | 2560 | 0.04 | 1.18 | 1.47 | 5.05 | 0.82 | 7.6 | 21.9 | Ca–SO4 |
| WB09 | 7.7 | 30.9 | 3944 | 3320 | 1200 | 229 | 4.61 | 105 | 307 | 154 | 1.2 | 612 | ND | 2.7 | 111 | 779 | ND | 0.0 | 555 | 0.32 | 0.00 | 1.79 | 0.00 | 1110 | 0.04 | 0.00 | 0.69 | 3.45 | <0.8 | 6.5 | 23.4 | Ca–SO4 |
| WB10 | 7.7 | 31.6 | 2271 | 1960 | 712 | 116 | 1.09 | 61.7 | 183 | 148 | 1.2 | 310 | ND | 2.3 | 47.5 | 414 | ND | 0.5 | 319 | 0.15 | 0.00 | 2.13 | 0.00 | 581 | 0.16 | 0.00 | 0.19 | 2.94 | <0.8 | 7.0 | 19.9 | Ca–SO4 |
| WB11 | 7.7 | 32.4 | 3433 | 2900 | 1010 | 199 | 3.52 | 86.7 | 262 | 145 | 1.2 | 491 | ND | 2.5 | 97.4 | 682 | ND | 0.5 | 531 | 0.28 | 0.54 | 1.45 | 0.00 | 940 | 0.10 | 0.00 | 0.39 | 2.77 | <0.8 | 7.0 | 17.4 | Ca–SO4–Cl |
| WB12 | 7.8 | 34.8 | 1487 | 1240 | 473 | 67.0 | 2.39 | 41.2 | 122 | 148 | 1.2 | 162 | ND | 1.2 | 8.54 | 278 | ND | 0.2 | 195 | 0.24 | 8.44 | 0.72 | 0.00 | 459 | 0.00 | 0.40 | 0.13 | 4.19 | <0.8 | 9.7 | 13.5 | Ca–SO4 |
| WB13 | 7.9 | 27.6 | 4387 | 3930 | 1650 | 224 | 4.79 | 138 | 434 | 119 | 1.6 | 480 | ND | 2.4 | 27.4 | 1450 | ND | 0.0 | 535 | 0.42 | 2.31 | 1.93 | 4.87 | 1640 | 0.09 | 0.71 | 0.41 | 5.06 | <0.8 | 10.8 | 13.5 | Ca–SO4–Cl |
| WB14 | 8.0 | 28.1 | 3711 | 3310 | 1440 | 167 | 3.41 | 112 | 394 | 145 | 1.5 | 380 | ND | 2.3 | 28.9 | 1220 | ND | 0.5 | 383 | 0.46 | 6.20 | 1.35 | 40.7 | 1700 | 0.08 | 0.85 | 1.93 | 5.39 | <0.8 | 9.9 | 13.0 | Ca–SO4–Cl |
| WB15 | 7.7 | 34.2 | 3458 | 2900 | 1070 | 184 | 2.80 | 84.1 | 291 | 140 | 1.2 | 516 | ND | 2.7 | 76.7 | 681 | ND | 0.5 | 363 | 0.29 | 1.04 | 1.69 | 0.00 | 1140 | 0.15 | 0.00 | 0.39 | 3.21 | <0.8 | 5.5 | 18.5 | Ca–SO4 |
| WB16 | 7.8 | 31.9 | 3327 | 2850 | 1030 | 159 | 3.55 | 83.7 | 273 | 143 | 1.2 | 497 | ND | 2.8 | 63.1 | 591 | ND | 0.5 | 278 | 0.23 | ND | 0.67 | ND | 870 | ND | 0.35 | 0.11 | 7.11 | <0.8 | 5.9 | 20.6 | Ca–SO4 |
| WB17 | 7.9 | 29.0 | 2912 | 2540 | 1120 | 122 | 3.11 | 87.9 | 304 | 142 | 1.6 | 282 | ND | 2.2 | 36.8 | 906 | ND | 0.5 | 338 | 0.64 | ND | 0.72 | ND | 989 | ND | ND | 0.37 | 5.08 | <0.8 | 7.9 | 13.2 | Ca–SO4–Cl |
| WB18 | 7.7 | 29.7 | 2595 | 2250 | 999 | 103 | 1.84 | 76.6 | 274 | 142 | 1.6 | 233 | ND | 2.2 | 21.5 | 831 | ND | ND | 293 | 0.26 | 17.7 | 0.23 | ND | 960 | ND | ND | 1.43 | 4.32 | <0.8 | 8.5 | 8.7 | Ca–SO4–Cl |
| WB19 | 7.9 | 30.1 | 5588 | 4940 | 1810 | 289 | 3.37 | 148 | 482 | 109 | 1.8 | 1030 | ND | 5.0 | 206 | 923 | ND | ND | 516 | 0.43 | 1.36 | 3.64 | ND | 1630 | 0.22 | ND | 0.58 | 3.87 | <0.8 | 5.7 | 21.7 | Ca–SO4–Cl |
| WB20 | 7.9 | 30.7 | 1680 | 1450 | 535 | 76.0 | 1.38 | 47.2 | 137 | 118 | 1.3 | 201 | ND | ND | 18.4 | 328 | ND | 0.4 | 246 | 0.09 | 2.83 | 3.20 | ND | 419 | 0.30 | ND | 0.50 | 5.01 | <0.8 | 7.9 | 17.8 | Ca–SO4 |
| WA01 | 7.5 | 35.0 | 1536 | 1100 | 449 | 115 | 5.47 | 36.7 | 119 | 165 | 1.0 | 136 | ND | 0.96 | 2.41 | 237 | ND | 66.3 | 334 | 0.42 | 1.27 | 2.25 | ND | 68.2 | 0.13 | 0.09 | 0.42 | 7.62 | - | - | - | Ca–Na–SO4–Cl |
| WA02 | 7.2 | 36.0 | 2504 | 1990 | 694 | 215 | 5.53 | 59.9 | 179 | 169 | 0.85 | 272 | ND | 1.14 | 9.54 | 417 | ND | 68.5 | 467 | 0.60 | 2.48 | 2.30 | 1.7 | 72.8 | 0.17 | 0.38 | 0.89 | 4.38 | - | - | - | Ca–Na–SO4–Cl |
| WA03 | 6.8 | 32.5 | 5255 | 4920 | 1690 | 395 | 7.40 | 134 | 457 | 168 | 1.4 | 780 | ND | 2.94 | 25.2 | 754 | ND | 71.4 | 399 | 1.50 | 20.9 | 3.03 | ND | 110 | 0.21 | 0.32 | 1.98 | 3.37 | - | - | - | Ca–SO4 |
| WA04 | 7.2 | 29.5 | 3746 | 3180 | 1400 | 288 | 5.30 | 111 | 380 | 169 | 1.6 | 304 | ND | 1.85 | 6.86 | 1200 | ND | 53.8 | 407 | 1.68 | 7.90 | 0.84 | 36.3 | 83.7 | 0.04 | 1.01 | 1.83 | 5.90 | - | - | - | Ca–SO4 |
| WA05 | 7.3 | 32.0 | 2237 | 1720 | 642 | 187 | 4.35 | 53.4 | 169 | 193 | 0.87 | 239 | ND | 1.14 | 8.25 | 349 | ND | 51.3 | 325 | 0.44 | 0.05 | 2.73 | 2.66 | 33.7 | 0.20 | 0.26 | 0.63 | 3.97 | - | - | - | Ca–Na–SO4–Cl |
| WA06 | 7.4 | 31.5 | 2170 | 1820 | 747 | 147 | 11.3 | 57.6 | 204 | 153 | 1.13 | 161 | 0.2 | 1.03 | 94.0 | 562 | 8.7 | 34.6 | 375 | 1.88 | 1.21 | 1.82 | 0.91 | 38.8 | 0.06 | 0.66 | 0.94 | 6.49 | - | - | - | Ca–SO4 |
| WA07 | 6.9 | 32.3 | 2440 | 2070 | 904 | 169 | 5.59 | 72.7 | 242 | 160 | 1.07 | 175 | 0.1 | 1.01 | 1.90 | 725 | 7.3 | 40.9 | 380 | 0.88 | 1.27 | 0.52 | ND | 41.4 | 0.01 | 0.31 | 1.09 | 5.37 | - | - | - | Ca–SO4 |
| WA08 | 6.9 | 31.4 | 1310 | 1860 | 754 | 207 | 6.96 | 62.1 | 200 | 68 | 1.25 | 186 | 0.2 | 1.05 | 1.94 | 625 | ND | 14.8 | 161 | 2.74 | 1.71 | 0.37 | 2.82 | 87.3 | 0.02 | 1.72 | 0.10 | 1.13 | - | - | - | Ca–SO4 |
| WA09 | 7.2 | 32.8 | 2970 | 2420 | 869 | 254 | 6.71 | 70.6 | 232 | 167 | 0.87 | 348 | 0.1 | 1.45 | 10.3 | 500 | ND | 81.6 | 418 | 0.73 | 0.22 | 2.90 | 0.00 | 39.6 | 0.22 | 0.31 | 1.04 | 5.58 | - | - | - | Ca–Na–SO4–Cl |
| WA10 | 7.3 | 35.5 | 1970 | 1500 | 566 | 152 | 6.70 | 45.4 | 152 | 153 | 0.89 | 212 | 0.1 | 1.31 | <1 | 304 | ND | 78.2 | 299 | 1.02 | 32.3 | 0.19 | 1.45 | 38.9 | 0.37 | 0.23 | 0.64 | 18.9 | - | - | - | Ca–Na–SO4–Cl |
| WA11 | 7.7 | 35.8 | 2360 | 1780 | 746 | 185 | 11.5 | 59.9 | 200 | 179 | 0.74 | 237 | 0.2 | 1.32 | <1 | 463 | ND | 44.3 | 134 | 0.19 | 20.2 | 0.08 | ND | 18.3 | 0.01 | 0.10 | 0.26 | 0.86 | - | - | - | Ca–Na–SO4–Cl |
| WA12 | 7.5 | 36.7 | 2310 | 1810 | 680 | 207 | 6.60 | 59.2 | 175 | 164 | 0.92 | 256 | ND | 1.19 | 7.97 | 419 | ND | 68.4 | 429 | 0.53 | 1.18 | 3.19 | ND | 20.5 | 0.24 | 0.23 | 0.94 | 4.67 | - | - | - | Ca–Na–SO4–Cl |
| WA14 | 7.4 | 28.5 | 4040 | 3580 | 1510 | 329 | 7.22 | 118 | 411 | 137 | 1.91 | 335 | ND | 2.25 | 14.7 | 1260 | ND | 86.8 | 693 | 3.60 | 5.09 | 1.41 | ND | 114 | 0.05 | 1.54 | 2.59 | 10.4 | - | - | - | Ca–SO4 |
| WA15 | 7.7 | 31.4 | 2240 | 1720 | 639 | 201 | 5.42 | 53.0 | 168 | 164 | 0.97 | 244 | 0.1 | 1.12 | 8.16 | 377 | ND | 63.2 | 403 | 0.52 | 0.36 | 4.02 | ND | 52.9 | 0.35 | 0.36 | 0.98 | 5.13 | - | - | - | Ca–Na–SO4–Cl |
© 2020 by the authors. Licensee MDPI, Basel, Switzerland. This article is an open access article distributed under the terms and conditions of the Creative Commons Attribution (CC BY) license (http://creativecommons.org/licenses/by/4.0/).
Share and Cite
Khogali, A.; Birkle, P.; Al-Shaibani, A.; Keller, M.; Tawabini, B.; Makkawi, M. Geochemical Assessment of Potential Sources for Nitrate in the Wasia Aquifer, Al Kharj Area, Central Saudi Arabia. Water 2020, 12, 1479. https://doi.org/10.3390/w12051479
Khogali A, Birkle P, Al-Shaibani A, Keller M, Tawabini B, Makkawi M. Geochemical Assessment of Potential Sources for Nitrate in the Wasia Aquifer, Al Kharj Area, Central Saudi Arabia. Water. 2020; 12(5):1479. https://doi.org/10.3390/w12051479
Chicago/Turabian StyleKhogali, Abid, Peter Birkle, Abdulaziz Al-Shaibani, Martin Keller, Bassam Tawabini, and Mohammad Makkawi. 2020. "Geochemical Assessment of Potential Sources for Nitrate in the Wasia Aquifer, Al Kharj Area, Central Saudi Arabia" Water 12, no. 5: 1479. https://doi.org/10.3390/w12051479