Individual Water-Saving Response Based on Complex Adaptive System Theory: Case Study of Beijing City, China


State Key Laboratory of Simulation and Regulation of Water Cycle in River Basin, China Institute of Water Resources and Hydropower Research, Beijing 100038, China
*
Authors to whom correspondence should be addressed.
Water 2020, 12(5), 1478; https://doi.org/10.3390/w12051478
Submission received: 27 February 2020
/
Revised: 14 May 2020
/
Accepted: 20 May 2020
/
Published: 22 May 2020
(This article belongs to the Section Water Resources Management, Policy and Governance)
Abstract
:It is of significance to examine the factors impacting individual water-saving behavior and their mechanism of action for water demand management, especially for domestic water demand management. To provide a solution to the issues of individual water-saving behavior research with unclear influence mechanisms and subjective modeling decisions, this study provides a novel idea of combining social survey and model study for research on domestic water conservation, introduces complex adaptive system theory to describe the mechanism of action between individuals as well as between individuals and external stimuli, and proposes a general framework for the model establishment and analysis of individual water-saving response research under external stimuli. This study uses Beijing as an empirical city. Based on the analysis results of the survey on Beijing residents’ domestic water use combined with the problems in Beijing’s domestic water-saving efforts, this study constructs water-saving regulation scenarios and corresponding individual water-saving response rules; systematically simulates the change process of individual water use considering the aspects of water price formulation, water use information, and water-saving publicity and education; quantitatively analyzes the influence of these three types of external stimuli on individual water saving; proposes individual water-saving promotion measures; and suggests the three aspects of water price formulation, water use information feedback, water-saving publicity and education.
1. Introduction
With the rapid economic development and continuous population growth, an increasing number of countries are attempting to resolve the challenge of the deepening contradiction between the supply of and demand for water resources. Accordingly, several countries are developing strategies to restrain water demand [1]. In the past, water demand management mainly focused on agricultural and industrial water demand. In recent years, due to a growing population and an ever-increasing standard of living, the proportion of domestic water consumption in several countries has been increasing, which has even become the primary growing part of water consumption. Therefore, the domestic water demand management has been paid increasing attention. The individual is the basic unit of domestic water use, and the final effect of domestic water saving is closely related to individual water use behavior. Therefore, examining individual water use behavior is the micro basis of water demand management. Understanding individual water-saving behavior and its promotion measures is essential to regulate the amount of domestic water use and alleviate the contradiction between the supply of and demand for water resources.
Scholars in water resource management, sociology, economics, and other domains have actively explored individual water-saving behaviors to examine the main determinants of individuals’ water-saving behaviors and ways to promote individuals’ water-saving behaviors. Early studies have focused on the impact of individual attributes, such as gender, age, education level, and income, on water-saving behavior [2,3,4,5]; however, these studies had certain limitations; for example, a few of these studies revealed that women were more likely to adopt water-saving behavior than men only through statistical data analysis but failed to explain as to why/how gender caused this difference and determine the exact difference that this attribute caused.
With the development of a subjective and an abstract index survey method, an increasing number of scholars have begun to examine the influence of water-saving attitudes, environmental awareness, values, and other factors on individual water-saving behavior. Furthermore, the structural equation model and the sociological theory method (e.g., planning behavior theory) have been used to examine the mechanism of the factors influencing individual water-saving behavior through sociological survey experiments [6,7,8,9,10,11,12,13,14,15,16].
In addition to the aforementioned factors that have been considered from an individual perspective, numerous scholars have explored the impact of water price [1,17,18], water-saving policies [1,19], water-saving publicity and education [20,21], water use information [14,22], water-saving technology [1], and other external factors on individual water-saving behaviors. Furthermore, the effect of external control measures on individual water-saving behavior has been analyzed to conduct qualitative discussions on policy and management. These studies have directly or indirectly associated the factors influencing individual water-saving behavior with domestic water consumption; however, they have not explored the mechanism of factors influencing the change in an individual’s water-saving behavior or the initiative of the individual in the process of changing water-saving behavior. Furthermore, they have not focused on the complexity of feedback and interaction between individual and external factors, which is not conducive to understanding the mechanism and process of individual water-saving behavior changes affected by external factors, and how to adequately guide individuals to alter their water use behaviors.
Complex adaptive system theory (CAS) provides an effective way to examine the behavioral rules and their changing process in complex systems [23]. The agent-based model (ABM) of CAS, which considers the behavior of microscopic agents as the endogenous factor of the system, generalizes system elements as active, adaptive, and independent agents and simulates the behavior change process of agents with the interactions among agents and environment to present the evolution process of the system [24]. ABM has become a critical supplement to the theories and methods of water resource management and has been effectively applied in domestic water management.
Galán et al. [25] developed an ABM comprising three social submodels for domestic water management in Valladolid, Spain, illustrating that the combination of ABM and simulation forms a useful research method to manage the complexity caused by multiple factors that affect the domestic water management in metropolitan areas. Yuan et al. [26] proposed an ABM to predict urban household water demand in Beijing, China by simulating the decision-making process of water consumption under the joint influence of the government’s policy behavior and neighbors’ water consumption behavior, demonstrating that water price and disposable income are essential to control household water demand. Ma et al. [27] proposed an ABM of household water consumption simulation to test the policy effectiveness of controlling household water consumption by simulating the water price negotiation process between households and the government, which can provide guidance for sustainable water resource management. Darbandsari et al. [28] introduced a new framework based on ABM to simulate the behavioral characteristics of domestic water users and their social interactions to evaluate the responses of domestic water users to factors affecting their water use behavior, which provided an effective tool for testing water resource management strategies. Koutiva and Makropoulos [29] developed the urban water agents’ behavior model based on ABM to simulate the domestic water user’s behavior in response to water demand management measures in Athens, Greece, which can effectively calculate the evolution of domestic water demand, examine behaviors and interactions in urban water systems, and assess the influence of various water demand management schemes. The aforementioned research demonstrates the universality and usefulness of the theory and method applied in the research on water demand management policy. However, in the most recent research, the rule making of water use behavior change in the model has had strong subjectivity; that is, the parameters are mostly set artificially, and no certain basis is provided.
In order to resolve the problem of unclear influence mechanisms in individual water-saving behavior research as well as subjectivity and lack of basis in formulating rules and determining parameters in ABM research, and to strengthen the relation between the model research and actual regional situation, this study uses the method of combining a questionnaire survey with model construction to explore the influence mechanism of individual water-saving behavior change and to refine the model establishment and analysis process. On the basis of the results of a survey on Beijing residents’ domestic water use and CAS, this paper constructs an individual water-saving response model under external stimuli. By setting stimulus schemes, the change process of individuals’ water use behavior under each scheme is systematically simulated. Moreover, the impact of external stimuli on individual water-saving behavior is quantitatively analyzed to propose measures and suggestions to promote individual water-saving behavior.
2. Survey on Residents’ Domestic Water Use
2.1. Survey Area
Beijing, the capital of China, a megalopolis with a population of over 20 million, has been plagued by water scarcity over the past decades [30]. The causes of the urban water crisis can be explained via the perspectives of water supply and water demand. From 1956 to 2000, its average annual precipitation was 585 mm, average annual internal renewable water resources were 3.739 billion m3, and the internal renewable water resources per capita were less than 200 m3 since 2010 [31]. Furthermore, since 1999, Beijing has suffered several droughts continuously, the amount of surface water resources has declined sharply, and the groundwater level has declined substantially, which has greatly threatened the security of the water supply in Beijing. However, the urban population explosion and rapid economic development have led to a significant increase in the rigid demand for water resources. Consequently, Beijing has had to take unconventional measures such as interregional water transfer, over-exploitation of groundwater, and the use of reclaimed water to support urban water demand over the past two decades. It can be seen that the water scarcity has become a prominent bottleneck restricting the sustainable development of Beijing.
Simultaneously, Beijing’s water use structure has changed tremendously. Due to urbanization, industrial structure upgrading, and other reasons, agricultural and industrial water consumption has continued to decrease over the past few decades, while domestic water consumption has continued to increase (Figure 1). Since 2005, the domestic water consumption has surpassed agricultural water consumption, constituting the largest usage of water in Beijing, indicating that domestic water use may become the leading crisis factor for Beijing’s future water supply. Over the years, the increase in domestic water consumption was partly due to the increase in population, which jumped from 14.56 million in 2003 to 21.73 million (the peak) in 2016; on the other hand, due to the economic improvements, the lifestyles of Beijing’s residents tend to be more water intensive, with domestic water consumption per capita increasing from 193 L/day in 2013 to 231 L/day in 2017, approximately a 20% increase in five years [32]. In recent years, Beijing’s population has been effectively controlled, while the domestic water consumption per capita has continued to increase. Therefore, water-saving efforts at the individual level will become the key to the Beijing’s domestic water demand management.
2.2. Survey Research
To understand the situation of individuals’ water use and water-saving behaviors in Beijing, we used a questionnaire to procure original data to further explore the influencing factors and mechanisms of individual water-saving behaviors and measures to promote individual water-saving behavior. The content of the questionnaire mainly includes the basic personal information of the respondents, the situation of individual water use and water saving, and their potential influencing factors. The questionnaire was administered to 523 individuals who were randomly interviewed in public places with a large flow of people.
2.2.1. Findings
We summarized the noteworthy survey results as follows:
- The survey results demonstrated that the influence of water price on an individual’s water use behavior is not significant as a whole. Of the respondents, 74% stated that water price has little or no influence on their water-saving behavior, and 26% stated that the increase in water price significantly influences their water-saving behavior. Notably, based on this finding, an inappropriate conclusion would be that regulating water price has little effect on promoting an individual’s water-saving behavior. This is because many respondents who believed that the increase in water price has little effect on the individual’s water-saving behavior stated that the household water charges and the proportion of the total household expenditure or income are small and that the increase in the water price in Beijing in recent years is insufficient to stimulate their water-saving behavior. In addition, a system of three-tiered pricing for household water consumption has been implemented in Beijing (See the website for details: http://swj.beijing.gov.cn/bmxx/sjxx/201912/t20191219_1311050.html). At present, more than 90% of Beijing residents’ household water consumption does not exceed the first tier of water consumption, which means that less than 10% of residents’ water use behavior is affected by the second- and third-tier water price; the per capita water expenditure constitutes less than 0.3% of their income, and this proportion is too low to affect the residents’ water use behavior [34]. These findings demonstrate that the current water pricing system in Beijing cannot take full advantage of the economic leverage of the tiered water price in promoting the individual’s water-saving behavior.
- Many respondents were unclear about the water price and household water charges: 20.7% knew the current domestic water price for residents in Beijing, 53.9% knew the household water charges, 73.5% of the respondents responsible for the payment of household water bills did not know the domestic water price for residents in Beijing, and 31.1% did not know the household water charges. Failure to know water prices occurs because most of the current household water charge is directly deducted from wages or automatically deducted every month after a one-time recharge of a water card or mobile phone app. These payment methods do not automatically provide the payer with water price and water fee information and the payer generally does not actively query the water use information, which indicates the absence of a satisfactory feedback mechanism of water use information in water management. Furthermore, the survey results showed that 81.2% of the individuals who knew about household water charges thought that increasing water prices would affect individual water-saving, while 68.9% of the individuals who did not know about household water charges thought that increasing water prices would affect individual water-saving. Thus, increases in water price have a greater impact on the water use behavior of individuals who know about household water charges, suggesting that improving individuals’ knowledge of water use information can enhance the promoting effect of water price on individuals’ water-saving behavior [34].
- The provision of water-saving publicity and education to the public is poor; thus, respondents’ understanding of the current situation of water resources and water-saving policies in China and their understanding and mastering of water-saving methods and skills have been poor. Up to 63.5% of the respondents reported that they received little water-saving publicity and education, 19.9% reported that they received them once per year, and less than 17% reported that they received them several times per year. However, 41.1% of respondents believed that water-saving publicity and education would considerably impact individuals’ water-saving behavior, and 56.3% believed that improving an individual’s mastery of water-saving methods and skills through water-saving publicity and education would considerably impact individuals’ water-saving behavior. Notably, young adults and men of all ages reported that their insufficient understanding and mastering of water-saving methods and skills limited their water-saving behavior.
Based on the results of the questionnaire, we observed that unreasonable water pricing, untimely feedback of water use information, and insufficient water-saving publicity and education are three major limitations to achieving the target levels of domestic water conservation in Beijing. Therefore, research on the influence of water price, water use information, and water-saving publicity and education on individuals’ water-saving behavior would advance the management of domestic water demand and the promotion of domestic water conservation in Beijing.
2.2.2. Statistical Analysis
Change in individuals’ water use behavior is often a complex process affected by multiple factors. This section analyzes the interaction of various factors that influence individuals’ water-saving behavior. Social psychologist Lewin [35] indicated that human behavior is the product of the interaction of internal factors (e.g., internal conditions and characteristics of the individual) and external factors, and individual behavior is affected and restricted by these two types of factors. Accordingly, when external conditions change, individuals with different internal conditions or characteristics have different degrees of responses to the change.
Therefore, we divide the influencing factors of individuals’ water-saving behavior into two categories: individual attributes and external stimulus. According to each respondent’s responses to the questionnaire, we assigned values to the degree that their water-saving behavior was influenced by external stimulus (values between 1 and 5, 1 representing no influence and 5 representing significant influence), used the chi-square test to screen out attribute categories that have significant differences in the impact of an external stimulus on individuals’ water-saving behaviors, and finally applied cross-statistical analysis to assess the degree of influence of individuals with different attributes in these attribute categories on their water-saving behavior when receiving external stimuli, with the values between 1 and 5.
The individual attributes included gender, age, education level, income, and water-charge payment frequency as surveyed in the questionnaire. External stimuli included water price stimulus, water use information stimulus, and water-saving publicity and education stimulus. According to the content of water-saving publicity and education, water-saving publicity and education stimulus are divided into two categories: teach knowledge (e.g., the current situation of water resources and water policy) and teach water-saving methods and skills. The analysis results are presented in Figure 2, Figure 3, Figure 4 and Figure 5.
The results demonstrated that the degree of influence of water price stimulus on individuals’ water-saving behavior was generally significantly different due to an individual’s age, income, and water-charge payment frequency. Furthermore, the water-saving behaviors of individuals aged 18–44 years, middle-income individuals, and individuals who often paid their water charges were the most affected by water price factors. The effect of a water use information stimulus on individuals’ water-saving behavior was inversely proportional to the age of the individual and the payment frequency of water charges. Moreover, the effect of water use information stimulus on low-income and high-income individuals was greater than that on middle-income individuals. Water-saving publicity and education stimulus of teaching knowledge considerably impacted the water-saving behavior of young adults aged below 30 years, individuals with a lower education level, and women, while water-saving publicity and education stimulus of teaching skills considerably impacted the water-saving behavior of individuals aged 18–30 years and those with a lower education level. In summary, based on individuals’ attributes and external stimuli, their water-saving behavior was affected by different degrees.
3. Modeling the System
3.1. Framework
Based on the survey and analysis of individuals’ domestic water use and water-saving behavior in Beijing, we introduced CAS to construct an individual water-saving response model under external stimuli. In the model, each individual with their specific attributes is regarded as the agent with an initiative and learning mechanism. The agent follows the general stimulus–response model in their interaction with the external environment; that is, after receiving the external stimulus (measures to promote individuals’ water-saving behavior), agents generate a corresponding water-saving behavior response by sensing the change in the system environment or other agents and further adjust their behavior according to the effect on water-saving behavior. This study systematically simulates the change process of individuals’ water use behavior under external stimulus through the model and reflects the overall effect on individuals’ water-saving behavior under various stimulus schemes to analyze individuals’ water-saving promotion measures.
The specific steps of modeling and analysis are summarized as follows: (1) build a system comprising several individuals (i.e., agents) on the basis of the basic situation of the research area and set the initial state for each agent in the system; (2) design stimulus schemes and set different regulatory scenarios for each external stimulus; (3) according to the sensitivity of agents with different attributes to various external stimuli, formulate the agent response rules corresponding to various attribute states of the agent under different stimulus schemes. This is so that agents in an initial state can generate a corresponding water-saving response according to response rules under different external stimulus schemes, and the response results (e.g., the change in water consumption or water charges) as feedback information further affect the subsequent water-saving response of agents. This is to simulate the dynamic process of individual water use changes with time under different external stimulus schemes and reflect the dynamic change of water use and the overall water-saving effect of the whole system simultaneously; and (4) based on the regulation of external stimulus, compare and analyze the water-saving effects of various stimulus schemes, summarize the stimulus schemes with better water-saving effects, and propose measures to promote individuals’ water-saving behavior. The framework of model construction and analysis is presented in Figure 6.
3.2. Individual Water-Saving Response Model
3.2.1. Agent Setting
According to the analysis results in Section 2.2.2, each external stimulus has a different degree of influence on the water-saving behavior of individuals with different attributes. Therefore, we set some attributes for each agent in the model to establish the individual response rules under external stimuli. In this model, the agent attributes included gender, age, education level, monthly income, and water-charge payment frequency. We also set the initial monthly total water consumption for each agent, including the domestic water consumption of the agent in the family and in public places.
Based on the questionnaire samples, this model constructed a system with 500 agents, set attributes for each agent so that the composition of agents in the system conforms to the demographic characteristics of Beijing, and set the initial monthly total water consumption for the agent according to the distribution law of per capita domestic water consumption in 2015 [36].
3.2.2. Stimulus Schemes
The external stimuli in this model comprised a water price stimulus, water use information stimulus, and water-saving publicity and education stimulus. Each external stimulus has multiple regulatory scenarios. Figure 7 presents the content considered in the stimulus schemes.
Water price stimulus refers to adjusting the water pricing system to regulate individual water charges so as to stimulate individuals’ water-saving behavior. Based on the problems in the current three-tiered water pricing system in Beijing (e.g., the excessive setting of the first-tier water consumption and the unreasonable setting of the tiered water prices), this model designs three regulatory scenarios to examine the impact of water price stimulus on individuals’ water-saving behavior: (1) reduce the scope of water consumption in the first tier to reduce the first-tier water price coverage rate (i.e., the proportion of the agent whose water consumption is within the scope of water consumption of the first tier to all agents); (2) increase the water price of the first tier or the second tier (because the coverage rate of the third tier in real life is low; additionally, to simplify the model scenario setting, the tiered water price in this model only considers the two-tier water price); (3) change the metering cycle of water consumption, that is, change the mode of division for tiered water consumption from annual cumulative water consumption (Mode I) to monthly cumulative water consumption (Mode II) and quarterly cumulative water consumption (Mode III).
A water use information stimulus increases individuals’ understanding of their or others’ water use to affect their water use behavior. The research content of this part of the model is the response of an individual’s water-saving behavior to the active display of water use information to individuals and is divided into two schemes: (1) regularly inform individual water consumption and water charges (information I), and (2) regularly inform information I and the average water consumption of individuals in the system (information II).
Water-saving publicity and education stimulus includes two categories: one is to teach knowledge, the other is to teach water-saving skills. The former affects individuals’ water-saving behavior by strengthening individual water-saving awareness, and the latter promotes individuals’ water-saving behavior by improving individuals’ water-saving skills and changing water use habits. This model designs three schemes for the stimulus: (1) conduct only water-saving publicity and education stimulus of teaching knowledge (WSPE I); (2) conduct only the water-saving publicity and education stimulus of teaching skills (WSPE II); (3) conduct water-saving publicity and education stimulus of teaching knowledge and skills (WSPE III).
3.2.3. Response Rules for the Model
1. Water price stimulus
According to the sensitivity of agents with different attributes to water price stimulus, the response rules corresponding to various attributes of agents under the water price stimulus are formulated. Because the water price stimulus mainly affects household water consumption, the agent response here refers to the change in the agent in household water use, reflected through the change in household water consumption (Wh). Under the water price stimulus, the inspiration mechanism of residents’ water-saving response occurs when the water charges exceed the psychologically acceptable range of the agent’s consumption, the agent correspondingly reduces water consumption and then continuously adjusts their water use behavior according to the feedback information of the water-saving response effect.
The specific agent response rule is as follows: household water consumption in the current month (Wh(i)) is charged according to the tiered water price. If the ratio R of the monthly water charges to the income in the current month (R(i)) is greater than a certain ratio r, the household water consumption in the next month (Wh(i+1)) is reduced by different agents with varying degrees of is, and the household water consumption in the month after the next month (Wh(i+2)) is adjusted according to water charges in the next month. Considering that the impact of water price stimulus on individuals’ water use behavior weakens over time, we assumed that the aforementioned adjustment would not be more than three times (i.e., a duration of three months) and that water would be used according to the last adjusted water use mode. The specific water-saving response process is presented in Figure 8.
2. Water use information stimulus
In the model, water use information refers to the amount of water used by the agent in the home and the corresponding water charges. The water use information stimulus only affects household water consumption, and the agent response refers to the change in the agent in household water use reflected through the change in Wh. Different water use information stimulus schemes produce different response processes. The agent response rules under the two stimulus schemes in this study are as follows:
Under the first stimulus scheme, there are two reasons to stimulate individual water-saving behavior: (1) the water charges exceed the psychologically acceptable range of the agent’s consumption, and (2) cumulative water consumption exceeds the first-tier water consumption, suggesting that the agent uses too much water. Thus, the agent response rule under this scheme is to increase the judgment of whether the water price increases from the first tier to the second tier on the basis of the individual water-saving response rule under the water price stimulus. The specific water-saving response process is presented in Figure 9, where ix represents the degree of impact of the water use information stimulus on the water-saving behavior of different agents.
In the second stimulus scheme, in addition to the two reasons for stimulating individual water-saving in the first stimulus scheme, individuals change their water use behavior because their monthly water consumption exceeds the average monthly water consumption of individuals in the system. The specific response steps under this plan are as follows: (1) according to the process presented in Figure 9, we preliminarily calculated the water consumption in the next month (); (2) according to the comparison between the of the agent and the average of the system () and the comparison between the ratio of the monthly water charges to the income in the current month (R(i)) of the agent and the average R(i) of the system (Ra(i)), we finally calculated the Wh(i+1) of the agent by using Formula (1).
3. Water-saving publicity and education stimulus
Different from the former two types of external stimuli, a water-saving publicity and education stimulus can affect an individual’s water use behavior in the family and in public places. We assumed that the degree of influence on the two is the same. This part reflects the individual water-saving response process with the change in the total water consumption (W).
For the first stimulus scheme, WSPE I affects individuals’ water-saving behavior by influencing individual water-saving attitude. Water-saving attitude, as an emotional influence factor, plays a significant role in promoting individuals’ water-saving behavior in the short term; however, its role decreases with time [6], that is, the degree of influence (i1) of WSPE I on individuals’ water-saving behavior decreases with time. Because we have no micro data, we assumed that the change rule of i1 was similar to the individual forgetting rule. We assumed that after an individual receives a WSPE Ⅰ at the beginning of the first month, water consumption in the following months is calculated according to the following formula:
where W (t) denotes the total water consumption of the individual in the t-th month, W1 denotes the total water consumption of the individual in the initial state, and b denotes the attenuation coefficient of the degree of influence.
For the second stimulus scheme, WSPE II promotes individuals’ water-saving behavior by increasing an individual’s understanding of water-saving methods and improving individuals’ water-saving skills. The influence of acquiring water-saving methods and skills on promoting individuals’ water-saving behavior is stable and lasting. Therefore, we assumed that the degree of influence (i2) of WSPE II on individuals’ water-saving behavior will not change with time. After an individual receives a WSPE II at the beginning of the first month, the water consumption in the following months is calculated according to the following formula:
The third stimulus scheme is to combine two types of water-saving publicity and education. The impact is to simply add the effect of two types of water-saving publicity and education. After the individual receives the WSPE III at the beginning of the first month, the water consumption in the following months is calculated according to the following formula:
3.3. Parameter and Assumption
3.3.1. Parameter
The agent response rules of the model involve the following parameters:
- r: when the R of an agent exceeds this value, the water price factor starts to promote individuals’ water-saving behavior. At present, the average R of Beijing residents is approximately 0.5%, and the average R of the system in the initial state of this model is 0.56%, which is consistent with the actual situation of Beijing. Regarding the r value that has started to promote individuals’ water-saving behavior, literature has not yet reached a consensus. Nevertheless, the relevant departments in China have proposed that the R should be greater than 1% according to the actual situation in China [37]. Therefore, this model sets r as 1%.
- b: this indicates the attenuation coefficient for the impact of water-saving publicity and education stimulus of teaching knowledge on individuals’ water-saving behavior. In this study, we referred to the results of similar studies, and the b value was set as 2 [38].
- is, ix, i1, i2 respectively represent the degree of influence of the water price stimulus, water information stimulus, water-saving publicity and education stimulus of teaching knowledge, as well as water-saving publicity and education stimulus of teaching skills on individuals’ water-saving behavior. The setting of these parameters is based on the results of the questionnaire and analysis (shown in Section 2.2.2).
3.3.2. Assumption
Because the change in individuals’ water use behavior in real life is a complex process, to realize the model simulation smoothly, we assumed the following to simplify the model simulation process:
- (1)
- the time scale of the model is month; that is, the minimum unit of measuring individual water use change is month, and daily water use change is not considered.
- (2)
- the time range of the model is one year; that is, we only studied the change in individual water use within one year, and the level of socioeconomic development and individual monthly income did not change in this year.
- (3)
- regardless of the seasonal change in water consumption, we assume that the individual uses water evenly within the year without external stimulus.
- (4)
- the influence of factors beyond the scope of model consideration on individual water-saving is ignored.
4. Results
4.1. Analysis of Individual Water-Saving Response under the Water Price Stimulus
Based on the questionnaire analysis, we qualitatively understood that the current domestic water price for residents in Beijing has little impact on individual water use as a whole, which doesn’t give full play to the role of water price regulation in promoting individuals’ water-saving behavior. Further analysis demonstrates that the impact of the water price stimulus on individuals’ water-saving behavior will be significantly different among individuals belonging to different age groups, income levels, or water-charge payment frequency.
Based on the population structure of Beijing and the sensitivity of individuals with different attributes to the water price stimulus, the influence of water price factors on individual water use under the current water price system in Beijing was quantitatively studied by constructing a model. Assuming that all agents in the system do not know the monthly water charges, the agents use water normally according to the original water use habits in the initial month. The model calculation results demonstrated the change in the total monthly domestic water consumption of the system under the current water price system in Beijing (Figure 10).
In Figure 10, the month with considerable water consumption reduction lies in the first three months. This finding occurs because 8.8% of the agents in the initial state of the model settings have an R greater than 1%, and the water consumption of these agents does not change in the fourth to ninth months after three months of water use adjustment. The real water saving owing to the tiered water price starts from the tenth month, that is, the cumulative water consumption of some agents exceeds that of the first tier and the water price enters the second tier, resulting in an R greater than 1%, which starts to stimulate individuals’ water-saving behavior. The reduction of water consumption in this stage is small, and the water consumption in the twelfth month is only 0.19% less than that in the ninth month. Thus, based on the current water price system in Beijing, the impact of the water price stimulus on individuals’ water-saving behavior starts six months later, and the degree of impact is small.
At present, the coverage rate of the first-tier water price in Beijing is 90%, indicating that 90% of the residents’ household water charges are not affected by the implementation of the tiered water price. Some scholars have suggested that the coverage rate of the first-tier water price should be reduced to 30% [39] to ensure that most residents are constrained by the tiered water price and to promote more residents to save water. In this part, the first-tier water price coverage rate is reduced from 90% to 30%. The change in water consumption under different first-tier water price coverage rates is presented in Figure 11.
Through Figure 11, we observe that reducing the first-tier water price coverage rate improves the water-saving effect of the tiered water price; however, the annual water consumption corresponding to the coverage rate of 30% is reduced by less than 0.3% compared with that corresponding to 90%. Clearly, reducing the first-tier water price coverage on the basis of the original water price has little effect on improving the water-saving effect of the tiered water price. In addition, when the first-tier water price coverage rate changes between 90% and 80%, the water consumption barely changes. This finding demonstrates that with an unadjusted water price, only when the first-tier water price coverage rate decreases to a certain value can the adjustment of the coverage rate play a better role in water-saving.
Next, we consider the situations of increasing the first- and second-tier water price, respectively. Table 1 presents the household water consumption with the tiered water price unchanged, the first-tier water price increasing by ¥1, and the second-tier water price increasing by ¥1–¥5 in sequence when the first-tier water price coverage rate is 90%, 50%, and 30%, respectively. In Table 1, when the first-tier water price coverage rate is 90%, the water-saving effect of increasing the second-tier water price by ¥5 is still not as good as that of increasing the first-tier water price by ¥1. When the first-tier water price coverage rate is 50%, the water-saving effect of increasing the second-tier water price by ¥3 is better than that of increasing the first-tier water price by ¥1, and the per capita annual water charges when the second-tier water price is increased by ¥3 is less than that when the first-tier water price is increased by ¥1; when the first-tier water price coverage rate is 30%, the water-saving effect of increasing the second-tier water price by ¥2 is better than that of increasing the first-tier water price by ¥1, and the per capita annual water charges when the second-tier water price is increased by ¥2 is also less than that when the first-tier water price is increased by ¥1.
Accordingly, it is concluded that when the first-tier water price coverage rate is high, the water-saving effect caused by increasing the second-tier water price is not obvious, and reducing the first-tier water price coverage rate promotes the water-saving effect of improving the second-tier water price. When increasing the second-tier water price and increasing the first-tier water price achieve the same water-saving effect, the increase in water charges in the former case is less than that in the latter case because increasing the first-tier water price increases the water charges of all agents, including agents with lower water consumption, while increasing the second-tier water price only increases the water charges of agents with excessive water consumption. This demonstrates that in the case of the low coverage rate of the first-tier water price, increasing the second tier does not increase the water charges of basic water consumption in life but effectively controls unnecessary water consumption, that is, it can achieve a better water-saving effect and will not increase the individual economic burden too much.
The results of this comprehensive study on the impact of reducing the first-tier water price coverage rate and increasing the tiered water price on household water use are presented in Figure 12. We draw the following conclusions from Figure 12:
- (1)
- All curves in Figure 12 demonstrate a downward trend from left to right, indicating that reducing the first-tier water price coverage rate under any water price promotes individuals’ water-saving behavior. When the coverage rate is greater than 60%, the curve decline range is smaller; when the coverage rate is less than 60%, the curve decline range is large; and when the coverage rate is reduced from 55% to 50%, the curve decline range is the largest, indicating that when the first-tier water price coverage rate is less than 60%, adjusting the first-tier water price coverage rate can better indicate the water-saving effect of the tiered water price.
- (2)
- The solid lines in Figure 12 are dense on the left and sparse on the right, which demonstrates that when the first-tier water price coverage rate is high, increasing the second-tier water price has no obvious effect on promoting individuals’ water-saving behavior. When the first-tier water price coverage rate is reduced to 50%, increasing the second-tier water price significantly increases the reduction in household water consumption. Especially when the second-tier water price is increased to ¥13, the water-saving effect of increasing the second-tier water price is particularly significant.
- (3)
- Comparing the dotted lines with the solid lines in the figure, we observe that when the first-tier water price coverage rate is greater than 75%, the water-saving effect of the second-tier water price increased to ¥20 is not as good as that of the first-tier water price increased by ¥1. Additionally, the dotted line intersects with all the solid lines representing the second-tier water price of more than ¥8. This indicates that increasing the first-tier water price only has an obvious advantage in terms of the water-saving effect when the first-tier water price coverage rate is high and loses its advantage in water-saving effects when the first-tier water price coverage rate is low.
In addition, the current tiered water pricing system divides the tiered water consumption on the basis of annual cumulative water consumption. In Figure 10, the reduction in water consumption because of the water price entering the second tier starts from the tenth month, that is, individual water use behavior starts to be constrained by the tiered water price at a later period under Mode Ⅰ, and the water consumption in the previous months is not affected by the tiered water price. Therefore, we analyzed the impact of two modes of the tiered water pricing system that changes the metering cycle of water consumption (Mode II, Mode III) on individual water consumption. The results of the model demonstrated that under any first-tier water price coverage rate and any tiered water price, the effect of these three modes on promoting individuals’ water-saving behavior is approximately Mode III > Mode Ⅰ > Mode II.
We further analyzed the changes in the monthly household water consumption for the year under the three modes. For example, we considered a case where the first-tier water price coverage rate is 50% and the second-tier water price is increased to ¥13. In Figure 13, under Mode II, some agents with large water consumption are charged with the second-tier water price in the middle and later period of the first month. When the R of the first month of the agent is greater than 1%, water consumption is reduced in the second month. After three months of adjustment, water consumption of the agent enters a stable state. Therefore, Mode II can enhance the role of the water-saving effect of tiered water price in the first month and let the agent with large water consumption enter the water-saving state as soon as possible. Under Mode I, only after the sixth month can the agent pay water charges with the second-tier water price, and their water consumption begins to be constrained by the tiered water price. However, only part of the monthly water consumption is charged based on the second-tier water price when Mode II is adopted, and whole-month water consumption may be charged based on the second-tier water price when Mode I is adopted; thus, Mode I leads to more agents’ R exceeding 1%. That is, Mode I can exert the water-saving effect of the tiered water price on more agents. Accordingly, Mode I has a better water-saving effect than Mode II. Mode III makes up for the shortcomings of those two modes. Mode Ⅲ can give full play to the water-saving effect of the tiered water price earlier and let the water-saving effect of the tiered water price play on more agents; thus, it is the best of the three modes. Considering the seasonal variation in individual water consumption in real life, if the tiered water pricing divides the tiered water consumption in terms of quarterly cumulative water consumption, different divisions of tiered water consumption can be set for different seasons such that the water-saving effect of the tiered water pricing can be more scientifically and rationally exerted.
4.2. Analysis of Individual Water-Saving Response under the Water Use Information Stimulus
Based on the results of the questionnaire, we know that the amount of good information feedback is insufficient between Beijing residents and their water use information, and individuals do not know much about household water consumption and water charges. The results demonstrated that individuals who know more about water use information are generally more sensitive to water price factors, and the impact of water price on their water use behavior is greater than that on individuals who do not know water use information, which is one of the reasons why other studies have posited that water use information can significantly positively affect water-saving behavior [14]. According to the questionnaire analysis, we also know that different types of individuals have significant differences in their attention to and understanding of water use information. The effect of water use information stimulus on water-saving behavior may be more prominent for individuals who do not focus much on or know about water use information. Therefore, the effect of promoting water saving differs when different types of individuals are stimulated by water use information.
Based on this analysis, we then quantitatively compared the implementation of two types of water use information stimulus (Information I, Information II) with the absence of the water use information stimulus (No Information) through model simulation. The change in the total monthly household water consumption in three cases is presented in Figure 14. In Figure 14, the implementation of the water use information stimulus can promote individual water saving. Compared with No Information, the implementation of Information I can reduce the total household water consumption by approximately 1.4% over the whole year. The implementation of Information II has a more obvious effect on promoting individuals’ water-saving behavior, reducing the total annual household water consumption by approximately 8.5%. This finding occurs because Information I mainly affects the agents with large water consumption and with little attention to water use information originally, whereas Information II can affect all the agents with water consumption that exceeds the average water consumption of the system, which results in the average water consumption of the system decreasing with the change in the agent’s water-saving behavior. Therefore, the implementation of Information II can form a virtuous circle of interaction between the agent’s water-saving behavior and the system’s water-saving level to improve the system’s water-saving level to a greater extent and finally stabilize the whole system in the state of a high water-saving level.
4.3. Analysis of Individual Water-Saving Response under the Water-Saving Publicity and Education Stimulus
The results of the questionnaire demonstrated that Beijing residents are poorly educated about water saving, their understanding of the current situation of water resources and water policies in Beijing is unsatisfactory, and they have not mastered water-saving methods and skills. Many respondents in the survey emphasized that strengthening water-saving publicity and education should be the fundamental measure to promote universal water conservation. Many scholars have stated that water-saving publicity and education play crucial roles in promoting individuals’ water-saving behavior [19,20,40], but elaboration is difficult on the impact process of water-saving publicity and education on individuals’ water-saving behavior, and few studies have discussed it separately according to the content of water-saving publicity and education.
Our study compared and analyzed the change in the total monthly water consumption in four cases of no water-saving publicity and education stimulus (No WSPE) and three types of water-saving publicity and education stimulus (WSPE I, WSPE II, WSPE III). The model results (Figure 15) demonstrate that the water consumption reduction in the first month after the implementation of WSPE I is significantly more than that of WSPE II, the water-saving effect of WSPE I is slightly worse than that of WSPE II in the second month, and the effect of WSPE I almost disappears seven months later. If WSPE III is implemented, the water-saving effect in the early period is obvious; that is, the water consumption reduction in the first month is approximately 2.67 times that in the implementation of WSPE II, and the water-saving effect in the later period basically depends on the role of WSPE II, which can reduce the water consumption by approximately 4% compared with No WSPE.
We did not collect data on the specific impact of water-saving publicity and education on individuals’ water-saving behavior and could not obtain relevant data from other research; thus, we could not accurately simulate the impact process of water-saving publicity and education on individuals’ water-saving behavior. However, more importantly, this research highlights the importance of conducting scenario analyses rather than sharp simulations. Further research could collect data on the change in household water consumption after water-saving publicity and education. On this basis, further research on the response process of individual water-saving under the water-saving publicity and education stimulus for several times can analyze the effect of various water-saving publicity and education frequencies on individuals’ water-saving behavior. This can assess which frequency and method of conducting water-saving publicity and education can achieve a better water-saving effect and guide water-saving publicity and education work more scientifically.
4.4. Analysis of Individual Water-Saving Promotion Measures
According to the analysis of the impact of water price stimulus on individuals’ water-saving behavior, we observed that under the current water pricing system in Beijing, the impact of a water price stimulus on individuals’ water-saving behavior is small. Thus, we suggest a reduction in the first-tier water price coverage rate and an increase in the second-tier water price to take full advantage of the promotion effect of the tiered water price on individuals’ water-saving behavior. The model results suggested to reduce the first-tier water price coverage to less than 50%. In real life, first-tier water consumption can be set as the water consumption necessary to fulfill the basic living needs of residents according to the actual situation of the region. In addition, the results of the model demonstrated that dividing tiered water consumption based on quarterly cumulative water consumption is more conducive to promoting water-saving behavior. Therefore, we suggest changes in the metering cycle of water consumption in the current tiered water pricing system from yearly to quarterly. Because of the substantial differences in individual water consumption in different seasons in real life, we suggest setting different divisions of tiered water consumption for each season according to the seasonal change in water consumption.
According to the analysis of the impact of a water use information stimulus on individuals’ water-saving behavior, promoting individuals to procure water use information could effectively enhance the water-saving effect of water price on individual water use behavior. Therefore, we suggest an increase in the access to water use information and improvements to the feedback mechanism of water use information. These include sending an SMS regularly, adding an app reminder function, installing real-time monitoring and display equipment for household water use, and applying other means to provide timely feedback on water price, water consumption, and water charges. In addition, disclosing other individuals’ water use information and increasing individuals’ understanding of the average water use of the system can effectively stimulate individuals to reduce their water consumption and make the whole system work to conserve more water. Therefore, when providing feedback on water use information to individuals, other residents’ water use information can be added for comparison. Moreover, neighborhood committees, community building management committees, and other organizations can compare and report the monthly, quarterly, and annual water use of the community, and praise and reward families with better water-saving behavior or families with greater progress to strengthen positive emotions for individuals’ water-saving behavior and to create a good water-saving atmosphere.
According to the analysis of the impact of water-saving publicity and education stimulus on individuals’ water-saving behavior, the effect of water-saving publicity and education stimulus of teaching knowledge on individuals’ water-saving behavior in the early period is relatively significant, but the effect obviously weakens with time. The effect of water-saving publicity and education stimulus of teaching skills in the early period is not as good as that of water-saving publicity and education stimulus of teaching knowledge, but its promoting effect on individual water-saving behavior is stable and lasting. Combining the two types of water-saving publicity and education can improve the significance and durability of water-saving effects. At present, the situation of water-saving publicity and education in Beijing is not ideal. Therefore, additional efforts to promote water-saving publicity and education are necessary. We suggest enriching the content and forms of water-saving publicity and education and determining the frequency of various water-saving publicity and education efforts based on the influence of various water-saving publicity and education efforts. Individuals’ water-saving behavior changes with time, so promoting water-saving publicity and education efforts need to be more normative and systematic.
5. Discussion
In this study, CAS is applied to study individuals’ water-saving behavior. Based on full consideration of the interaction between individual attributes and external stimuli, we establish an individual water-saving response model under external stimuli. By directly stimulating the micro water use behavior under different stimulus schemes, we predict overall water consumption of the system, evaluate the water-saving effect of different external stimulus schemes, and provide suggestions for individual water-saving promotion measures and water demand management. Different from many model studies, this study also conducts a social survey in the research area and integrates the analysis results of the social survey into the establishment and analysis of the model, which effectively solves the problem of too much subjectivity and the lack of basis when determining parameters in this type of model. Moreover, this model considers the heterogeneity and mutual influence among micro individuals and depicts the internal mechanism that affects the change in individuals’ water-saving behavior. Therefore, the simulation results of the model can more truly reflect the change in the trend of the regional water-saving situation under the water-saving control measures, which can provide a reference for research on regional water demand management and have great value in practical applications.
There are several limitations because of the complexity of the influencing factors and processes of individual water-saving behavior as well as the difficulty of micro data collection. First, we do not comprehensively consider the influencing factors of individual water-saving behavior but assume and simplify some influencing factors in the model. Thus, further research could consider other key influencing factors (e.g., family characteristics, seasonal changes, and water-saving technology development) that can be appropriately added according to the actual needs, reduce the assumptions, and study the influence of each key factor on individuals’ water-saving behavior in a more in-depth manner. Second, our study has insufficient data support. Limited by the existing basic data, the rules of some models lack objective data support, such as research on the impact of water-saving publicity and education on individuals’ water-saving behavior. Notably, to create a water-saving publicity and education plan, researchers should record the change in individual water consumption with time after each water-saving publicity and education and analyze the law of the influence of the form and frequency of water-saving publicity and education on individuals’ water-saving behavior with time. Furthermore, researchers must use this as the basis to determine the model parameters, improve the accuracy of the model, and make the research more scientific, rigorous, and objective.
Although there is much room for improvement in research, any method of studying human behavior has its inherent limitations. The human ability of exercising free will, thinking creatively, and innovating means that human actions, especially in cases that have not been previously experienced, are fundamentally difficult to predict accurately [41]. As far as the individual water-saving behavior studied in this paper is concerned, its influencing factors and processes are complicated, and they will vary in different periods and different regions. Therefore, we put forward a research idea to grasp the main problems of individual water-saving efforts in a certain period of the study area through social surveys, and then combined with regional characteristics to drive modeling decision-making with the purpose of practical problem-solving, and finally, through model simulation to judge the effectiveness of different regulatory measures in promoting individual water saving. Managers in different regions can formulate models based on the regional characteristics and make differentiated water-saving management policies based on the model’s results.
Further thinking about domestic water management, there is a certain limit for domestic water-saving; water demand management and water supply management should be considered at the same time in practical water resources management [42]. Because human beings have a basic demand for domestic water to fulfill their basic health and hygiene needs and excessively curbing of domestic water demand will reduce the quality of life, individual domestic water-saving should be moderate [34,43,44]. Moreover, treating and making good use of domestic sewage can enlarge the amount of water resources available, and then balance water supply and demand from the overall allocation of water resources [45]. Therefore, in the future domestic water management and research, we need emphasize that domestic water-saving should be to save unreasonable consumption of water resources to scientifically formulate water-saving management policies to curb unreasonable domestic water use, and also call for strengthening the treatment and reuse of domestic sewage.
6. Conclusions
The management of domestic water demand is one of the key points of water demand management in areas with high economic development level. In recent years, an increasing number of scholars and managers studied the measures of domestic water-saving from the perspective of individual behavior. This paper explores the feedback interaction between individuals and external factors in the process of changing water use behavior, with the ultimate goal of proposing individual water-saving promotion measures for regional individual water-saving problems. A research idea of combining a social survey and model study was put forward. Furthermore, based on CAS, a general model framework of individual water saving behavior response research was proposed, and the process of model establishment and analysis was refined in combination with the actual situation of the region.
This study considers Beijing as the research area. Through the survey of individual domestic water use in Beijing, we observe three notable problems in the domestic water-saving efforts in Beijing: unreasonable water pricing, untimely feedback of water use information, and insufficient water-saving publicity and education. Furthermore, according to the survey results, the relation among the impact of water price stimulus, water information stimulus, water-saving publicity and education stimulus on individual water-saving behavior and individual attributes (i.e., gender, age, education level, income, and water-charge payment frequency) was analyzed. It was found that for individuals with different attributes, different external stimuli were considered and their water-saving behavior was affected in different degrees. Therefore, we fully consider the regional demographic characteristics and the heterogeneity between micro individuals in the model, so that the model has more regional characteristics. Additionally, aiming at the shortcomings of the current water price system, water information feedback mechanism, and water-saving publicity and education in Beijing, this study proposes suggestions on individual water-saving promotion measures by setting different control schemes and analyzing the water-saving effect under each scheme.
Author Contributions
Conceptualization and methodology, Y.Z., H.L. (Haihong Li) and H.L. (Hanqing Liu); software, formal analysis, and investigation, H.L. (Hanqing Liu); resources, H.L. (Haihong Li) and L.W.; data curation, H.L. (Hanqing Liu); writing—original draft preparation, H.L. (Hanqing Liu); writing—review and editing, L.W., H.L. (Haihong Li), Y.Z., and Q.W.; supervision, Y.Z. and H.L. (Haihong Li); project administration, Y.Z. and H.L. (Haihong Li); funding acquisition, Y.Z. All authors have read and agreed to the published version of the manuscript.
Funding
This research was funded by the National Key Research and Development Program of China, grant number 2016YFC0401407; and the Basic Research Fund Project of China IWHR, grant number WR0145B622017.
Acknowledgments
Thanks to Tong Ling of China Agricultural University for her help during the research; Qian Penghao for his help in programing; and Zhang Xin, Jiang Yasai, Yang Fubo, Chen Yanxin, Li Zhiqi, Zhang Qiongfang, Jin Rong, Wang Jingjing, and Wang Pu for their help in the questionnaire survey.
Conflicts of Interest
The authors declare no conflict of interest.
References
- Grafton, R.Q.; Ward, M.B.; To, H.; Kompas, T. Determinants of residential water consumption: Evidence and analysis from a 10-country household survey. Water Resour. Res. 2011, 47, 47. [Google Scholar] [CrossRef] [Green Version]
- De Oliver, M. Attitudes and Inaction. Environ. Behav. 1999, 31, 372–394. [Google Scholar] [CrossRef]
- Zelezny, L.C.; Chua, P.-P.; Aldrich, C. New Ways of Thinking about Environmentalism: Elaborating on Gender Differences in Environmentalism. J. Soc. Issues 2000, 56, 443–457. [Google Scholar] [CrossRef]
- Tindall, D.B.; Davies, S.; Mauboulès, C. Activism and Conservation Behavior in an Environmental Movement: The Contradictory Effects of Gender. Soc. Nat. Resour. 2003, 16, 909–932. [Google Scholar] [CrossRef]
- Gregory, G.D.; Di Leo, M. Repeated Behavior and Environmental Psychology: The Role of Personal Involvement and Habit Formation in Explaining Water Consumption1. J. Appl. Soc. Psychol. 2003, 33, 1261–1296. [Google Scholar] [CrossRef]
- Randolph, B.; Troy, P. Attitudes to conservation and water consumption. Environ. Sci. Policy 2008, 11, 441–455. [Google Scholar] [CrossRef]
- Willis, R.M.; Stewart, R.A.; Panuwatwanich, K.; Williams, P.R.; Hollingsworth, A.L. Quantifying the influence of environmental and water conservation attitudes on household end use water consumption. J. Environ. Manag. 2011, 92, 1996–2009. [Google Scholar] [CrossRef] [Green Version]
- Wolters, E.A. Attitude–behavior consistency in household water consumption. Soc. Sci. J. 2014, 51, 455–463. [Google Scholar] [CrossRef]
- Salvaggio, M.; Futrell, R.; Batson, C.D.; Brents, B.G. Water scarcity in the desert metropolis: How environmental values, knowledge and concern affect Las Vegas residents’ support for water conservation policy. J. Environ. Plan. Manag. 2013, 57, 588–611. [Google Scholar] [CrossRef]
- Aprile, M.C.; Fiorillo, D. Water conservation behavior and environmental concerns: Evidence from a representative sample of Italian individuals. J. Clean. Prod. 2017, 159, 119–129. [Google Scholar] [CrossRef]
- Untaru, E.-N.; Ispas, A.; Candrea, A.N.; Luca, M.; Epuran, G. Predictors of individuals’ intention to conserve water in a lodging context: The application of an extended Theory of Reasoned Action. Int. J. Hosp. Manag. 2016, 59, 50–59. [Google Scholar] [CrossRef]
- Russell, S.V.; Fielding, K.S. Water demand management research: A psychological perspective. Water Resour. Res. 2010, 46, 46. [Google Scholar] [CrossRef] [Green Version]
- Fu, Y.; Wu, W.; Gao, J. Simulation and conservation of the end use water based on behaviour intervention modelling. Procedia Eng. 2015, 119, 761–770. [Google Scholar] [CrossRef] [Green Version]
- Perren, K.; Yang, L. Psychosocial and Behavioural Factors Associated with Intention to Save Water Around the Home: A Greek Case Study. Procedia Eng. 2015, 119, 1447–1454. [Google Scholar] [CrossRef] [Green Version]
- Ramsey, E.; Berglund, E.; Goyal, R. The Impact of Demographic Factors, Beliefs, and Social Influences on Residential Water Consumption and Implications for Non-Price Policies in Urban India. Water 2017, 9, 844. [Google Scholar] [CrossRef] [Green Version]
- Fan, L.; Wang, F.; Liu, G.; Yang, X.; Qin, W. Public Perception of Water Consumption and Its Effects on Water Conservation Behavior. Water 2014, 6, 1771–1784. [Google Scholar] [CrossRef] [Green Version]
- Arbués, F.; Barberán, R.; Villanúa, I. Price impact on urban residential water demand: A dynamic panel data approach. Water Resour. Res. 2004, 40, 40. [Google Scholar] [CrossRef] [Green Version]
- Savenije, H.; Van Der Zaag, P. Water as an Economic Good and Demand ManagementParadigms with Pitfalls. Water Int. 2002, 27, 98–104. [Google Scholar] [CrossRef]
- Athanasiadis, I.N.; Mentes, A.K.; Mitkas, P.A.; Mylopoulos, Y.A. A Hybrid Agent-Based Model for Estimating Residential Water Demand. Simul. 2005, 81, 175–187. [Google Scholar] [CrossRef] [Green Version]
- Berk, R.A.; Schulman, D.; Mckeever, M.; Freeman, H.E. Measuring the impact of water conservation campaigns in California. Clim. Chang. 1993, 24, 233–248. [Google Scholar] [CrossRef]
- Linkola, L.; Andrews, C.J.; Schuetze, T. An Agent Based Model of Household Water Use. Water 2013, 5, 1082–1100. [Google Scholar] [CrossRef]
- Wichman, C.J. Information provision and consumer behavior: A natural experiment in billing frequency. J. Public Econ. 2017, 152, 13–33. [Google Scholar] [CrossRef]
- Holland, J.H. Hidden Order: How Adaptation Builds Complexity; Addison-Wesley: Reading, MA, USA, 1995. [Google Scholar]
- Gilbert, N. Agent-Based Models; Sage: London, UK, 2007. [Google Scholar]
- Galán, J.M.; Del Olmo, R.; López-Paredes, A. An agent-based model for domestic water management in Valladolid metropolitan area. Water Resour. Res. 2009, 45, 45. [Google Scholar] [CrossRef] [Green Version]
- Yuan, X.-C.; Wei, Y.-M.; Pan, S.-Y.; Jin, J.-L. Urban Household Water Demand in Beijing by 2020: An Agent-Based Model. Water Resour. Manag. 2014, 28, 2967–2980. [Google Scholar] [CrossRef]
- Ma, Y.; Shen, Z.; Kawakami, M.; Suzuki, K.; Long, Y. An Agent-Based Approach to Support Decision-Making of Total Amount Control for Household Water Consumption. In Advances in Geographic Information Science; Springer Science and Business Media LLC: Berlin Heidelberg, Germany, 2012; pp. 107–128. [Google Scholar]
- Darbandsari, P.; Kerachian, R.; Estalaki, S.M. An Agent-based behavioral simulation model for residential water demand management: The case-study of Tehran, Iran. Simul. Model. Pr. Theory 2017, 78, 51–72. [Google Scholar] [CrossRef]
- Koutiva, I.; Makropoulos, C. Modelling domestic water demand: An agent based approach. Environ. Model. Softw. 2016, 79, 35–54. [Google Scholar] [CrossRef]
- Li, B.; Sivapalan, M.; Xu, X. An Urban Sociohydrologic Model for Exploration of Beijing’s Water Sustainability Challenges and Solution Spaces. Water Resour. Res. 2019, 55, 5918–5940. [Google Scholar] [CrossRef]
- Beijing Water Authority. Beijing Water Resources Bulletin 2010. Available online: http://swj.beijing.gov.cn/zwgk/szygb/201912/P020191219479481875049.pdf (accessed on 5 February 2020). (In Chinese)
- Beijing Municipal Bureau Statistics. Beijing Statistical Yearbook 2018. Available online: http://202.96.40.155/nj/main/2018-tjnj/zk/indexch.htm (accessed on 5 February 2020). (In Chinese).
- Beijing Water Authority. Beijing Water Resources Bulletin 2003-2018. Available online: http://swj.beijing.gov.cn/zwgk/szygb/. (In Chinese)
- Sauri, D. Water Conservation: Theory and Evidence in Urban Areas of the Developed World. Annu. Rev. Environ. Resour. 2013, 38, 227–248. [Google Scholar] [CrossRef]
- Lewin, K.; Heider, F.; Heider, G.M. Principles of topological psychology; McGraw-Hill: New York, NY, USA, 1936. [Google Scholar]
- Wang, H.; Zhao, Y.; Li, H.; Wang, L.; Jiang, S. Investigation and Analysis on the law of household water use in Beijing. In Proceedings of the 2016 China (Ningxia) International Forum on efficient utilization of water resources, Yinchuan, Ningxia, China, 30 May 2016. (In Chinese). [Google Scholar]
- Chen, J.; Lu, J.; Wang, X.; Zhang, Y. Analysis on the current situation of water expenditure of urban residents in the east, middle and west of China. Chin. Price 2017, 8, 29–31. (In Chinese) [Google Scholar]
- Ding, F. A Case Study on Practical Curriculum of Public Water-saving Education. Master’s Thesis, East China Normal University, Shanghai, China, 2015. (In Chinese). [Google Scholar]
- Liu, X. A Novel Water Pricing Model of the Utility Analysis for Beijing Urban Residents. Master’s Thesis, Capital University if Economics and Business, Beijing, China, 2017. (In Chinese). [Google Scholar]
- Sharvelle, S.; Dozier, A.; Arabi, M.; Reichel, B. A geospatially-enabled web tool for urban water demand forecasting and assessment of alternative urban water management strategies. Environ. Model. Softw. 2017, 97, 213–228. [Google Scholar] [CrossRef]
- Garcia, M.; Portney, K.; Islam, S. A question driven socio-hydrological modeling process. Hydrol. Earth Syst. Sci. 2016, 20, 73–92. [Google Scholar] [CrossRef] [Green Version]
- Katz, D. Undermining Demand Management with Supply Management: Moral Hazard in Israeli Water Policies. Water 2016, 8, 159. [Google Scholar] [CrossRef] [Green Version]
- Rak, J.; Pietrucha-Urbanik, K. An Approach to Determine Risk Indices for Drinking Water–Study Investigation. Sustainability 2019, 11, 3189. [Google Scholar] [CrossRef] [Green Version]
- Inman, D.; Jeffrey, P. A review of residential water conservation tool performance and influences on implementation effectiveness. Urban Water J. 2006, 3, 127–143. [Google Scholar] [CrossRef] [Green Version]
- Zhao, Y.; Zhu, Y.; Wang, J.; Gao, X.; Li, H.; Zhu, Y.; Jiang, S.; Yong, Z.; Guohua, H.; Jianhua, W.; et al. Water stress assessment integrated with virtual water trade and physical transfer water: A case study of Beijing, China. Sci. Total Environ. 2020, 708, 134578. [Google Scholar] [CrossRef]
Figure 1.
Water consumption by sector from 2003 to 2018. Based on data from [33].
Figure 1.
Water consumption by sector from 2003 to 2018. Based on data from [33].

Figure 2.
Degree of influence of water price stimulus on individuals with different attributes.

Figure 3.
Degree of influence of water use information stimulus on individuals with different attributes.
Figure 3.
Degree of influence of water use information stimulus on individuals with different attributes.

Figure 4.
Degree of influence of water-saving publicity and education stimulus of teaching knowledge on individuals with different attributes.
Figure 4.
Degree of influence of water-saving publicity and education stimulus of teaching knowledge on individuals with different attributes.

Figure 5.
Degree of influence of water-saving publicity and education stimulus of teaching skills on individuals with different attributes.
Figure 5.
Degree of influence of water-saving publicity and education stimulus of teaching skills on individuals with different attributes.

Figure 6.
Framework of model construction and analysis.

Figure 7.
Regulatory scenarios of stimulus schemes.

Figure 8.
Schematic diagram of individual water-saving response process under the water price stimulus. “①” “②” “③” represent the first, second, and third adjustment, respectively. “a” means i = i + 1. “b” means that the water consumption will not change after three times of water use adjustment.
Figure 8.
Schematic diagram of individual water-saving response process under the water price stimulus. “①” “②” “③” represent the first, second, and third adjustment, respectively. “a” means i = i + 1. “b” means that the water consumption will not change after three times of water use adjustment.

Figure 9.
Schematic diagram of the individual water-saving response process under the water use information stimulus. “①” “②” “③” represent the first, second, and third adjustment, respectively. “a” means i = i + 1. “b” means that the water consumption will not change after three times of water use adjustment.

Figure 10.
Change in the total monthly household water consumption under the current water price system.
Figure 10.
Change in the total monthly household water consumption under the current water price system.

Figure 11.
Change in total annual household water consumption under different first-tier water price coverage rate.
Figure 11.
Change in total annual household water consumption under different first-tier water price coverage rate.

Figure 12.
Change in the total annual household water consumption under the change in the first-tier water price coverage rate and tiered water price.
Figure 12.
Change in the total annual household water consumption under the change in the first-tier water price coverage rate and tiered water price.

Figure 13.
Change in the total monthly household water consumption under three modes (when the first-tier water coverage rate is 50%, the first-tier water price is ¥5 and the second-tier water price is ¥13).
Figure 13.
Change in the total monthly household water consumption under three modes (when the first-tier water coverage rate is 50%, the first-tier water price is ¥5 and the second-tier water price is ¥13).

Figure 14.
Change in the total monthly household water consumption in the three cases.

Figure 15.
Change in the total monthly water consumption in four cases.


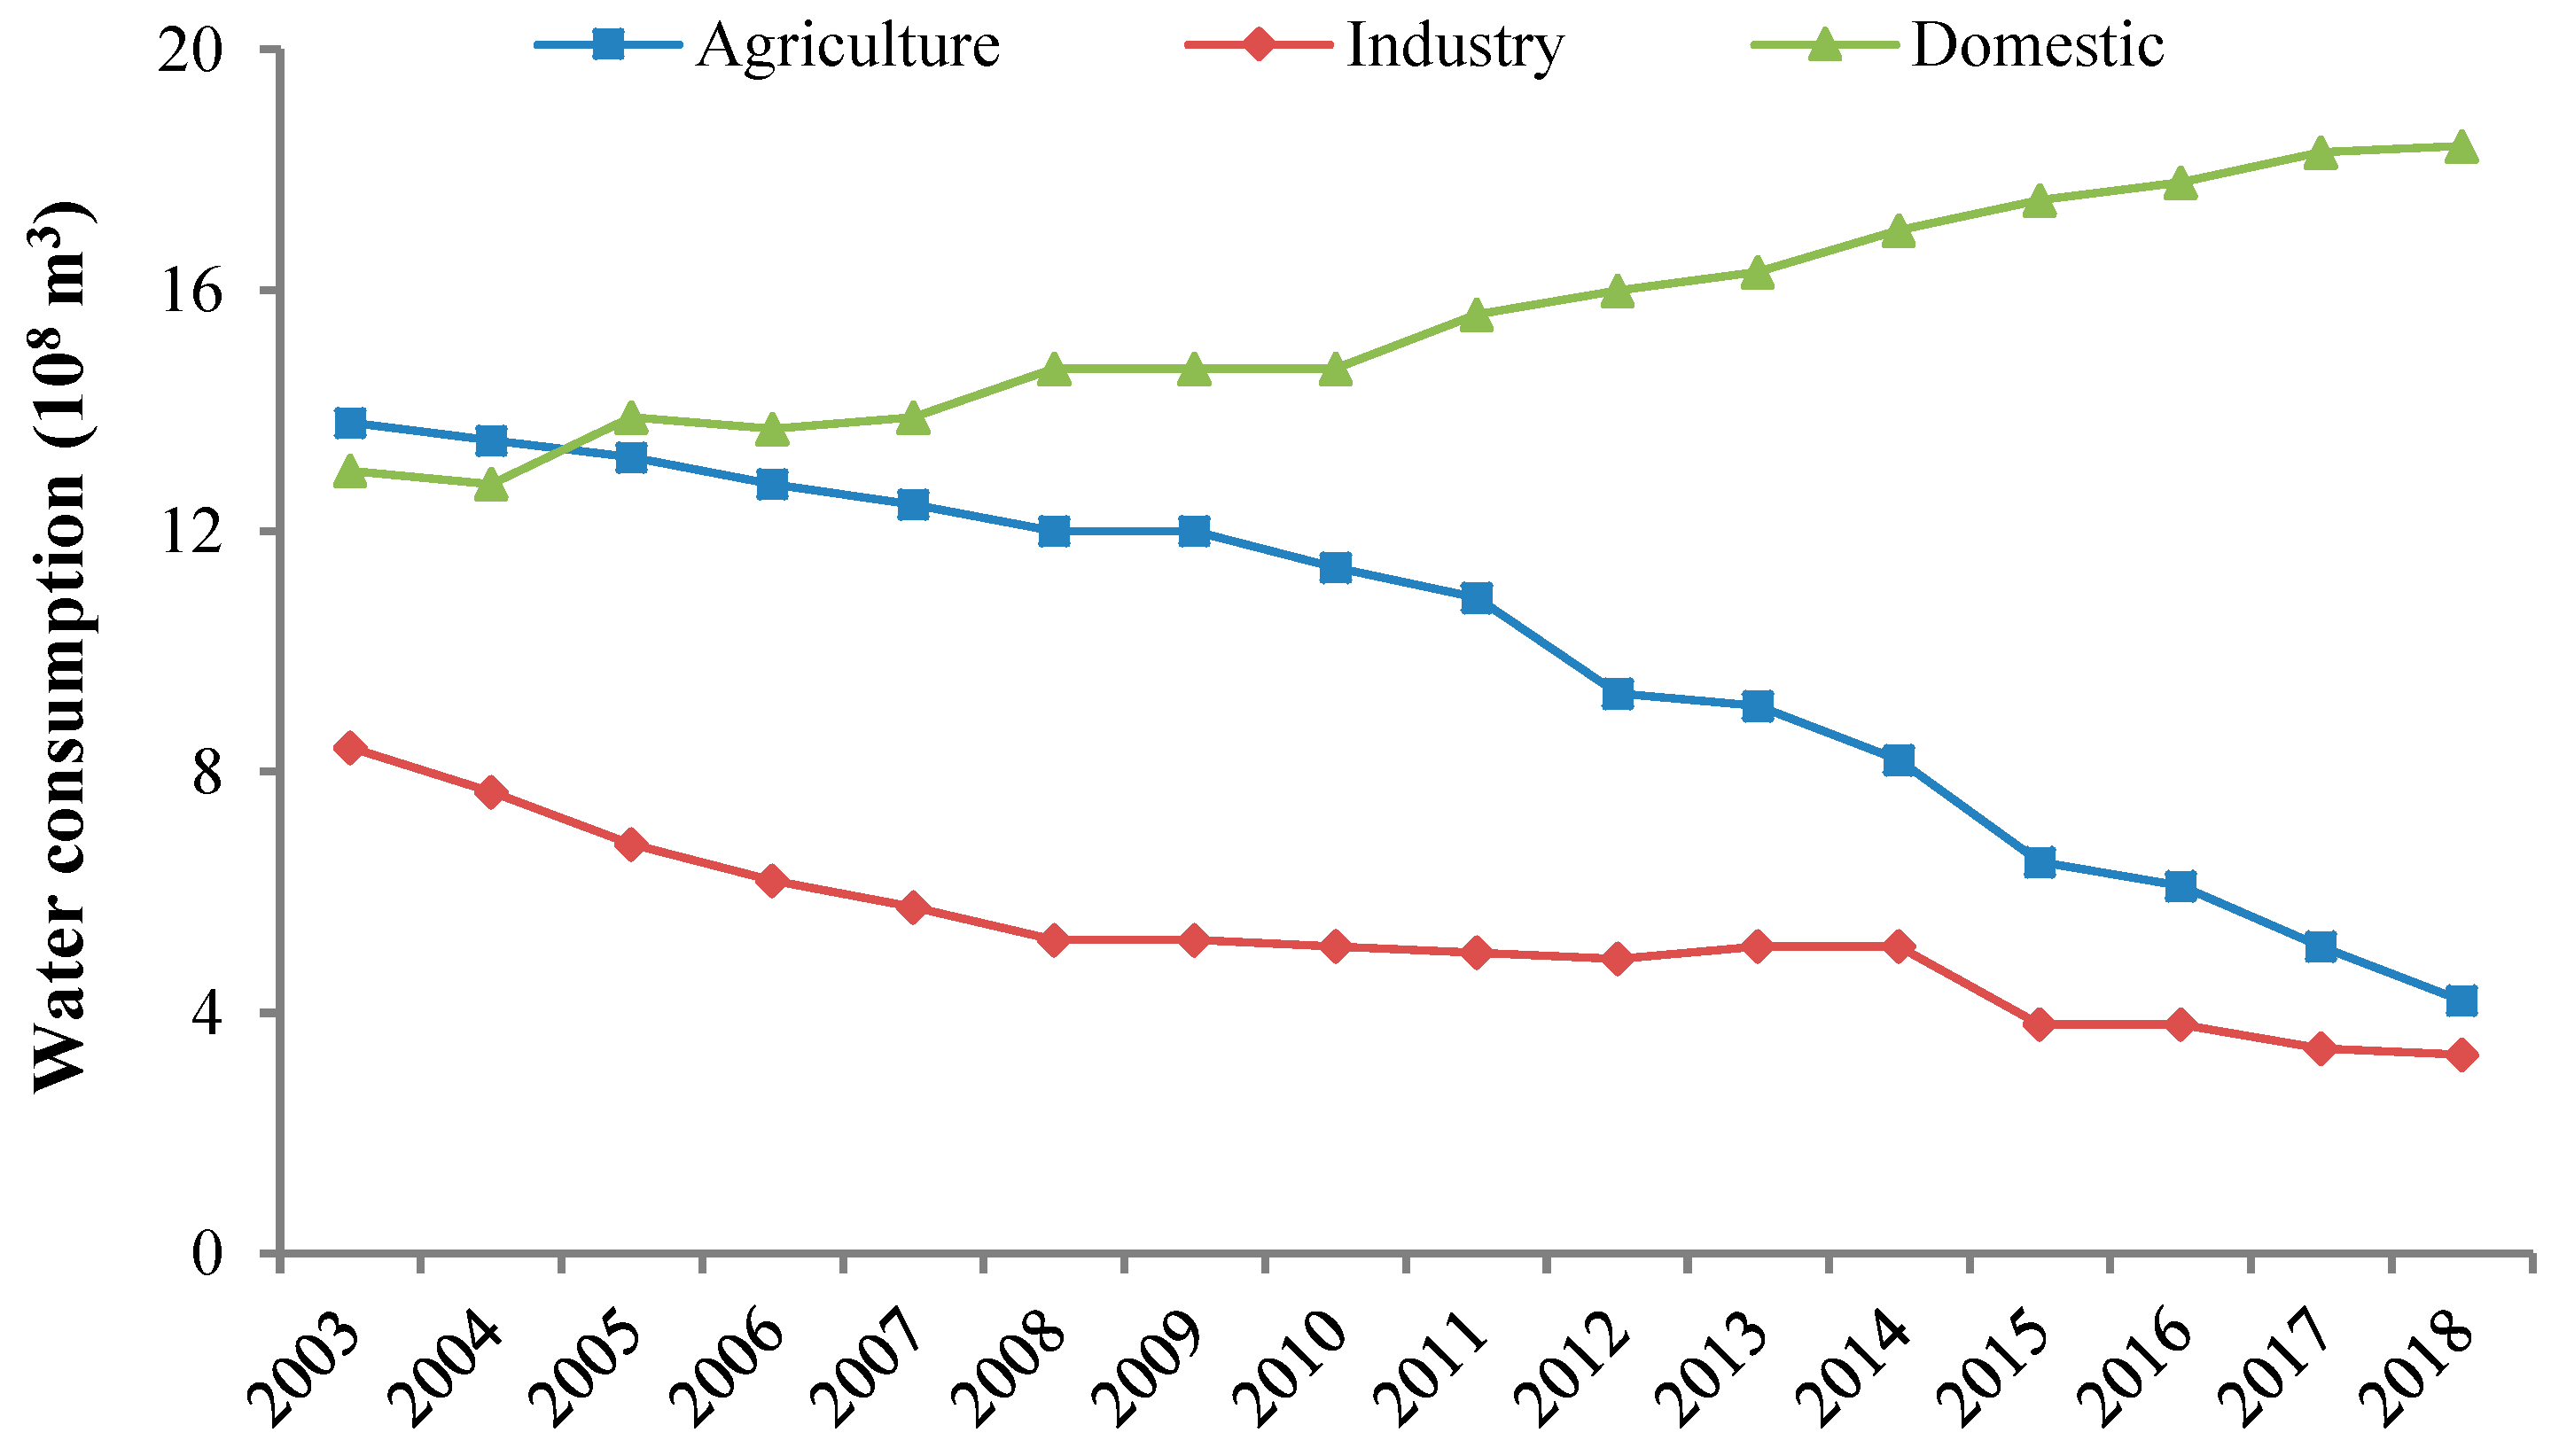
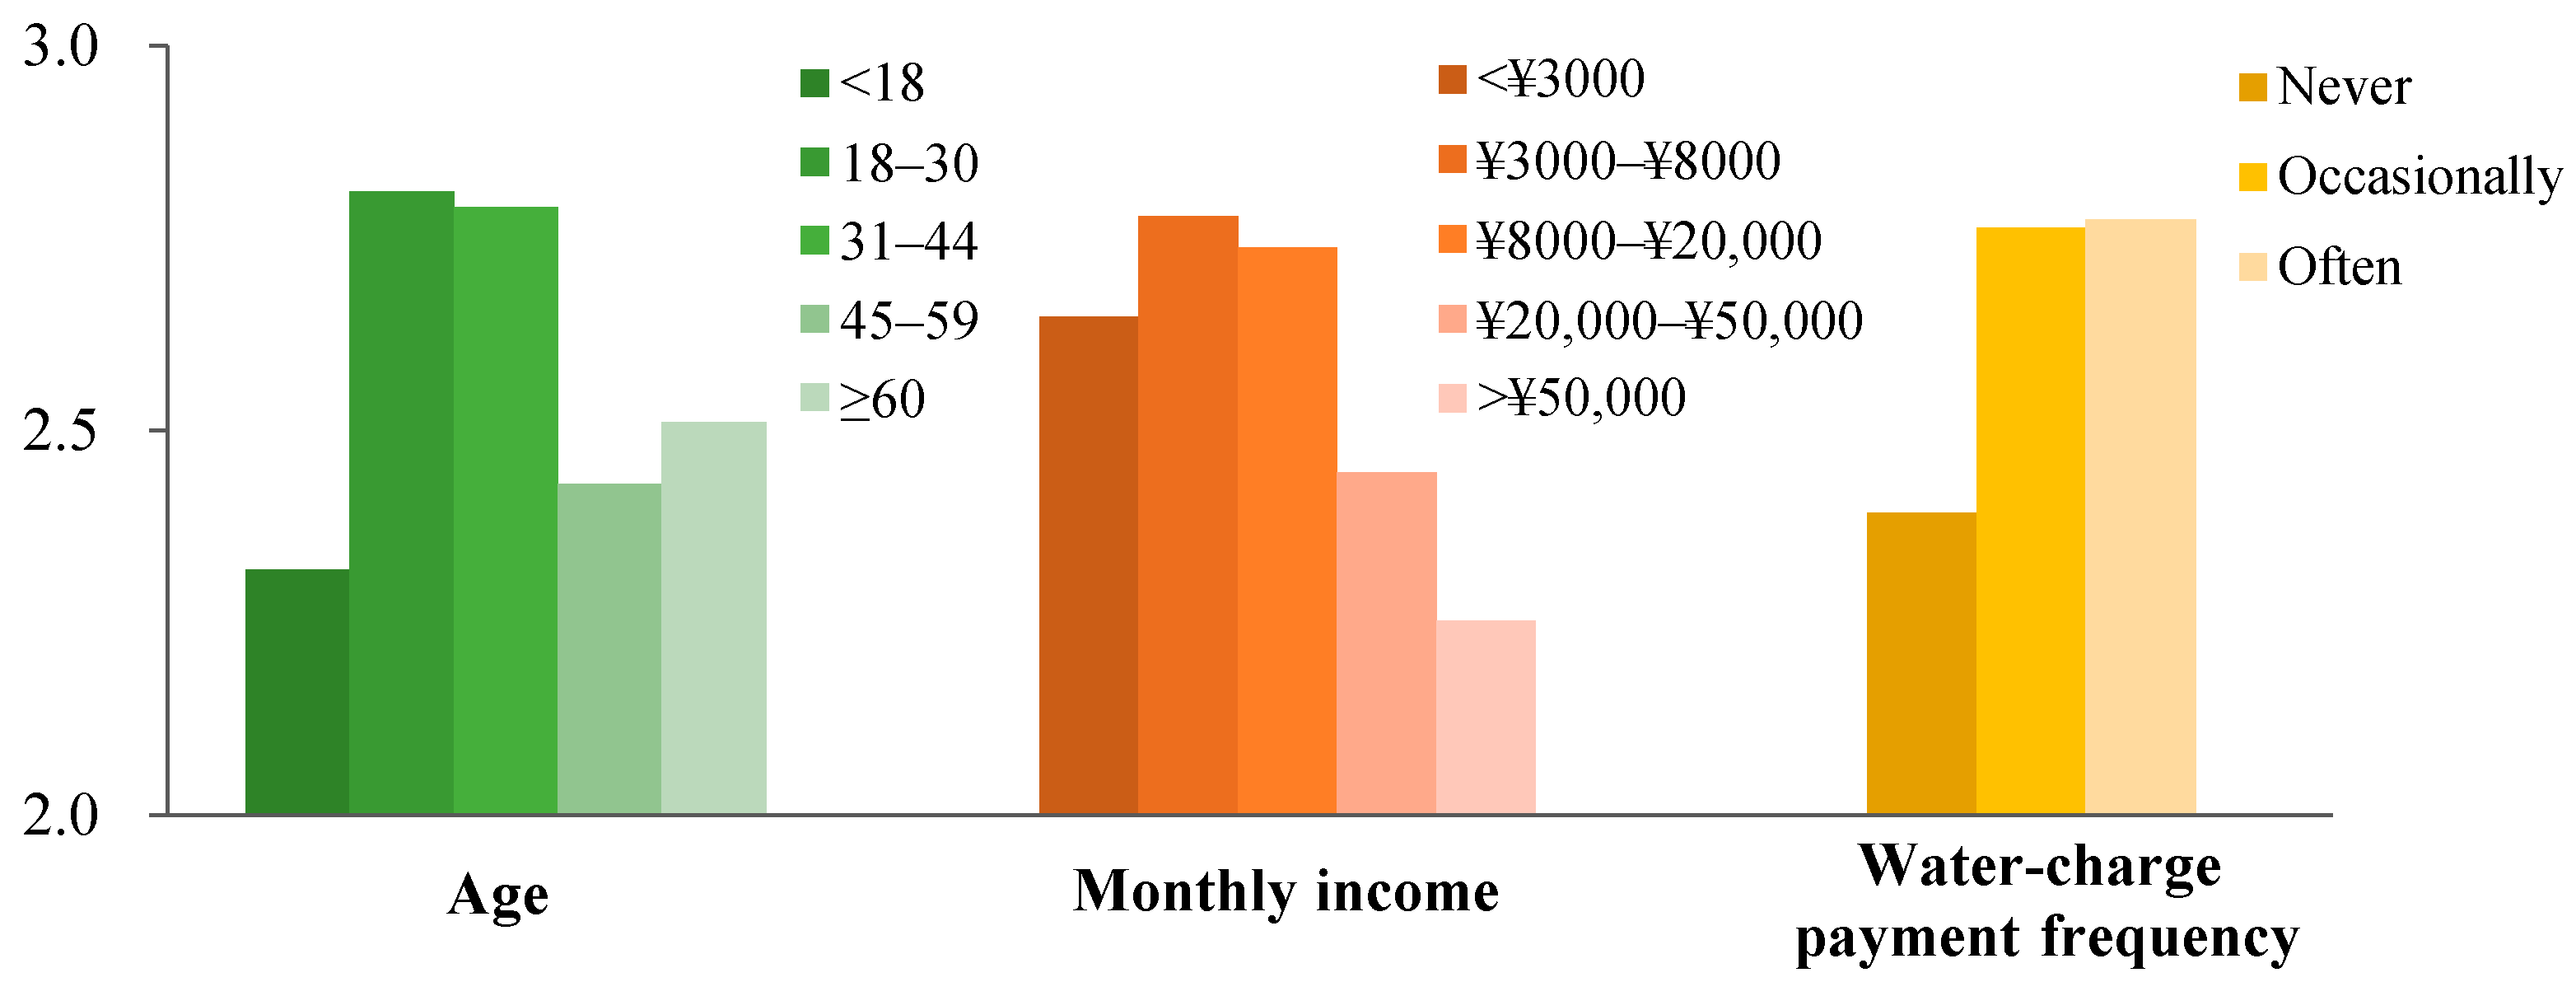
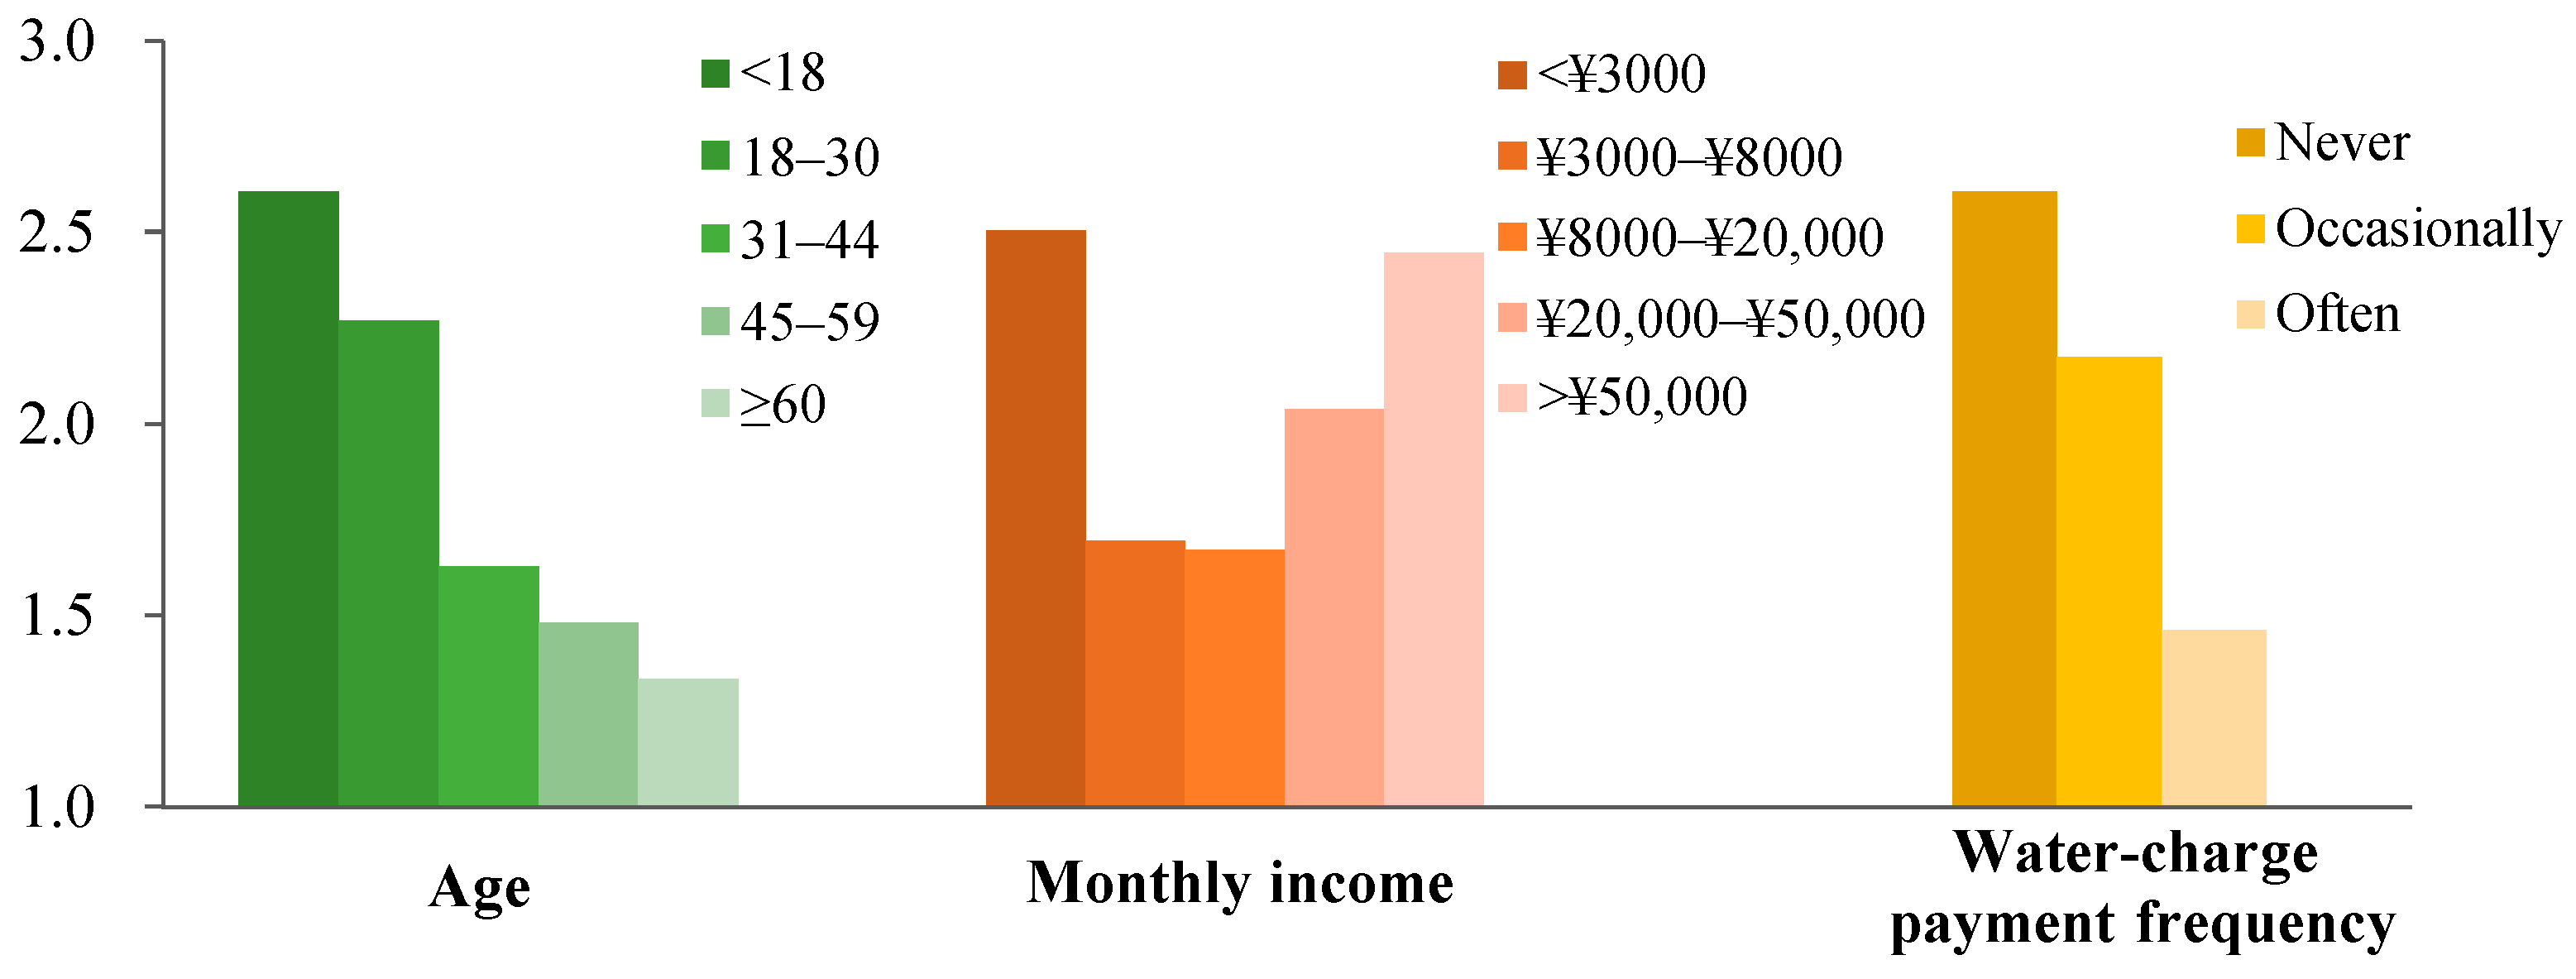
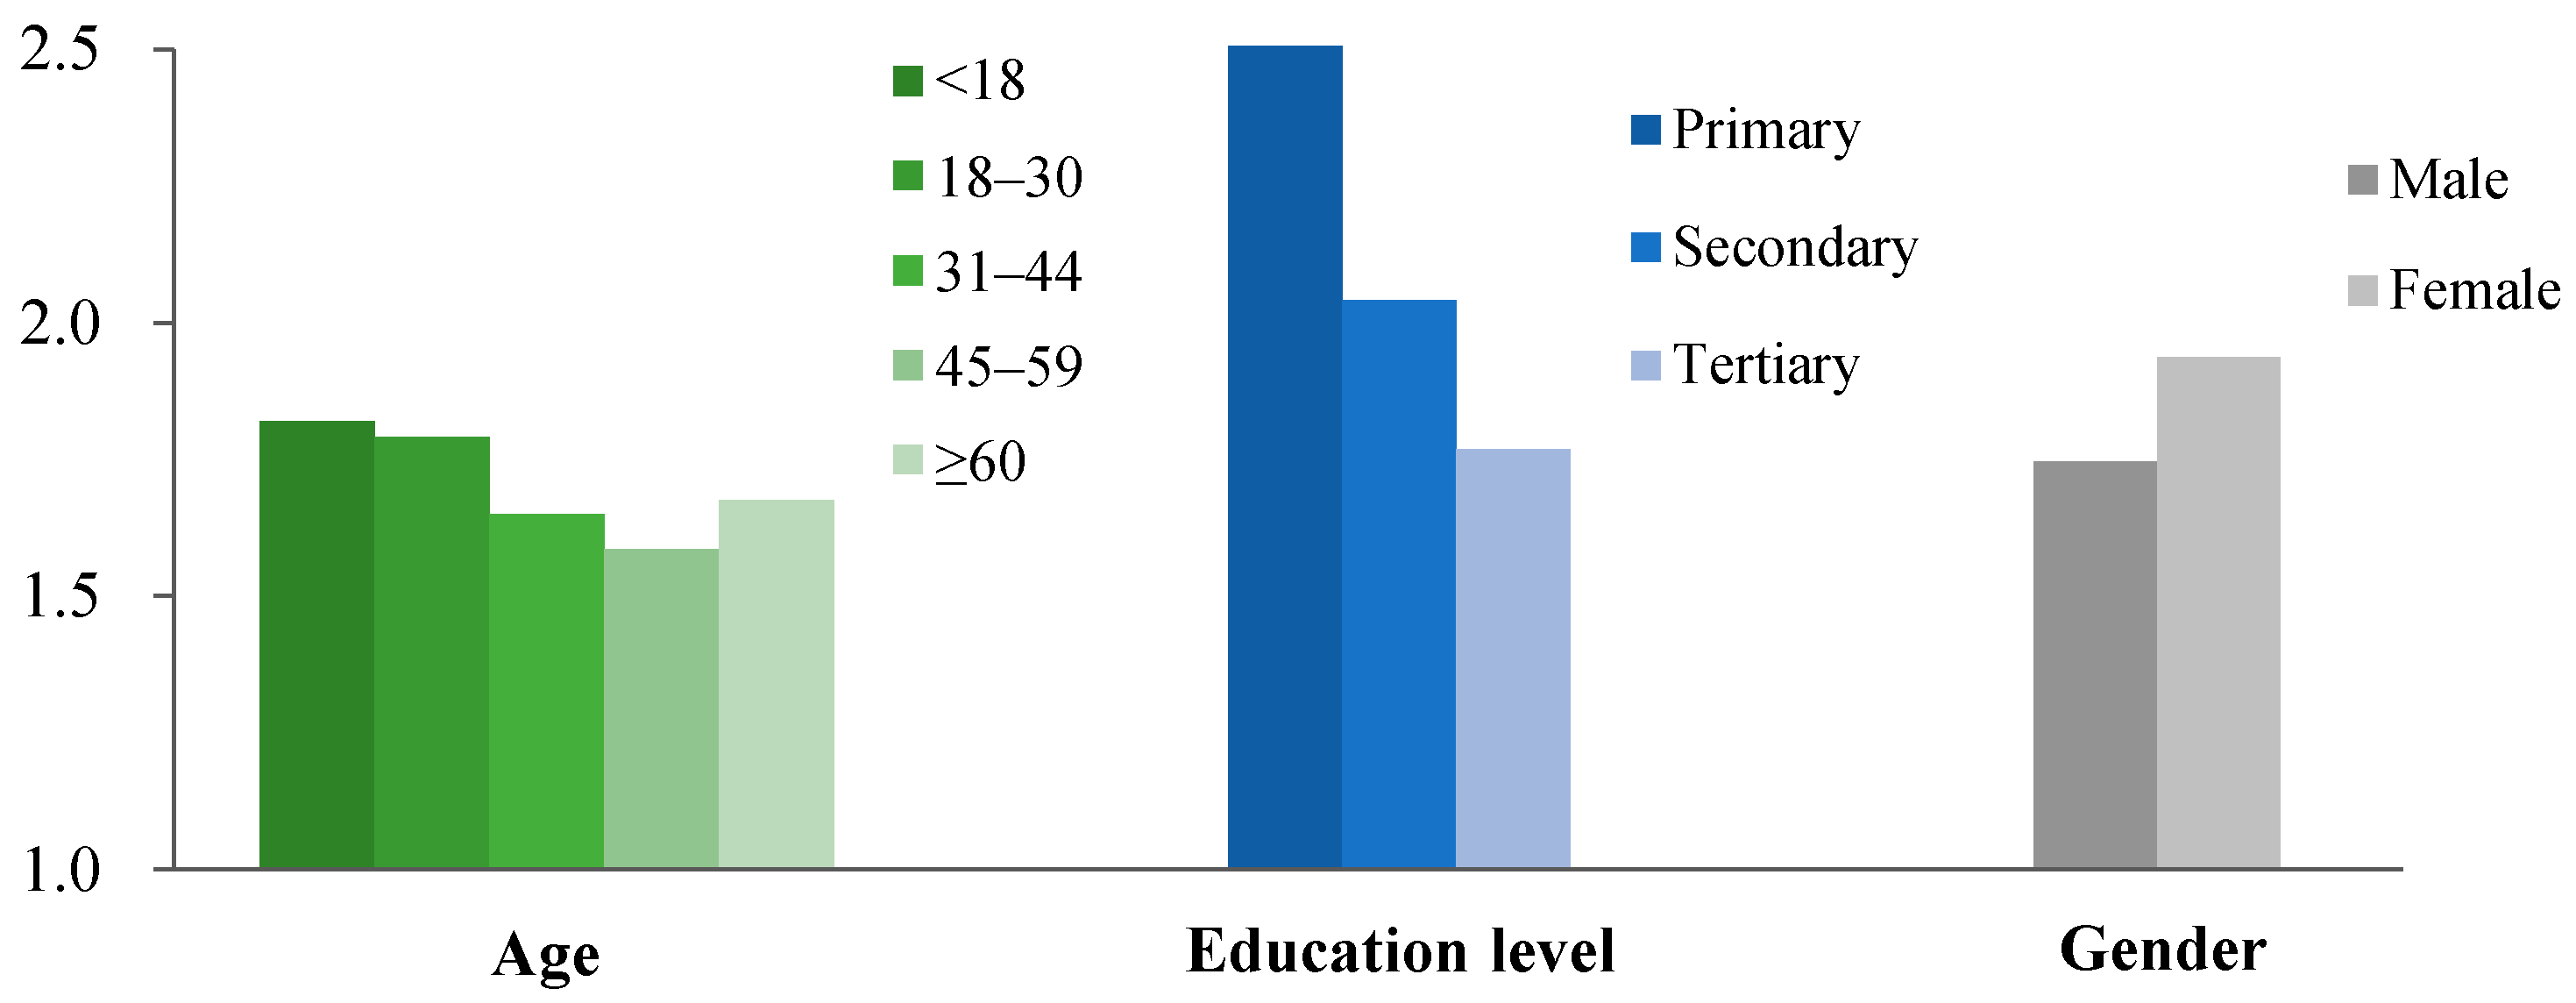
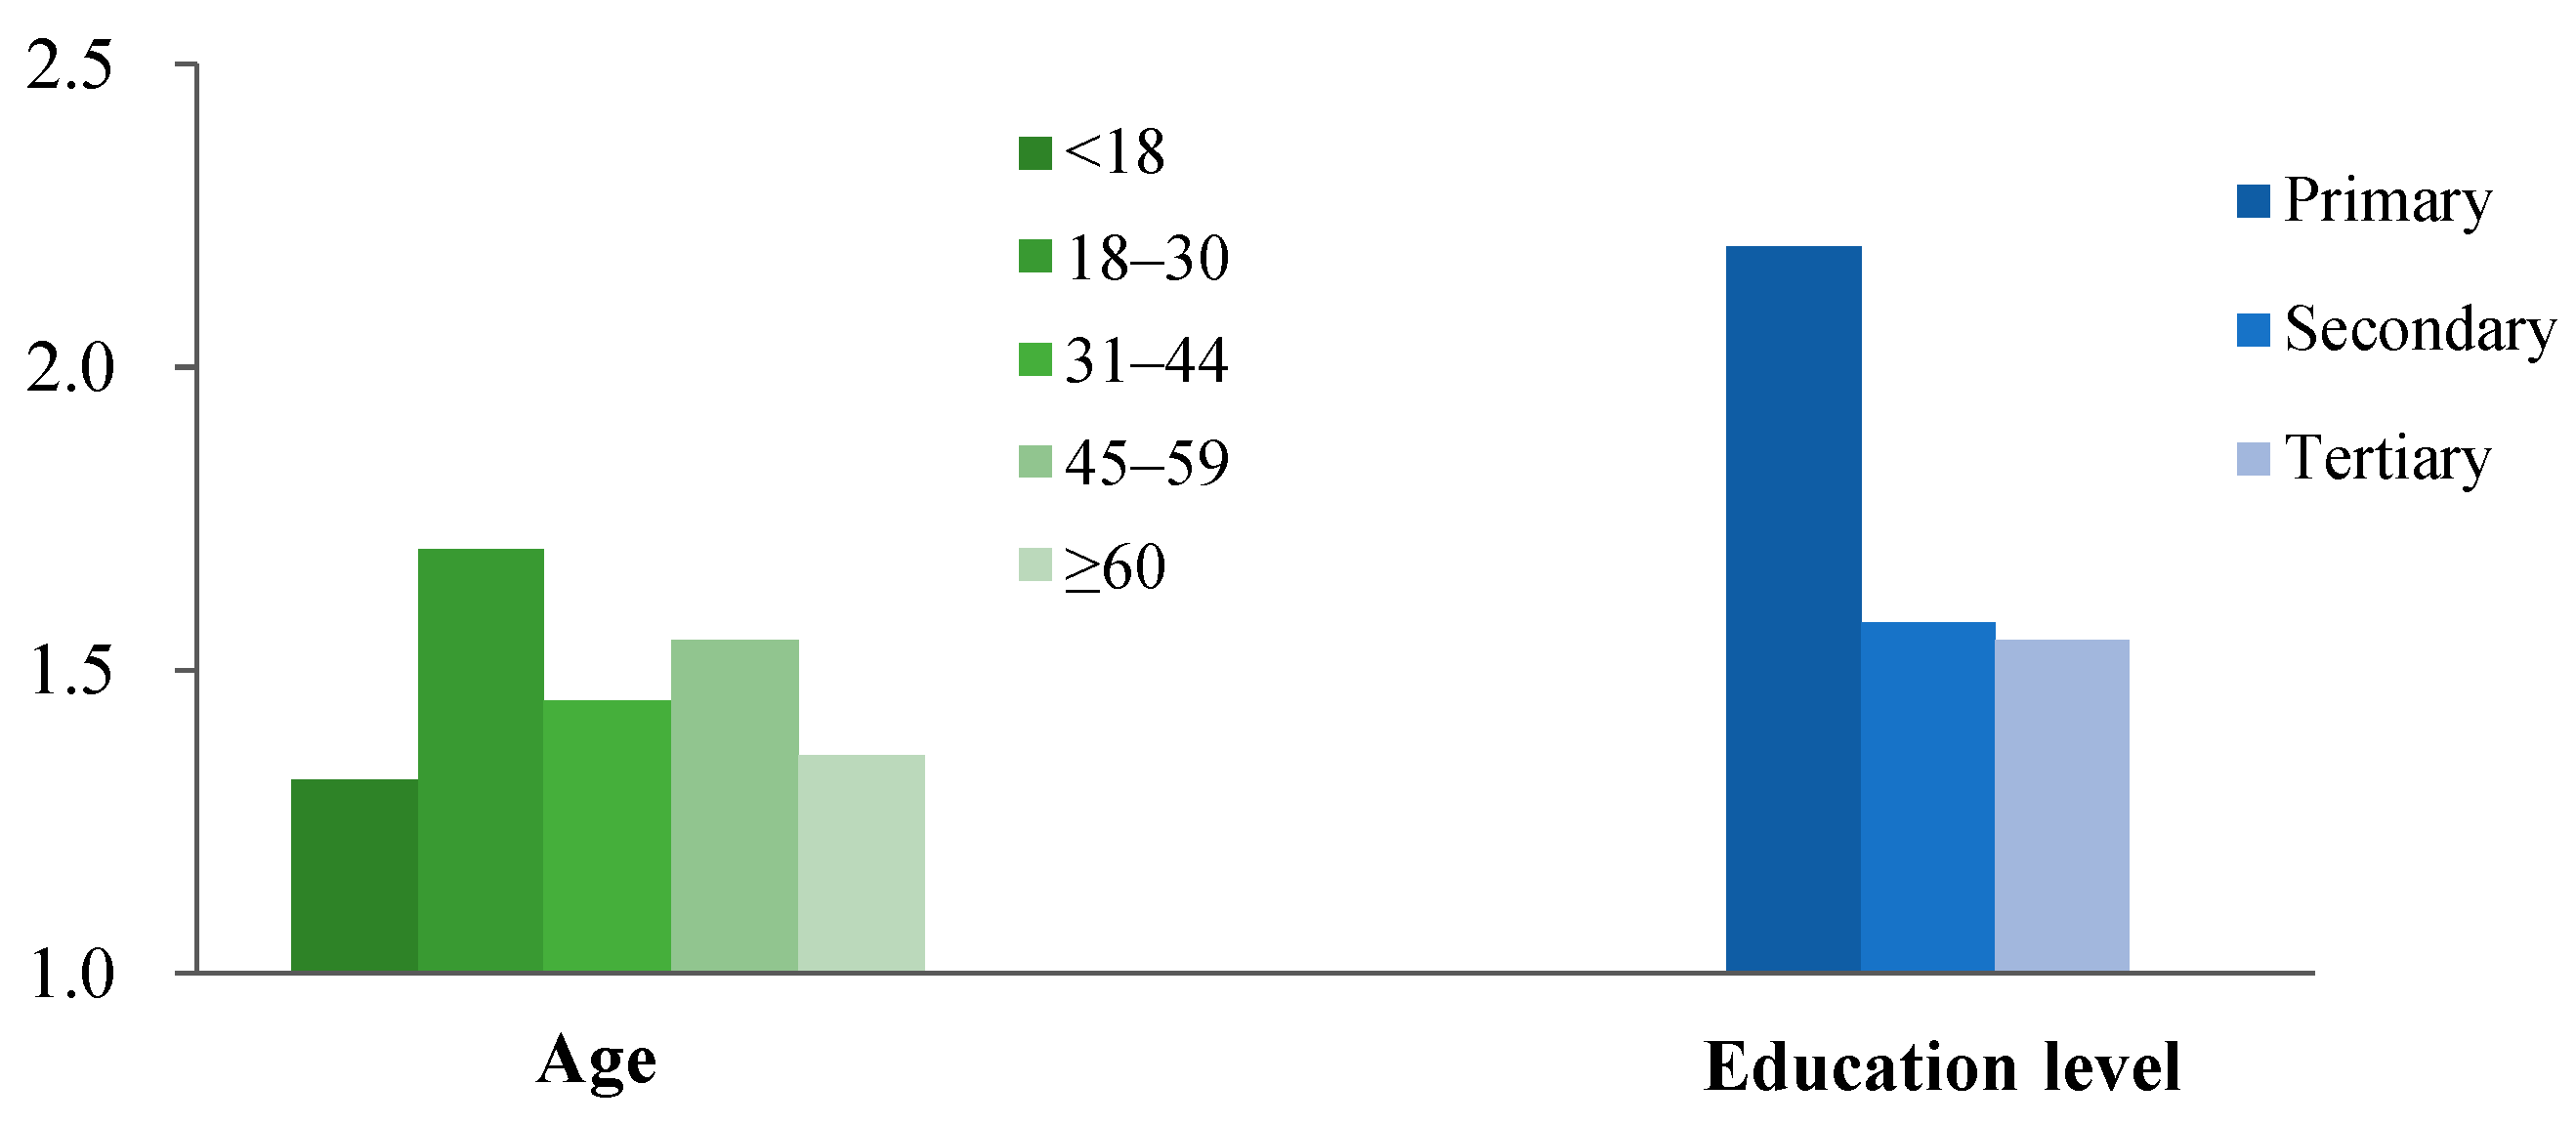
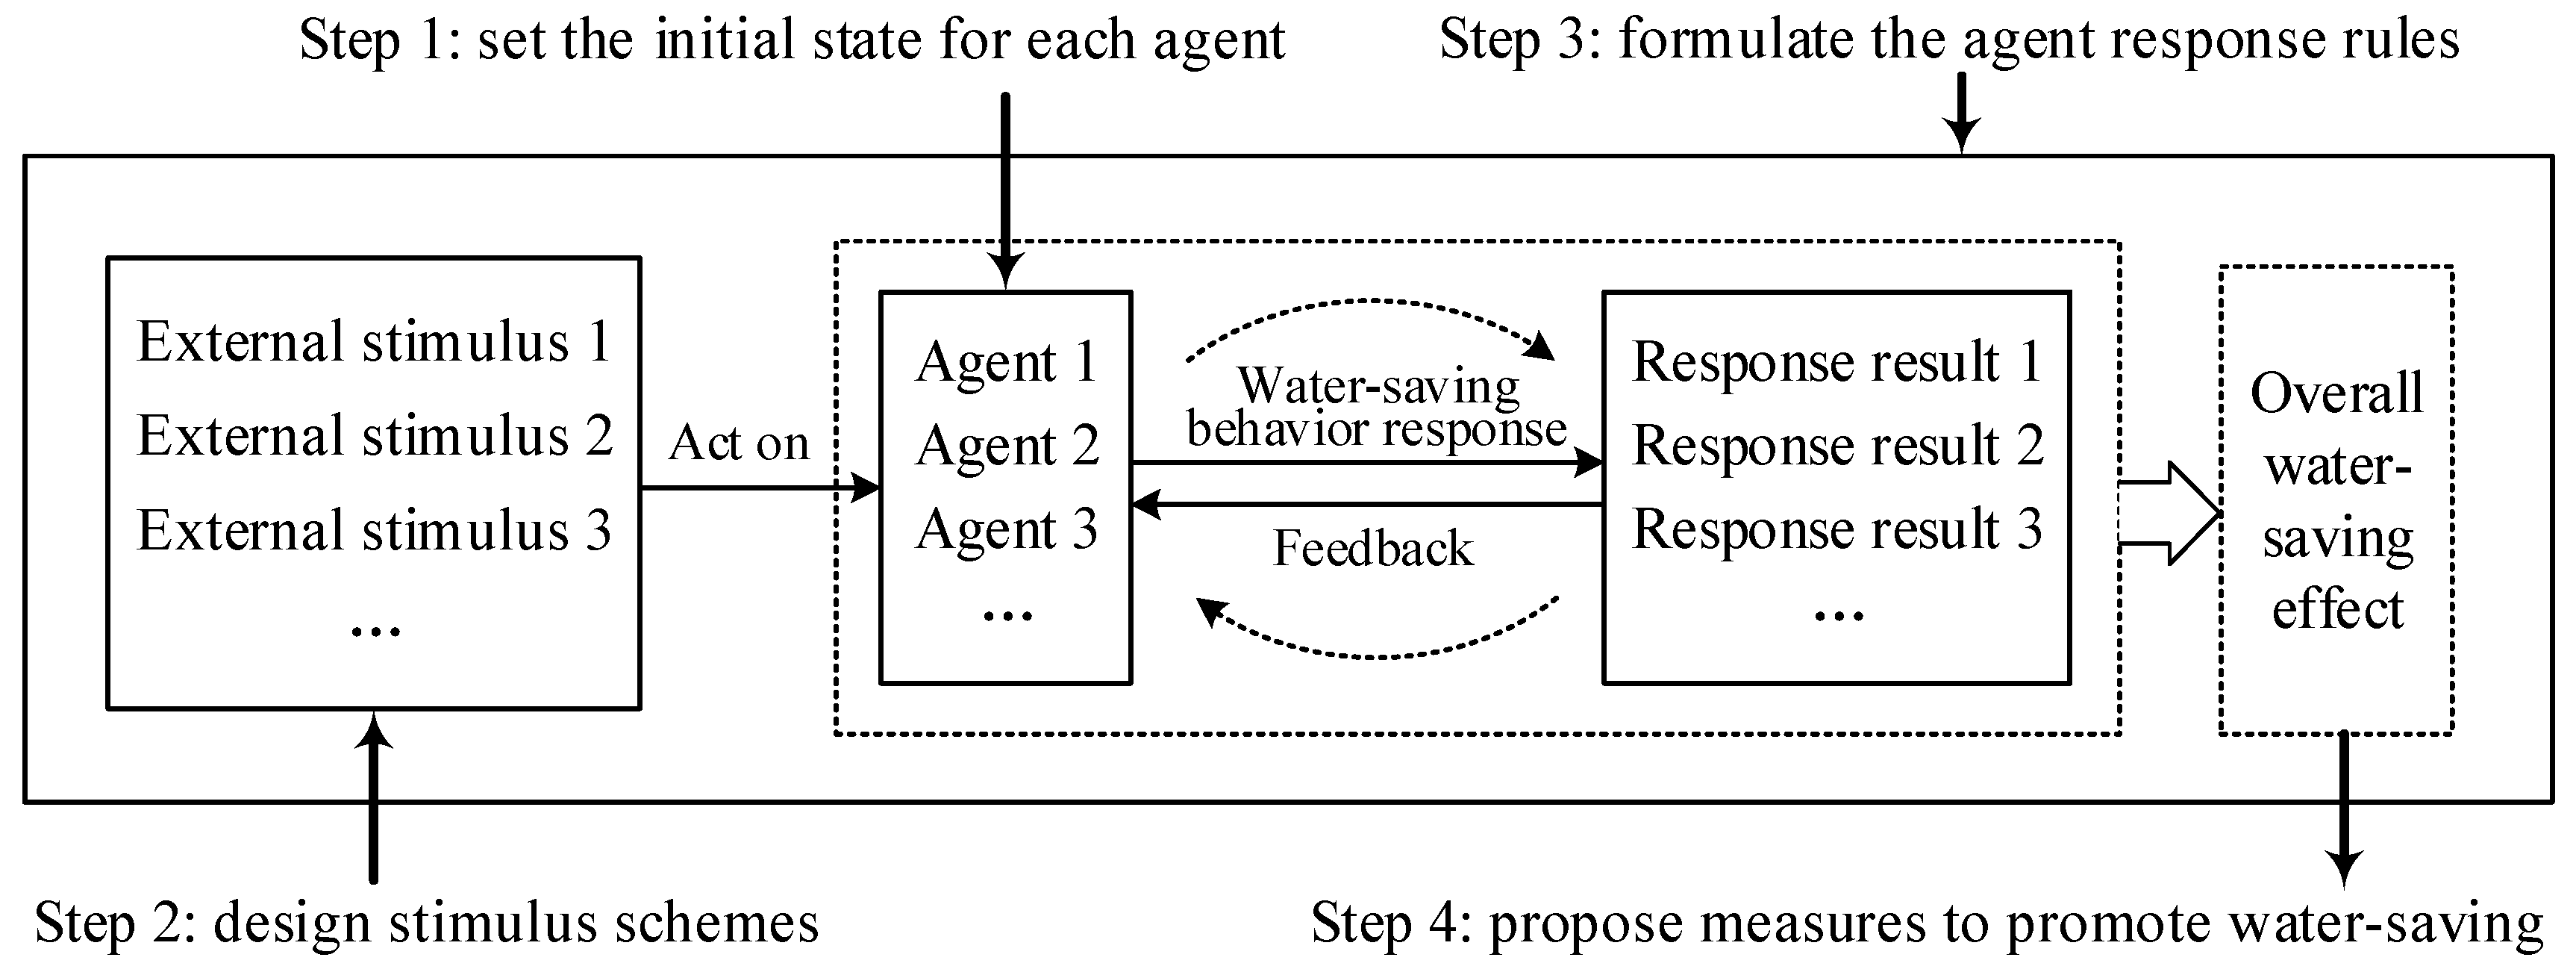
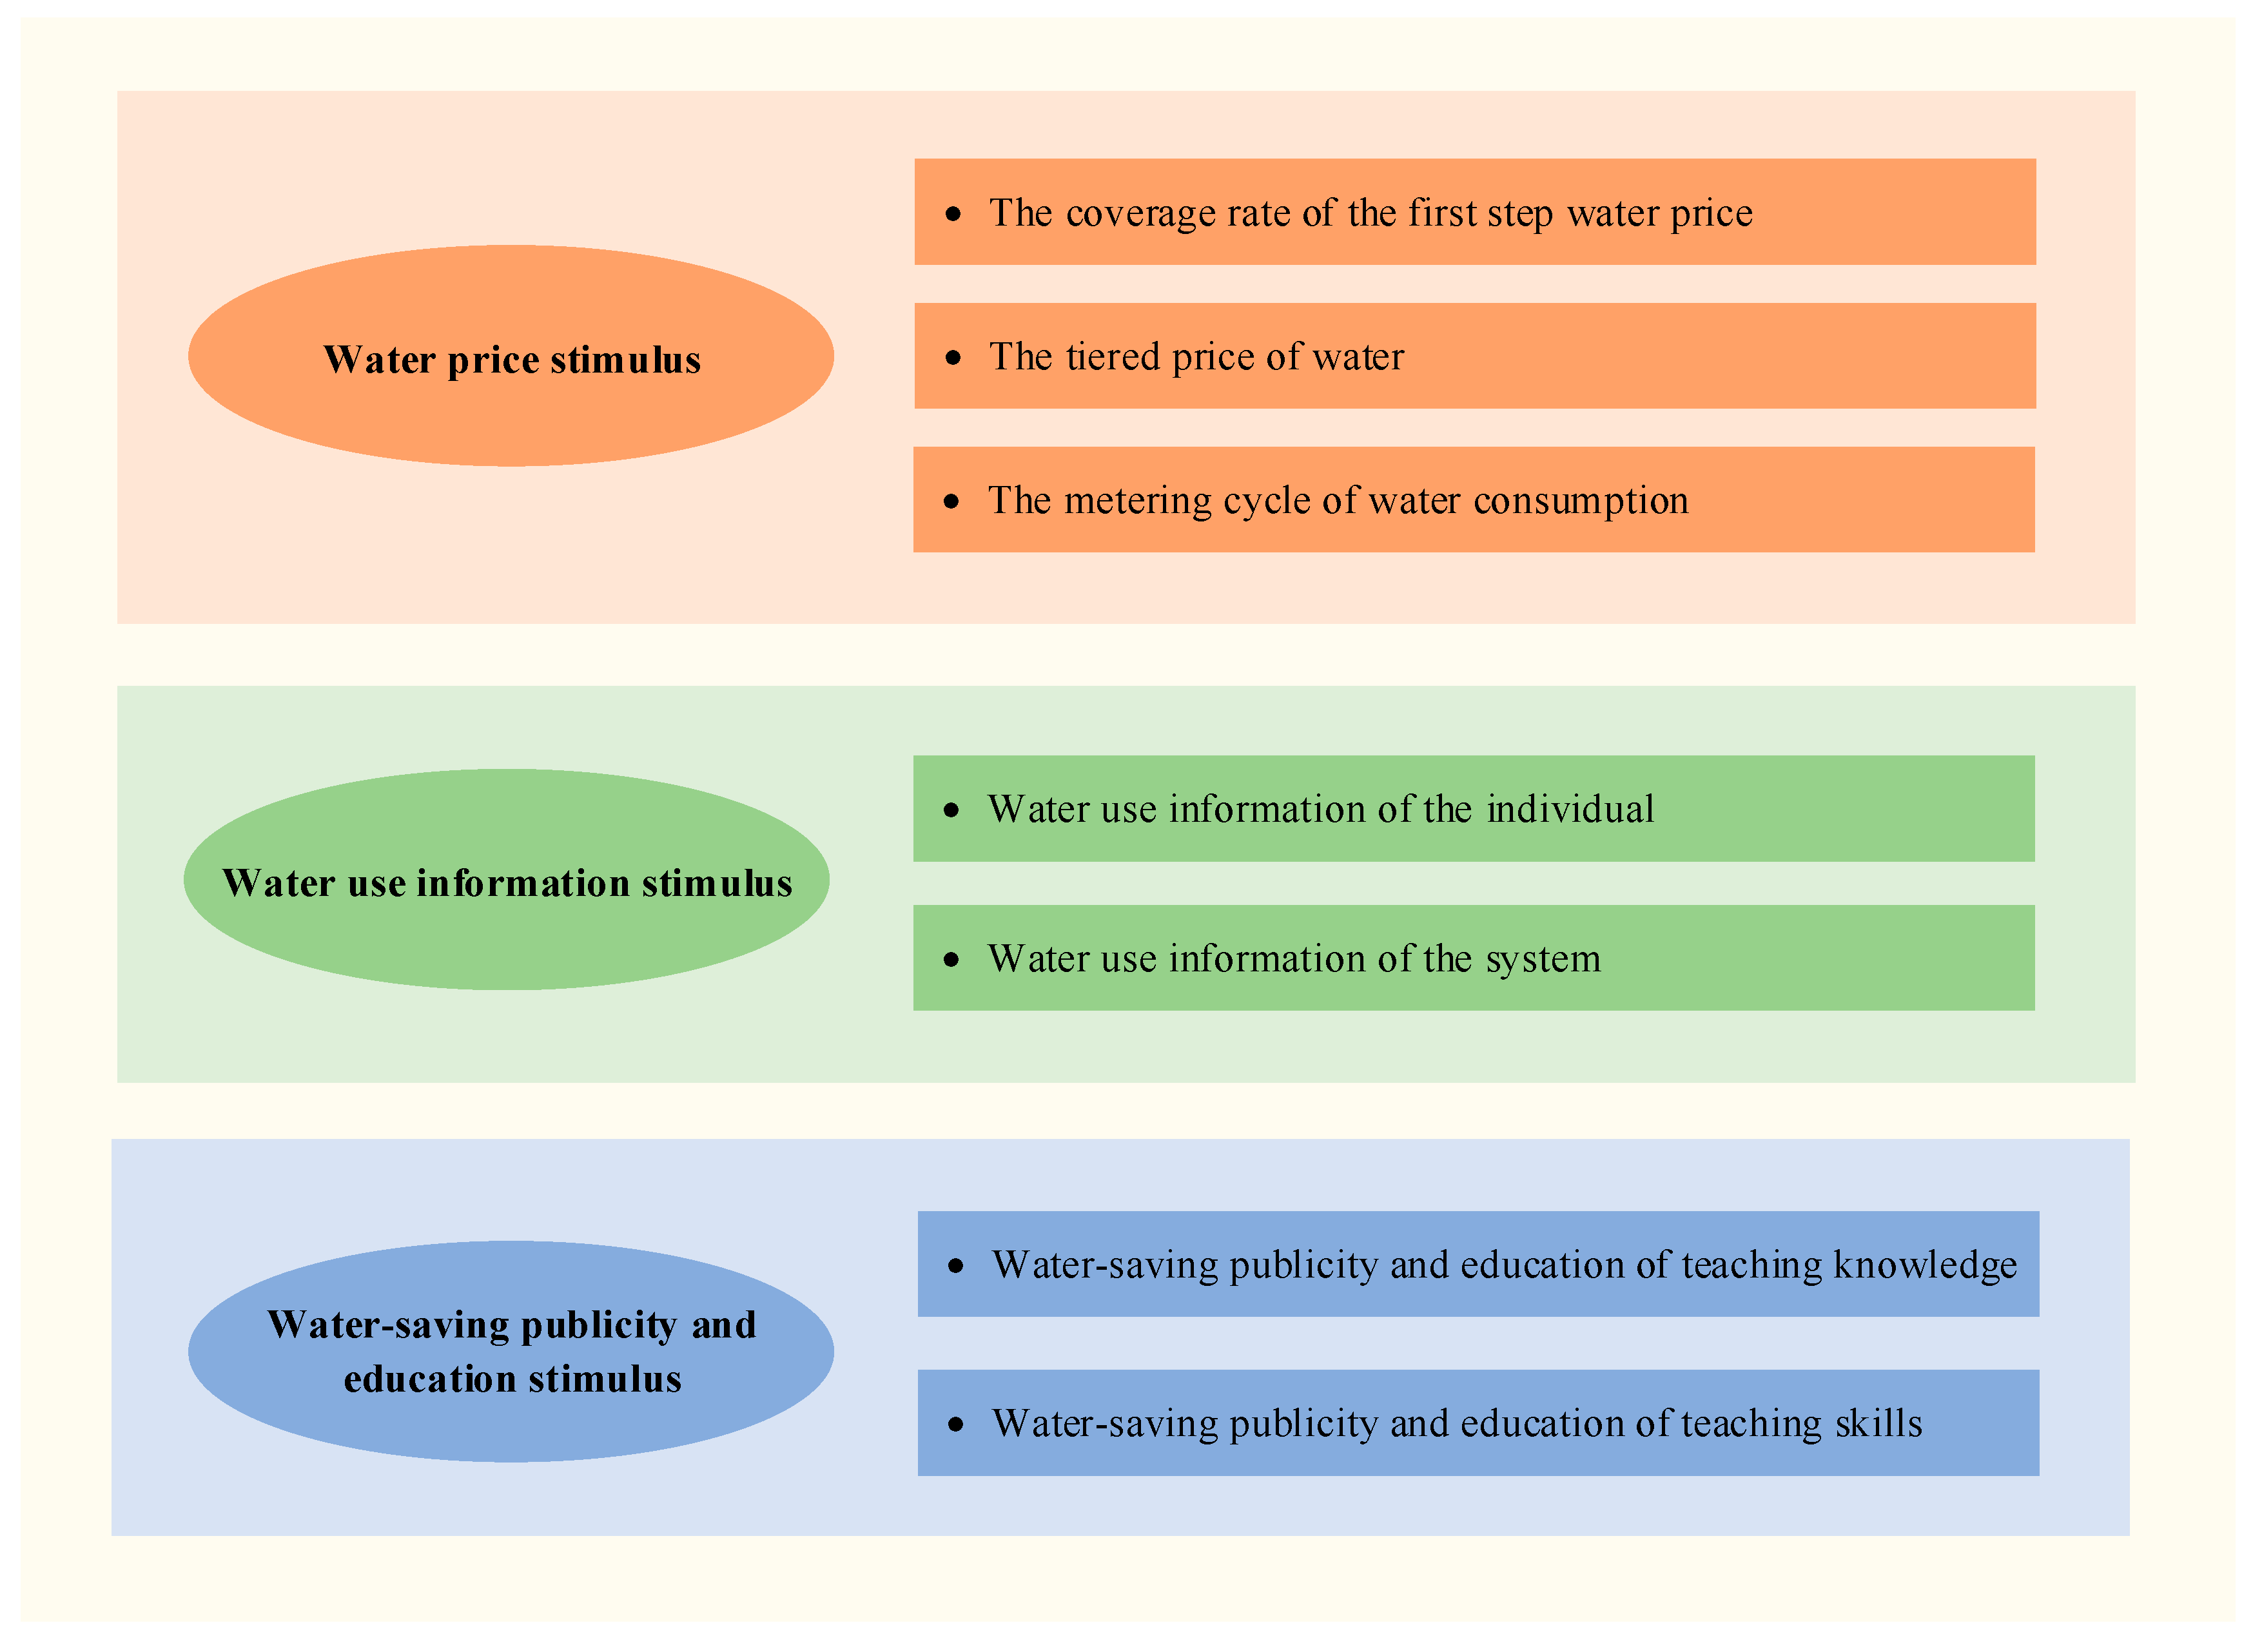
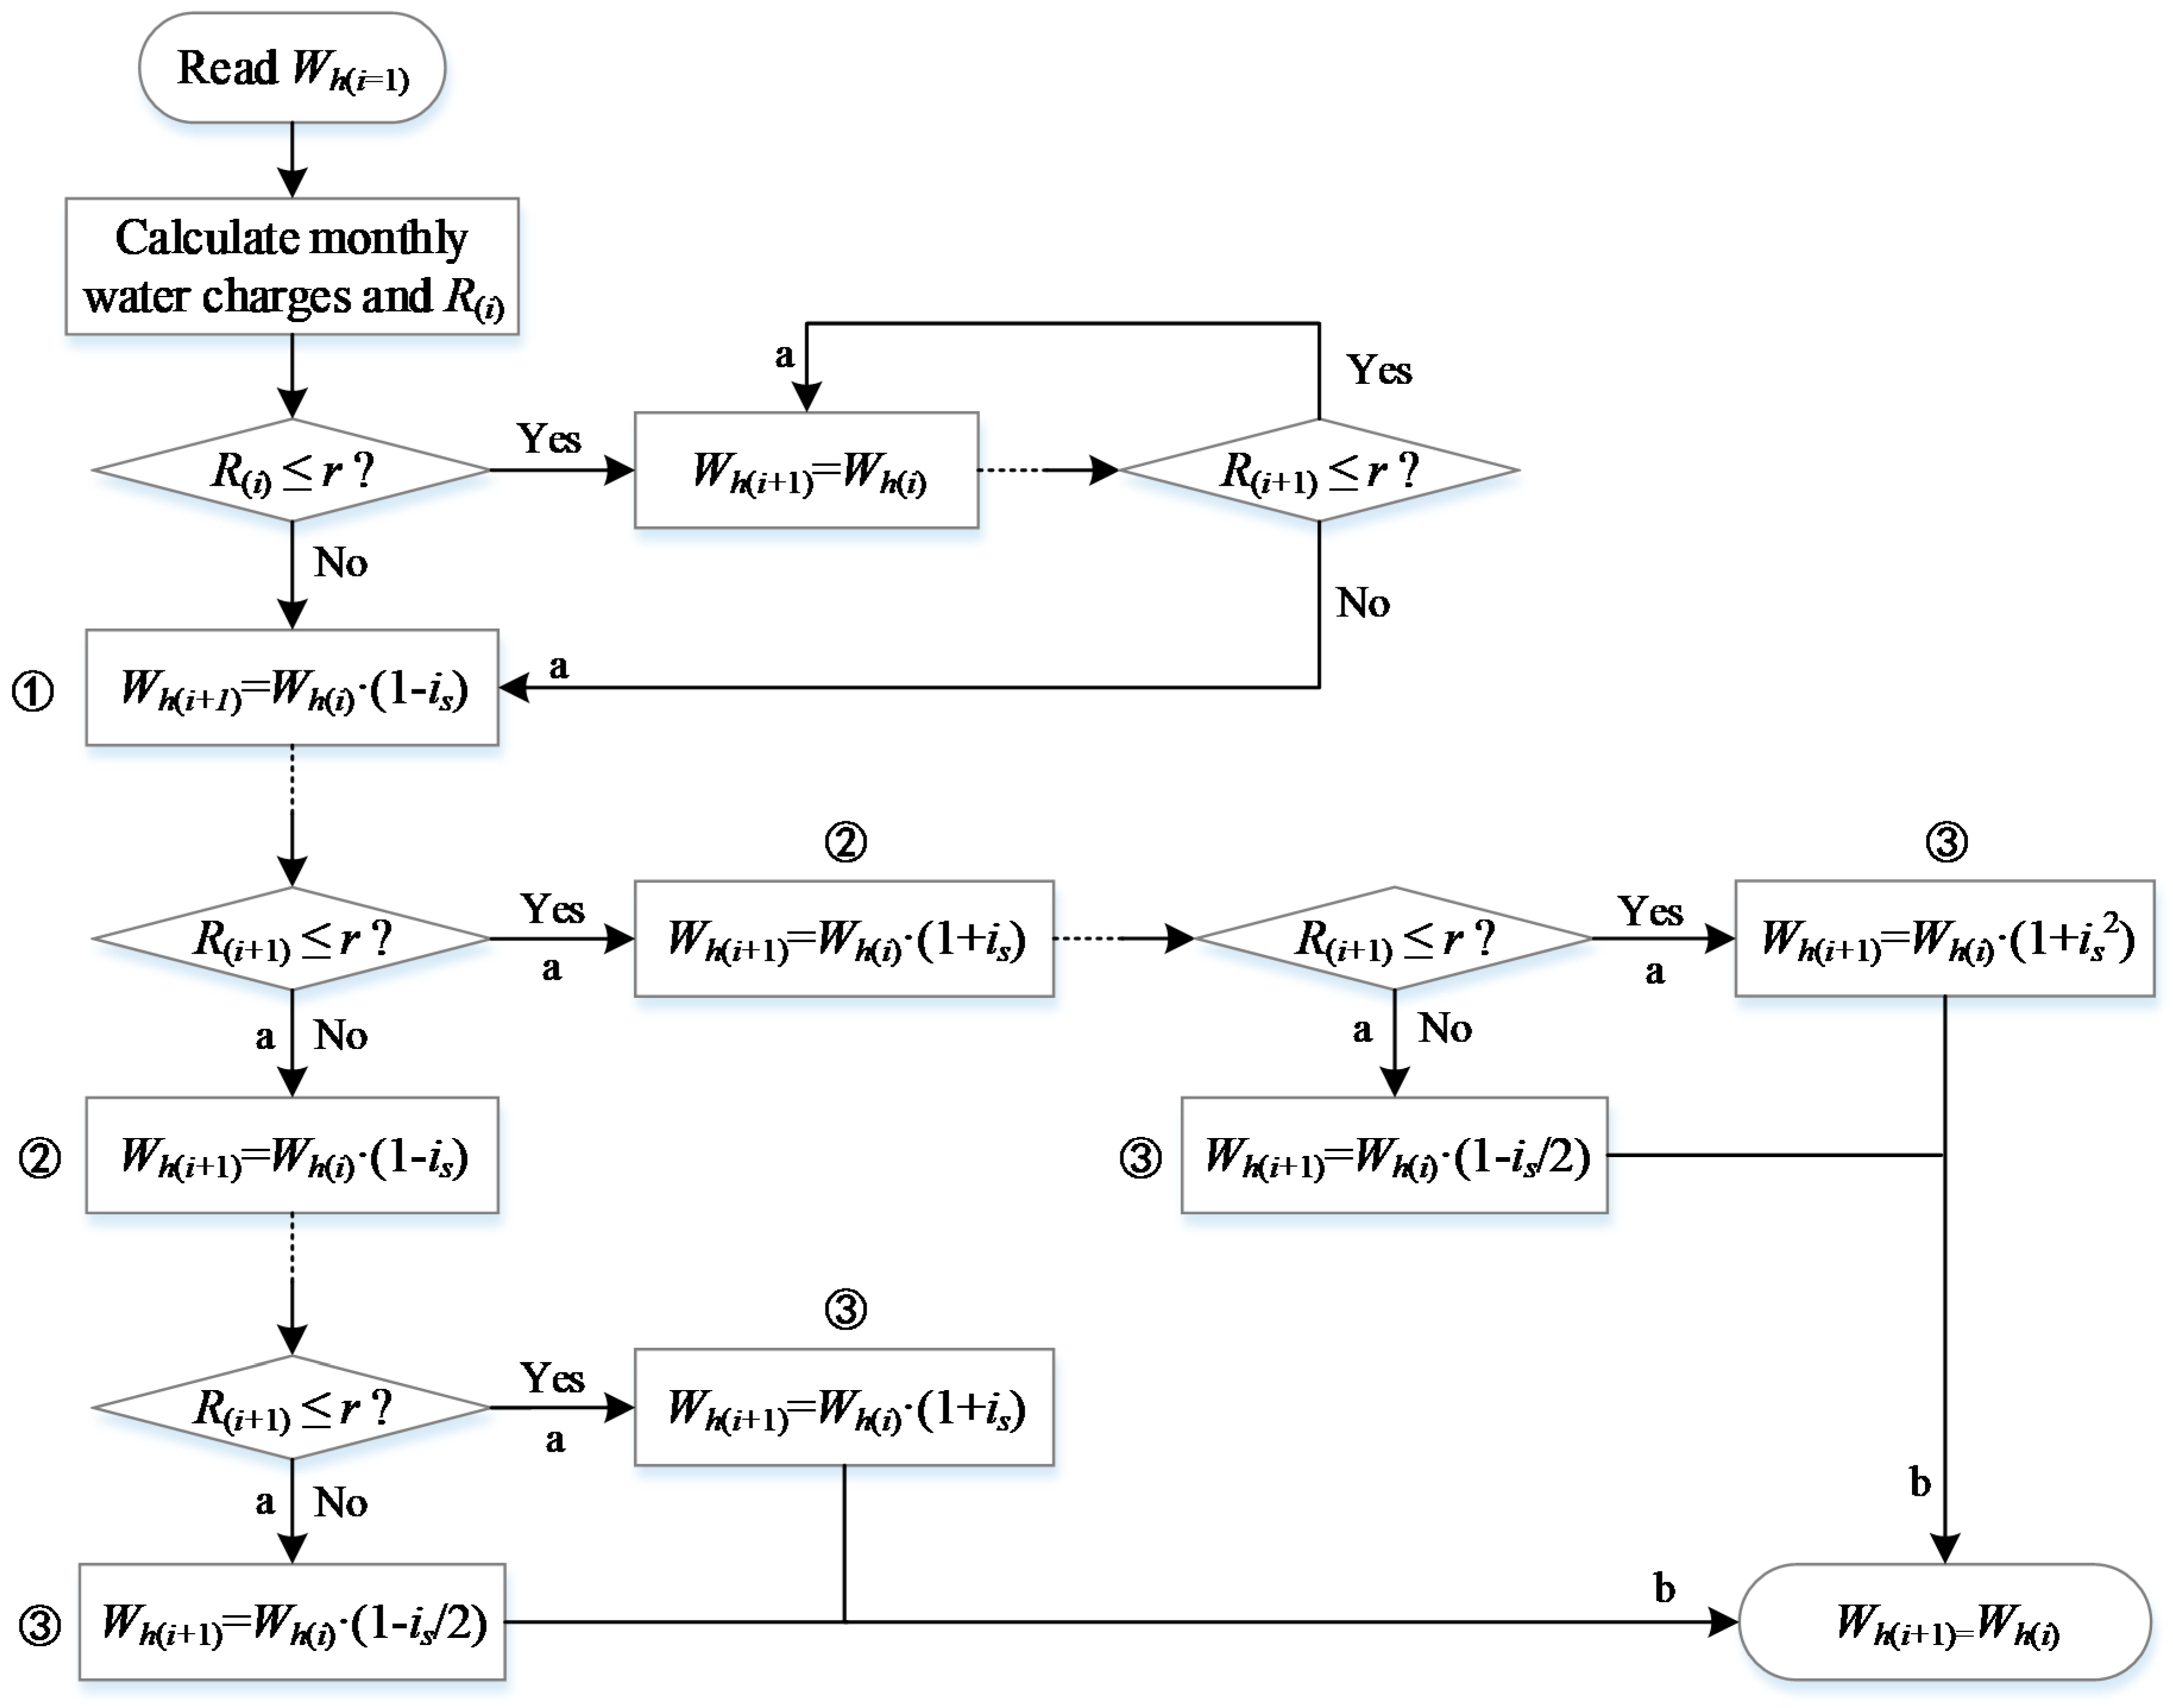
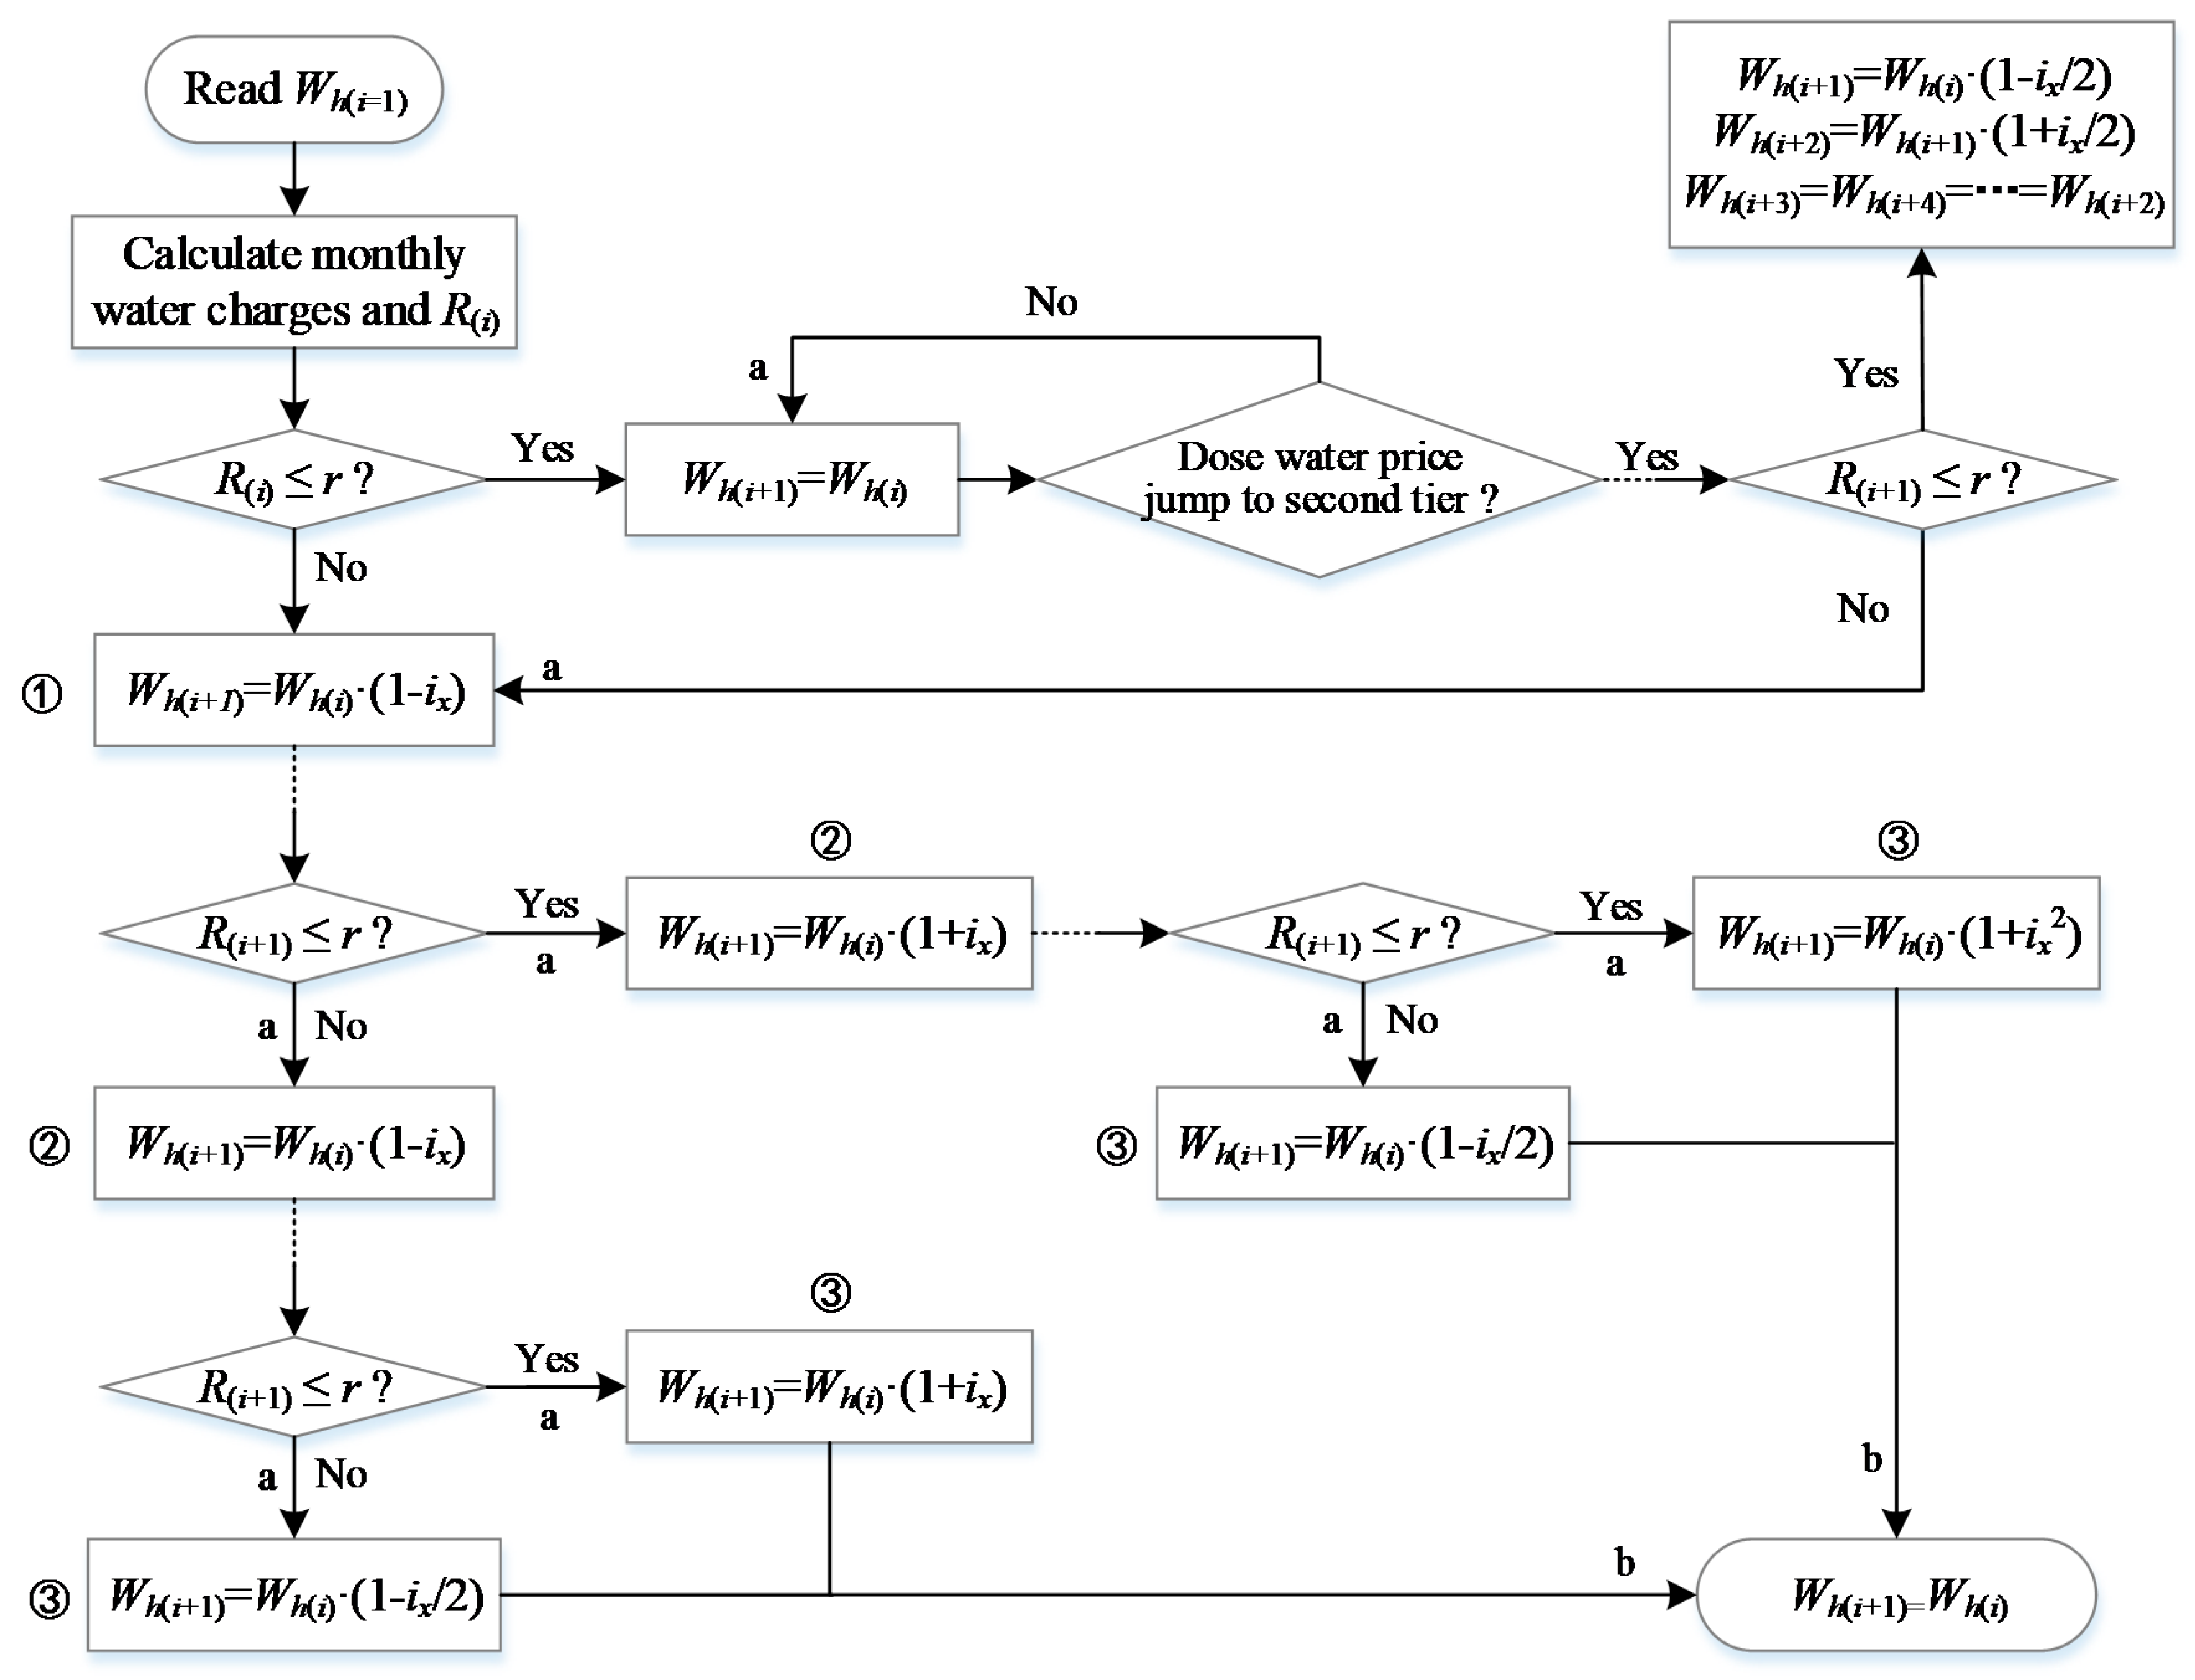
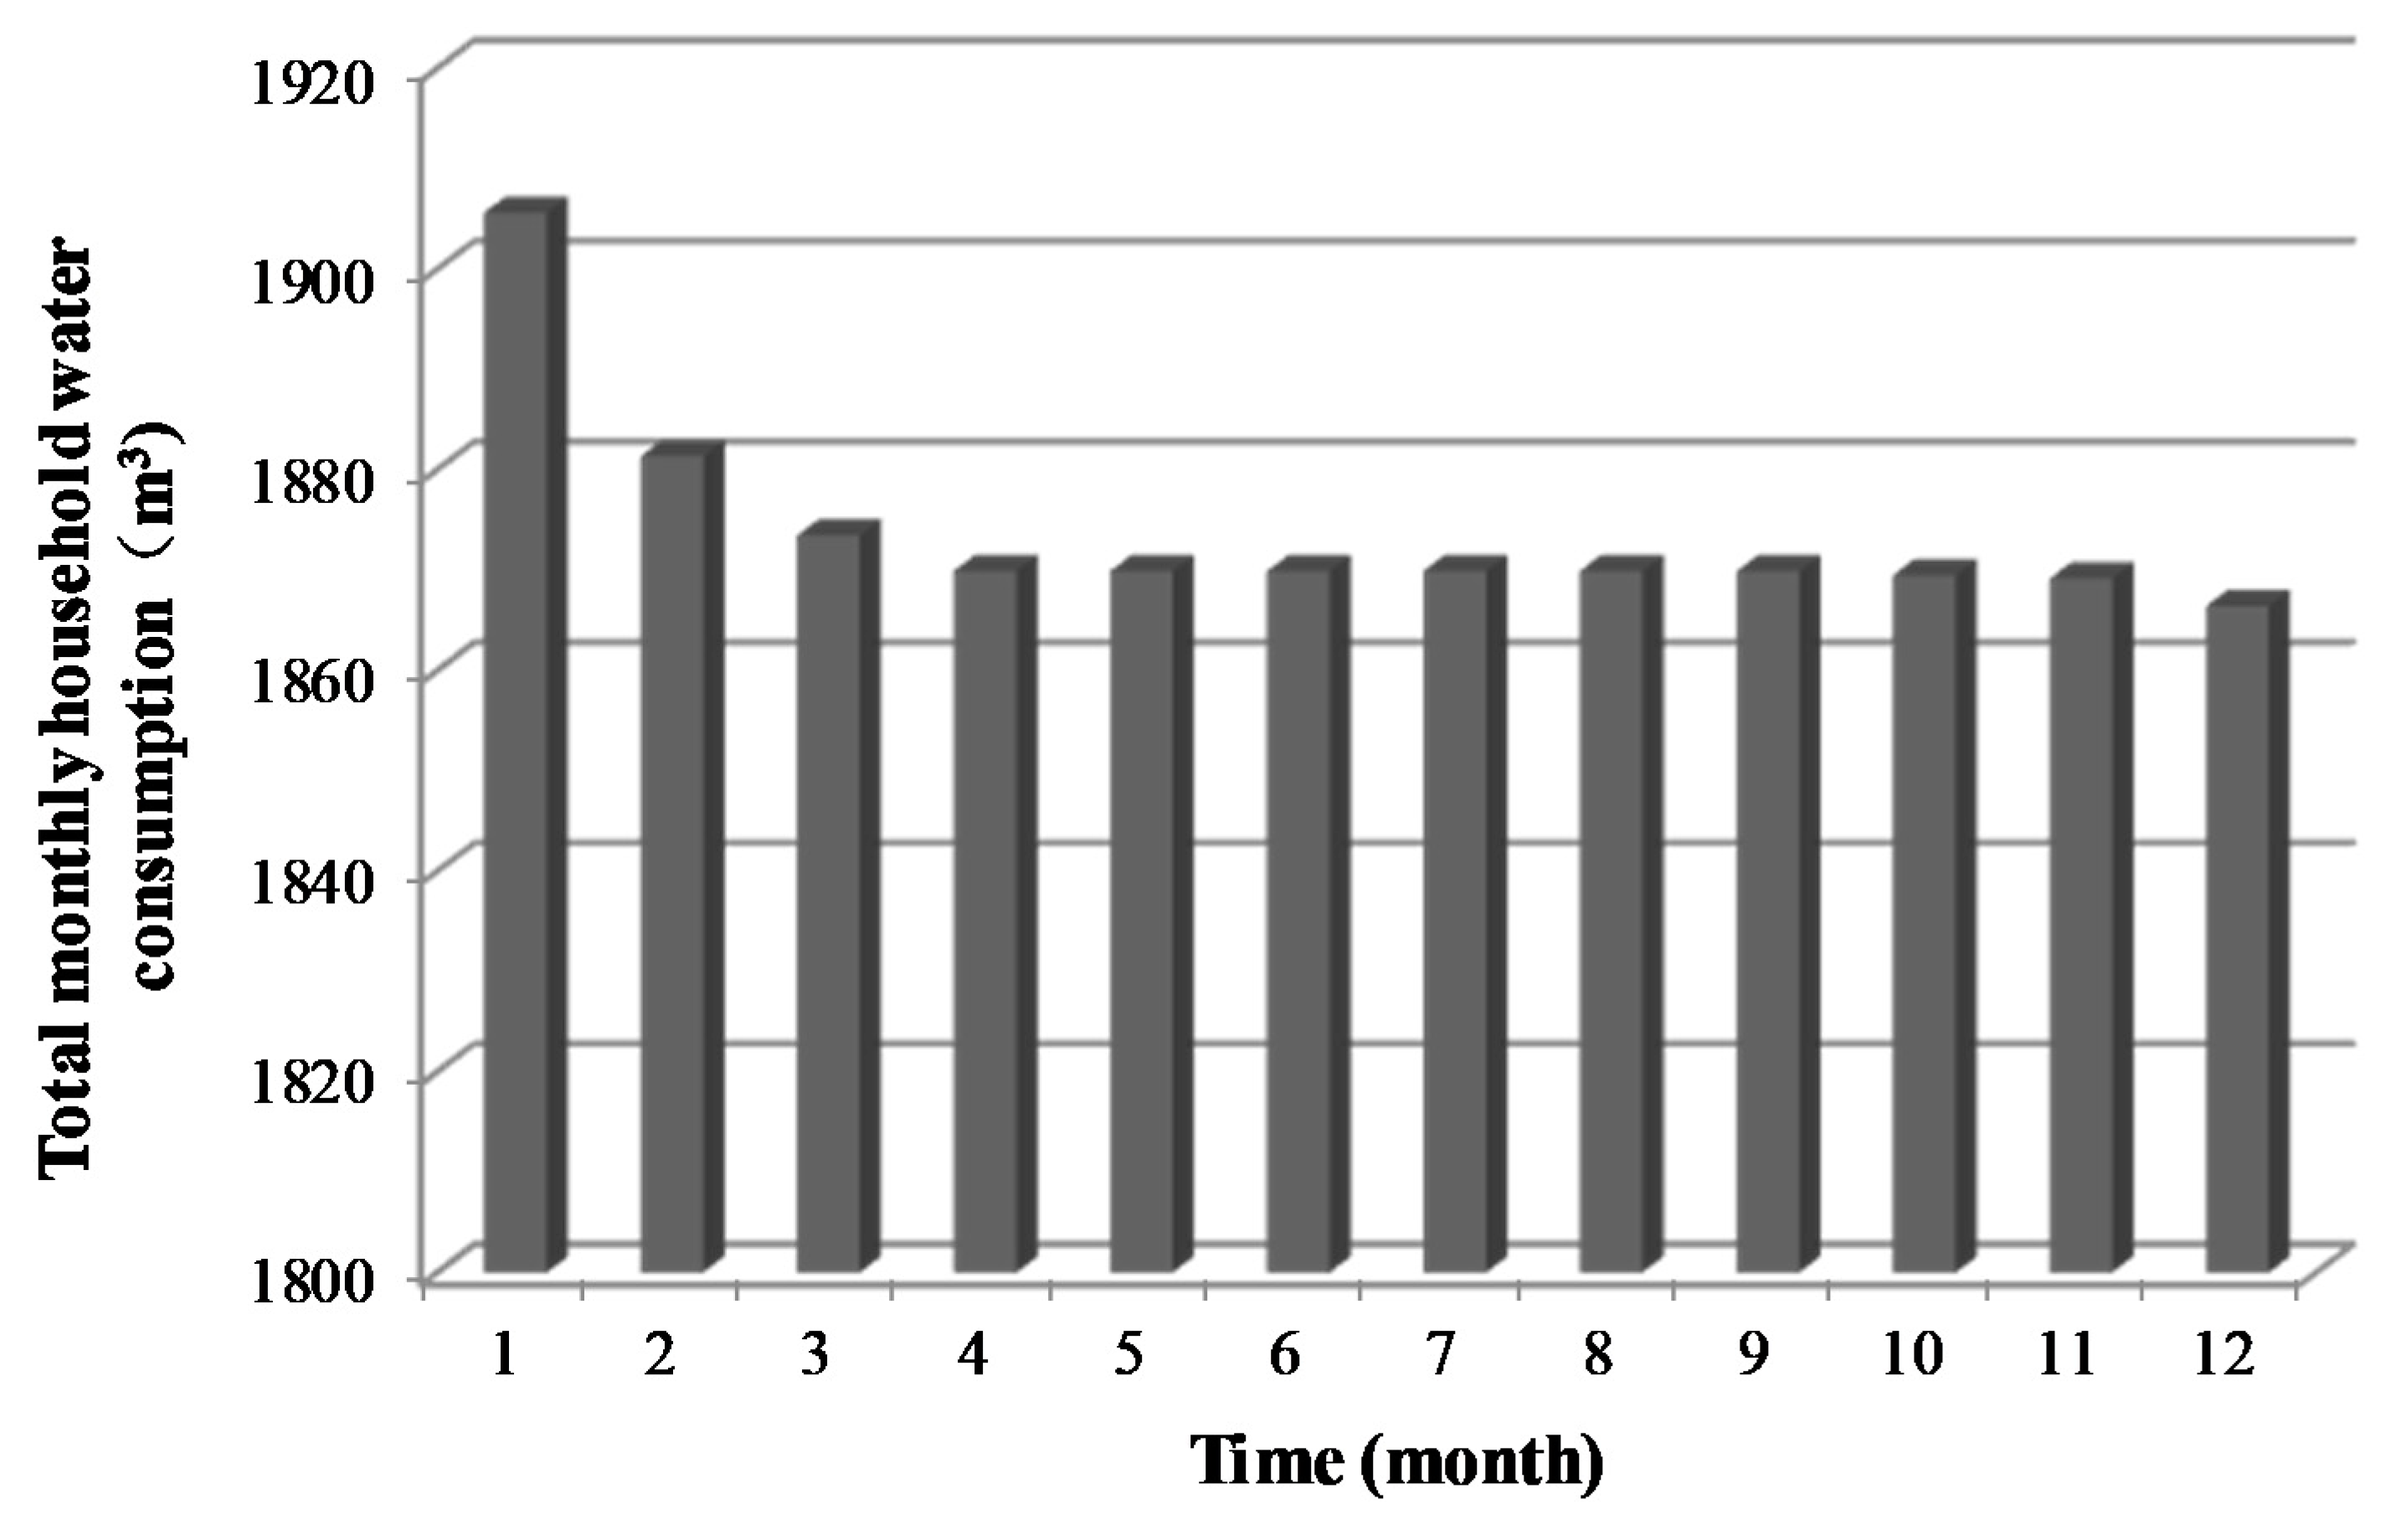
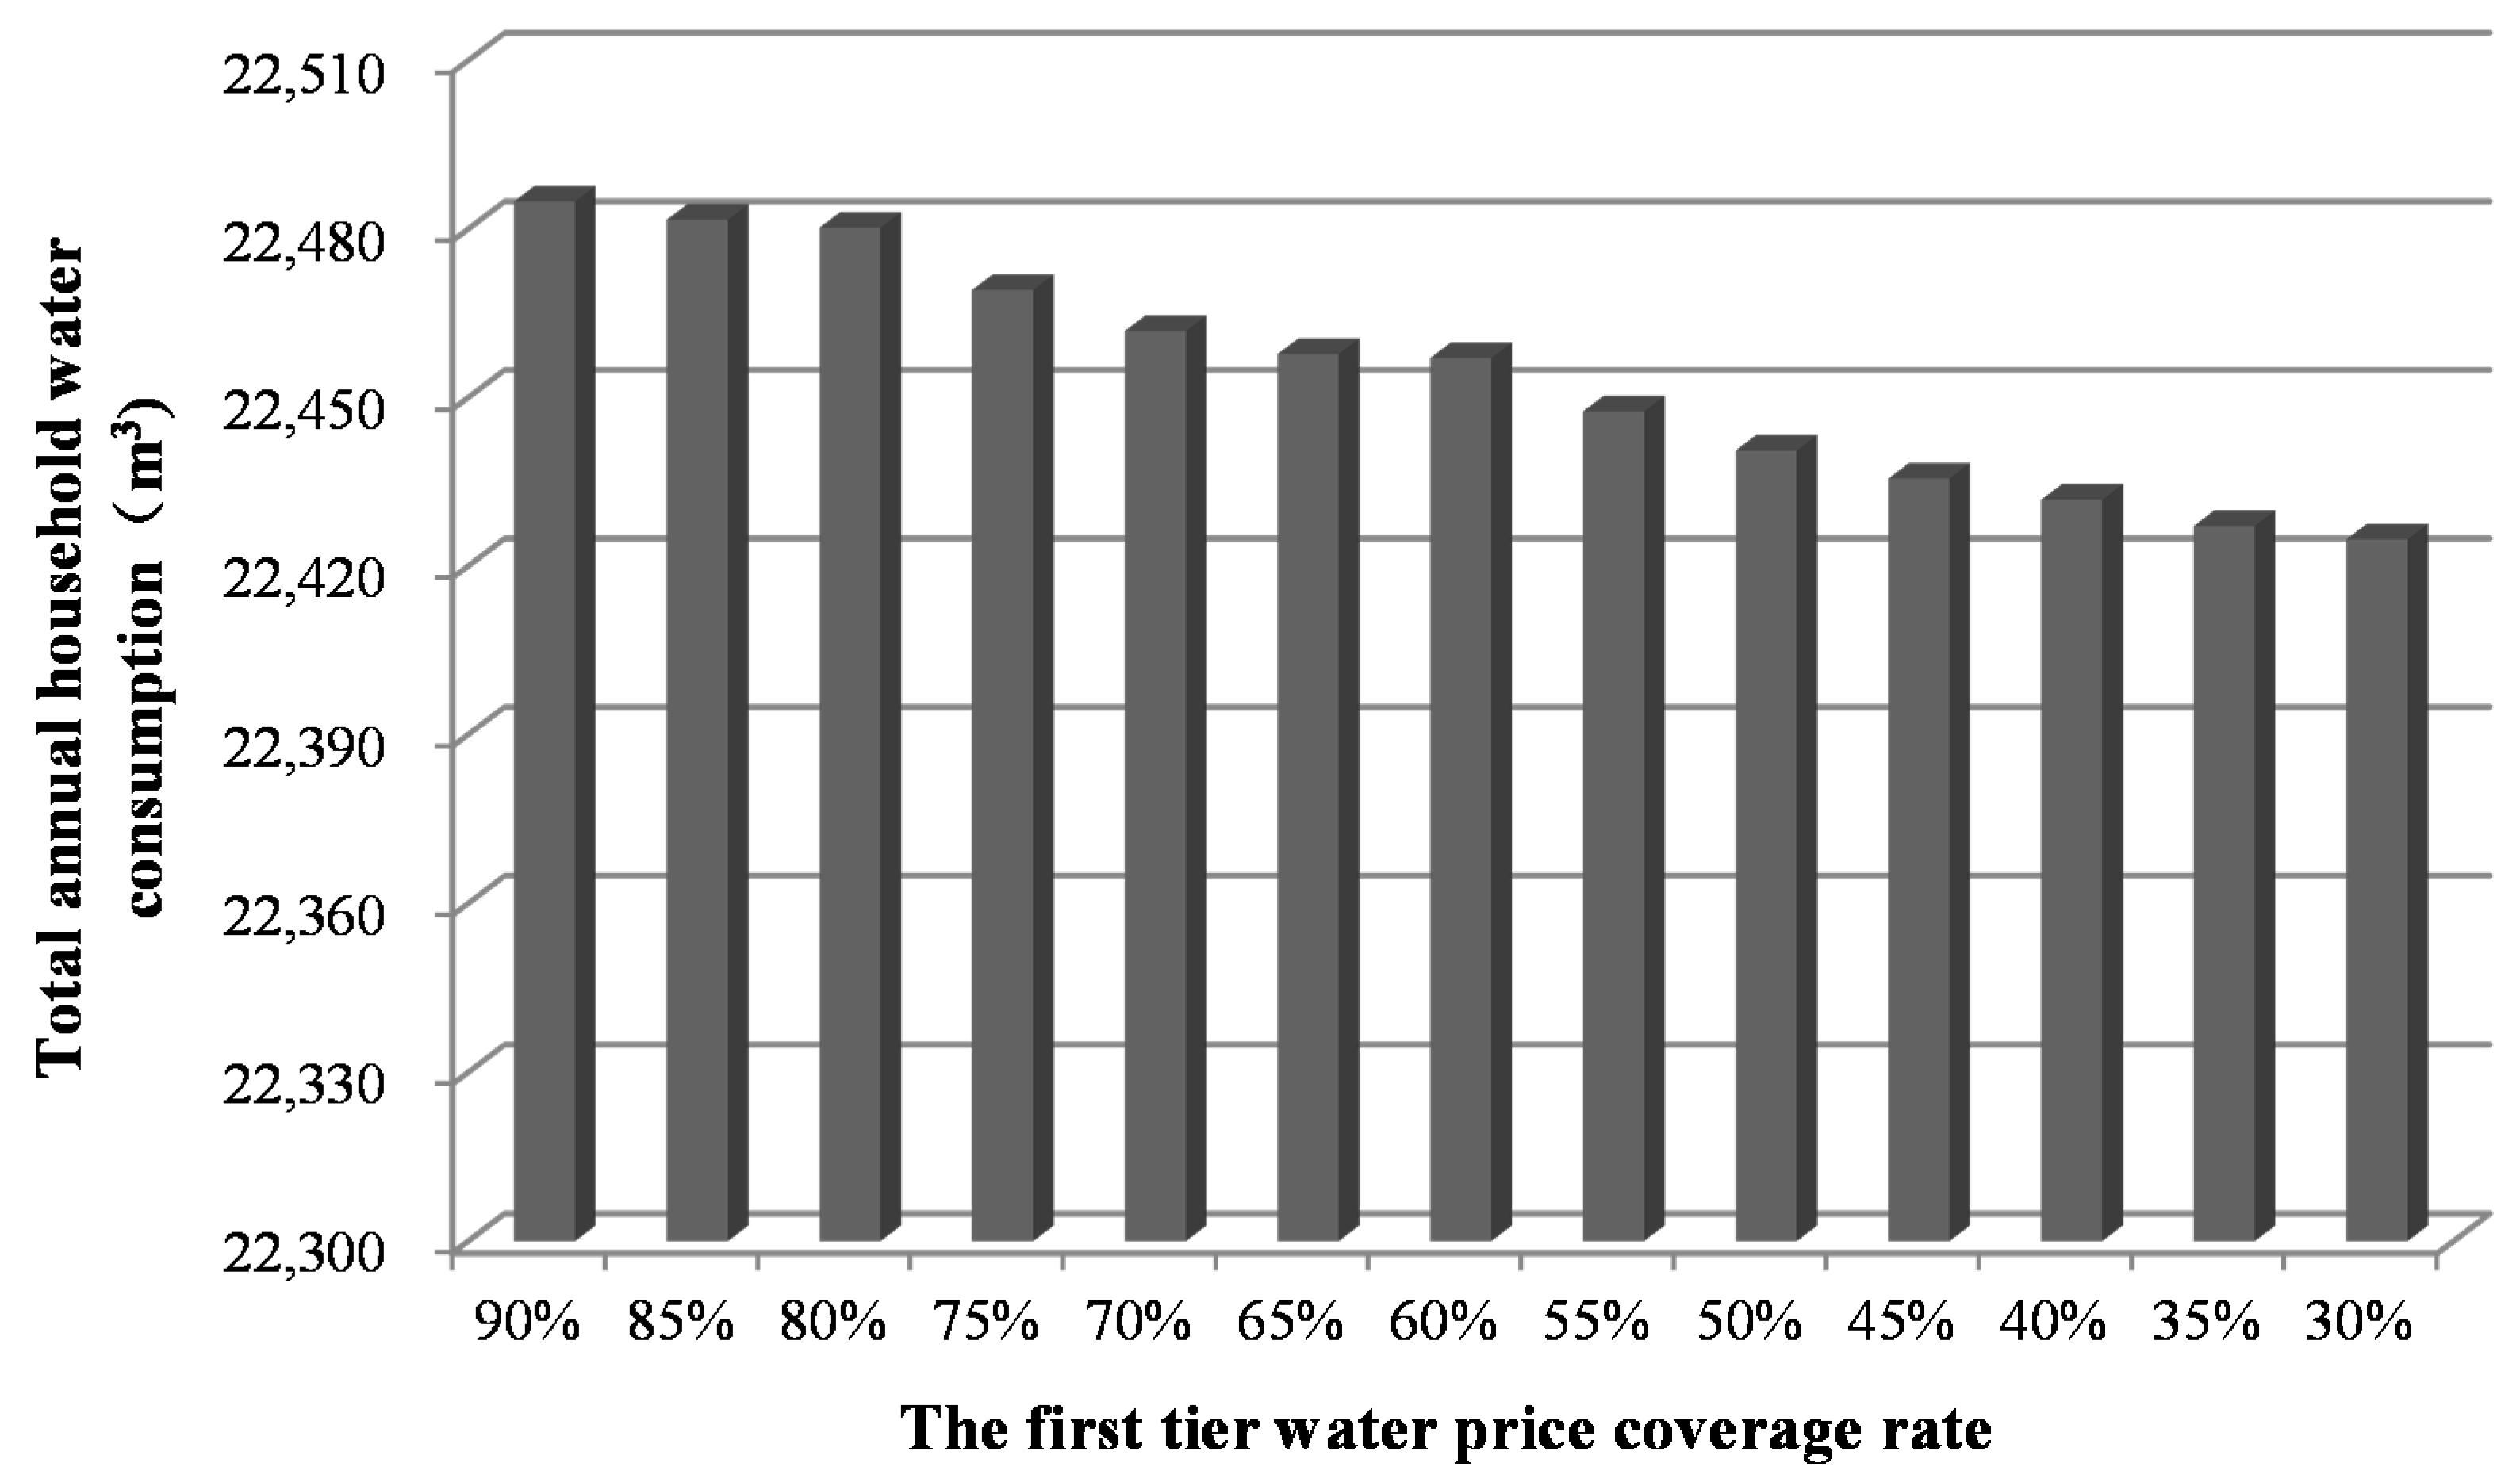
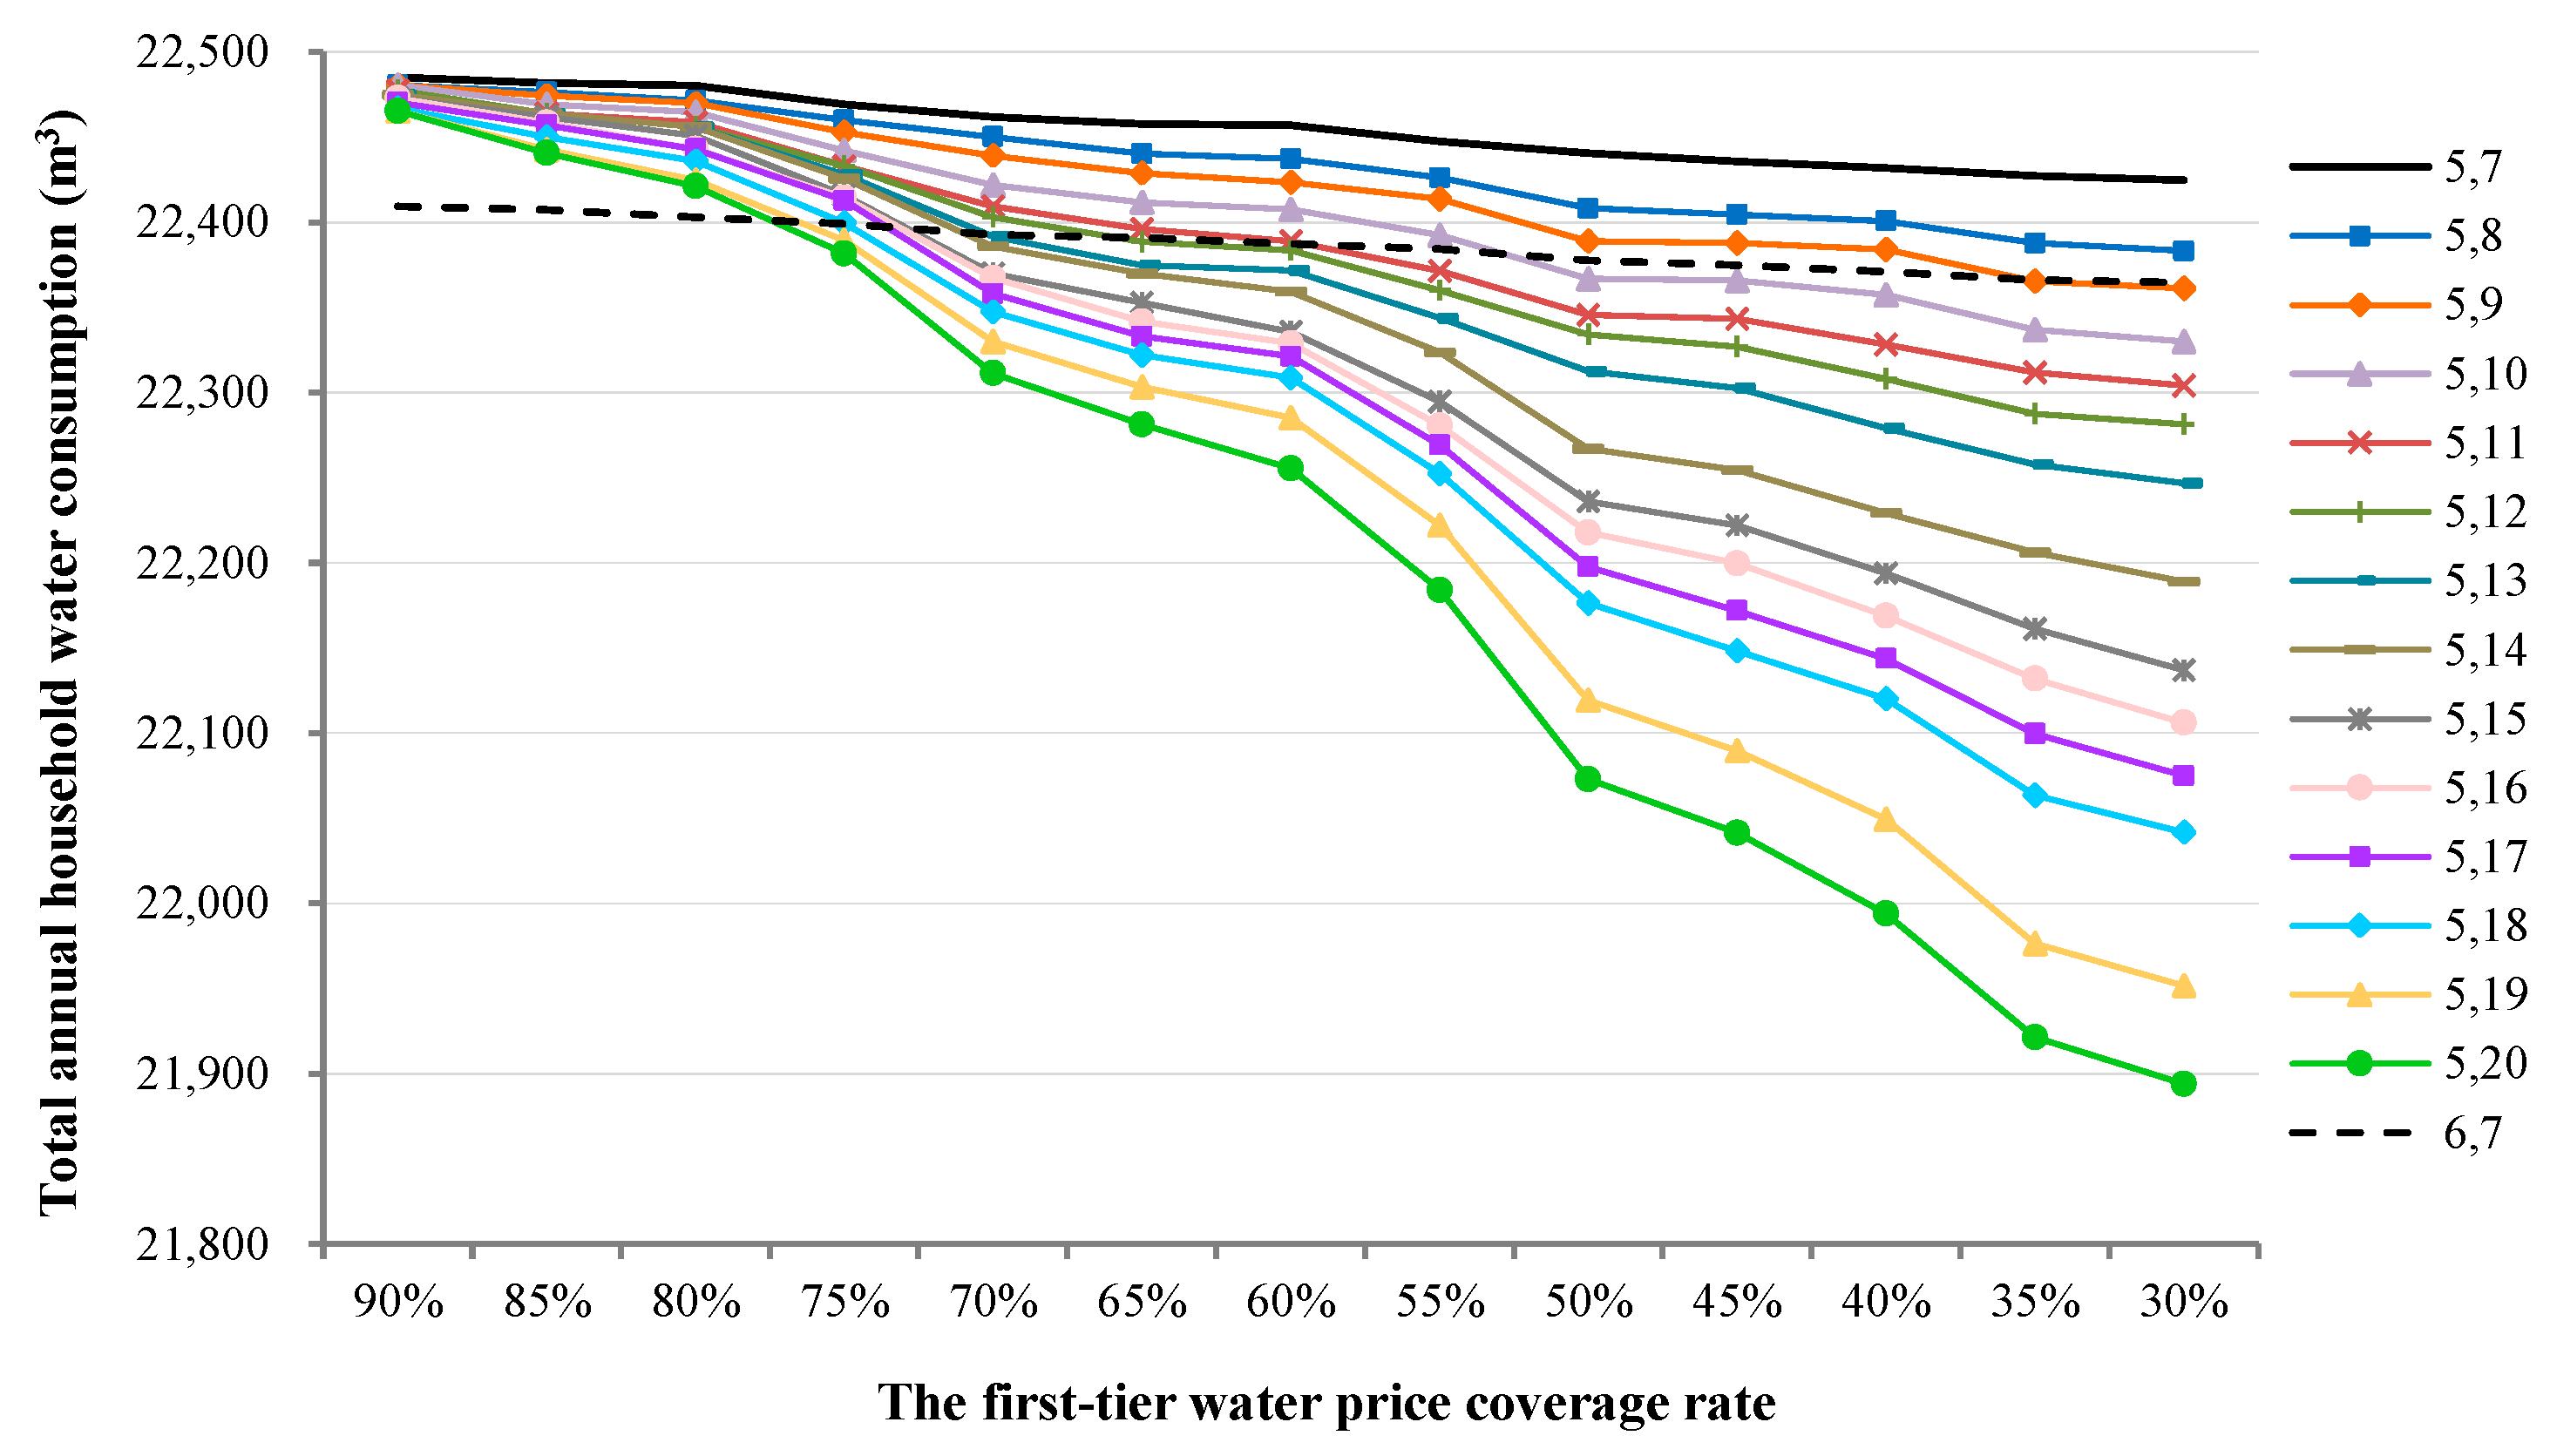
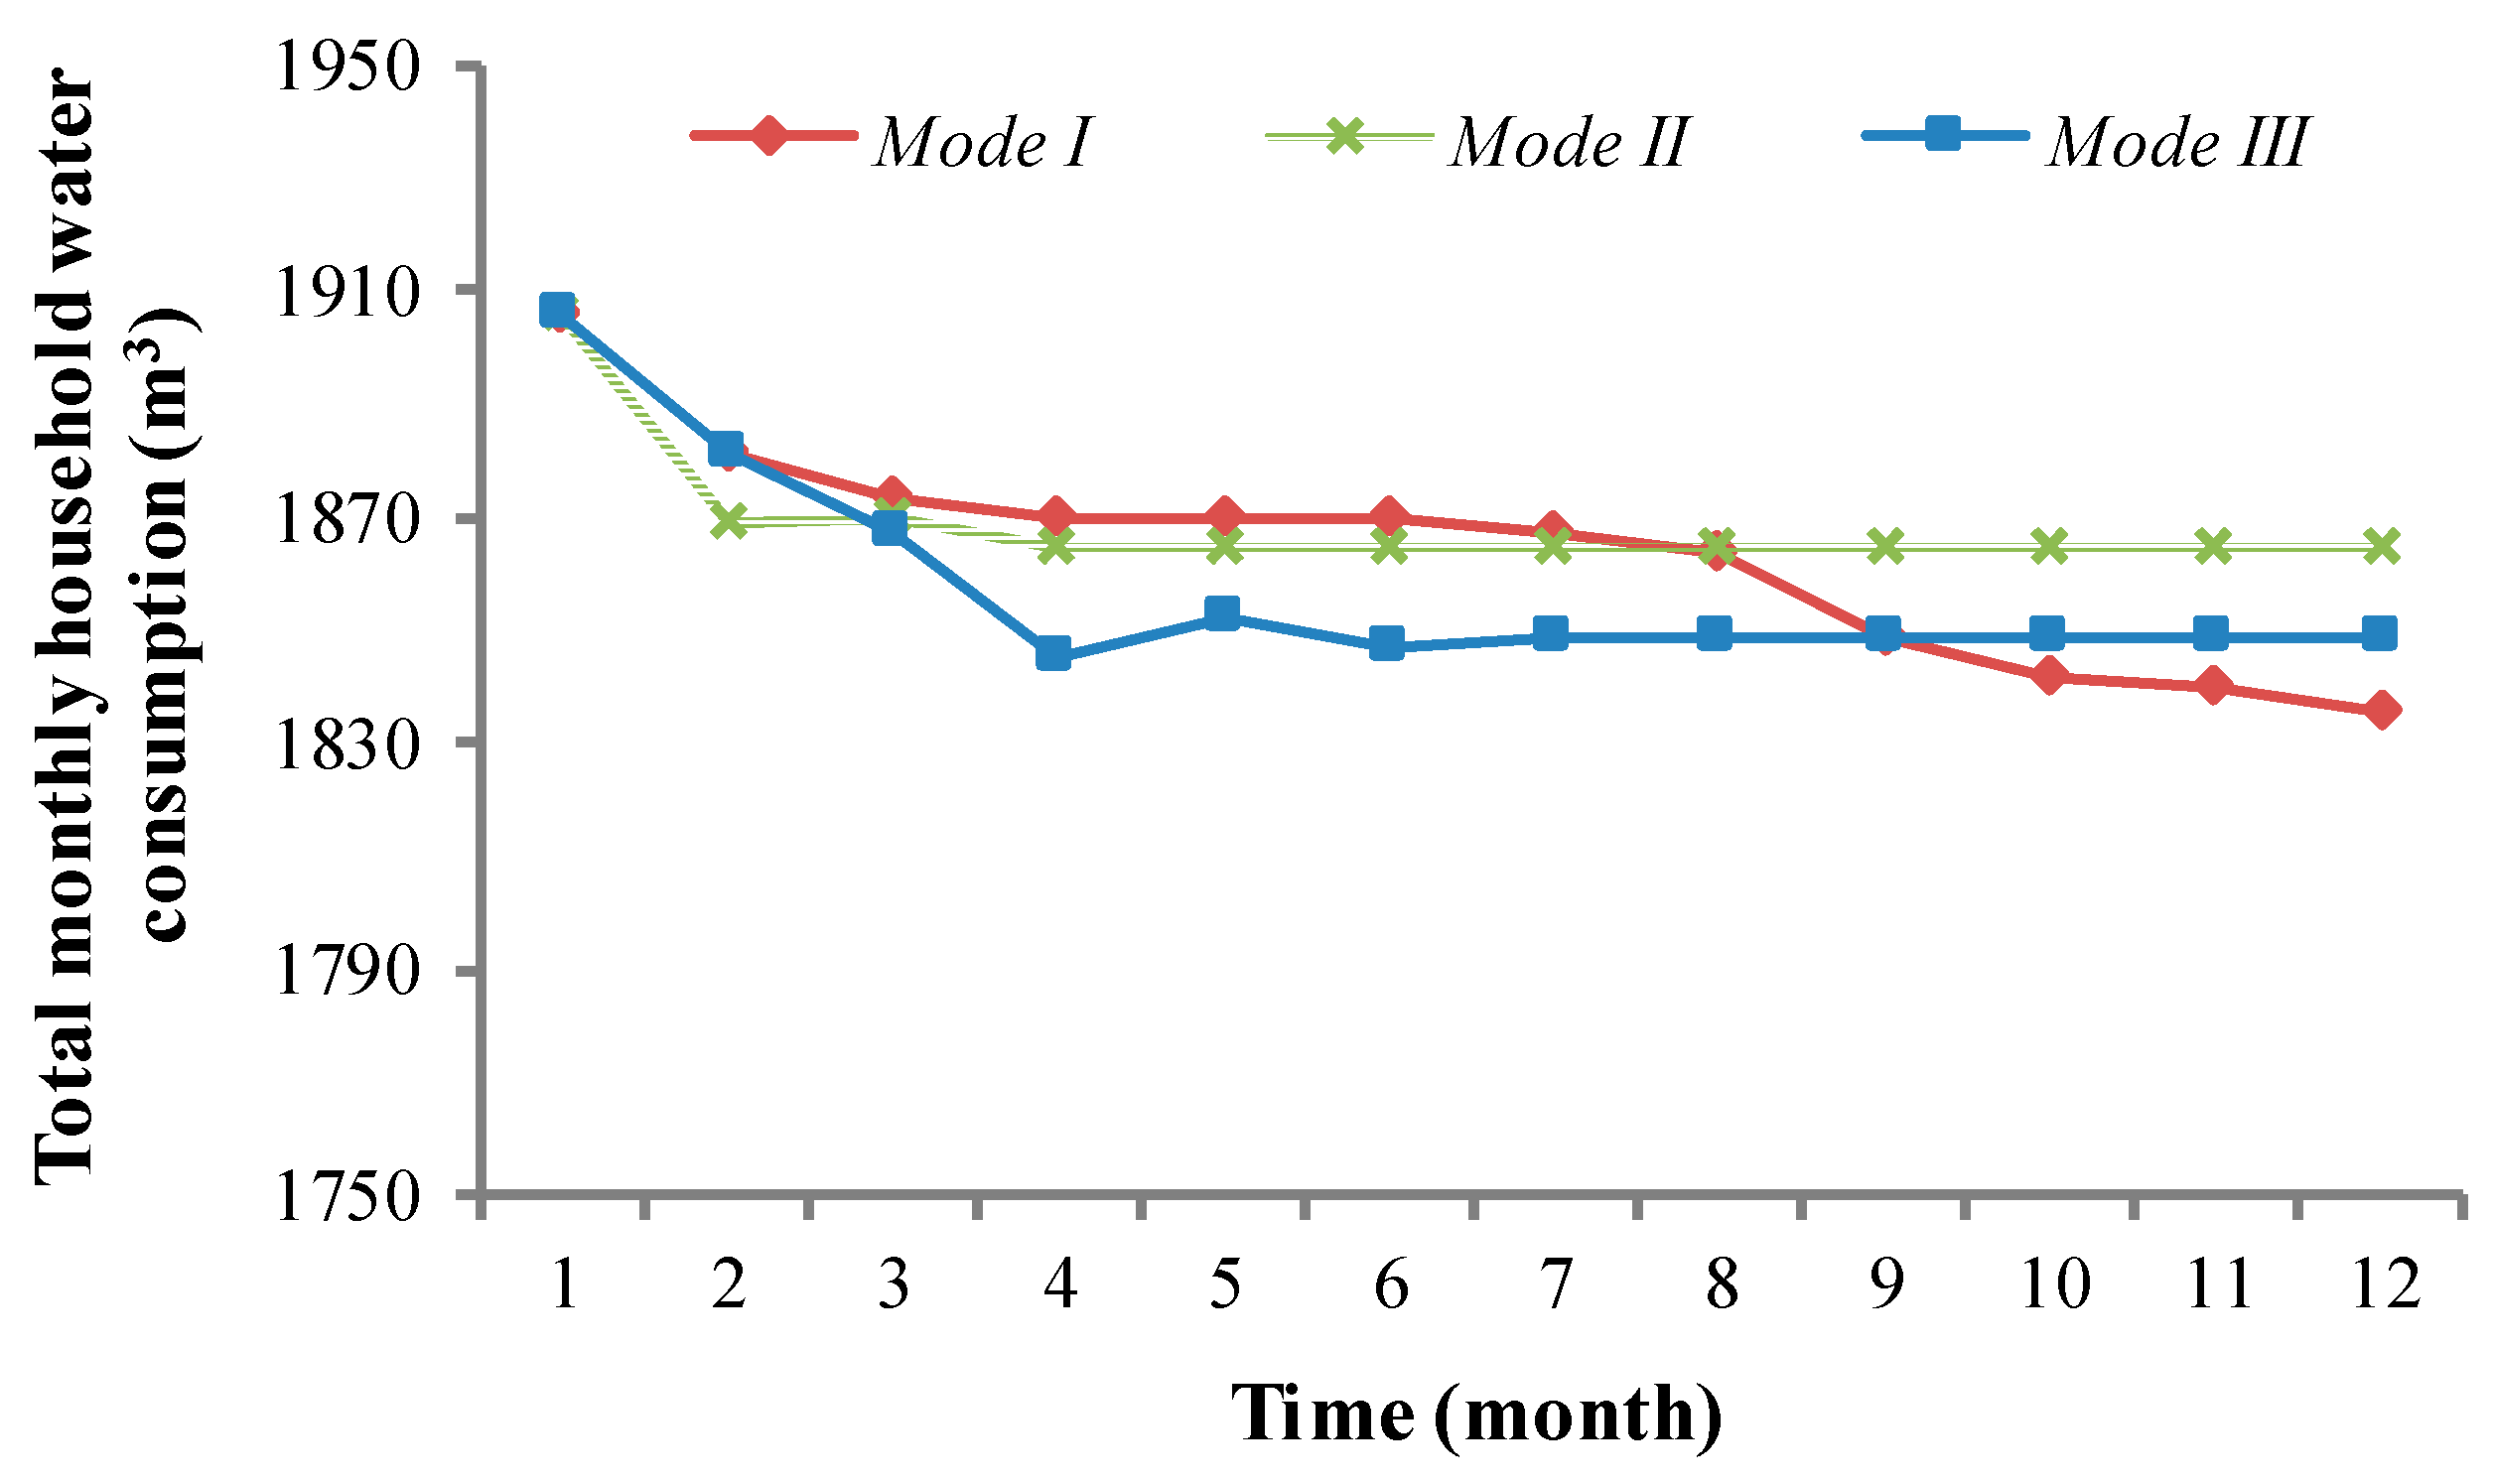
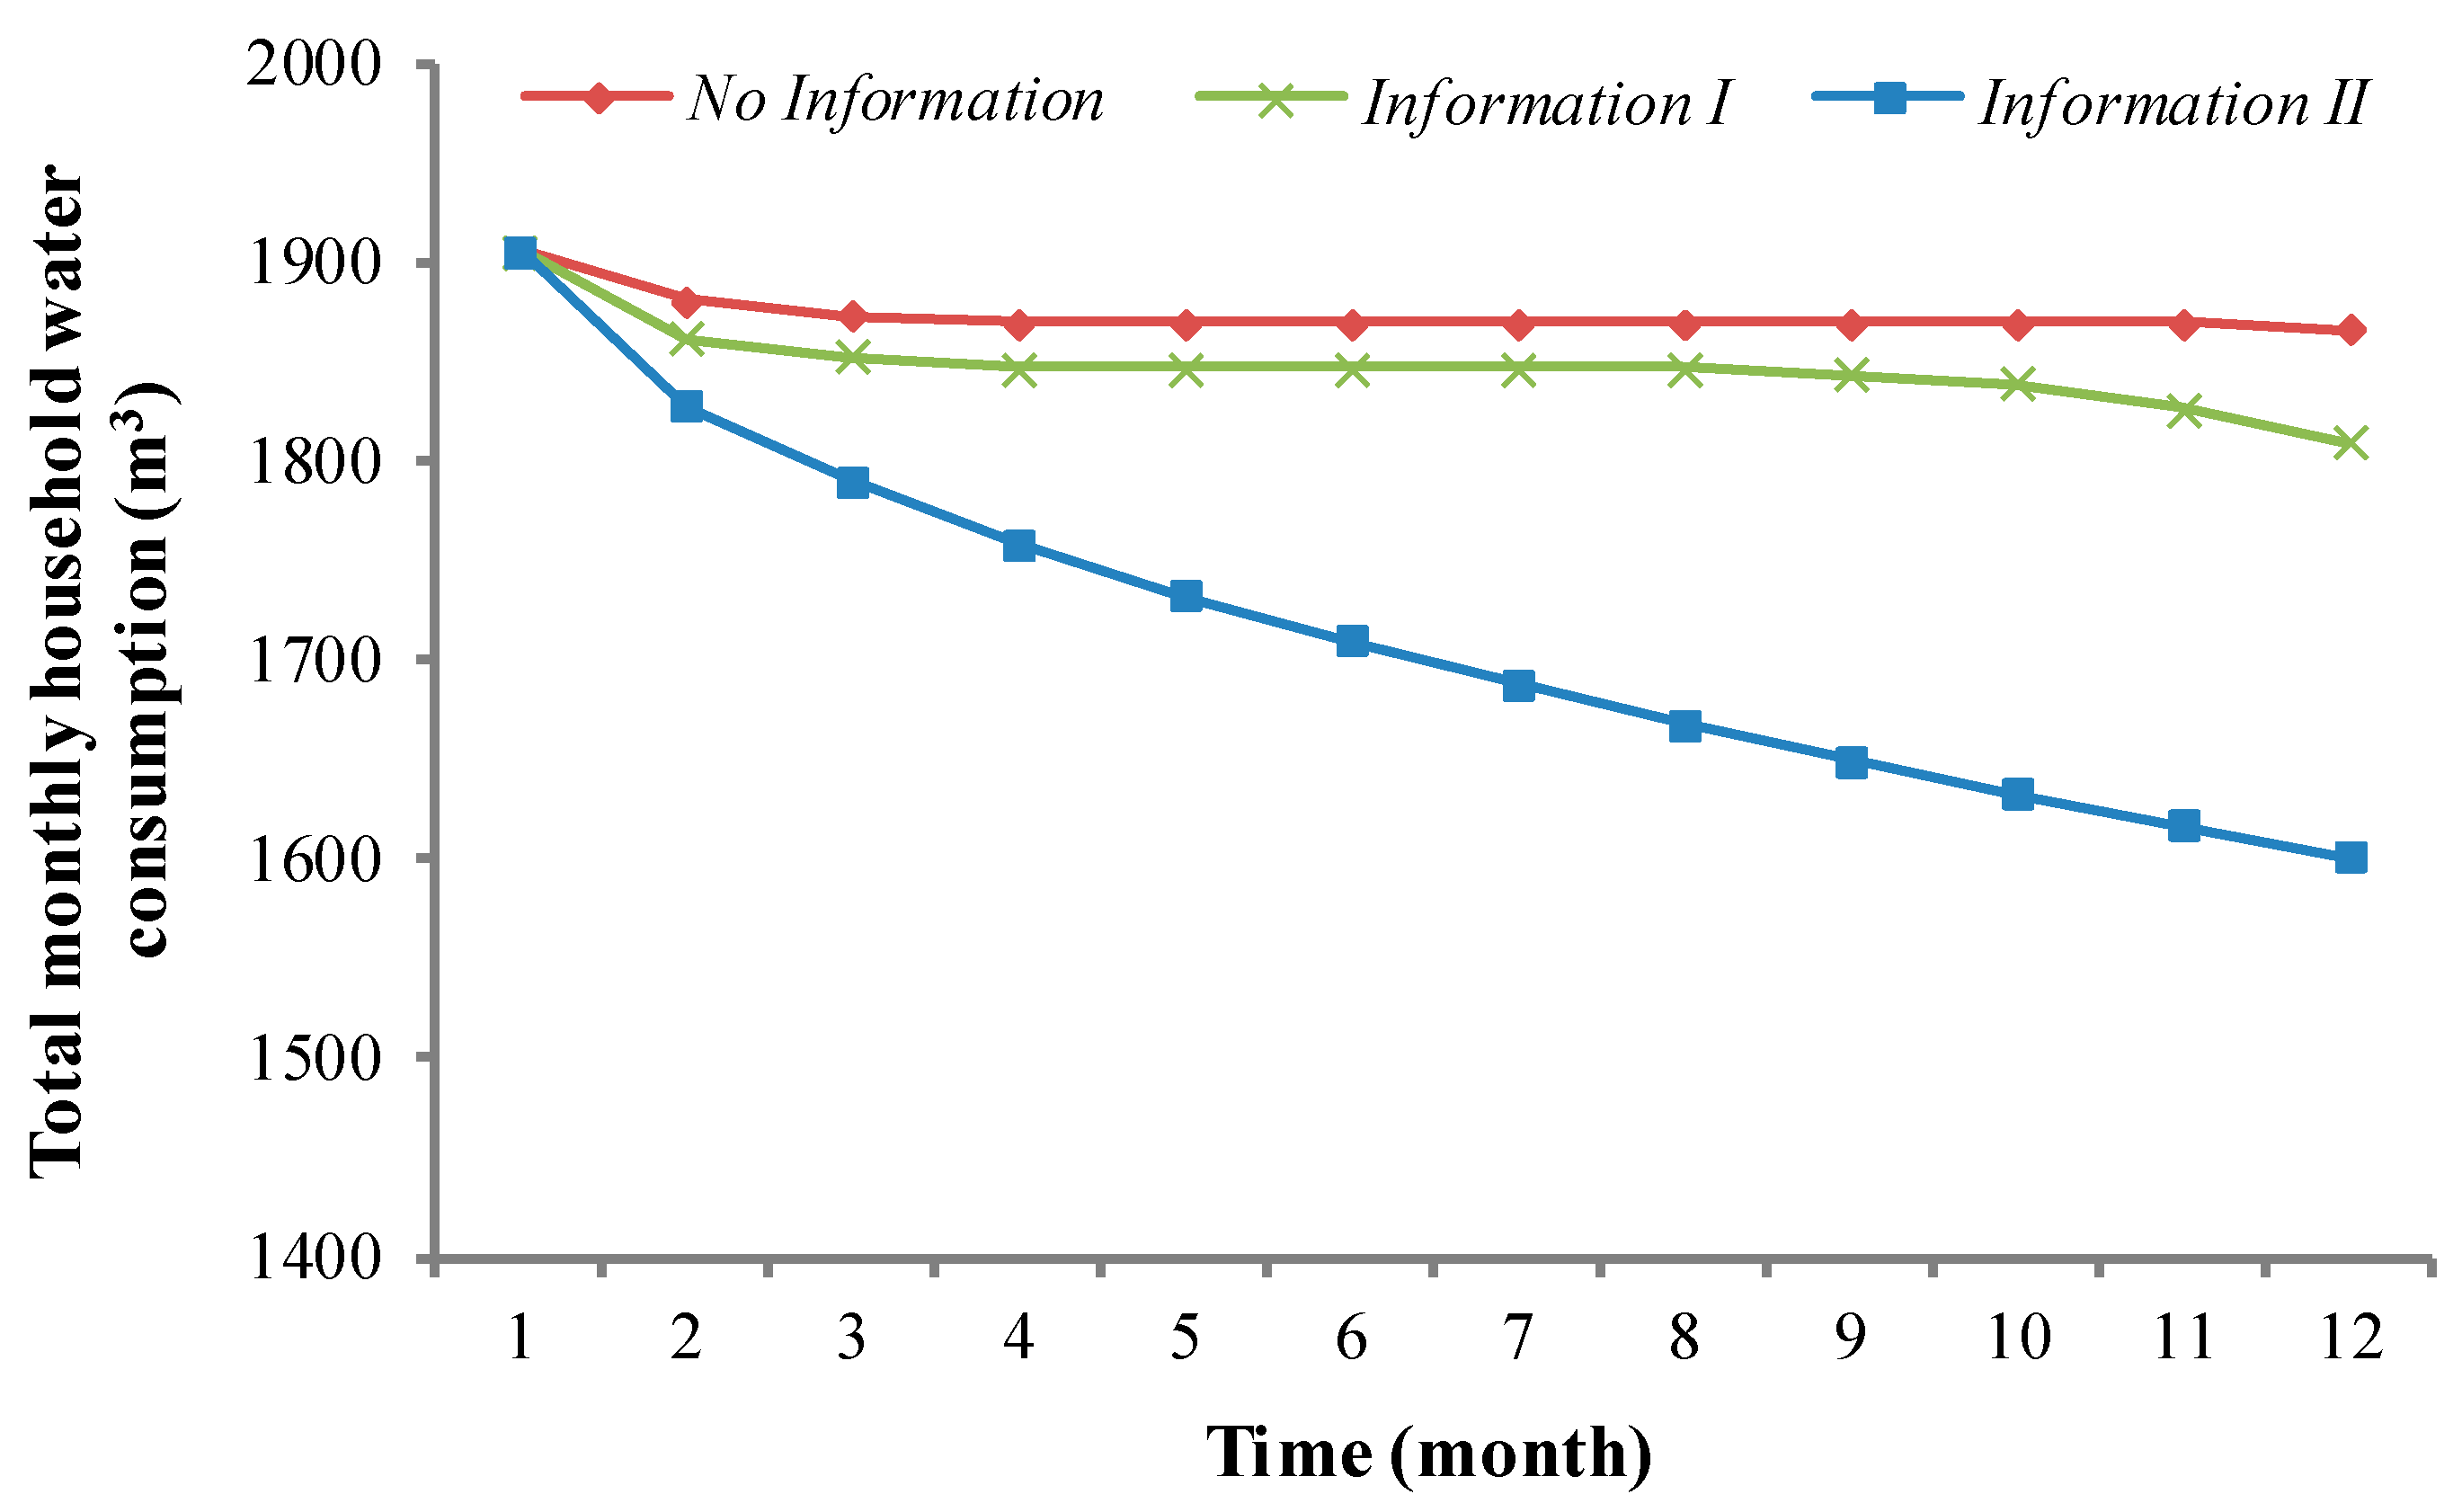
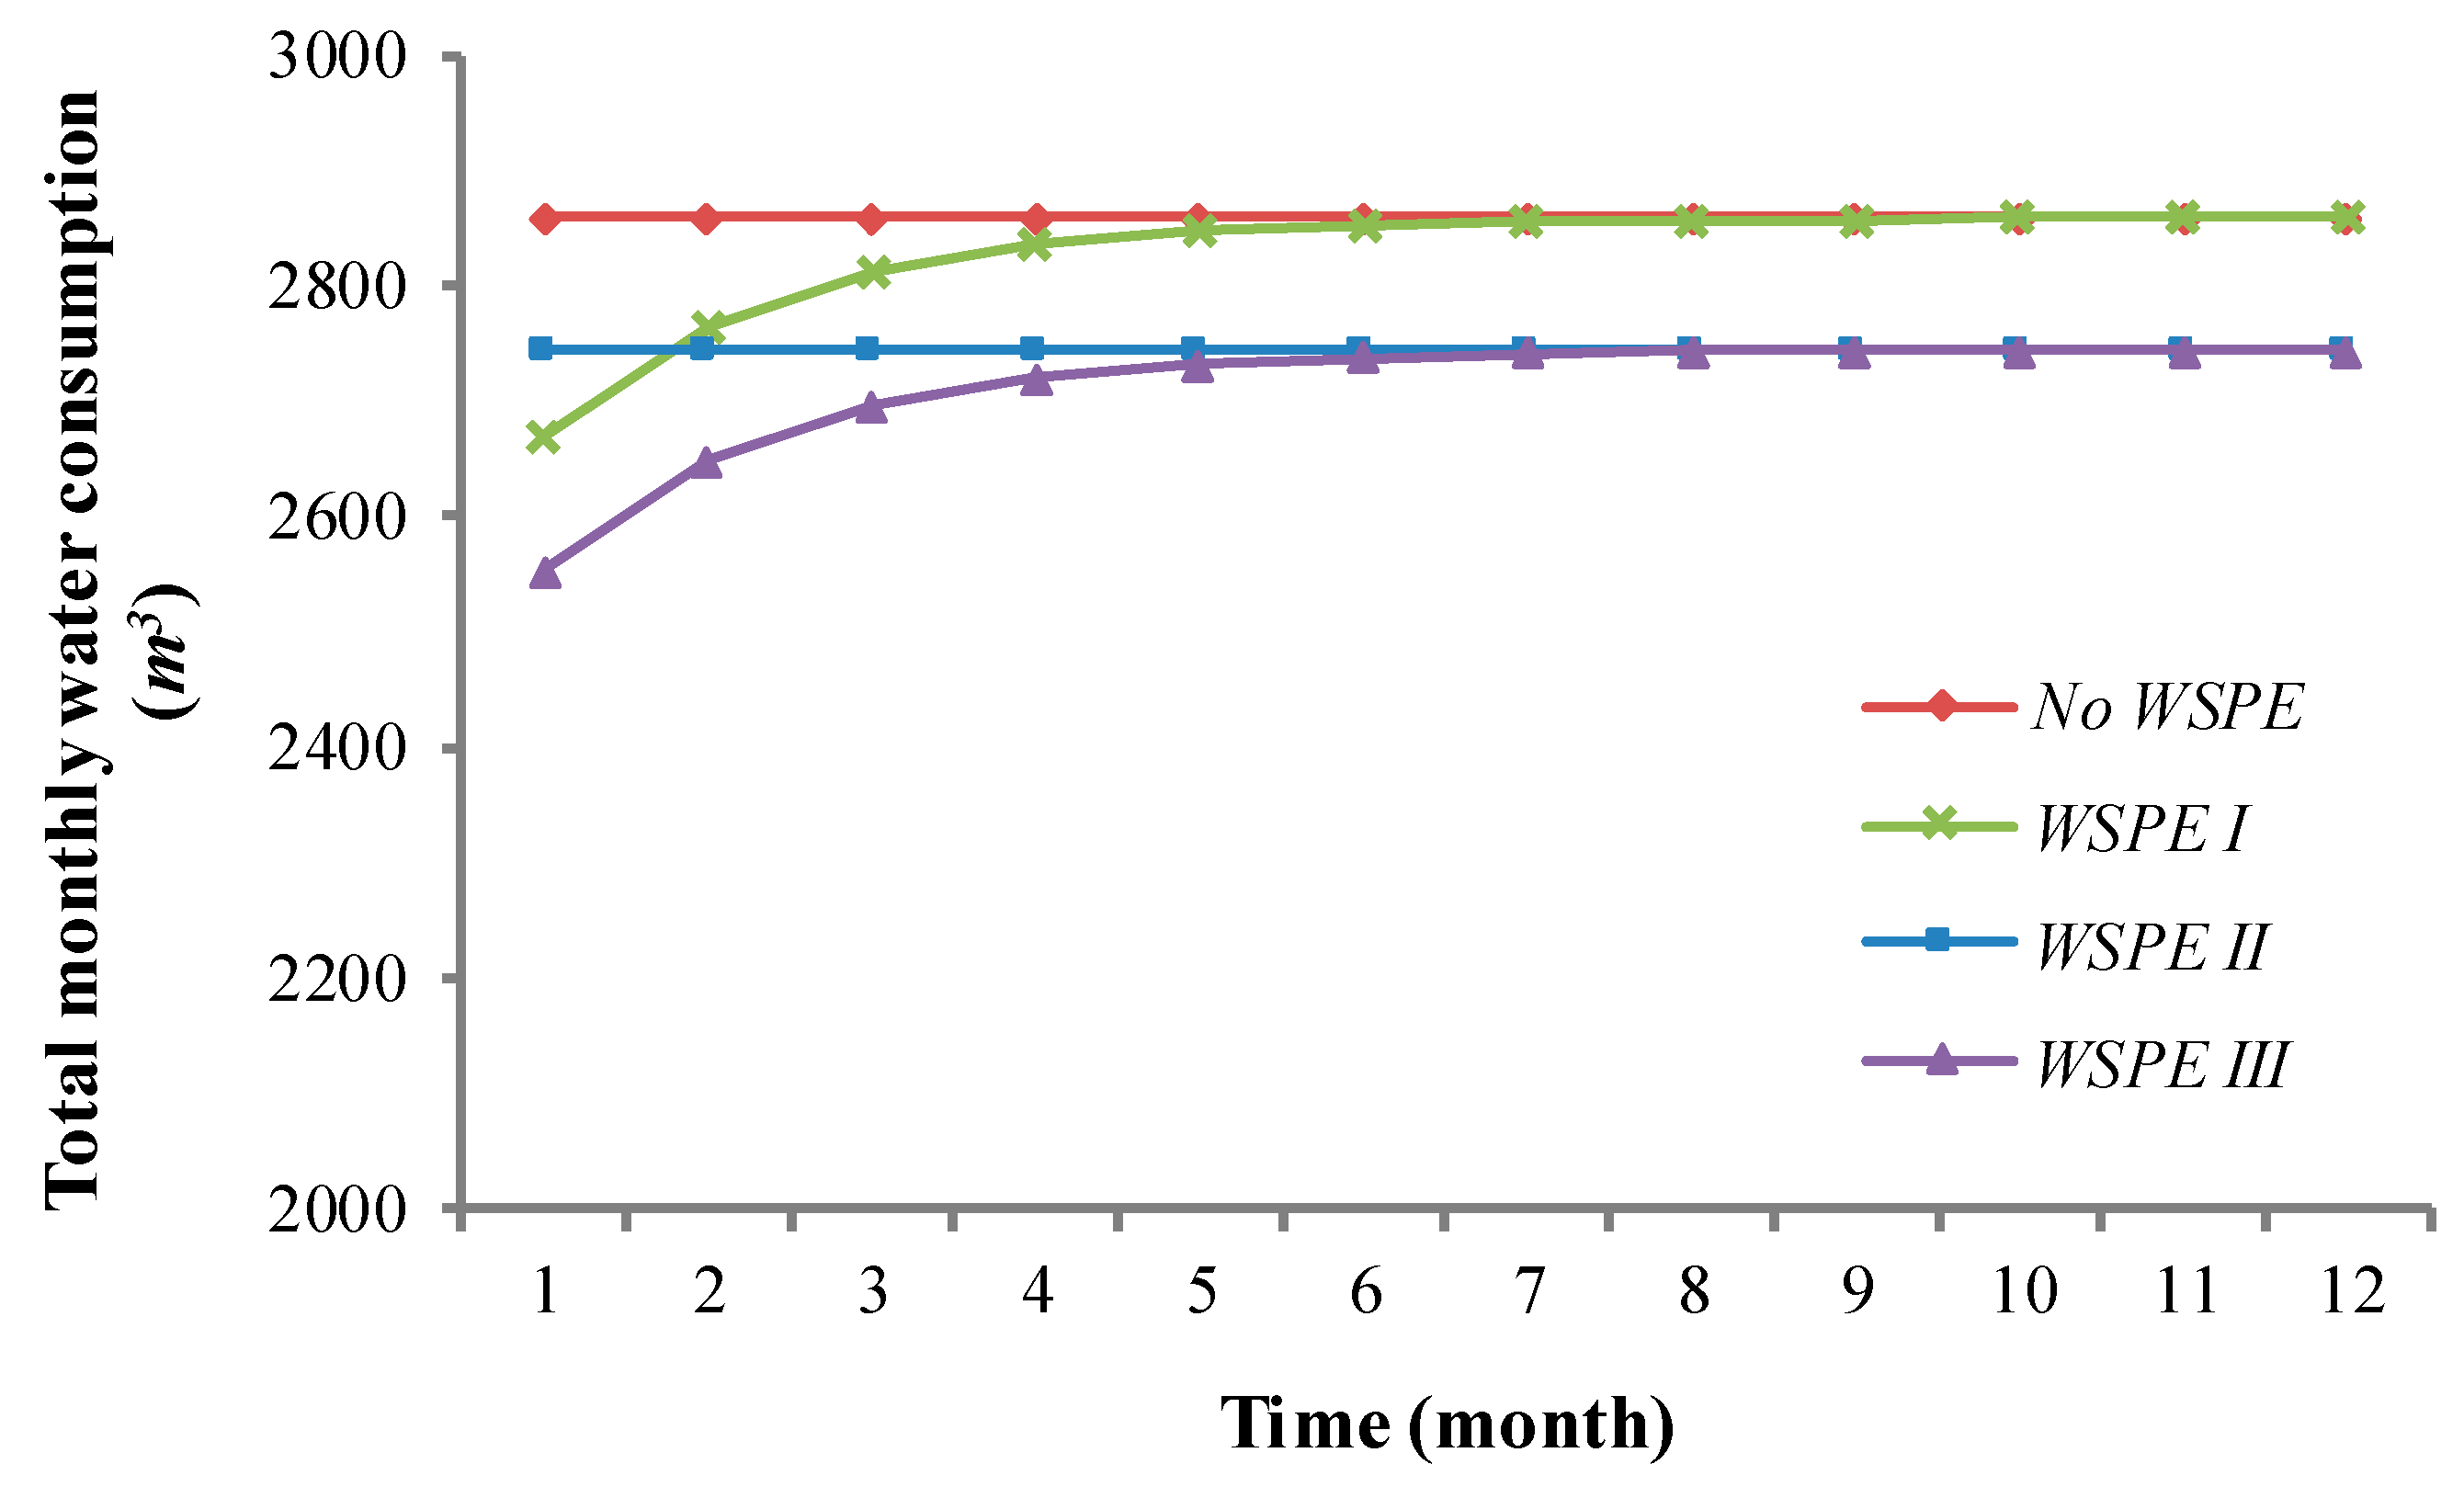
Table 1.
Household water consumption after increasing the water price under different first-tier water price coverage rates.
Table 1.
Household water consumption after increasing the water price under different first-tier water price coverage rates.
| First Tier Water Price Coverage Rate | Variables | Tiered Water Price | ||||||
|---|---|---|---|---|---|---|---|---|
| 5,7 a | 6,7 b | 5,8 c | 5,9 c | 5,10 c | 5,11 c | 5,12 c | ||
| 90% | Total annual household water consumption | 22,484.9 | 22,409.3 | 22,480.4 | 22,480.4 | 22,480.4 | 22,477.3 | 22,477.3 |
| Per capital annual water charges | 226.8 | 269.9 | 227.8 | 228.8 | 229.8 | 230.7 | 231.7 | |
| 50% | Total annual household water consumption | 22,440.6 | 22,377.3 | 22,408.1 | 22,388.9 | 22,366.7 | 22,345.5 | 22,334.0 |
| Per capital annual water charges | 240.7 | 276.6 | 248.3 | 256.0 | 263.6 | 271.1 | 278.8 | |
| 30% | Total annual household water consumption | 22,424.8 | 22,364.5 | 22,383.2 | 22,361.2 | 22,329.9 | 22,304.0 | 22,281.4 |
| Per capital annual water charges | 246.2 | 279.3 | 256.5 | 267.0 | 277.2 | 287.4 | 297.6 | |
Notes: “5,7” means that the first-tier water price is ¥5 and that the second-tier water price is ¥7. Other similar expressions have the same interpretation. a It is the original tiered water price, that is, the scenario of not changing the tiered water price. b It is the scenario of increasing the first-tier water price. c It is the scenario of increasing the second-tier water price.
© 2020 by the authors. Licensee MDPI, Basel, Switzerland. This article is an open access article distributed under the terms and conditions of the Creative Commons Attribution (CC BY) license (http://creativecommons.org/licenses/by/4.0/).
Share and Cite
MDPI and ACS Style
Liu, H.; Zhao, Y.; Li, H.; Wang, L.; Wang, Q. Individual Water-Saving Response Based on Complex Adaptive System Theory: Case Study of Beijing City, China. Water 2020, 12, 1478. https://doi.org/10.3390/w12051478
AMA Style
Liu H, Zhao Y, Li H, Wang L, Wang Q. Individual Water-Saving Response Based on Complex Adaptive System Theory: Case Study of Beijing City, China. Water. 2020; 12(5):1478. https://doi.org/10.3390/w12051478
Chicago/Turabian StyleLiu, Hanqing, Yong Zhao, Haihong Li, Lizhen Wang, and Qingming Wang. 2020. "Individual Water-Saving Response Based on Complex Adaptive System Theory: Case Study of Beijing City, China" Water 12, no. 5: 1478. https://doi.org/10.3390/w12051478
Note that from the first issue of 2016, this journal uses article numbers instead of page numbers. See further details here.