Revisiting the Comparison of Public and Private Water Service Provision: An Empirical Study in Portugal


CERIS, Instituto Superior Técnico, Universidade de Lisboa, 1049-001 Lisbon, Portugal
*
Author to whom correspondence should be addressed.
Water 2020, 12(5), 1477; https://doi.org/10.3390/w12051477
Submission received: 3 May 2020
/
Revised: 18 May 2020
/
Accepted: 19 May 2020
/
Published: 21 May 2020
(This article belongs to the Section Urban Water Management)
Abstract
:The controversy between the performance of public and private ownership of water and wastewater services is common worldwide. In most cases, this discussion is biased due to ideological issues or insufficiency or inconsistency of information. This study aims to compare the performance of private water utilities with that of public water utilities, using rich, robust, and audited information from Portuguese operators. The benchmarking exercise focuses on three distinct areas, namely, the efficiency and effectiveness of the investments made, the quality of service provided, and the tariffs and prices implemented. From the analysis performed, it is concluded that, on average, the performance of private water utilities exceeds that of public water utilities, and prejudice in most cases is unjustified regarding private ownership. Anyway, water, as an essential service, should always be provided, regardless of utility ownership.
1. Introduction
Water and sanitation services (hereafter WSS) are responsible for the provision of essential activities for the population, society, and the environment, and they make strong contributions to their economic and social cohesion [1]. Therefore, these services are of high importance and they are structural pillars for the sustainability and development of societies. Given that these services provide quasi-public goods, included in the sustainable development goal No. 6 [2] and human right to water [3], they have a high social value which justifies the adoption of public policies regarding universal service and service provision with high quality while safeguarding affordable tariffs [4].
Traditionally, the private sector has had high importance for WSS. Note that, at an early stage, in the 19th century and at the beginning of the 20th century, the participation of the private sector was mainly engaged to capitalize on the sector’s know-how and leverage water supply projects to cities, which were new, innovative, and of large size [5].
Currently, economists primarily justify the benefits of private provision in WSS with several economic theories that are easily understandable, such as public choice, property rights, and transaction costs theories [6]. From an empirical perspective, these theories support the best results and the efficiency of private ownership, because private managers have greater incentives than public managers to be efficient and innovative [7]. This can be justified by better salaries, rewards or other benefits provided to private managers. Conversely, public managers are not so performance (results) based oriented, because they must act under the severity of the public administration rules [8]. Moreover, the greater pressure of the shareholders for the results obtained, which is effective in the private sector and inapplicable in the public sector, can explain this issue, as can the greater flexibility and adaptability of the operational management under private ownership [9].
Internationally, it is possible to observe important private sector participation in WSS, although the contractual arrangements (i.e., concession) found in the Portuguese panorama are not always adopted elsewhere. Many countries have adopted public-private partnership (PPP) arrangements, especially BOT (build, operate, and transfer) projects for the construction and operation of water or wastewater treatment plants when they require high investment and/or specific know-how [10]. The media has covered a set of unsuccessful cases, as in Buenos Aires in Argentina or Cochabamba in Bolivia [11], in several countries in Africa, or even in some European countries, pointing to private companies that are associated with the water sector as devils [12].
Actually, the protagonists of this debate, either public or private providers, are often surrounded by prejudice and/or political ideology [13]. Moreover, there are always good and bad examples of public and private water utilities [14]. However, it is worth questioning why unsuccessful cases have occurred and whether responsibilities should, in fact, be attributed to private public ownership; i.e., among other issues, how can a public entity be incompetent to manage private contracts but competent to manage the services directly?
In this scope, it should also be questioned, when comparing the operating performance or the level of tariffs implemented, whether:
- the amount of rents (i.e., upfront payments) is removed;
- the depreciation periods of investments are identical between public and private ownership;
- the benefits of taxes paid or the use of subsidies by public utilities are accounted for; and,
- the risk sharing is the same in private and public projects.
In short, most comparisons in the literature are biased, either because they compare apples with oranges or because they are filled with ideological content that prevents comparison with the necessary equity [15].
In Portugal, among the main reforms of the water sector, the implementation of different management models of WSS stands out, particularly private sector participation, which became possible in 1993 after the enactment of Law No. 372 and that had not been allowed since 1974 [16]. Thus, in the past 25 years, there has been a growth in the private sector participation in the water sector in Portugal, both as a unique shareholder through public service concessions and as a minority shareholder, through institutional PPPs, commonly known as mixed enterprises [17]. The private sector has brought several benefits to the Portuguese WSS, for example, capacity and effectiveness of investment, efficiency and innovation and know-how, the high quality of service provided to the end user, or even the increased social awareness. However, stakeholders generally feel that they are not properly recognized by society. Moreover, these results are often ’disguised’ by external factors that go beyond the private partner itself (such as high upfront rents paid to municipalities).
From another perspective, different actors have contributed to some instrumentalization of the public opinion. Whereas this instrumentalization can be legitimate, it can sometimes be motivated by prejudice, ideologies, or political agendas, suggesting that private ownership provides less efficient WSS with higher prices and worse quality of service and aims at high profits than public ownership [18,19]. This study was developed with the support of the Association of the Portuguese Companies for the Environment Sector (AEPSA) and mainly intends to analyze and compare the performance of public and private ownership of water utilities in Portugal [20]. For this purpose, the effectiveness of the investments, the quality of service provided, and the tariff levels were compared while using credible and robust information provided by the Water and Waste Services Regulatory Authority (ERSAR), complemented by information from other government agencies or sources or from the operators themselves. Thus, the analysis and evaluation of the performance of the private sector and a comparison with other management models in Portugal is carried out through the discussion of three statements or, in other words, through the statistical and factual testing of three hypotheses or perspectives, which are often considered to be valid by society in relation to the WSS supplied by private companies:
- Hypothesis 1 (H1)—investments made by private operators are less productive than those made by public operators, with greater waste of resources and less value for money;
- Hypothesis 2 (H2)—private operators provide a worse quality of service than public operators, motivated by the reduction of their expenses and, thus, the maximization of their profits; and,
- Hypothesis 3 (H3)—private operators apply higher tariffs than public operators, thereby maximizing their profits.
More than estimating whether private management is more efficient than public management or vice versa, this paper aims to emphasize that, for the sustainable development of the water sector in Portugal and in any country, all of the management models can be relevant and make their contributions, and viable and credible options should not be ruled out. After this brief introduction, this article is also composed of three more sections that address the legal and institutional framework for WSS, compare the performance between public and private management, and finally summarize the conclusions.
2. Institutional and Regulatory Framework
2.1. Evolution
Since the 1990s, WSS in Portugal has gone through major developments concerning access, the quality of service provided, and the market structure. The restructuring of the water sector, which began in 1993, dealt with unbundling, separating the ”wholesale“ from the ”retail“ segments for both water and wastewater, opening the sector to private capital and, later, establishing a regulatory authority dedicated to water services, which has unequivocally marked the progress and quality of the water sector in Portugal [21]. In this period, for example, water supply coverage grew from 81% to 96% and the water quality test compliance improved from 50% to 99%, whereas, in wastewater, the coverage level (collection) improved from 28% to 82% and the quality of water resources from 28% to 78% [22].
Since 1993, the central state administration, through the company Águas de Portugal (AdP), has assumed an important role in the reform of the water sector in Portugal, especially in its unbundling, with several regional systems in various regions of the country being created. The system concerns water supply, addressing availability problems of water resources, as in the Algarve or in the regions of Porto and Minho, and wastewater treatment, handling significant pollution problems, for example, in the Estoril Coast or in the Aveiro Region.
Moreover, in the 1990s, the private sector participation, especially in the ”retail“ systems, grew and reached considerable levels, although below the expectations, reaching more than a dozen systems in 2000. From 1998 onwards, several operators have also been created with the enactment of the municipal companies (MC) laws [23].
In 2000, the Strategic Plan for Water Supply and Wastewater was published (PEAASAR). This first plan, which encompassed the period between 2000 and 2006, played a major role not only in leveraging a new restructuring of the sector, but also in defining objectives and policies to guide social, environmental, and economically sustainable solutions [24]. After this period, the government conceived the PEAASAR 2007–2013, addressing and guiding aspects more related to the operational component and targeting a more rational use of public expenses [25]. Subsequently, a new strategy was developed in the PENSAAR 2020 (Strategic Plan for Water Supply and Wastewater 2020). Based on the balance sheet of the previous plans, the PENSAAR 2020 defines a strategy that is based on sustainability objectives in all its components, including technical, environmental, economic, financial, and social aspects [21].
The various reforms and plans were financed by several billion Euros from European funds. Europe financed the unbundling of systems at an early stage and then financed their merging and was decisive for the substantive improvement of the main indicators of WSS access and quality of service.
Although the progress of the water sector has been undeniable, there is doubt regarding the added value from the several billion Euros spent and whether the option or adoption of another development model, as occurred in Chile or even Spain, would enable even better results or, at least, the same kind of results at a lower cost.
2.2. Institutional Framework
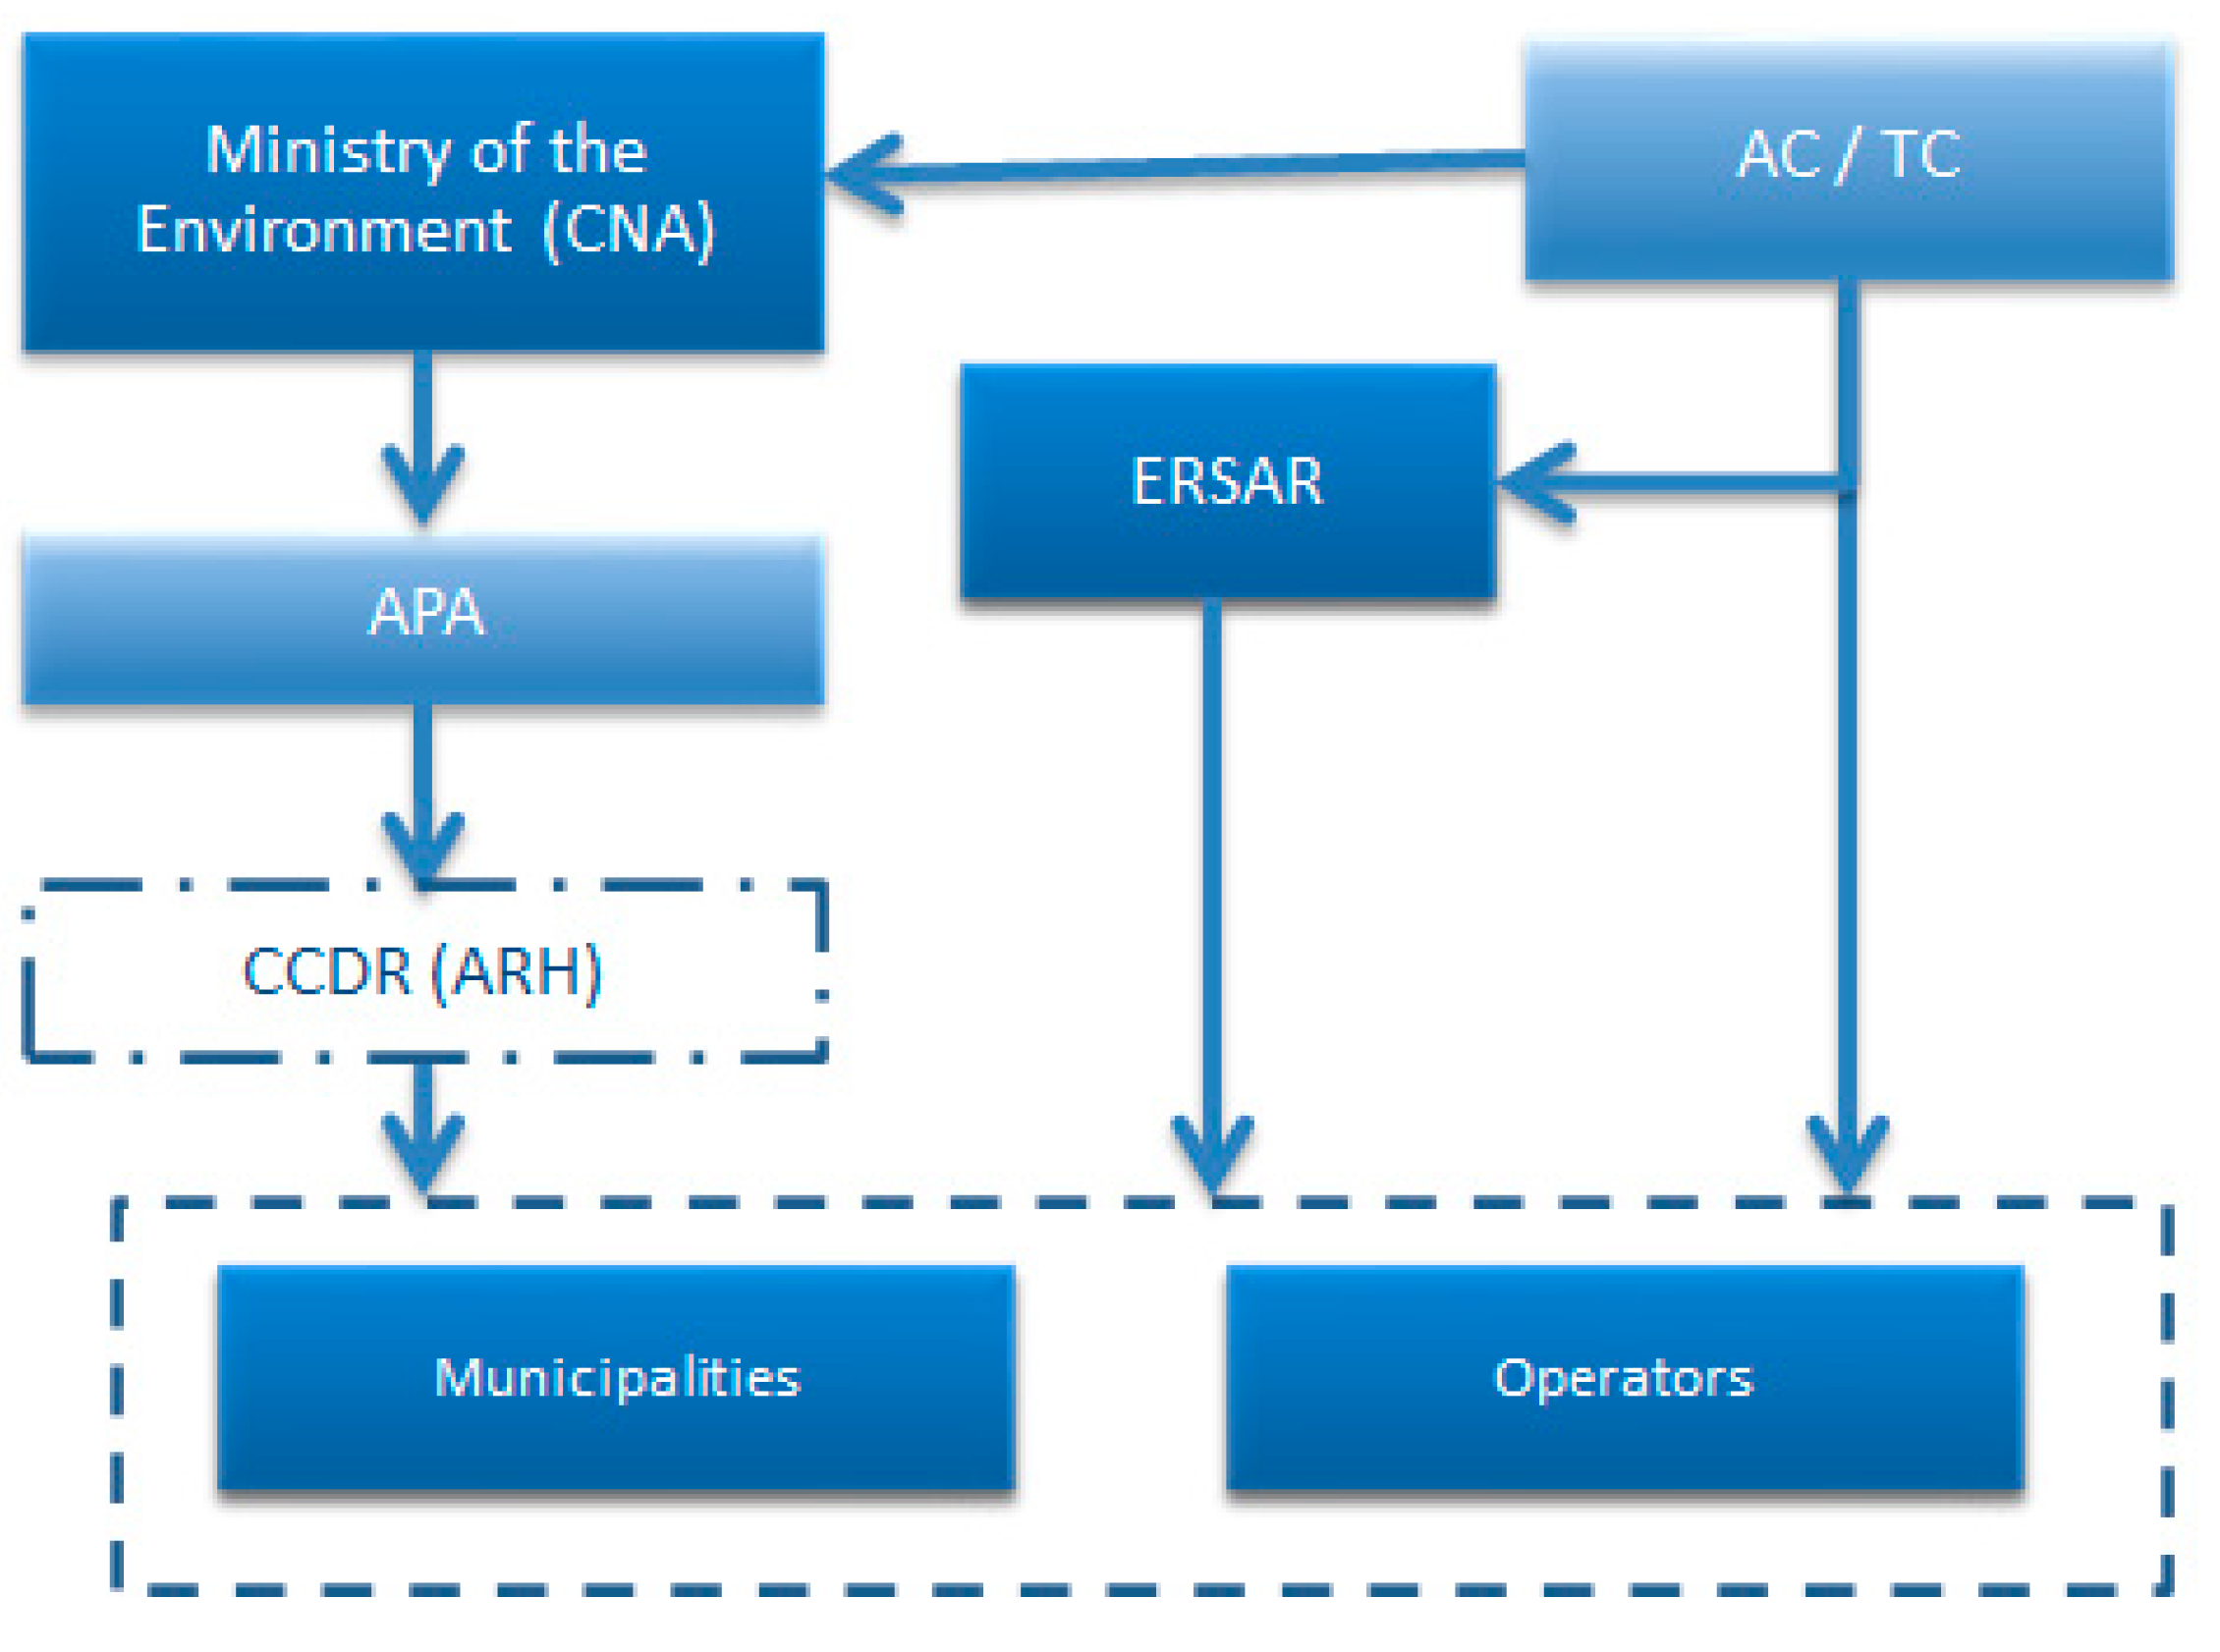
Many diverse types of actors coexist in the water sector. At the administration level, roles are played by the Ministry of the Environment (ME), which is the highest authority for the water sector, the Water and Waste Services Regulatory Authority (ERSAR), the Portuguese Environment Agency (APA), and the other structures of the public administration or with responsibility in the sector, namely, the National Water Council (CNA), the Coordination Commissions for Regional Development (CCDRs) and Water Resources Regional Administrations (ARHs), the Competition Authority (AC), and the Court of Auditors (TC). Finally, Águas de Portugal (AdP) has a very important structuring role in the development of the water sector, along with the municipalities that are the holders of the services and the private operators that disseminate good practices in the sector and contribute to increasing coverage.
Concerning the public policies for the sector, ME stands out as the authority with the most responsibility for the various policies of the environmental sector, which includes water.
For regulation, ERSAR is the WSS sector-specific regulator. As part of its tasks, ERSAR is responsible for supervising, controlling, and regulating WSS, regardless of the management model adopted, and it is responsible for imposing sanctions on providers that do not comply with the provisions of the legislation for the sector. Thus, ERSAR’s mission is to ensure three key objectives: the protection of users’ rights, the economic and financial sustainability of the operators, and the environmental sustainability [23].
Regarding environmental regulation, APA aims to create more effective conditions in the management of environmental and sustainable development policies. The role of this agency is also to propose, develop, and monitor the implementation of policies concerning the fight against climate change, and the emission of air pollutants, environmental impact assessment, prevention of serious risks, integrated control of pollution, and environmental education, ensuring the participation and awareness of the public and environmental non-governmental organizations (NGOs).
Additionally, in the area of regulation, AC has transversal powers over the Portuguese economy for the application of competition rules, along with regulatory bodies in the sector. Furthermore, TC has the task of supervising the legality and regularity of income and public expenditure, assessing public financial management, carrying out financial responsibilities, and exercising the other powers assigned to it by law.
Other important institutions are CNA, which is an independent consultation body of the Portuguese government in the field of water resource management, and CCDRs, which are decentralized bodies of the central administration that hold regulatory power coordination, along with planning, licensing, and supervision functions, in particular in the case of water abstraction and wastewater discharge, in addition to being the authorities that are responsible for the management of European Community funds. However, the Water Law established the creation of ARHs, which cover part of the powers of CCDRs, in particular to accomplish water management tasks, including planning, licensing, and supervision, which currently constitute departments of APA.
The municipalities are the entities that are responsible for WSS and their provision. In this scope, they may directly or indirectly fulfill their tasks by granting their services to private entities or by delegating them to third parties, including MC, of public or mixed capital.
AdP, belonging to the state′s business sector, is the main business group of the environment sector in Portugal, providing services to nearly 80% of the population in Portugal. The public company’s mission is to contribute to solving national problems in the fields of water supply and wastewater. The AdP Group, in the “wholesale” component, provides services to 234 of the 308 Portuguese municipalities and, in the “retail” component, it is responsible for serving water supply and sanitation to approximately 1,2 million people, which represents more than 10% of the population (AdP website).
Figure 1 displays the simplified institutional framework for the water sector in Portugal.
2.3. Regulation
In Portugal, there is a regulatory authority (vertical) for the sector, ERSAR, which has, according to its Statutes, relevant regulatory functions for all of the management models, pursuing the protection of users’ rights and safeguarding the sustainability and economic viability of the systems. ERSAR, as a competent authority, also has the function of monitoring and controlling drinking water quality.
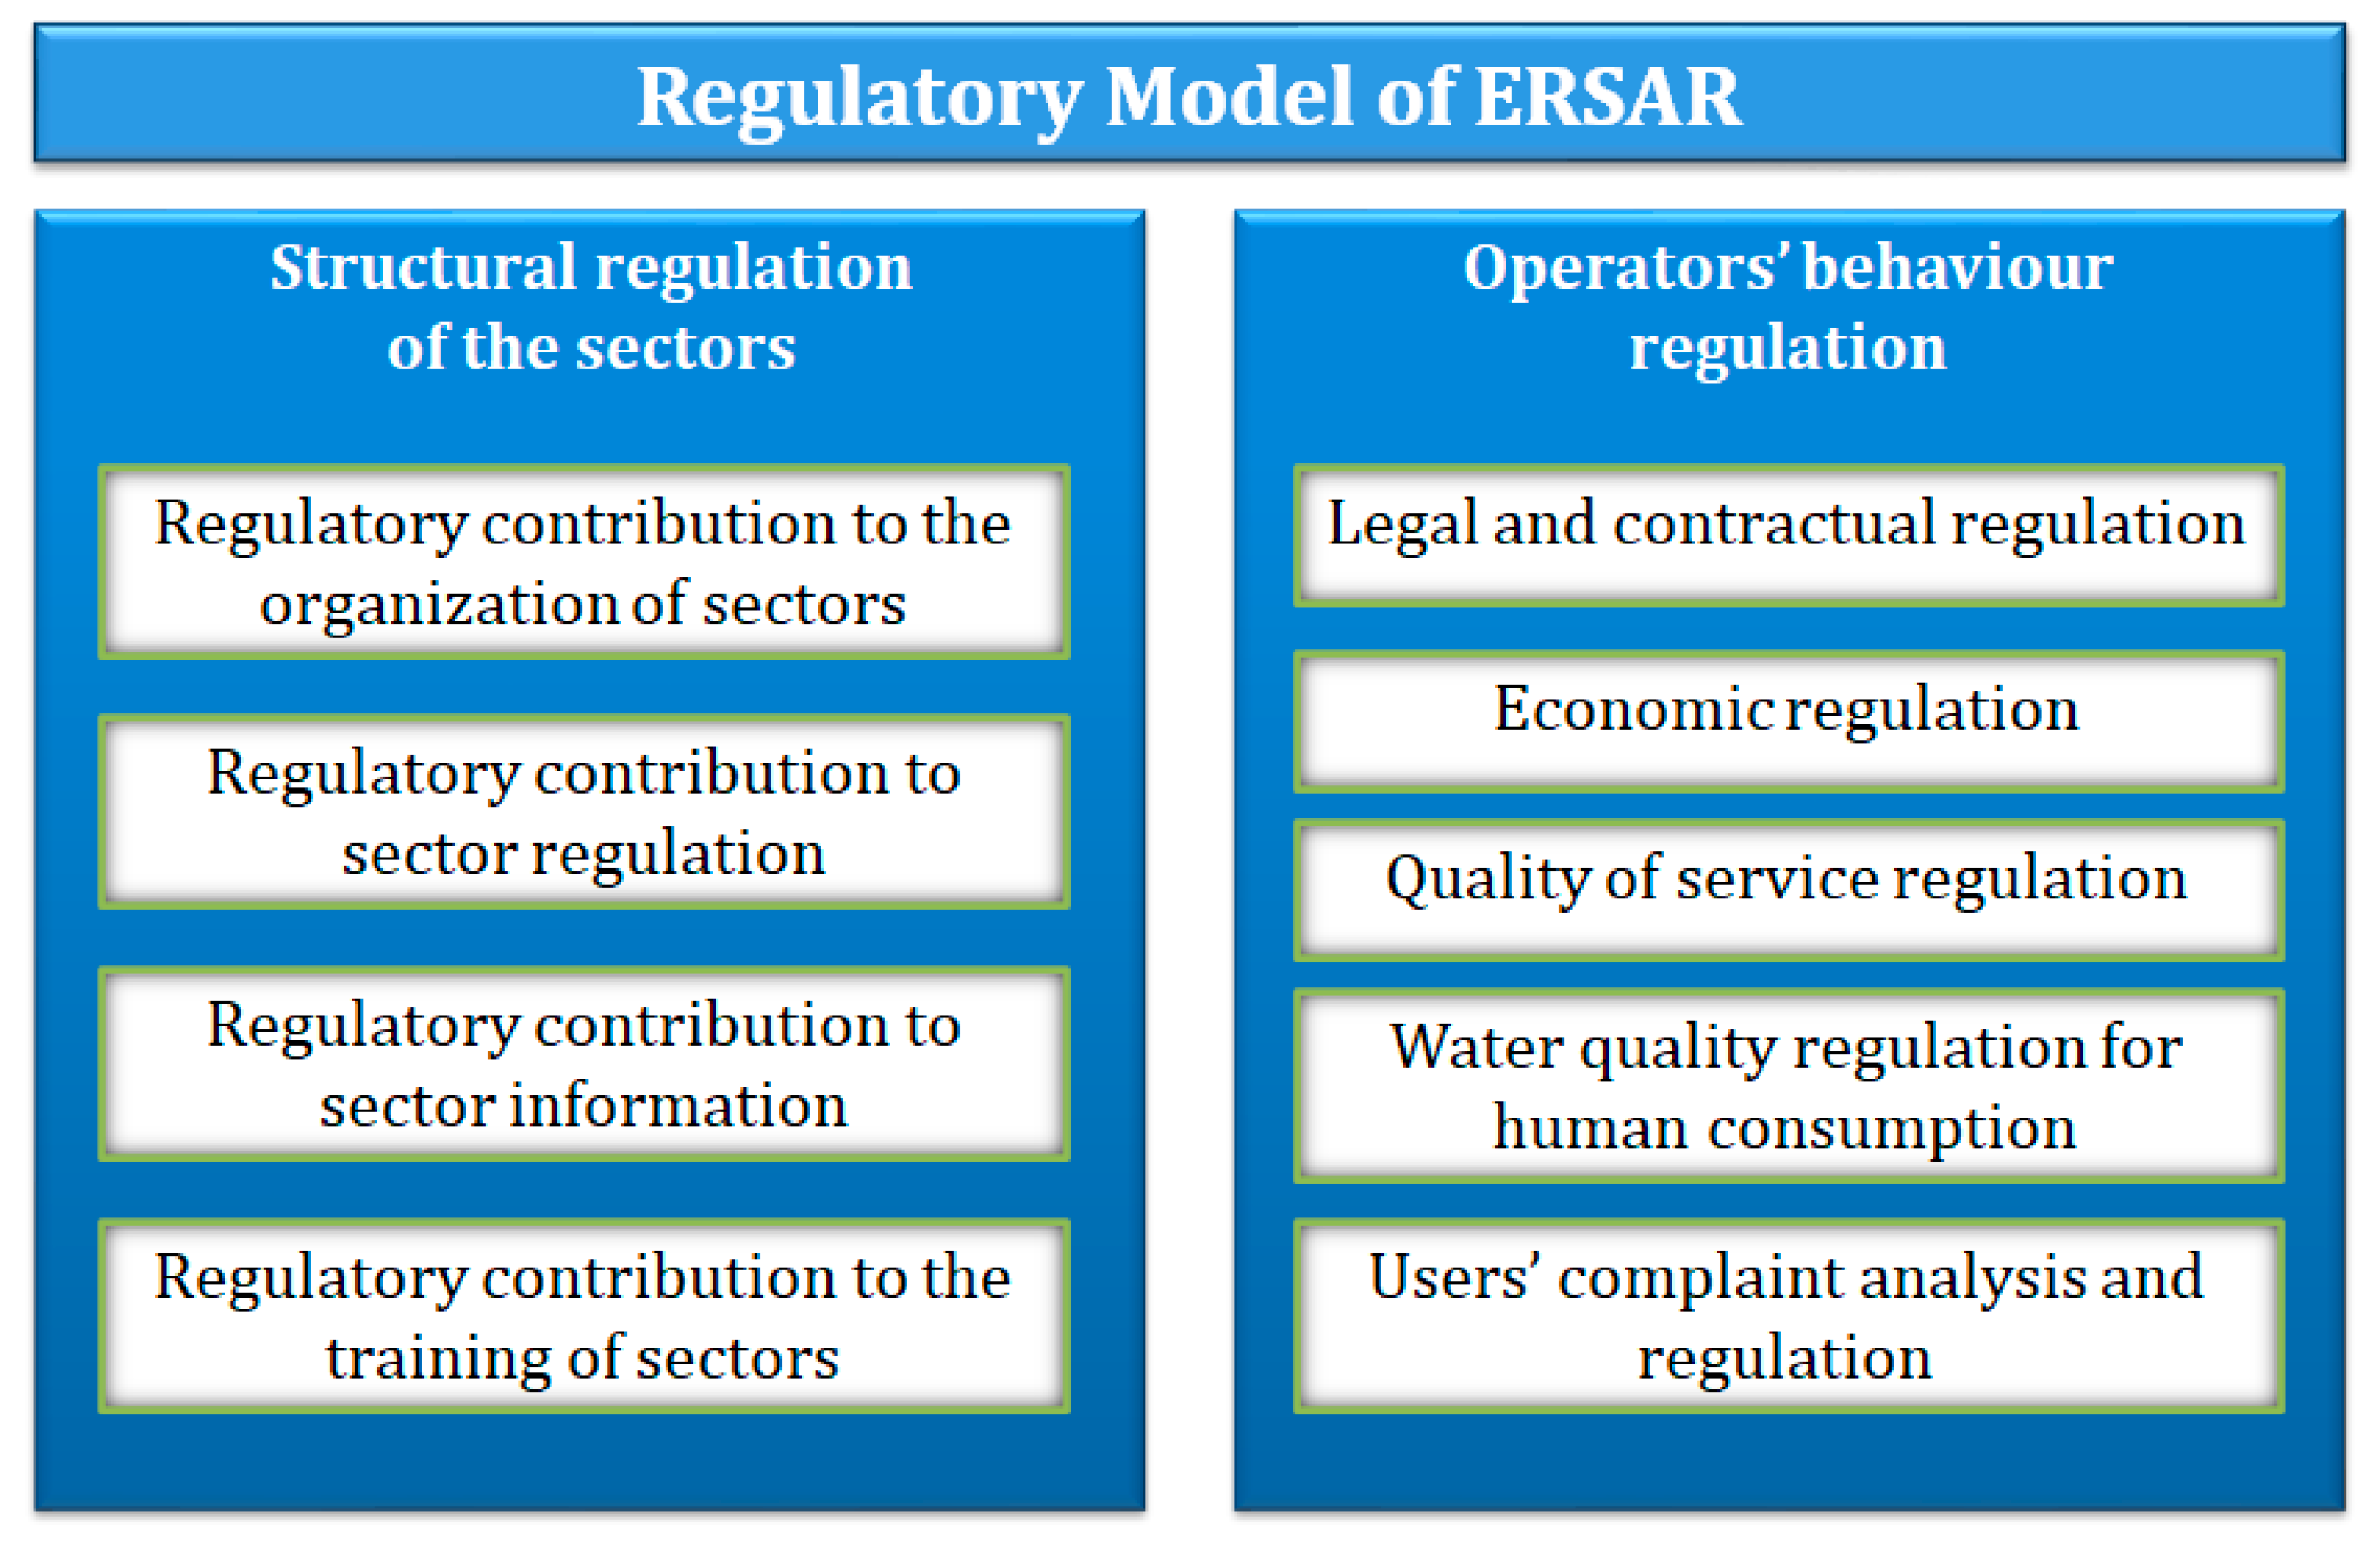
The strategy of the regulatory model that was adopted by ERSAR, which consists of an integrated regulatory approach, comprises two major intervention plans, one at a structural level, regarding the external environment of the operators, and another at the behavioral level, comprising the regulation of operators’ behavior [26].
Figure 2, below, illustrates the scope of ERSAR’s regulatory model in mainland Portugal.
2.4. Market Structure
The ownership of WSS belongs to the municipalities, with the exception of the water company (EPAL), in Lisbon, which is an atypical case and whose assets are held by the central state. WSS management, which can be granted or delegated to third parties, has mainly been associated with the public sector. There was no private management in the water sector in Portugal between 1974 and 1993.
Since 1993, there has been a proliferation of private sector participation in the WSS. Currently, the private sector (in various ways), in the “retail” segment, provides services to more than 20% of the Portuguese population. In addition, corporatization (in which a public entity is governed by private law) has proliferated extensively, with ’wholesale’ services operating on a business basis and “retail” services opting for business management models over the years, with particular emphasis on the MC delegation model.
The awarding of WSS provision belongs to the municipalities by law. However, municipalities may provide these services in a direct way, through municipal services (that are directly managed by municipal bodies, without administrative or financial autonomy—DMS) or through municipalized services (MSWA), which have administrative and financial autonomy and are managed by their own boards of directors, although they do not have legal personality.
Municipalities can also delegate WSS provision to MCs, seeking a more business-oriented approach and a clear escape to private law [27]. The provision might also be assigned to private entities through concession or to public entities of a different nature through partnership agreements [28].
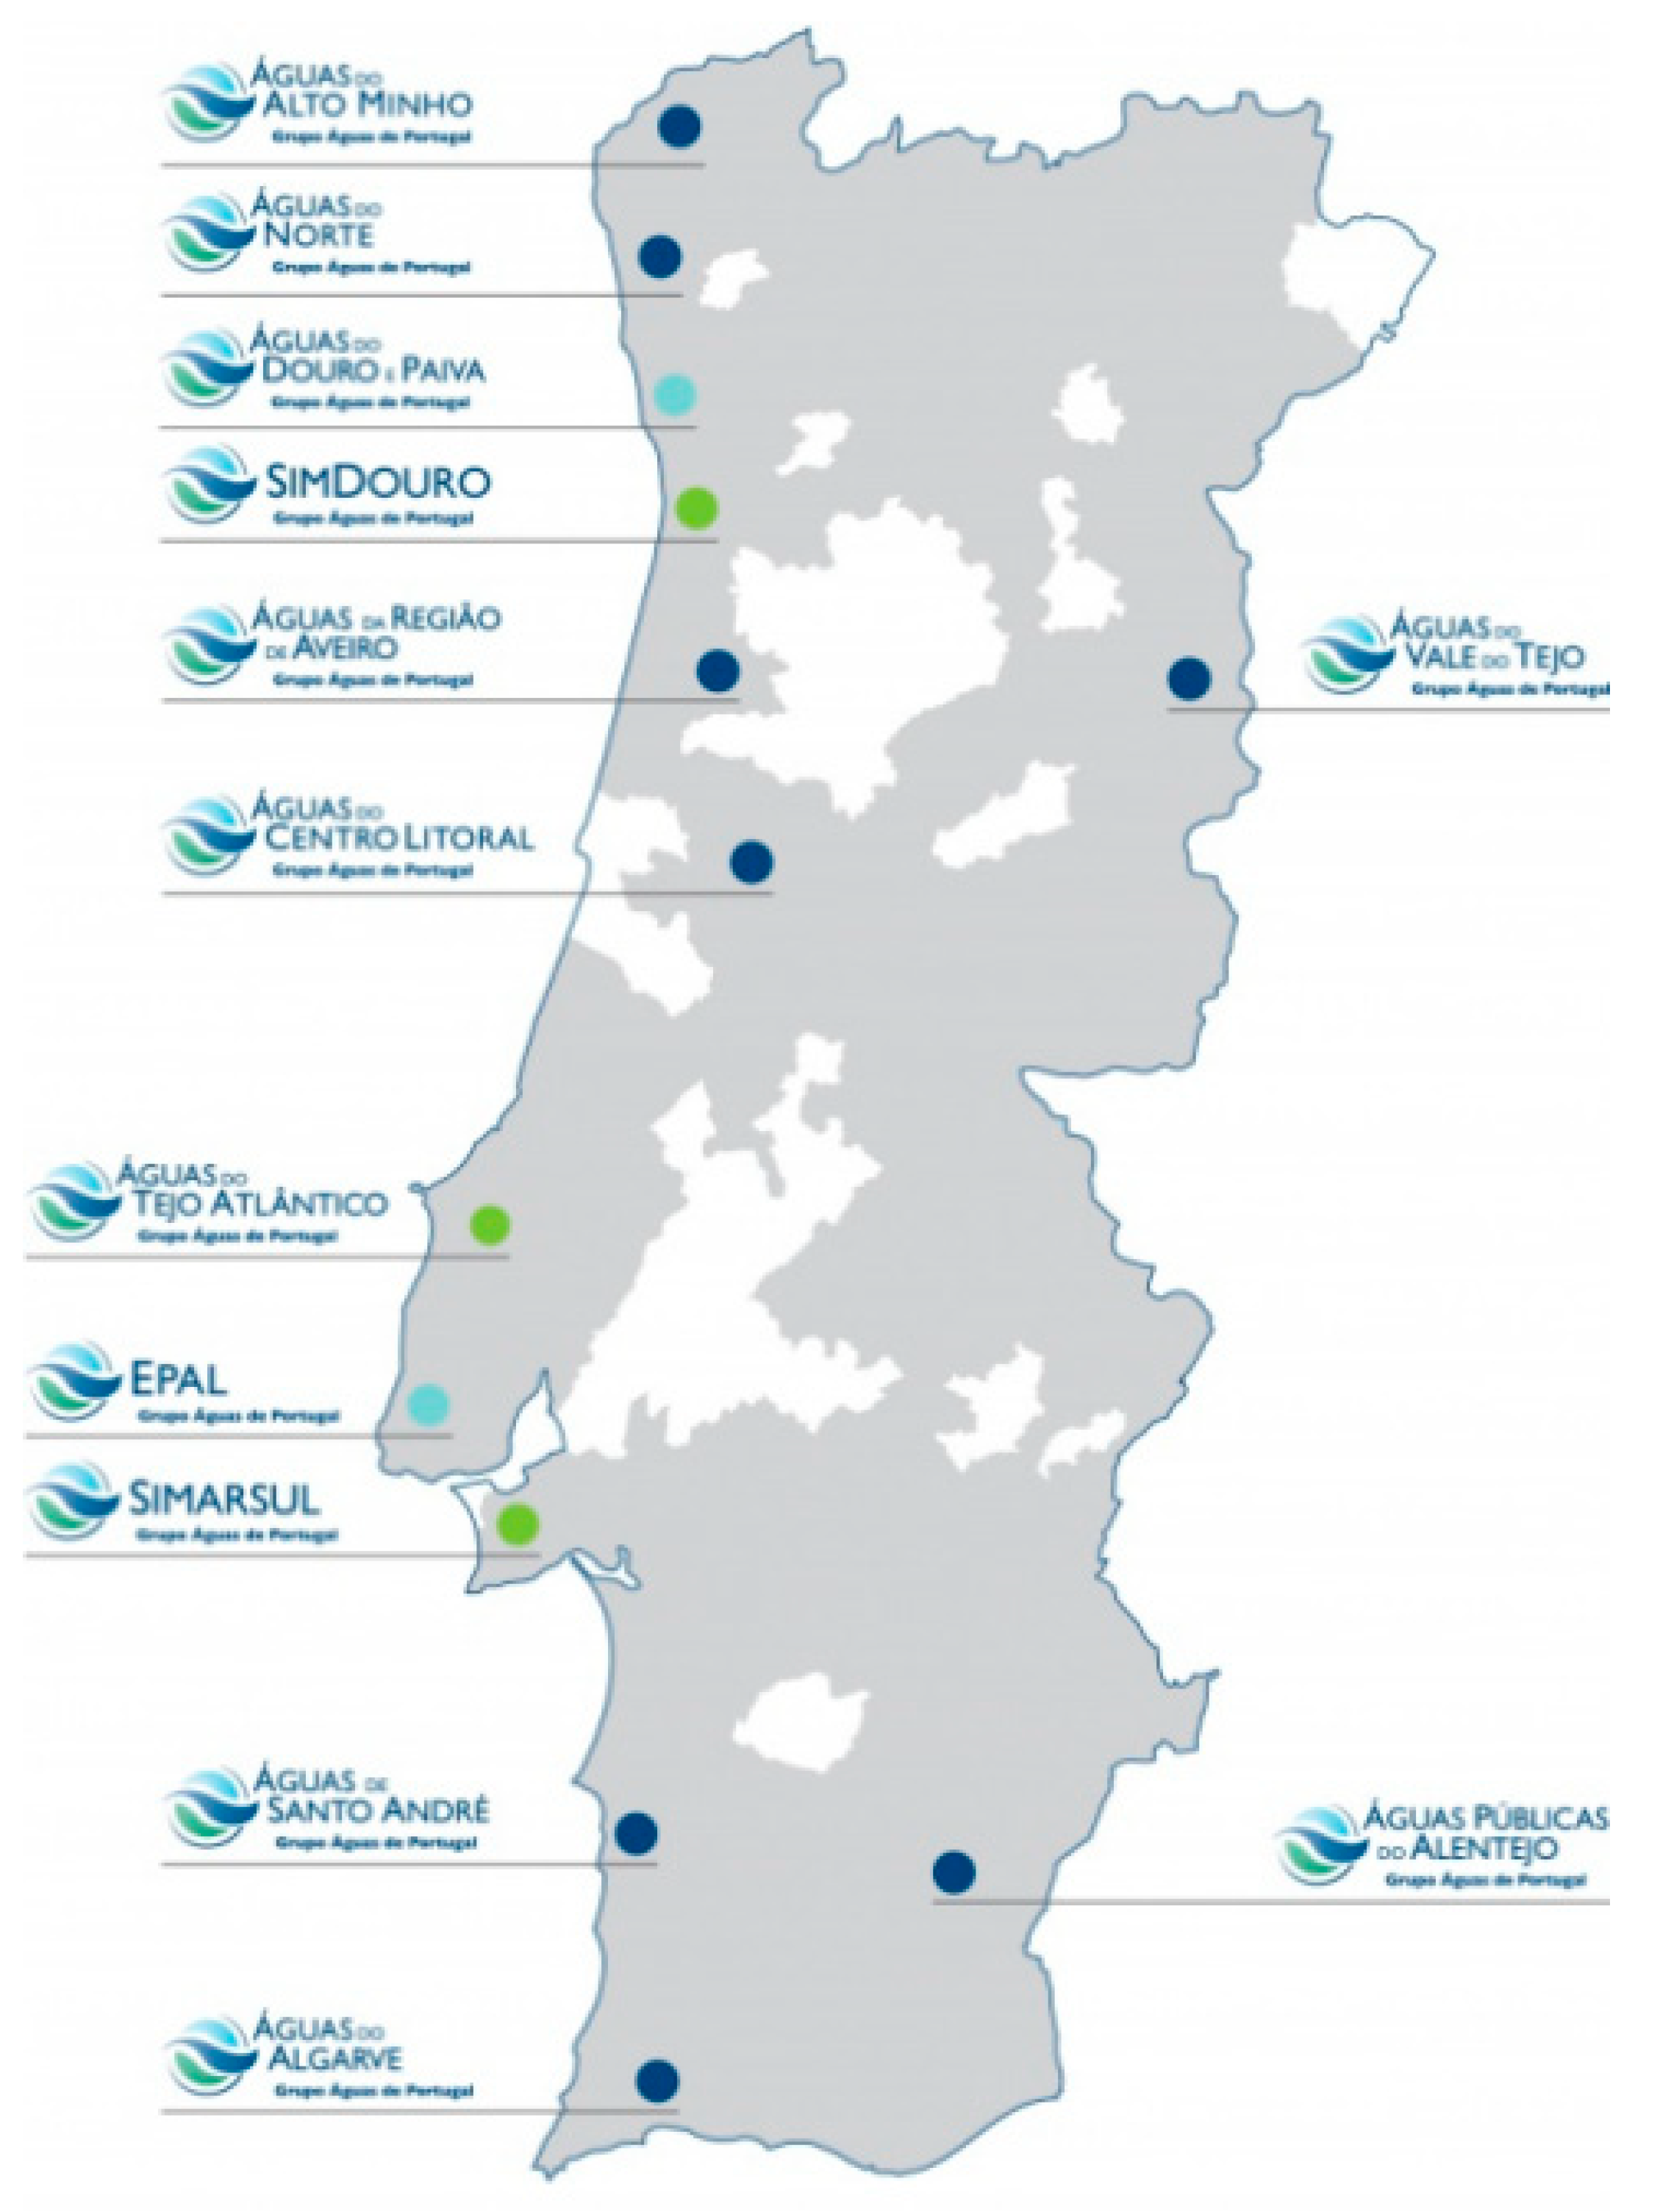
In Portugal, most municipalities do not provide “wholesale” WSS services, as this service is mainly provided by regional systems that are controlled by the AdP group, even though the municipalities participate in the companies as minority shareholders. The AdP group comprises 13 companies, of which 10 provide wholesale services, as shown in Figure 3.
Table 1 presents the organizational structure the “retail” component of WSS, when considering the different management models [29].
In Portugal, WSS are mostly unbundled. Thus, the “wholesale” and “retail” systems, both for water supply and wastewater, are usually provided by different operators. Concerning horizontal integration, there are different situations both for services in the “wholesale” and in the “retail” segments.
In the “wholesale” services, due to the high investment costs in infrastructure and the clear benefits that exist in exploiting economies of scale, there is a high degree of horizontal integration, with a few examples of companies providing services at the municipal level (e.g., ICOVI, Águas da Serra and Águas de Santo André). Concerning the “retail” services, the conditions are not favorable to regional management, so there is a low level of horizontal integration, with only eight entities (by the end of 2018) providing water services on a regional basis [29] although the creation of several regional entities is underway.
As far as the provision of “retail” services is concerned, most of the time, operators provide water and wastewater services together. They sometimes also include municipal waste management services and, less often, transport or other activities.
2.5. Major Figures
The reforms of the water sector in Portugal in the last 25 years led to very interesting results. Although, as stated, the value for money might not have been the best, there was a noteworthy progress in the water sector. Taking the audited and credible data of the Portuguese regulator ERSAR into account (see its website and its annual reports on the Portuguese water sector status-quo), currently, the water supply coverage is about 96% when it was a little bit higher than 80% in the 90’s. More than 567 mil water tests were performed in the last year, with a score of 98.72% of conformity. In the 90’s, the conformity percentage was approximately 60%. The number of water sources reduced substantially and, currently, they mostly consist of surface water of large dimension and the systems are much more robust and resilient. Particularly in the South, where the weather is more adverse and the climate change effect has been worse, for example, in the tourist region of the Algarve water scarcity has no longer taken place. The water production in 2019 was about 782 hm3, from those 573 hm3 were billed, corresponding to about 29% of water losses. In the 90’s, water losses reached almost 50%. The existing assets were ageing and the mains replacement level was near 0%. Nowadays, the replacement level of more than 110 thousand km of existing mains is nearly 1%. In 2019, the per capita consumption was 192 liter per inhabitant and per day. The improvement in wastewater services was even more significant. The wastewater collection and treatment coverage is approximately 83% and in the 90’s was less than 50%. The remaining population is isolated and served by individual systems. Currently, about 1.5 million of sewage is conveniently treated per day according to the EU legislation in the wastewater treatment plants. Finally, the household charges with WSS for a consumption of 10 m3 was 23.98 € in 2019, which represented a high affordability, being less than 1% of the monthly average of the household income.
3. Performance of the Public and Private Sectors
3.1. Overview
In Portugal, the provision of these services may be the responsibility of different operators, with either public or private ownership. However, there is the biased idea that water services are always very profitable activities and their provision by private entities is achieved with lower quality and performance and with excessive profits [30,31].
This idea that prevails in Portuguese society and internationally has no substantive basis. Performance studies and analyses (including, for example, studies promoted by the regulator itself) do not conclude that the performance of private operators is lower, but quite the contrary [15,32].
In a recent audit, the TC raised a number of issues that had consequences for the image and credibility of the private management model in Portugal, although criticism was not the intention, since the issues were not different from those that were addressed in other audits of public entities. In spite of that, at no time does the TC state that private management should not be implemented or that it shows a worse performance than public management [33].
Hence, the aim of this article was to test the three hypotheses or perspectives that were mentioned in the introduction concerning effectiveness of investments (H1), quality of service provided (H2), and tariffs adopted (H3). This was done in the clearest possible way while using information based on the RASARP published by ERSAR [34]. In some cases, and to analyze the most updated information, the most recent accounts reports of the operators and other complementary information were also examined. Therefore, the performance comparison of the sample of private companies with those of different management models using statistical analysis provides evidence of the most efficient management model. The three different hypotheses for diverse perspectives (investments, quality of service, and tariffs) aim to avoid and counterweight that a good performance in a particular perspective can be compensated by the lower or higher performance in other perspective, for example, a higher level of quality of service and a higher tariff.
3.2. Analysis of the Investments Made (H1)
Stakeholders, in general, see private companies as investing poorly, often overvaluing the estimates of investments or making investments that are not useful in an attempt to take advantage of their implementation, given that some of the companies belong (or belonged) to or have preferential relations with the construction industry [35].
These arguments do not get much support, since all investments are approved by the holder (municipality) and are subject to the opinion of the regulatory agency, in addition to the fact that some of the companies see these investments in infrastructure as a cost. Besides, these companies are generally responsible for the operation and maintenance of investments, and the investments made must be efficient and effective.
Thus, hypothesis or perspective 1 (H1) considers that the investments made by private operators show lower productivity than those that are made by public operators, denoting a greater waste of resources and a lower value for money. Accounting for this thesis, the effectiveness and efficiency of investments made both by the private and the public sectors were analyzed. Note that the analysis of investments was focused on the period between 2000 and 2013 (for PEAASAR I and II). Nevertheless, the main source of information refers to PENSAAR 2020 (pp 38 and 52), where the values of investment made in the WSS in the “retail” segment by both the private and public sectors are detailed, while assuming that this investment is continuous and that the invested amounts are constant in the period considered and with slightly different percentages for water supply (40%) and wastewater (60%). The size of the public and private sectors is also taken into account.
It is necessary to assess not only the amount spent, but also the evolution of the WSS level of coverage in order to analyze the effectiveness and efficiency of the investment made.
Despite the significant growth of the private sector in the water sector in Portugal, currently reaching approximately 20% of the population, the investment per inhabitant by the private sector seems to be significantly higher than that by the public sector, as shown in the following Table 2 and Table 3.
The analysis of Table 2 and Table 3 shows that although the private sector serves only approximately 20% of the population, it has a level of investment that is very close to that of the public sector. This analysis identified the values of 1085 M€ for the private sector and 1577 M€ for the public sector. This means that despite the lower population served, the private sector is able to achieve a relative weight of nearly 40% of the total investment made.
Thus, there appears to be greater effectiveness and efficiency in the accomplishment of investments in WSS by the private sector, while taking the lower expenditure made for an increase in coverage into account (€/inhabitant). Although this difference is significant, it would be much greater if European Union funding were considered, which, as pointed out, constituted the lion’s share of investments in the public sector and were virtually insignificant in the private sector.
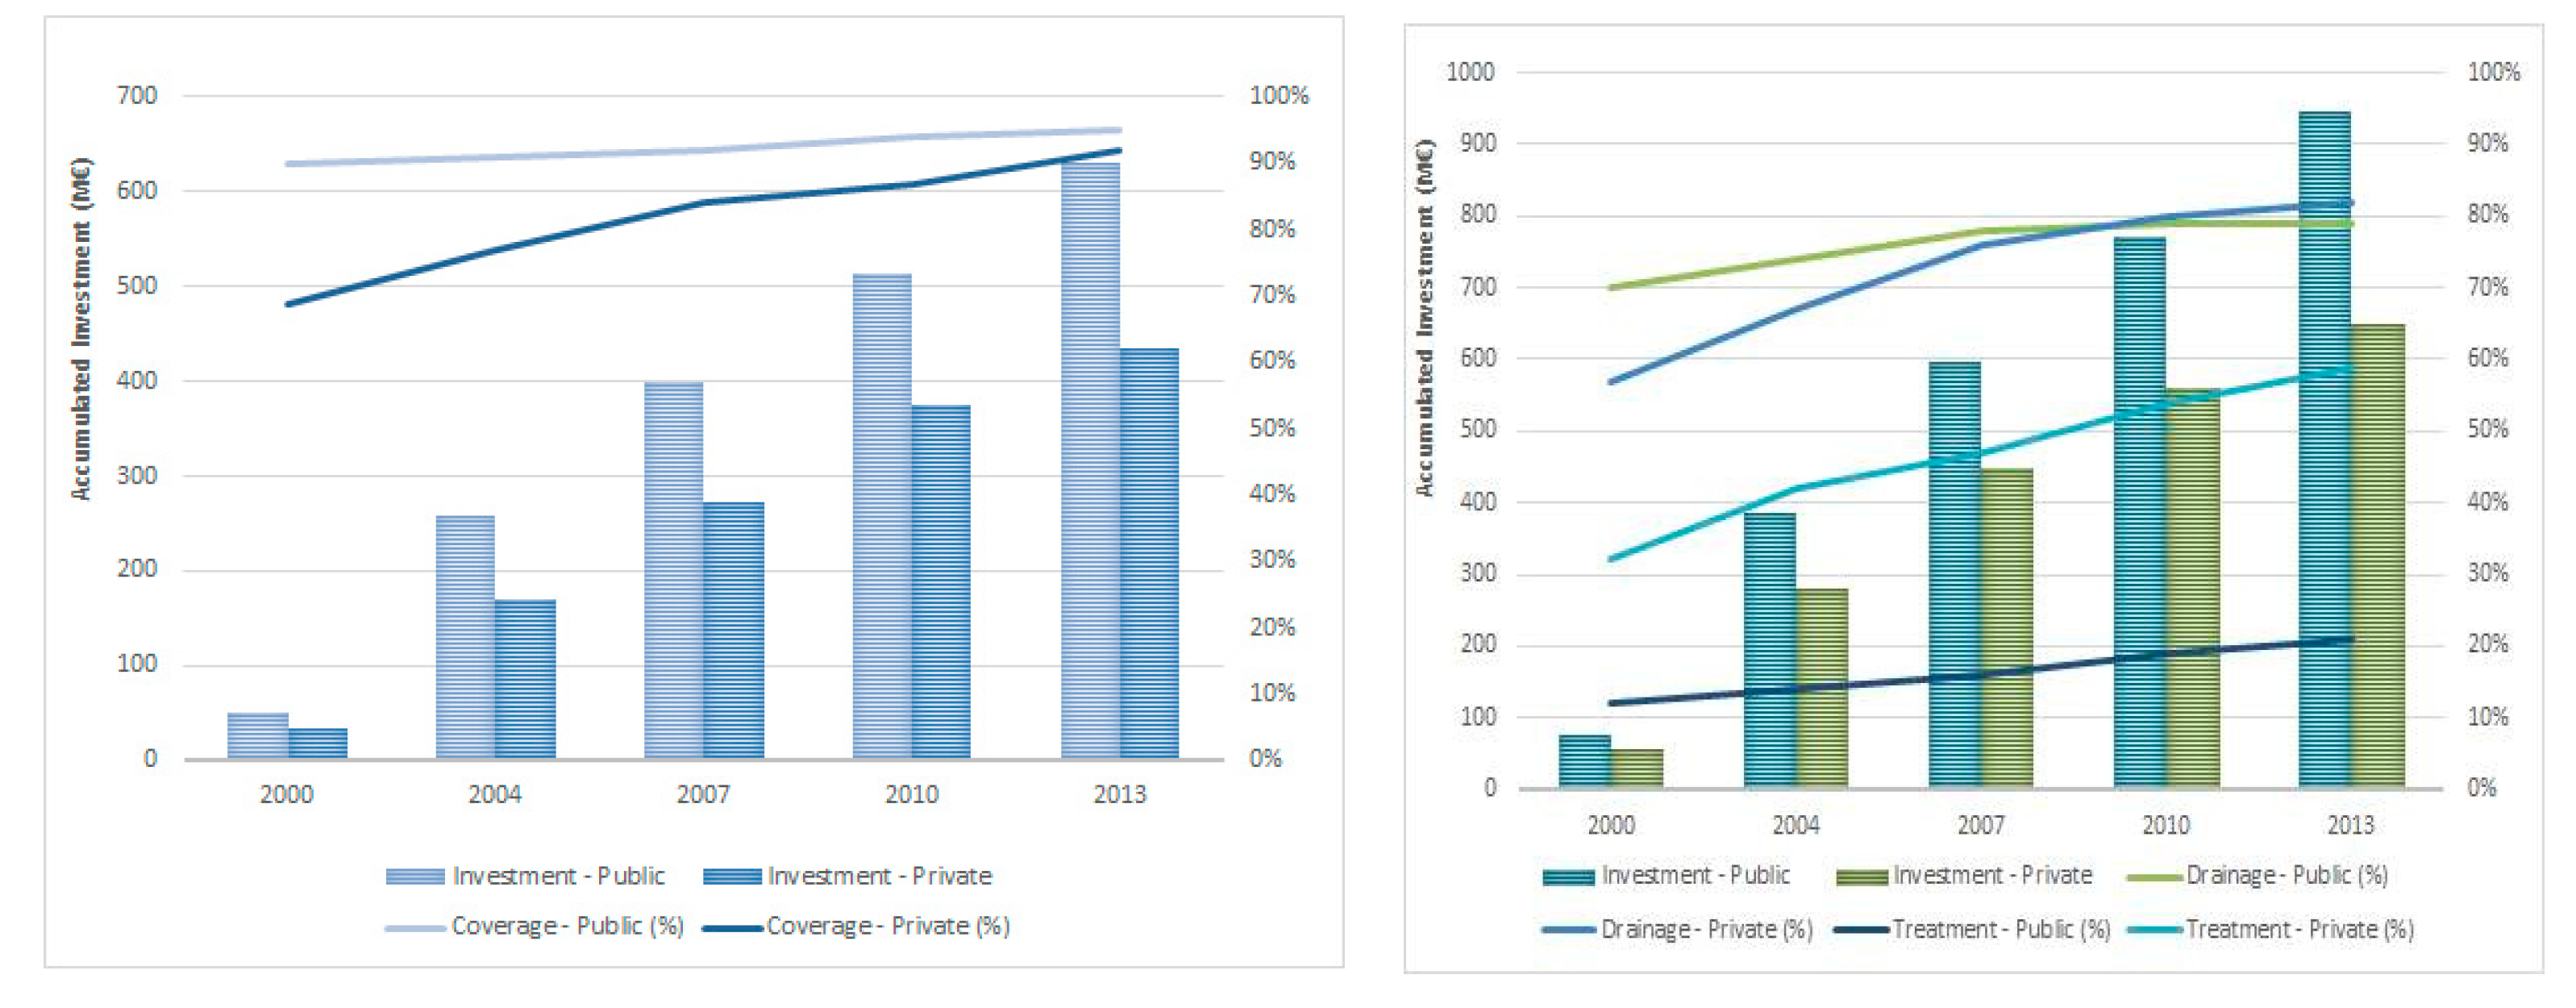
The large investment made by private operators has been reflected, as expected, in an accelerated growth in their coverage over the period 2000–2013, with increases of 23%, 25%, and 27% in the level of coverage of water service, wastewater collection, and wastewater treatment, respectively.
The public sector, in turn, has lower WSS coverage growth values, which can also be explained, at least partially, by several factors, including the starting level, the capacity to make investment in the sector, and the type of investments made.
Regarding the starting level, in 2000, the average level of coverage of the public sector was already much higher than that observed in the private sector, instigated by the (almost total) public management in the metropolitan regions of Lisbon and Porto. This was also one of the reasons that justified the private sector participation in some municipalities with very low levels of coverage.
This might mean that, for the increase in coverage, investments may be higher (infrastructure in the most rural areas), and some of these investments may end up having another aim beyond increasing coverage (which includes the network optimization, etc.). Figure 4 illustrates the evolution of the investment made and the WSS coverage by management model in the period between 2000 and 2013.
While analyzing the figure mentioned, there is a much faster growth in the level of coverage by private operators than by public operators.
After examining the previous Table 2 and Table 3 and Figure 4 and with the abovementioned cautions, it seems possible to confirm the evidence that the private operators are, in fact, more effective and more efficient in carrying out investments in WSS, with lower expenditures per inhabitant and per percentage of increase in service coverage in both water and wastewater services. The savings of resources by the private sector, per inhabitant, as observed, are close to 5% for water services and 15% for wastewater services.
Thus, when considering the analysis of the investments made and their effects in increasing WSS coverage, it is possible to reject H1, given the evidence that private operators have been more effective and efficient in implementing planned investments than public sector operators.
3.3. Analysis of the Quality of Service (H2)
Another myth regarding the water sector in Portugal concerns the quality of service provided by private operators. It is commonly said that private companies aim for profit, meaning that the best way to increase or guarantee profit is by saving resources while reducing the quality of service provided. This assertion reveals some prejudice, and it is strongly ideological [36,37].
First, a poor or worse quality of service does not necessarily lead to lower expenses. Usually, what is observed is precisely the opposite, since the operational expenses (OPEX) increases (e.g., major bursts, interruptions, and water losses). Second, the regulatory agency regulates the quality of service, and the standards are established by contract, so performance is not exclusively a result of the choices of private managers, which are constrained by legal and contractual requirements.
Finally, what is suggested is precisely the opposite; that is, due to prejudice, political interference, and a preconceived public image, private companies have additional incentives to provide a high quality of service and, therefore, a better quality of service should be expected from these entities.
Thus, the assessment of hypothesis or perspective 2 (H2), which assumes that private operators provide a worse quality of service to customers than public operators, indicates that private operators may be motivated to reduce their operating and capital expenses and, thus, maximize their profits.
The analysis of this perspective was developed using a set of key performance indicators (KPIs) for the various WSS management models, comprising the different perspectives of services provision, such as the protection of users’ interests, the financial sustainability of the operator, and environmental sustainability.
The set of KPIs adopted fundamentally comprises the KPIs used by ERSAR, taking into account the reference values (benchmarks) that were recommended by that entity and the weighted averages. The sample includes all the mainland country, only excluding the islands (have a different regulator) and a couple of outliers. Table 4 below shows the selected KPIs.
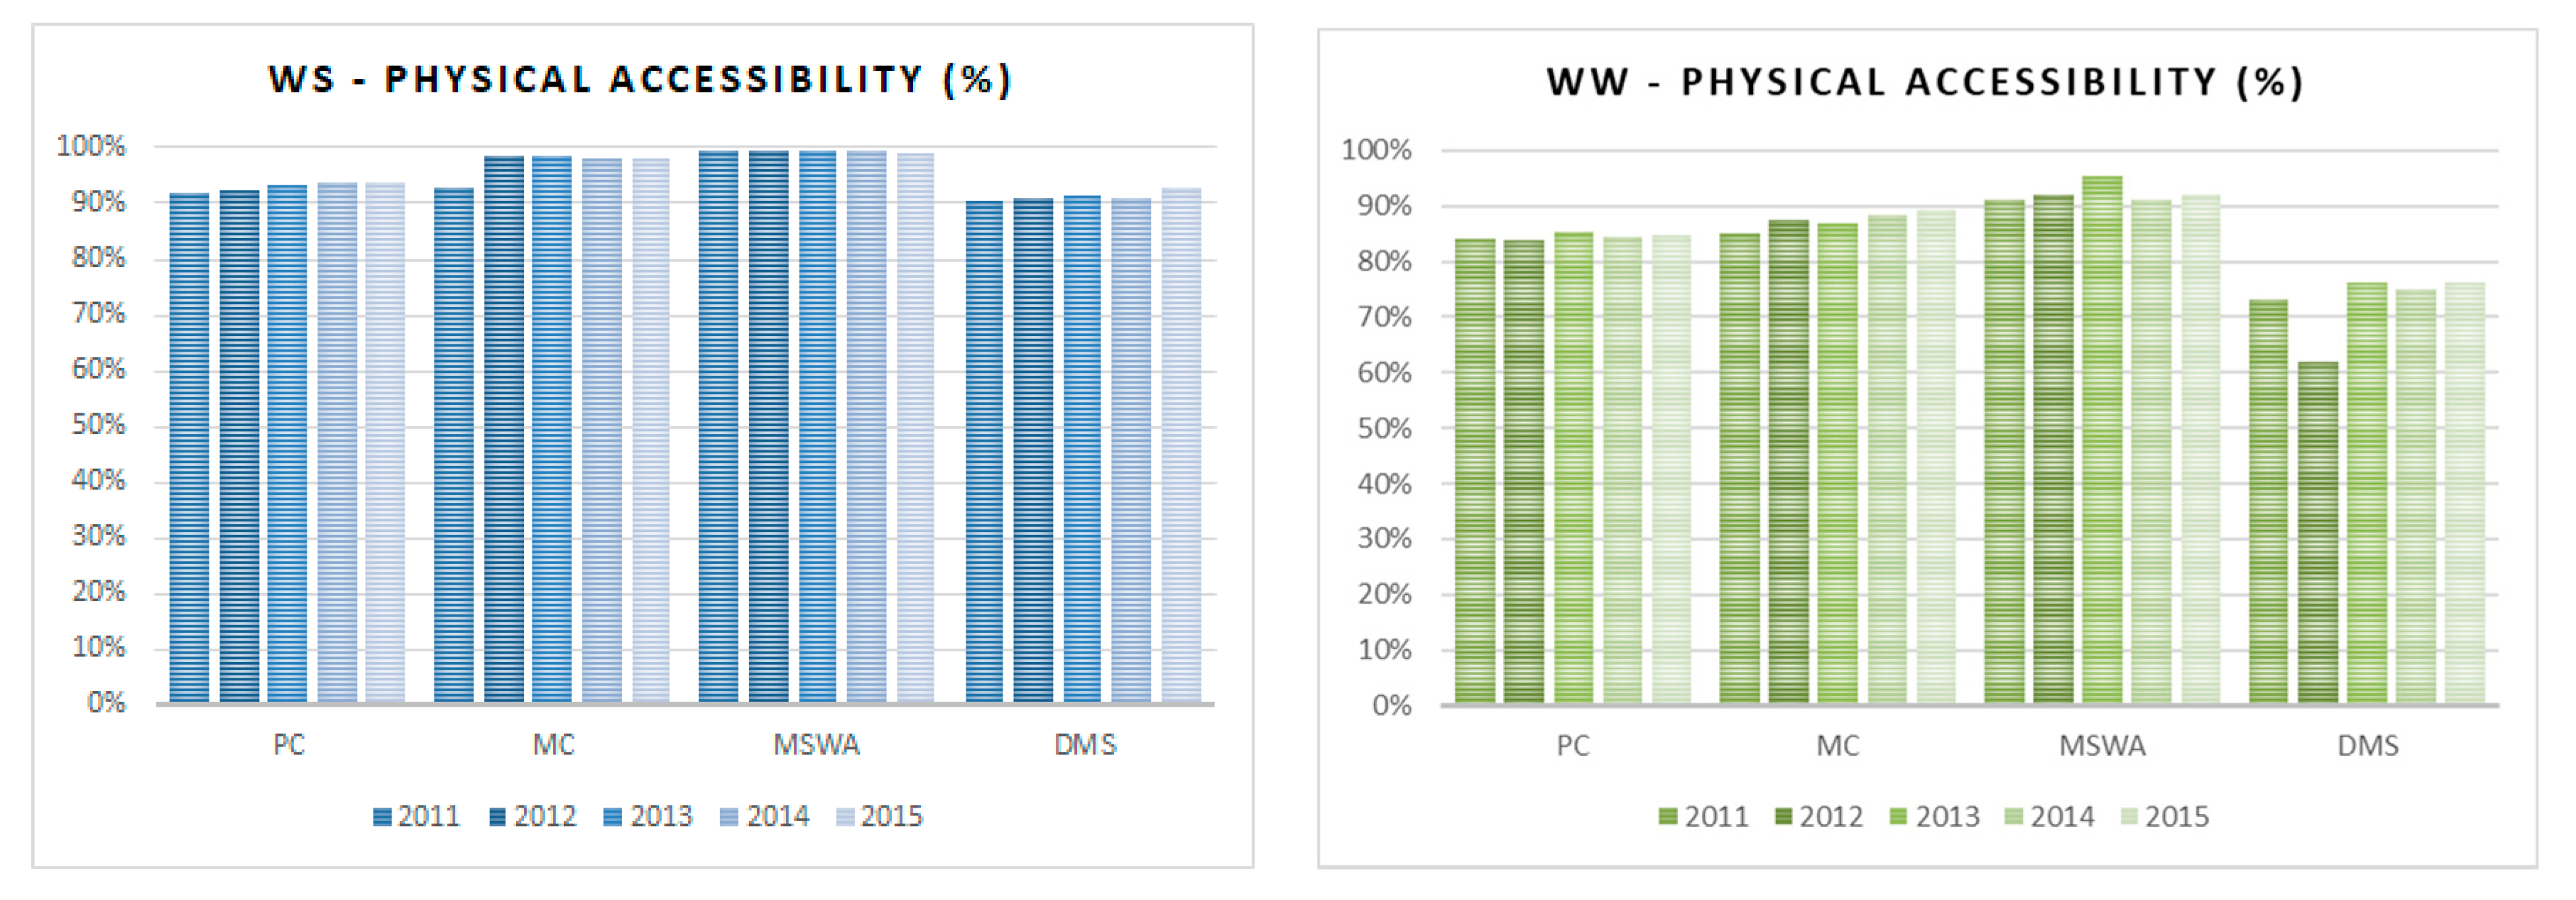
3.3.1. Coverage Level
The coverage level, using the indicator of physical accessibility, aims to evaluate the population’s access to WSS through the total number of households connected. Figure 5 illustrates the evolution of the indicator between 2011 and 2015. The annual reports of ERSAR are the source for the data.
As expected, the investment in coverage expansion in the rural environment does not have the same effect as that in urban areas. In this sense, ERSAR recommends different reference levels, depending on the features of the region (urban or rural). Thus, ERSAR considers that, in predominantly urban areas, operators must have a coverage level of at least 95% and that, in predominantly rural areas, they must have a coverage level of at least 80%, while for wastewater the values are 90% and 70%, respectively.
By analyzing Figure 5, it seems that there was a clear effort of all the operators to achieve the targets that were proposed by ERSAR, since nearly all of them, on average, obtained the classification of ’good’ in the indicator for water service, although some exceptions remain.
However, the focus is on the private sector, whose activity takes place mostly in rural areas (as compared to public operators) and ends up presenting a level of coverage that is very close to the reference level for predominantly urban areas (i.e., almost 95%). Thus, this seems to indicate a better performance of the private operators concerning the water services coverage level. The same scenario can be observed for wastewater, even though the results, in general, are worse for all operators.
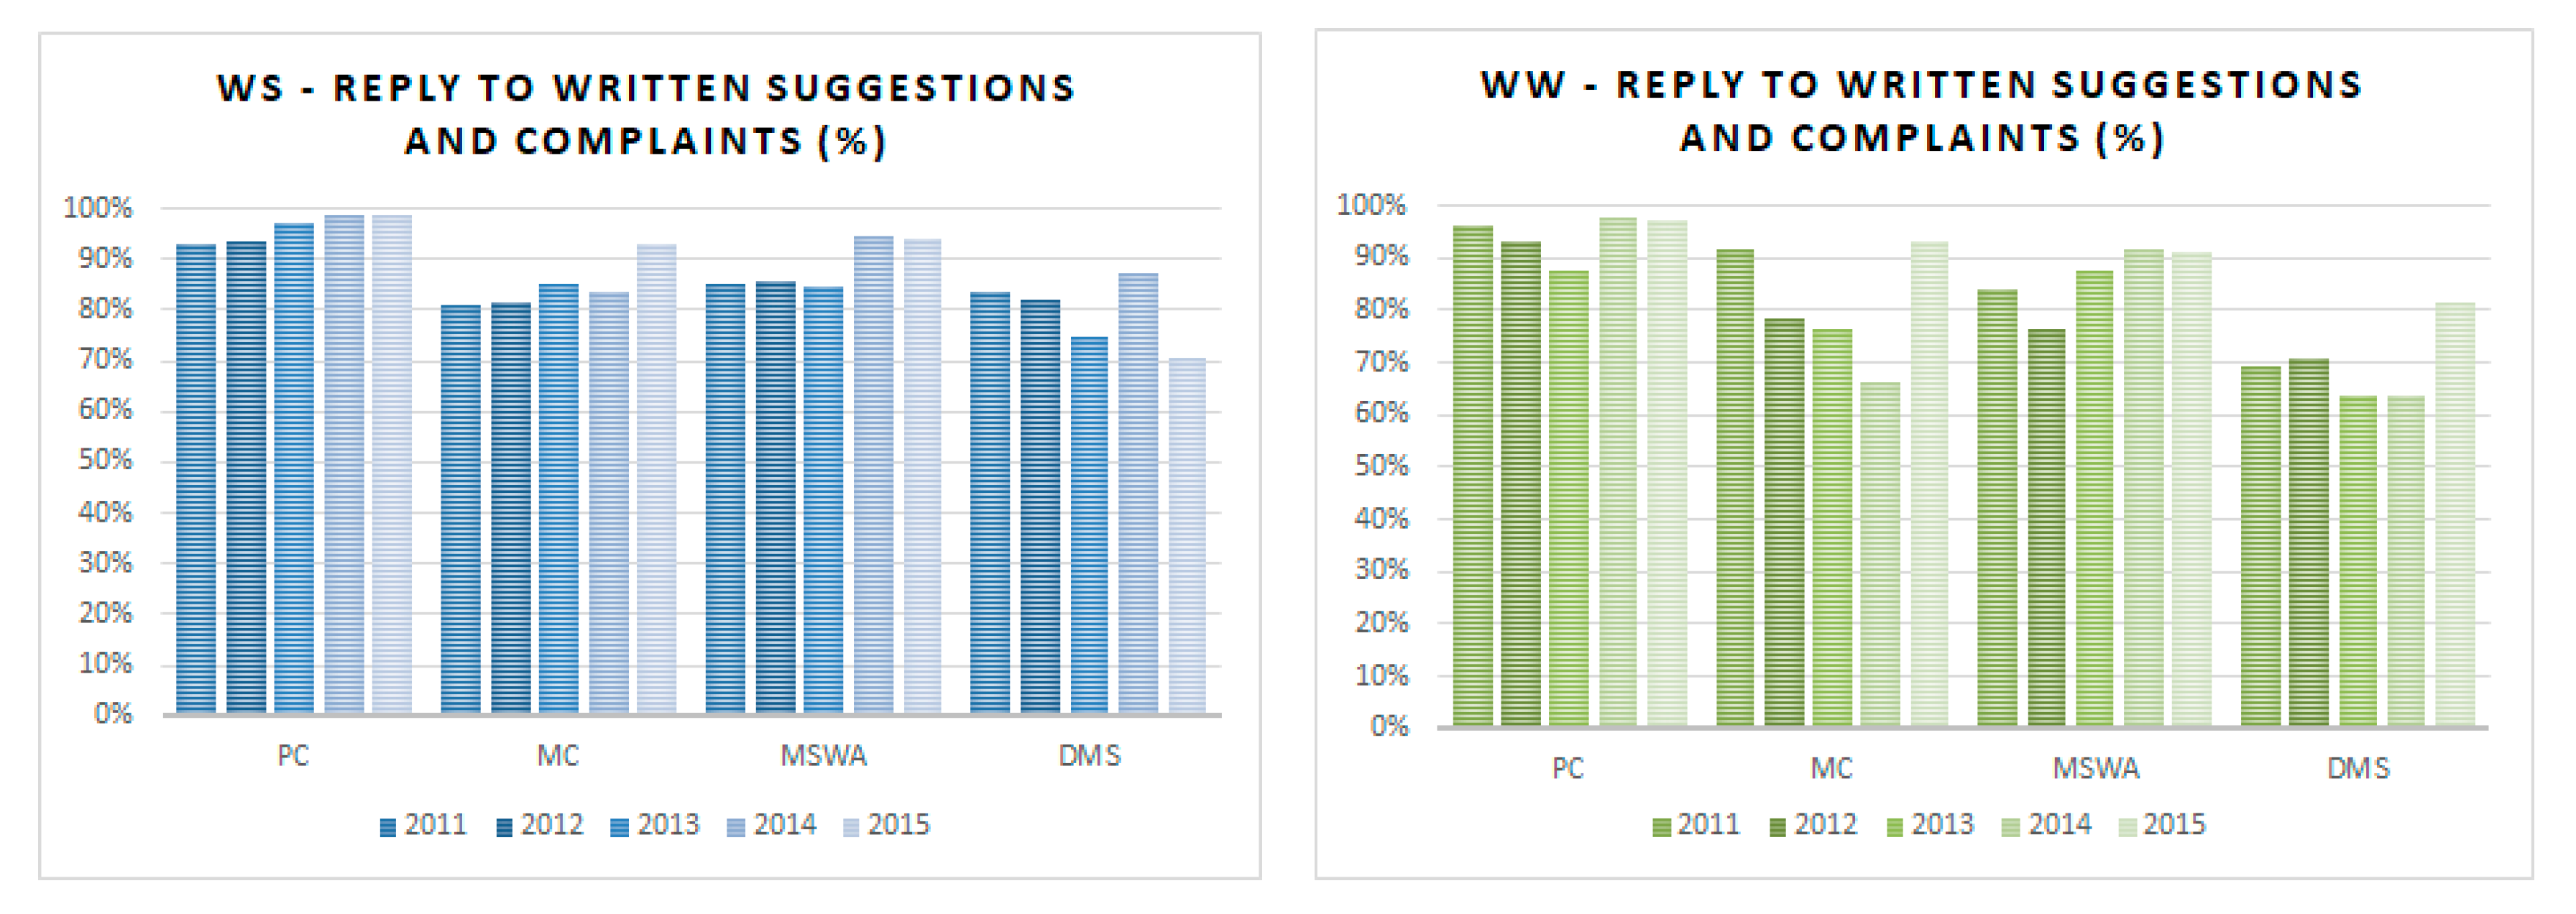
3.3.2. Customer Service
Customer service is evaluated by means of the ERSAR’s indicator response to complaints and suggestions, which can be observed through the management of complaints and suggestions received and duly forwarded. Figure 6 illustrates the evolution of this indicator. Data are based on ERSAR’s annual reports (RASARP).
Since these are essential public services, it is recommended that the users′ requirements and complaints are adequately treated. Therefore, a ’good’ performance level, according to ERSAR, is assigned when the operators respond to all of the complaints and suggestions from users in due time (i.e., 100% response). In turn, the average performance is assigned between 85% and 100%.
By analyzing Figure 6, it can be observed that no management model, on average, reaches the ’good’ level of performance. However, the private sector stands out as the only sector that, during the period under review, has always increased the quality of service and, in 2015, only three of the 29 operators did not achieve the “good” level of performance, showing higher concern for the issues and problems identified by its users.
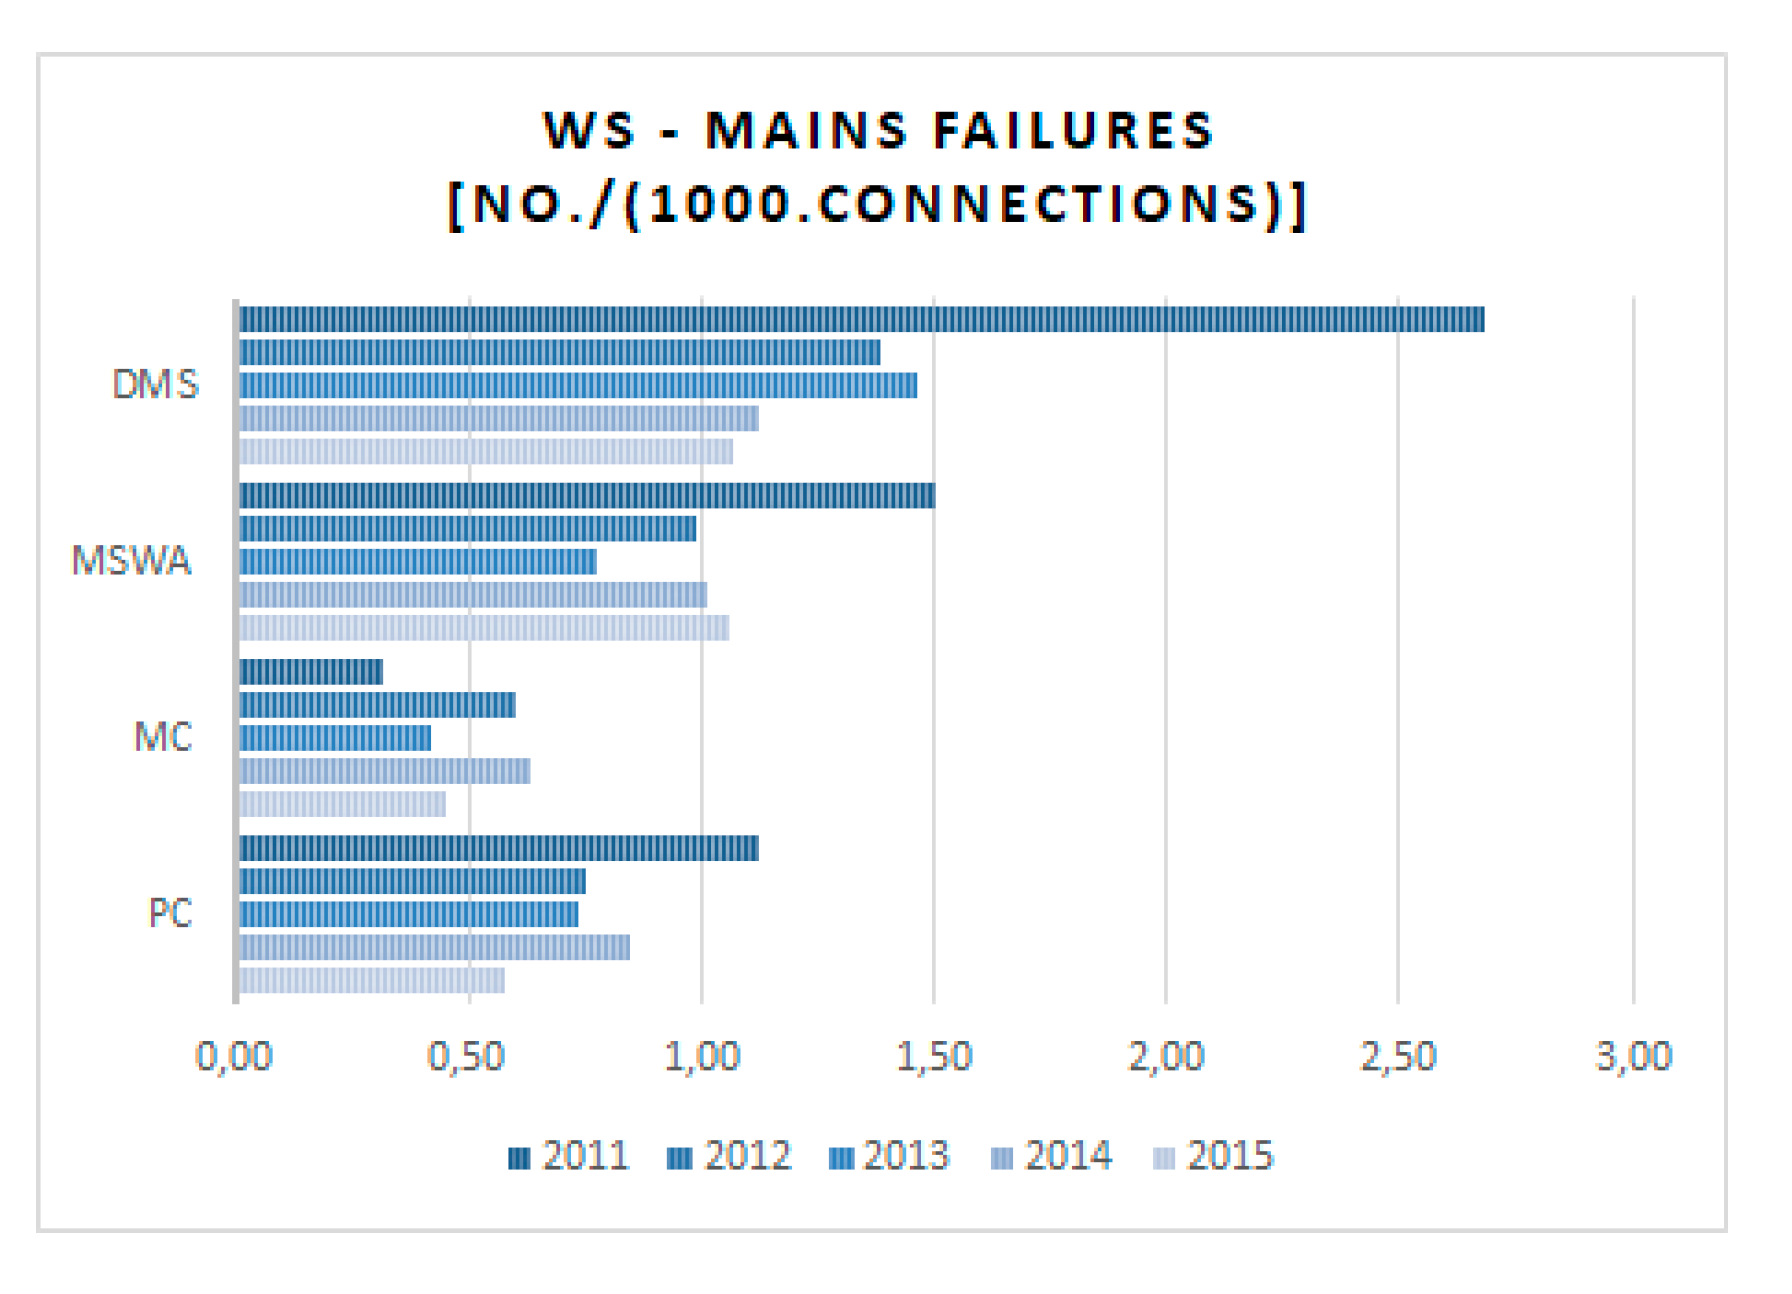
3.3.3. Service Failures
Concerning water supply, service failures are evaluated by means of a KPI, whose aim is to assess the frequency of interruptions. Figure 7 shows the performance evolution of the various operators. ERSAR’s annual reports are the data source.
For this KPI, the reference level of ERSAR is the occurrence of one failure per 1000 connections, and the average performance is defined by the results that were achieved between 1 and 2.5 failures per 1000 connections. In this context, both private operators and MCs show good performance. However, the private sector once again stands out, as it mainly operates in rural areas. This is another sign of the quality of the operation and maintenance carried out by private operators and of the effectiveness of the investments made.
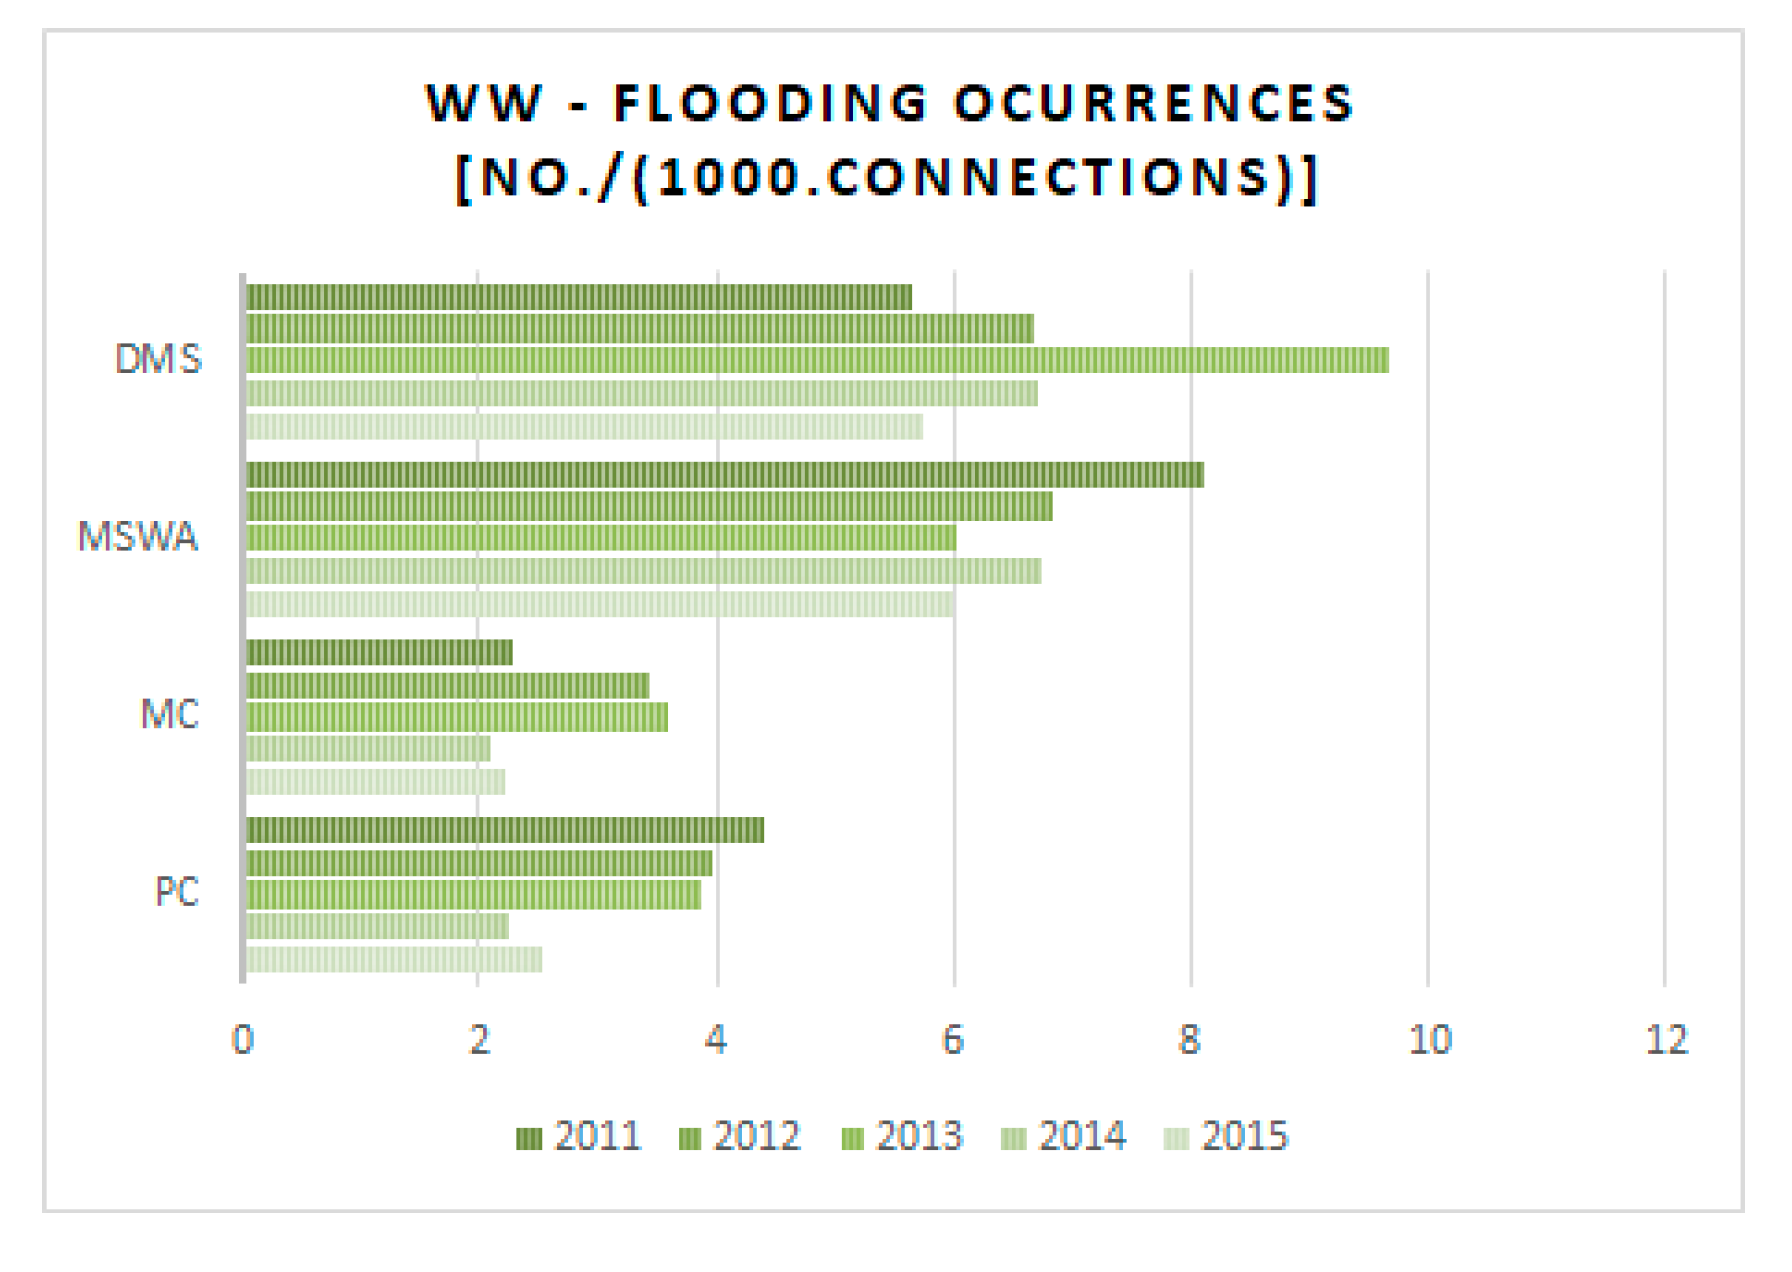
As far as wastewater service is concerned, the KPI relative to floods aims to evaluate the occurrence of floods originating in the drainage network. The ERSAR’s reference value for this KPI is that a maximum of 0.25 floods occur per year for every 1000 connections. In turn, the average performance is defined by the occurrence of floods between 0.25 and one per 1000 connections. Figure 8 illustrates the evolution of this indicator for the different operators. The annual reports of ERSAR are the source for the data.
It is observed that none of the management models, on average, are able to reach the level of performance considered to be satisfactory (by ERSAR), and this is a situation that, of course, should be reviewed and improved. Despite the negative performance of most operators, a generally positive evolution of private operators is noticeable, in contrast with the trend shown by the other operators. Moreover, the best results are achieved by the private sector alongside the MCs.
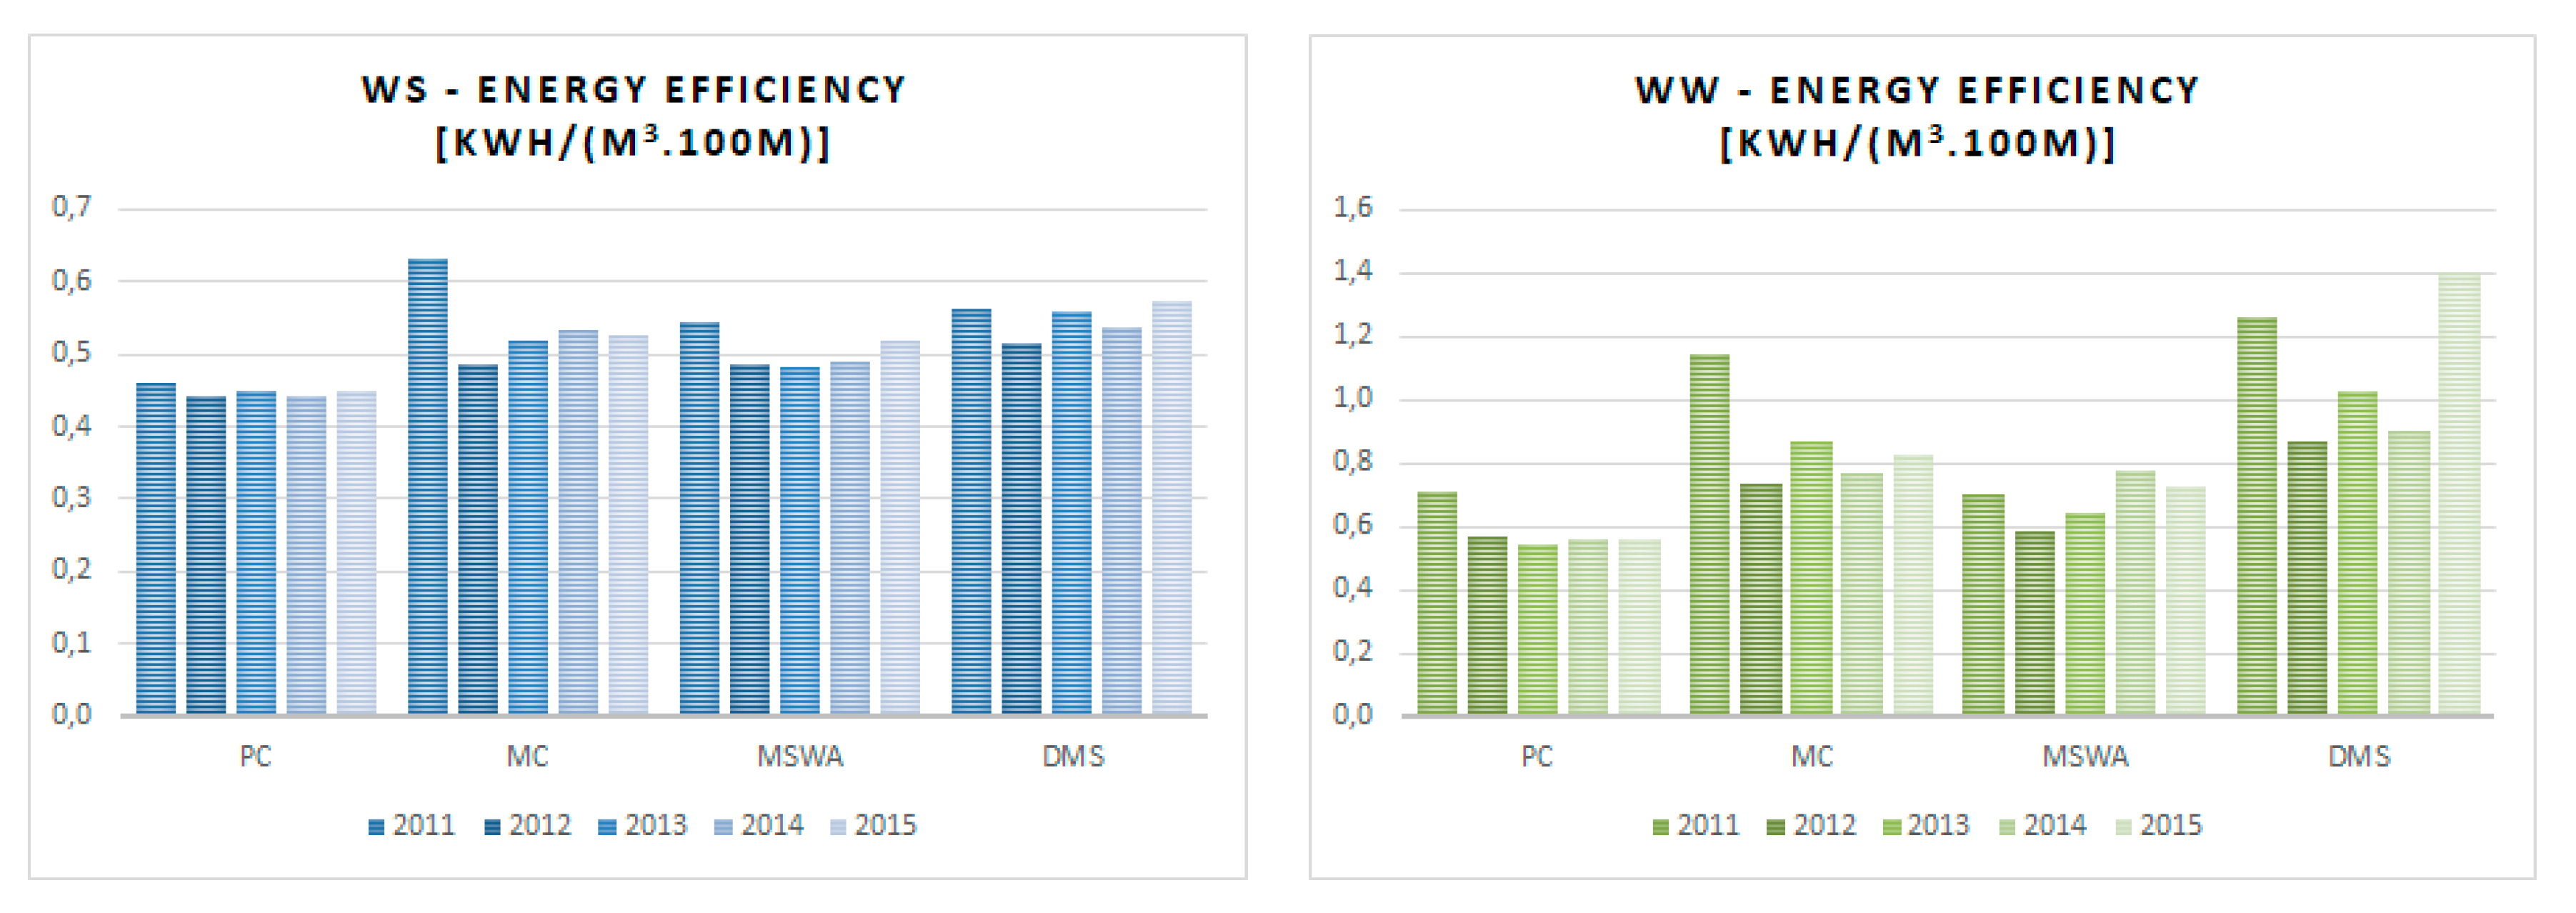
3.3.4. Energy Efficiency
Energy efficiency aims to assess the level of use of energy resources by operators, particularly the energy consumption that is necessary to pump water or wastewater. Figure 9 shows the performance evolution of the energy efficiency indicator.
A good level of performance for this indicator in the water service, in accordance with ERSAR’s guidelines, is achieved when the operators are able to pump 1 m3 of water over 100 meters, consuming a maximum of 0.4 kWh of electricity (and a minimum of 0.27 kWh). In turn, the average performance level is determined by energy consumption between 0.4 and 0.54 kWh per m3 and per 100 meters head. For wastewater, the values are 0.45 and 0.45 and 0.68 kWh per m3 and per 100 meters head, respectively.
Figure 9 shows that the different operators, on average, are not able to achieve a “good” performance in this indicator. Additionally, private sector performance should be emphasized, because despite not achieving a “good” performance rating, on average, it has the best result among all management models. Data are based on ERSAR’s annual reports.
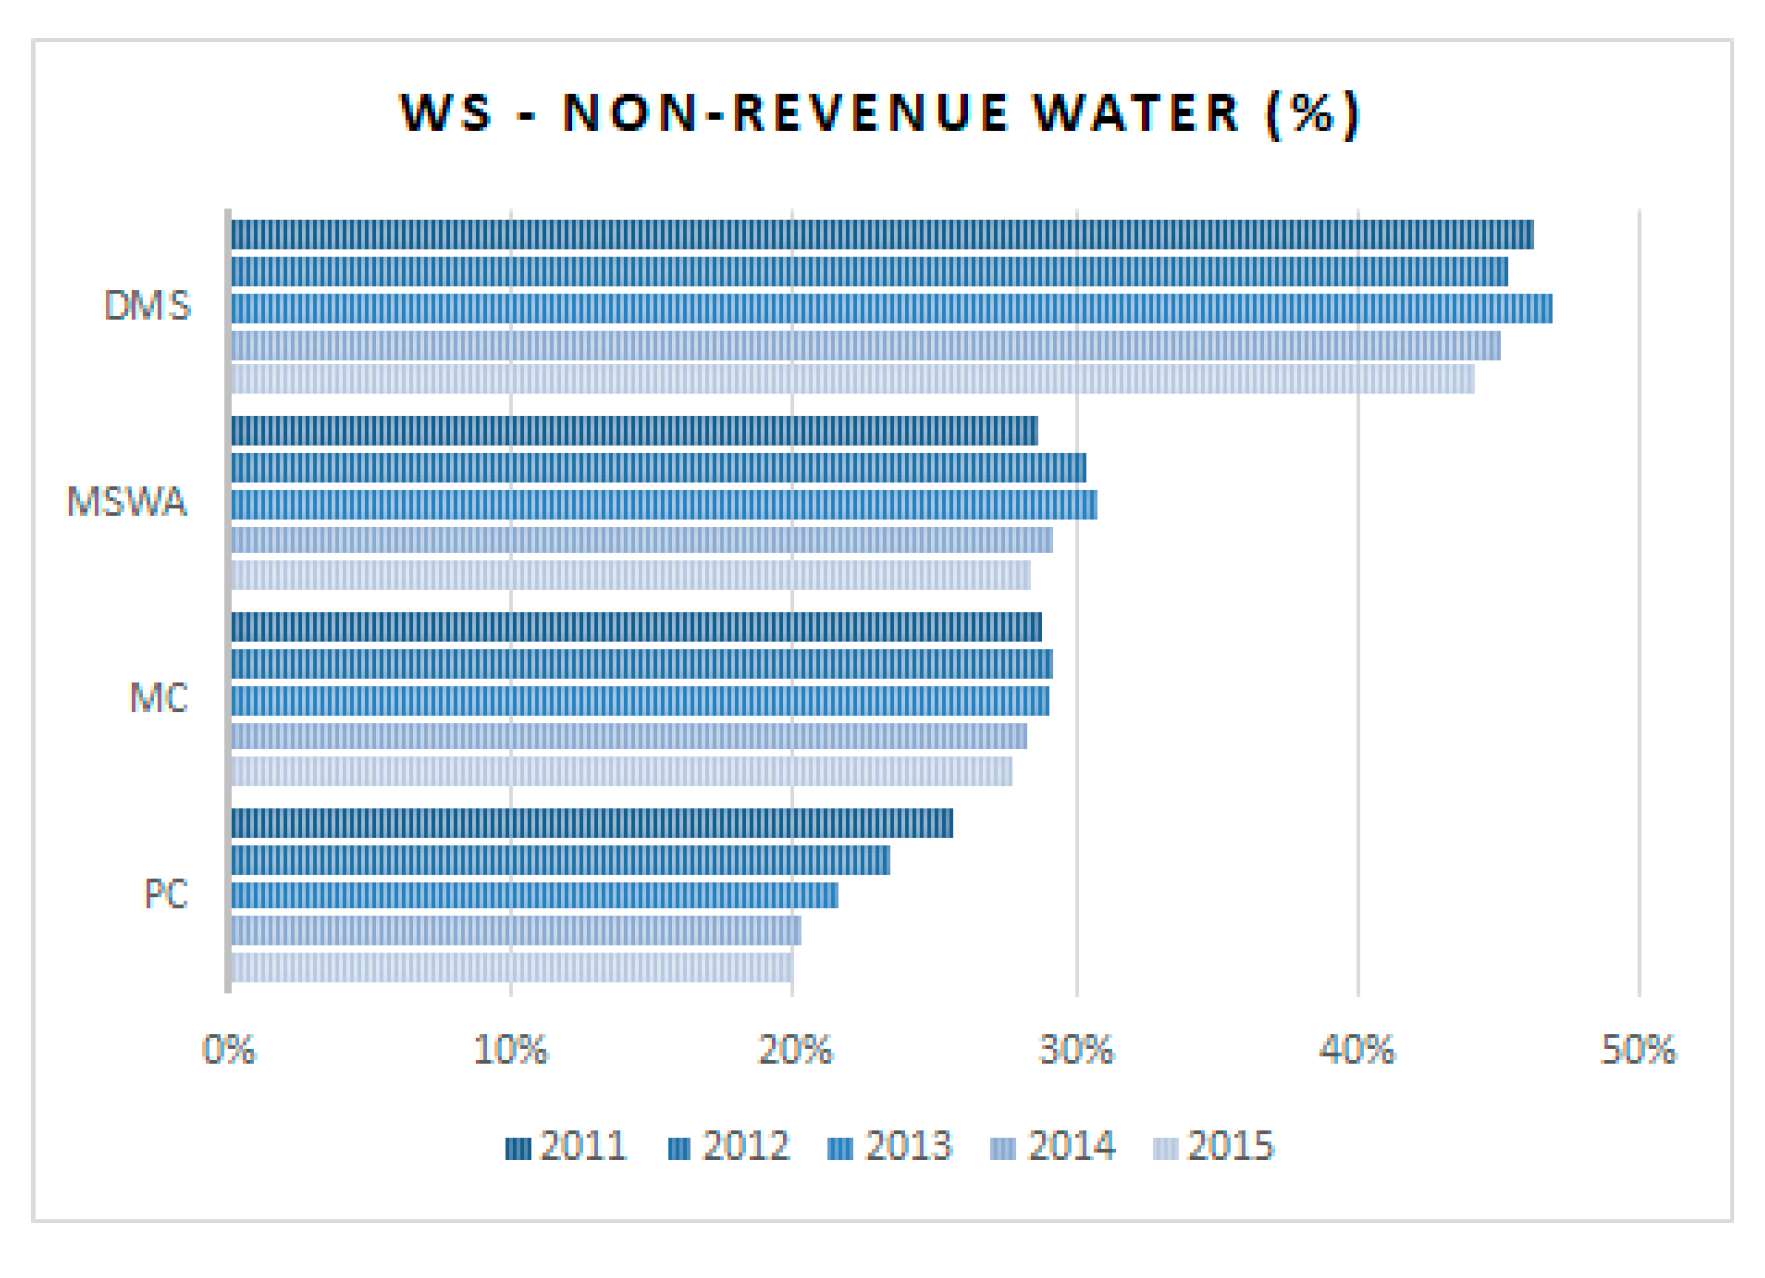
3.3.5. Non-Revenue Water
The non-revenue water indicator tries to reflect the level of financial and physical losses of water that enters into the system and that is not billed to customers. Figure 10 illustrates the evolution of the indicator for non-revenue water by the various management models.
The reference value for “good” performance is up to 20% for non-revenue water, while the average performance corresponds to results between 20 and 30%, according to ERSAR.
As Figure 10 shows, no management model achieves “good” performance. With the exception of DMS, all other models have satisfactory efficiency. The annual reports of ERSAR are the source for the data.
However, the results accomplished by the private sector must be underlined. In addition to a very positive evolution over the period analyzed between 2011 and 2015, the private sector achieved a much higher performance than the other management models, being close to the threshold of good performance set by e ERSAR. While private operators, on average, reached a level of 20.2% of non-revenue water in 2015, MCs accomplished approximately 27.7%, MSWA 28.4%, and DMS 44.2%.
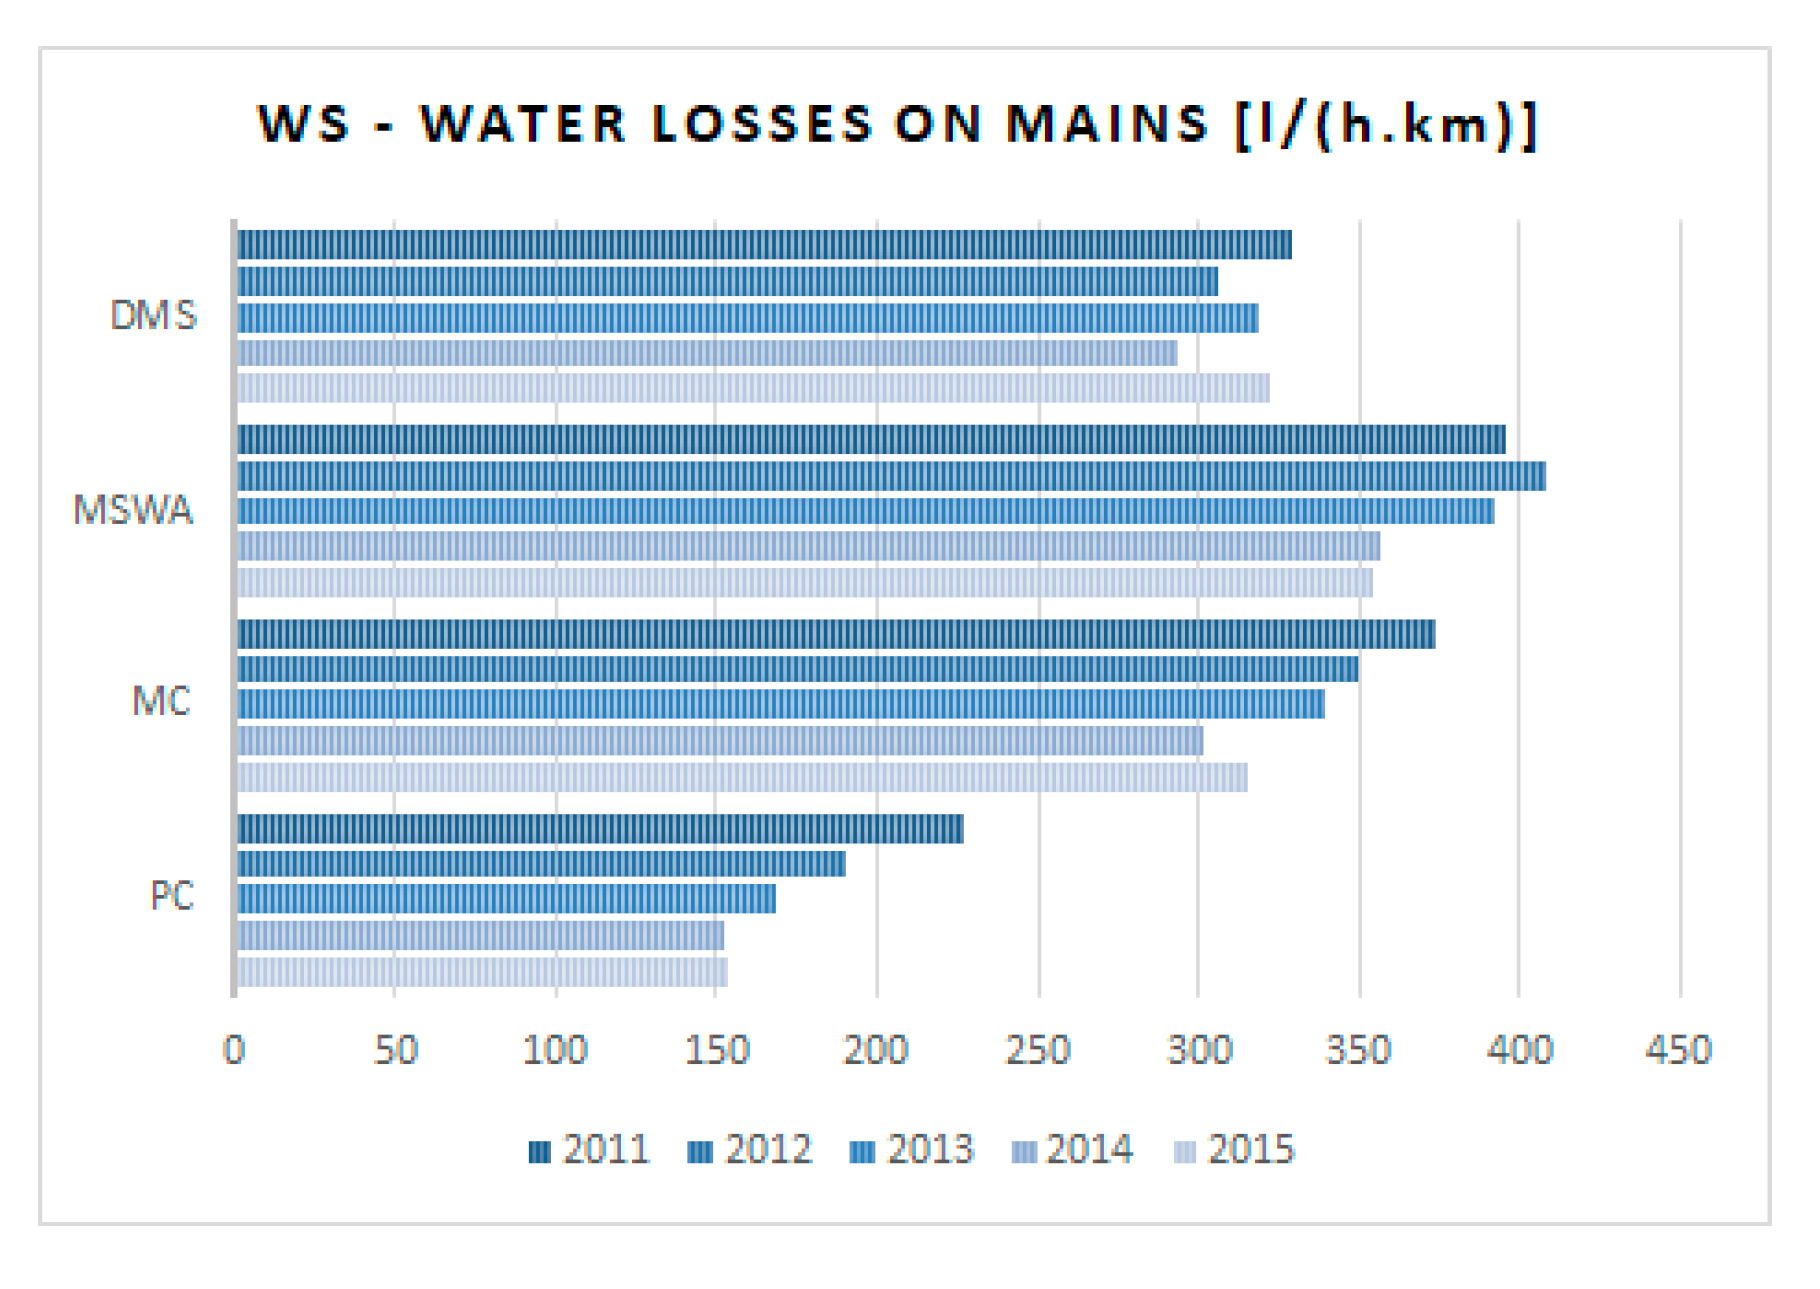
3.3.6. Network Losses
Water losses in the network can be considered to be a KPI that is complementary to the non-revenue water indicator.
Figure 11 illustrates the evolution of water losses in the network per management model.
Although without reference in the ERSAR’s quality of service regulation model, this KPI shows, once again, good performance for private operators, being far ahead of the other operators. Data are based on ERSAR’s annual reports.
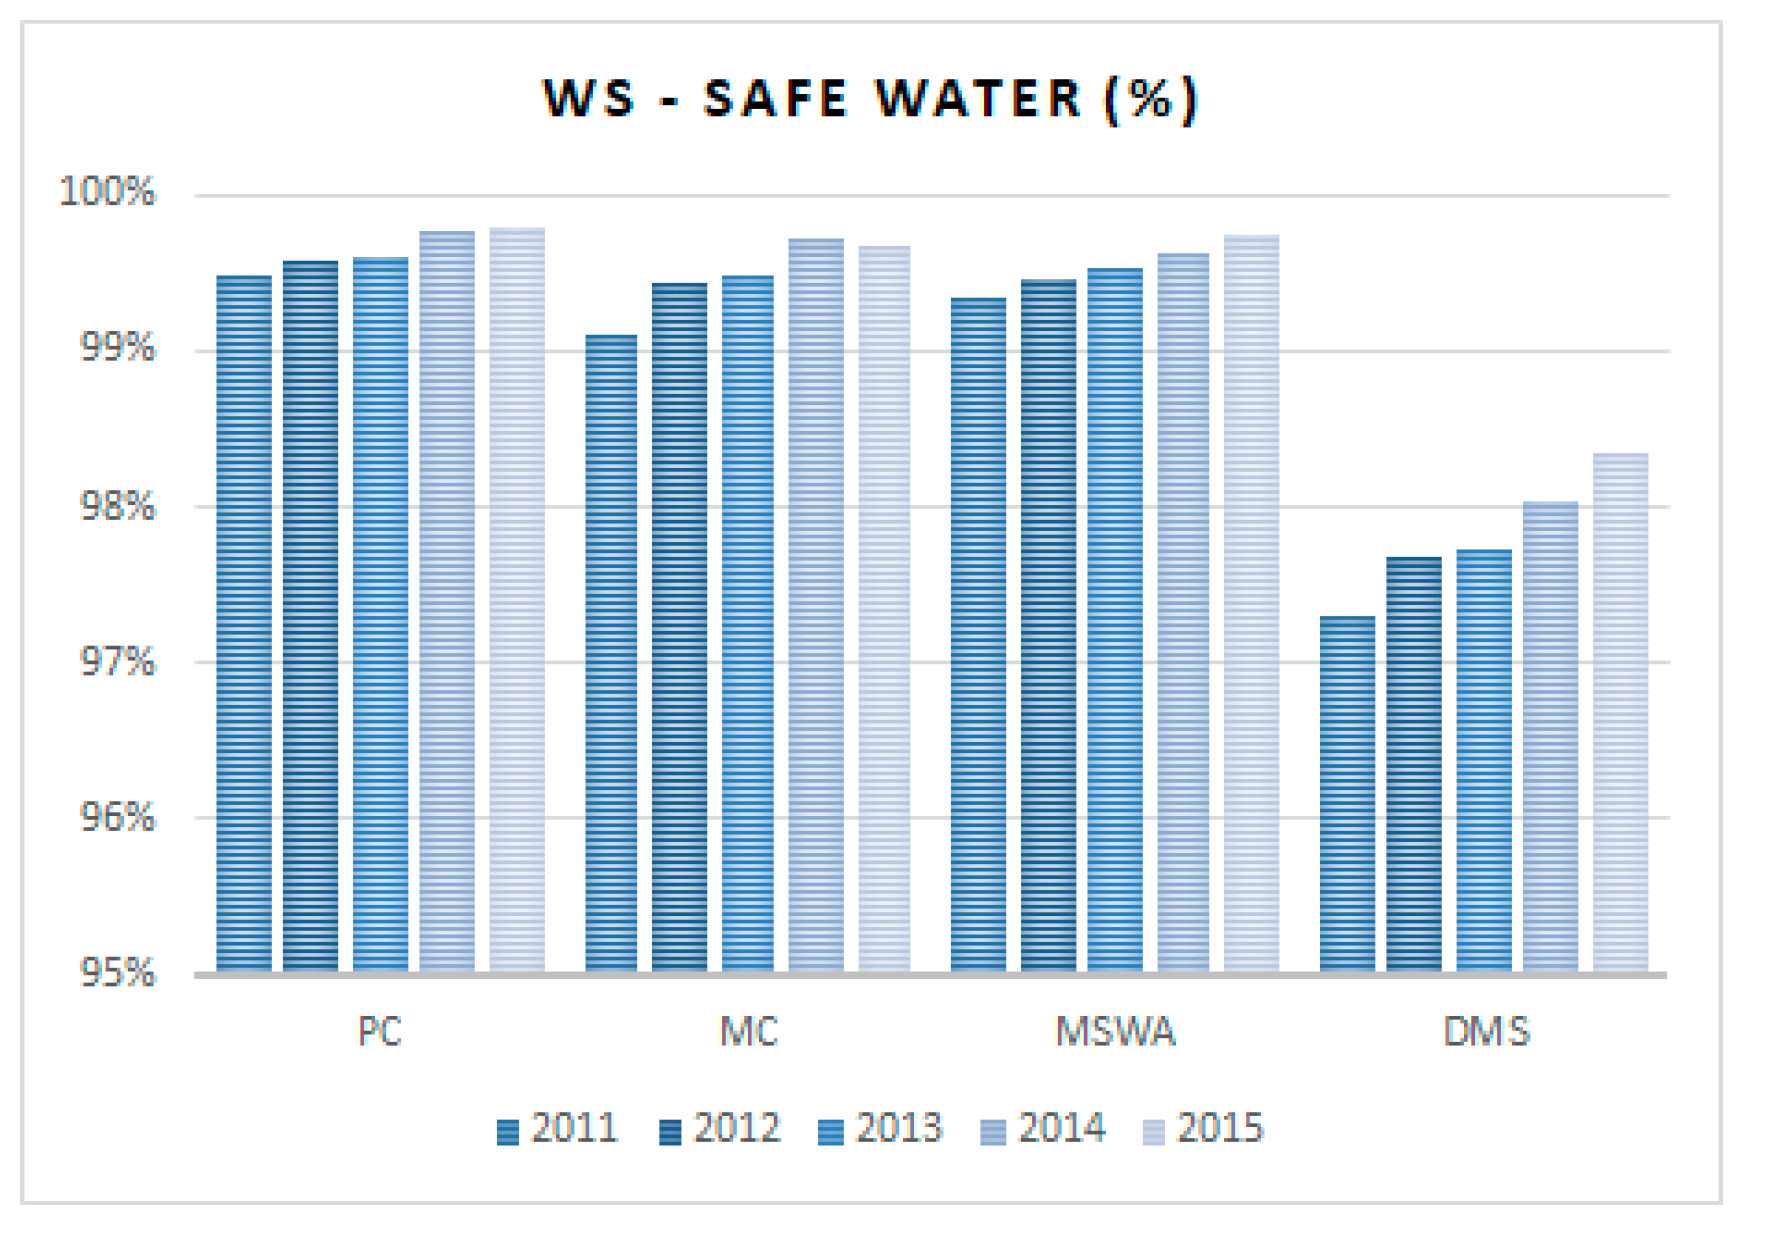
3.3.7. Water Quality
The water quality KPI intends to assess whether the water that is supplied to customers complies with all the legal requirements, including those that are defined by ERSAR. Figure 12, below, illustrates the evolution of the water quality indicator.
The reference value corresponds to results equal to or greater than 98.5%, according to ERSAR. The average performance is set for water quality compliance levels that are equal to or greater than 94.5 and below 98.5%.
The various management models (except for DMS) had a “good” water quality performance and highlighted a very positive evolution, as Figure 12 shows. However, the private sector must be underlined, as it has been providing good water quality since 2011, achieving the best results among the different management models. Data are based on ERSAR’s annual reports.
3.3.8. Compliance with Discharge Parameters
The KPI of compliance with discharge parameters is associated with wastewater treatment and destination and, therefore, with compliance with the legal parameters of discharge. Figure 13, below, illustrates the evolution of this indicator for the various management models. The annual reports of ERSAR are the source for the data.
The reference level of this indicator corresponds to full compliance with the legal parameters of wastewater discharge (i.e., 100%), according to ERSAR. The average reference corresponds to performance levels between 95 and 100% compliance.
Analyzing the previous figure, it is observed that private management model and MCs have shown a much better evolution than direct management models (DMS and MSWA). The private sector stands out, once again, with the best result regarding compliance with the discharge parameters, being the only management model that achieves an average level of performance. This circumstance might highlight the best practices of operation and maintenance of private management.
In short, H2 considered that private operators would provide a worse quality of service than public operators, with regard to both water and wastewater services. This could perhaps be motivated by their lower expenses, allowing for them to maximize their profits.
However, after detailed analysis of the set of KPIs, it is possible to conclude that the private sector achieves the best results in eight of the 12 KPIs considered and it is in line with the other management models concerning the remaining KPIs.
For the reasons given above, it is possible to categorically refute H2 that private operators provide a worse quality of service than public operators, since they represent the management model that, overall, shows the best performance.
3.4. Analysis of the Prices and Tariffs Implemented (H3)
Finally, it should also be noted that there is a preconceived idea in society and among water sector stakeholders that the tariffs put into practice by private operators are higher than those that were implemented by their public counterparts and that private operators are mostly profit-oriented [31,38].
However, while private operator tariffs in some cases may be higher than those of public operators, when they are, generally they are not associated with excessive profits but reflect compliance with the contractual obligations, which often are disproportionate to the economic, financial, and even social reality of WSS.
High rents or even investment plans with significant amounts and without European Community funding have to be recovered by means of tariffs, which inevitably imply a tariff increase. Additionally, the need to depreciate investments in the concession term when public operators can do so in longer periods leads to higher costs, which is particularly penalizing in large WSS works with high investments (e.g., dams).
Moreover, the option for private partnership in most situations does not arise due to the benefit of the option, but rather due to the so-called scissors effect, related to the existence of very serious problems (e.g., very indebted municipalities, rural systems, low coverage, or very poor technical conditions requiring large investments). Contrarily, in other countries, the private sector participation takes place in urban areas and when the systems are new and in good technical conditions, meaning that they are very profitable which is not the typical case in Portugal.
The last hypothesis or perspective to be tested, hypothesis 3 (H3), presupposes that private operators apply higher tariffs than public operators, thereby maximizing their profits.
At this stage, the aim is to analyze the financial performance of the different operators through the average tariff and the associated cost recovery.
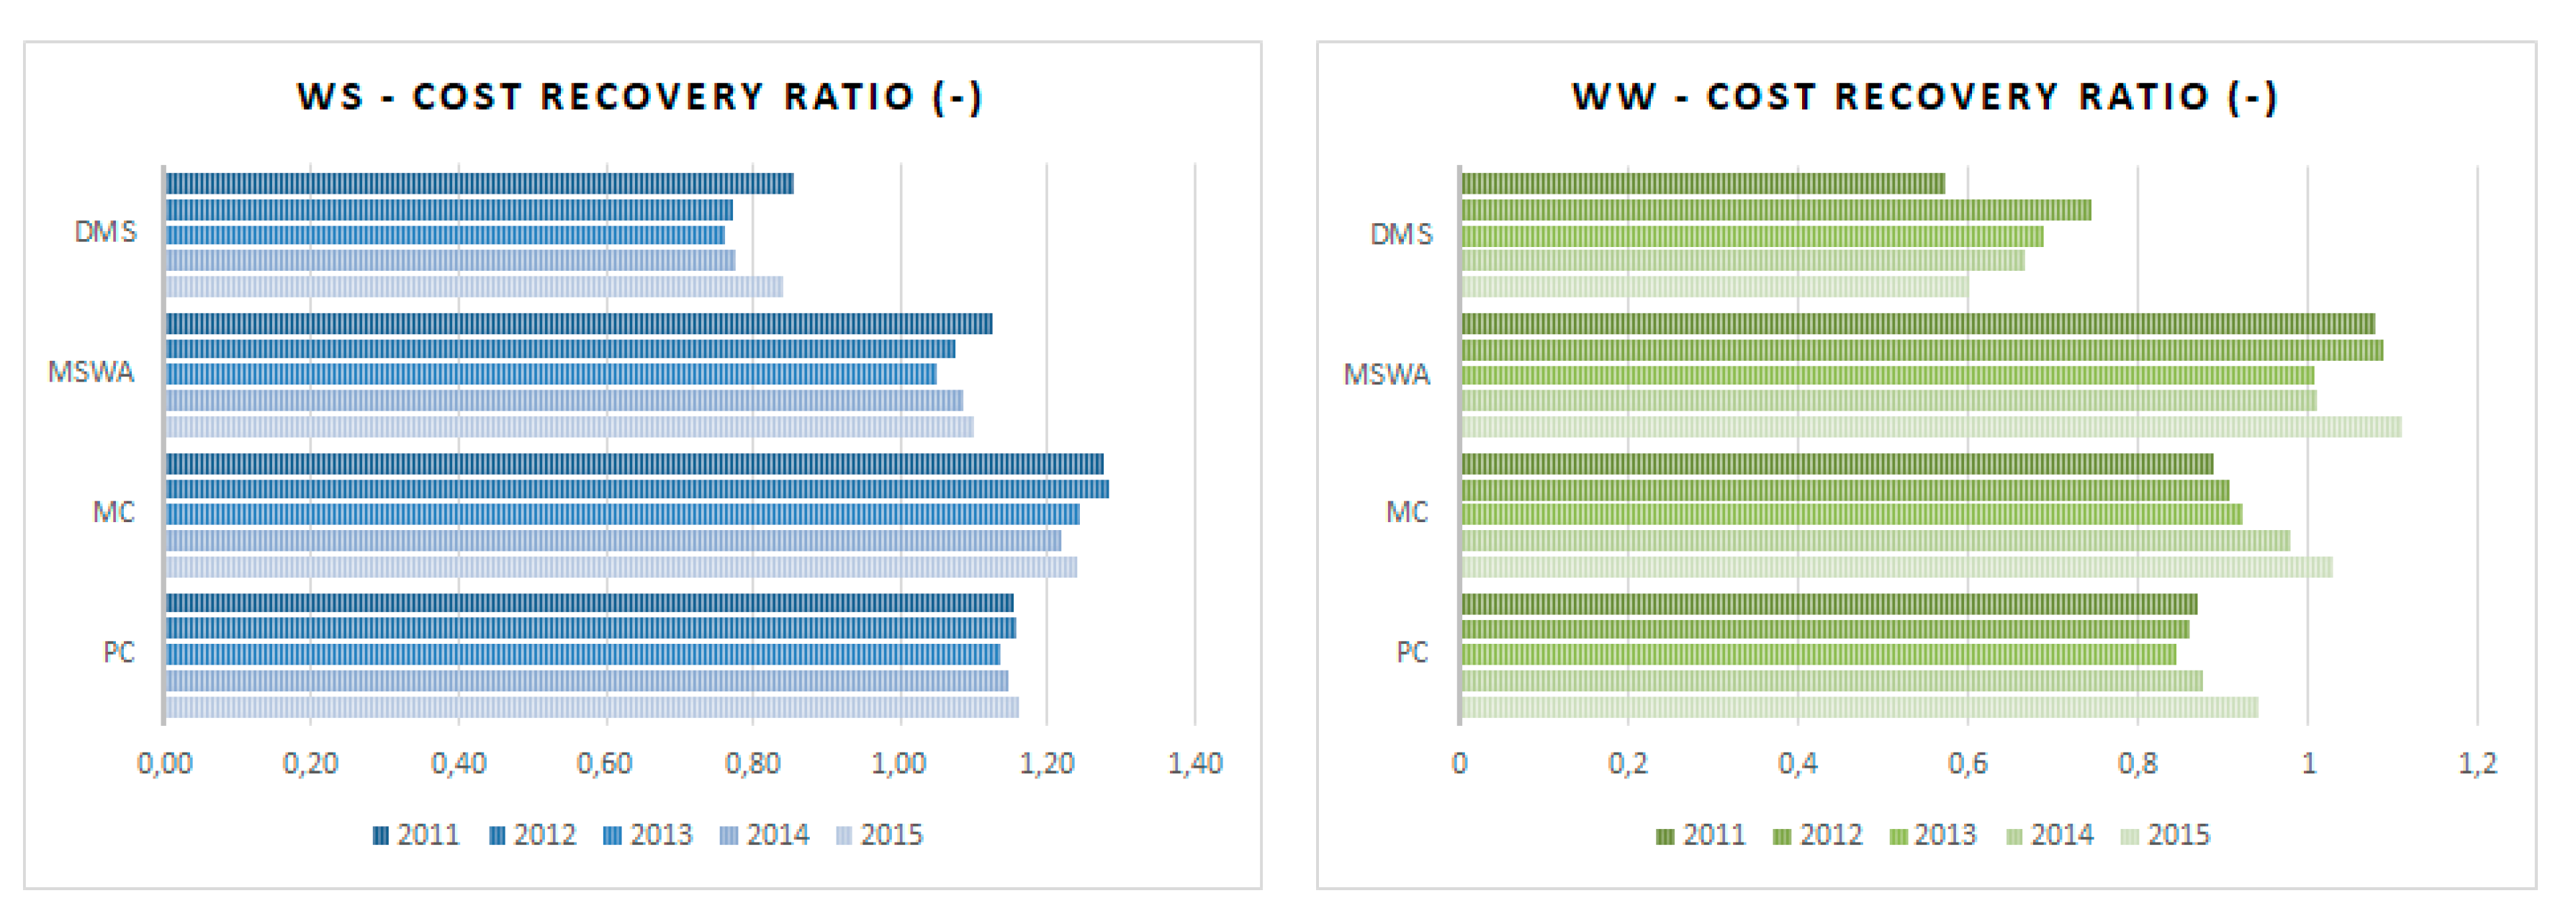
3.4.1. Cost Coverage
The cost coverage KPI aims to assess the level of financial sustainability of operators by covering the total costs. Figure 14 illustrates the evolution of this indicator.
The KPI of cost coverage for both water supply and wastewater, according to ERSAR’s guidelines, presents reference values between 1.0 and 1.1, which means a level of profitability between 0% and 10%. In turn, the average performance level corresponds to the results between 0.9 and 1.0 and between 1.1 and 1.2, thus penalizing both the overvaluation and undervaluation of tariffs. Performance at other values is considered to be unsatisfactory by ERSAR. The source for the data is the annual reports of ERSAR.
Figure 14 seems to show that private sector operators have robust financial sustainability and a relatively adjusted level of cost coverage in water service, although slightly above the reference value. On the one hand, the level of excessive profitability of MCs and, on the other hand, the under-profitability of the DMSs in terms of financial performance and cost recovery, must also be stressed. It is observed that the majority of wastewater operators are in deficit, a situation that might be explained by the fact that this activity is subsidized by the water service.
It is observed that private operators’ performance is overall good if subsidization between services is considered and the joint cost coverage in the WSS is analyzed, according to ERSAR’s guidelines. In contrast, the DMSs’ poor performance emphasizes the fragile economic situation as a consequence of putting “political prices” in practice.
3.4.2. Tariffs in Force
The tariffs of operators are closely linked to their economic and financial sustainability, so tariff levels should never be analyzed by themselves, but the factors determining the prices charged should also be considered, such as operating costs (e.g., water production costs) and capital costs (investments, etc.), or, when private sector participation exists, rents paid to municipalities and financing needs.
Table 5 shows the average monthly charges by management model. DMSs that did not recover at least 80% of the total costs were not considered. Data are based on ERSAR’s annual reports.
The average charges were computed when considering an average household consumption of 10 m3 of water per month. When observing the table, the first analysis gives the idea that private operators actually apply higher tariffs than other operators. However, it emphasizes an “apples with oranges” comparison, since there are some requirements that the private sector is obliged to assume (taxes, rent payments, depreciation rules, …) and respect, which, of course, are reflected in the final price charged to users.
Concerning the investment obligations of private operators, if they were able to finance themselves mainly using European Community funds, as is the case with public operators, they would have a margin for reducing the tariffs by approximately € 0.15/m3 (taking the financial statements of the different concessionaires into account).
Additionally, if the rents paid to the municipalities by many concessionaires were removed, there would be savings of € 0.19/m3 (as saved by public operators).
Table 6 below shows the potential average monthly WSS charge if the amounts private operators pay in rents were transformed into a discount in the tariff and if the investments were subsidized, as they are for public operators. The annual reports of ERSAR and the financial statements of the operators are the source for the data.
Thus, after updating tariffs by removing the impact of rent and subsidy, it is observed that private operators seem to be able to implement a lower tariff than MCs and MSWAs. Note that, even when removing these two fundamental aspects of WSS costs, there are still other costs that the private sector redistributes to the public interest and that are not counted here, for example, those that are included in the tax burden that in public management models do not exist or are less penalizing (e.g., income tax).
To sum up, H3 presupposes that private operators apply higher tariffs than public operators, thereby maximizing their profits. After an analysis to the costs of the different management models, by removing the exogenous particularities of private management for the comparison between the various models to be fair and possible to perform, the private operators, on average, seem to implement lower or, at least, reasonable tariffs, and they could pose lower charges to customers if they enjoyed the same conditions, so H3 can also and should be refuted.
Finally, it should be emphasized that these results are naturally related not to the fact that private operators do not seek and do not enjoy profits, but to the fact that they are more efficient and productive and they provide more value for money for the WSS.
3.5. Discussion
The comparison of the various management models and the performance evaluation of the private sector in WSS provision was achieved through the formulation of three hypotheses or perspectives (H1, H2, and H3) corresponding to the main ’myths’ about the performance of the private ownership of the WSS in Portugal. Thus, this analysis provides some contributions to elucidate the most skeptical and dismiss uncertainties related to three key issues: the effectiveness and efficiency of the investments made, the level of quality of service provided, and the tariffs implemented.
Regarding the investment made in the “retail” system, the private sector seems to show better performance, both in water and wastewater services, and it uses less financial resources per new inhabitant served. While the private sector takes total responsibility for the investments made, the public sector mainly uses European Community funds, which encourages the private sector to seek greater efficiency and effectiveness.
Concerning the quality of service, it is observed that private operators seem to perform better in most of the indicators adopted in the analysis, obtaining better scores than the other management models in eight of the 12 KPIs studied. When considering the four KPIs in which the private sector does not obtain the best results, the sector shows an average performance in line with that of the other management models.
With regard to the tariffs, although private operators apply higher tariffs due to the stricter requirements that they have to comply with, in particular the rents paid and the lack of subsidization of investments, they actually seem to perform better in terms of tariff balance.
In summary, the three hypotheses were rejected based on the results of the analyses performed for WSS in Portugal. More than estimating whether private management is more efficient than public management or vice versa, this study helps to dismiss the ’myths’ and ’dogmas’ that exist in the water sector in Portugal and in other countries, which, due to a set of circumstances, have persisted without coherent justification. It is believed that, for the sustainable development of the water sector in any country, all of the management models can be relevant and make their contributions, and viable and credible options should not be ruled out.
4. Conclusions
This article aims to demystify some ideas and concepts that have proliferated and become consolidated in society and among water sector stakeholders, namely, the principle that WSS private operators cannot efficiently and effectively provide services at reasonable prices [39]. Therefore, this study looked at central issues, such as investments made for the expansion and modernization of WSS (H1), the quality of service provided (H2), and the tariffs charged to ensure sustainability services (H3).
In view of the hypotheses listed, the data seem to show that private operators in Portugal are more efficient and effective in making investments (H1), provide a better quality of service (H2), and, under similar conditions, offer tariffs that are more reasonable (H3).
Thus, it is concluded that the private sector is an important stakeholder in the Portuguese water sector, complementing the role of the public sector. It has also served as a lever of the water sector in Portugal, through effectively implementing planned investments, increasing WSS access, and transferring know-how to the public sector, either through shareholder participation in municipal companies or through the concession model. Before the 1990’s, when the participation of private sector was not possible, the performance of the Portuguese water sector was rather poor; however, with the water reforms in 1993 and the following that allowed private sector participation and considerably enhanced the market structure and the rules of the game, the improvement of the main indicators, both physical and quality (access and drinking and water resources quality) and operational indicators (e.g., water losses) of the sector was substantial [22].
Finally, although, in theoretical terms, the option of private management has advantages when compared to public management in the current context, and despite the requirements of WSS functioning, there are very good private operators, but also others that are less competent, just as there are good public operators and those with a mediocre performance. Moreover, the particular operational environment of the WSS does matter and it can make the difference. In this article, besides having removed the outliers, the average performance of the samples was compared, so that the particular effect of the WSS characteristics will probably be mitigated and the existing bias will not alter the results trend. However, diverse WSS characteristics can indeed result in different performance and the best conditions for private and public ownership are still an open question.
Thus, it is very important for the WSS in Portugal and, globally, to be able to consider and even expand private sector participation. However, for this to be possible, it is necessary to reveal and dispel the bias that exists in society and among the sector stakeholders that private companies are always malicious and only focused on profit, providing WSS with poor quality of service. This study intended to address this misconception and contribute to a balanced perspective to this area.
Author Contributions
All authors have contributed equally to this paper development. R.C.M. was responsible for the study and wrote an initial version of the paper. P.S. reviewed and made substantial criticisms and changes on the entire manuscript. All authors have read and agreed to the published version of the manuscript.
Funding
This research was funded by AEPSA—Portuguese Association of Environmental Sector Companies which is an association of the Portuguese companies that operate in the environmental sector.
Conflicts of Interest
The authors declare no conflict of interest.
References
- Marie, T. Public values as essential criteria for public entrepreneurship: Water management in France. Util. Policy 2016, 40, 162–169. [Google Scholar] [CrossRef]
- United Nations. The Human Right to Water and Sanitation. In United Nationals General Assembly Resolution 64/292, 2010; Adopted by the General Assembly on 28 July 2010, A7RES/64/292, 2010; UN: New York, NY, USA, 2011. [Google Scholar]
- United Nations. Beyond Sustainable Development Goal 6. In SDG 6 Synthesis Report 2018 on Water and Sanitation 2018; UN: New York, NY, USA, 2018; pp. 129–176. [Google Scholar]
- Tosun, J.; Triebskorn, R. Civil Society and the Governance of Water Services: German Political Parties’ Reactions to Right2Water. Water 2020, 12, 743. [Google Scholar] [CrossRef] [Green Version]
- Marques, R. Regulation of Water and Wastewater Services: An International Comparison; International Water Association Publishing: London, UK, 2010; Volume 9, p. 480. [Google Scholar] [CrossRef]
- Boardman, A.; Vining, A. Ownership and Performance in Competitive Environments: A Comparison of the Performance of Private, Mixed, and State-Owned Enterprises. J. Law Econ. 1989, 32, 1–33. [Google Scholar] [CrossRef]
- Boycko, M.; Shleifer, A.; Vishny, R.W. A Theory of Privatisation. Econ. J. 1996, 106, 309. [Google Scholar] [CrossRef]
- Marques, R.C. Comparing private and public performance of Portuguese water services. Water Policy 2008, 10, 25–42. [Google Scholar] [CrossRef]
- Bel, G.; Fageda, X.; Warner, M.E. Is private production of public services cheaper than public production? A meta-regression analysis of solid waste and water services. J. Policy Anal. Manag. 2010, 29, 553–577. [Google Scholar] [CrossRef] [Green Version]
- Jensen, O. Public–private partnerships for water in Asia: A review of two decades of experience. Int. J. Water Resour. Dev. 2016, 33, 1–27. [Google Scholar] [CrossRef] [Green Version]
- Mulreany, J.P.; Calikoglu, S.; Ruiz, S.; Sapsin, J.W. Water privatization and public health in Latin America. Rev. Panam. De Salud Pública 2006, 19, 23–32. [Google Scholar] [CrossRef] [Green Version]
- Kishimoto, S.; Lobina, E.; Petitjean, O. Our public water future. In The Global Experience with Remunicipalisation; Transnational Institute (TNI); Public Services International Research Unit (PSIRU); Multinationals Observatory; Municipal Services Project (MSP); The European Federation of Public Service Unions (EPSU): Brussels, Belgium, 2015. [Google Scholar]
- Razavi, N.S. ‘Social Control’ and the Politics of Public Participation in Water Remunicipalization, Cochabamba, Bolivia. Water 2019, 11, 1455. [Google Scholar] [CrossRef] [Green Version]
- Estache, A. How Different Is the Efficiency of Public and Private Water Companies in Asia? World Bank Econ. Rev. 2002, 16, 139–148. [Google Scholar] [CrossRef] [Green Version]
- Carvalho, P.M.S.; Marques, R.C.; Berg, S.V. A meta-regression analysis of benchmarking studies on water utilities market structure. Util. Policy 2012, 21, 40–49. [Google Scholar] [CrossRef] [Green Version]
- Dinis, S.; Marques, R.E. Análise das Parcerias Público-Privadas nos Serviços Municipais de Água e de Águas Residuais; Associação das Empresas Portuguesas para o Sector do Ambiente: Lisbon, Portugal, 2010; p. 111. [Google Scholar]
- Cruz, C.; Marques, R. O Estado e as Parcerias Público-Privadas; Edições Sílabo: Lisbon, Portugal, 2012; p. 216. [Google Scholar]
- Lobina, E.; Hall, D. The comparative advantage of the public sector in the development of urban water supply. Prog. Dev. Stud. 2008, 8, 85–101. [Google Scholar] [CrossRef]
- Araral, E. The failure of water utilities privatization: Synthesis of evidence, analysis and implications. Policy Soc. 2009, 27, 221–228. [Google Scholar] [CrossRef]
- Marques, R. Análise do Desempenho dos Operadores Privados e Públicos; Associação das Empresas Portuguesas para o Sector do Ambiente (AEPSA): Lisbon, Portugal, 2017. [Google Scholar]
- PENSAAR. Uma nova Estratégia para o Setor de Abastecimento de Água e Saneamento de Águas Residuais; Governo de Portugal: Lisbon, Portugal, 2020. [Google Scholar]
- Baptista, J. Lessons learnt from the water reforms in Portugal; Presentation in the visit organized for the Bahamas Water and Sewerage Corporation; LisWater and LNEC: Lisbon, Portigal, 2019. [Google Scholar]
- Marques, R. Regulação de Serviços Públicos, 1ª Edição ed; Edições Sílabo: Lisbon, Portugal, 2005; p. 404. [Google Scholar]
- PENSAAR I. Plano Estratégico de Abastecimento de Água e de Saneamento de Águas Residuais 2000–2006; Governo de Portugal: Lisbon, Portugal, 2000. [Google Scholar]
- PENSAAR II. Plano Estratégico de Abastecimento de Água e de Saneamento de Águas Residuais 2007–2013; Governo de Portugal: Lisbon, Portugal, 2007. [Google Scholar]
- Baptista, J. Uma Abordagem Regulatória Integrada (ARIT-ERSAR) para os Serviços de Águas e Resíduos; Entidade Reguladora dos Serviços de Águas e Resíduos: Lisbon, Portugal, 2014; p. 314. [Google Scholar]
- Gonçalves, P. Regime Jurídico das Empresas Municipais; Almedina: Coimbra, Portugal, 2007; p. 296. [Google Scholar]
- Pinto, F.; Da Cruz, N.; Marques, R. Contracting water services with public and private partners: A case study approach. J. Water Supply: Res. Technol. Aqua 2015, 64, 194–210. [Google Scholar] [CrossRef]
- RASARP. Relatório Anual dos Serviços de Águas e Resíduos em Portugal; Entidade Reguladora de Serviços de Águas e Resíduos (ERSAR): Lisbon, Portugal, 2019. [Google Scholar]
- Braadbaart, O. Private versus public provision of water services: Does ownership matter for utility efficiency? J. Water Supply: Res. Technol. Aqua 2002, 51, 375–388. [Google Scholar] [CrossRef]
- Pérard, E. Water supply: Public or private? An approach based on cost of funds, transaction costs, efficiency and political costs. Policy Soc. 2009, 27, 193–219. [Google Scholar] [CrossRef]
- Vilanova, M.; Balestieri, P. Does public or private ownership defines the performance of water supply systems? Evid. Literature. Rev. Bras. De Gestão E Desenvolv. Reg. 2014, 10, 138. [Google Scholar]
- TC. Regulação de PPP no Sector das Águas; Relatório no. 3–2 Secção; Tribunal de Contas: Lisbon, Portugal, 2014. [Google Scholar]
- RASARP. Relatório Anual dos Serviços de Águas e Resíduos em Portugal; Entidade Reguladora de Serviços de Águas e Resíduos (ERSAR): Lisbon, Portugal, 2017. [Google Scholar]
- Prasad, N. Privatisation Results: Private Sector Participation in Water Services After 15 Years. Dev. Policy Rev. 2006, 24, 669–692. [Google Scholar] [CrossRef]
- Marin, P. Public-Private Partnerships for Urban Water Utilities. Public-Priv. Partnersh. Urban Water Util. 2009. [Google Scholar] [CrossRef]
- Al-Jayyousi, O.R. Scenarios for Public-Private Partnerships in Water Management: A Case Study from Jordan. Int. J. Water Resour. Dev. 2003, 19, 185–201. [Google Scholar] [CrossRef]
- Porcher, S. The ‘hidden costs’ of water provision: New evidence from the relationship between contracting-out and price in French water public services. Util. Policy 2017, 48, 166–175. [Google Scholar] [CrossRef] [Green Version]
- Comair, F. Private public partnership in the water sector-ESCWA Region. In Proceedings in Seminar on Water Governance: Role of Stakeholders; UN: Beirut, Lebanon, 2005. [Google Scholar]
Figure 1.
Institutional framework of the water sector in Portugal.

Figure 2.
Scope of regulation of the Water and Waste Services Regulatory Authority (ERSAR).

Figure 3.
Companies of the Águas de Portugal (AdP) group.

Figure 4.
Evolution of water service coverage (left) and wastewater (right) and of the investments made.
Figure 4.
Evolution of water service coverage (left) and wastewater (right) and of the investments made.

Figure 5.
Evolution of coverage levels in water (left) and wastewater services (right).

Figure 6.
Customer service in water (left) and wastewater services (right).

Figure 7.
Evolution of water supply failures.

Figure 8.
Evolution of floods in wastewater service.

Figure 9.
Evolution of energy efficiency in water (left) and wastewater services (right).

Figure 10.
Evolution of non-revenue water.

Figure 11.
Evolution of water losses in the network.

Figure 12.
Evolution of the safe water indicator.

Figure 13.
Evolution of compliance with the legal discharge parameters.

Figure 14.
Evolution of cost coverage in water (left) and wastewater services (right).


Table 1.
Management models of the “retail” component of water and sanitation services.
| Management Model | Water | Wastewater | ||
|---|---|---|---|---|
| No. | Population (103) * | No. | Population (103) * | |
| DMS | 184 | 2966 (29.5%) | 191 | 3678 (36.5%) |
| MSWA | 19 | 2274 (22.6%) | 18 | 2235 (22.2%) |
| MC | 23 | 1793 (17.8%) | 23 | 1796 (17.8%) |
| Private operators | 28 | 1971 (19.6%) | 23 | 1714 (17.0%) |
| Other models | 4 ** | 1043 (10.5%) | 2 *** | 647 (6.3%) |
| Total | 258 | 10.070 | 257 | 10.070 |
* Census 2011 population; ** EPAL, Águas do Norte, Águas da Região de Aveiro (AdRA) and Águas de Santo André (AdSA); *** Águas do Norte and AdRA.
Table 2.
Investments made and efficiency of investments in water service.
| Water (2000–2013) | Investment (106 €) | Expenditure by Increase in Coverage/Inhabitant (€/inhab.) |
|---|---|---|
| Private | 433,92 | 1.10325 |
| Public | 630,80 | 1.15398 |
Table 3.
Investments made and efficiency of investments in wastewater service.
| Wastewater (2000–2013) | Investment (106 €) | Expenditure by Increase in Coverage/Inhabitant (€/inhab.) |
|---|---|---|
| Private | 650.88 | 763.08 |
| Public | 946.20 | 893.55 |
Table 4.
Quality of service assessment indicators.
| KPI | |
|---|---|
| Water | Wastewater |
| Physical accessibility (%) | Physical accessibility (%) |
| Reply to written suggestions and complaints (%) | Reply to written suggestions and complaints (%) |
| Mains failures (No./1.000 connections) | Flooding occurrences (No./1.000 connections) |
| Energy efficiency [kWh/(m3·100 m)] | Energy efficiency [kWh/(m3·100 m)] |
| Safe water (%) | Compliance with discharge parameters (%) |
| Non-revenue water (%) | |
| Water losses on mains [l/(km·h)] | |
Table 5.
Average monthly WSS household charges.
| Average Charges (10 m3) | Water (€) | Wastewater (€) | Total (€) |
|---|---|---|---|
| Private Operator | 12.84 | 8.67 | 21.51 |
| MC | 10.78 | 10.26 | 21.04 |
| MSWA | 11.72 | 9.24 | 20.96 |
| DMS | 9.61 | 7.28 | 16.90 |
Table 6.
Average monthly WSS charges removing the rent and investment subsidy effects.
| Average Charges (10 m3) | Total (€) |
|---|---|
| Private Operator | 18.11 |
| MC | 21.04 |
| MSWA | 20.96 |
| DMS | 16.90 |
© 2020 by the authors. Licensee MDPI, Basel, Switzerland. This article is an open access article distributed under the terms and conditions of the Creative Commons Attribution (CC BY) license (http://creativecommons.org/licenses/by/4.0/).
Share and Cite
MDPI and ACS Style
Marques, R.C.; Simões, P. Revisiting the Comparison of Public and Private Water Service Provision: An Empirical Study in Portugal. Water 2020, 12, 1477. https://doi.org/10.3390/w12051477
AMA Style
Marques RC, Simões P. Revisiting the Comparison of Public and Private Water Service Provision: An Empirical Study in Portugal. Water. 2020; 12(5):1477. https://doi.org/10.3390/w12051477
Chicago/Turabian StyleMarques, Rui Cunha, and Pedro Simões. 2020. "Revisiting the Comparison of Public and Private Water Service Provision: An Empirical Study in Portugal" Water 12, no. 5: 1477. https://doi.org/10.3390/w12051477
Note that from the first issue of 2016, this journal uses article numbers instead of page numbers. See further details here.