1. Introduction
The importance of sustainable development in society has increased considerably during the last decades. This growing interest in sustainable development is associated with the consequences of past behaviors that currently affect our society.
The “heat island effect” is a clear example of this lack of environmental awareness in the design of urban infrastructure. In natural conditions, the soil helps in the regulation of atmospheric temperature and humidity, but conventional pavements create a waterproof barrier that significantly reduces this natural regulation. This effect creates a microclimate in urban areas that impacts the quality of life of its population and modifies the water cycle [
1].
Waterproofing urban surfaces also reduces its capability of efficiently managing rainwater, leading to higher volumes of run-off water. Usually, this water also drags contaminants present on the pavement surface, spreading the contaminant and creating diffuse pollution. The installation of conventional pavements also increases the frequency of flooding within the urban nuclei. Floods not only create significant economic damage, but they also generate a sensation of vulnerability in the affected societies. Different factors might affect the quantity of contaminants present in run-off water and can make it inadequate for being disposed directly into the environment. Among these factors, population growth in urban areas, the increase in the number of parking lots, and the intensive use of motor vehicles stand out.
One possible solution to the problems of climate regulation and run-off water management in urban areas is the usage of what is known as Sustainable Urban Drainage Systems (SUDS) in Europe, Water Sensitive Urban Design (WSUD) in Australia, or Low Impact Development (LID) in the United States and Japan. SUDS are a group of techniques that aim to improve the management of run-off water while reducing its ability to spread pollutants. Improvement in the quality of run-off water reduces the intensity of treatment needed for its reuse, sometimes even making it possible to eliminate the treatment, depending on its future usage [
2,
3]. Reuse offers great benefits for society, both environmentally and economically.
Many of these systems, such as pervious pavements, incorporate geotextiles into their structures, as they have separating and filtering functions. The role that geotextiles play in the makeup of pavement seems to be uncertain, both on traditional and on the pervious pavements used in SUDS.
Table 1 shows different guides for permeable pavement design. Most of these guides do not explicitly recommend the usage of geotextiles and, in most cases, it is considered optional.
Following a literature review [
4,
5,
6,
7,
8,
9,
10] it can be concluded that there is no consensus amongst the different investigations and design guides on the benefits of including geotextiles in the design of pervious pavements, on their functions, on the position that they should have or even on whether their installation is more harmful than beneficial, mainly because they introduce potential slip surfaces into the road structure [
4,
9]. Among the reported benefits of the installation of geotextiles in pervious pavements includes the widely accepted ability to filter run-off water, and retaining both small-sized solids and liquid contaminants. Some authors recommend the installation of geotextiles because of their filtration capabilities [
2,
3,
10], while others consider that this benefit is not sufficient to justify their inclusion [
5].
2. Scope and Objectives
During the construction of pavement, geotextiles undergo a series of processes that might affect their future performance. Amongst these processes, the most important include the mechanical actions produced by the compaction works and the clogging of its pores by the fine fraction of the material placed over it [
11]. The modification of geotextile properties just by its installation in the road structure is known as the new condition, and there is no standardized method to quantify it.
Most of the mechanical damage suffered by geotextiles used in the construction of pavements occurs during the construction, installation, and compaction stages. Although there is also some mechanical damage experienced during their lifespan, this is generally less important, as the loads are significantly lower than during construction. There exist standardized laboratory methods to evaluate the mechanical damage on a geotextile caused by granular material under repetitive loading. However, the conditions of the tests differ significantly from those in the construction of the pavement.
The effects of the fine particles in the clogging of the pores can be divided into two different stages. In the first stage, usually in low moisture conditions, some of the fine material reach the geotextile surface and settle on it. The second stage occurs when water is poured on top of the aggregates and drags the finer particles that end up on the surface of the geotextile. This water mixed with the fine particles from the aggregates usually creates a crust on the surface of the geotextile.
Beecham et al. [
12] and Shackel [
13] indicated that a correction factor that modifies the initial water permeability of the geotextiles is needed in the design of pervious pavements. However, this correction factor should differ depending on the position of the geotextile in the road structure.
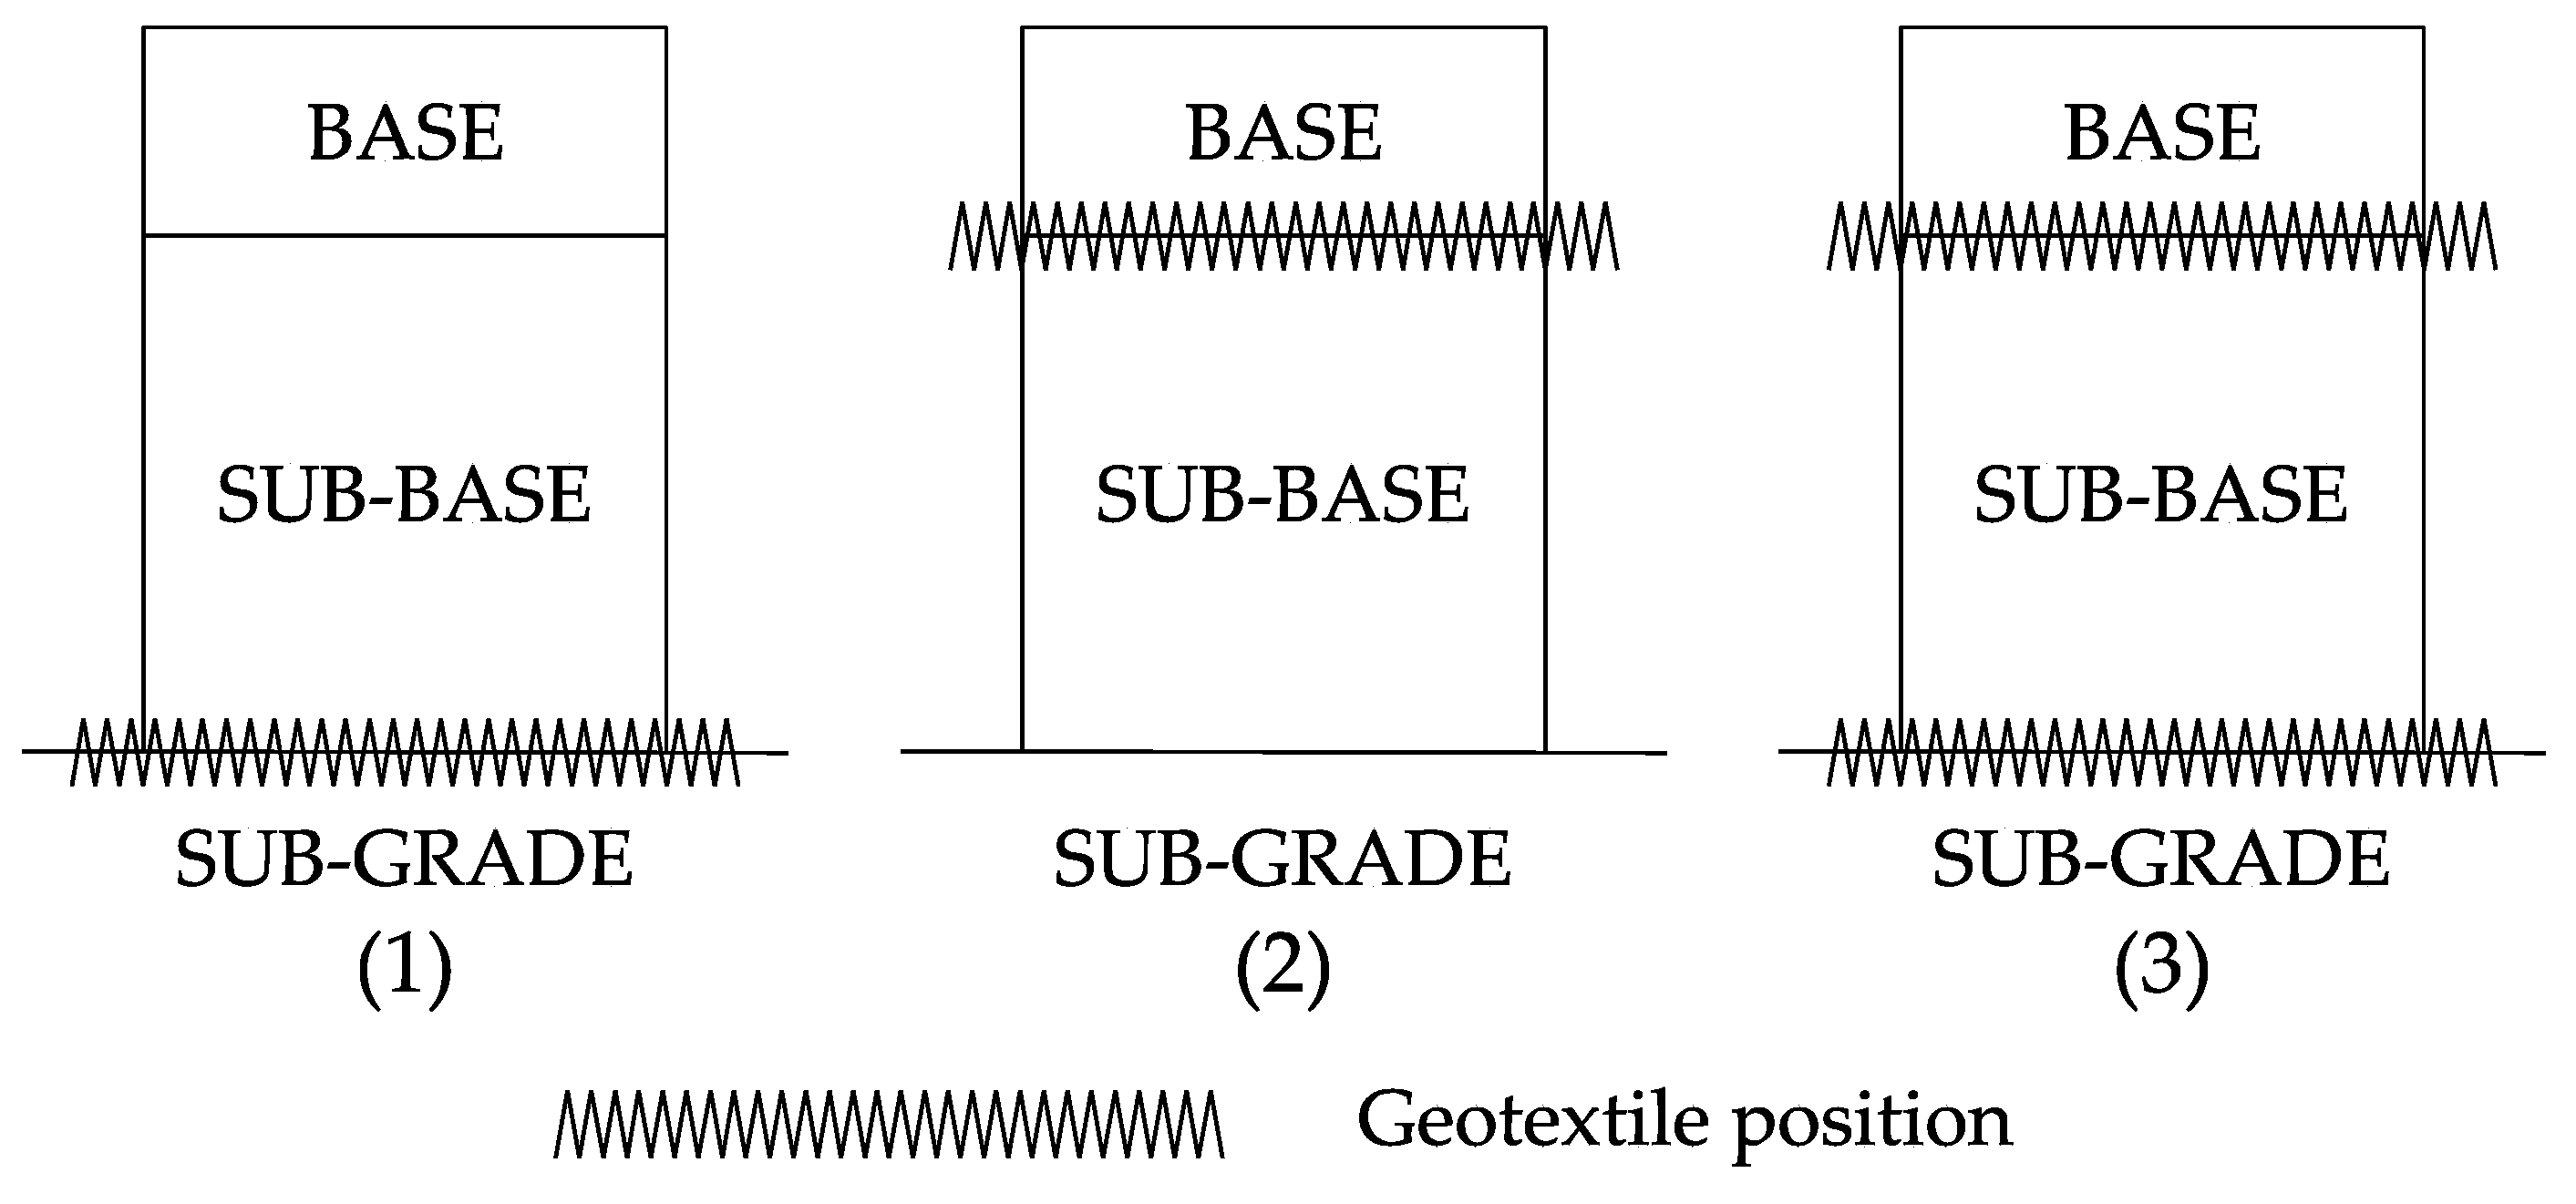
Figure 1 shows typical geotextile configurations of pervious pavements proposed by different guides [
14].
Geotextiles can be located between sub-base and the sub-grade (configuration 1), between the base and the sub-base (configuration 2) or in both positions (configuration 3) (
Figure 1). Laboratory tests could be performed only to configurations 1 and 3 to accomplish valid results for all three cases. This simplification is possible because the damage on the geotextile located in the upper position (between the base and the sub-base) is not affected by the inclusion of a geotextile in the lower position (between the sub-base and the sub-grade), as the fines that can potentially clog its pores come only from the base layer. However, in a configuration with both geotextiles, the upper one acts as a filter for the lower one, changing its working conditions, and thus making it necessary to test it in two different scenarios. Therefore, the present study aimed to design a laboratory procedure to determine the new condition factor for the water permeability of a geotextile in the described scenarios.
3. Materials and Methods
A laboratory testing methodology was designed to study the water permeability loss of a geotextile through the construction of the pavement in which it is incorporated.
3.1. Initial Considerations
For the study of a possible initial correction, the first step was to identify the factors that might influence the initial water permeability of the geotextile. This fundamentally included the type of geotextile, the position of the geotextile in the pavement structure, the granular material used for road construction, and the pavement construction processes.
The granular material used for the laboratory tests should be carefully selected to match the nature and the particle size distribution of the aggregates used on roads. This is determinant on not only the mechanical damage suffered by the geotextile that is in direct contact with it, but also on the presence and generation of fines, and hence on the clogging potential of the simulated layer.
The testing procedure devised aims to reproduce in the laboratory the conditions that a geotextile is exposed to during pavement construction, in order to measure its loss of water permeability. The proposed methodology was divided into four stages, with the first and fourth stages measuring the water permeability normal to the plane of the geotextile, before and after the damage simulation. The second stage simulates the mechanical damage to the geotextile occurring during compaction, and the third stage simulates the hydraulic damage or clogging that takes place when the fines generated in the first stage and naturally present in the aggregates move through the granular layers and build up on the geotextile with the addition of water. This third stage is not covered in the existing testing standards and is expected to have a significant effect on the loss of water permeability of the geotextile.
3.2. Geotextiles
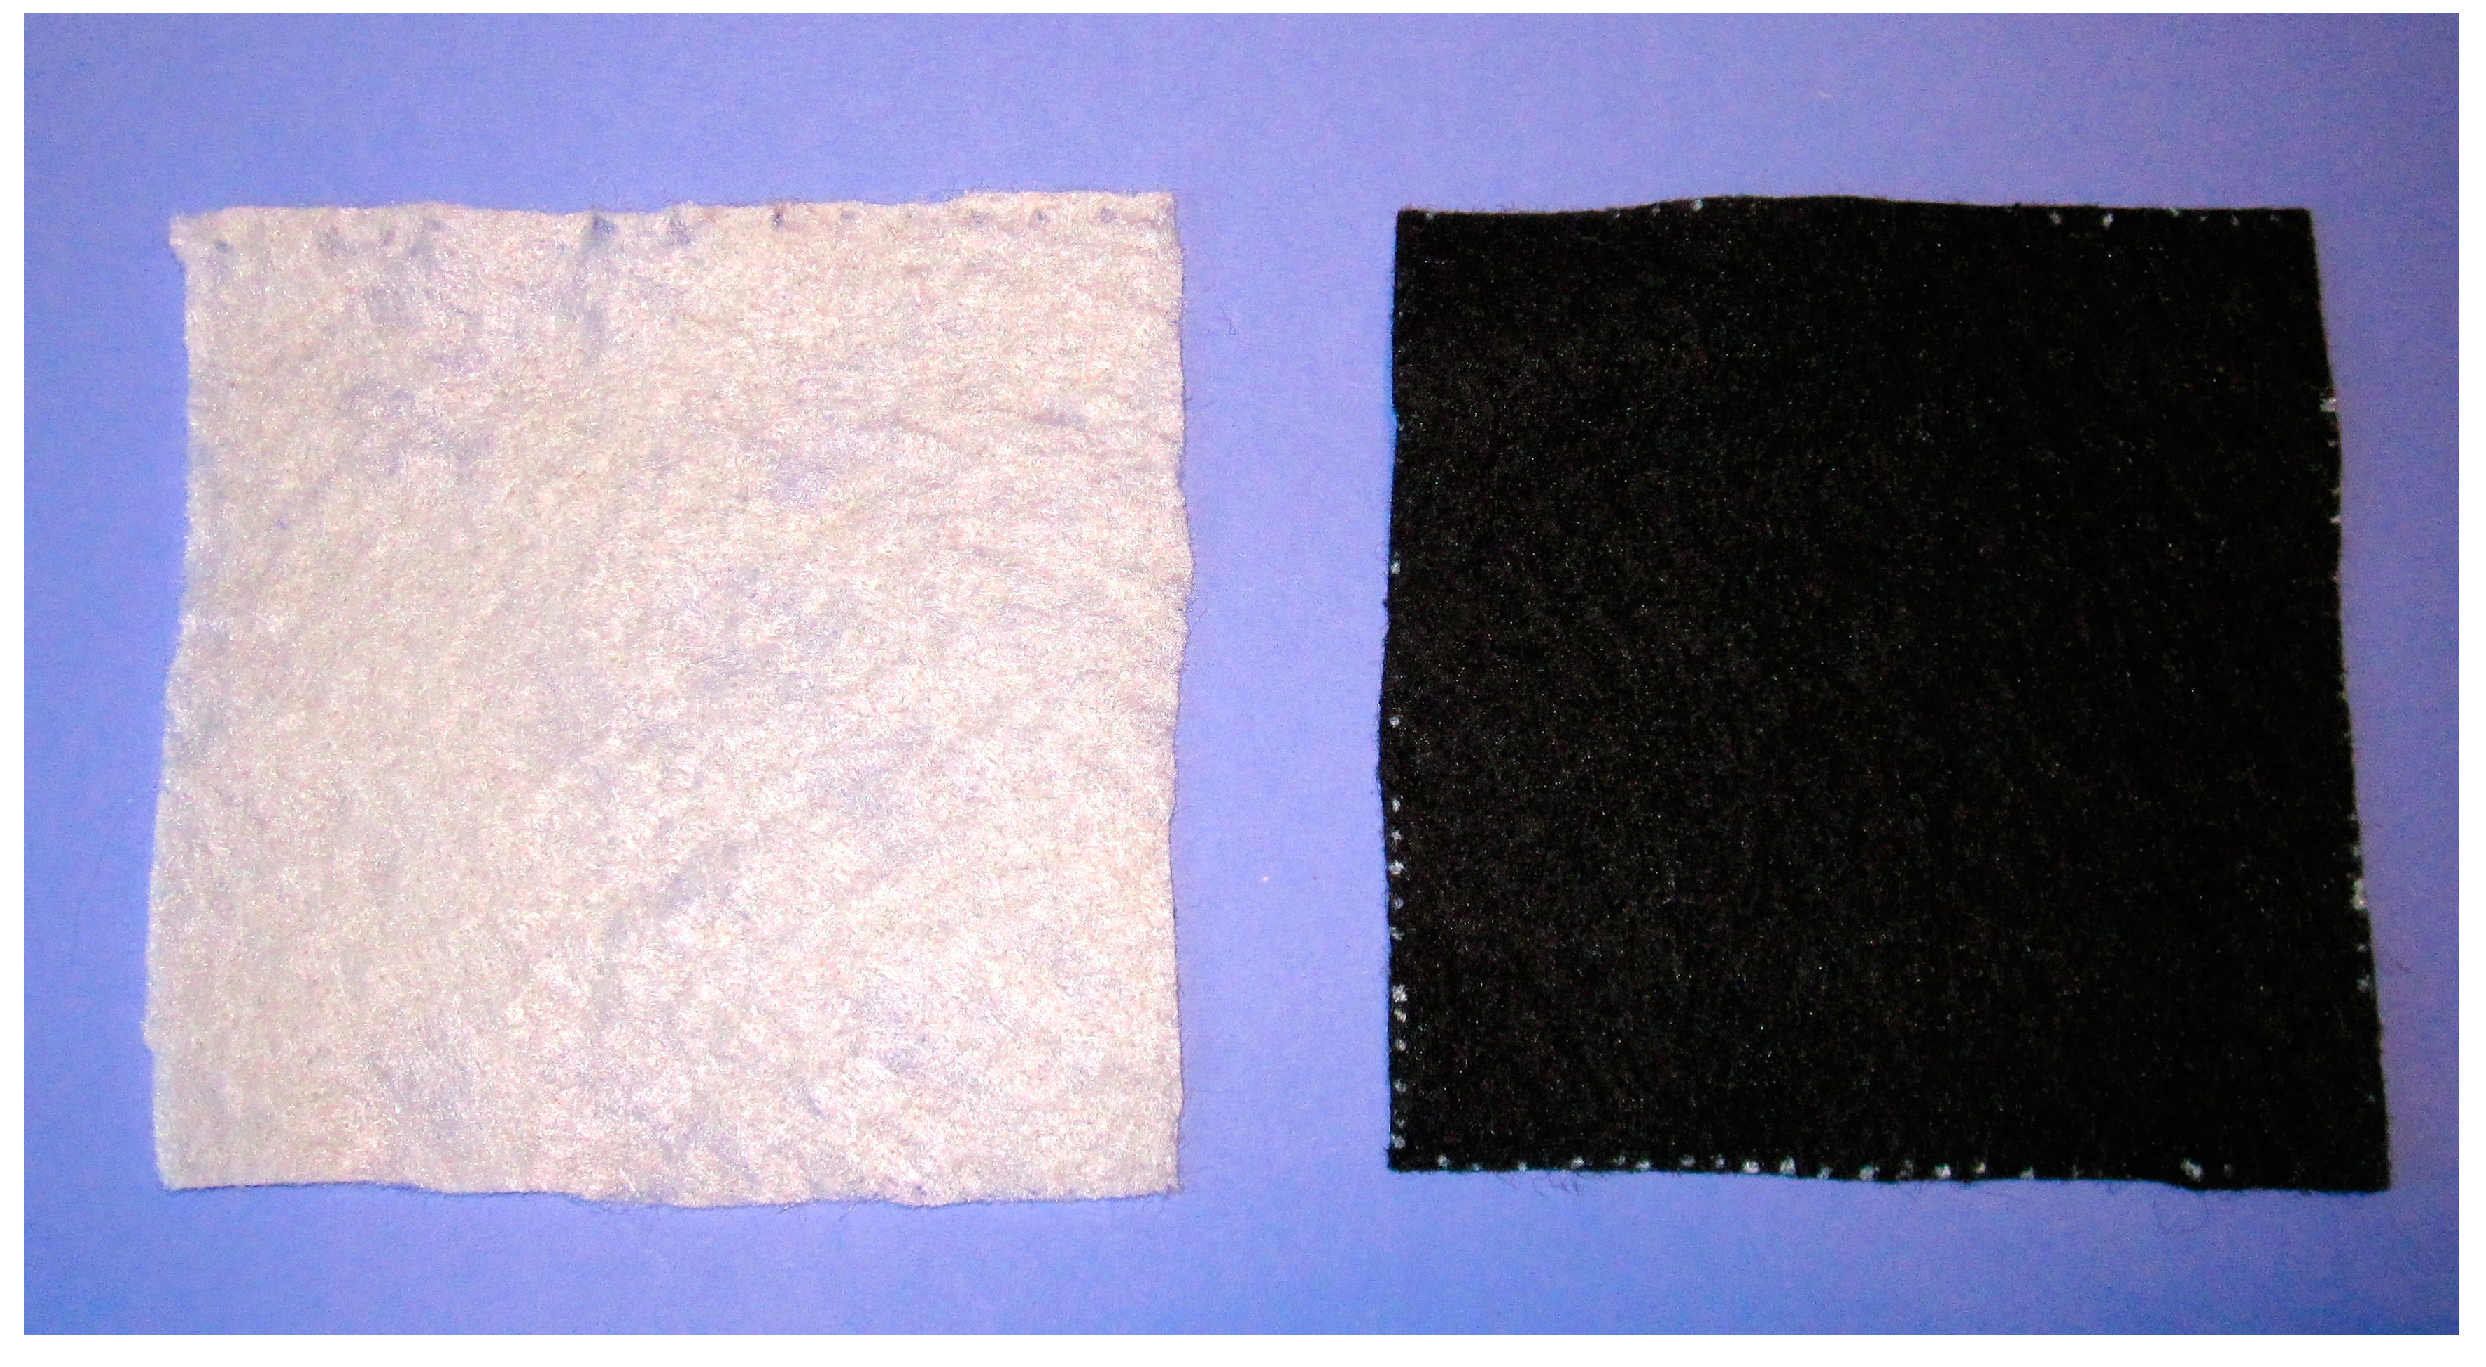
Two different polypropylene nonwoven geotextiles were used in this study (
Figure 2). The initial properties of both geotextiles are outlined in
Table 2.
3.3. Granular Material
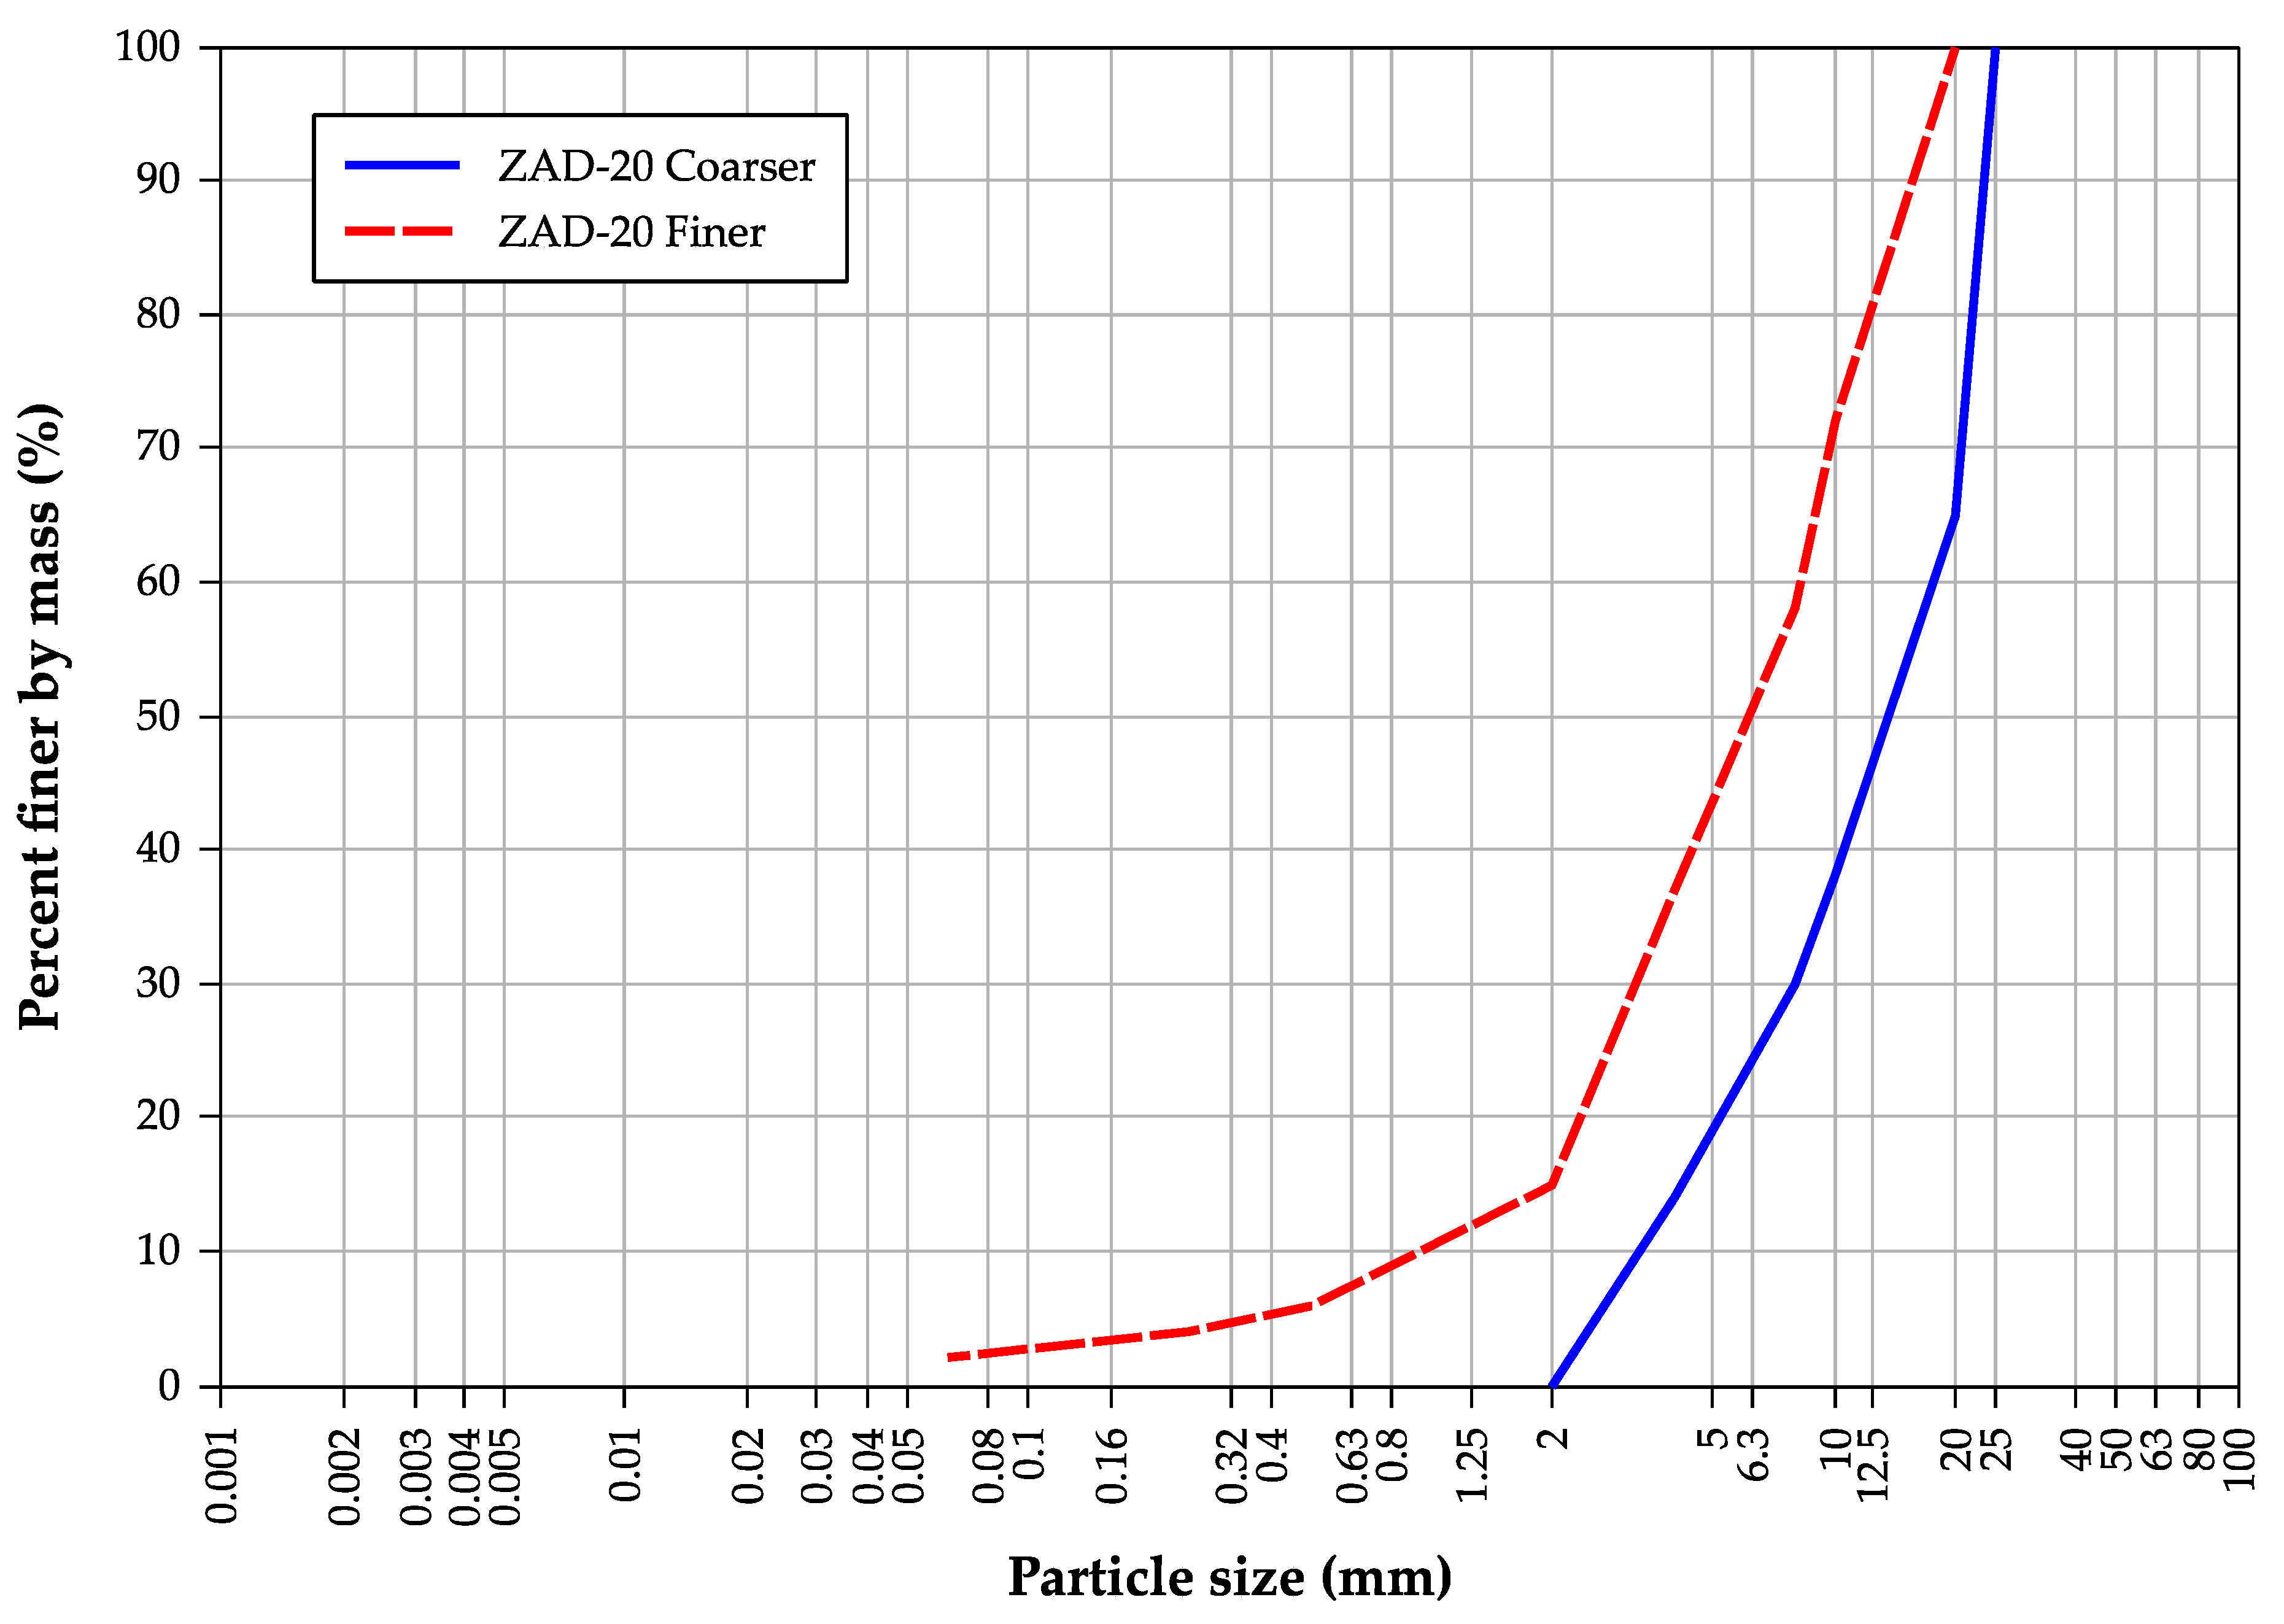
The particle size distribution utilized corresponded to the material used in the sub-base of pervious pavements in Spain. In the General Technical Specification Standard for Road and Bridges Works (“Pliego de Prescripciones Técnicas Generales para Obras de Carreteras y Puentes”, PG-3) [
15], this is called ZAD-20. ZA stands for “Zahorra Artificial”, defined in the PG-3 as a granular material, with a continuous particle size distribution, made up of totally or partially crushed aggregates with a particle size distribution stated in the standard for every material. The letter D means that the material is used in pervious pavements. Lastly, the number is the maximum nominal particle diameter in millimeters. In the Spanish code, this is the only material recommended for its usage as a sub-base layer for pervious pavements, and thus it was used in this study. The particle size distribution chart for the coarser and finer boundaries prescribed in the PG-3 are shown in
Figure 3. For this study, synthetic samples made to match the particle size distribution of both boundaries were used for the sub-base. These particle size distributions were chosen to reproduce the extreme behaviors of the multiple options that could be used in real pavement constructions.
Usually, ZAD-20 is not used for the base layer of pervious pavements. It is common in the usage of a crushed limestone aggregate with a continuous particle size distribution between 6 and 12 mm. This material was used as granular material for the base in all test configurations in the present study.
3.4. Test Procedure
In the following paragraphs, the proposed procedure to determine the water permeability loss of geotextiles due to their installation in pervious pavements is presented.
3.4.1. Stage 1: Determination of the Initial Water Permeability Normal to the Plane
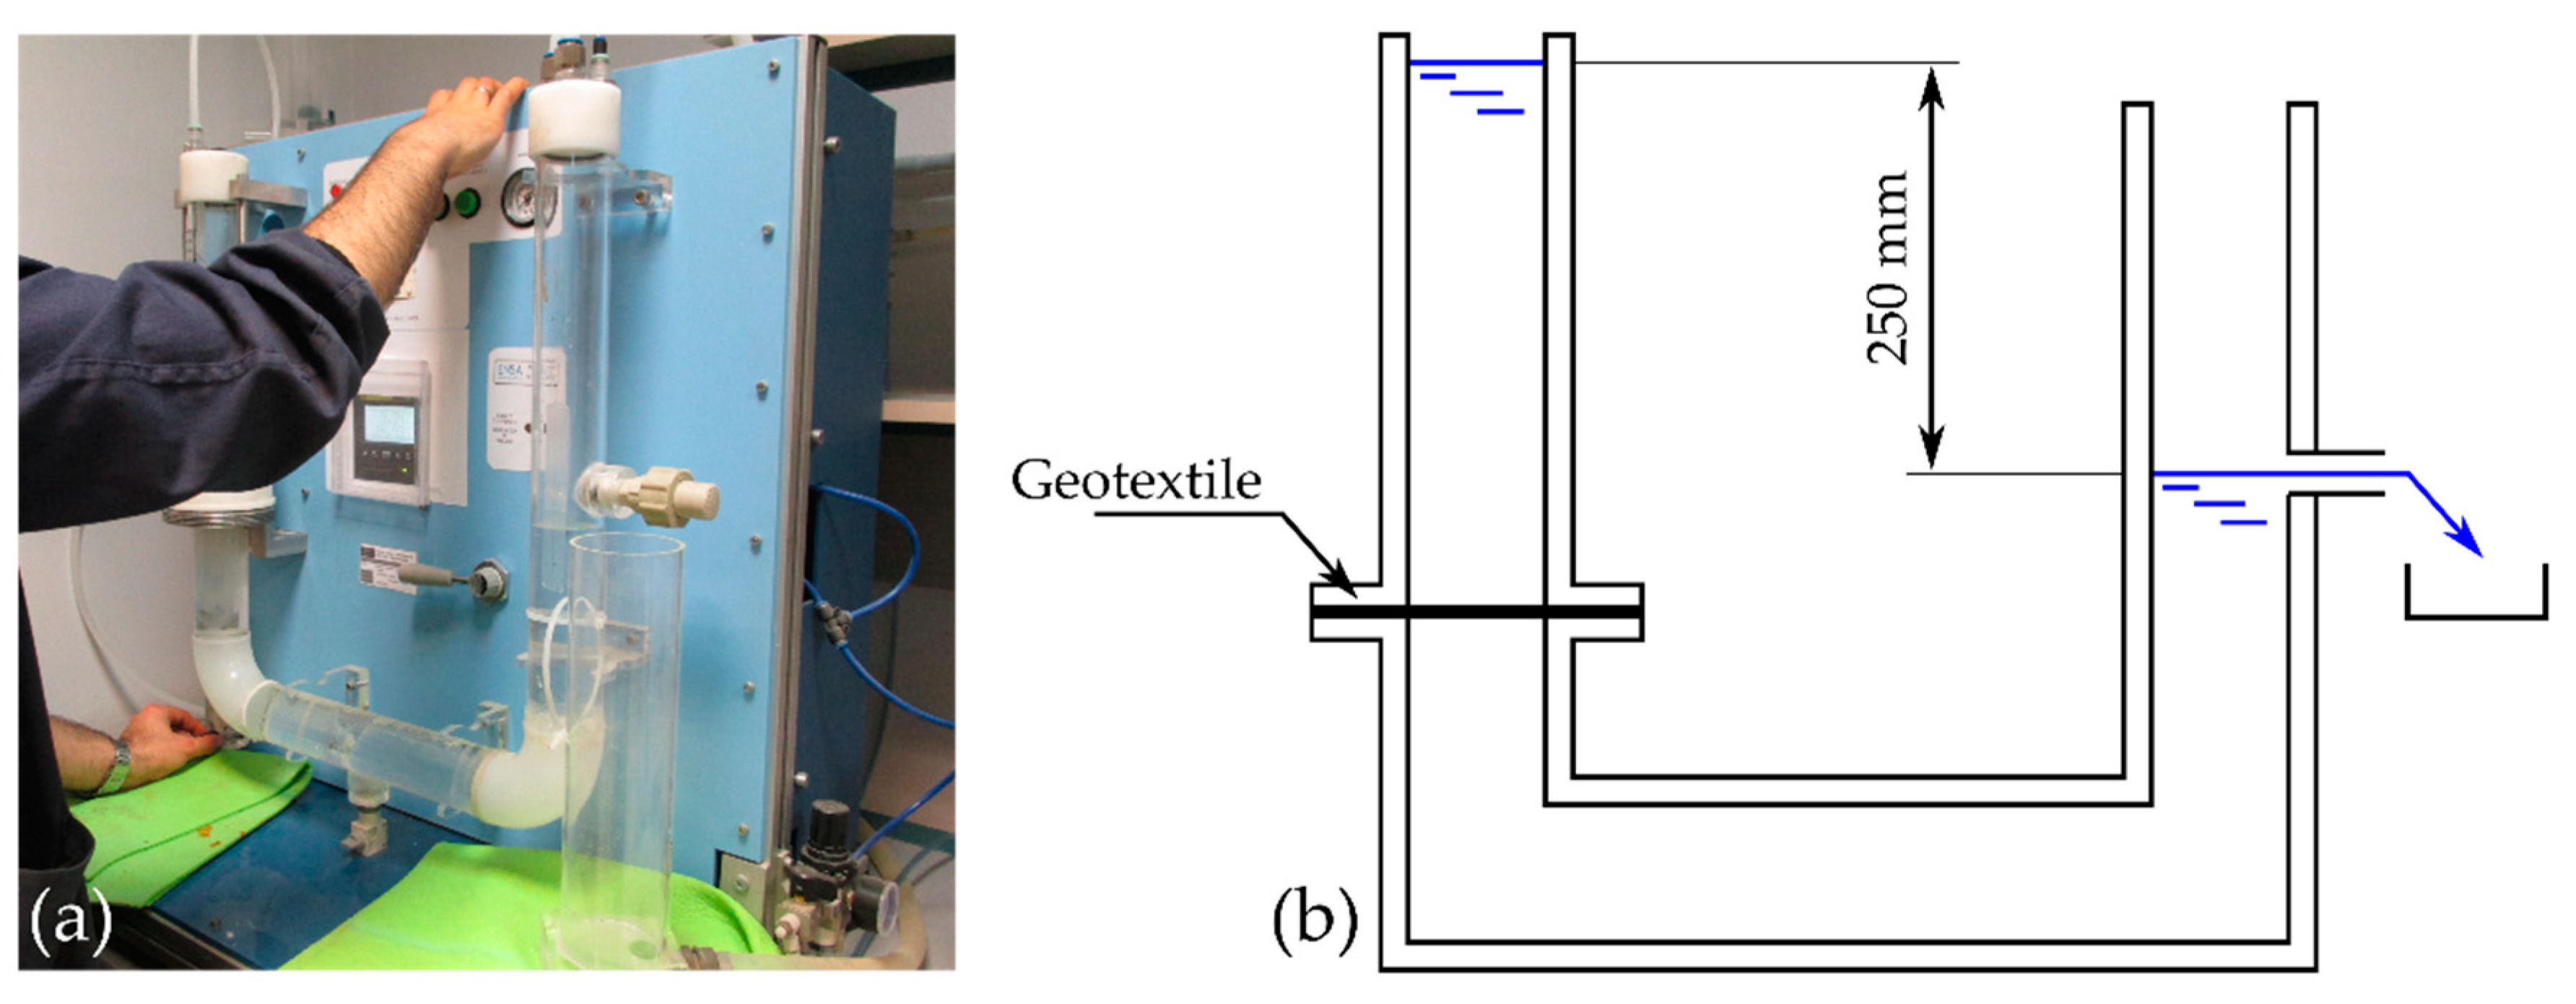
The water permeability normal to the plane for an untested probe of geotextile is determined using the ISO 11058 standard test [
16]. This is a standardized procedure, and there is no need for modification of the procedure. For this study, samples of 50 mm in diameter were subjected to falling head, vertical flow tests with an initial water height over the specimen of 250 mm. The equipment used to perform the tests and a schematic drawing modified from the standard are shown in
Figure 4.
3.4.2. Stage 2: Simulation of Mechanical Damage
In order to simulate the installation conditions, a modified version of the ISO 10722 [
17] test is used. Originally, this test consists of placing a sample of geotextile with defined dimensions (300 × 300 mm) between two layers of synthetic gravel. Once placed in the test rig according to the standard, a loading plate is centered on the sample, which applied a cyclical pressure ranging from a minimum of 10 ± 10 kPa and a maximum of 500 ± 10 kPa, at a frequency of 1 Hz during 200 load cycles. For this study, a load of 485 kPa was used. The value was similar to the maximum load prescribed in the ISO 10722, to better reproduce the high loads produced during the compaction of the road but with a small margin, to avoid problems associated with reaching the maximum capacity of the equipment.
To adapt the test to real installation conditions, both the nature and the particle size of the gravel used are modified to match the characteristics of the real aggregates used in road construction. This modification also implies a change in loading conditions. The final configuration of the mechanical damage stage is shown in
Figure 5.
The type of mechanical damage that affects geotextiles can be divided into six categories—abrasion, splitting, puncturing, stress breakdown, fiber cutting, and tearing [
18,
19]. It was observed that the intensity of the damage did not only depend on the compacting energy but to a great degree on the materials that make up the pavement. This phenomenon was also studied by Carneiro et al. [
20], who came to the same conclusion after studying different materials. It was also observed that the quantity of fines that settled on the geotextile surface depended on the granular material used. In summary, the aggregates used in the test affected both the mechanical damage of the geotextile and the presence of fines on the geotextile surface. Therefore, the mechanical damage stage of the proposed procedure, even though based on the ISO 10722 standard, is designed to accurately simulate the actual on-site conditions during road construction, and thus the material used is changed to match the real scenario.
Test Adjustments
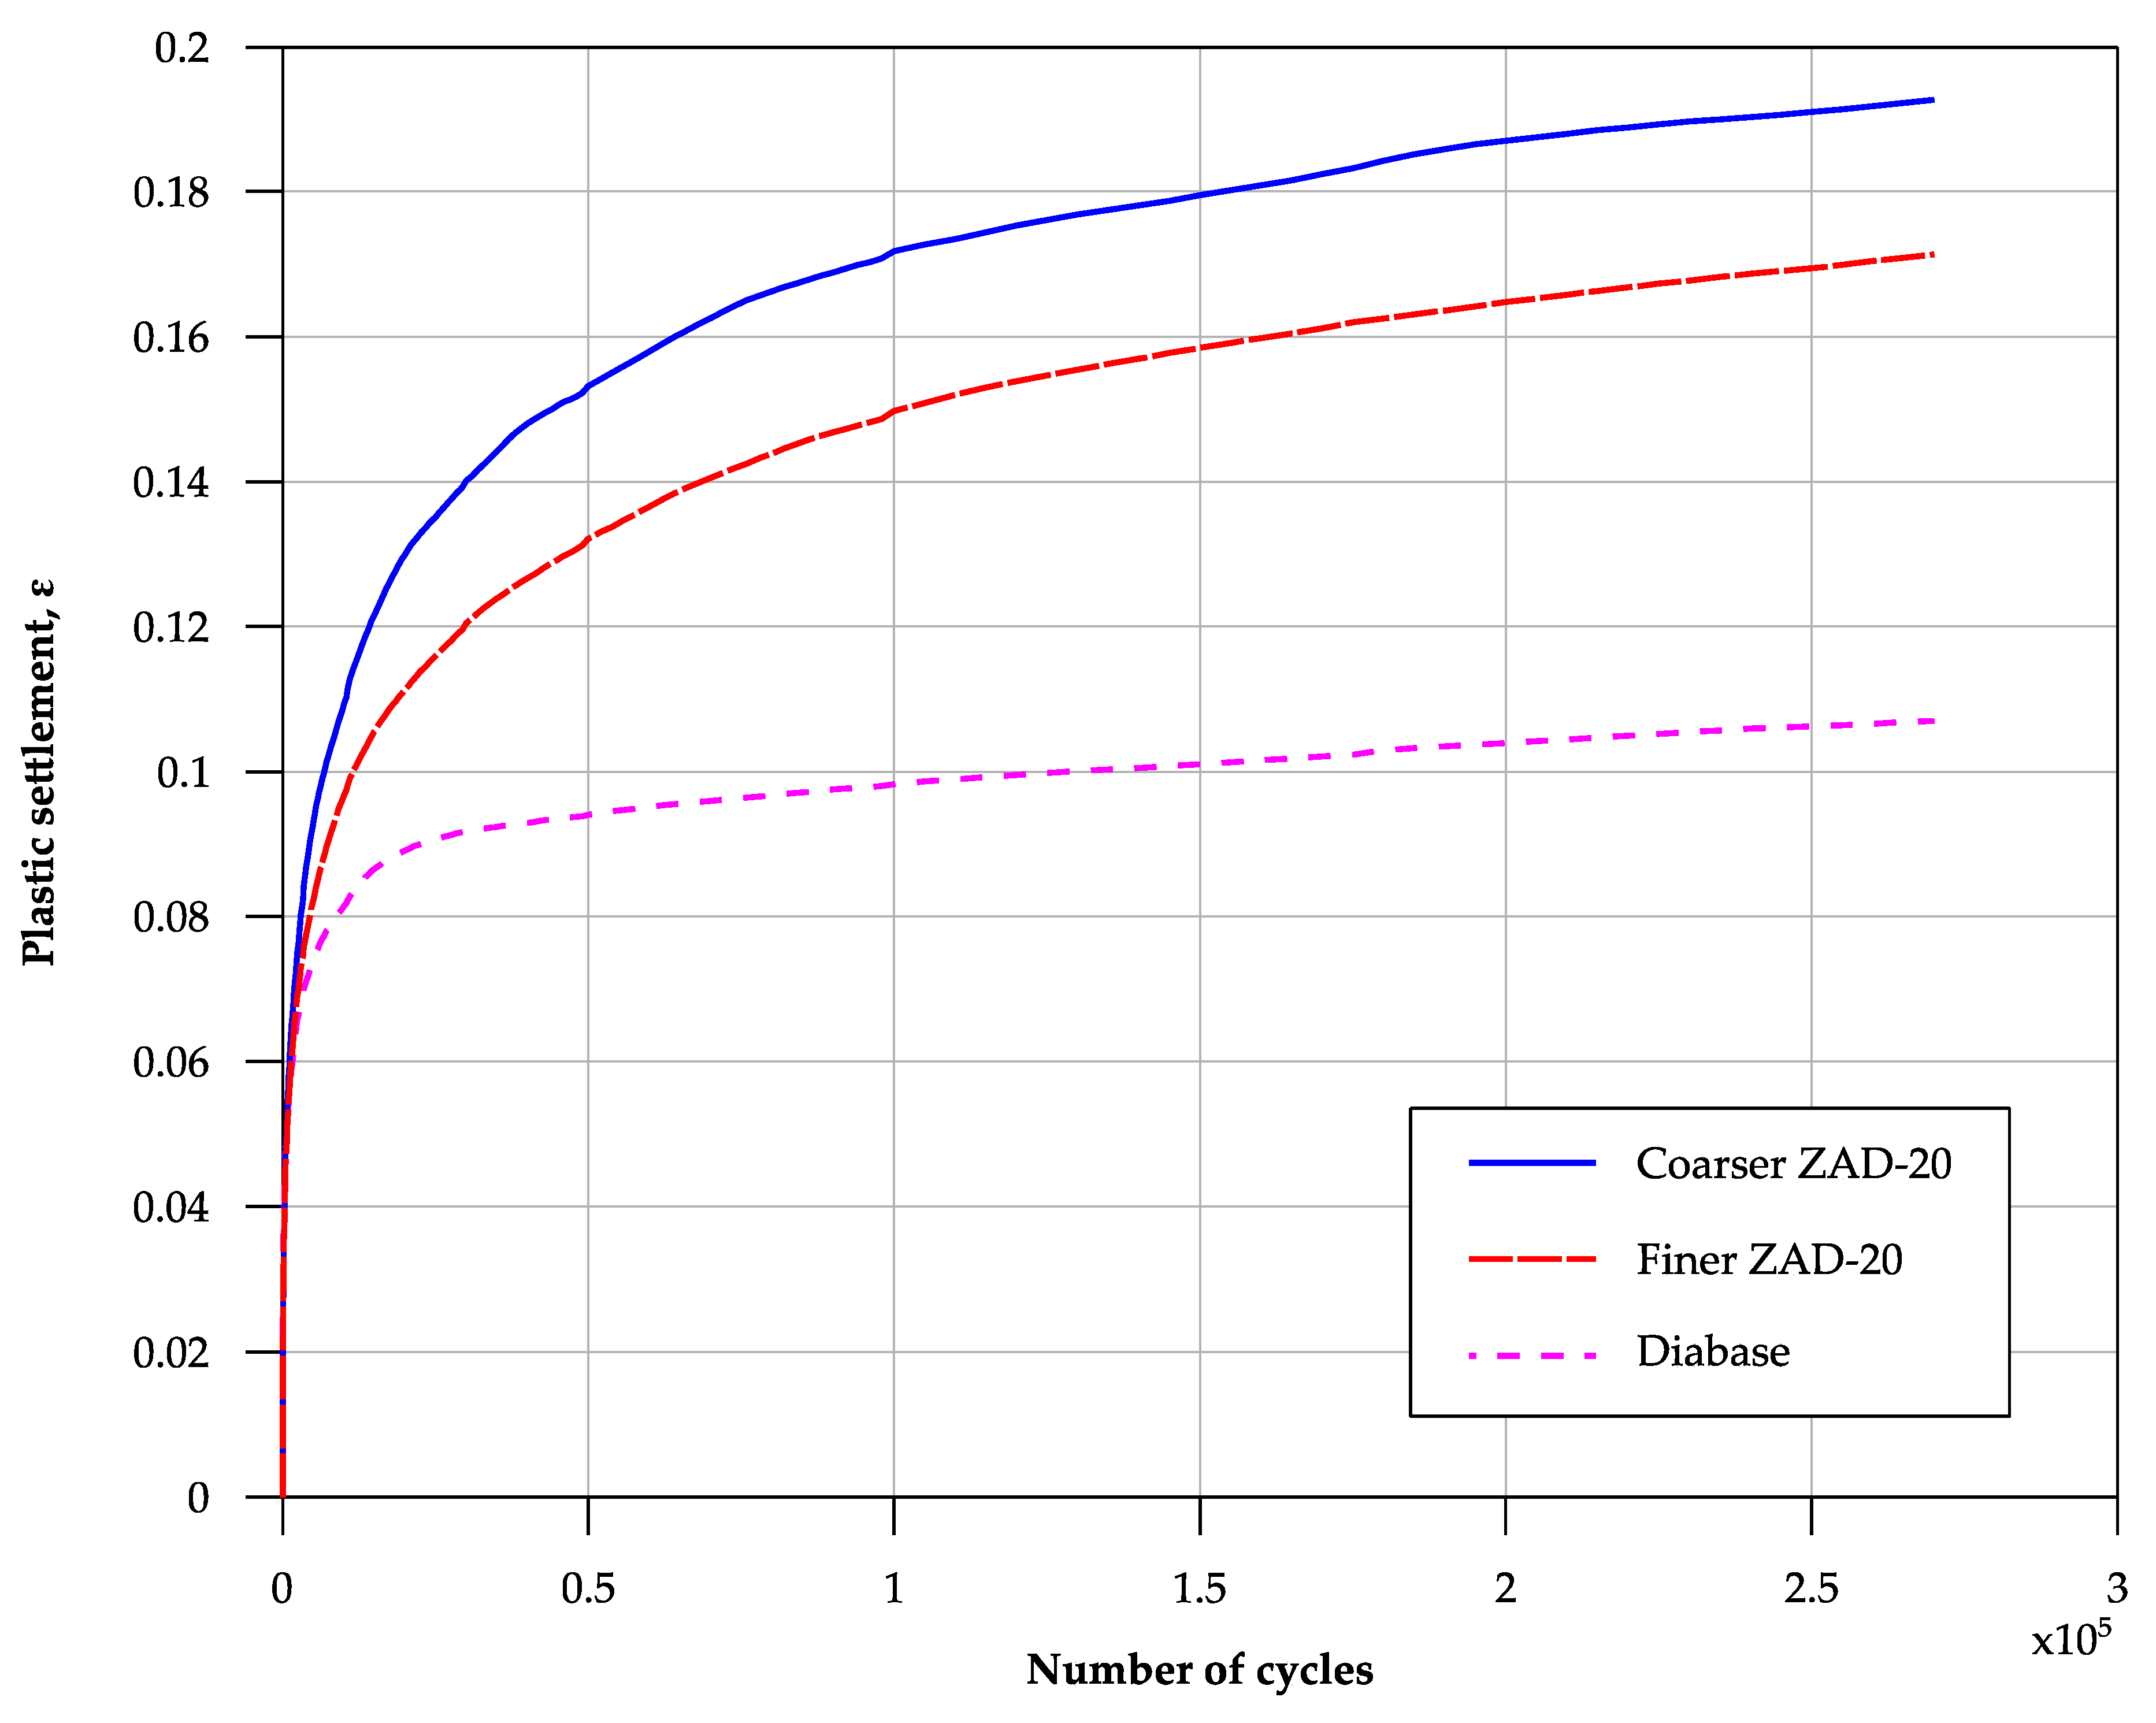
The mechanical damage that a geotextile undergoes during this stage of the test is the consequence of the relative movement of the particles during the cyclic load application process. In this process new fine particles are generated, and this generation of particles also depends on the nature of the granular material and the energy used in the compaction process. As a result, some of the parameters prescribed in ISO 10722 for the reference material need to be adjusted for the use of different materials. The aggregate prescribed in ISO 10722 is corundum with a precise particle size distribution. Since this material is troublesome to obtain, it is usually replaced by a diabase aggregate, with a similar Los Angeles coefficient of abrasion of 16%, with the particle size distribution prescribed in the standard for the corundum. To adjust the test parameters, the three granular materials used in this study, diabase and the two ZAD-20, were tested under cyclic loading conditions. As the compaction equipment was supposed to be the same, it was decided to adjust the procedure by changing the number of applied load cycles and maintaining the load intensity and frequency. As a result, the characterization tests were carried out using the same molds, stresses, and frequency indicated by the ISO 10722 standard, with a higher number of load cycles. As the aim of these tests were to obtain the characteristics of the aggregates, a geotextile was not installed into the test rig. In order to adjust the test parameters, the evolution of the plastic settlement with the application of the cyclic loads for the different materials was compared.
Figure 6 shows the plastic settlement over the number of cycle curves obtained in the tests.
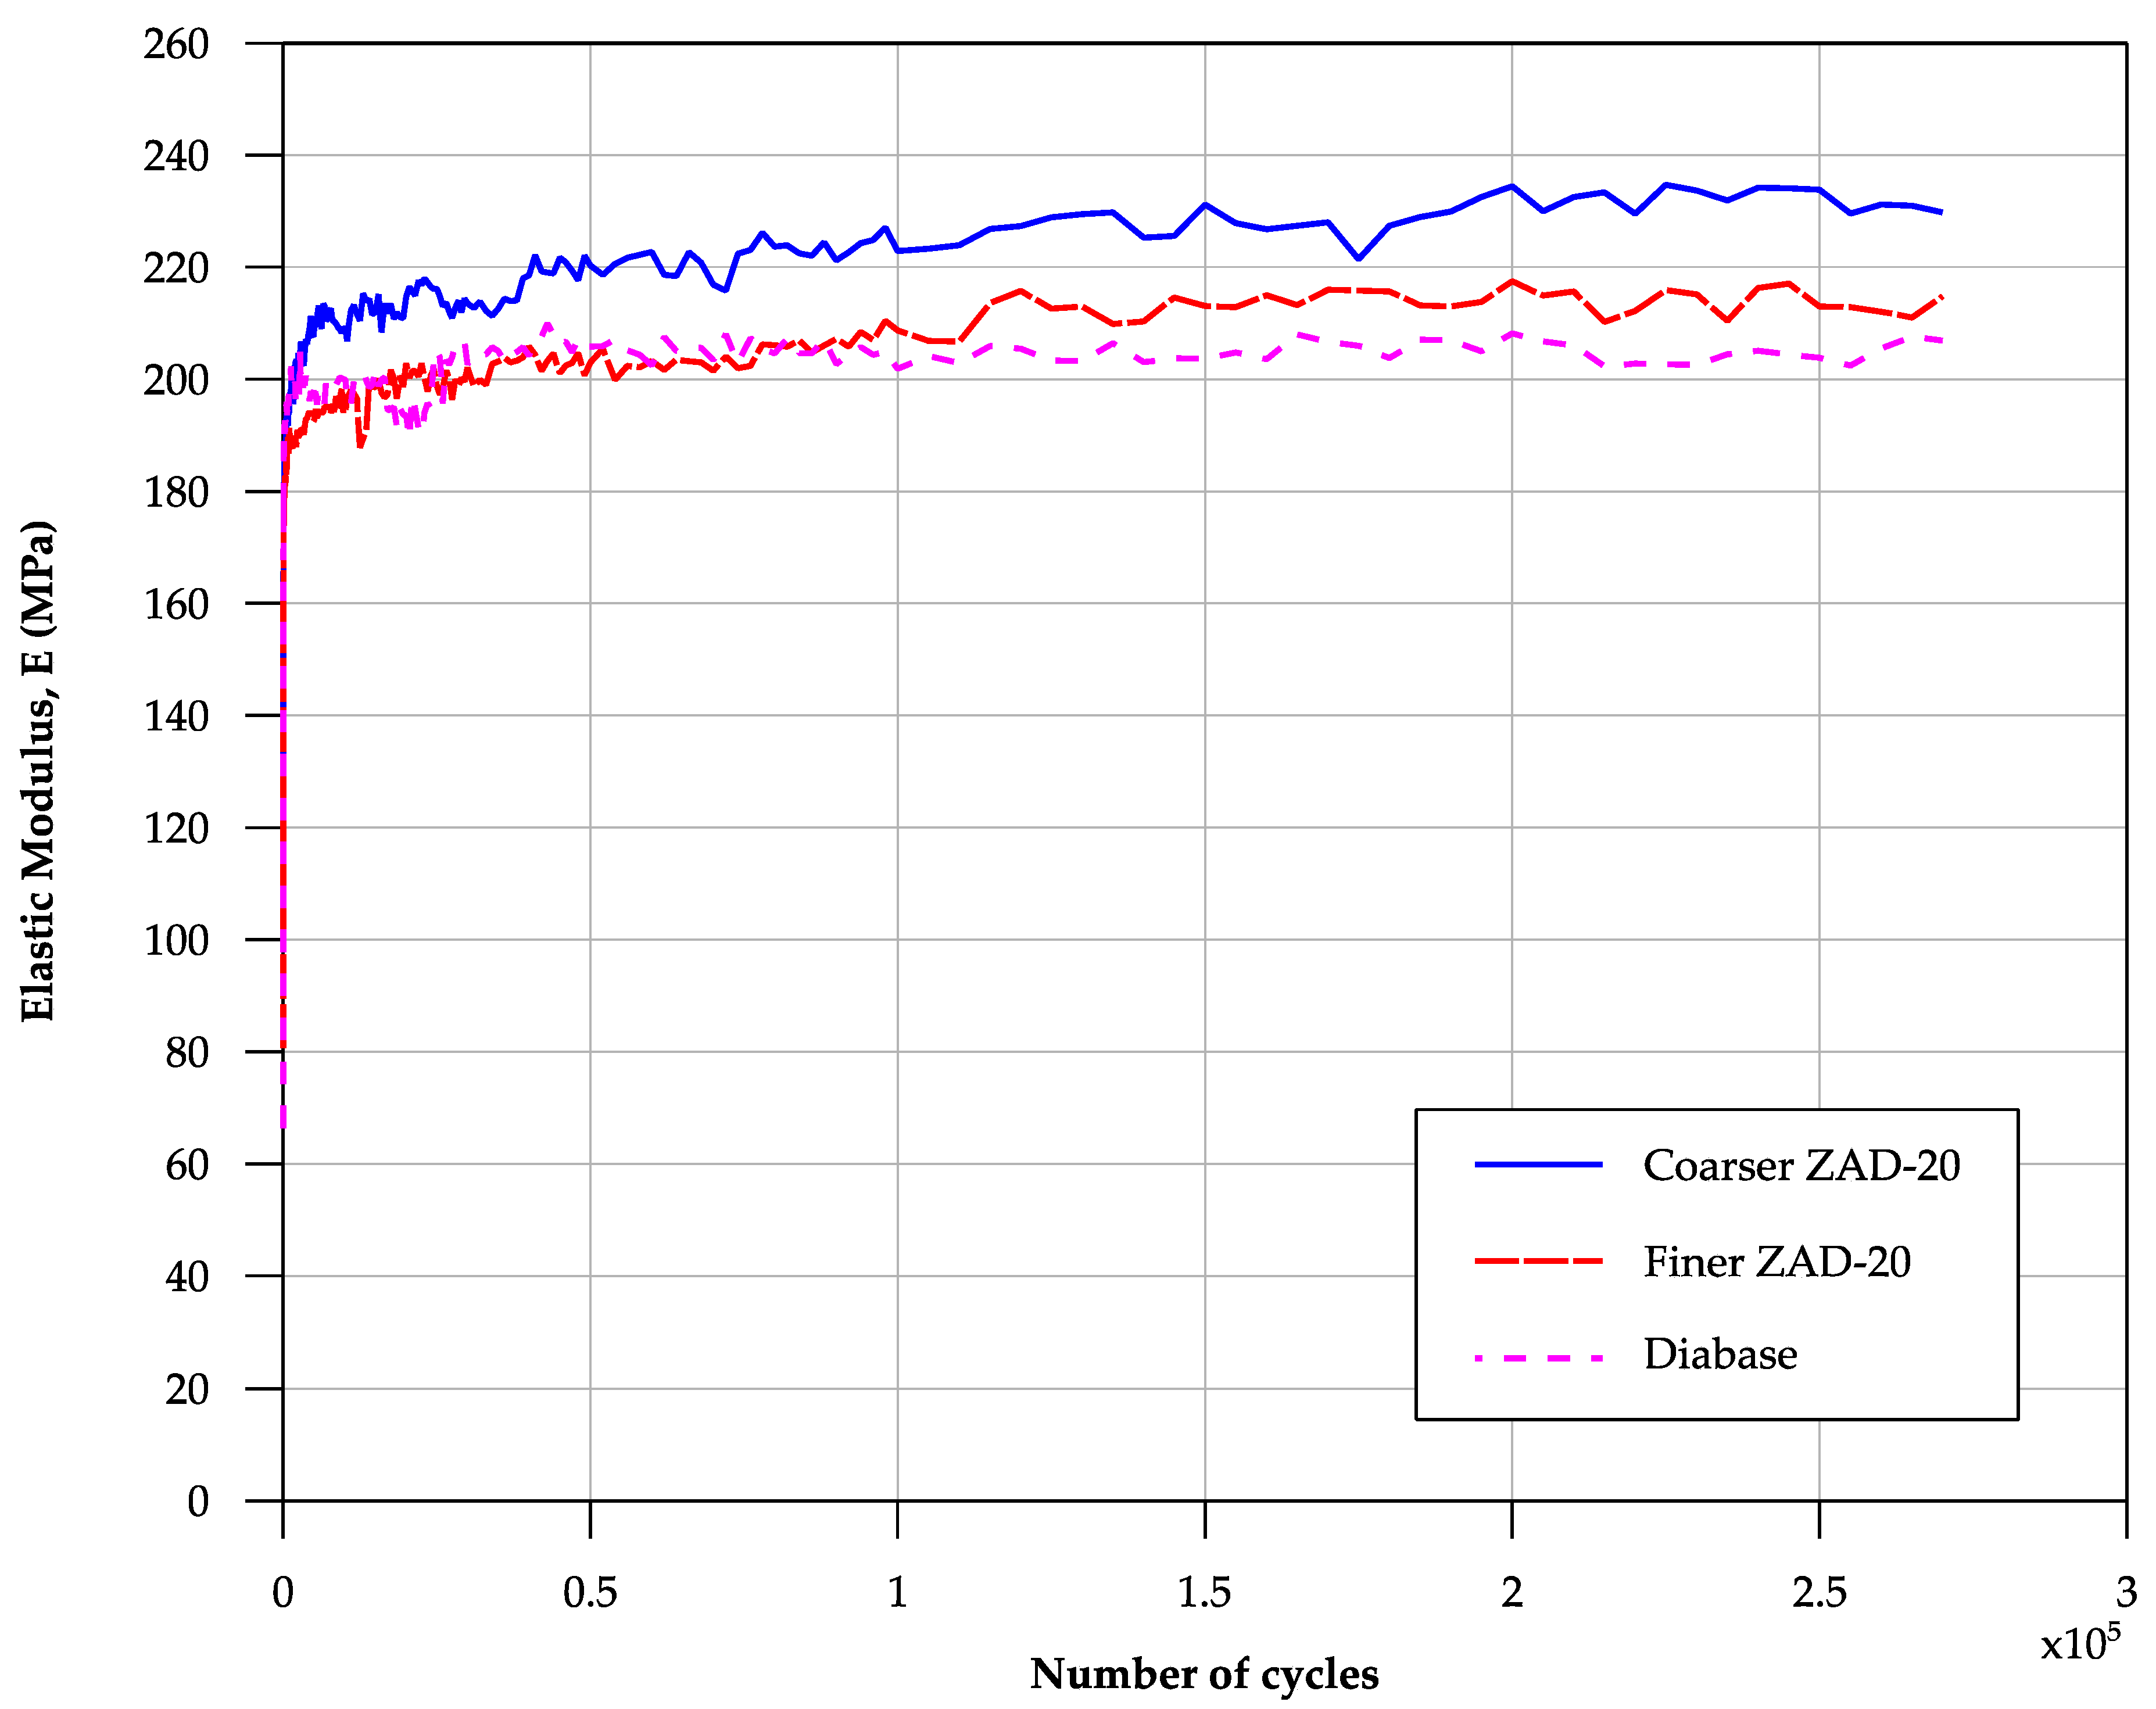
Additionally, the evolution of the elastic modulus (E) when applied with the load cycles was obtained (
Figure 7). In order to attain this parameter, the settlement produced in each cycle was considered to be totally elastic. This consideration was not valid for the first load applications, as the permanent settlement produced in each cycle of this test phase was not insignificant. However, it could be disregarded after the application of a relatively small number of load cycles—around 500.
As observed in
Figure 6, both the magnitude of the settlement and its evolution were clearly different for the three materials. Given this, the variation on the number of cycles applied is one of the adjustments made to the ISO 10722 procedure to better represent the actual on-site compaction conditions. As the standardized procedure consisted of the application of 200 cycles, the number of cycles needed to obtain the same degree of compaction was obtained for the other two materials. To achieve this ratio, the settlement obtained after 270,000 cycles was considered to be the maximum (
). Although it could be observed in the graph (
Figure 6) that the stabilization of the settlement was not reached, the slope of the curves in this zone indicated that they were close to stabilizing. Furthermore, the elastic modulus stabilized after the application of around 150,000 cycles in all three materials (
Figure 7), further showing that the materials had reached their maximum compaction for the applied load. One possible explanation of the lack of stabilization of the settlement, even with a large number of cycles, is the migration of material from the area under the loading plate towards the edge of the mold, which increases the settlement produced without increasing the dry density of the material. This could explain why the settlement does not stabilize for light loads like the ones applied during the tests.
For the tested diabase, the settlement produced after 200 cycles was around 35% of what was considered the maximum settlement; this settlement was labeled
. The number of cycles applied in the tests using ZAD-20 would be that which produced a settlement equal to 35% of the maximum. In
Table 3, the values obtained for the tested granular layers are shown.
3.4.3. Stage 3: Simulation of Hydraulic Damage
After the simulation of the mechanical damage, the dimensions of the geotextile specimens are reduced from 300 × 300 mm to 200 × 200 mm, to eliminate the possible edge effects. Only the center part of the sheet is maintained, using a template to ensure that all geotextiles are cut consistently.
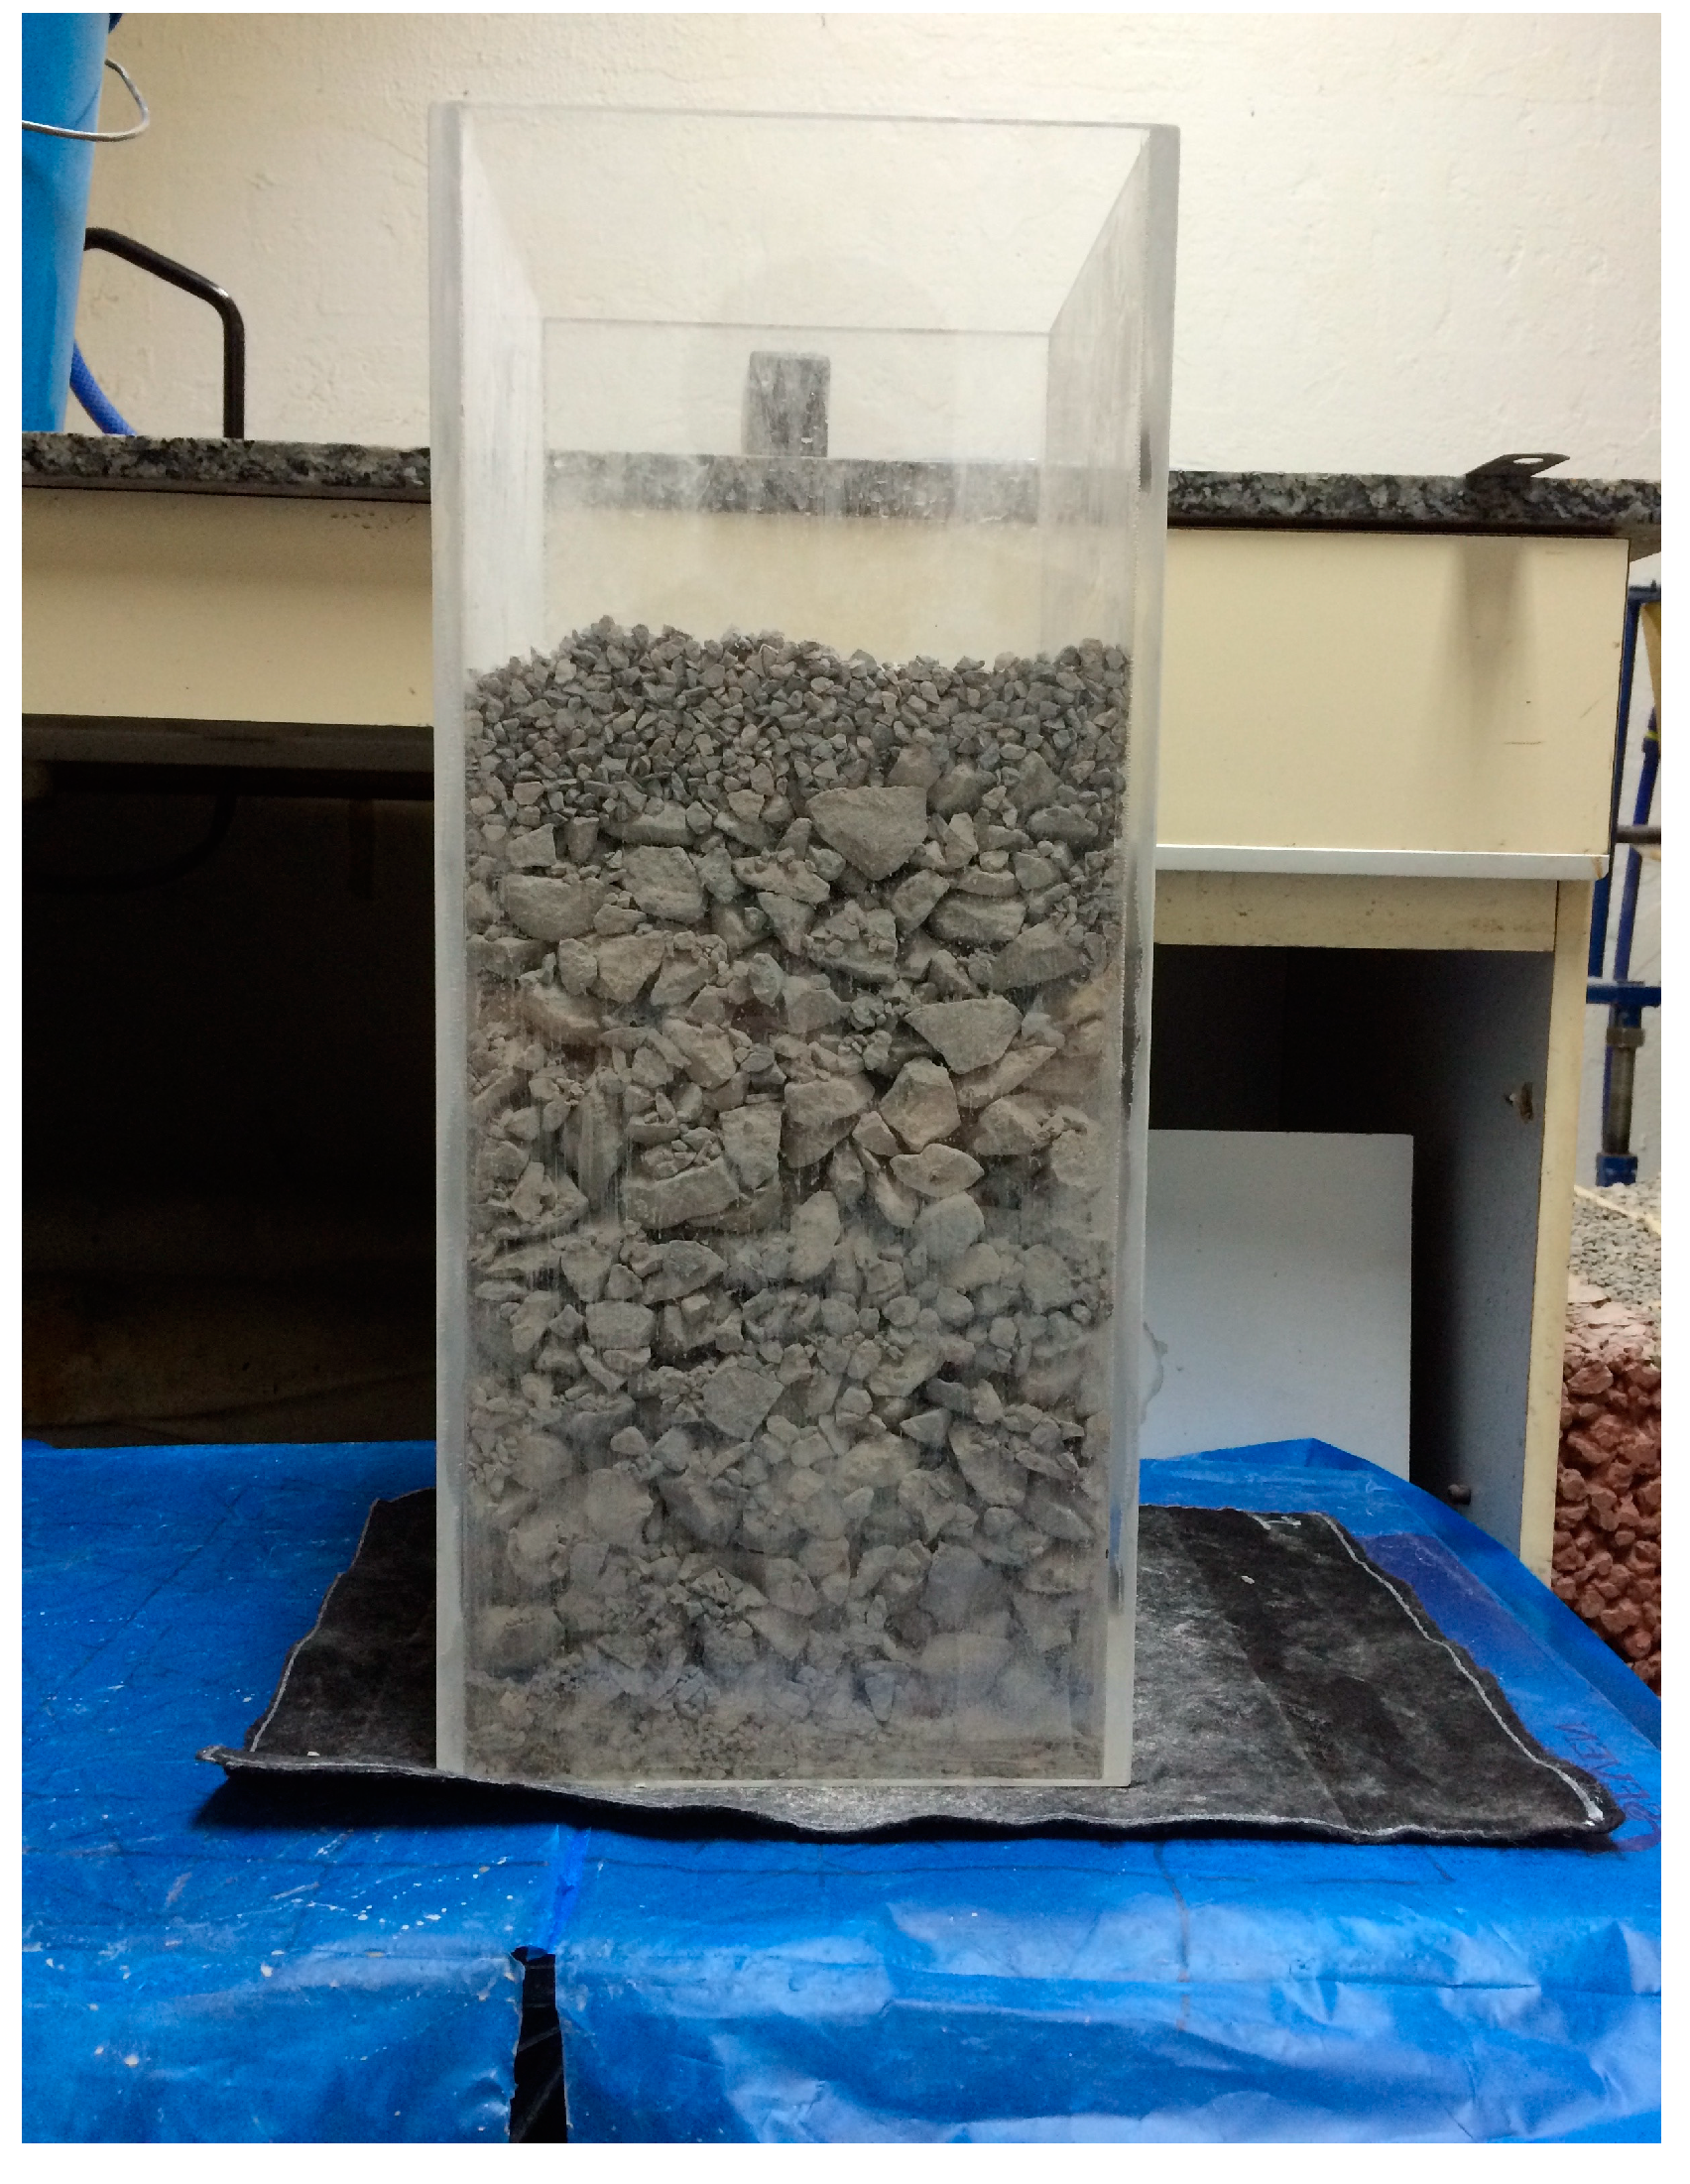
The third test stage consists of passing water through a sample with the same layer arrangement as the studied pavement, using the resulting geotextiles from the previous test stage. The sample is constructed within a bottomless acrylic container, which is placed over a geo-cell, allowing the free flow of water to a drain. In the Spanish code for pavement cross-sections, there are several configurations, depending on the materials used, the sub-grade quality, and the type of traffic. For this study, a 40 cm sub-base layer made of ZAD-20 with an overlaying 7 cm base layer was used. An example of the final arrangement is shown in
Figure 8.
Water circulation through the sample is done by pouring a volume equal to the sum of the volumes of field capacity of the sample (estimated to be 7% in volume) and the volume of the pores (estimated to be 35% in volume). For the tested section, this corresponded to a volume of 8 liters of water. Water was poured manually, maintaining a 3 cm water layer on top of the surface, at any time during the process.
The circulation of water across the sample drags some fines that are stuck to the larger particles to the surface of the geotextile. This stage is not present in the standardized procedures but is considered essential to replicate the actual installation conditions of a geotextile. The ISO 10722 standard suggests the realization of a water permeability test right after the mechanical damage simulation. However, with the real aggregates used in road construction, this underestimates the water permeability loss, since the quantity of fines that settled on the surface of the geotextiles by the dragging effect of water during this stage was relevant.
3.4.4. Stage 4: Determination of the Water Permeability Normal to the Plane after the Test
The geotextile is carefully recovered from the acrylic container, avoiding losing the fines that settled on its surface. Five circular specimens of 50 mm in diameter are prepared from this specimen, in order to perform the ISO 11058 standard procedure, to obtain water permeability normal to the plane of the resulting material. Specimens are obtained at random locations within the tested geotextile sheet. The edges of the sheet are avoided to eliminate the possible edge effects due to the preferential flow path between the aggregates and the acrylic container walls. The value of the water permeability obtained is compared with the value from stage 1 for an untested piece of geotextile. The ratio of these two magnitudes is the value of the new condition factor.
3.5. Testing Campaign
The two geotextiles were subjected to two complete tests for each ZAD-20 type and geotextile configuration defined in
Figure 1. As previously mentioned, the three configurations could be tested by testing configuration 1, with the geotextile only between the sub-base and the subgrade (lower position), and configuration 3, with the geotextile both between the base and sub-base layers (upper position) and the sub-base and subgrade (lower position). This gave a total of 16 complete tests. To achieve this, 24 mechanical damage simulations and 16 washing simulations had to be done. A total of 120 water permeability tests were performed to probes that had previously undergone both the mechanical and hydraulic damage stages. As a result, 12 new condition factors were obtained, depending on the granular material used, the geotextile tested, and the pavement configuration.
4. Results and Discussion
Although the main scope of this study was to design a test procedure to obtain the water permeability loss of geotextiles due to their installation in pervious pavements, some preliminary results were obtained from the tests carried out. A three-way analysis of the variance (ANOVA) was performed to the test results to determine the statistical significance of the variables affecting the tests, along with an analysis of the coefficient of variation to verify the precision of the test procedure. In addition to the numerical results obtained after the interpretation of the test results, some qualitative results were obtained from a visual inspection of the tested samples.
4.1. Qualitative Results: Visual Observations
Figure 9 is a picture taken right after a mechanical damage stage. It was observed that the deterioration of the geotextile after the mechanical damage stage was in concordance with those described in previous experiments from other authors. Although this study was focused on the loss of water permeability, it was crucial to observe the degree of mechanical deterioration of the geotextile sheets, as it could affect the permeability through an increase in the size of the openings and creation of holes. In all tested specimens, only minor isolated holes were found, and the main difference with the untested geotextiles was the presence of a layer made up of fine particles from the aggregates.
Additionally, when carrying out particle size distribution tests of the material after the mechanical damage simulation, the results barely varied from the initial measurements. Considering these observations, we could conclude that most of the fine particles settled on the geotextile surface came from the pre-existing fines in the aggregates, and the generation of new fine particles caused by abrasion and crushing of the material during the test was negligible.
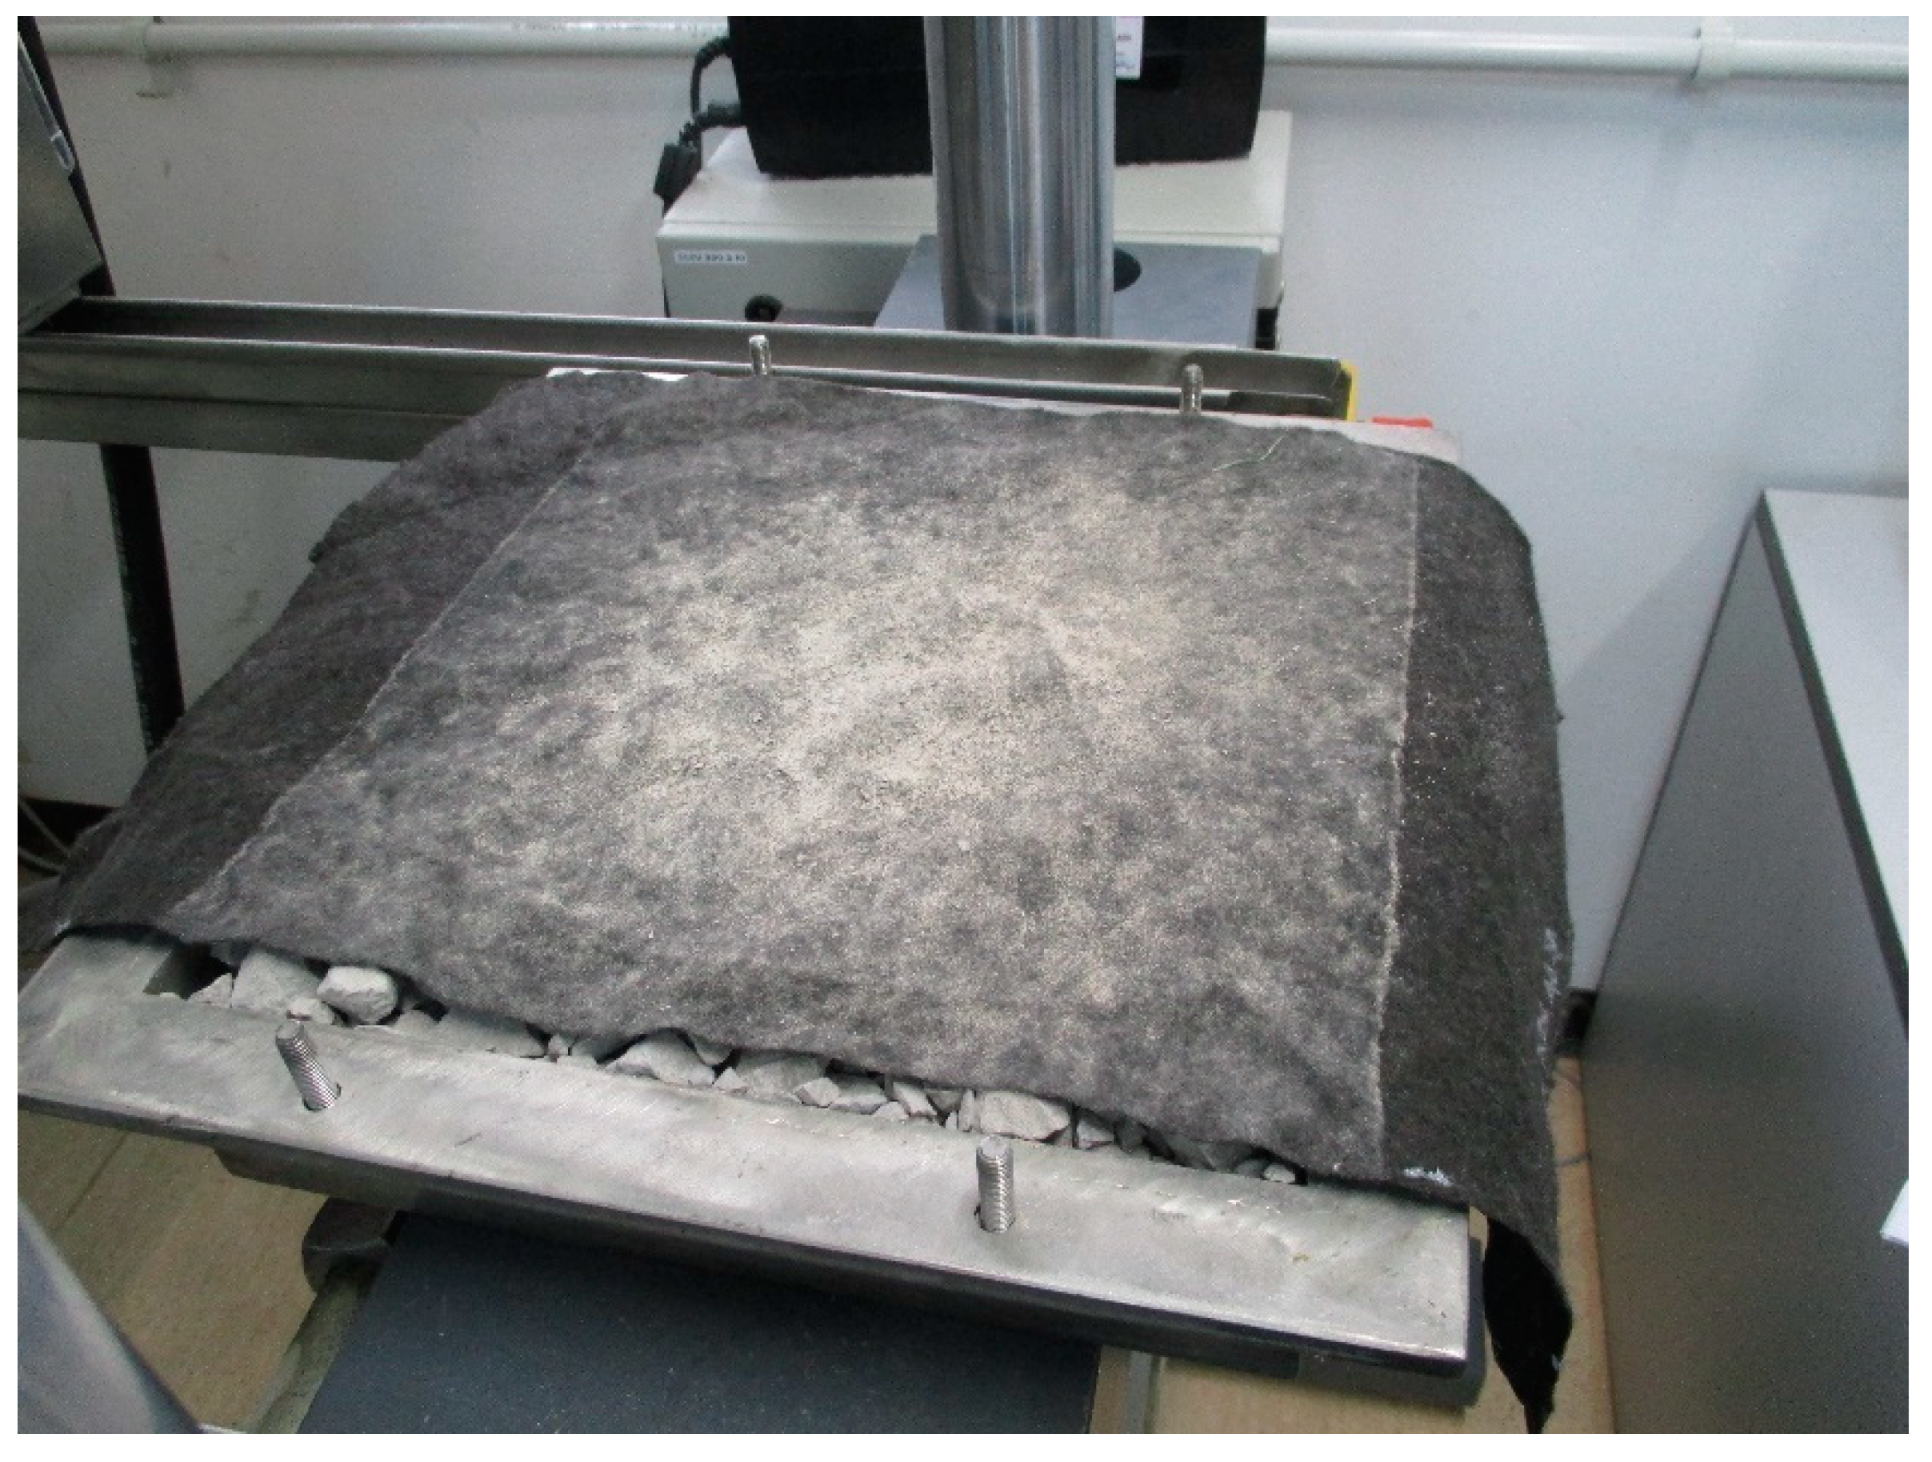
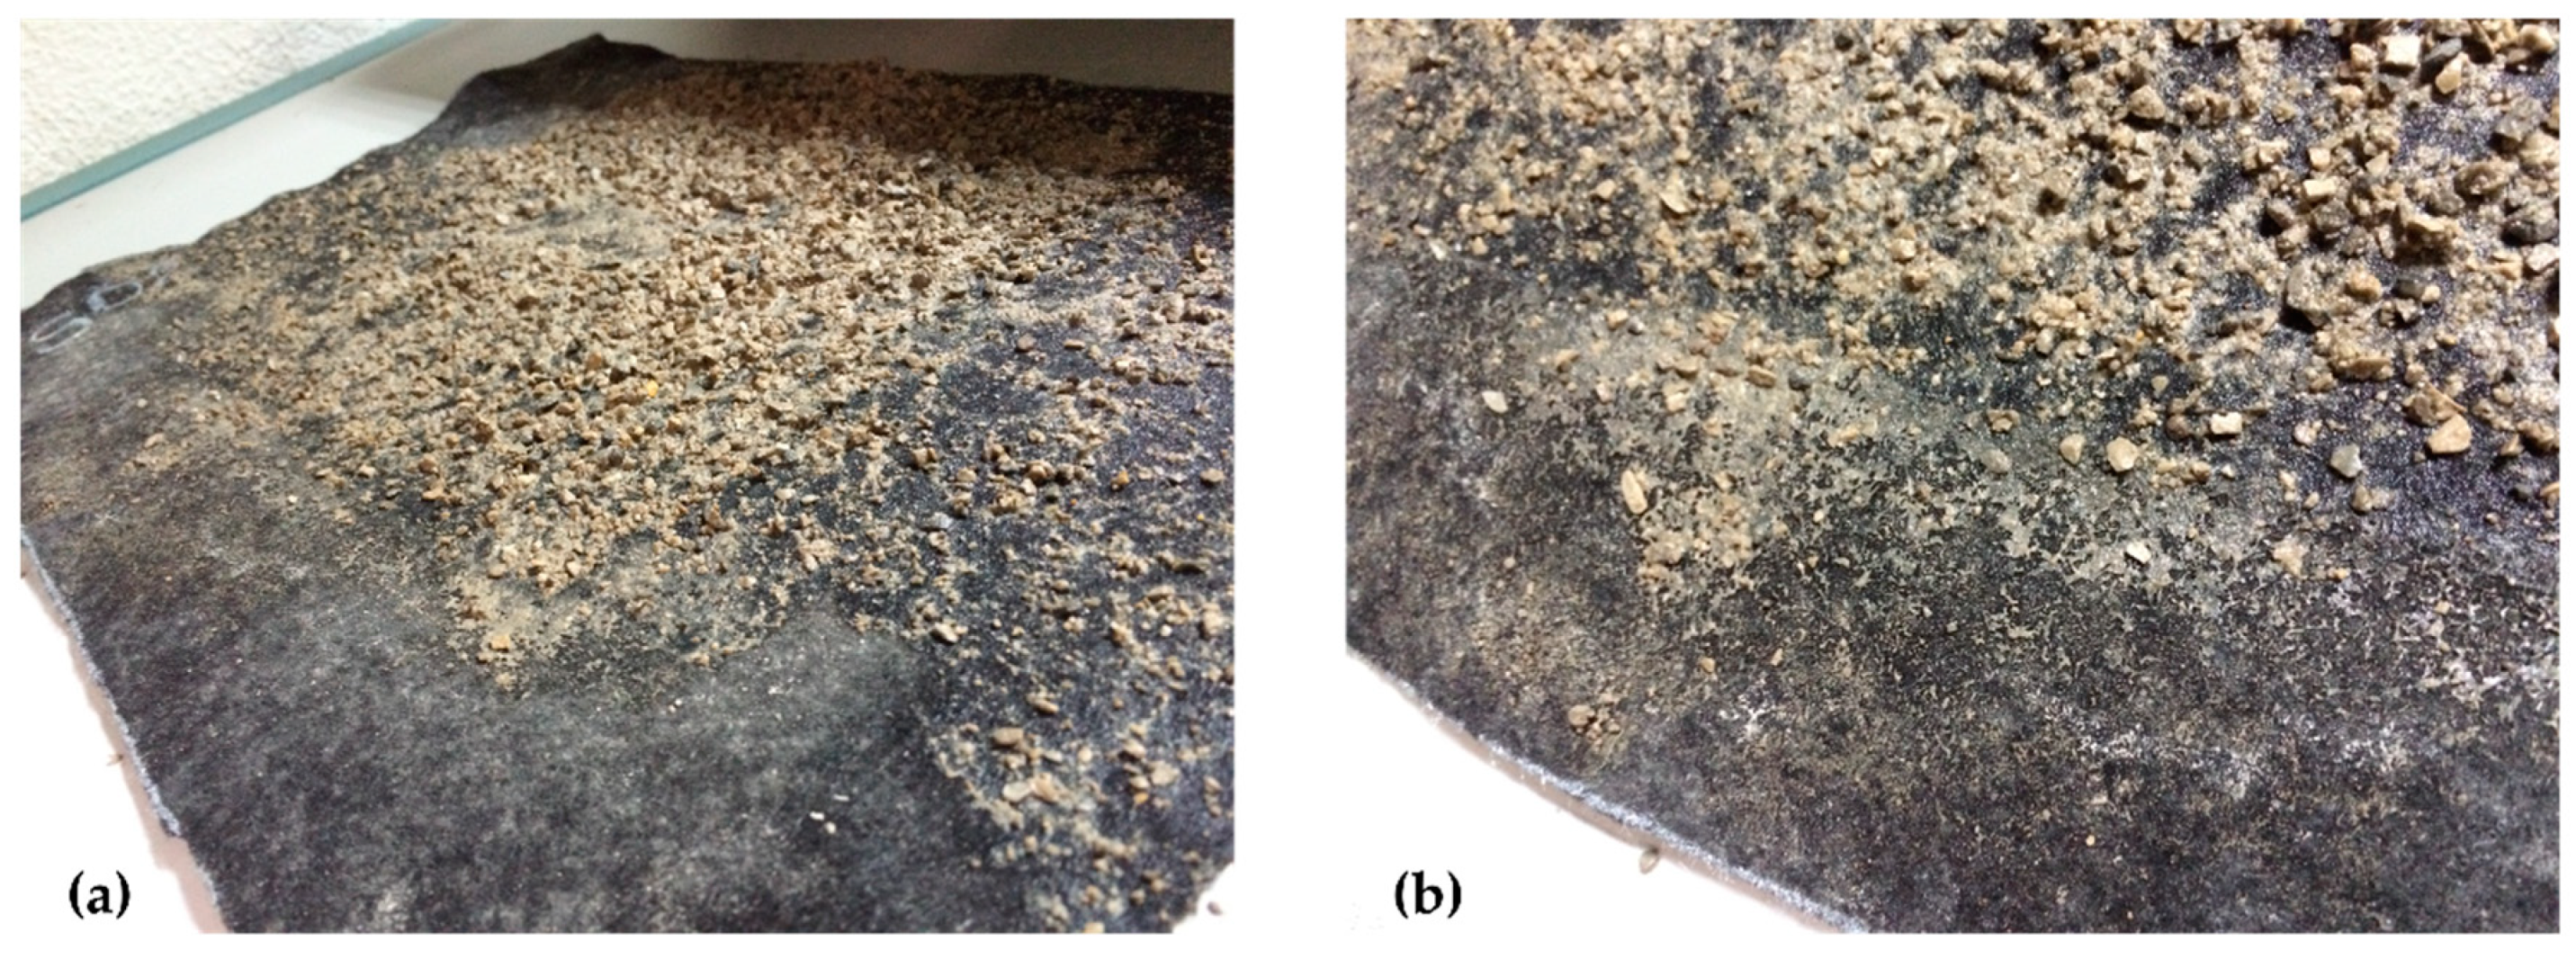
After the hydraulic damage stage, a worsening of the appearance of the geotextile could be observed (
Figure 10). This was due to both the migration of the fines stuck to the larger particles of the granular material dragged by water, and their cementation on the surface of the geotextile due to the presence of water. Most of the permeability loss of the geotextile could be attributed to this layer of cemented fines.
4.2. Quantitative Results: Water Permeability Loss
The measurements of water permeability normal to the plane of the tested samples were compared with the initial determinations carried out on the new samples of the two geotextiles. The percentage of permeability loss was obtained for every test scenario to obtain the new condition factor.
Table 4 and
Table 5 show the obtained results for geotextile A and B, respectively.
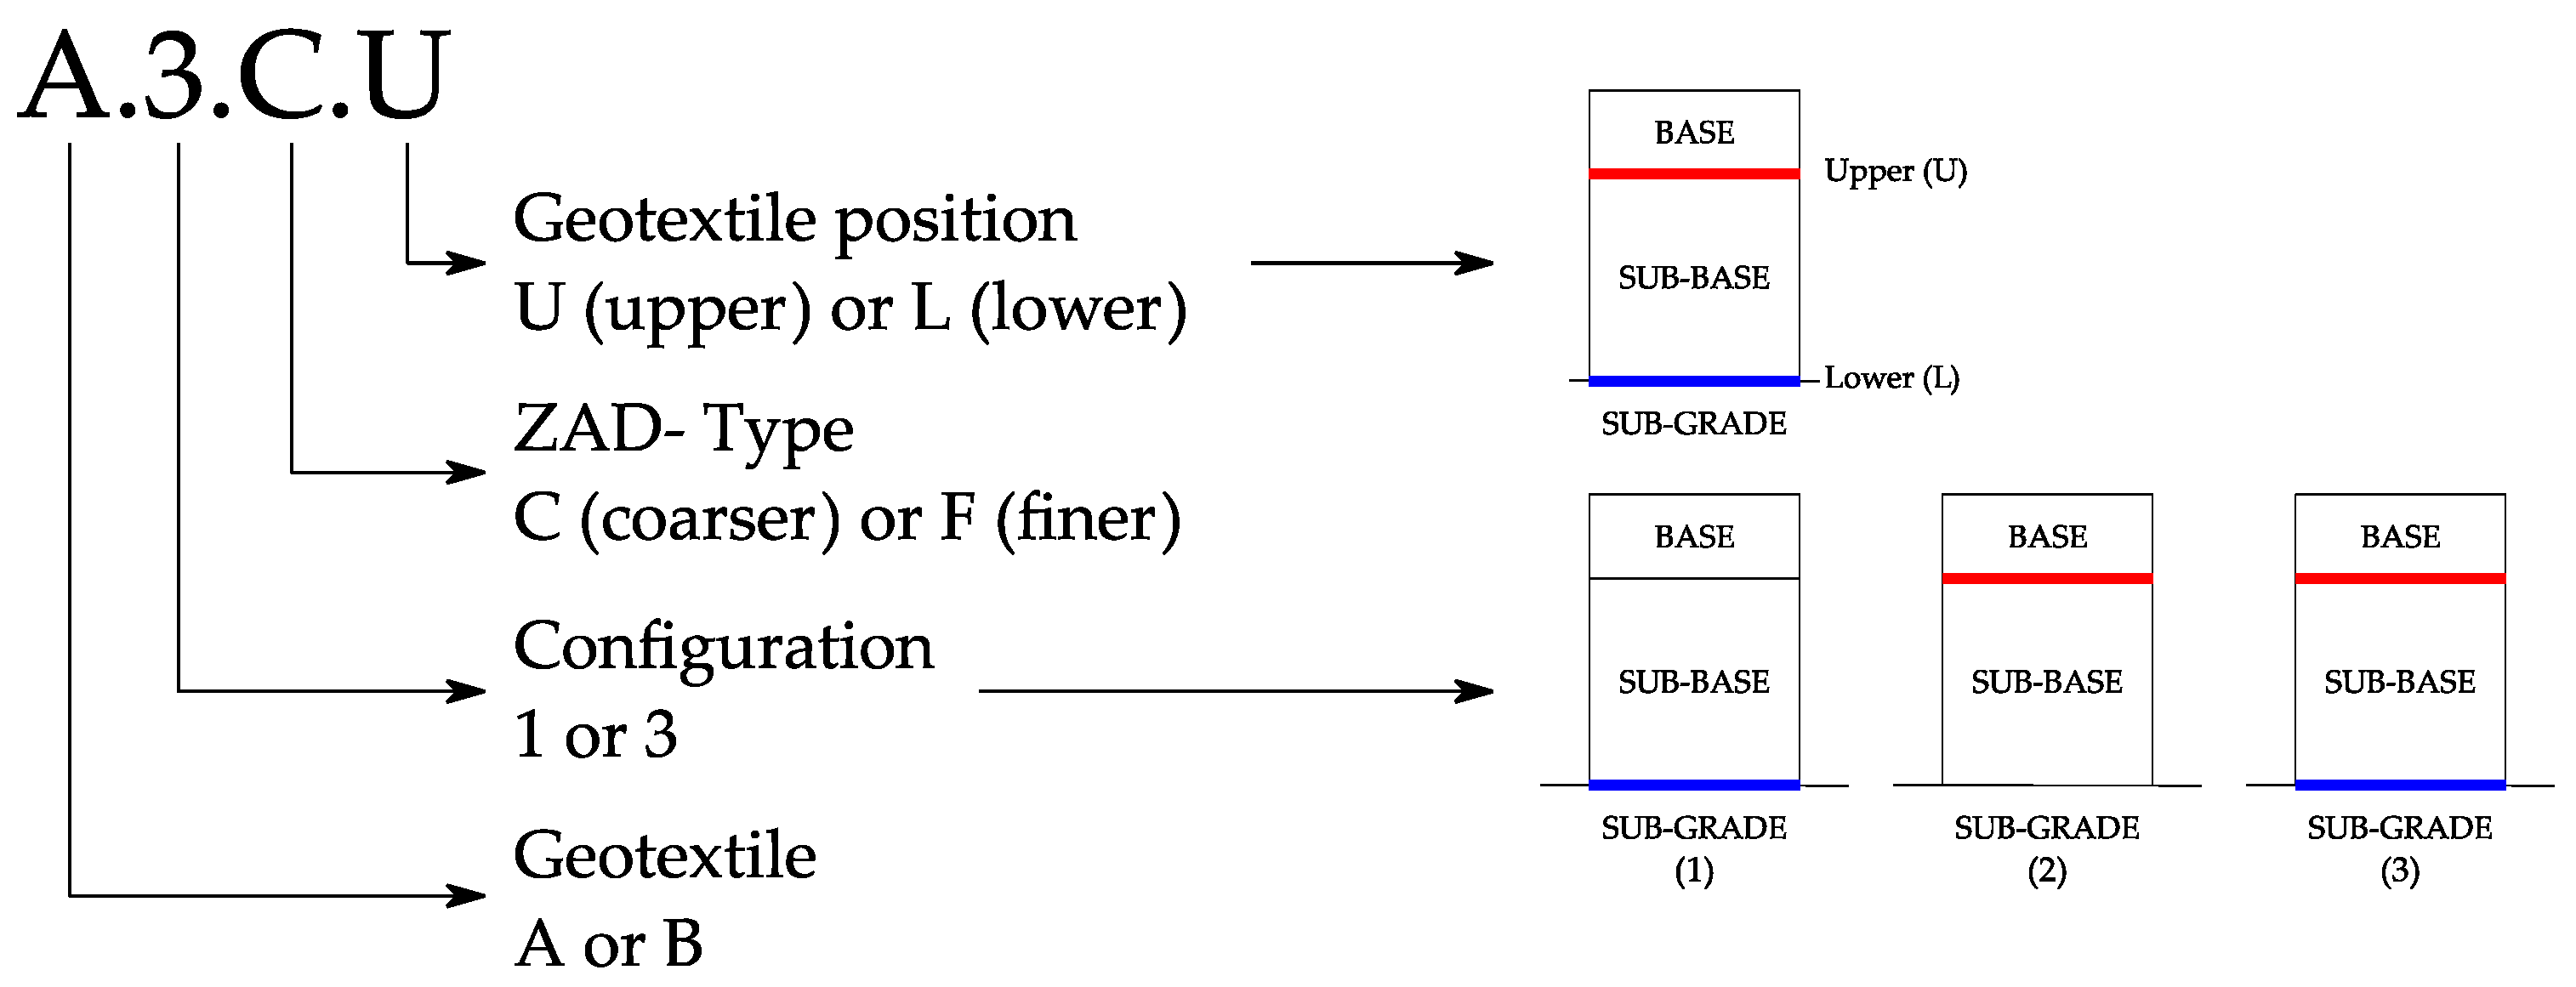
A test code was added to the different tests, to improve their reference within the text.
Figure 11 shows the meaning of the code.
Measurements of water permeability loss ranged between 3% (A.1.C.L) and 51% (A.3.F.U), with an average water permeability loss of 24.6%, for all tested geotextiles. In some specimens, the loss of permeability was very low, and even an increase in permeability was measured. This could be explained by the appearance of little holes during the mechanical deterioration simulation and inconsistencies in the geotextile manufacturing that produced a certain level of heterogeneity in the geotextile. The holes not only affected the permeability of the geotextile but could also cause the geotextile to lose its properties as a separation and filtering layer.
According to the obtained results, including an upper geotextile did not significantly affect the loss of water permeability of the geotextile in the lower position. As a result, the inclusion of a geotextile in the upper position could be motivated by its separation function or biofilm support, handling the biodegradation of oils and grease, rather than to protect the lower geotextile. Results showed that the variable with the highest impact in water permeability loss was the type of aggregates used.
4.3. Analysis of Variance (ANOVA)
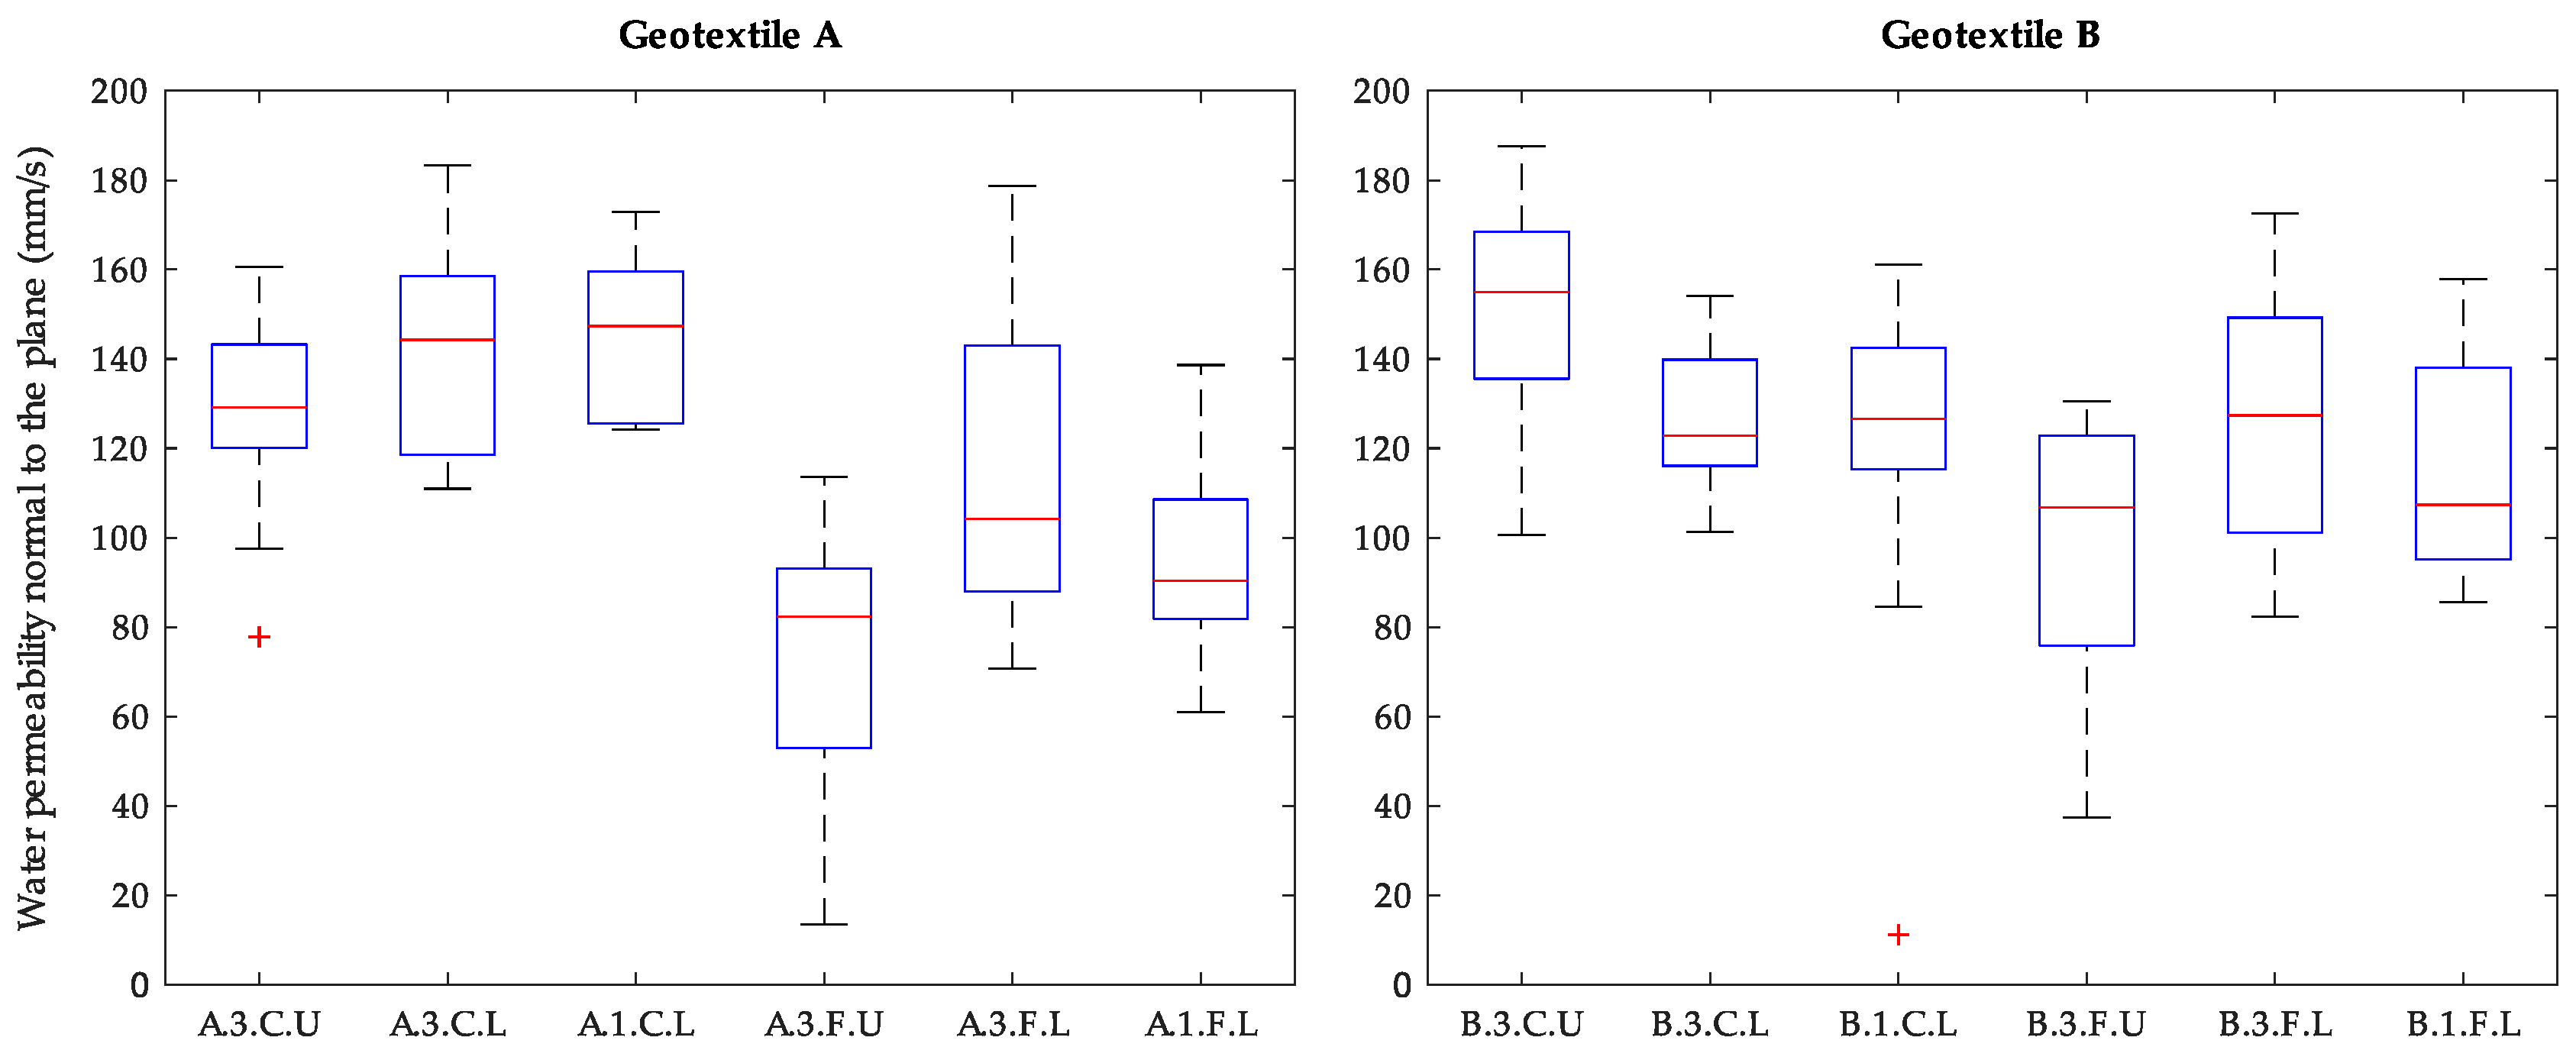
Figure 12 shows a box plot representation of the data obtained from all test scenarios. A total of ten samples were tested to obtain every value of water permeability normal to the plane.
Results for the different geotextiles were analyzed using a three-way analysis of variance (ANOVA) to determine the statistical significance of the variables involved—configuration, aggregate type, and geotextile position.
Table 6 and
Table 7 summarize the results of the analysis for both geotextiles.
In both cases, the aggregate type was statistically significant for a 0.05% level of significance. This was in accordance with the thesis of the investigation and pointed out the importance of using real aggregates to perform the tests. For the other two variables, the analysis showed that they were only statistically significant on the tests carried out to geotextile A. This can also be seen in
Figure 12, in the similar values for all three tests performed using the same ZAD.
4.4. Coefficient of Variation Analysis
All water permeability tests were carried out at the Geosynthetics Laboratory of the University of Cantabria (LAGUC), with ISO 17025 certification.
Due to the nature and manufacturing process of geotextiles, both the water permeability normal to the plane and the mechanical damage under repeated load test results show a high variability even in the same geotextile sheet. The proposed procedure comprises the realization of these two tests to the same specimen, adding the hydraulic damage simulation in between. Hence, the variability of the results for this new procedure is expected to be higher than in the individual tests.
The precision of a test is usually evaluated using the coefficient of variation (CV). Due to the lack of available information about the allowable CV between the specimens of a water permeability test under the ISO 11058 standard, the results of the last proficiency testing campaign (interlaboratory test comparison) for the laboratory certification was used for comparison. In the proficiency testing campaign, the obtained CV referred to complete tests, not to single specimens. The result of a complete test is obtained by averaging the water permeability of five specimens, and this averaging reduces the variability, and hence the coefficient of variation. As a result, the CV calculated between the specimens in the same test should be significantly higher than that obtained from different complete tests. Five laboratories participated in the proficiency testing campaign for ISO 11058, using a nonwoven geotextile, obtaining a coefficient of variation of 13.4%.
The average CV obtained in this study was 24.3%, with a minimum of 12% (A.1.C.L) and a maximum of 40.8 (A.3.F.U). Comparing these values with the results of the interlaboratory study, it could be said that the precision of the test is sufficient for the measured variable.
5. Conclusions
This work presents a test procedure proposal to obtain the new condition factor for the water permeability normal to the plane of a geotextile. The main novelties of the test procedure are the usage of the same aggregates used in road construction instead of the granular material prescribed in the mechanical damage test (ISO 10722) and the inclusion of a hydraulic damage phase. These two improvements are introduced to better reproduce the on-site conditions during road construction. The loss of permeability of a geotextile is mainly caused by the clogging of its pores with fines present in the aggregates, and thus the usage of real aggregates is crucial to simulate real conditions. An analysis of the variance (ANOVA) performed to the results obtained from testing 120 geotextile specimens subjected to the proposed test procedure determined that the variable aggregate type was statistically significant, and thus the tests should be carried out using the appropriate granular material. Additionally, circulating water through a model of the pavement dragged more fine particles stuck to larger ones and created a crust on the geotextile surface, further reducing the permeability.
Two nonwoven geotextiles were tested in different pavement configurations, geotextile positions, and aggregate type. The average water permeability loss was 24.6%, with a maximum of 51%. These results confirmed the initial assumption of the necessity of design pervious pavements taking into consideration the water permeability loss due to its installation, and hence the usage of a new condition factor.
Author Contributions
Conceptualization, C.G.-C.; Formal analysis, C.G.-C. and P.L.-M.; Funding acquisition, Á.V.-Z.; Investigation, C.G.-C. and P.L.-M.; Methodology, C.G.-C. and P.L.-M.; Project administration, C.G.-C.; Resources, E.B.-F.; Software, P.L.-M. and E.B.-F.; Supervision, Á.V.-Z.; Visualization, C.G.-C. and P.L.-M.; Writing—original draft, C.G.-C.; Writing—review & editing, P.L.-M. and J.M.M.-C. All authors have read and agreed to the published version of the manuscript.
Funding
This research was funded by the Spanish Ministry of Economy and Competitiveness, grant number BIA2012-32463, and by the Dirección de Investigación of the Universidad Católica de la Santísima Concepción, fund FAA 02/2018.
Acknowledgments
The authors would like to thank the support and collaboration from the Construction Technology Research Group (Grupo de Investigación de Tecnología de la Construcción - GITECO), the Geosynthetics Laboratory of the University of Cantabria (LAGUC), Grupo de Caminos de Santander (GCS) and the Geotechnical Group of the University of Cantabria.
Conflicts of Interest
The authors declare no conflict of interest.
References
- Rodríguez Hernández, J. Estudio, Análisis y Diseño de Secciones Permeables de Firmes para Vías Urbanas con un Comportamiento Adecuado Frente a la Colmatación y con la Capacidad Portante Necesaria para Soportar Tráficos Ligeros. Ph.D. Thesis, Universidad de Cantabria, Santander, Spain, 2008. [Google Scholar]
- Lamy, E.; Lassabatere, L.; Bechet, B.; Andrieu, H. Effect of a nonwoven geotextile on solute and colloid transport in porous media under both saturated and unsaturated conditions. Geotext. Geomembr. 2013, 36, 55–65. [Google Scholar] [CrossRef]
- Mulligan, C.N.; Fukue, M.; Sato, Y. Sediments Contamination and Sustainable Remediation; CRC Press: Boca Raton, FL, USA, 2009; ISBN 978-0-429-14803-3. [Google Scholar]
- Mullaney, J.; Lucke, T. Practical Review of Pervious Pavement Designs. CLEAN Soil Air Water 2014, 42, 111–124. [Google Scholar] [CrossRef]
- Lucke, T.; Beecham, S. Field Investigation of Clogging in a Permeable Pavement System. Build. Res. Inf. 2011, 39, 603–615. [Google Scholar] [CrossRef]
- Mullaney, J.; Rikalainen, P.; Jefferies, C. Pollution profiling and particle size distribution within permeable paving units—With and without a geotextile. Manag. Environ. Qual. Int. J. 2012, 23, 150–162. [Google Scholar] [CrossRef] [Green Version]
- Puehmeier, T.; Newman, A.P. Oil Retaining and Treating Geotextile for Pavement Applications. In Proceedings of the 11th International Conference on Urban Drainage, Edinburgh, UK, 31 August 2008. [Google Scholar]
- Yong, C.F.; McCarthy, D.T.; Deletic, A. Predicting physical clogging of porous and permeable pavements. J. Hydrol. 2013, 481, 48–55. [Google Scholar] [CrossRef]
- Lucke, T.; Beecham, S. An investigation into long-term infiltration rates for permeable pavements on sloping sub-catchments. In Proceedings of the 12th International Conference on Urban Drainage, Porto Alegre, Brazil, 11–16 September 2011. [Google Scholar]
- Tota-Maharaj, K.; Grabowiecki, P.; Babatunde, A.O.; Coupe, S.J. The performance and effectiveness of geotextiles within permeable pavements for treating concentrated storm water. In Proceedings of the Sixteenth International Water Technology Conference, IWTC 16, Istanbul, Turkey, 7–10 May 2012. [Google Scholar]
- Yong, C.F.; Deletic, A. Factors that predict clogging through porous pavements. In WSUD 2012: Water Sensitive Urban Design; Building the Water Sensitive Community; Proceedings of the 7th International Conference on Water Sensitive Urban Design, Melbourne, Australia, 21–23 February 2012; Institution of Engineers Australia: Barton, Australia, 2012. [Google Scholar]
- Beecham, S.; Pezzaniti, D.; Myers, B.; Shackel, B.; Pearson, A. Experience in the application of permeable interlocking concrete paving in Australia. In Proceedings of the 9th International Conference on Concrete Block Paving, Buenos Aires, Argentina, 18–21 October 2009. [Google Scholar]
- Shackel, B. The design, construction and evaluation of permeable pavements in Australia. In Proceedings of the 24th ARRB Conference—Building on 50 Years of Road and Transport Research, Melbourne, Australia, 12–15 October 2010. [Google Scholar]
- Brown, C.; Chu, A.; van Duin, B.; Valeo, C. Characteristics of Sediment Removal in Two Types of Permeable Pavement. Water Qual. Res. J. Can. 2009, 44. [Google Scholar] [CrossRef] [Green Version]
- Dirección General de Carreteras, Ministerio de Fomento, Gobierno de España. Pliego de Prescripciones Técnicas Generales para Obras de Carreteras y Puentes (PG-3); Ministerio de Fomento: Madrid, Spain, 2014. [Google Scholar]
- AENOR. UNE-EN ISO 11058 2010, Geotextiles y Productos Relacionados con Geotextiles. Determinación de las Características de Permeabilidad al Agua Perpendicularmente al Plano sin Carga. (ISO 11058:2010); AENOR: Madrid, Spain, 2010. [Google Scholar]
- AENOR. UNE-EN ISO10722 2007, Geosintéticos. Procedimiento de Ensayo Indexado para la Evaluación del Daño Mecánico Bajo Carga Repetida. Daño Causado por Material Granulado. (ISO 10722:2007); AENOR: Madrid, Spain, 2007. [Google Scholar]
- Vaitkus, A.; Laurinavičius, A.; Cygas, D. Site damage tests of geotextiles used for layer separation in road construction. Balt. J. Road Bridge. Eng. 2006, 1, 29–37. [Google Scholar]
- Brady, K.C.; Watts, G.R.A.; Nagarkatti, A.S.; Greenwood, J.H. Installation Damage Trials on Geotextiles; Transport Research Laboratory: Crowthorne, UK; Berkshire, UK, 1994. [Google Scholar]
- Carneiro, J.R.; Morais, L.M.; Moreira, S.P.; Lopes, M.L. Evaluation of the Damages Occurred During the Installation of Non-Woven Geotextiles. Mater. Sci. Forum 2013. [Google Scholar] [CrossRef]
© 2020 by the authors. Licensee MDPI, Basel, Switzerland. This article is an open access article distributed under the terms and conditions of the Creative Commons Attribution (CC BY) license (http://creativecommons.org/licenses/by/4.0/).

 ,
, 


