The Effect of Monsoon Rainfall Patterns on Epilithic Diatom Communities in the Hantangang River, Korea


1
Department of Environmental Science, Hanyang University, Seoul 04763, Korea
2
Doohee Institute of Ecological Research, Korea Ecosystem Service Inc., Gyeonggi-do 13814, Korea
3
Department of Life Science, Daejin University, Pochun, Gyunggi 487-711, Korea
4
National Institute of Environmental Research, Incheon 22689, Korea
5
Department of Life Science and Research Institute for Natural Sciences, Hanyang University, Seoul 04763, Korea
*
Author to whom correspondence should be addressed.
Water 2020, 12(5), 1471; https://doi.org/10.3390/w12051471
Submission received: 18 March 2020
/
Revised: 17 May 2020
/
Accepted: 20 May 2020
/
Published: 21 May 2020
(This article belongs to the Special Issue The Ecological Assessment of Rivers and Estuaries: Present and Future)
Abstract
:Most of Korea’s rivers and lakes are subject to physico-chemical disturbances, such as increased water quantity and flow rates, and influx of nitrogen and phosphorus, due to intense rainfall concentrated in the Asian monsoon season. To examine the influence of rainfall on epilithic diatom communities, we measured the diatom distribution and river water quality at 29 sites along the main-stream and tributaries of the Hantangang River, Korea, in the period of 2012–2015. Water quality parameters in the polluted sites had improved following rainfall, but the response of dominant species varied with water quality; the dominant species Nitzschia fonticola decreased in abundance regardless of sampling sites, and the abundance of Achnanthidium minutissimum in the clean sites and Nitzschia palea in the polluted sites increased after rainfall, respectively. The community dynamic index (CDI) showed that the most obvious shift of epilithic diatom community occurred in the mid-polluted sites in 2013 with the highest rainfall. This suggest that the effect of rainfalls on the epilithic diatom community is dependent on various parameters, such as the magnitude of rainfall, water quality and its biotic compositions of diatom communities, but it also indicates that improving the water quality of rivers is important to promote the resilience of diatom communities to extremes of precipitation. Further investigation is needed to generalize the effects of monsoon rainfall on the epilithic diatom communities, considering rivers with different environmental characteristics.
1. Introduction
The Asia-monsoon, also called the seasonal wind, refers to a change in wind direction in summer and winter driven by temperature differences between the land and ocean. Monsoons are associated with intense rainfall and are typically generated by seasonal changes in wind and atmospheric pressure. As a peninsula, South Korea is largely affected by the difference in heat capacity between the land and ocean; it is therefore influenced by seasonal wind, with a dominant northwesterly wind in winter and a dominant southeasterly wind in summer [1]. The Korean peninsula is mainly affected by the North Pacific High in summer, and more than 50% of the annual precipitation is concentrated within the monsoon season [2].
Due to rapid global climate change, the frequency of floods and droughts is becoming more irregular in the Korean peninsula and worldwide, with increasing impacts on the hydrology of rivers and lakes [3,4,5]. Rainfall has a profound effect on the disturbed river ecosystems, rather than pristine or undisturbed rivers; in particular, river biochemical oxygen demand (BOD), turbidity, electrical conductivity, and nitrogen-phosphorus (N-P) nutrients were found to markedly increase following rainfall, due to an influx of nutrients from the surrounding environment [6]. Despite the differences in rainfall characteristics, the biomass of algae (green algae and diatoms) and zooplankton in rivers generally increases after rainfall [7,8]; the fish biomass also typically increases, signifying bottom-up ecosystem characteristics [9,10]. Studies on the response of riverine ecosystems to rainfall have predominantly focused on the rainfall impacts on water quality, fish, invertebrates, and phytoplankton [11,12,13,14]; however, studies on the effects of rainfall on epilithic diatom communities are currently limited.
Epilithic diatoms account for 20% of the total global carbon fixation and include the most diverse taxonomic groups of algae [15]. Along with bacteria, they form biofilms on the surface of substrates, such as rocks and pebbles. Diatoms undergo a biofilm cycle in running water by absorbing nutrients, increasing their cell density, and desorbing after reaching a certain growth stage [16,17]. Benthic algae that inhabit running waters, such as streams or rivers, are the main food source for high-level predators, such as aquatic insects and fish [18,19,20]. To understand climate change-induced changes in river flow and its effects on biotic communities, the long-term monitoring of rainfall patterns during the monsoon season and its impacts on epilithic diatom communities should be investigated.
Our research team previously reported the impacts of monsoon rainfall on the river diatom community [21,22]. To understand the impact or its magnitude of rainfall, we compared physico-chemical and biological parameters before and after the monsoon, and analyzed the relationship between water quality parameters and biological indices (dominance, diversity, eveness and richness).
In this study, for the pursuit of more visible performance on the shift of the diatom community, we also propose and used a community dynamic index of epilithic diatoms (CDI) based on a simple ordination method (i.e. principal component analysis, PCA) of biological data. CDI reflects the magnitude of change between two communities before and after monsoon rainfall. Before the introduction of CDI method, we conducted the pre-test using various ordination methods.
The main aim of this work is to study the impacts of Asian monsoon rainfall patterns on the river environmental characteristics and over the epilithic diatom communities. For that, an investigation of the water characteristics and epilithic diatom communities was conducted for the Hantangang River in the central Korean peninsula before and after the monsoon season in the period of 2012–2015, including 2013, the year of highest rainfall.
2. Materials and Methods
2.1. Study Area
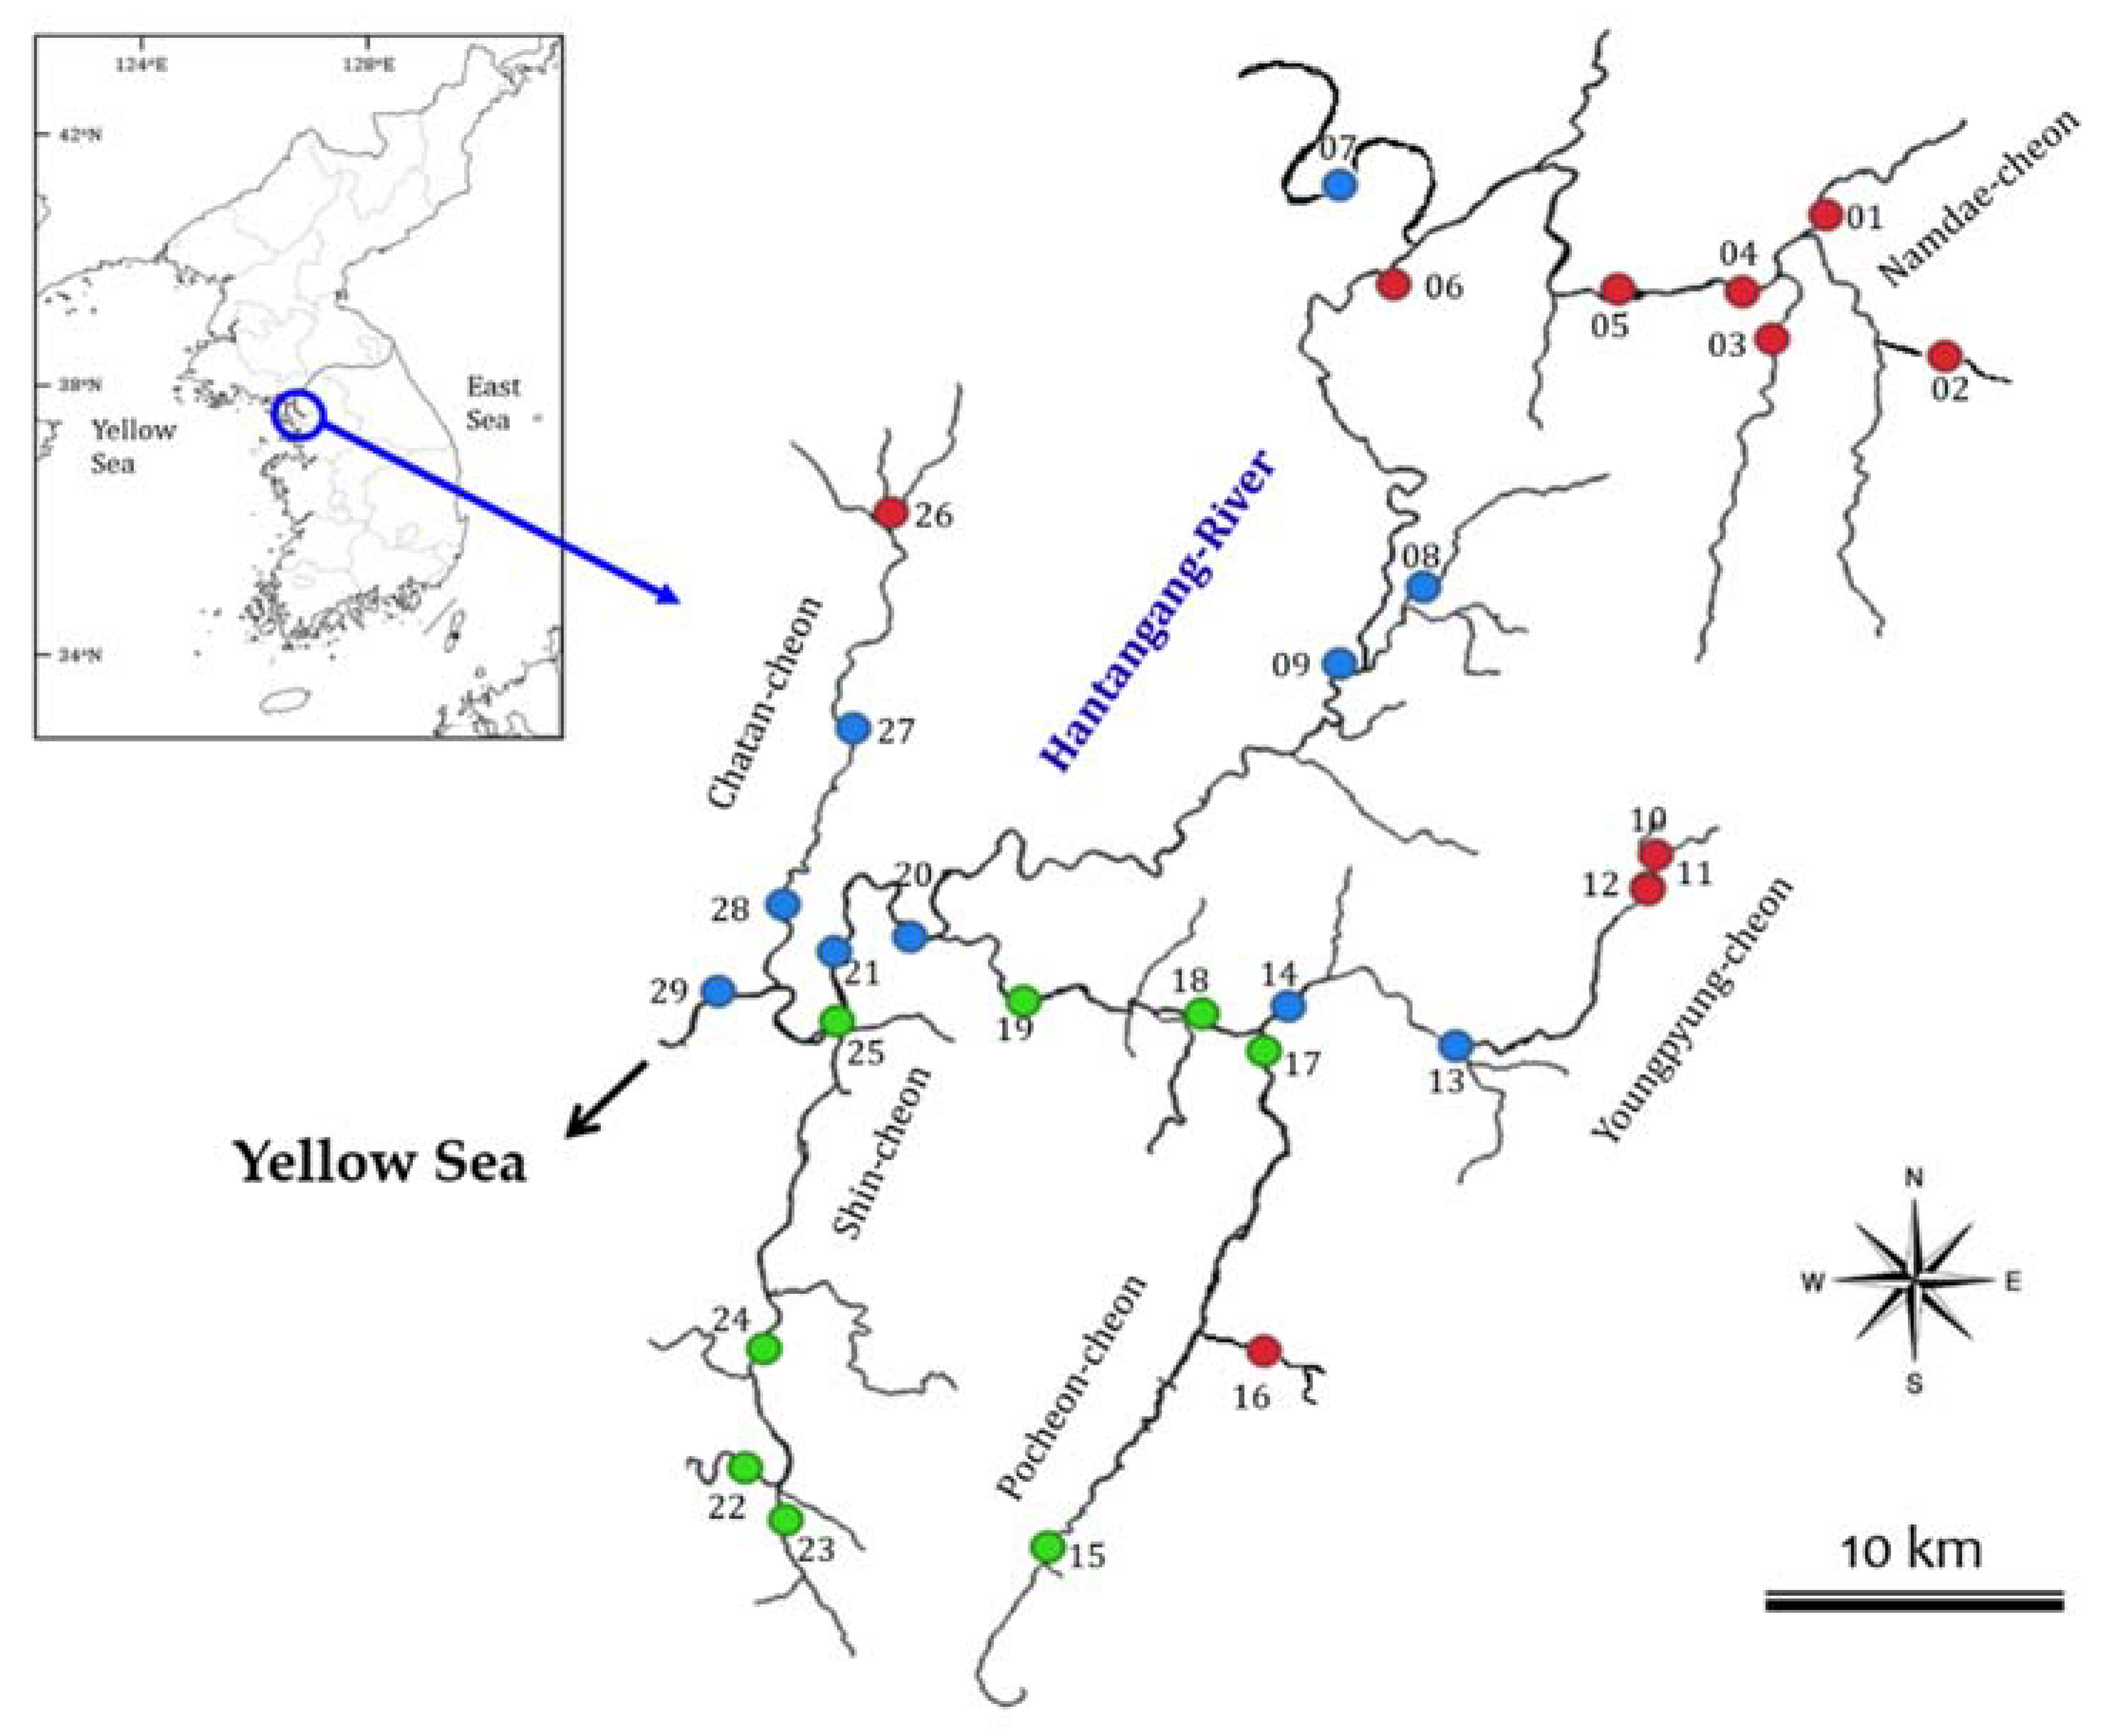
As a study site, the Hantangang River is a major tributary of the Imjin River, with a length of 141.0 km and a drainage area of 2436.4 km2. The river’s source is located in Cheorwon, Gangwon-do and the river converges with the Imjin River in Yangju-gun, Gyeonggi-do, which then flows toward the west coast (Figure 1). The river is a major water resource for various uses. Its main tributaries include Youngpyeongcheon, Pocheoncheon, Sincheon, and Chatancheon [23]. The upstream region consists of canyons and has a high flow velocity, due to its large river regime coefficient and a dominant river bed composition of rocks and pebbles. The region also serves as a leisure-sports venue in summer.
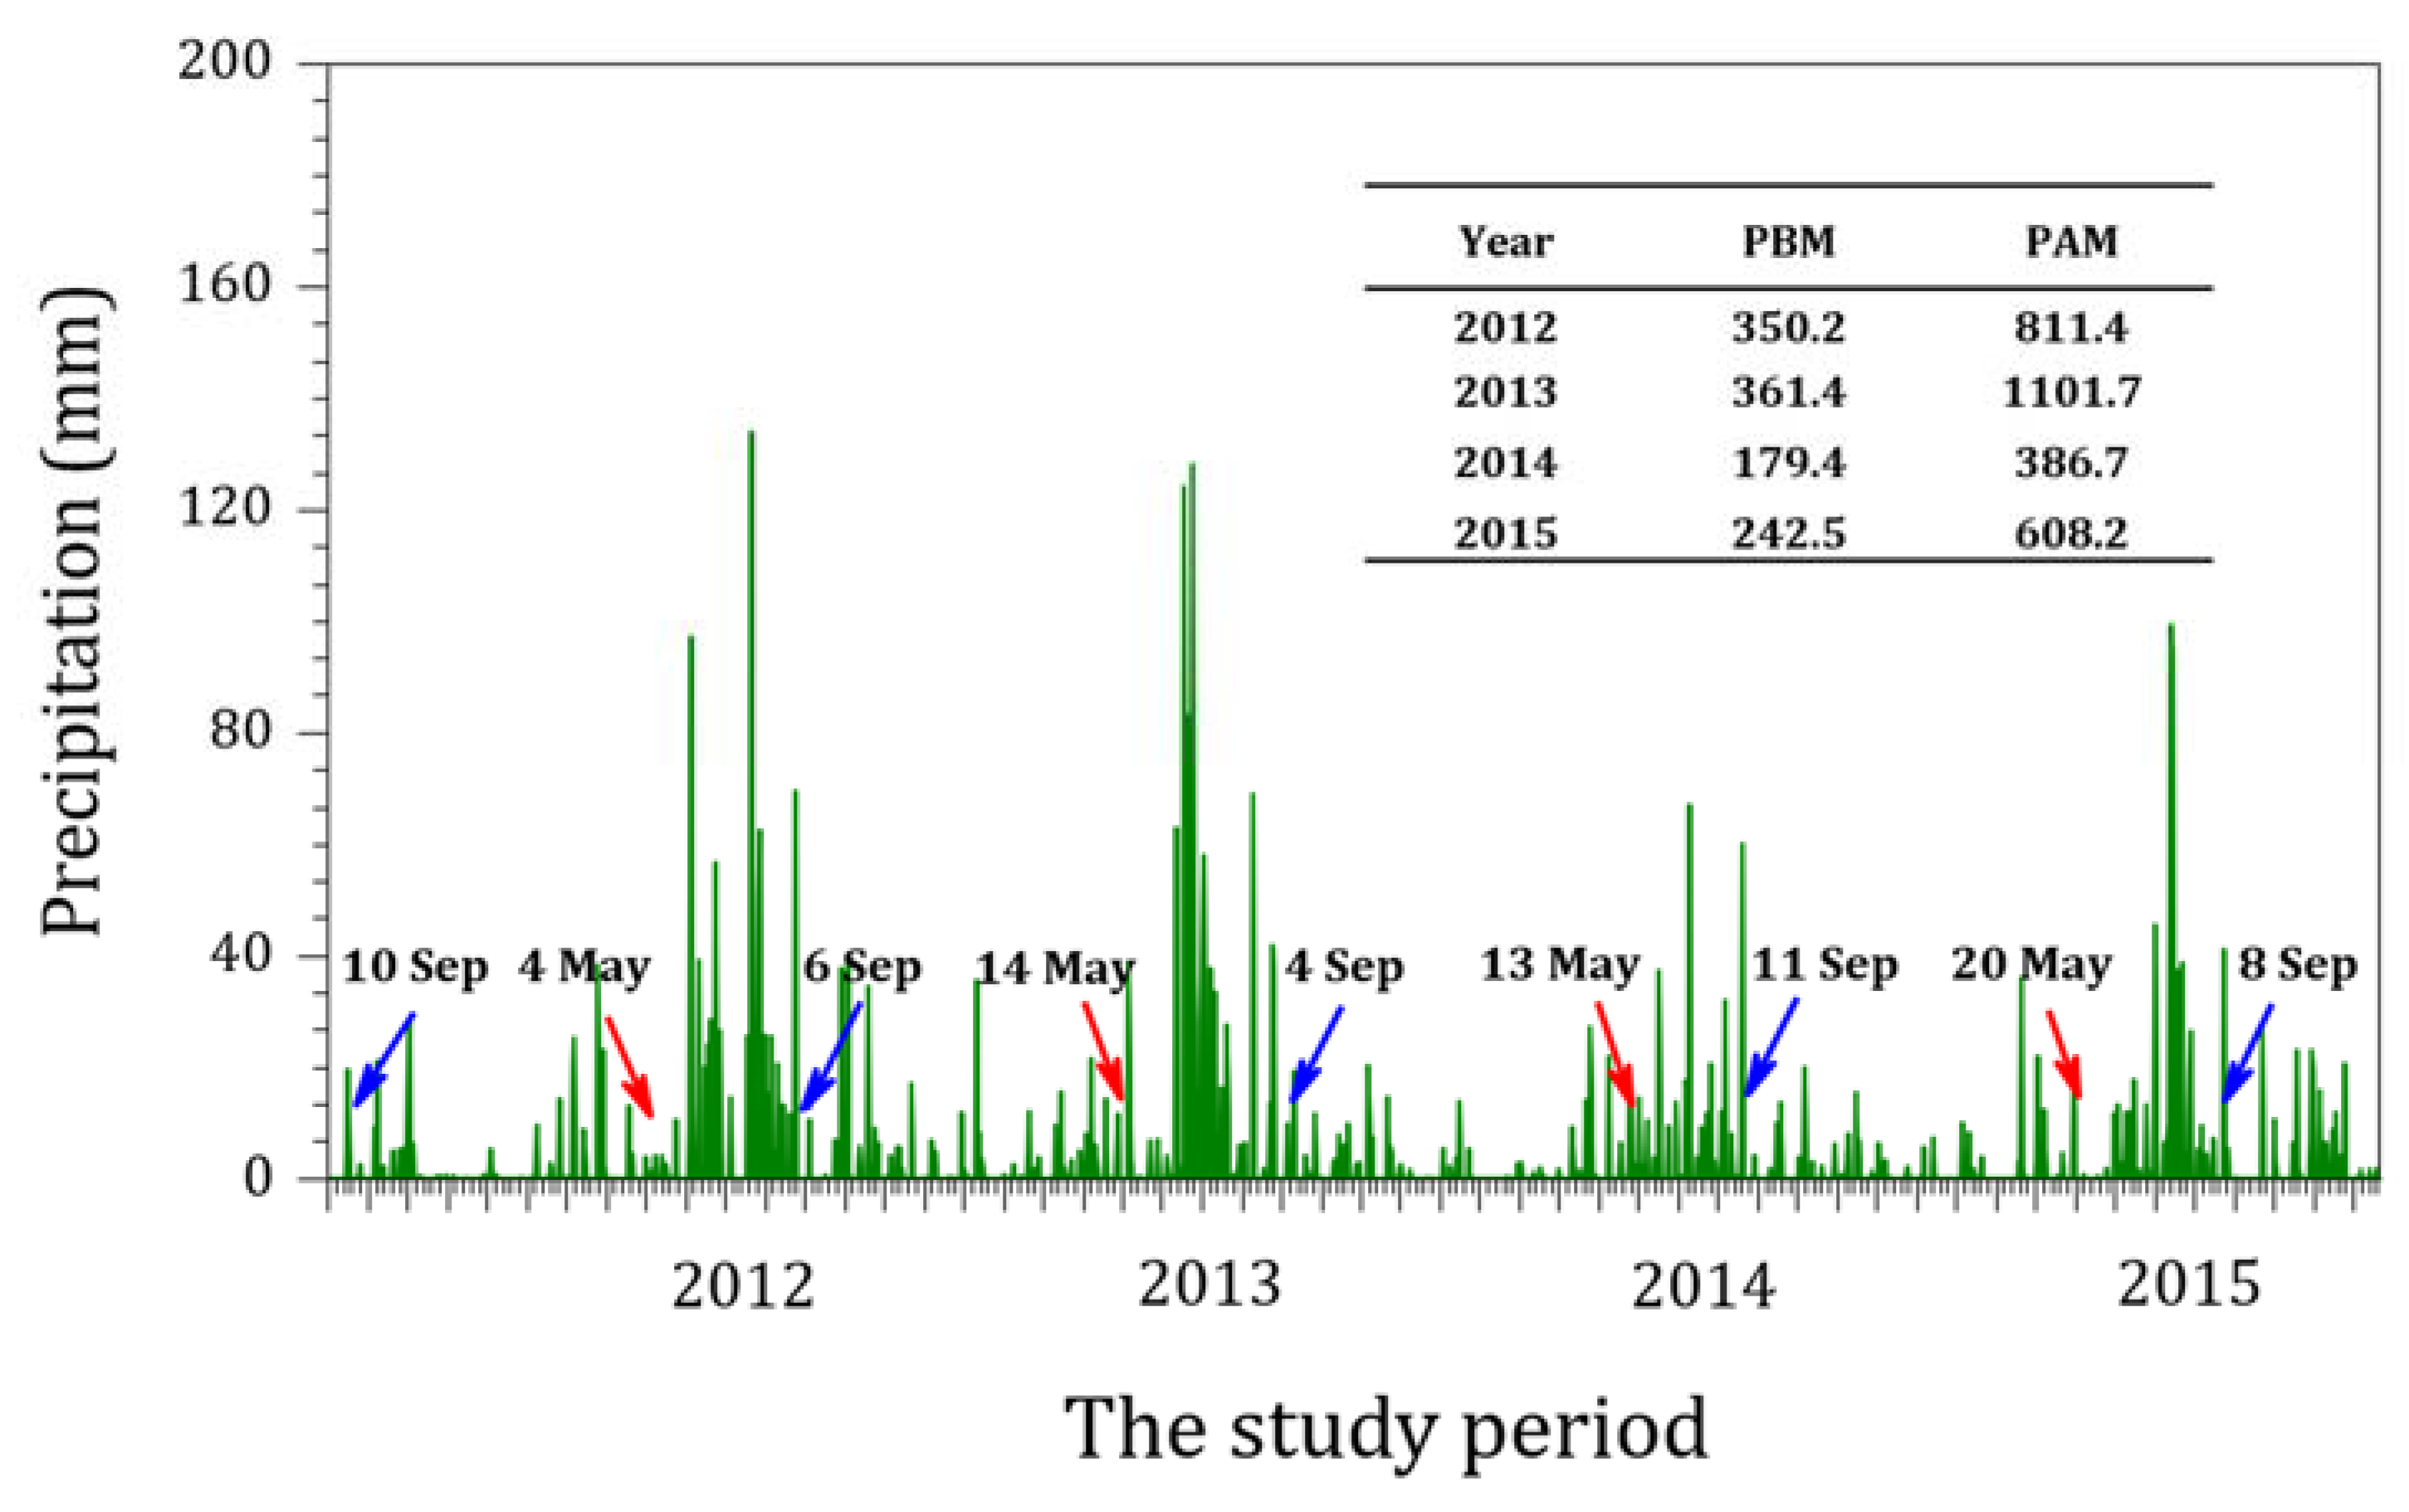
The onset of the summer monsoon in Far East Asia—including South Korea, China, and Japan—is abrupt, as opposed to gradual [24]. The timing of the summer monsoon varies between each country according to their location. In South Korea, the monsoon mainly occurs between June and September and is accompanied by localized heavy rainfall [25]. When the summer rainy season is influenced by the summer monsoon, localized heavy rainfall can occur twice a year [26,27]. For example, localized heavy rainfall occurred twice in the Hantangang River in 2012; however, the absence of this pattern in other years implies that it is not typical. We observed high precipitation during the study period, with a maximum of 1101.7 mm in 2013 and a minimum of 386.7 mm in 2014 (Figure 2). The rainfall varied significantly within the study period (p < 0.001). The annual mean precipitation of the Gyeonggi-do region—including the Hantangang River—was 1200–1500 mm, and 50%–60% (600–900 mm on average) occurred during the summer rainy season.
To compare the rainfall between the 1st and 2nd samplings or among survey years, we calculated the total precipitation measured by a weather center of South Korea (http://www.kma.go.kr/index.jsp). The 1st sampling’s rainfall before monsoon (PBM) is the sum of all precipitation during the cold and dry season from late autumn to the late spring, while the 2nd rainfall or precipitation after monsoon (PAM) is the sum of all precipitation during the warm season from late spring to the late autumn. In Hantan River Basin, the average rainfall during the monsoon period for 4 years was about 2.5 times higher than that of non-monsoon periods.
2.2. Sampling of River Diatom and Waters
To collect epilithic diatoms and river water samples, a total of 29 sites was selected within the mainstream and tributaries of the Hantangang River (Figure 1). Since 2007, the study sites have been continuously monitored for aquatic communities and water quality with land-use under the project of NIER (National Institute of Environmental Research, Korea). Sampling campaigns were conducted twice a year; in May (pre-monsoon) and September (post-monsoon), between 2012 and 2015.
2.3. Analysis of Water Quality Parameters
At each sampling site, the water temperature, dissolved oxygen, pH, electrical conductivity, and turbidity were measured using a portable water quality measuring device (Horiba U-50, HORIBA Ltd., Japan). Water samples were collected using a Van-Dorn type water sampler from the site and transferred to the lab under dark and refrigerated conditions. The samples were then analyzed for BOD, NO3-N, NH3-N, TN, PO4-P, and TP contents. BOD was measured using the Winkler-azide method [28], NO3-N and TN were measured via cadmium reduction, NH3-N was measured using the colorimetric method, PO4-P was measured using the ascorbic acid method, and TP was measured using the ascorbic acid method after persulfate hydrolysis [28]. NO3-N, NH3-N, TN, PO4-P, and TP were analyzed using a spectrophotometer (SP2770i, Youngwoo, Korea).
2.4. Analysis of Epilithic Diatoms
We used a natural rock—with a wide, flat top—as the substrate for collecting epilithic diatoms. When the rain was absent for over two weeks, the rock submerged in water at a depth of 20–30 cm for at least one week was collected. A soft brush was used to collect the diatoms from a 5 × 5 cm2 area on the top surface of the rock. After the samples were fixed with Lugol’s solution [29], transferred to the laboratory and washed, we produced permanent specimens using the mounting agent NaphraxⓇ (Brunel Microscopes Ltd., England), following the Permanganate method [30].
The total abundance of epilithic diatoms (cell/cm2) at each study site was quantified using an inverted microscope (Nikon E600, Tokyo, Japan), and the relative abundance (%) of each species was calculated during the identification process. To calculate the density of diatoms (cells/cm2), the total abundance of diatoms and the relative abundance of each species were multiplied. These data were used to define the most abundant species, and calculate the dominance [31], diversity [32], richness [33], and evenness [34] of the epilithic diatom communities.
2.5. Measurement of Diatom Community Changes
As mentioned in the introduction, we introduced here a numerical method to measure the shift of diatom community before and after monsoon rainfall. Biotic communities show different characteristics according to abiotic parameters; these characteristics can also significantly change with time [35]. This makes it difficult to determine the degree of the numerical values in response to specific changes, such as a precipitation gradient. In this study, we developed a numerical method for the explanation of community change before and after monsoon rainfall, which is called community dynamic index of epilithic diatom (CDI), based on the principal component analysis. Briefly, as an ordination method for understanding the characteristics of a biological community or ecosystem, many statistical methods, such as principal component analysis (PCA) [36], multidimensional scaling (MDS) [37], principal coordinate analysis (PCoA) [38], extended correspondence analysis (DCA) [39], correspondence analysis (CA) [40], redundancy analysis (RDA) [41] and canonical correspondence analysis (CCA) [42], have often been adopted. Of these, PCA, which uses the Euclidean distance method, minimizes data loss and is easy to visualize or present, even with a small amount of principal component variables [43]. In this study, due to the identification of the changes in biological communities, RDA, DCA, and CCA, which required separate environmental variables, were excluded, while the correction models, such as MDS and PCoA, were not included due to null data. In previous studies, the distance in the PCA dimension before and after monsoon rainfall showed higher eigenvalue (Eigenvalue, 22.498) and variance (11.193) than DCA and CA. These characteristics are also consistent with the study of Ko et al. [43], which was conducted with the data of spider harvested by Ter Braak [42].
The CDI index is easily calculated by the measurement of distance between two points before and after all events or stresses (i.e. natural and artificial), to compare the magnitude or strength of impacts with other sampling sites. The PCA finds the orthogonal axis while maintaining the variance of data to a maximum degree and converts the variables in the higher-dimensional space into a lower-dimensional space with no linear correlation,
The community dynamic index of epilithic diatom (CDI), before and after monsoon rainfall, was calculated by the following equation:
- d is the distance between two communities with different times at the specific site in PCA dimension.
- x1 and y1 is the first sampling site in PCA dimension before monsoon
- x2 and y2 is the second sampling site in PCA dimension after monsoon rainfall
- di is the distance between different times of ith community before and after monsoon rainfall
- n is the number of sampling sites or communities
2.6. Data Analysis
The abundance of epilithic diatoms were converted to log10(x+1), to reduce the population variation. As a first step, to understand the characteristics of epilithic diatoms, we performed a cluster analysis (Ward’s methods), based on the number and abundance of species of epilithic diatoms identified from each site. We also conducted an analysis of variance (ANOVA) to compare the differences in biological characteristics (number and abundance of appeared species), community indices (dominant index, diversity, eveness and richness), and water quality between each group. In addition, we applied Pearson’s correlation analysis to determine the associations between epilithic diatoms, water quality, and the precipitation during monsoon. In a second step, we performed a principal component analysis (PCA) to calculate the community dynamic index (CDA); the distance between two communities before and after monsoon rainfall. Meanwhile, for the generalization and validation of the CDI to other organisms or communities, we examined the relationship between CDI and the above community indices, using a correlation coefficient analysis. The statistical analyses were performed using PC-ORD (ver. 4.25. MjM Software, Gleneden Beach, OR, USA) and SPSS software (ver. 23. SPSS Inc. Korea).
3. Results
3.1. Epilithic Diatoms of the Hantangang River
Between 2012 and 2015, we identified a total of 201 different taxa of epilithic diatoms, including two orders, three suborders, eight families, 32 genera, 175 species, 15 varieties, two forma, and nine unidentified taxa (not shown).
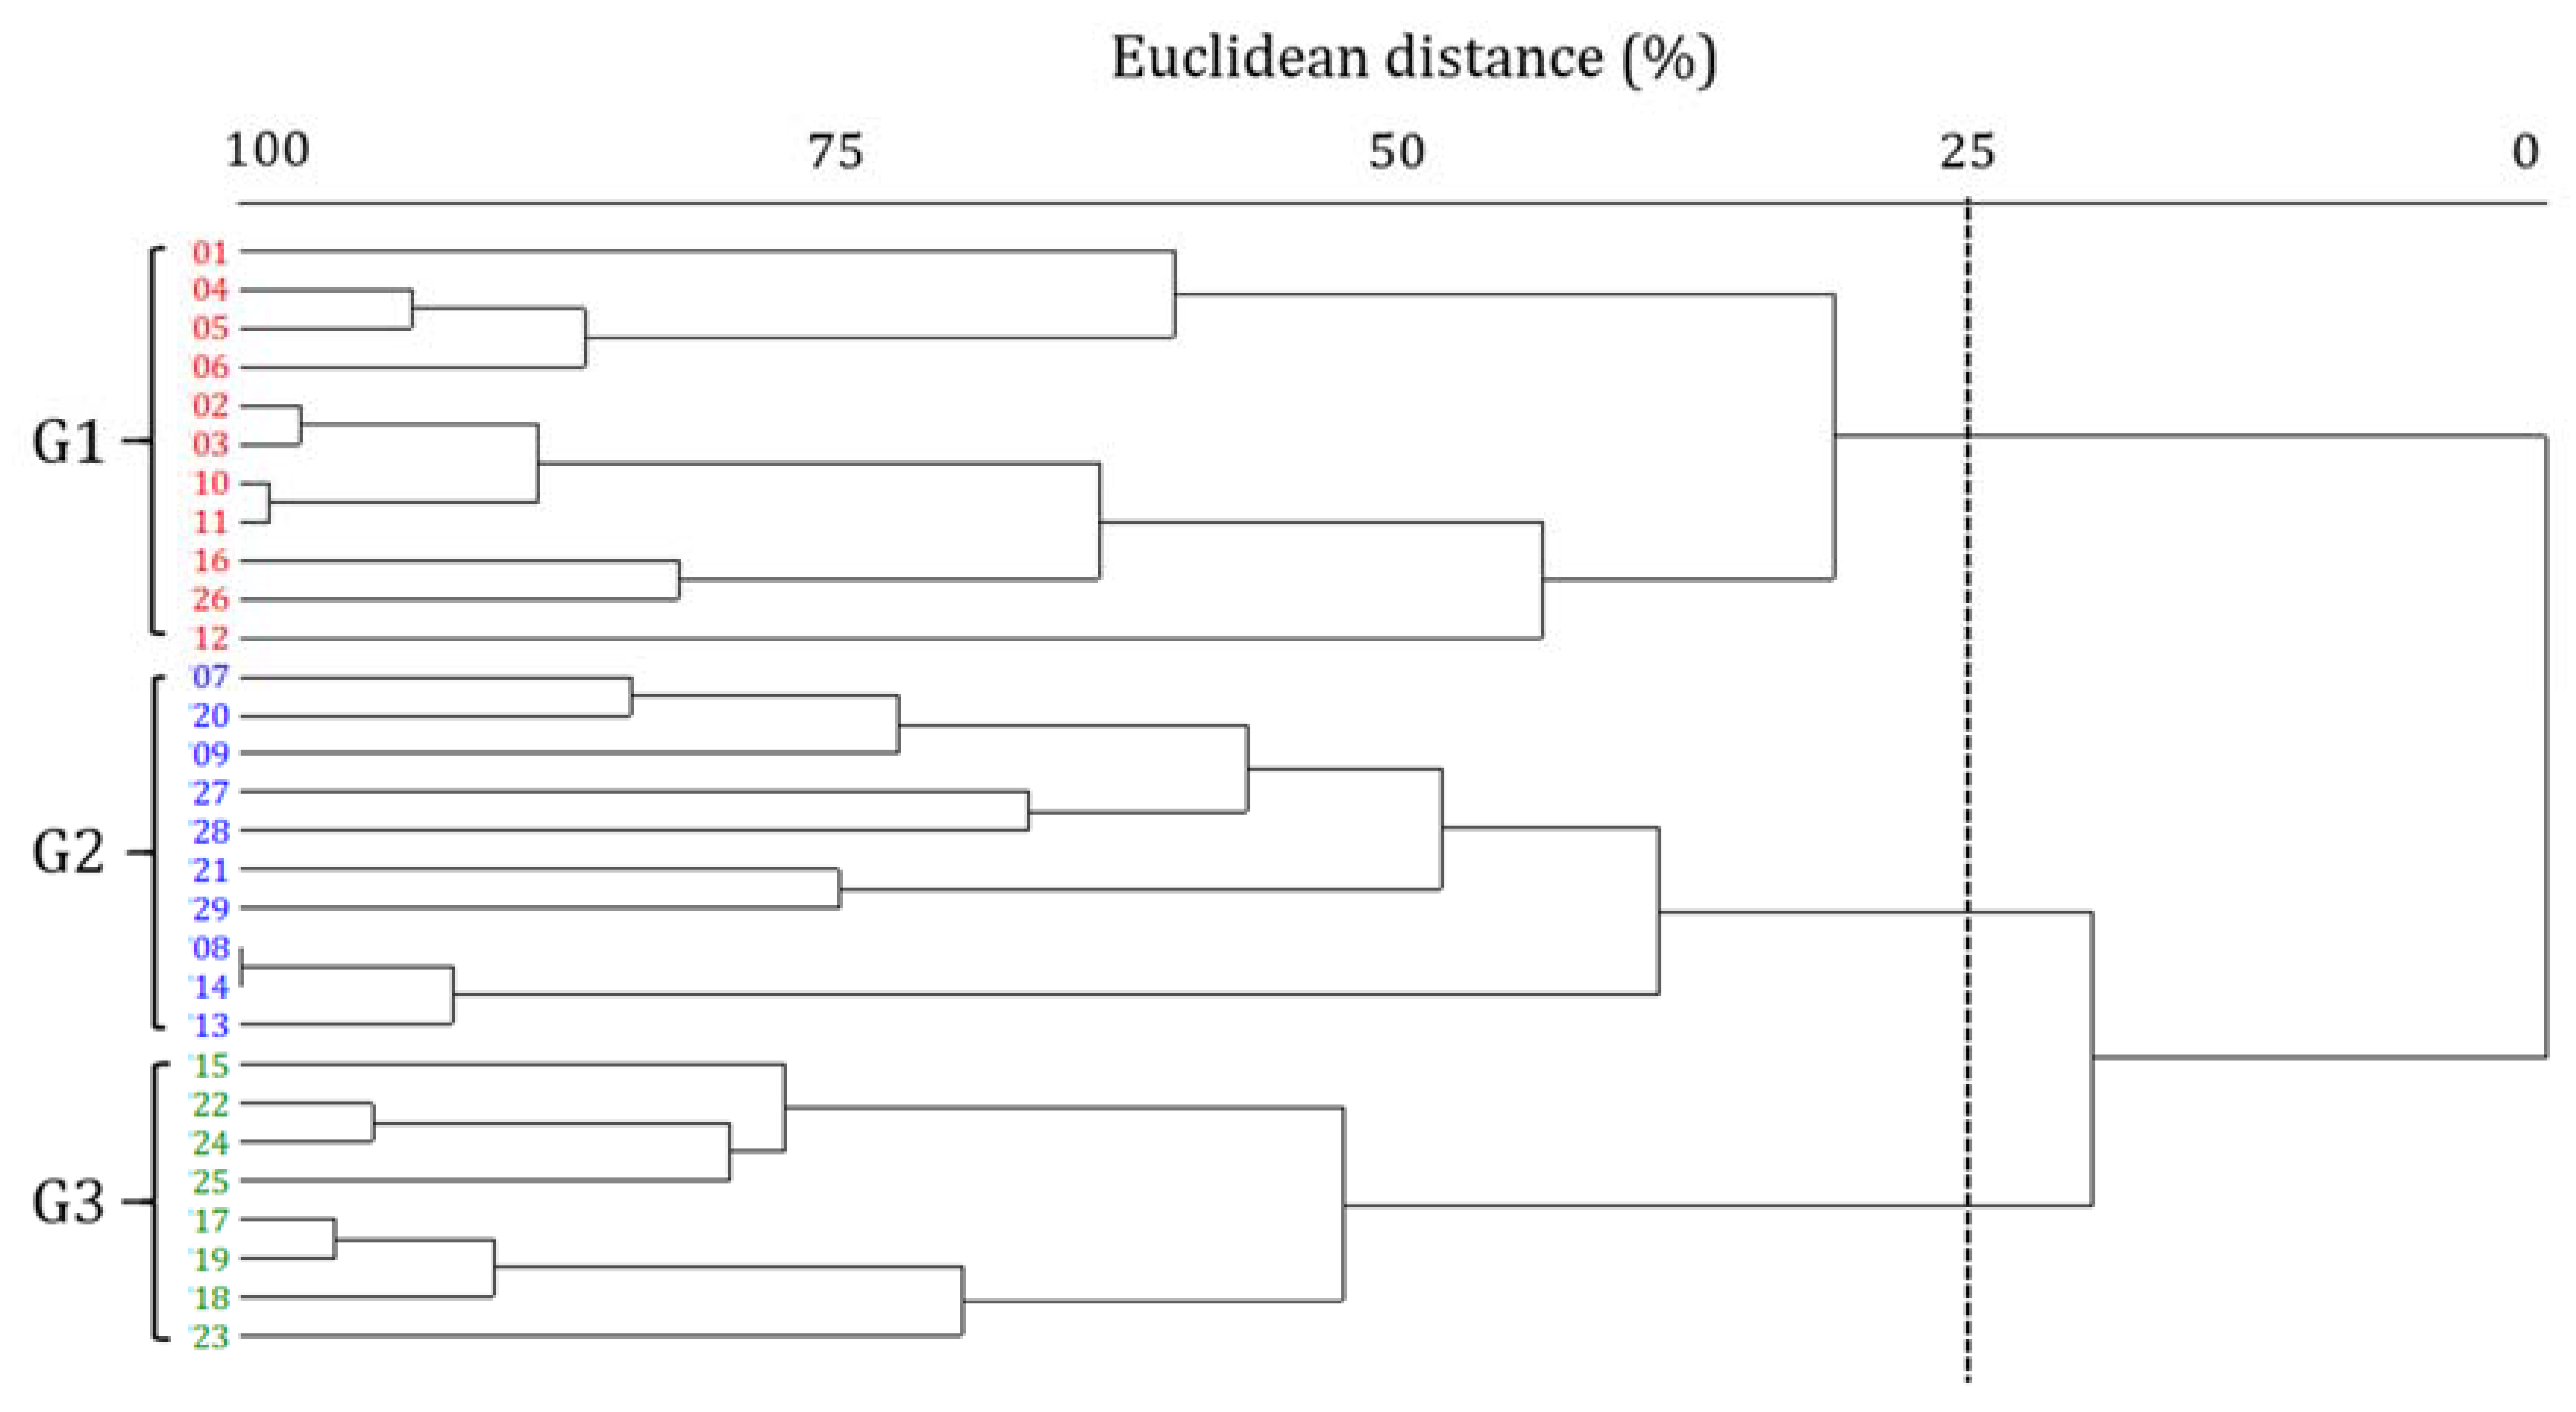
The results of cluster analysis were based on species or abundance showed the existence of three groups (G1–3) (Figure 3). G1 comprises 11 sampling sites predominantly located in the mainstream of the Hantangang River and the upstream tributaries; G2 comprises 10 sites predominately located in the mid- and downstream sections of the river; and G3 comprises eight sites and includes the Sincheon tributary, which enters the downstream region of the Hantangang River.
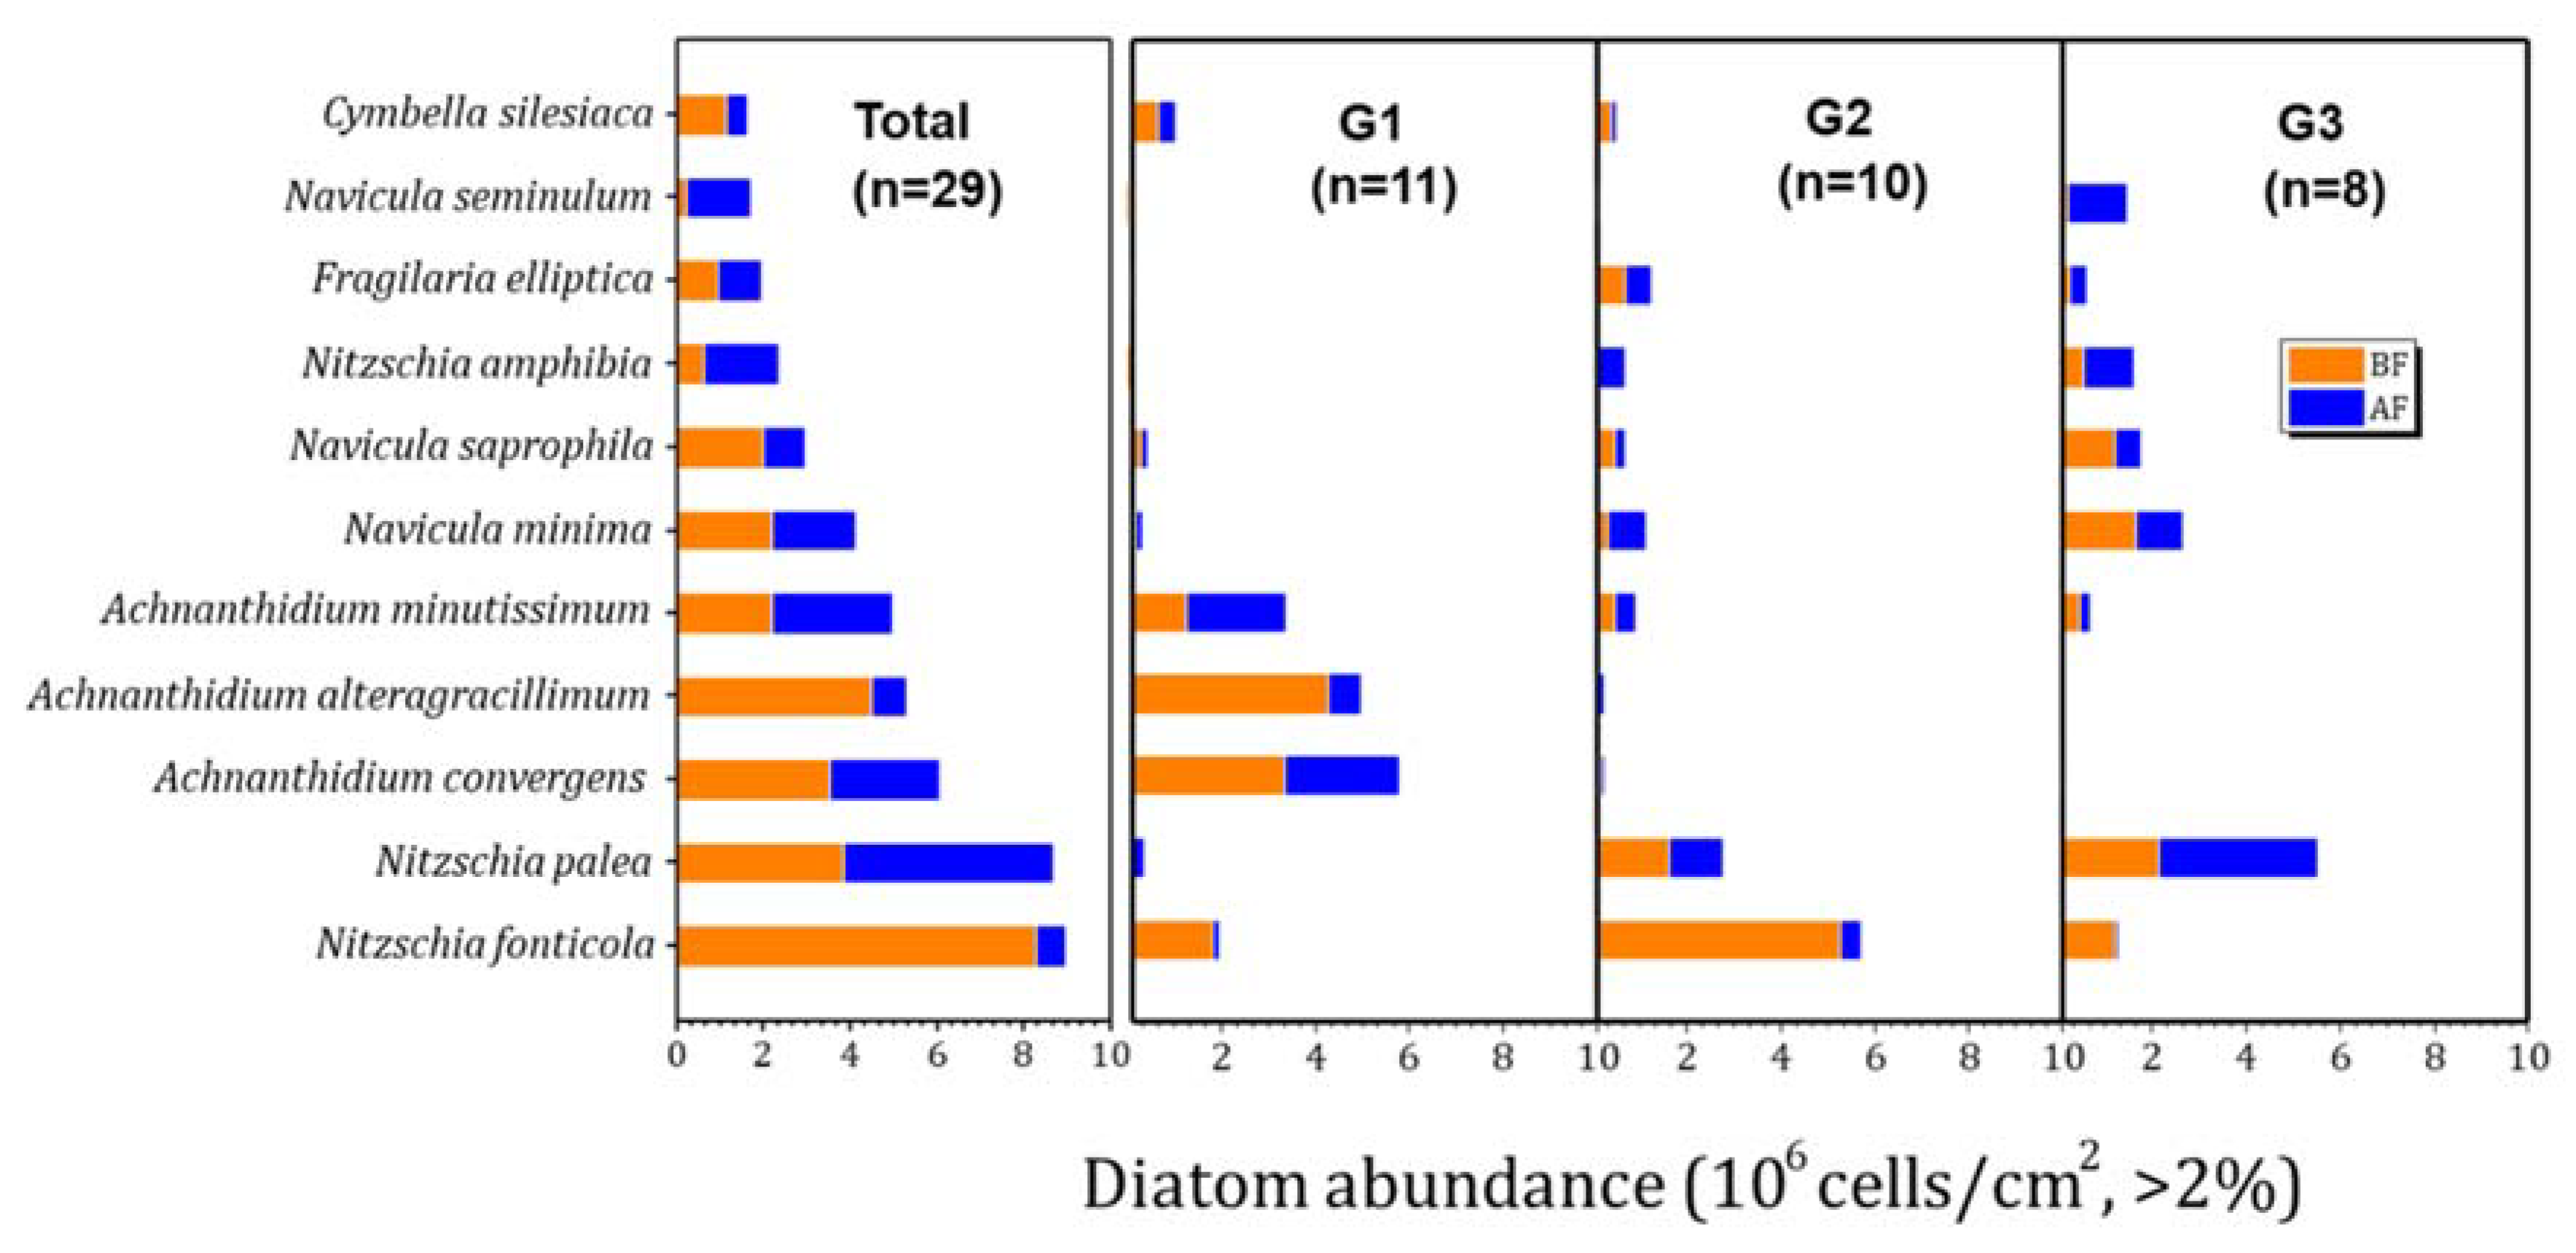
The community characteristics of the epilithic diatoms in this study are shown in Table 1 and Table 2 and Figure 4 and Figure 5. Abundance showed no difference between the groups, whereas the diversity, richness, and number of species were higher in G2. The dominant species in each group were Table 2: in G1, Achnanthidium alteragracillimum (26.7%–6.1%) in the pre-monsoon periods, and Achnanthidium minutissimum (27.3%–29.8%) dominated in the post-monsoon periods; in G2 and G3, Nitzschia fonticola (26.0%–43.2%) dominated in the pre-monsoon periods, and Nitzschia palea (14.0%–45.2%) in the post-monsoon periods. Both species showed similar trends in two groups.
In addition, the most abundant species in the Hantangang River were Nitzschia fonticola (before monsoon, BF: 8.3x10⁶cells/cm2, after monsoon, AF: 0.7 × 10⁶cells/cm2), Nitzschia palea (BF: 3.8 × 10⁶cells/cm2, AF: 4.9 × 10⁶cells/cm2), and Achnanthidium convergens (BF: 3.5 × 10⁶ cells/cm2, AF: 2.6 × 10⁶ cells/cm2) (Figure 4). Achnanthidium convergens and Achnanthidium alteragracillimum were most abundant in G1; Nitzschia fonticola and Nitzschia palea the largest in G2; and Nitzschia palea, and Navicula minima in G3. The species showing variability in abundance before and after rainfall were Achnanthidium alteragracillimum (G1), Nitzschia fonticola (G2), and Nitzschia palea (G3). The correlation analysis between the dominant species, environmental factors, and the precipitation during monsoon between each group is shown in Table 3. Ach. convergens and Ach. alteragracillimum of G1 and Nitzschia fonticola of G2 were positively correlated with nutrients such as NH4, NO3, TN, PO4 and TP. In contrast, Nitzschia palea—the most abundant species of G3—negatively correlated with the same nutrients (Table 3). Water temperature also showed a similar pattern to the nutrients. However, we could not understand the role of temperature on diatom communities during the monsoon.
3.2. Water Quality Parameters of the Hantangang River
The ANOVA results on water quality parameters showed differences among the three groups divided by the cluster analysis based on the distribution of epilithic diatoms (Table 1, Figure 5). Most of the water parameters including electrical conductivity, turbidity, BOD, and nutrients such as NH4, NO3, TN, PO4 and TP, showed the lowest values in G1, indicating the highest water quality among groups. Conversely, G3 showed the opposite trend, with the most turbid water of the three groups. G2 displayed an intermediate trend (Figure 5). G1 maintained the cleanest water quality throughout the entire study period, with small variability before and after monsoon. Although conductivity, BOD, and nitrogenous nutrients were similar between G1 and G2, turbidity and phosphorus nutrients showed obvious differences. Turbidity decreased after rainfall in all investigations, and phosphorus nutrients decreased after rainfall in all investigations, except in 2012. Conductivity and BOD showed the highest variation of all water quality parameters in G3: conductivity increased in 2013 during the highest rainfall of the study period, whereas BOD decreased after rainfall throughout the entire investigation period. Similarly, TP and PO4-P also decreased after rainfall.
3.3. Shift in Diatom Communities before and after monsoon
The variation in diatom community, such as number and abundance of species, dominance (DI), species diversity (H’), richness index (j) and evenness index (e) before and after monsoon rainfall, occurred throughout the study period (Figure 5).
The abundance of both G1 and G2 decreased after rainfall, whereas G3 showed no consistent trend. The richness index and number of species were highest in G2 in all investigations and consistently increased after rainfall. In contrast, G1 and G3 were not consistent. Indices of dominance and diversity in G2 and G3 indicated the obvious change of epilithic diatom community before and after monsoon rainfall, such as increases of species diversity, converse to dominant index. T-test results also supported the distinct changes of biological index as dominance and diversity after rainfall (P<0.01 for two, data not shown).
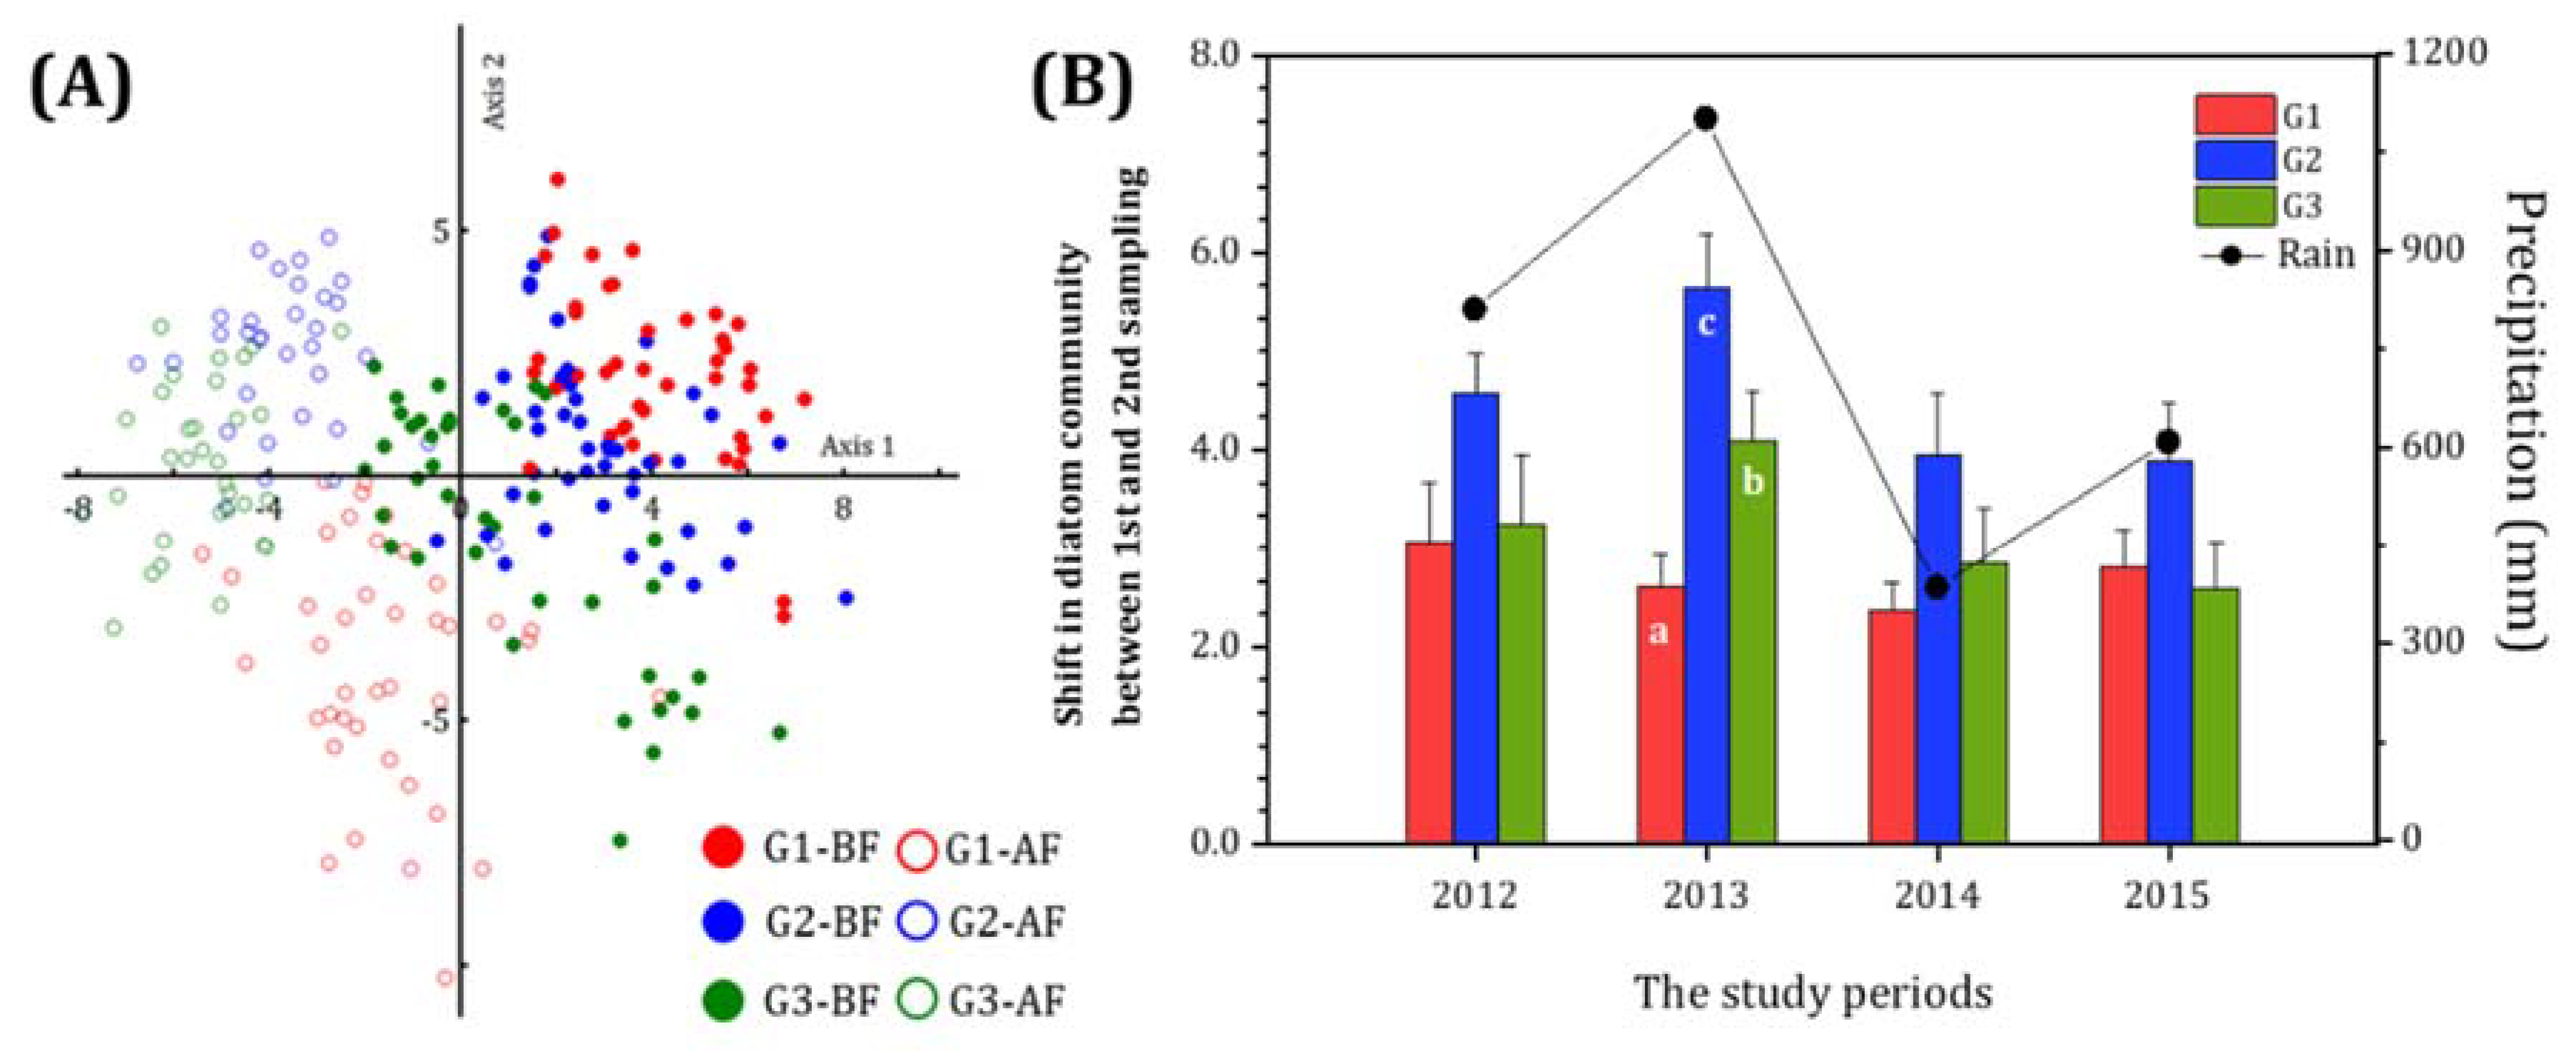
In the PCA ordination, all diatom communities clearly changed before and after monsoon rainfall from 2012–2015, regardless of sampling sites (Figure 6A). The eigenvalues of axis 1 and 2 were 14.1 and 8.4, respectively, and together, they explain 11.2% of the total variance (significance level of p < 0.001). In addition, the correlations between axis 1 and 2 with rainfall were −0.23 (p < 0.01) and −0.32 (p < 0.01). The positive and negative regions on axis 1 in the PCA ordination correspond to the before and after monsoon rainfall data, respectively. Meanwhile, the positive region on axis 2 is divided into the before rainfall G1 and G2 data and the after rainfall G2 and G3 data. The negative region on axis 2 is divided into the after rainfall G1 and before rainfall G2 data. These results of the PCA ordination therefore demonstrate clear differences between groups with different water quality.
The shift in diatom community or community dynamic index of epilithic diatom (CDI) of three groups before and after monsoon rainfall from 2012–2015 (Figure 6B) showed the highest values in G2, the mid-polluted river, indicating a relative higher fluctuation of diatom species, compared to the clean or polluted water. However, the group showed significant differences only in 2013, in response to the highest annual rainfall during the study period (p < 0.001).
There was a significant relationship between CDI and classical biological indices shown throughout all the study sites and periods (Table 4), except for the abundance. The number of species, diversity, richness and evenness indices were significantly correlated with CDI, and the dominant index was negatively correlated with CDI. These results indicate the potential of PCA-base CDI as a measure of community change of the ecosystem. However, this study is limited to a small river, so, more studies are needed to generalize the understanding of the shift of various communities with natural or artificial events.
4. Discussion
All water quality parameters (conductivity, turbidity, BOD, NH3-N, NO3-N, TN, PO4-P, and TP) showed higher concentrations in G3, which comprises the tributaries and the downstream region of the main river. Lower values were observed in G1 and G2, which comprises the upper and middle reaches of the main river. This pattern infers a complex downstream gradient [44], which may be caused by a number of factors, such as nutrient concentrations, soil usage, and flow velocity.
Environmental factors are the dominant controls on epilithic diatom communities [44], but spatial factors are also important. In our study, we identified high spatial variability in the epilithic diatom communities, according to stream order. Moreover, the dominant diatom species differed between each group in response to differences in water quality. The dominant species in G1 were Achnanthidium alteragracillimum and Ach. convergens, which are mainly clean-water species [45,46]. G2 and G3 had a mixed population of clean-water and turbid-water species, with a dominance of Nit. fonticola, Nitzschia palea, and Ach. minutissimum in G2, and a dominance of Nit. fonticola and Nit. palea in G3 [47,48,49]. As concluded by other studies around the world [50,51], these results suggest that water quality significantly affects the epilithic diatoms in the Hantangang River.
Rainfall directly influences the physicochemical characteristics of rivers—including nutrient concentrations. For example, increased riverine flood flow was found to be the dominant contributor toward increased suspended solid concentrations in rivers [52]. Moreover, previous studies [6,53,54] have demonstrated a significant increase in water quality indices (BOD, PO4-P, total suspended particulate matters, surfactants, and turbidity) after rainfall, which contradicts our study results. Ion and nutrient concentrations in rivers are greatly affected by flow rate, and studies have inferred elevated water pollution in response to concentrated rainfall [55,56,57,58]. In contrast, we observed improved water quality in the Hantangang River during the post-monsoon periods, in both G2 and G3. The previous studies analyzed water quality immediately after rainfall, whereas water quality was analyzed at least two weeks after rainfall in our study. The contrasting results could therefore be due to differences in the timing of the water quality measurements.
In this study, the cellular abundance of typical of oligotrophic waters diatom species, Ach. alteragracillimum and Nit. fonticola, decreased after rainfall, despite improved water quality. On the other hand, Nit. palea as dominant species in the polluted water increased in abundance after monsoon rainfall (Table 2, Figure 4). This may suggest that the rainfall can strongly influence the most abundant diatom species following the stream condition with different water quality. Other studies showed that diatoms are pioneer species that attach to substrates immediately after the occurrence of floods that wash out most of the substrates. The monsoonal climate of South Korea likely influences the appearance of the common pioneer species Ach. minutissimum [59]. Our results are consistent with the study, but do not explain the abrupt decrease of Ach. altergracillima after rainfall. In addition, not all pennate diatoms increased after rainfall, and thus, further studies should investigate the introduction of pioneer species on substrates immediately following severe environmental disturbance like rainfall. The community dynamic index of epilithic diatom (CDI), showed a positive or negative significant relation to biological indices. Thus, we believe that the CDI methods would be the simplest tool to numerically measure the shift of various biotic communities in aquatic and terrestrial ecosystems. Although it is difficult to define the threshold or limit of the CDI values due to the various event by response interactions according to the biotic community, they may be useful to compare the relative impact magnitude with another community.
This study also showed that the community change of epilithic diatoms was not consistent with water quality before and after monsoon rainfall. Previously, the polluted sites highly improved water quality after rainfall, while the biotic community or CDI of the mid-polluted water became worse. It may suggest that communities that are in a better condition, with a higher diversity of species, are better able to cope with extreme disturbances such as that caused by monsoons, while impoverished communities are less resistant or resilient to those changes, as suggested by Feio et al. [60] Poorer communities are less affected because they are already composed only of very resistant taxa.
5. Conclusions
We examined the influence of rainfall before and after monsoon rainfall on epilithic diatom communities and water quality parameters at the Hantangang River, South Korea, from 2012–2015. Water quality in the polluted sites had improved following rainfall, but the abundance of dominant species was not directly associated to their sensitivity; Nitzschia fonticola decreased in all sampling sites, and Nitzschia palea in the clean sites and Achnanthidium minutissimum in the polluted sites increased after rainfall, respectively. Based on the principal component analysis (PCA), the community dynamic index of epilithic diatom (CDI) indicates that the shift of diatom community in the mid-polluted sites in 2013—the year of highest rainfall, was the most obvious among groups. These study results indicate that the monsoon rainfall strongly influences water quality and diatom communities. Thus, further studies are needed to generalize the effects of monsoon rainfall on water quality and epilithic diatom communities, which should include more rivers with different environmental characteristics, and data on rainfalls with different magnitudes, and exposure periods.
Author Contributions
Conceptualization, B.-H.K. and Y.-J.K.; methodology, I.-H.C. and M.-H.L.; validation, B.-H.K., Y.-J.K., H.L. and I.-H.C.; formal analysis, I.-H.C. and H.-K.K.; investigation, I.-H.C. and M.-H.L.; data curation, I.-H.C.; writing—original draft preparation, B.-H.K., Y.-J.K., H.L. and I.-H.C.; writing—review and editing, B.-H.K., H.L. and I.-H.C. All authors have read and agreed to the published version of the manuscript.
Funding
This research was originally supported by the Environmental Basic Research Program, Han-river watershed management committee in Korea (Grant No. NIER-2019-01-01-031).
Acknowledgments
The authors would like to thank all the survey members involved in the project for their help in the sampling and analyses. The authors also thank the reviewers for their help in improving the scientific quality of the manuscript. We would like to thank Editage (www.editage.co.kr) for English language editing.
Conflicts of Interest
The authors declare no conflict of interest.
References
- Kim, C.H.; Jhun, J.G. Numerical simulations of the three-dimensional land and sea breezes under synoptic flows over South Korea. APJAS 1992, 28, 165–181. [Google Scholar]
- Yun, W.T.; Park, C.K.; Lee, J.W.; Lee, H.S.; Min, S.K. Analysis of the Korean Heavy Rainfall Features in Summer 1998. J. Korean Meteorol. Soc. 2001, 37, 181–194. [Google Scholar]
- Vincent, C.E.; Davies, T.D.; Beresford, A.K.C. Recent changes in the level of Lake Naivasha, Kenya, as an indicator of equatorial westerlies over East Africa. Clim. Chang. 1979, 2, 175–189. [Google Scholar] [CrossRef]
- Johnson, G.; Harper, D.M.; Mavuti, K. Information for the Sustainable Management of Shallow Lakes: Lake Naivasha, Kenya; The Sustainable Management of Tropical Catchments; Wiley: Chichester, UK, 1998. [Google Scholar]
- Harper, D.M. Primary production in Lake Naivasha, Kenya. Int. Ver. Theor. Angew. Limnol. 1991, 24, 1112–1116. [Google Scholar] [CrossRef]
- Mallin, M.A.; Johnson, V.L.; Ensign, S.H. Comparative impacts of stormwater runoff on water quality of an urban, a suburban, and a rural stream. Environ. Monit. Assess. 2009, 159, 475–491. [Google Scholar] [CrossRef] [PubMed]
- Jeong, K.S.; Kim, D.K.; Joo, G.J. Delayed influence of dam storage and discharge on the determination of seasonal proliferations of Microcystis aeruginosa and Stephanodiscus hantzschii in a regulated river system of the lower Nakdong River (South Korea). Water Res. 2007, 41, 1269–1279. [Google Scholar] [CrossRef]
- Liu, D.Y.; Sun, J.; Zou, J.Z.; Zhang, J. Phytoplankton succession during a red tide of Skeletonema costatum in Jiaozhou Bay of China. Mar. Pollut. Bull. 2005, 50, 91–94. [Google Scholar] [CrossRef]
- Jose, E.C.; Furio, E.F.; Borja, V.M.; Gatdula, N.C.; Santos, M.D. Zooplankton Composition and Abundance and its Relationship with Physico-Chemical Parameters in Manila Bay. Oceanography 2015, 3, 136. [Google Scholar] [CrossRef]
- Zhou, G.; Zhao, X.; Bi, Y.; Hu, Z. Effects of rainfall on spring phytoplankton community structure in Xiangxi Bay of the Three-Gorges Reservoir, China. Fresen. Environ. Bull. 2012, 21, 3533–3541. [Google Scholar]
- Lu, M.; Xie, P. Impacts of filter-feeding fishes on the long-term changes of crustacean zooplankton in a eutrophic subtropical Chinese lake. J. Freshw. Ecol. 2001, 16, 219–228. [Google Scholar] [CrossRef] [Green Version]
- Pinto-Coelho, R.; Pinel-Alloul, B.; Méthot, G.; Havens, K.E. Crustacean zooplankton in lakes and reservoirs of temperate and tropical regions: Variation with trophic status. Can. J. Fish. Aquat. Sci. 2005, 62, 348–361. [Google Scholar] [CrossRef] [Green Version]
- Da Silva Abes, S.; Agostinho, A.A. Spatial patterns in fish distributions and structure of the ichthyocenosis in the Água Nanci stream, upper Paraná River basin, Brazil. Hydrobiologia 2001, 445, 217–227. [Google Scholar] [CrossRef]
- Lacoul, P.; Freedman, B. Environmental influences on aquatic plants in freshwater ecosystems. Environ. Rev. 2006, 14, 89–136. [Google Scholar] [CrossRef]
- Staley, J.T.; Hodgson, C.J.; Mortimer, S.R.; Morecroft, M.D.; Masters, G.J.; Brown, V.K.; Taylor, M.E. Effects of summer rainfall manipulations on the abundance and vertical distribution of herbivorous soil macro-invertebrates. Eur. J. Soil Biol. 2007, 43, 189–198. [Google Scholar] [CrossRef]
- Beche, L.A.; Mcelravy, E.P.; Resh, V.H. Long-term seasonal variation in the biological traits of benthic-macroinvertebrates in two Mediterranean-climate streams in California, USA. Freshw. Biol. 2006, 51, 56–75. [Google Scholar] [CrossRef]
- Leland, H.V.; Porter, S.D. Distribution of benthic algae in the upper Illinois River basin in relation to geology and land use. Freshw. Biol. 2000, 44, 279–301. [Google Scholar] [CrossRef]
- Cushing, C.E.; Allan, J.D. Streams: Their Ecology and Life; Academic Press: San Diego, CA, USA, 2001. [Google Scholar]
- Khatoon, H.; Yusoff, F.; Banerjee, S.; Shariff, M.; Bujang, J.S. Formation of periphyton biofilm and subsequent biofouling on different substrates in nutrient enriched brackish water shrimp ponds. Aquaculture 2007, 273, 470–477. [Google Scholar] [CrossRef]
- Hill, W.R. Factors Affecting Benthic Algae—Effects of Light. Algal Ecology: Freshwater Benthic Ecosystem; Stevenson, R.J., Bothwell, M.L., Lowe, R.L., Eds.; Academic Press: San Diego, CA, USA, 1996. [Google Scholar]
- Kim, H.K.; Kim, Y.J.; Won, D.H.; Hwang, S.J.; Hwang, S.O.; Kim, B.H. Spatial and Temporal Distribution of Epilithic Diatom Communities in Major Harbors of Korean peninsula. J. Korean Soc. Wat. Environ. 2013, 29, 598–609. [Google Scholar]
- Cho, I.H.; Kim, H.K.; Choi, M.Y.; Kwon, Y.S.; Hwang, S.J.; Kim, S.H.; Kim, B.H. Distribution and Species Prediction of Epilithic Diatom in the Geum River Basin. Korean J. Limnol. 2015, 48, 153–167. [Google Scholar]
- Kim, Y.J. Temporal and Spatial Dynamics of an Epilithic Algal Community in the Hantan River. Algae 2004, 19, 15–22. [Google Scholar]
- Lau, K.M.; Li, M.T. The monsoon of East Asia and its global associations—A survey. Am. Meteorol. Soc. 1984, 65, 114–125. [Google Scholar] [CrossRef]
- Chung, H.S.; Chung, Y.A.; Kim, C.M.; Ryu, C.S. The Characteristics of Heavy Rainfall over the Korean Peninsula Case Studies of Heavy Rainfall Events during the On-and Off-Changma Season. J. Environ. Sci. 2012, 21, 1511–1521. [Google Scholar]
- Ha, K.J.; Yun, K.S.; Jhun, J.G.; Park, C.K. Definition of onset/retreat and intensity of changma during the boreal Summer monsoon season. J. Korean Meteorol. Soc. 2005, 41, 927–942. [Google Scholar]
- Byun, J.H.; Cho, I.H.; Hwang, S.J.; Park, M.H.; Byeon, M.S.; Kim, B.H. Relationship between a Dense Bloom of Cyanobacterium Anabaena spp. and Rainfalls in the North Han River System of South Korea. Korean J. Environ. Ecol. 2014, 47, 116–126. [Google Scholar] [CrossRef]
- APHA. Standard Methods for the Examination of Water and Waste Water; American Public Health Association: New York, NY, USA, 2001. [Google Scholar]
- MOE (Ministry of Environment, South Korea). The Survey and Evaluation of Aquatic Ecosystem Health in Korea; National Institute of Environmental Research (NIER): Incheon, Korea, 2015.
- Hendey, N.I. The permanganate method for cleaning freshly gathered diatoms. Microscopy 1974, 32, 423–426. [Google Scholar]
- McNaughton, S.J. Relationships among functional properties of Californian grassland. Nature 1967, 216, 168–169. [Google Scholar] [CrossRef]
- Shannon, C.E.; Weaver, W. A mathematical theory of communication. Bell Syst. Tech. J. 1948, 318, 379–423. [Google Scholar]
- Margalef, R. Information theory in ecology, General Systems. Int. J. Gen. Syst. 1958, 32, 36–71. [Google Scholar]
- Pielou, E.C. Ecological Diversity; Wiley: New York, NY, USA, 1975. [Google Scholar]
- Hallett, L.M.; Hsu, J.S.; Cleland, E.E.; Collins, S.L. Biotic mechanisms of community stability shift along a precipitation gradient. Ecology 2014, 95, 1693–1700. [Google Scholar] [CrossRef] [Green Version]
- Pearson, K. On lines and planes of closest fit to systems of points in space. Lond. Edinb. Dubl. Philos. Mag. 1901, 2, 559–572. [Google Scholar] [CrossRef] [Green Version]
- Kruskal, J.B. Nonmetric multidimensional scaling: A numerical method. Psychometrika 1964, 29, 115–129. [Google Scholar] [CrossRef]
- Gower, J.C. Some distance properties of latent root and vector methods used in multivariate analysis. Biometrika 1966, 53, 322–338. [Google Scholar] [CrossRef]
- Hill, M.O.; Gauch, H.G., Jr. Detrended correspondence analysis: An improved ordination technique. Vegetation 1980, 42, 42–58. [Google Scholar] [CrossRef]
- Hill, M.O. Correspondence analysis: A neglected multivariate method. J. R. Stat. Soc. C Appl. 1974, 23, 340–354. [Google Scholar] [CrossRef]
- Van Den Wollenberg, A.L. Redundancy analysis an alternative for canonical correlation analysis. Psychometrika 1977, 42, 207–219. [Google Scholar] [CrossRef]
- Ter Braak, C.J.F. Canonical Correspondence Analysis: A New Eigenvector Technique for Multivariate Direct Gradient Analysis. Ecology 1986, 67, 1167–1179. [Google Scholar] [CrossRef] [Green Version]
- Ko, H.S.; Jhun, M.S.; Jeong, H.C. A Comparion Study for Ordination Methods in Ecology. Korean J. Appl. Stat. 2015, 28, 49–60. [Google Scholar] [CrossRef] [Green Version]
- Potapova, M.G.; Charles, D.F. Benthic diatoms in USA rivers: Distributions along spatial and environmental gradients. J. Biogeogr. 2002, 29, 167–187. [Google Scholar] [CrossRef]
- Lange-Bertalot, H. 85 Neue Taxa und über 100 weitre neudefinierte taxa ergänzend zur Süβwasserflora von Mitteleuropa vol. 2/1-4. Biblioth. Diatomol. 1993, 27, 1–454. [Google Scholar]
- Watanabe, T. Picture Book and Ecology of the Freshwater Diatoms; Uchida Rokakuho publishing Co: Tokyo, Japan, 2005. [Google Scholar]
- Krammer, K.; Lange-Bertalot, H. Süsswasserflora von Mitteleuropa, Band 2/1: Bacillariophyceae. 2. Teil. Bacillariaceae, Epithemiaceae, Surirellaceae; Ettl, H., Gerloff, J., Heynig, H., Mollenhauer, D., Eds.; Gustav Verlag, Stuttgart: New York, NY, USA, 1988. [Google Scholar]
- Taylor, J.C.; Harding, W.R.; Archibald, C.G.M. An Illustrated Guide to Some Common Diatom Species from South Africa. Water Research Commission; WRC Report TT 282/07; RSA: Pretoria, South Africa, 2007. [Google Scholar]
- Kützing, F.T. Synopsis Diatomacearum oder Versuch einer systematischen Zusammentellung der Diatomeen. Linnaea 1833, 8, 529–620. [Google Scholar]
- Zhang, J.; Shu, X.; Zhang, Y.; Tan, X.; Zhang, Q. The responses of epilithic algal community structure and function to light and nutrients and their linkages in subtropical rivers. Hydrobiologia 2020, 847, 841–855. [Google Scholar] [CrossRef]
- Tan, X.; Zhang, Q.; Burford, M.A.; Sheldon, F.; Bunn, S.E. Benthic Diatom Based Indices for Water Quality Assessment in Two Subtropical Streams. Front. Microbiol. 2017, 8, 601. [Google Scholar] [CrossRef] [Green Version]
- Meybeck, M.; Friedrich, G.; Thomas, R.; Chapman, D. Rivers; Water Quality Assessments. A Guide to the use of Biota, Sediments and Water in Environmental Monitoring; Chapman, D., Ed.; Chapman and Hall: Cambridge, UK, 1992. [Google Scholar]
- Prathumratana, L.; Sthiannopkao, S.; Kim, K.W. The relationship of climatic and hydrological parameters to surface water quality in the lower Mekong River. Environ. Int. 2008, 34, 860–866. [Google Scholar] [CrossRef] [PubMed]
- Coulliette, A.D.; Noble, R.T. Impacts of rainfall on the water quality of the Newport River Estuary (Eastern North Carolina, USA). J. Water. Health 2008, 6, 473–482. [Google Scholar] [CrossRef] [PubMed]
- Miller, W.R.; Drever, J.I. Water chemistry of a stream following a storm, Absaroka Mountains, Wyoming. Geol. Soc. Am. Bull. 1977, 88, 286–290. [Google Scholar] [CrossRef]
- Cornish, P.M. The Variations of Dissolved Ion Concentration with Discharge in Some New South Wales Streams; The First National Symposium on Forest Hydrology: Melbourne, Australia, 1982.
- Muraoka, K.; Hirata, T. Streamwater chemistry during rainfall events in a forested basin. J. Hydrol. 1988, 102, 235–253. [Google Scholar] [CrossRef]
- Jénkins, A. Storm period hydrochemical response in an unforested Scottish catchment. Hydrol. Sci. J. 1989, 34, 393–404. [Google Scholar] [CrossRef] [Green Version]
- Hwang, S.J.; Kim, N.Y.; Yoon, S.A.; Kim, B.H.; Park, M.H.; You, K.A.; Lee, H.Y.; Kim, H.S.; Kim, Y.J.; Lee, J.; et al. Distribution of benthic diatoms in Korean rivers and streams in relation to environmental variables. Ann. Limnol. Int. J. Lim. 2011, 47, S15–S33. [Google Scholar] [CrossRef] [Green Version]
- Feio, M.J.; Dolédec, S.; Graça, M.A.S. Human disturbance affects the long-term spatial synchrony of freshwater invertebrate communities. Environ. Pollut. 2015, 196, 300–308. [Google Scholar] [CrossRef]
Figure 1.
Map of the sampling sites in the Hantangang River in South Korea for epilithic diatom and water analysis. Sampling has been conducted twice a year between 2012 and 2015. Color circles indicate the sampling sites of three groups, such as G1 (red), G2 (blue) and G3 (green). Groups were divided by a cluster analysis (see Results section).

Figure 2.
Daily precipitation in the Hantangang River basin between 2012 and 2015, measured by a Korea Weather Center (http://www.kma.go.kr/index.jsp). The arrows are the sampling dates before (red) and after the monsoon (blue), respectively. A small table in the figure showed the total precipitation for the periods of before (PBM) and after monsoon (PAM); In 2012, PBM or the former indicate the sum of daily precipitation from 10 September to 3 May, while PAM or the latter are those from 4 May to 6 September of 2012, respectively.

Figure 3.
Dendrogram of on the epilithic diatom communities of 29 sampling sites of the Hantangang River, Korea, from 2012–2015.
Figure 3.
Dendrogram of on the epilithic diatom communities of 29 sampling sites of the Hantangang River, Korea, from 2012–2015.

Figure 4.
Total abundances of most abundant epilithic diatom species in each group (G1–3) in the Hantangang River before (BF) and after monsoon (AF) from 2012 to 2015. BF: before monsoon, AF: after monsoon.
Figure 4.
Total abundances of most abundant epilithic diatom species in each group (G1–3) in the Hantangang River before (BF) and after monsoon (AF) from 2012 to 2015. BF: before monsoon, AF: after monsoon.

Figure 5.
The temporal variability of the biological and physicochemical variables of each group (G1–3) in the Hantangang River, from 2012 to 2015. WT: water temperature (°C), DO: dissolve oxygen (mg/L), EC: electronic conductivity (µS/Cm), Turb: Turbidity (NTU), BOD: biochemical oxygen demand (mg/L), TN: total nitrogen (mg/L), TP: total phosphorus (mg/L), NH3-N, NO3-N, PO4-P: mg/L, NS: number of species, BF: before monsoon, AF: after monsoon. DI; Dominance index, H’; Diversity index, j; Richness index, e; Evenness index, 12-BF and 12-AF: the measurements before and after monsoon in 2012, respectively.

Figure 6.
Epilithic diatom community characteristics before and after monsoon in the Hantangang River from 2012 to 2015, including (A) the PCA ordination and (B) the CDI or average of distances of each group between the before (1-BF) and after monsoon (2-AF) period. Black circle is total annual precipitation during the monsoon period every year. Example, G1-BF and G1-AF: the sampling sites of group 1(G1) before (red-closed circle) and after monsoon (red-open circle), respectively.


Table 1.
Physicochemical and biological variables of the epilithic diatom communities (G1–3) in the Hantangang River, from 2012 to 2015.
Table 1.
Physicochemical and biological variables of the epilithic diatom communities (G1–3) in the Hantangang River, from 2012 to 2015.
| Variables | G1 | G2 | G3 | F | p |
|---|---|---|---|---|---|
| WT | 18.8 ± 3.0a | 22.7 ± 3.0b | 24.9 ± 2.8c | 83.457 | <0.001 |
| DO | 8.7 ± 1.0 | 9.3 ± 1.5 | 9.2 ± 2.6 | 2.829 | 0.061 |
| pH | 7.3 ± 0.5a | 7.9 ± 0.6c | 7.7 ± 0.5b | 26.001 | <0.001 |
| EC | 97 ± 59a | 171 ± 119a | 728 ± 564b | 89.128 | <0.001 |
| Turb | 8.5 ± 6.4a | 18.6 ± 9b | 26.7 ± 12.4c | 73.017 | <0.001 |
| BOD | 0.8 ± 0.4a | 1.7 ± 0.9a | 7.3 ± 5.4b | 103.037 | <0.001 |
| NH3-N | 0.21 ± 0.24a | 0.59 ± 0.67a | 2.84 ± 2.78b | 61.559 | <0.001 |
| NO3-N | 1.24 ± 0.54a | 1.75 ± 0.64b | 1.84 ± 1.02b | 15.715 | <0.001 |
| TN | 2.37 ± 0.88a | 3.30 ± 1.23b | 6.28 ± 3.22c | 80.512 | <0.001 |
| PO4-P | 0.02 ± 0.02a | 0.07 ± 0.07b | 0.16 ± 0.15c | 41.414 | <0.001 |
| TP | 0.04 ± 0.04a | 0.11 ± 0.11b | 0.25 ± 0.25c | 41.944 | <0.001 |
| Biomass | 29.3 ± 32.7 | 27.2 ± 27.0 | 31.8 ± 29.4 | 0.412 | 0.663 |
| No. species | 28.5 ± 7.9b | 37.7 ± 9.2c | 23.2 ± 6.5a | 61.606 | <0.001 |
| Dominance (DI) | 0.55 ± 0.16a | 0.50 ± 0.16a | 0.63 ± 0.16b | 12.076 | <0.001 |
| Diversity (H’) | 3.06 ± 0.73b | 3.42 ± 0.79c | 2.64 ± 0.74a | 19.424 | <0.001 |
| Richness (j) | 2.29 ± 0.70b | 3.06 ± 0.87c | 1.80 ± 0.54a | 55.323 | <0.001 |
| Evenness (e) | 0.64 ± 0.11b | 0.66 ± 0.12b | 0.59 ± 0.13a | 6.233 | 0.002 |
Superscripts a, b, and c are Tukey’s post hoc test after the Bonferroni test. WT: water temperature (°C), DO: dissolve oxygen (mg/L), EC: electronic conductivity (µS/Cm) Turb.: Turbidity (NTU), BOD: biochemical oxygen demand (mg/L), TN: total nitrogen (mg/L) TP: total phosphorus (mg/L), NH3-N, NO3-N, PO4-P: mg/L, Biomass (104 cells/cm2).
Table 2.
The dominant species and their relative abundances (%) in each diatom community (G1–3), before (1st) and after (2nd) the monsoon in the Hantangang River from 2012 to 2015.
Table 2.
The dominant species and their relative abundances (%) in each diatom community (G1–3), before (1st) and after (2nd) the monsoon in the Hantangang River from 2012 to 2015.
| Years | G1 | G2 | G3 | |
|---|---|---|---|---|
| 2012 | BF | Achnanthidium alteragracillimum (36.1) | Nitzschia fonticola (43.2) | Nitzschia palea (19.1) |
| AF | Achnanthidium convergens (22.5) | Nitzschia palea (14.0) | Nitzschia palea (27.6) | |
| 2013 | BF | Achnanthidium convergens (38.5) | Nitzschia fonticola (26.0) | Nitzschia fonticola (27.6) |
| AF | Achnanthidium convergens (43.3) | Achnanthidium minutissimum (16.1) | Nitzschia palea (45.2) | |
| 2014 | BF | Achnanthidium convergens (30.8) | Nitzschia palea (54.4) | Nitzschia palea (22.4) |
| AF | Achnanthidium minutissimum (29.8) | Nitzschia palea (20.2) | Nitzschia palea (26.8) | |
| 2015 | BF | Achnanthidium alteragracillimum (26.7) | Nitzschia fonticola (31.2) | Nitzschia fonticola (31.5) |
| AF | Achnanthidium minutissimum (27.3) | Fragilaria elliptica (20.0) | Nitzschia palea (26.3) |
BF: before monsoon, AF: after monsoon.
Table 3.
The correlation coefficients between the dominant diatom species (DS) and water quality parameters before and after the monsoon in the Hantangang River, from 2012 to 2015.
Table 3.
The correlation coefficients between the dominant diatom species (DS) and water quality parameters before and after the monsoon in the Hantangang River, from 2012 to 2015.
| DS | Rain | WT | DO | pH | EC | Turb. | BOD | NH3-N | NO3-N | TN | PO4-P | TP | Group |
|---|---|---|---|---|---|---|---|---|---|---|---|---|---|
| ACCN | - | −0.55** | - | −0.25** | −0.59** | −0.37** | −0.60** | −0.58** | −0.36** | −0.63** | −0.48** | −0.48** | G1 |
| ACAL | - | −0.36** | - | −0.13* | −0.41** | −0.32** | −0.51** | −0.55** | −0.30** | −0.55** | −0.44** | −0.45** | G1 |
| ACMI | - | −0.34** | - | −0.24** | −0.53** | −0.33** | −0.49** | −0.54** | −0.25** | −0.55** | −0.36** | −0.38** | G1 |
| NIFO | −0.29** | −0.22** | 0.15* | - | −0.16* | - | −0.21** | −0.32** | 0.19** | −0.18** | −0.19** | −0.17** | G2 |
| NIPA | 0.23** | 0.49** | - | 0.23** | 0.49** | 0.39** | 0.45** | 0.41** | 0.31** | 0.42** | 0.29** | 0.29** | G3 |
| NAMI | - | 0.23** | - | - | 0.32** | 0.21** | 0.29** | 0.25** | 0.25** | 0.26** | 0.21** | 0.23** | G3 |
* p < 0.05, ** p < 0.01. ACCN: Achnanthidium convergens, ACAL: Achnanthidium alteragracillimum, ACMI: Achnanthidium minutissimum, NIFO: Nitzschia fonticola, NIPA: Nitzschia palea, NAMI: Navicula minima. WT: water temperature (°C), DO: dissolve oxygen (mg/L), EC: electronic conductivity (µS/Cm), Turb.: Turbidity (NTU), BOD: biochemical oxygen demand (mg/L),TN: total nitrogen (mg/L), TP: total phosphorus (mg/L), NH3-N, NO3-N, PO4-P: mg/L.
Table 4.
The correlation coefficients between the community dynamic index of epilithic diatom (CDI) and biological indices in the Hantangang River from 2012 to 2015. ** p < 0.01.
Table 4.
The correlation coefficients between the community dynamic index of epilithic diatom (CDI) and biological indices in the Hantangang River from 2012 to 2015. ** p < 0.01.
| Biological Indices | CDI |
|---|---|
| Abundance | −0.03 |
| No. of species | 0.44 ** |
| Dominant index | −0.31 ** |
| Diversity index | 0.35 ** |
| Richness index | 0.41 ** |
| Evenness index | 0.28 ** |
© 2020 by the authors. Licensee MDPI, Basel, Switzerland. This article is an open access article distributed under the terms and conditions of the Creative Commons Attribution (CC BY) license (http://creativecommons.org/licenses/by/4.0/).
Share and Cite
MDPI and ACS Style
Cho, I.-H.; Kim, H.-K.; Lee, M.-H.; Kim, Y.-J.; Lee, H.; Kim, B.-H. The Effect of Monsoon Rainfall Patterns on Epilithic Diatom Communities in the Hantangang River, Korea. Water 2020, 12, 1471. https://doi.org/10.3390/w12051471
AMA Style
Cho I-H, Kim H-K, Lee M-H, Kim Y-J, Lee H, Kim B-H. The Effect of Monsoon Rainfall Patterns on Epilithic Diatom Communities in the Hantangang River, Korea. Water. 2020; 12(5):1471. https://doi.org/10.3390/w12051471
Chicago/Turabian StyleCho, In-Hwan, Ha-Kyung Kim, Min-Hyuk Lee, Yong-Jae Kim, Hyuk Lee, and Baik-Ho Kim. 2020. "The Effect of Monsoon Rainfall Patterns on Epilithic Diatom Communities in the Hantangang River, Korea" Water 12, no. 5: 1471. https://doi.org/10.3390/w12051471
Note that from the first issue of 2016, this journal uses article numbers instead of page numbers. See further details here.