Evaluation of Thirty-Eight Models of Drippers Using Reclaimed Water: Effect on Distribution Uniformity and Emitter Clogging


Institute of Research and Training in Agriculture and Fishery (IFAPA), Junta of Andalucia, La Mojonera, 04630 Almería, Spain
*
Author to whom correspondence should be addressed.
Water 2020, 12(5), 1463; https://doi.org/10.3390/w12051463
Submission received: 13 April 2020
/
Revised: 13 May 2020
/
Accepted: 18 May 2020
/
Published: 20 May 2020
(This article belongs to the Section Water Use and Scarcity)
Abstract
:Emitter clogging is a problem in drip irrigation systems, and it is accentuated when using reclaimed water. The objective of this work was to evaluate the different commercial models of drippers used for irrigation with reclaimed water in greenhouse horticultural crops. Thirty-eight commercial emitter models were selected. The selection was based on recommended models from different irrigation installation companies and manufacturers for this type of water. These emitters had different types of pipeline insertion (inter-line, in-line, and on-line) and different pressure compensation (compensating and non-compensating pressure). The emitter models were analyzed in the laboratory, determining the manufacturing variation coefficient (Cv) and the emitter equation (Ee), and subsequently two consecutive tests were established in the greenhouse, with a period of irrigation inactivation between tests, as well as different reclaimed water qualities. The reclaimed water was regenerated urban wastewater from the city of Almería. Distribution uniformity coefficient (DU) and clogging of the emitter (Ec) were evaluated in the greenhouse tests. Of the 38 models analyzed, only one of them did not comply with the International Organization for Standardization (ISO) standard, providing a Cv greater than 0.07. At the commencement of the greenhouse trial (0 h of irrigation), 14 dripper models performed with an excellent DU, above 95%, and all emitter models presented a DU above 85%. At the end of the second greenhouse trial (206 h of irrigation), three models recorded a DU of less than 85%. The application of reclaimed wastewater produced events of clogging and reducing uniformity in the studied models. On-line pressure-compensating emitter models had the worst performance. The irrigation inactivation period produced an improvement in uniformity values. By improving the quality of reclaimed water, all types of emitters showed a better performance during the irrigation season. Notably, pressure-compensating emitter models even showed some cleaning capacity, because their clogging was reduced in the second trial.
1. Introduction
Climate change will affect the availability, quality, and quantity of water for basic human needs. In many regions of the world, it is increasingly necessary to consider “unconventional” water resources in future planning. Water reuse (or reclaimed water) is a reliable alternative to conventional water resources for a number of uses, provided that it is treated and/or used safely [1]. Agriculture is by far the main user of water in the world. Irrigated agriculture accounts for 70% of water withdrawals, which can rise to more than 90% in some regions. Around 20% of total water used globally is from groundwater sources (renewable or not), and this share is rising rapidly, particularly in dry areas [2].
Drip irrigation, also called trickle irrigation or micro-irrigation, is a localized irrigation method that slowly and frequently provides water directly to the plant root zone [3]. It is considered to be a low-cost water-delivery system. Due to limited water resources and environmental consequences of common irrigation systems, drip irrigation technology has received more attention and played an important role in agricultural production. Therefore, the use of drip irrigation systems is rapidly increasing around the world. Moreover, irrigation management also needs to be efficient in order to help reduce the environmental impact and to promote the sustainable use of resources [4,5].
As in the rest of world, irrigated agriculture has experienced a great exponential growth in recent years in Spain. At present, there are more of 3,700,000 ha [6]. Although parallel to this growth, irrigation systems have been extensively modernized, significantly increasing the area with the most efficient drip irrigation systems, water demand has also increased, generating a deficit of water resources. Concretely in Andalusia (Southern Spain), the generated gap between available resources and the demands has reached a value of over 1000 hm3 per year [7]. The situation is particularly critical in coastal areas, where most of the available resources come from groundwater. To alleviate this deficit, three major alternative water transfers from other basins have been launched, as well as desalination and the reuse of reclaimed urban wastewater. The latter option, although usually less expensive than the other two, remains a low-weight irrigation water source. However, current water policies not only consider reuse as a viable option, but they strongly encourage increasing their use, as reflected in the relevant regional and national water plans. The use of effluents in agriculture is a viable alternative in areas where water is scarce or there is intense competition for its use [8]. In Spain, reusing treated water for agricultural irrigation, among other uses, is regulated by Royal Decree 1620/2007, of 7 December [9]. In addition, The European Commission is evaluating the proposed Regulation of The European Parliament and the council on minimum requirements for water reuse [10].
In the southeast of Andalusia is Almería, with one of the highest concentrations of greenhouses in the world. Almería has three greenhouse production areas; one of them, the Andarax basin, is a paradigmatic area of reclaimed water used for greenhouse horticultural crop irrigation since 1997 [11,12,13]. Previous studies [14,15] showed that irrigation uniformity in this area was less than in other areas of Almería in which groundwater or desalinated water is used.
Emitter clogging is a major problem incurred in the operation of drip irrigation systems, especially when these systems utilize wastewater or reclaimed water [16,17]. These waters contain a large amount of particles, nutrient salts, organics, micro-organisms, and other substances, making the emitter clogging mechanism more complex and also significantly increasing the risk of emitter clogging. Partial and total plugging of emitters is closely related to irrigation-water quality, and occurs as a result of multiple factors, including physical, biological, and chemical agents [18,19,20]. Favorable environmental conditions in drip irrigation systems can cause rapid growth of several species of algae and bacteria, resulting in slime and filament buildup, which often become large enough to cause biological clogging [21]. On the other hand, some of the bacterial species may cause emitter clogging due to the precipitation of iron, manganese, and sulfur minerals dissolved in irrigation water [19]. Emitter clogging is related to the coefficient uniformity of flow, with some authors finding a linear relationship between the two parameters [17].
Some research showed the importance of flow distribution uniformity on growth, productivity, and quality of different crops, such as cotton [22], maize [23], onion [24], and zucchini [25], among others. However, other studies show irrigation system uniformity does not have a significant influence on the yield of some crops [26,27,28]. In any case, the decrease in uniformity is associated with greater water consumption, since water is irrigated above the needs of the crop, to ensure that the most unfavorable points receive the necessary water.
For this reason, the objective to be achieved is to maintain a high uniformity coefficient in drip irrigation systems. Many of the investigations carried out in this line show the importance that the type of emitter has in the obturation, and therefore in the uniformity [29,30,31]. However, not only the emitter has an influence; the characteristics of the water also have an influence [32,33]. Therefore, to evaluate the anti-clogging capacity of the emitters, it is necessary to carry out studies under the conditions of specific development, monitoring the dynamic variations of flow in the different types of emitters evaluated during a long period of irrigation [34,35,36].
The main objective of this work was to evaluate the behavior, using reclaimed urban wastewater, of different commercial emitters models commonly used in greenhouse horticultural crops.
2. Materials and Methods
The experiment consisted of two phases: The first was carried out in the laboratory, and the second was carried out in a greenhouse, under field conditions. The two phases were located at the Agricultural Research and Training Institute of Andalusia (IFAPA)—Southern Spain—(36°50′13″ N, 2°24′03″ W, 3 m Altitude).
2.1. Laboratory Phase
2.1.1. Emitters Tested
Thirty-eight commercial emitter models were selected after the performance of a previous local prospective study [37]. The main manufacturers and irrigation installation companies recommend these emitter models for this type of water (reclaimed water) and for greenhouse vegetable crops. Therefore, the flow range of these emitters was wide (2.0 to 4.8 L h−1). In addition, emitters with different pipeline integration (inter-line, on-line, and in-line) and with compensating and non-compensating pressure were included in the emitter models studied. The 38 commercial emitter models evaluated are shown in Table 1. Most emitter models evaluated were in/on/inter 16 mm pipelines, except inter-line or in-line models of 12 mm, where a pipeline of 12 mm was used (emitter models with reference number 4, 8, 11, 12, and 19, in Table 1).
2.1.2. Test Set
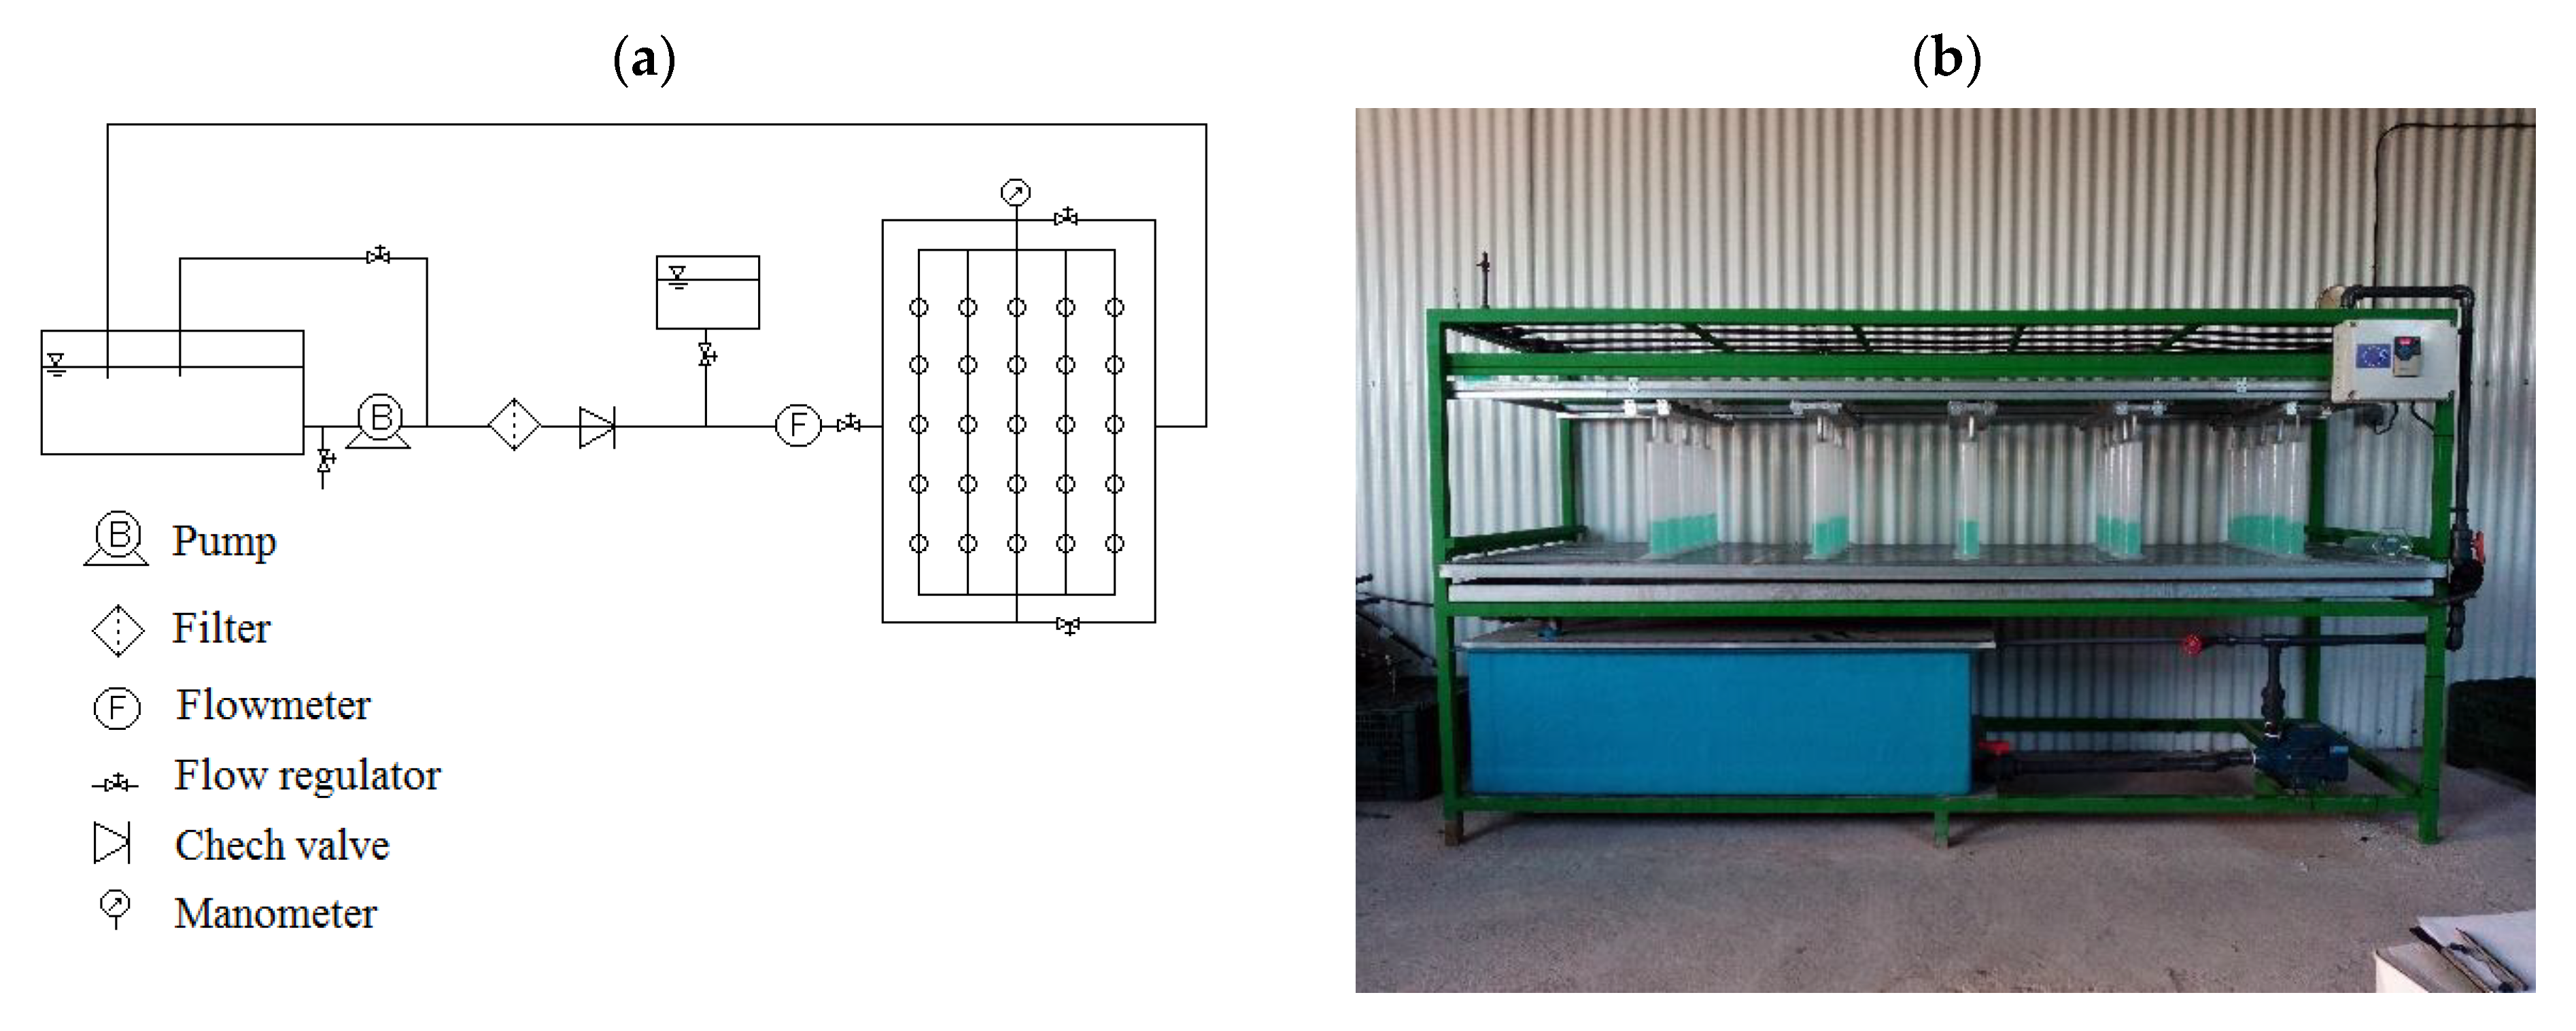
The test set used was designed according to UNE 68-075-86, which can be used by ISO 9261, because it complies with the specifications given by ISO, in the section on the precision of test set measurement devices and filtration of test water (Figure 1).
2.1.3. Determinations
The manufacturer’s coefficient of variation (Cv) and the relationship between flow rate and operating pressure (Emitter equation; Ee) of the different emitters were evaluated in the laboratory, before starting greenhouse trials. The water used for this was of good quality (desalinated groundwater). The emitters were evaluated in the test set and as established ISO 9261:2004 (Agricultural irrigation equipment. Emitters and emitting pipe).
The manufacturer′s coefficient of variation was computed by using the following expression:
where is the mean discharge of emitters in the sample (L h−1); and is the standard deviation of the emitter’s discharge in the sample.
In order for the issuer to comply with ISO 9261:2004, the emitter must have a manufacturing variation coefficient (Cv) of the tested sample that does not exceed 0.07.
The relationship between flow rate and operating pressure (Emitter equation; Ee) was defined by the following equation:
where q is the emitter discharge (L h−1); H is the pressure (kPa); k is the coefficient characterizing dripper dimension; and x is the dripper flow regime coefficient (flow exponent).
q = k Hx
The flow exponent () was obtained by the following equation:
where i is 1,2,3 …, n; n is the number of pressure values tested; is the mean discharge of emitters (L h−1); and is the pressure (kPa).
2.2. Greenhouse Condition Phase
In this phase of the experiment, the 38 models of emitters irrigating in greenhouse conditions were evaluated. Two irrigation seasons were conducted, named 1st trial and 2nd trial. The 1st trial was conducted from March 19th to December 11th (8 months), with a total of 111 h of irrigation, equivalent to the total water irrigation volume applied on a standard basis for greenhouse tomato crops in this area [38]. The 2nd trial was conducted after the first, from September 10th to April 28th (6 months), with a total of 95 h of irrigation, an amount also equivalent to the total water irrigation volume applied on a standard basis for greenhouse tomato crops in this area. Emitters of the 2nd trial were the same as those of the 1st trial; therefore, the irrigation hours were cumulative, and at the end of the second trial, the drippers had 206 h of irrigation (111 for the 1st trial, and 95 for the 2nd trial). The operation time consisted of continuous irrigation pulses of 35 min, giving five weekly applications. The objective was to precisely simulate the common practice of growers in the area for the production of greenhouse tomatoes. Irrigation pressure remained constant at 150 kPa during the irrigation periods. Irrigation was exclusively with water, without additional fertilizers. No maintenance work of the irrigation system was conducted (acidification of water, cleaning of pipeline, etc.), other than water filtration, using a disk filter. The filtration of the water with a disc filter was carried out to ensure that large particles did not pass into the irrigation system in the event of an accidental break in the distribution pipes, since the distributor of reclaimed water provided the filtered water.
2.2.1. Origin, Treatment, and Quality of Reclaimed Water
The water used was provided by the “Cuatro Vegas” Irrigation District, distributor of reclaimed urban wastewater of the city of Almeria. The water source came from the urban wastewater reclaiming plant in the city of Almería (Southern Spain) (36°50′ N, 2°27′ W). It has been estimated that this plant treats 15 hm3 year−1. In this plant, the primary treatment of wastewater is carried out by decanting the solids and breaking down the fatty emulsions. The next stage is the secondary treatment (biological), by activated sludge. After these treatments, the water is sent to the tertiary treatment plant, located 6 km away from the first plant. In this second treatment plant, the water undergoes a treatment with chlorite, using sodium hypochlorite, followed by a treatment with ozone. The dosage used in both treatments varies depending on the microbiological contamination present in the purified wastewater to be treated. The disinfection process eliminates, on average, 99.96% of the total coliforms, fecal coliforms, and fecal streptococcus present in the water. The chemical characteristics of the reclaimed water were suitable for irrigation (HCO3 −: 6.6 mM, Cl−: 8.9 mM, N-NO3−: 0.3 mM, H2PO4−: 0.4 mM, N-NH4+: 3.3 mM; Ca2+: 4.8 mM, Mg2+: 4.2 mM, Na+: 9.1 mM, K+: 0.6 mM). The water had low concentrations of inorganic contaminants (Cr: 14.22 µg L−1, As: 4.84 µg L−1, Cd: 0.04 µg L−1, Pb: 1.79 µg L−1, Ni: 3.08 µg L−1, Mn: 13.17 µg L−1, Cu: 9.82 µg L−1, Zn: 37.76 µg L−1). In the 2nd trial, the treatment applied in the tertiary treatment plant was modified by adding a filtration system prior to the application of sodium hypochlorite and ozone. It consists of a filtration system composed of 20 sand and anthracite filters of 2500 mm diameter that decreases the concentration of suspended solids and turbidity of the water. The water quality supplied by the irrigation district during the experiment (1st and 2nd trials) was variable (Table 2). In the 2nd trial, a higher water quality was achieved due to the addition of the preliminary filtration system.
2.2.2. Equipment, Experimental Design, and Treatments
The 1st and 2nd trials were carried out in a 1200 m2 plastic greenhouse. The greenhouse was equipped with automatic climate control and drip irrigation. Using the automatic climate controller, we kept climatic parameters approximately equivalent to those measured conventionally in the commercial cultivated tomato greenhouses of the area [39]. The greenhouse was equipped with a drainage system, which allowed for the removal of the excess water applied.
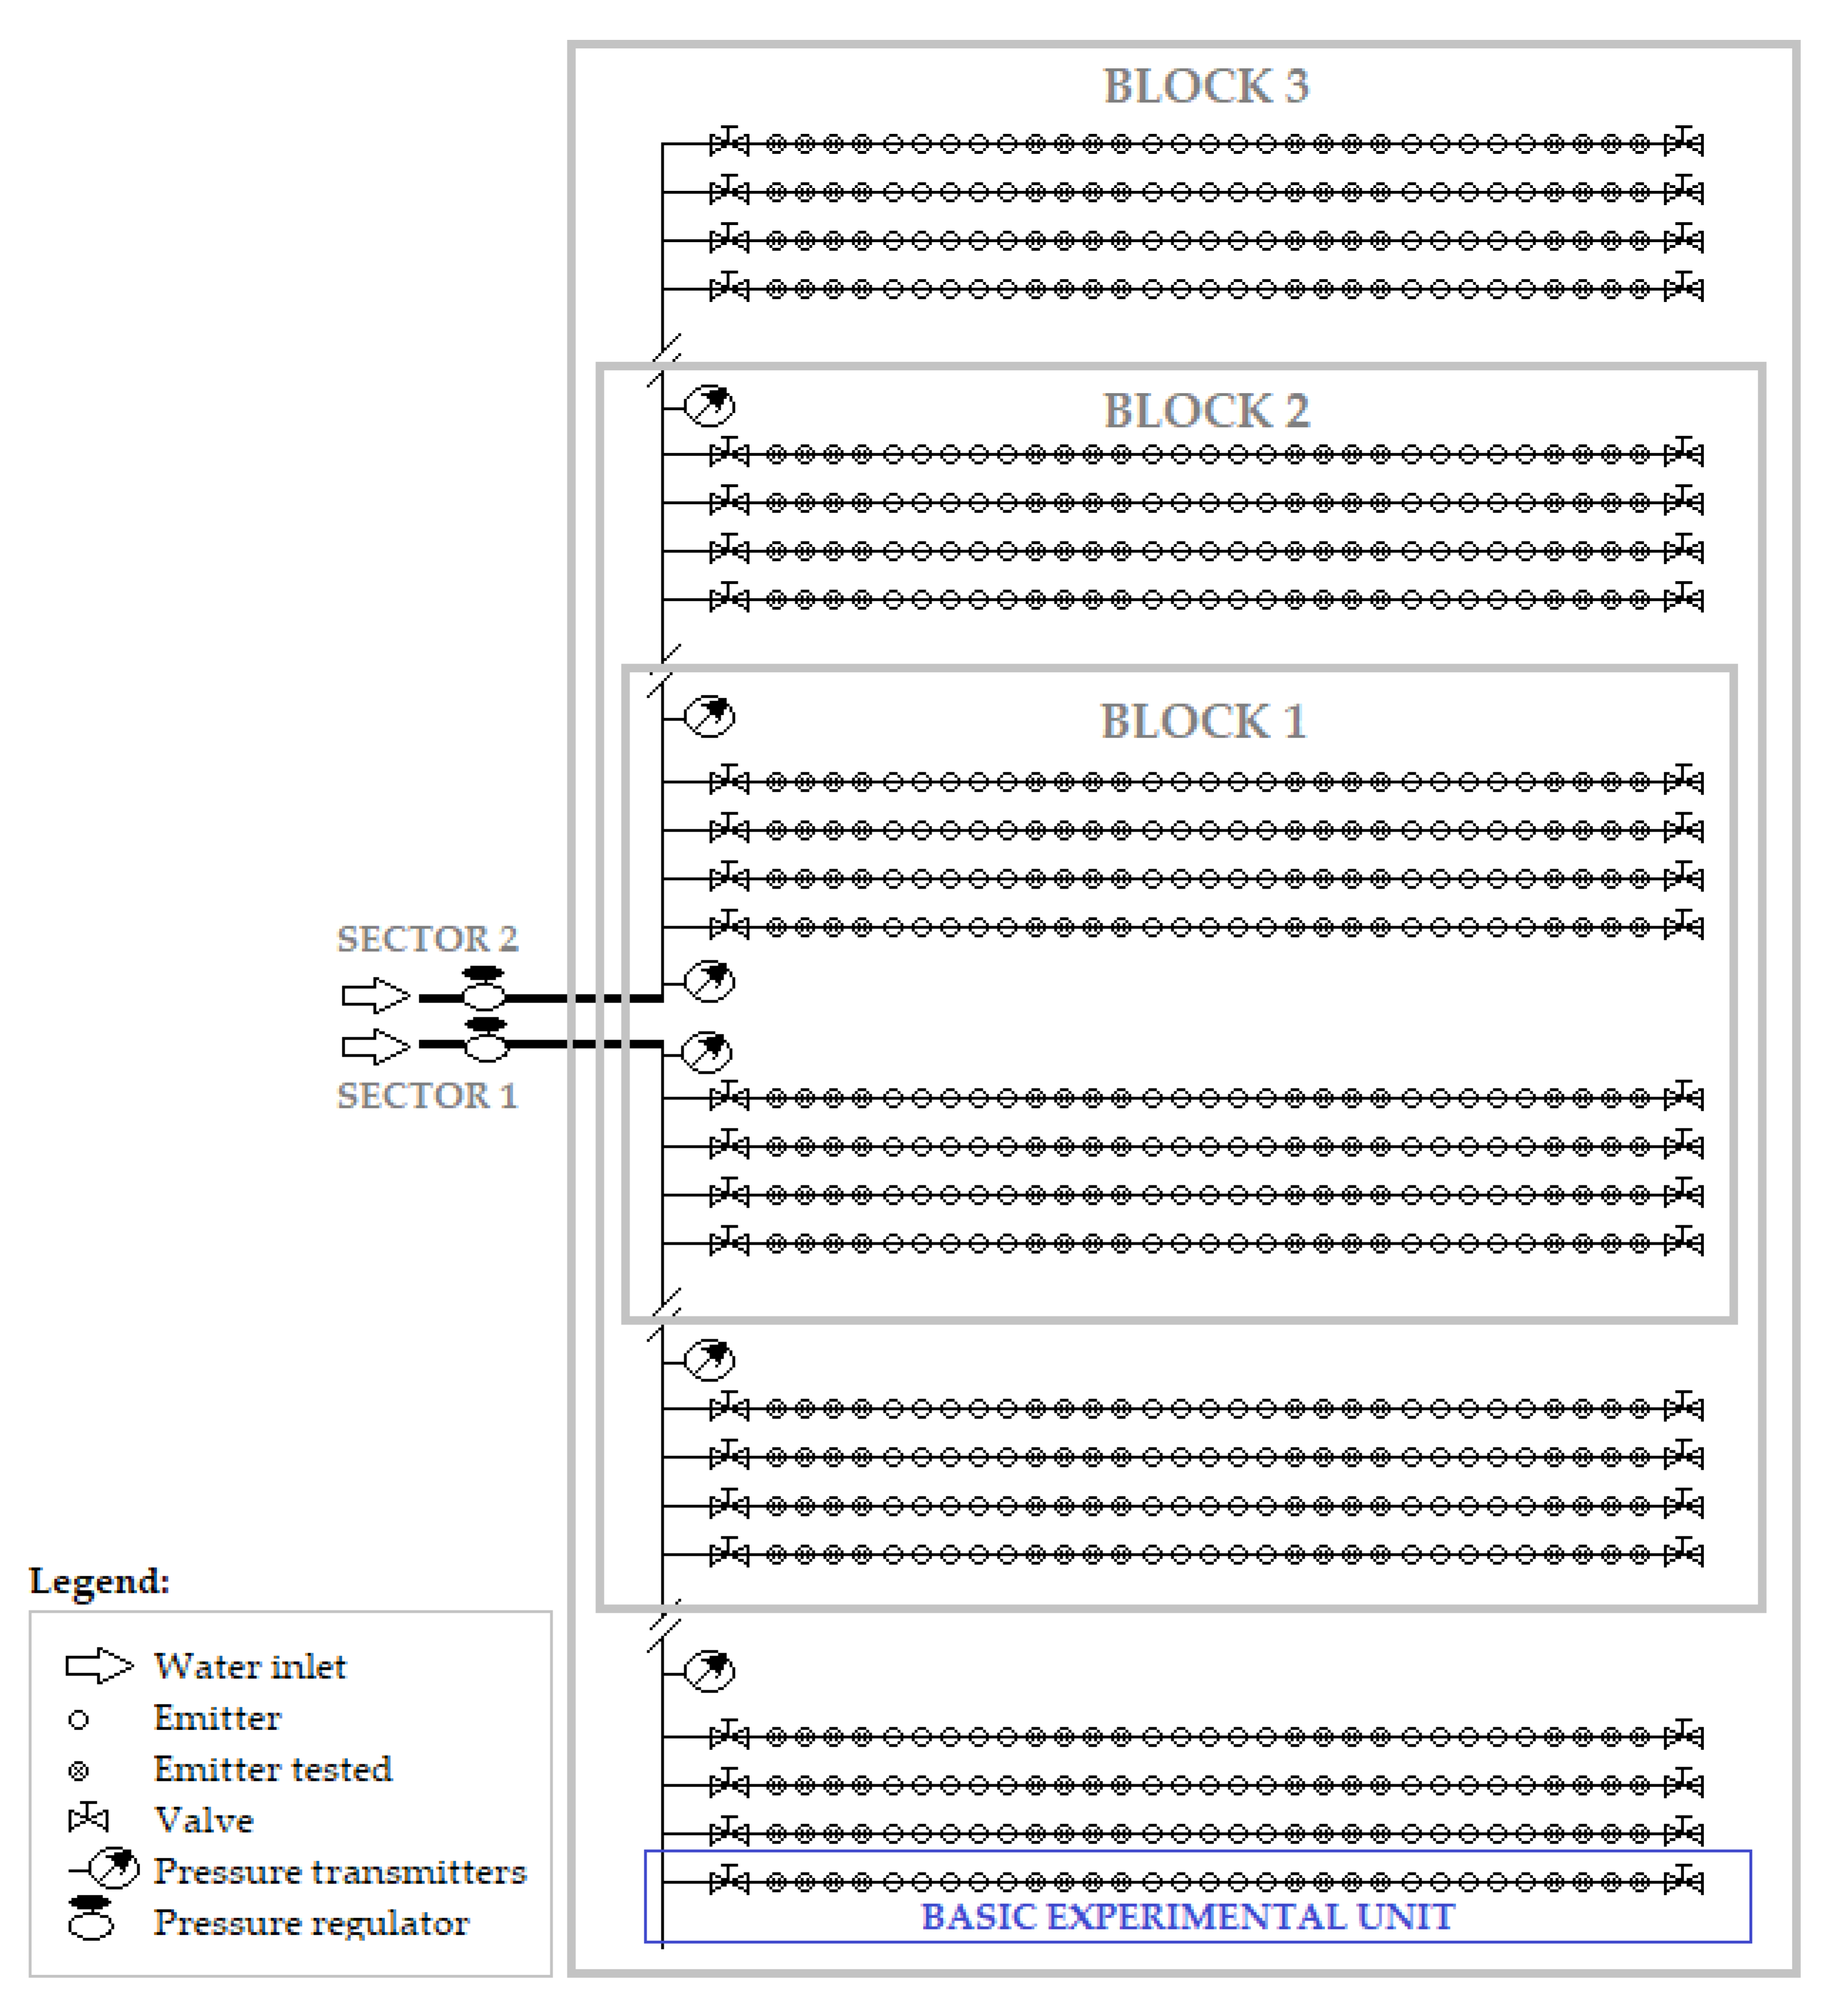
The experimental setup consisted of the installation of a bank of emitters, establishing a randomized block design, with thirty-eight treatments and three replications. The basic experimental unit was a pipeline with 31 emitters separated by 0.5 m. The treatments were the 38 emitters models studied in the laboratory (Table 1), and the blocks were established based on the proximity to the water inlet (B1 the closest; B3 the farthest) (Figure 2). The experimental micro-irrigation system was divided into two irrigation sectors, because it was not possible to irrigate all of it at once (the total instantaneous flow of reclaimed water demand in the experiment was higher than the instantaneous flow supplied by the “Cuatro Vegas” Irrigation District). The sectors were watered one after the other, with the same working conditions. Each irrigation sector had a pressure regulator and five pressure transmitters distributed along the pipeline. The function of these pressure transmitters was to check that the pressure was constantly maintained along the pipeline.
2.2.3. Determinations
The performance of each emitter model was evaluated by determining the uniformity distribution coefficient (DU) and emitter clogging (CE).
DU was determined at the beginning and at the end of each trial, and an intermediate evaluation.
Sixteen emitters were selected from each basic experimental unit (a pipeline with 31 emitters separated 0.5 m) spread over 4 locations (four at the beginning, four at 1/3 of the length, four at 2/3 of the length, and four at the end of the emitter line). The water delivered for each selected emitter was collected during 3 min, for measuring its discharge. These evaluations were carried out with desalinated water, so as not to influence the irrigation hours carried out with reclaimed water.
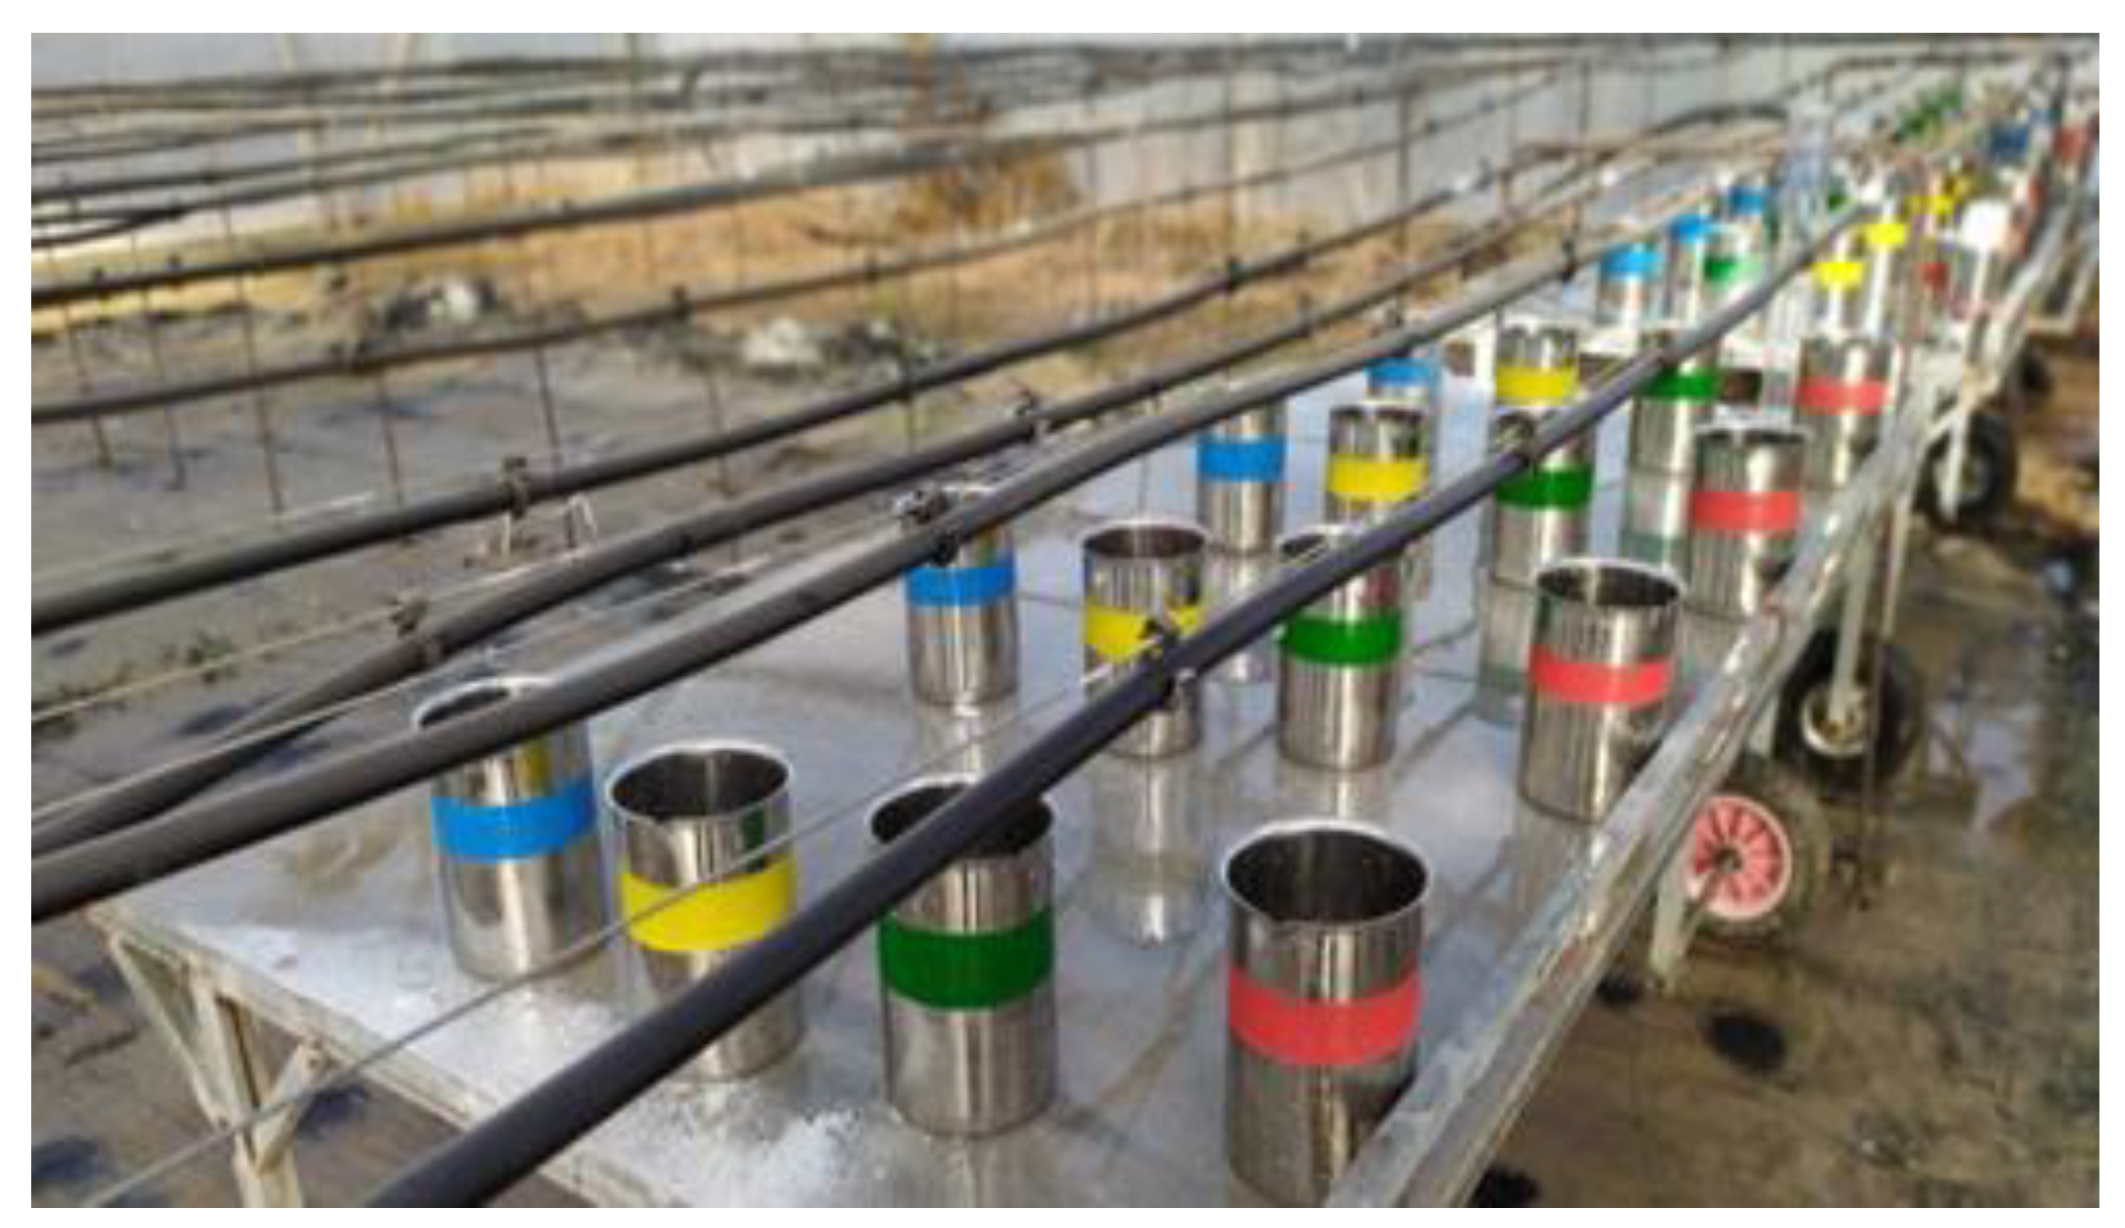
Data collection was facilitated by using four sampling tables designed to be moved horizontally and with a capacity of 16 volume measurements per table, four drippers per line, and four lines with different emitter models (Figure 3).
The uniformity distribution coefficient (DU) was estimated by using the classical methodology proposed by Merriam and Keller [40], who proposed the following equation:
where q25% is the average discharge of the 25% of the emitters with the lowest flow rate (L h−1); and qm is the average discharge of all emitter tested (L h−1).
DU = (q25%/qm) × 100
The classification of the distribution uniformity coefficient (DU) by Merriam and Keller [40] is shown in Table 3.
The clogging of the emitter (CE) was calculated by percentage discharge reduction, using the following equation:
where qI is the discharge of the emitters at the beginning of the 1st trial (L h−1); and qF is the discharge of the emitters at the end of the trial (L h−1).
CE = ((qI − qF)/qI) × 100
2.2.4. Statistical Analysis
To determine the effect of the treatments (emitter model), the data were analyzed by using analysis of variance for a complete randomized block design with tree replications (two-way analysis of variance (ANOVA) without interaction). In addition, the data were also analyzed by a randomized unifactorial design, considering the insertion in the pipeline, and considering the pressure compensation (one-way ANOVA). For pressure compensation, 2 treatments (compensating and non-compensating) were considered, and the emitter models were the repetitions. For insertion in the pipeline, 3 treatments (inter-line, in-line, and on-line) were considered, and the emitter models were the repetitions. Moreover, for pressure compensation and pipeline insertion, 4 treatments (in-line compensating, in-line non-compensating, on-line compensating, and on-line non compensating) were considered. The data were also analyzed as a one-factor design, to determine the effect of the sampling date on the different types of insertion and pressure compensations.
Data percentage was transformed with inverse sign√, to obtain a normal distribution. For each analysis, when ANOVA was significant, statistically significant differences between means were identified by using the least significant difference (LSD) test (p ≤ 0.05).
Statistical analyses were performed with Statgraphics 18 (2020 Statgraphics Technologies, Inc. The Plains, Virginia, United States).
3. Results
3.1. Manufacturer’s Coefficient of Variation (Cv) and Emitter Equation (Ee)
The emitters recommended by manufacturers generally had a good manufacturing variation coefficient in the previous tests performed in the laboratory (Table 1), an aspect that directly influences the distribution uniformity coefficient. Of the 38 models analyzed, only one model did not comply with the ISO 9261:2004, providing a Cv greater than 0.07 (emitter model with reference number 36, in Table 1). Three of the models studied presented a Cv of 0.07, the limit established by the norm at the limit of the norm (emitter models with reference number 10, 18, and 26, in Table 1).
The Ee of all compensating emitter models presented a flow exponent less than 0.2, complying with the ISO, which specifies that it be less than 0.2. Many of them were very close to 0; therefore, their compensation was very high. The flow exponent in the non-compensating emitters’ models varied from 0.39 (emitter model with reference number 2 in Table 1) to 0.54 (emitter model with reference number 12 in Table 1), being in most emitter models very close to 0.5.
3.2. Distribution Uniformity Coefficient (DU)
3.2.1. First Trial
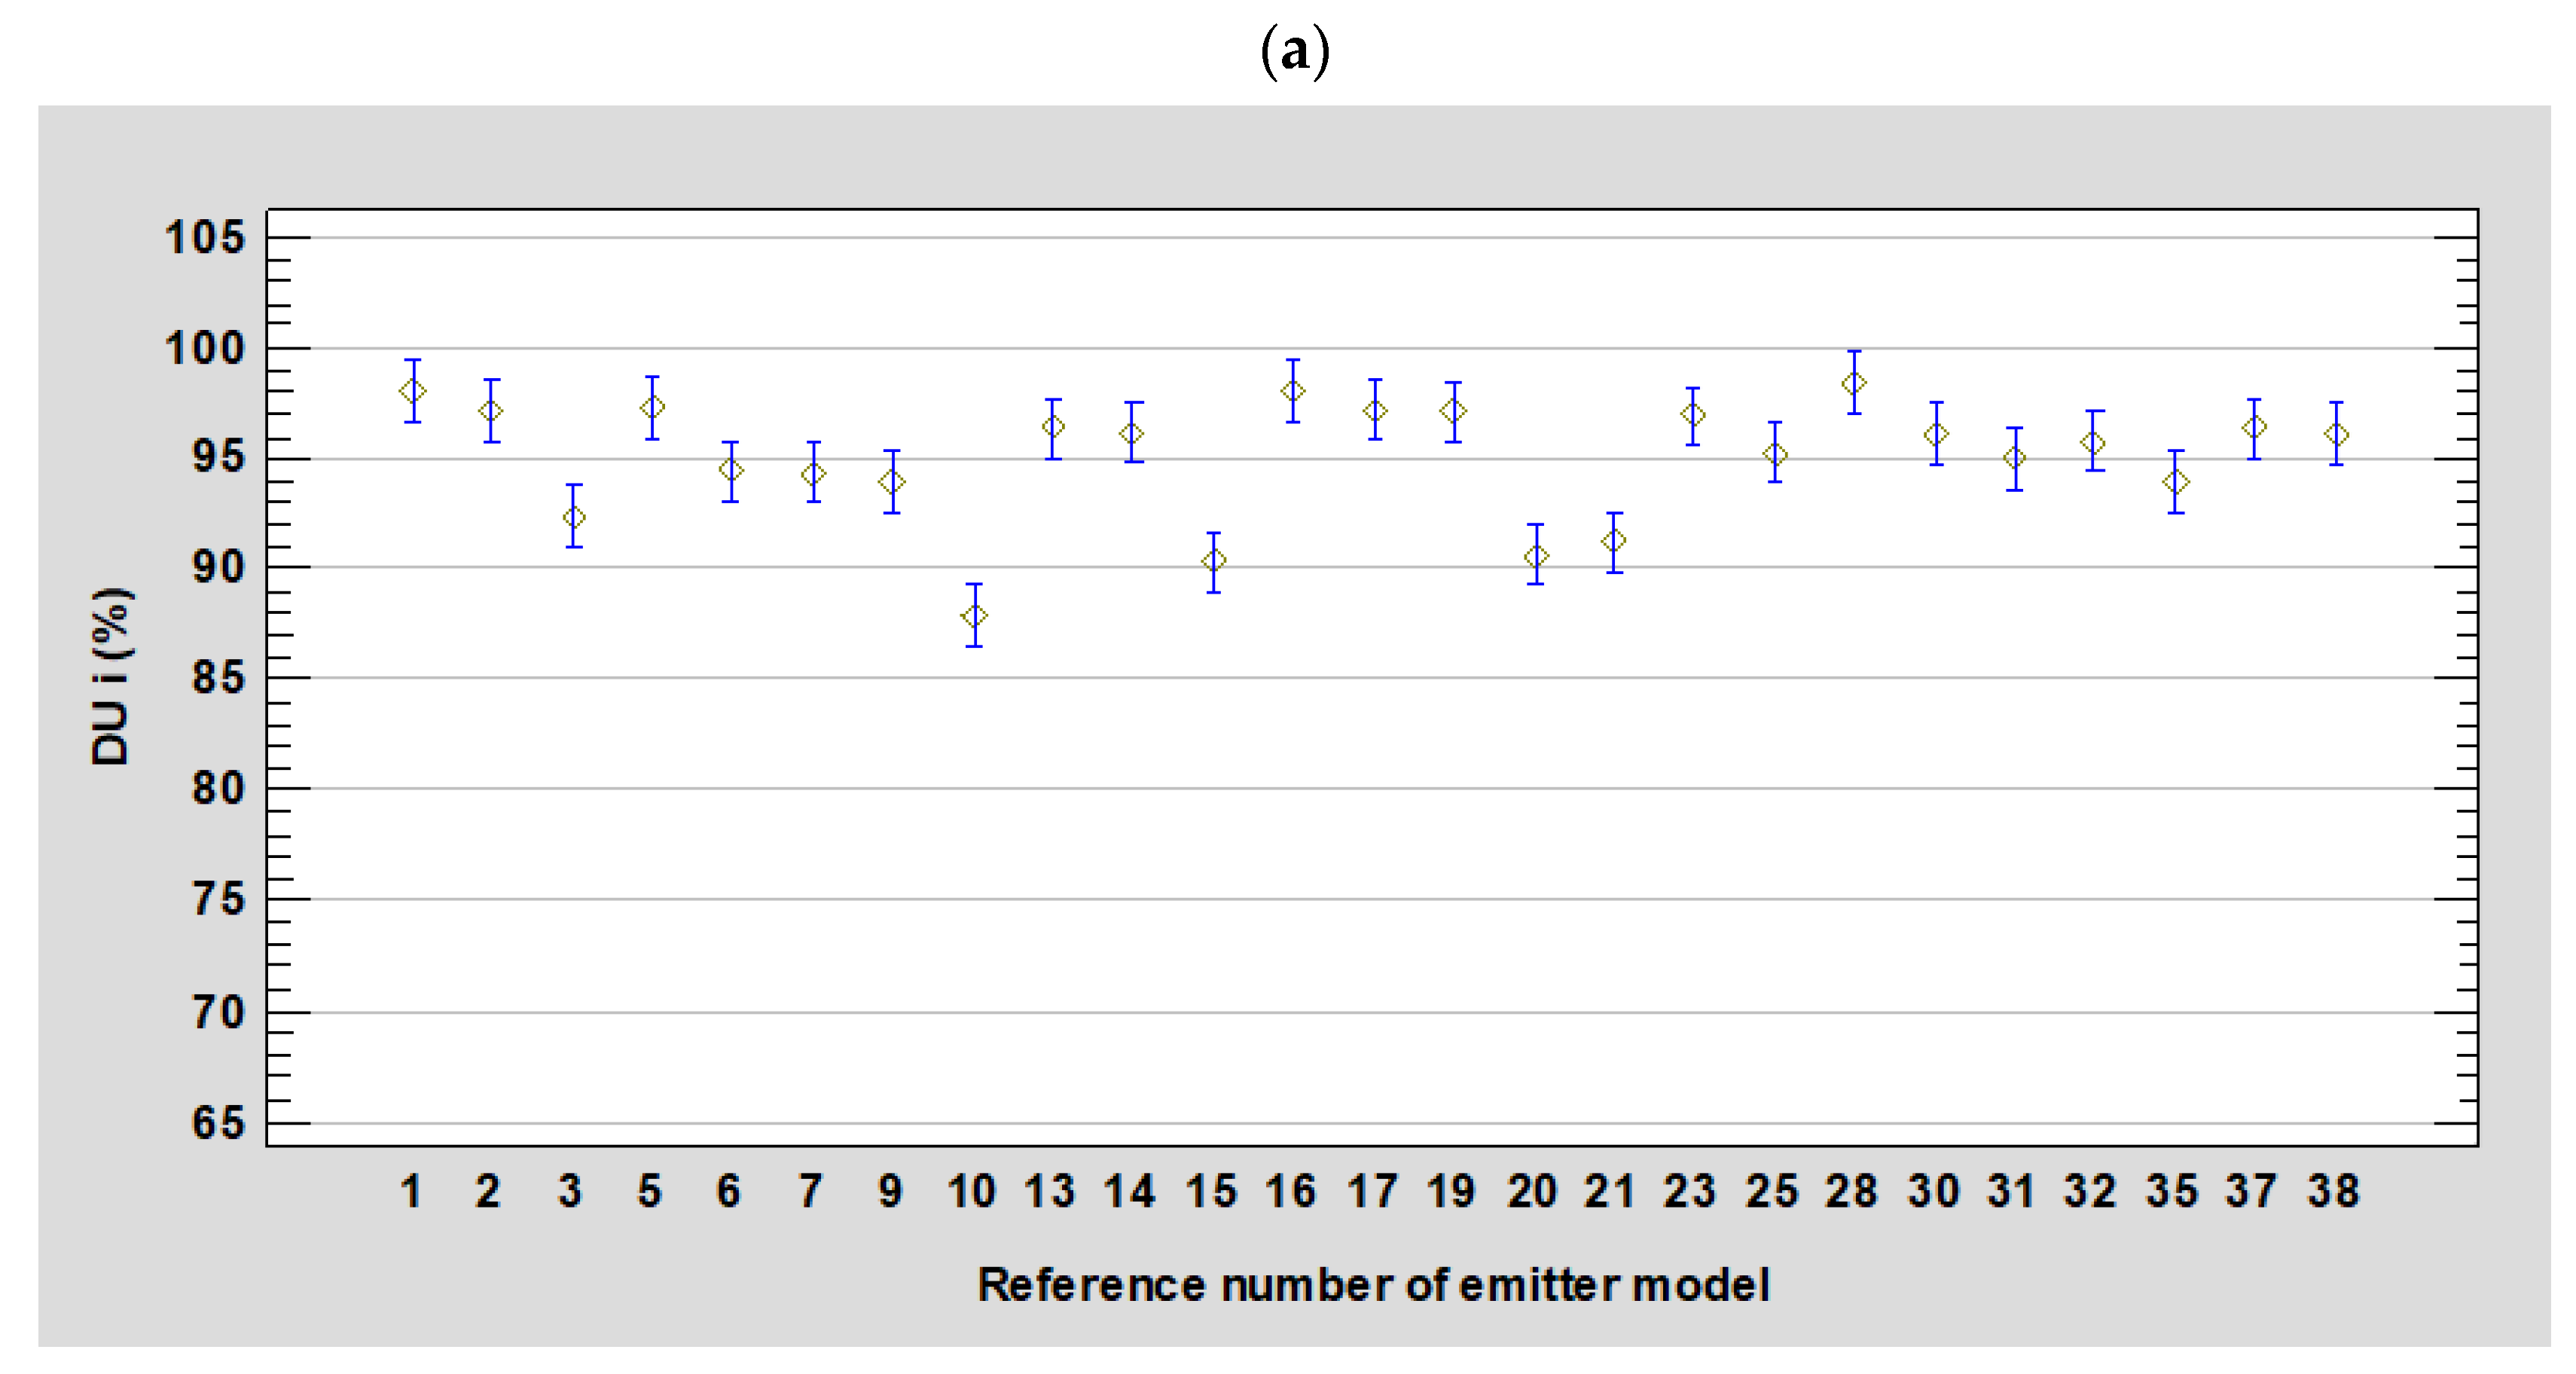
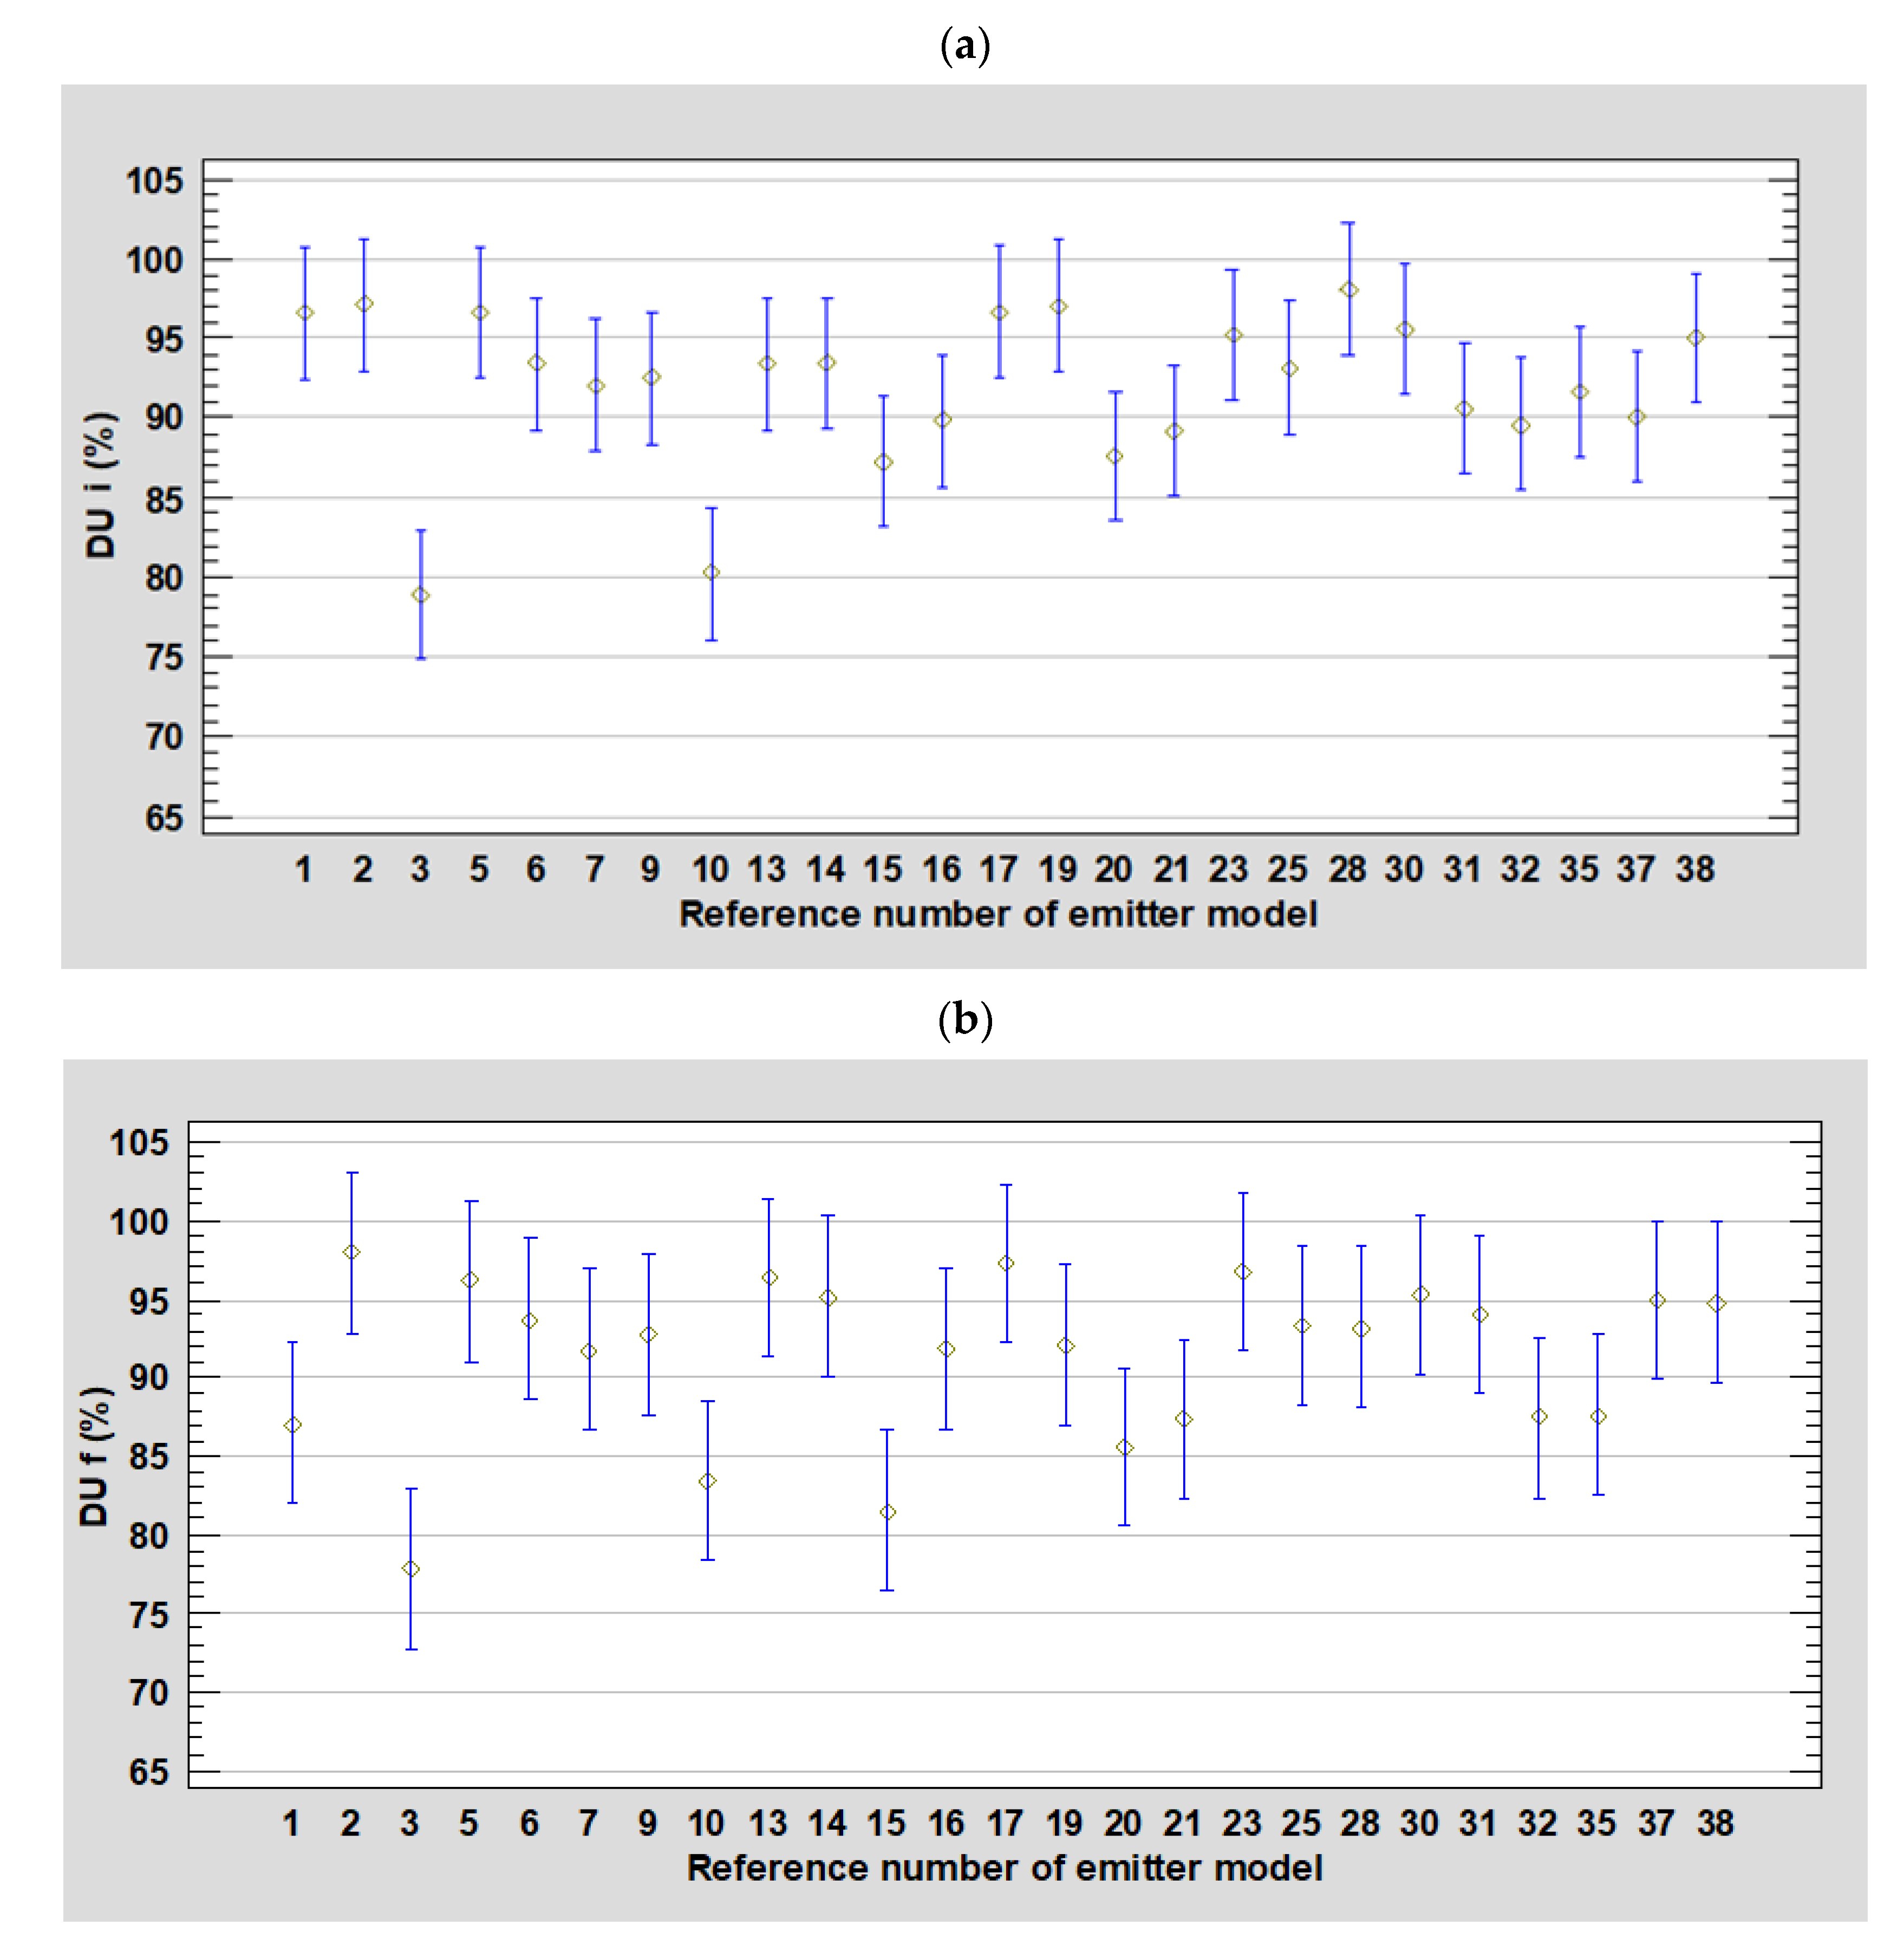
Significant differences in the flow coefficient of uniformity of different emitter models were found at the beginning of the first trial (Figure 4). At the start, 14 dripper models performed with an excellent uniformity distribution coefficient above 95%, and all the models of emitters presented a DU above 85%; thus, all drippers could be classified as “excellent” and “good”, according to Merriam and Keller [40] (Table 3).
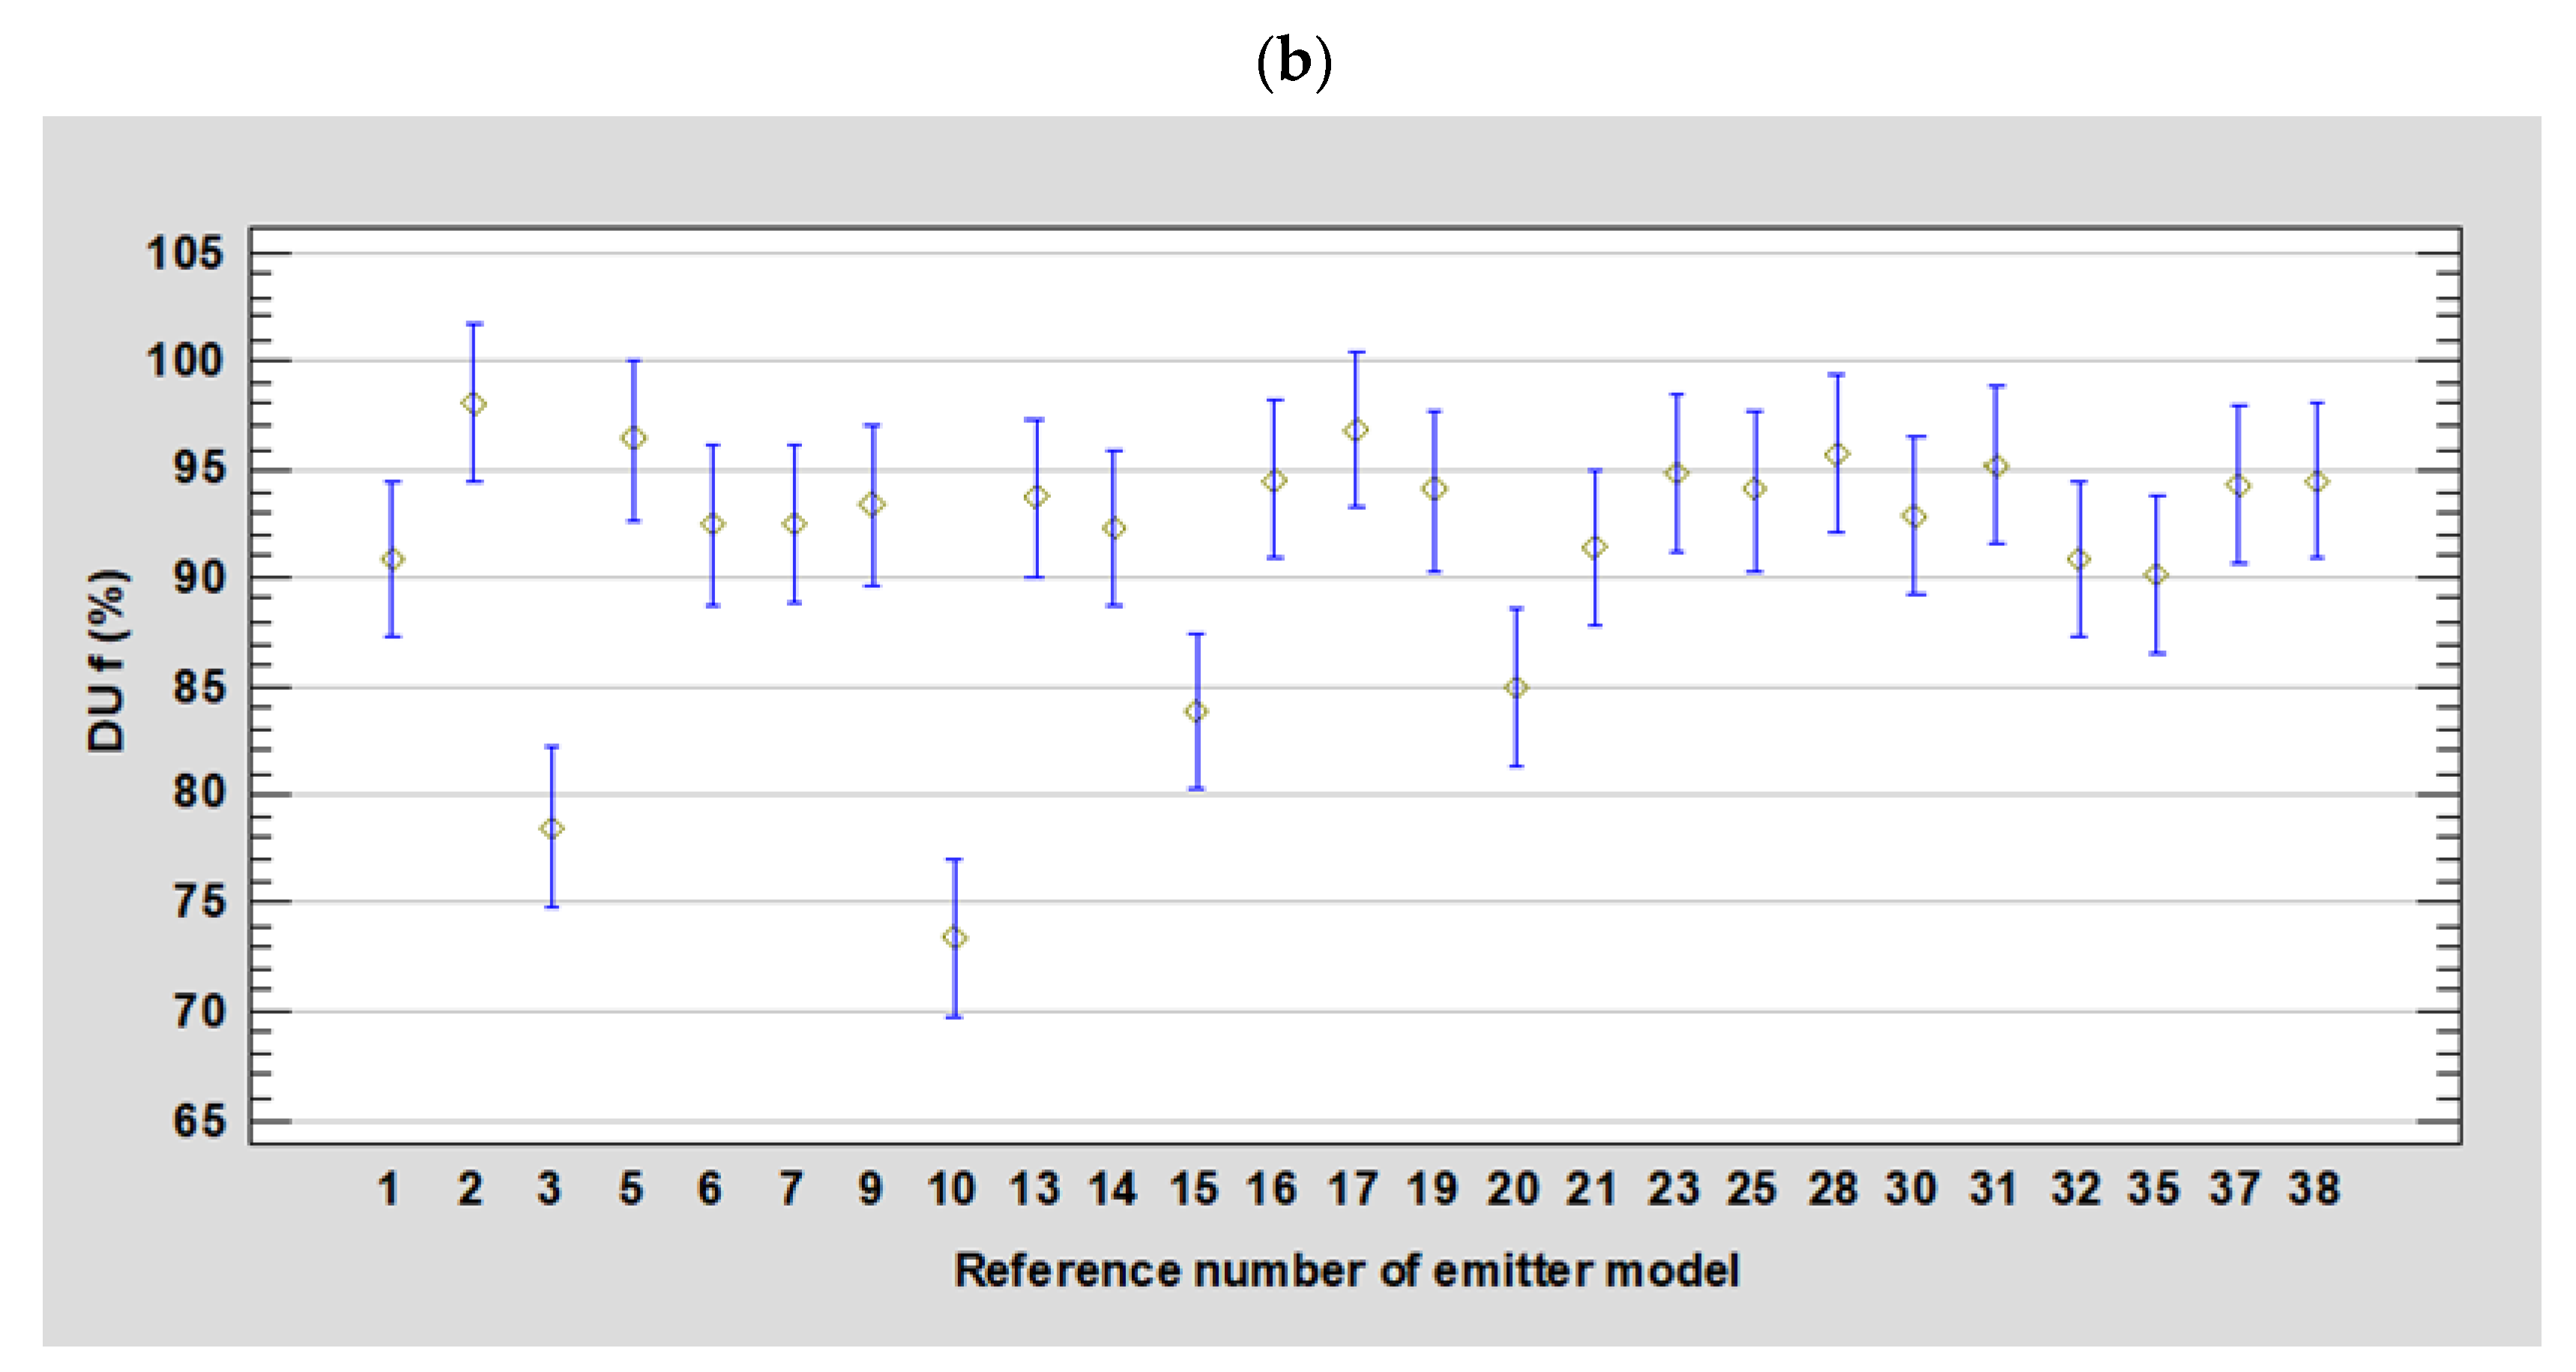
At the end, in general, the DU values decreased in relation to the initial values, and significant statistical differences were found between the different emitter models (Figure 4). Amongst the 38 tested emitter models, five of them got a DU of less than 85%, and only seven models had a DU greater than 95%.
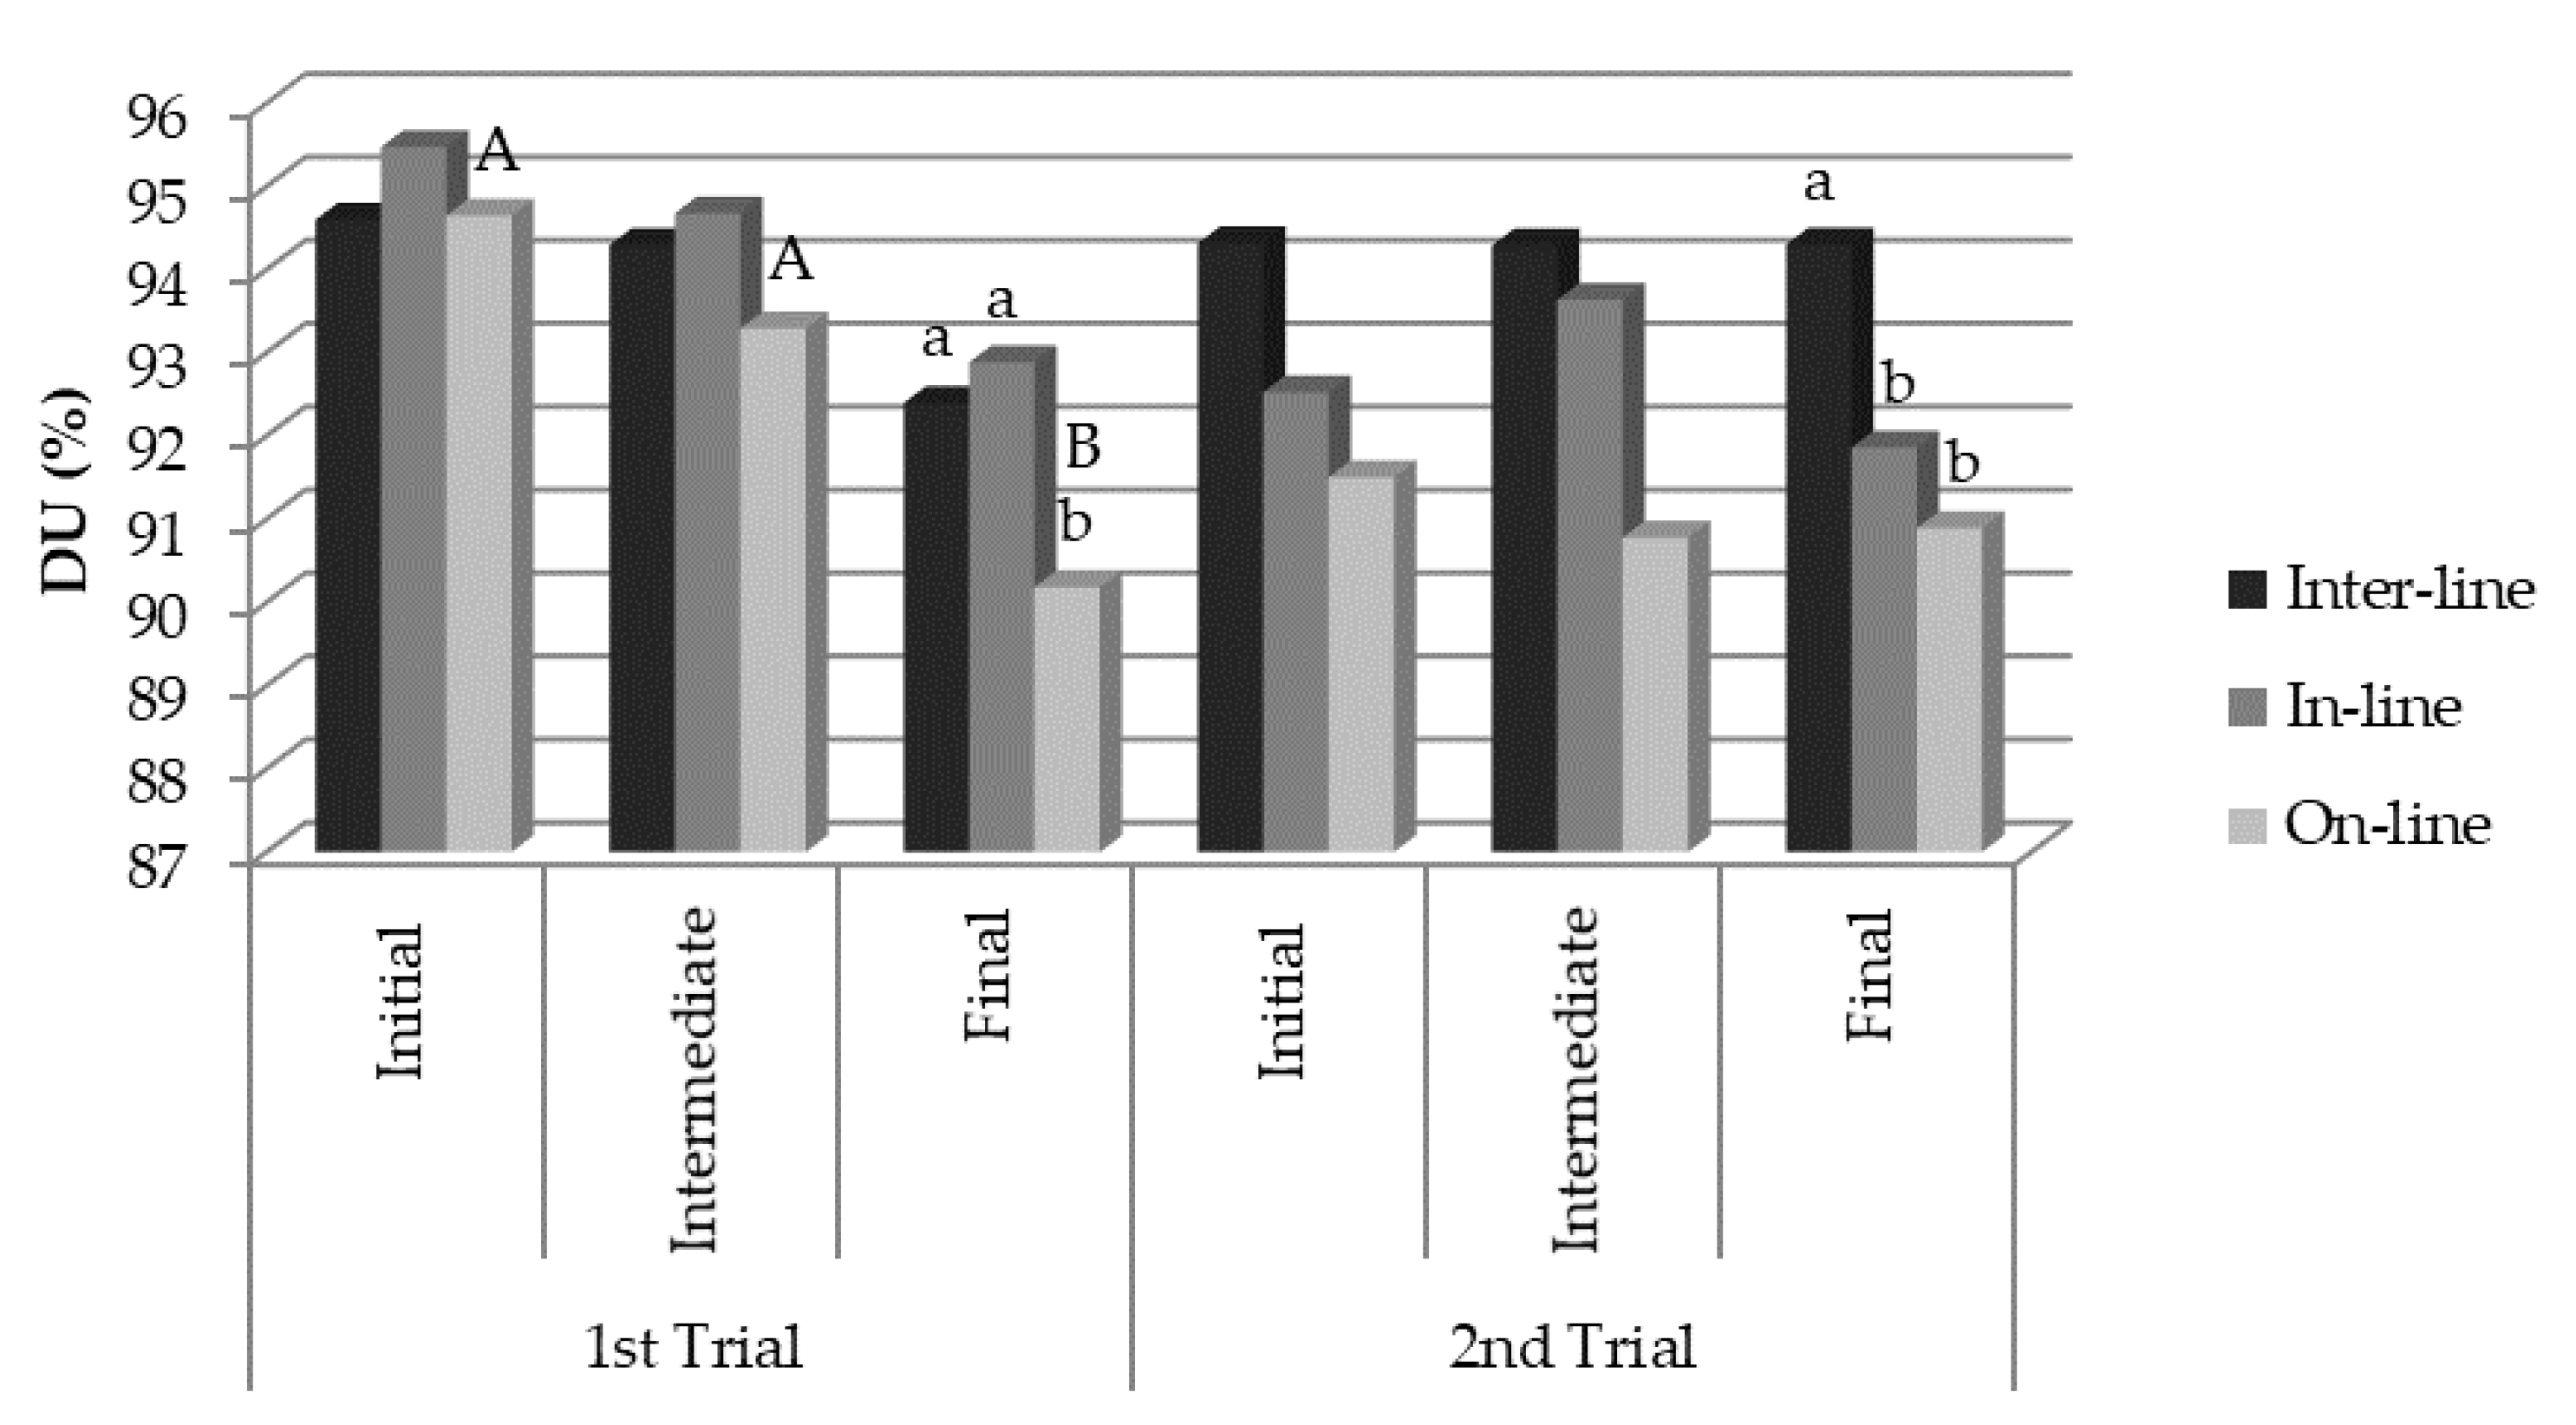
When the emitters were classified according to their integration in the pipeline, there were no significant differences at the beginning; however, significant differences were also observed at the end of the first trial (Figure 5). In-line emitters recorded the best DU throughout the irrigation period (95.5%, 94.6%, and 92.8% for initial, intermediate, and final samplings, respectively) but did not show statistically significant differences with inter-line emitters. On-line emitters presented the worst DU (94.5%, 93.2%, and 90.1% for initial, intermediate, and final samplings, respectively), being significantly lower than those recorded by other emitters at the end of the trial.
Comparing the DU values obtained at the beginning to those obtained at the end of the trial, we observed a decrease, regardless of the type of insertion in the pipeline (Figure 5). The decrease in DU was statistically significant in on-line emitters, as these had an average DU of 94.5% at the start of the trial and 90% at the end.
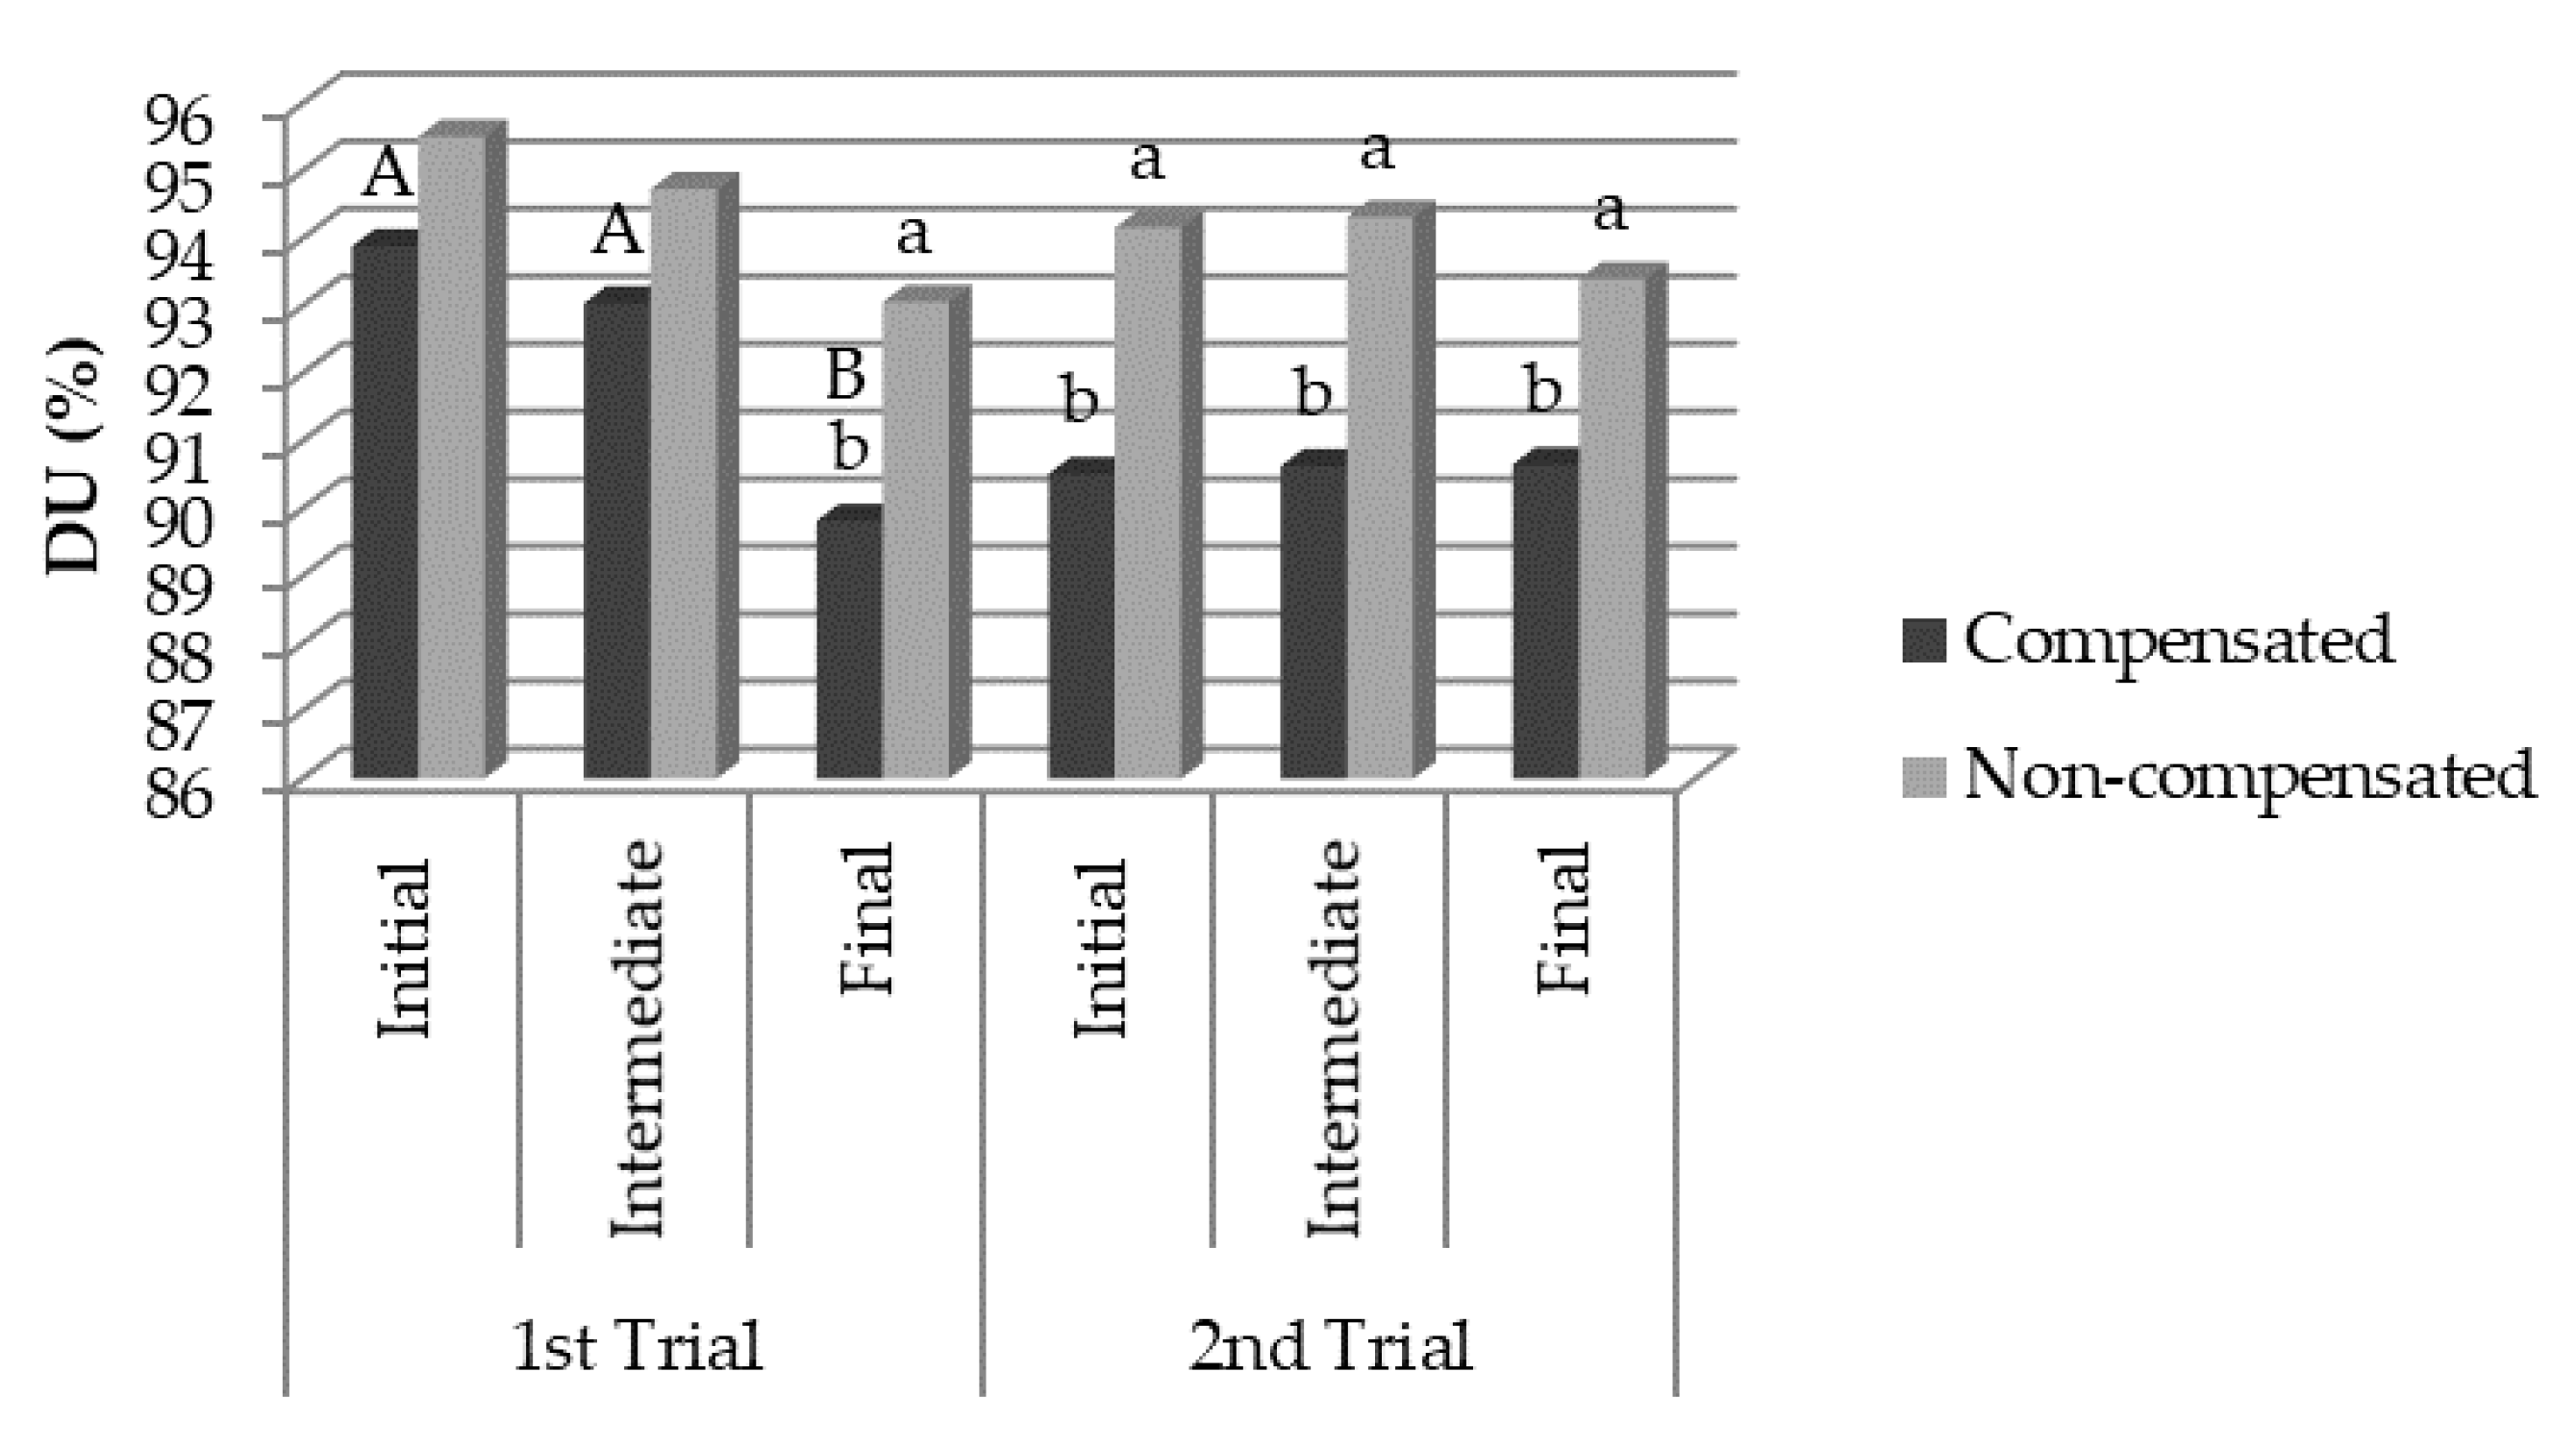
When grouping emitters as pressure compensating or non-compensating, we observed that pressure-compensating emitters had lower DU during the whole trial, with statistically significant differences at the end of the trial (89.7% DU for pressure compensating and 93% DU for the non-compensating) (Figure 6).
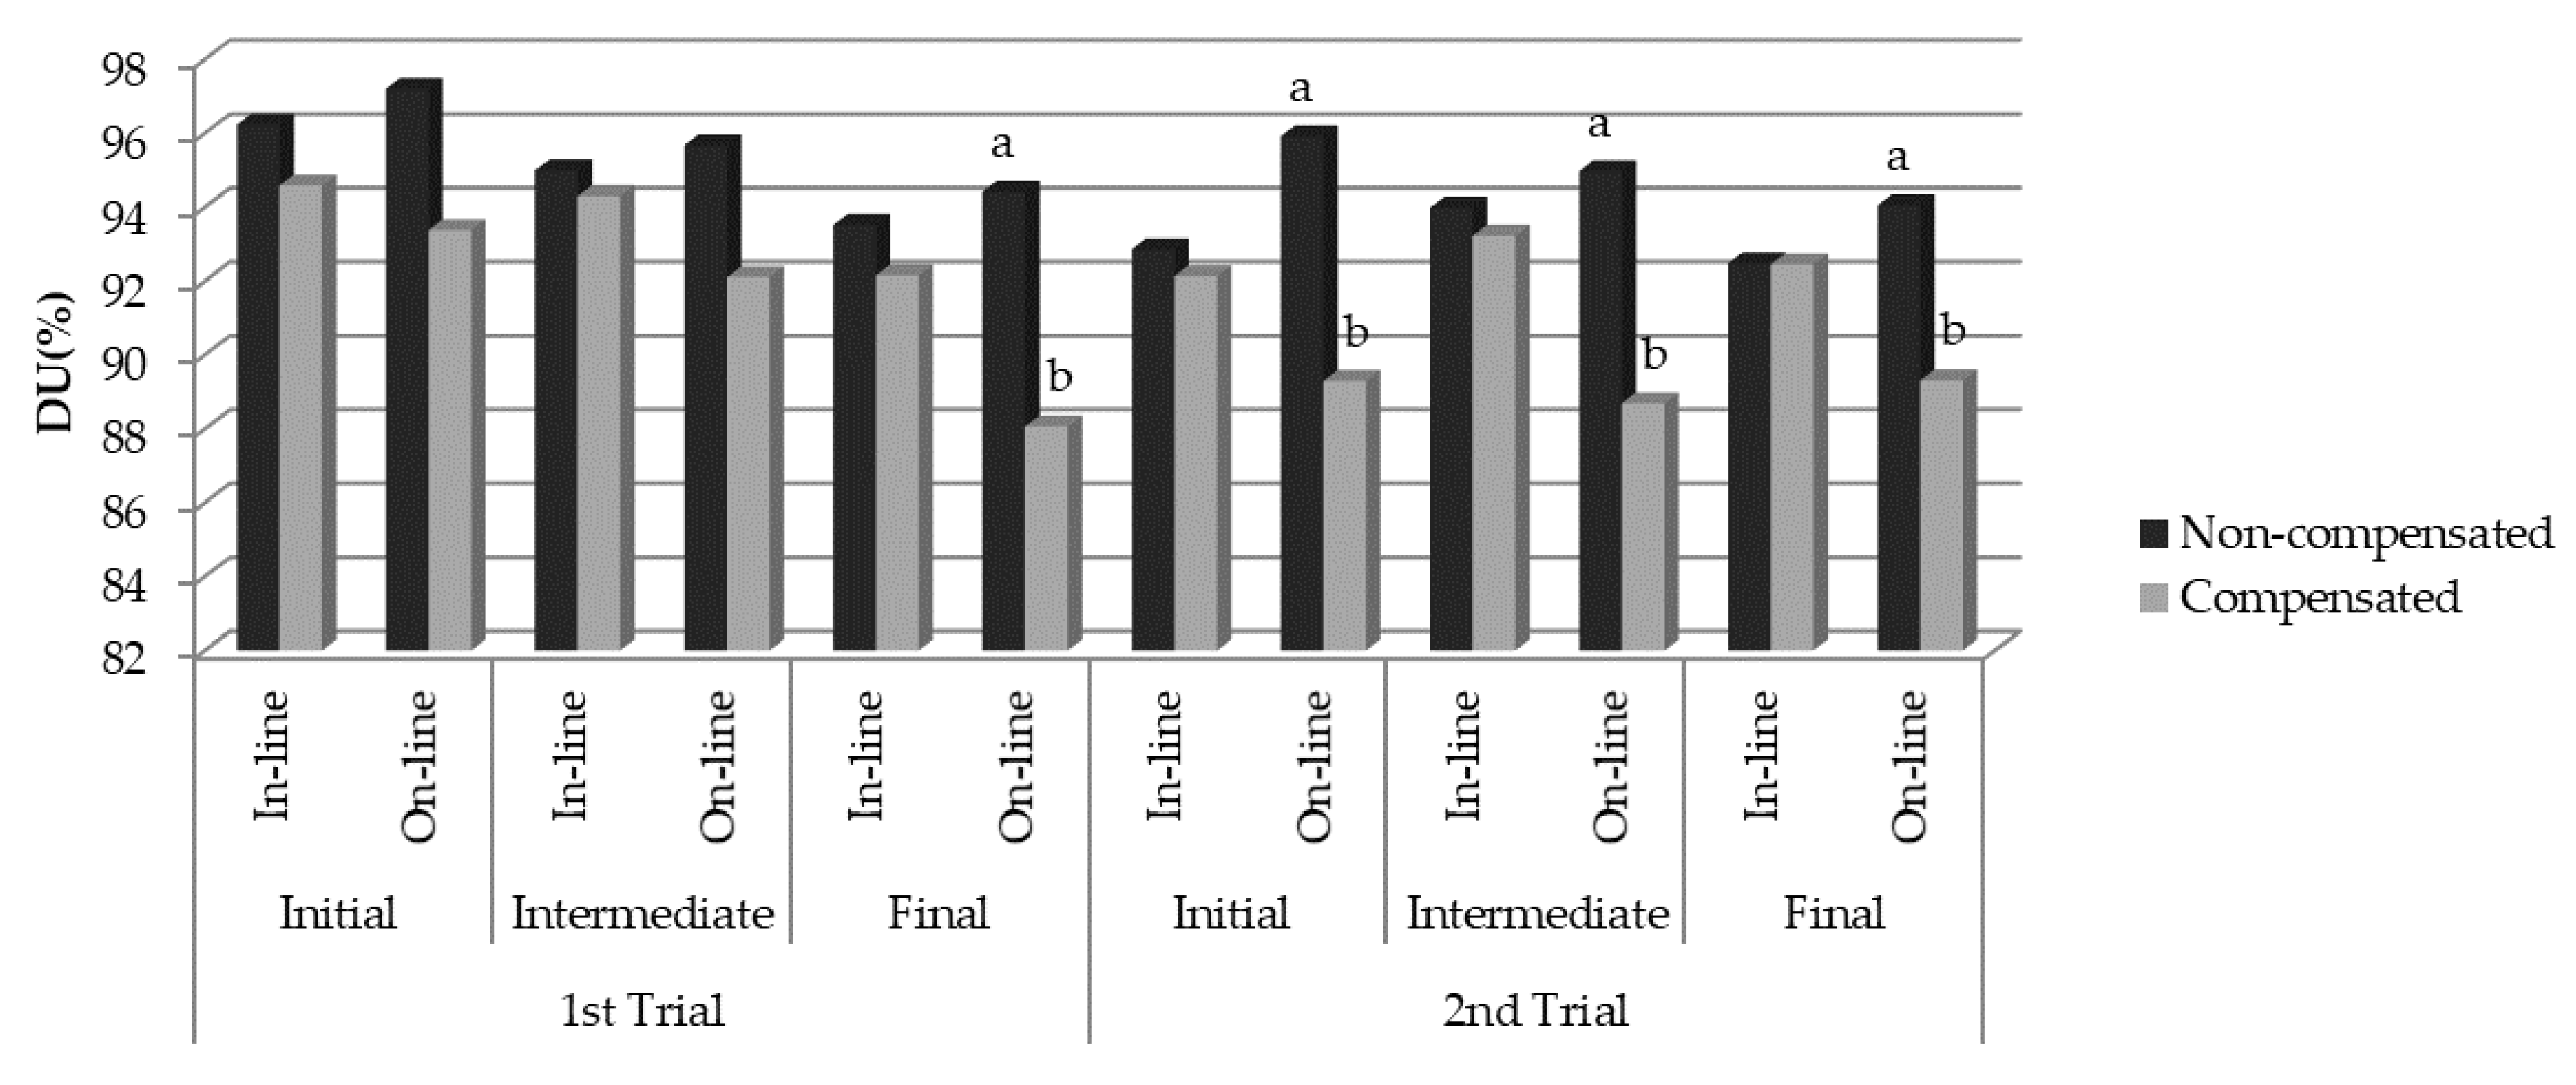
In-line and on-line emitters encompass both pressure-compensating and non-compensating drippers. DU was also studied separately by type of insertion (in-line and on-line) and pressure compensating (compensating and non-compensating). The in-line models were not affected by pressure compensation, presenting a similar DU on each of the measurements. However, on-line emitters had a different response, with clear differences between pressure compensating and non-compensating in all measurements, obtaining smaller DU values in the emitters with pressure compensation (Figure 7).
3.2.2. Second Trial
At the start of the second trial, with improved irrigation-water quality and the same emitter as in the first trial, statistically significant differences in the flow coefficient of uniformity in the different emitting models were found (Figure 8). At the beginning of the second trial, 15 models of drippers showed an excellent (above 95%) uniformity distribution coefficient, 11 models of emitter presented a distribution uniformity coefficient (DU) above 85%, and only two had a DU value less than 85%, as for which all drippers could be classified as “excellent” and “good”, according to Merriam and Keller [40].
At the end of the second trial, the DU was, in most cases, similar to that obtained at the beginning, and significant differences were found between the different emitter models (Figure 8). Amongst the 38 tested emitter models, three showed a DU of less than 85%, and 14 continuous had a DU value greater than 95%.
When classifying the emitters with respect to the type of pipeline integration, we found significant differences at the end of the second trial (Figure 5). Inter-line emitters recorded the best DU throughout the irrigation period (between 94.3% and 94.5% for initial, intermediate, and final samplings), showing significant differences with in-line and on-line emitters at the end (Figure 5).
When comparing the DU values obtained at the beginning, with respect to those obtained at the end of the trial, we observed no significant differences, regardless of the type of insertion in the pipeline (Figure 5). The DU value remained stable throughout the irrigation season, between 94.3% and 94.5% for inter-line emitters, 91.9% and 93.6% for in-line, and 90.8% and 91.5% for on-line.
When emitters were grouped as pressure compensating or non-compensating, the same result observed at the end of the first trial was obtained, with pressure-compensating emitters having statistically significant lower DU during the whole trial (between 90.5% and 90.7% for pressure compensating and between 93.4% and 94.3% for non-compensating) (Figure 6).
As previously mentioned, in-line and on-line emitters include amongst them both pressure-compensating and non-compensating drippers. DU was studied separately by insertion type (in-line and on-line) and pressure compensation (compensating and non-compensating). Equally to the results obtained in the first trial, the in-line models were not affected by pressure compensation, presenting similar DU values on each one of the measurements. On-line emitters had a different response, with significant differences between pressure compensating and non-compensating in all measurements, obtaining lower DU values in the emitters with pressure compensation (Figure 7).
3.3. Emitter Clogging (CE)
3.3.1. First Trial
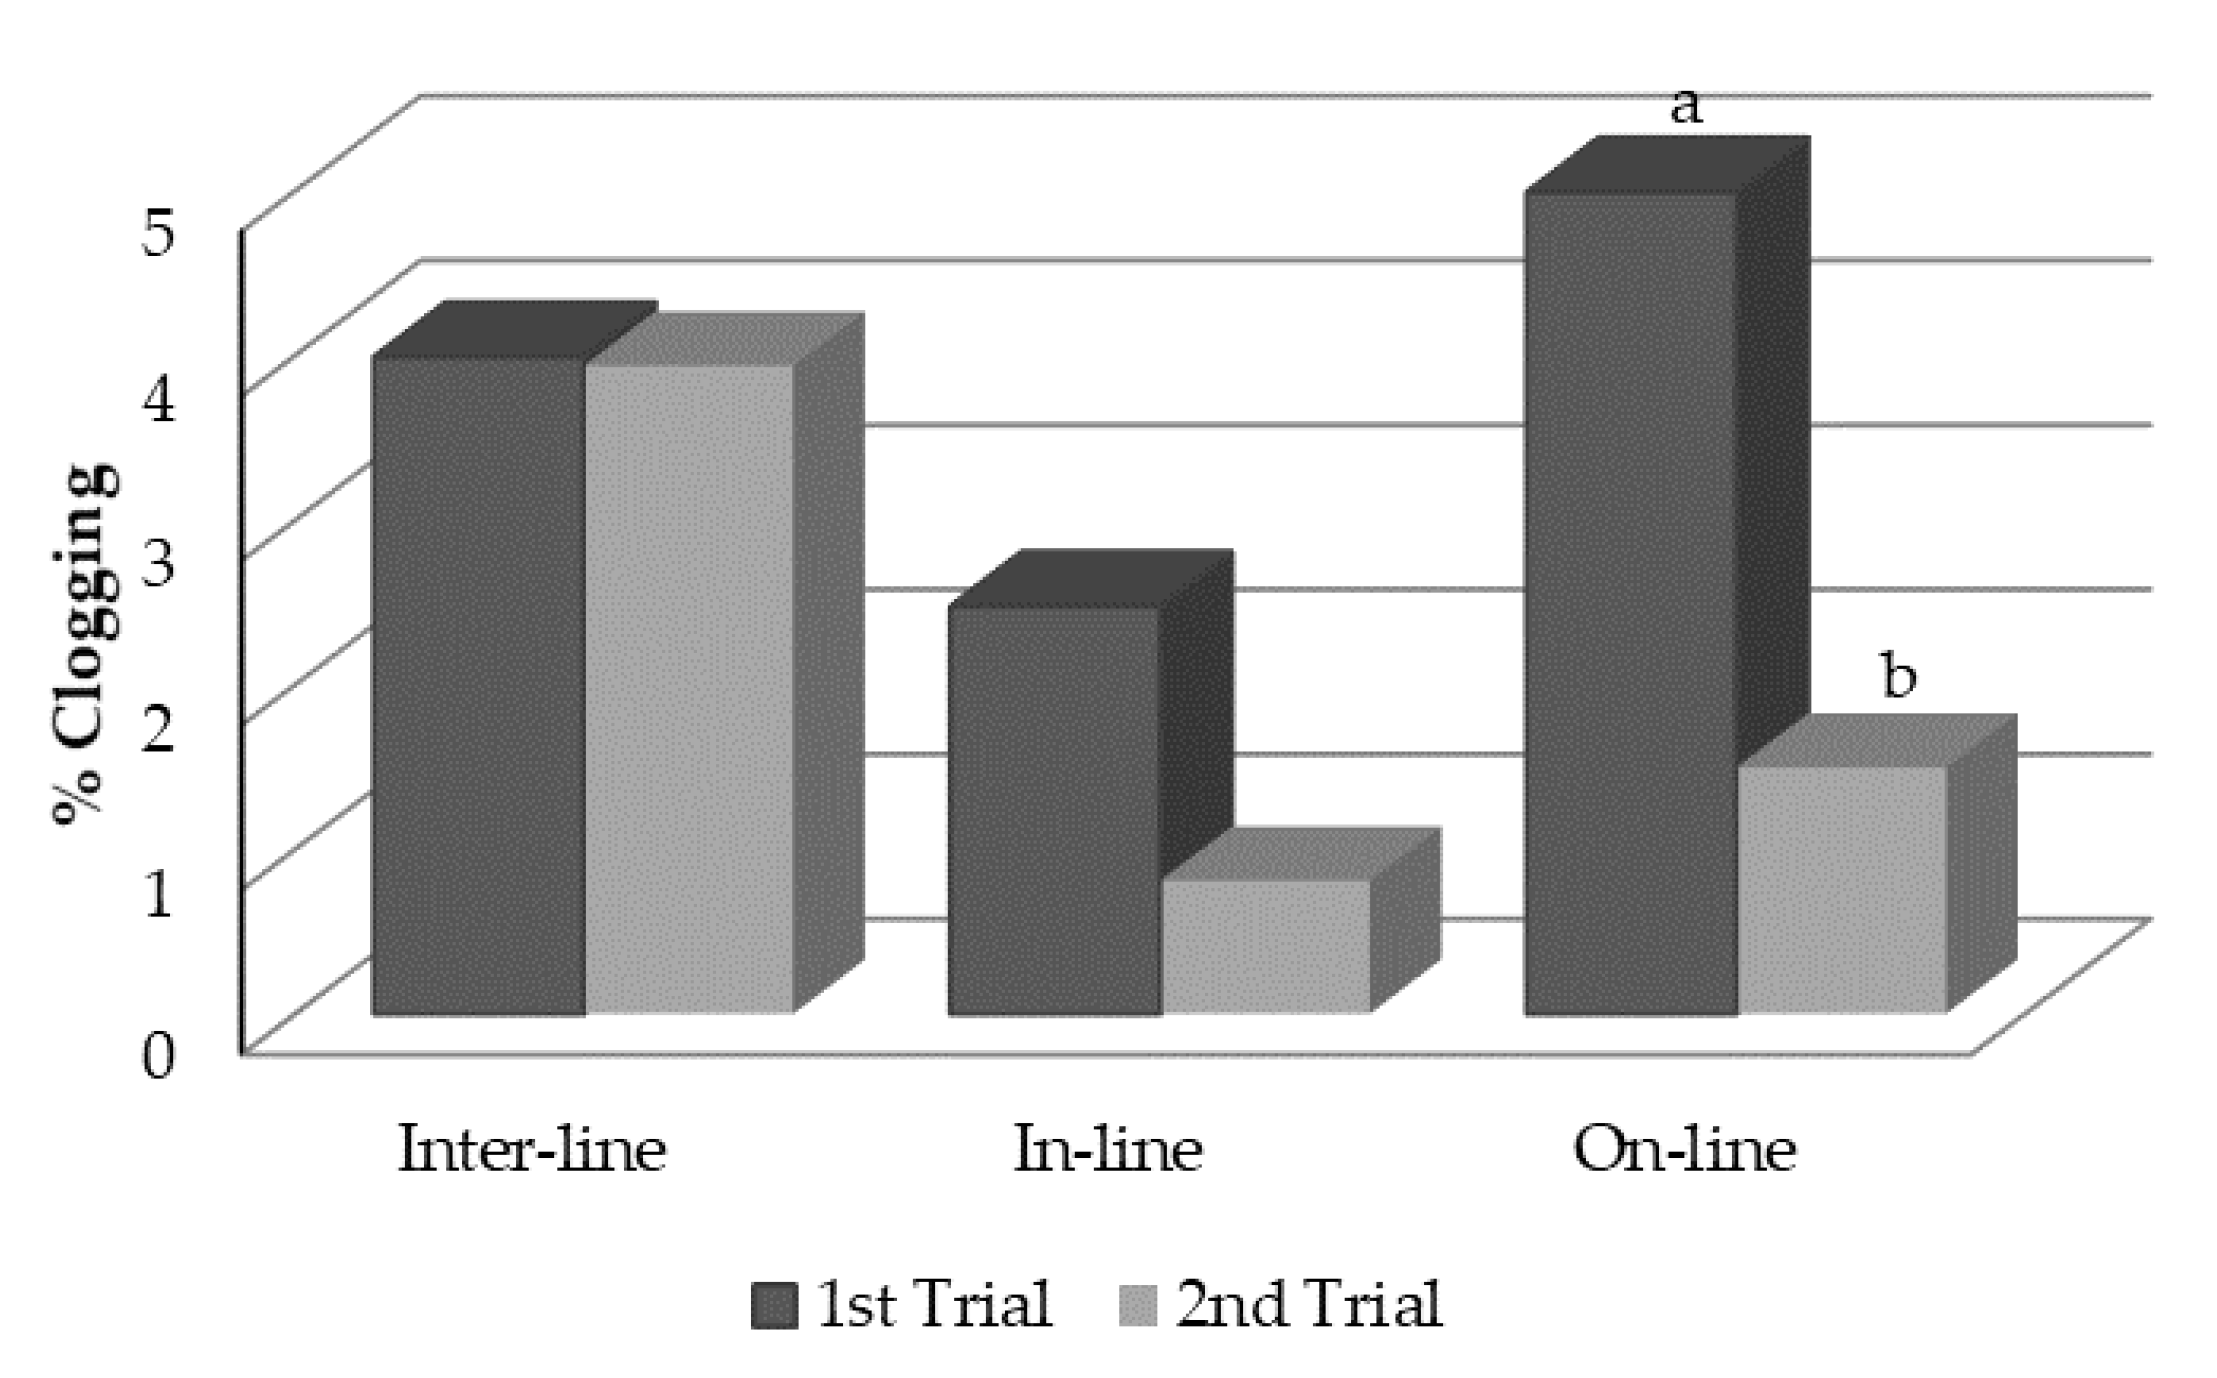
Emitter clogging was calculated as the percentage of discharge reduction. In the first trial, on-line emitters had a higher percentage of clogging (CE = 5.0%), followed by inter-line emitters (CE = 4.0%), being in-line emitters, which were lower CE (2.5%), although there were no statistically significant differences between them (Figure 9).
3.3.2. Second Trial
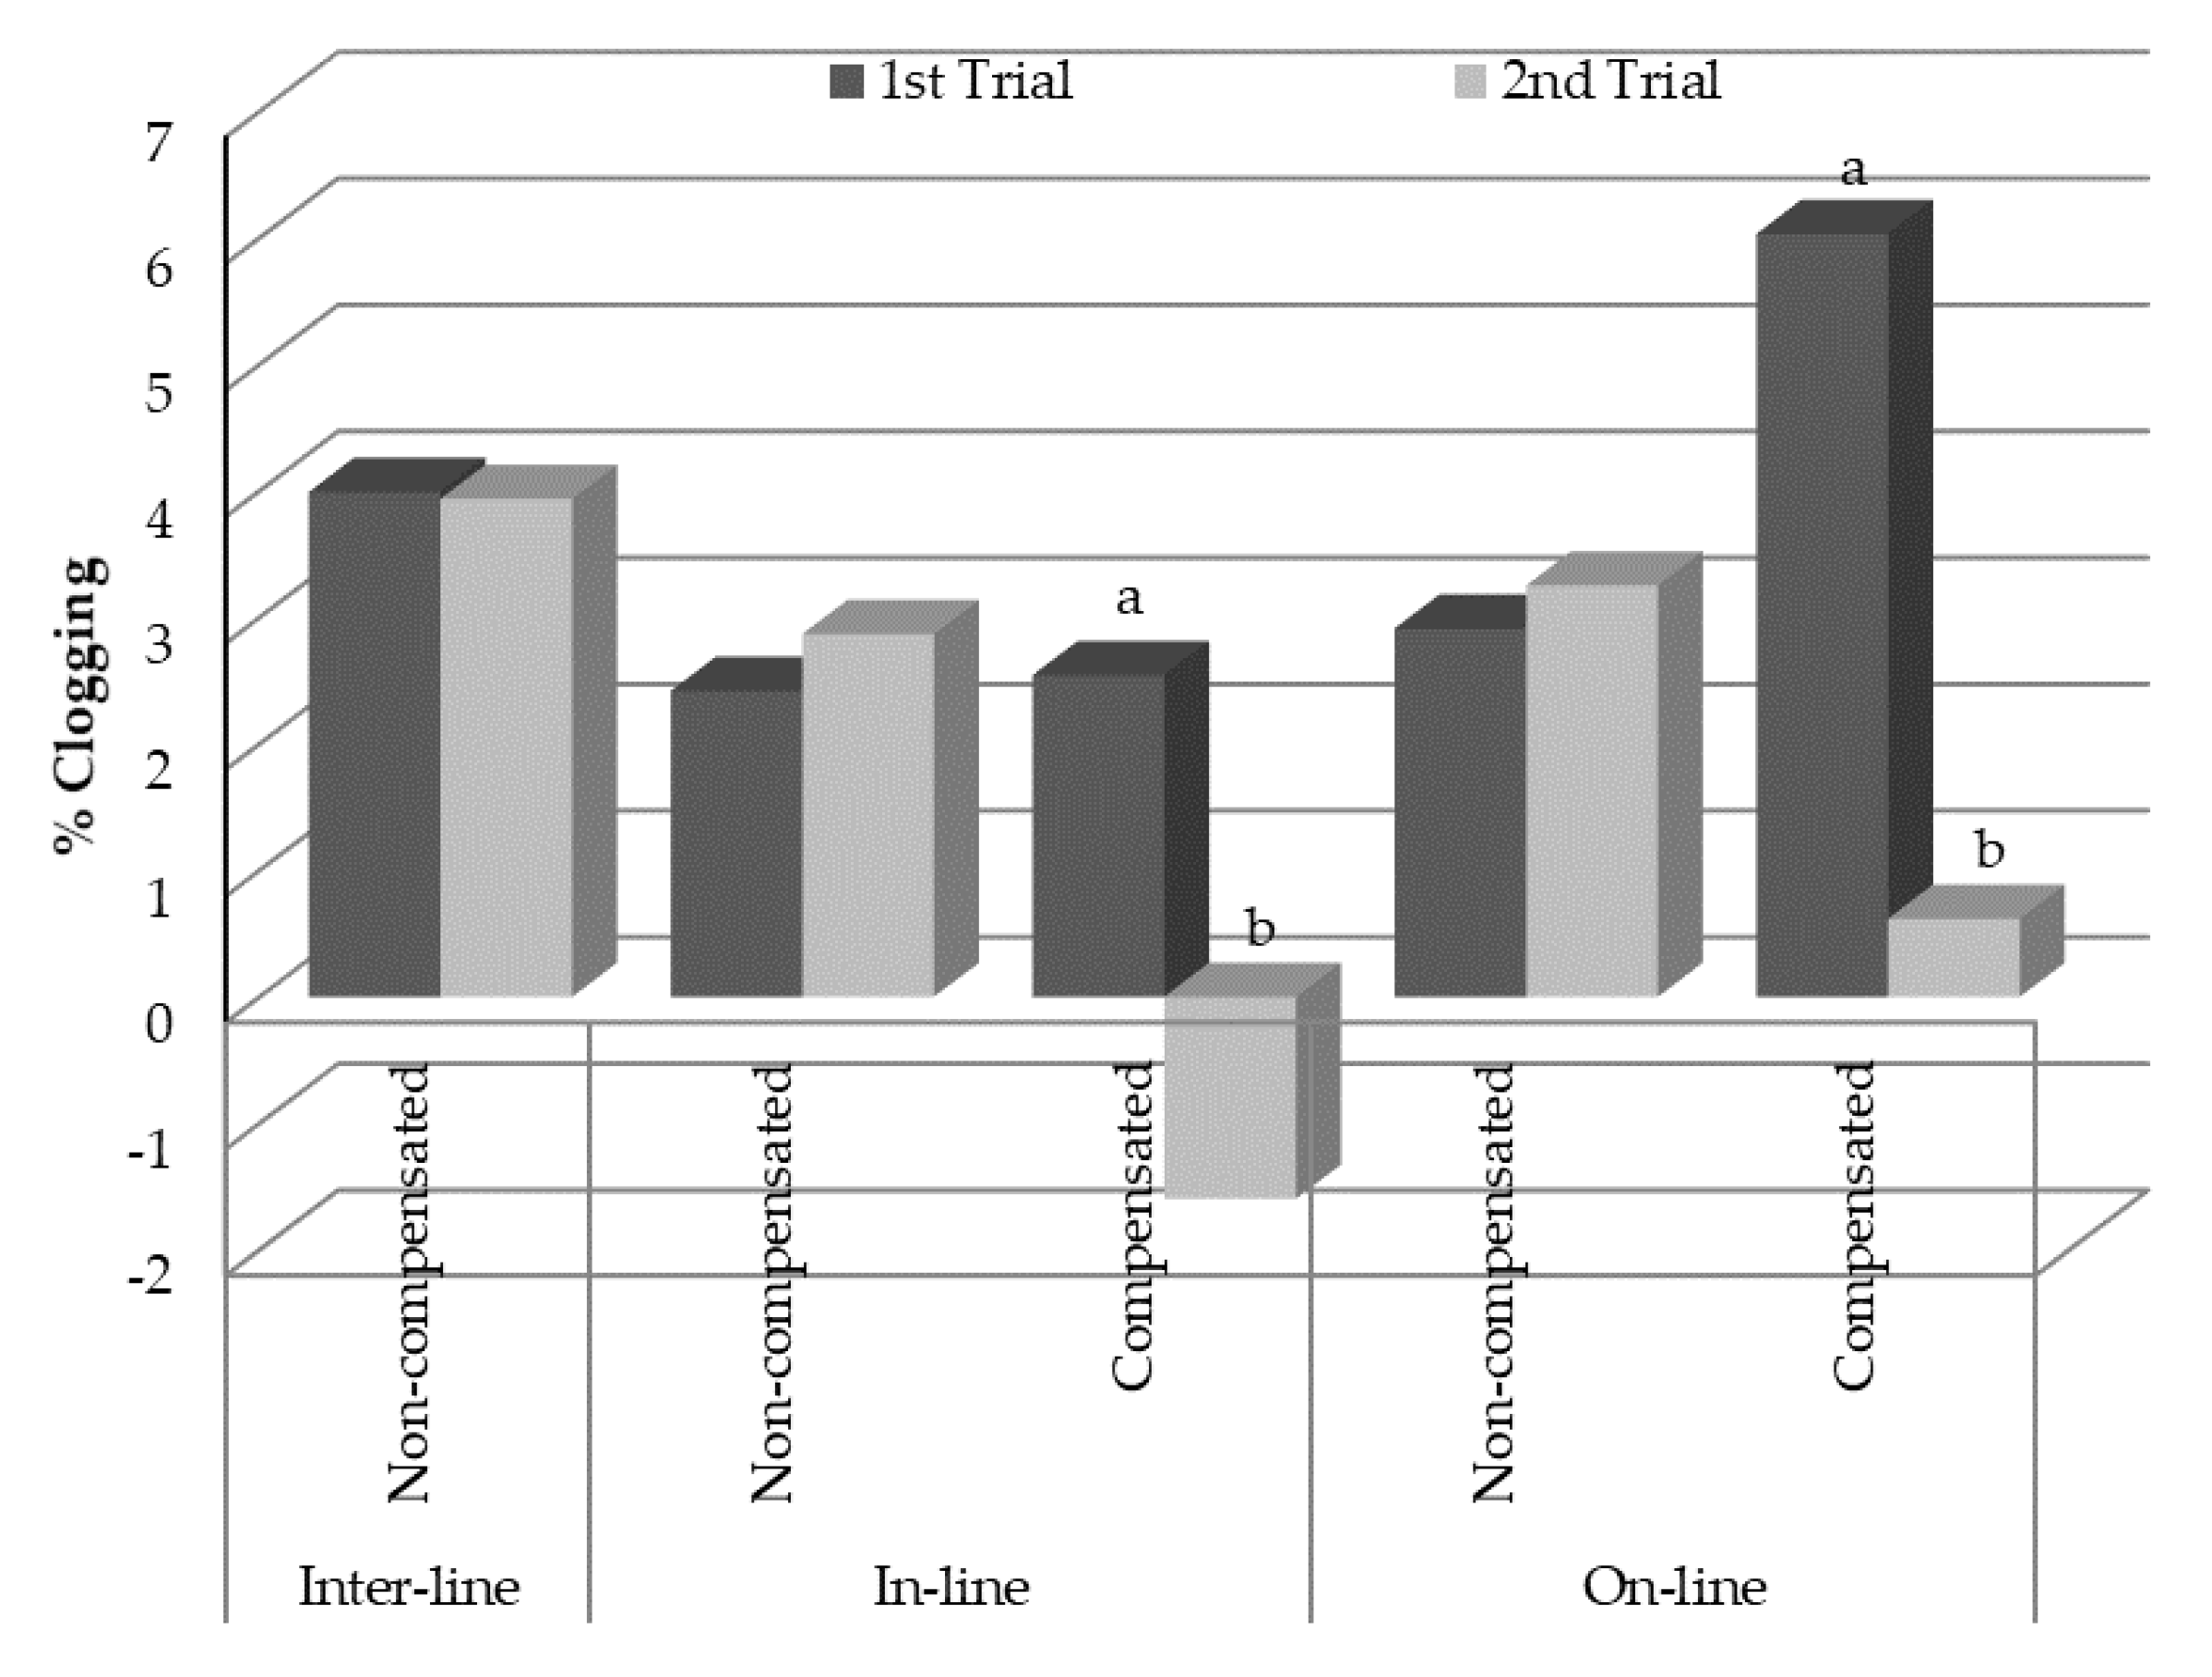
With respect to the CE in the second trial, inter-line emitters had similar values to those obtained during the first trial (Figure 9); however, in-line and on-line emitters showed lower average CE in the first trial, because the models with pressure compensation were included within each of the categories (Figure 11).
The CE exhibits different behavior depending on water quality, and in the first trial, on-line emitters presented a greater percentage of discharge reduction, followed by inter-line emitters and in-line emitters, which were the ones with lower values of CE. In the second-year trial, in-line emitters had the lowest CE values (0.8%), followed closely by on-line emitters (CE = 1.5%), whereas inter-line drippers presented the greatest CE values (3.9%).
By improving water quality, CE decreased in all emitter models, a decrease that was statistically significant in the on-line type (Figure 9). Notably, with the optimum water quality of the second trial, the CE value was lower for on-line emitters (5.0% in first trial vs. 1.5% in second trial).
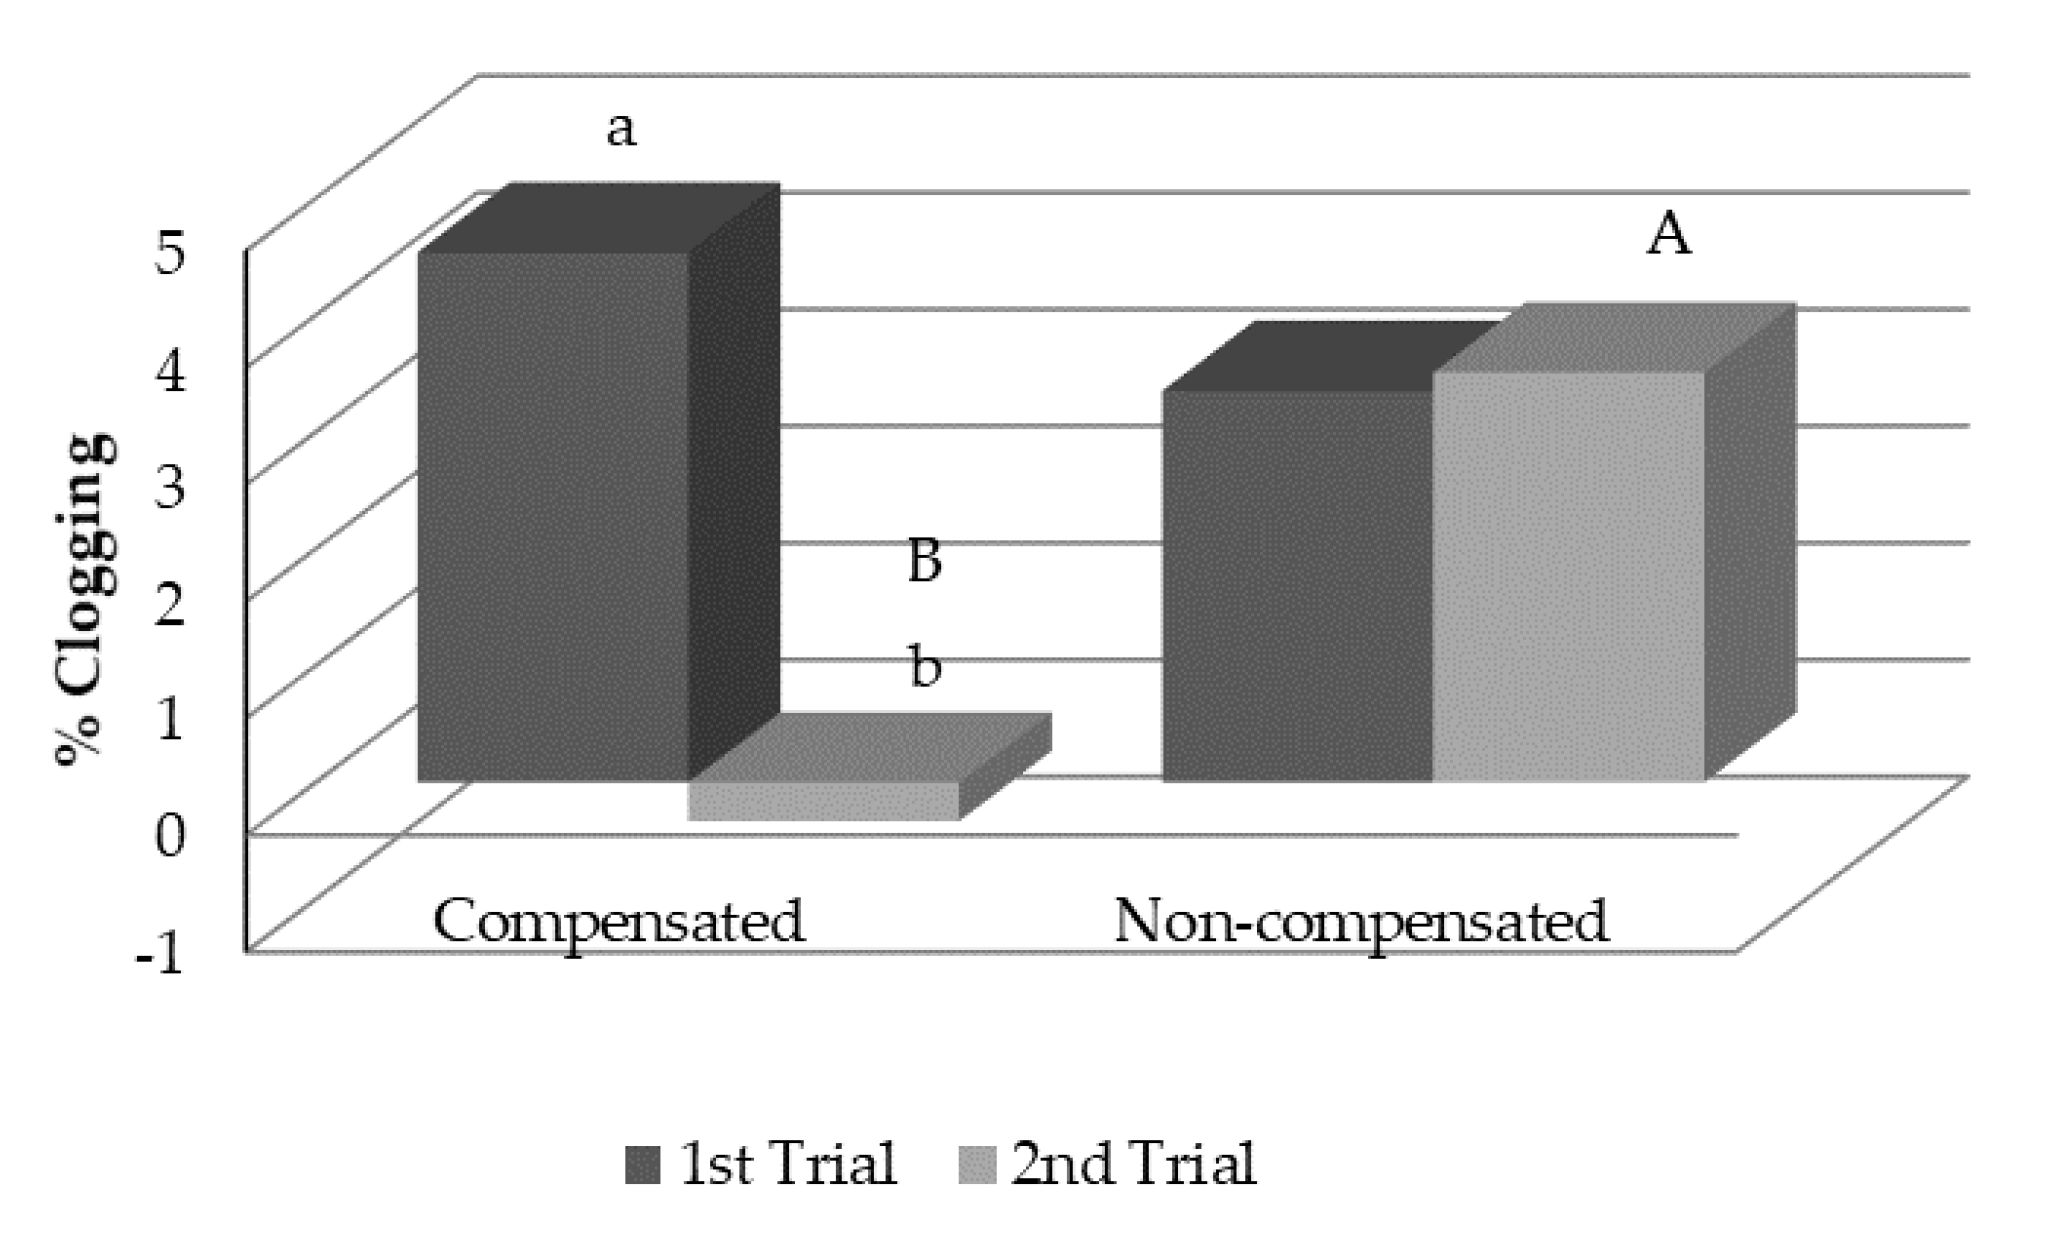
When we separated emitters by pressure compensation, no emitter models had similar CE values in the first- and second-season trials (Figure 10), regardless of the insertion into the pipeline (Figure 11). However, pressure-compensating emitter models had lower values of CE after the second season trial, reaching a negative value close to zero (Figure 11) and denoting some cleaning ability of these issuers, thanks to the use of improved water quality.
4. Discussion
4.1. Regarding Water Quality
The decrease in uniformity achieved in the first trial, in all the emitters, regardless of the type of insertion (inter-line, in-line, and on-line) and the compensation or not of flow, is in line with that obtained by other authors when using low-quality irrigation water, wastewater, or reclaimed water [41,42,43,44,45]. This is because wastewater intensifies the potential of microorganisms to develop and produce a biofilm layer on the internal surfaces of a micro-irrigation system. Biofilm formation can result in decreased or uneven discharge and emitter clogging [46]. Similarly, the decrease in uniformity registered in all the emitter models with the increase in the hours of irrigation with regenerated water also coincides with that obtained by other authors [34,35,36,47]. This is because biofilm formation is a biomass accumulation process that increases with the presence of regenerated water. The formation of the biofilm has different phases, with different structural characteristics, until the development of the biofilm, and there is a relationship between biomass accumulation and clogging in a drip irrigation system receiving reclaimed wastewater [46].
However, in the second trial, with improved reclaimed water quality, irrigation uniformity was maintained, showing the importance of water quality in the clogging processes and therefore in the uniformity, coinciding with what has been observed by other authors [41,42,44,48].
Therefore, clogging fluctuated, increasing as the hours of irrigation with regenerated water of worse quality increased and decreased when water quality was improved, coinciding with what was obtained by Ravina et al. [41].
The period of irrigation inactivity between trials (nine months) affected the state of the emitters, producing slight variations in the DU values observed at the end of the first trial, compared to the beginning of the second. During the shutdown period, the pipelines dry out completely, causing the death and disintegration of the biological colonies. This phenomenon may, on the one hand, reduce the incidence of clogging generated by these colonies installed in the emitters, but, on the other hand, it may generate new clogging, due to the accumulation of solid particles detached in the final sections of the pipelines. These results are in line with those obtained by Zhou et al. [49], who observed that the spacing of the irrigation frequency with regenerated water reduces to a lesser extent the uniformity of high-frequency irrigation, due to the effects of frequency on drip irrigation on the growth and detachment of biofilms inside the emitters.
4.2. Regarding Type of Emitter
In the first trial, on-line emitters had a higher percentage of flow reduction, also being those which showed less uniformity of flow distribution coefficient (DU). In-line emitters were better performers in terms of uniformity and clogging; however, they were not significantly different from inter-line models.
The greater obstruction and decrease in uniformity in the on-line emitters were due to the pressure-compensating emitter models. These results corroborate what was obtained by Gamri et al. [48], who evaluated a compensating model on-line versus two non-compensating models also on-line and concluded that compensated emitters seem to be more sensitive to clogging compared to non-compensated emitters. This may be because, when on-line pressure-compensating, the membranes (which produces the flow compensation effect) covered with biofilm stick to emitters’ inlets or outlets, preventing the flow from passing, as described and identified by Gamri et al. [50], in their research. Similar results had been found by Pinto et al. [51] for some models of pressure-compensating drippers, behavior attributed to the imbalance of their membrane.
On the other hand, the worst results in uniformity and clogging of on-line emitters (on-line emitters are also vortex emitters) with poorer-quality reclaimed water agree with those obtained by Capra and Scicolone [48]. These authors concluded that vortex emitters were more sensitive to clogging than labyrinth emitters, when irrigated with reclaimed water.
Nevertheless, the results obtained in the first trial disagree with those obtained by Ebrahimi et al. [50], who concluded that on-line emitters had higher effluence uniformity and lower discharge decrease (minor clogging) than an inline emitter, and this type of emitter was better used when wastewater was applied. The discrepancy in the results obtained in these trials with respect to those obtained by Ebrahimi et al. [52] may be associated with the different conditions of the experiments (emitter flow, quality of water used, number of models evaluated, number of issuers evaluated, manufacturers, or even with consideration of no-compensation or compensation emitters), as they only evaluate one online emitter model and one inline emitter model, because, as proved by the results obtained in this study and other research, all of these parameters had an influence on both distribution uniformity coefficient and percentage of emitter clogging.
As previously mentioned, the period of irrigation inactivity between trials affected the state of the emitters, producing slight variations in the DU values observed at the end of the first trial, compared to the beginning of the second. This effect is more pronounced in inter-line emitters that increase media uniformity by 2% (from 92 to 94%), and it also increases in on-line emitters by 1.5% (from 90% to 91.5%). This is caused by the complete drying of the pipelines, causing the death and disintegration of the biological colonies [46] that can cause a decrease in clogging and, therefore, an increase in uniformity.
Regarding clogging, it does not vary after the second trial in the non-compensated emitters, but it differs in the flow-compensated emitters. The flow-compensated emitters even presented negative values caused by the overflow observed more commonly in the compensating emitters, also coinciding with the results obtained by Ravina et al. [41]. When reclaimed-water quality was improved (second trial), pressure-compensating emitters presented the least degree of obstruction, results that agree with those obtained by Puig-Bargués et al. [53] for a trial with regenerated-water quality parameters similar to those used in the second trial.
5. Conclusions
Under the conditions of development of trials, we can conclude that not only does water quality have effects on irrigation uniformity and emitter clogging but also on the type of insertion into the pipeline, as well as the pressure-compensation nature of the emitters.
After an irrigation session with reclaimed water of the worst quality (first trial), irrigation uniformity was reduced in all emitter models, regardless of insertion type (inter-line, in-line, and on-line) and the compensation or not of flow. However, with improved-quality reclaimed water (second trial), irrigation uniformity was maintained, showing the importance of water quality in the clogging processes and, therefore, in uniformity. Therefore, clogging fluctuated, increasing as the hours of irrigation with regenerated water of worse quality increased, and decreasing when the quality of water improved.
With poorer reclaimed-water quality (first trial), on-line emitters had a higher percentage of flow reduction, being also those which showed less uniformity of flow distribution coefficient, due to the pressure-compensating emitter models.
The period of irrigation inactivity between trials has affected the state of the emitters, producing slight variations in the DU values observed at the end of the first trial, compared to the beginning of the second. This effect is more pronounced in inter-line emitters, which increase mean uniformity by 2% (from 92 to 94%), and also increase in on-line emitters, by 1.5% (from 90% to 91.5%).
By improving the quality of reclaimed water (second trial), pressure-compensating emitters presented the least degree of obstruction. These models showed some cleaning capacity, because their clogging was reduced in the second trial.
Author Contributions
Both authors contributed equally. All authors have read and agreed to the published version of the manuscript.
Funding
This research was funded by European Regional Development Fund (ERDF), grand number A1122062U0 and the Agricultural Research and Training Institute of Andalusia (IFAPA), under project: Technological Transfer for an Irrigation Sustainable. SAR, with code PP.TRA.TRA2019.006. The APC was funded by IFAPA.
Acknowledgments
We thank Nicholas Andrew Davies for the English language correction.
Conflicts of Interest
The authors declare no conflict of interest.
Abbreviations
The following abbreviations are used in this manuscript:
| Cv | Manufacturer’s Coefficient of Variation |
| Ee | Emitter equation |
| DU | Uniformity Distribution Coefficient |
| CE | Clogging of the Emitter |
References
- UNESDOC. Digital Library. Available online: https://unesdoc.unesco.org/ark:/48223/pf0000372985.locale=en (accessed on 12 April 2020).
- UNESCO. The Agenda 21 World Water Development Report 3: Water in a Changing World; World Water Assessment Programme; UNESCO: Paris, France, 2009. [Google Scholar]
- Evans, R.G. Microirrigacion; 24106 North Bunn Roas Prosser; Washington State University, Irrigated Agriculture Research and Extension Center: Washington, DC, USA, 2002. [Google Scholar]
- Contreras, J.I.; Alonso, F.; Cánovas, G.; Baeza, R. Irrigation management of greenhouse zucchini with different soil matric potential level. Agronomic and environmental effects. Agric. Water Manag. 2017, 183, 26–34. [Google Scholar] [CrossRef]
- Garcia-Caparros, P.; Contreras, J.I.; Baeza, R.; Segura, M.L.; Lao, M.T. Integral management of irrigation water in intensive horticultural systems of Almería. Sustainability 2017, 9, 2271. [Google Scholar] [CrossRef] [Green Version]
- Instituto Geográfico Nacional. Available online: https://www.ign.es/espmap/mapas_rural_bach/Rural_Mapa_06.htm (accessed on 12 April 2020).
- Corominas, J. Los Nuevos Planes Hidrológicos de las Cuencas Andaluzas; Observatorio del Agua de la Fundación Botín: Madrid, Spain, 2010. [Google Scholar]
- Pujol, J.; Duran-Ros, M.; Arbat, G.; Ramirez de Cartagena, F.; Puig-Bargues, J. Private micro-irrigation costs using reclaimed water. Span. J. Agric. Res. 2011, 9, 1120–1129. [Google Scholar] [CrossRef] [Green Version]
- BOE. Royal Decree 1620/2007, of December 7, by Establishing the Legal Regime Reuse of Treated Water; Boletín Oficial del Estado No. 294; BOE: Madrid, Spain, 2007. [Google Scholar]
- EUR-lex. Access to European Union Law. Available online: https://eur-lex.europa.eu/procedure/ES/2018_169?uri=PROCEDURE:2018_169 (accessed on 12 April 2020).
- García-Delgado, C.; Eymar, E.; Contreras, J.I.; Segura, M.L. Effects of fertigation with purified urban wastewater on soil and pepper plant (Capsicum annuum L.) production, fruit quality and pollutant contents. Span. J. Agric. Res. 2012, 10, 209–221. [Google Scholar] [CrossRef] [Green Version]
- Contreras, J.I.; Eymar, E.; Lopez, J.G.; Lao, M.T.; Segura, M.L. Influences of nitrogen and potassium fertigation on nutrient uptake, production, and quality of pepper irrigated with disinfected urban wastewater. Commun. Soil Sci. Plant Anal. 2013, 44, 767–775. [Google Scholar] [CrossRef]
- Contreras, J.I.; López, J.G.; Lao, M.T.; Eymar, E.; Segura, M.L. Dry-matter allocation and nutrient uptake dynamic in pepper plant irrigated with recycled water by different nitrogen and potassium rate. Commun. Soil Sci. Plant Anal. 2013, 44, 758–766. [Google Scholar] [CrossRef]
- Baeza, R.; Gavilán, P.; Del Castillo, N.; Berenguel, P.; López, J.G. Programa de evaluación y asesoramiento en instalaciones de riego en invernadero con uso de dos fuentes distintas de agua: Subterránea y regenerada. In Proceedings of the XXVIII Congreso Nacional de Riegos, León, Spain, 15–17 June 2010; pp. 111–112. [Google Scholar]
- Baeza, R.; Cánovas, G.; Alonso, F.; Contreras, J.I. Evaluación de las instalaciones de riego en cultivos hortícolas intensivos del sureste de Andalucía. In El Agua en Andalucía. El agua, clave medioambiental y socioeconómica. Tomo II; SIAGA; Instituto Geológico y Minero de España: Málaga, Spain, 2015. [Google Scholar]
- Ravina, I.; Paz, E.; Sofer, Z.; Marm, A.; Schischa, A.; Sagi, G.; Yechialy, Z.; Lev, Y. Control of clogging in drip irrigation with stored treated municipal sewage effluent. Agric. Water Manag. 1997, 33, 127–137. [Google Scholar] [CrossRef]
- Li, J.; Chen, L.; Li, Y. Comparison of clogging in drip emitters during application of sewage effluent and groundwater. Trans ASABE 2009, 52, 1203–1211. [Google Scholar] [CrossRef]
- Gilbert, R.G.; Nakayama, F.S.; Bucks, D.A.; French, O.F.; Adamson, K.C. Trickle irrigation: Emitter clogging and flow problems. Agric. Water Manag. 1981, 3, 159–178. [Google Scholar] [CrossRef]
- Pitts, D.J.; Haman, D.Z.; Smajstrla, A.G. Causes and prevention of emitter plugging in micro irrigation systems. Bull.-Fla. Coop. Ext. Serv. 1990, 258. [Google Scholar]
- Coelho, R.D.; Resende, R.S. Biological Clogging of nEtafim’s Drippers and Recovering Process through Chlorination Impact Treatment; ASAE Paper Number: 012231; ASAE: Sacramento, CA, USA, 2001. [Google Scholar]
- Gilbert, R.G.; Ford, H.W. Operational principles emitter clogging. In Trickle Irrigation for Crop Production: Design, Operation and Management; Nakayama, F.S., Bucks, D.A., Eds.; Elsevier: Amsterdam, The Netherlands, 1986; pp. 142–163. [Google Scholar]
- Guan, H.; Li, J.; Li, Y. Effects of drip system uniformity and irrigation amount on cotton yield and quality under arid conditions. Agric. Water Manag. 2013, 124, 37–51. [Google Scholar] [CrossRef]
- Wang, Z.; Li, J.; Li, Y. Effects of drip system uniformity and nitrogen application rate on yield and nitrogen balance of spring maize in the North China Plain. Field Crops Res. 2014, 159, 10–20. [Google Scholar] [CrossRef]
- Pérez-Ortolá, M.; Daccache, A.; Hess, T.M.; Knox, J.W. Simulating impacts of irrigation heterogeneity on onion (Allium cepa L.) yield in a humid climate. Irrig. Sci. 2015, 33, 1–14. [Google Scholar] [CrossRef]
- Muñoz, C.E. Efecto de la Uniformidad de Riego sobre la Productividad del Cultivo de Calabacín en Invernadero. Master’s Thesis, Universidad de Almería, Almería, Spain, 2018. [Google Scholar]
- Mateos, L.; Mantovani, E.C.; Villalobos, F.J. Cotton response to non-uniformity of conventional sprinkler irrigation. Irrig. Sci. 1997, 17, 47–52. [Google Scholar] [CrossRef]
- Bordovsky, J.P.; Porter, D.O. Effect of subsurface drip irrigation system uniformity on cotton production in the Texas High Plains. Appl. Eng. Agric. 2008, 24, 465–472. [Google Scholar] [CrossRef]
- Zhao, W.; Li, J.; Li, Y.; Yin, J. Effects of drip system uniformity on yield and quality of Chinese cabbage heads. Agric. Water Manag. 2012, 110, 118–128. [Google Scholar] [CrossRef]
- Adin, A.; Sacks, M. Dripper-clogging factors in wastewater irrigation. J. Irrig. Drain. Eng. 1991, 117, 813–826. [Google Scholar] [CrossRef]
- Zheng, Y.Q. Some advice on the application of micro irrigation. Beijing Water Technol. 1993, 4, 23–24. [Google Scholar]
- Feng, J.; Li, Y.; Wang, W.; Xue, S. Effect of optimization forms of flow path on emitter hydraulic and anti-clogging performance in drip irrigation system. Irrig. Sci. 2018, 36, 37–47. [Google Scholar] [CrossRef]
- Zhangzhong, L.; Yang, P.; Li, Y.; Ren, S. Effects of flow path geometrical parameters on flow characteristics and hydraulic performance of drip irrigation emitters. Irrig. Drain. 2016, 65, 426–438. [Google Scholar] [CrossRef]
- Zhou, B.; Li, Y.; Song, P.; Xu, Z.; Bralts, V. A kinetic model for biofilm growth inside non-PC emitters under reclaimed water drip irrigation. Agric. Water Manag. 2016, 168, 23–34. [Google Scholar] [CrossRef]
- Pei, Y.; Li, Y.; Liu, Y.; Zhou, B.; Shi, Z.; Jiang, Y. Eight emitters clogging characteristics and its suitability under on-site reclaimed water drip irrigation. Irrig. Sci. 2014, 32, 141–157. [Google Scholar] [CrossRef]
- Bounoua, S.; Tomas, S.; Labille, J.; Molle, B.; Granier, J.; Haldenwang, P.; Izzati, S.N. Understanding physical clogging in drip irrigation: In situ, in-lab and numerical approaches. Irrig. Sci. 2016, 34, 327–342. [Google Scholar] [CrossRef]
- Han, S.; Li, Y.; Zhou, B.; Liu, Z.; Feng, J.; Xiao, Y. An in-situ accelerated experimental testing method for drip irrigation emitter clogging with inferior water. Agric. Water Manag. 2019, 212, 136–154. [Google Scholar] [CrossRef]
- Baeza, R.; Contreras, J.I.; Martin, F.; Zapata, A.; López, J.G. Estudio prospectivo de los emisores de riego localizado instalados en la zona regable del Bajo Andarax con aguas residuales urbanas regenerada. In Proceedings of the XXX Congreso Nacional de Riegos, Albacete, Spain, 12–14 June 2012; pp. 89–90. [Google Scholar]
- Lorenzo, P.; Sánchez-Guerrero, M.C.; Medrano, E.; Garcia, M.L.; Caparros, I.; Coelho, G.; Giménez, M. Climate control in the summer season: A comparative study of external mobile shading and fog system. Act. Hort. 2004, 659, 189–194. [Google Scholar] [CrossRef]
- Fernández, M.D.; Bonachela, S.; Orgaz, F.; Thompson, R.; López, J.C.; Granados, M.R.; Gallardo, M.; Fereres, E. Measurement and estimation of plastic greenhouse reference evapotranspiration in a Mediterranean climate. Irrig. Sci. 2010, 28, 497–509. [Google Scholar] [CrossRef] [Green Version]
- Merriam, J.L.; Keller, J. Farm Irrigation System Evaluation: A Guide for Management; UTAH State University: Logan, UT, USA, 1978. [Google Scholar]
- Ravina, I.; Paz, E.; Sofer, Z.; Marcu, A.; Shisha, A.; Sagi, G. Control of emitter clogging in drip irrigation with reclaimed wastewater. Irrig. Sci. 1992, 13, 129–139. [Google Scholar] [CrossRef]
- Capra, A.; Scicolone, B. Management of emitter clogging with municipal wastewater. In Wastewater Management for Irrigation: Principles and Practices; Goyal, M.R., Tripathi, V.K., Eds.; CRC Press: Boca Raton, FL, USA, 2016; Volume 4, pp. 81–96. [Google Scholar]
- Lili, Z.; Yang, P.; Ren, S.; Li, Y.; Liu, Y.; Xia, Y. Chemical clogging of emitters and evaluation of their suitability for saline water drip irrigation. Irrig. Drain. 2016, 65, 439–450. [Google Scholar] [CrossRef]
- Zhou, B.; Li, Y.; Song, P.; Zhou, Y.; Yu, Y.; Bralts, V. Anti-clogging evaluation for drip irrigation emitters using reclaimed water. Irrig. Sci. 2017, 35, 181–192. [Google Scholar] [CrossRef]
- Baeza, R.; Contreras, J.I.; Cánovas, G.; Alonso, F.; Reyes-Requena, R.; Roldán-Cañas, J.; Moreno-Pérez, M.F. Study of the uniformity of emitters in drip irrigation using regenerated wastewater under different management practices. In Geophysical Research Abstracts; EGU General Assembly: Vienna, Austria, 2019; Volume 21. [Google Scholar]
- Yan, D.; Yang, P.; Rowan, M.; Ren, S.; Pitts, D. Biofilm accumulation and structure in the flow path of drip emitters using reclaimed wastewater. Trans. ASABE 2010, 53, 751–758. [Google Scholar] [CrossRef] [Green Version]
- Solé-Torres, C.; Duran-Ros, M.; Arbat, G.; Pujol, J.; Ramírez de Cartagena, F.; Puig-Bargués, J. Assessment of Field Water Uniformity Distribution in a Microirrigation System Using a SCADA System. Water 2019, 11, 1346. [Google Scholar] [CrossRef] [Green Version]
- Capra, A.; Scicolone, B. Recycling of poor quality urban wastewater by drip irrigation systems. J. Clean Prod. 2007, 15, 1529–1534. [Google Scholar] [CrossRef]
- Zhou, B.; Li, Y.; Liu, Y.; Xu, F.; Pei, Y.; Wang, Z. Effect of drip irrigation frequency on emitter clogging using reclaimed water. Irrig. Sci. 2015, 33, 221–234. [Google Scholar] [CrossRef]
- Gamri, S.; Soric, A.; Tomas, S.; Molle, B.; Roche, N. Biofilm development in micro-irrigation emitters for wastewater reuse. Irrig. Sci. 2014, 32, 77–85. [Google Scholar] [CrossRef]
- Pinto, M.F.; Molle, B.; Alves, D.G.; Ait-Mouheb, N.; Camargo, A.P.D.; Frizzone, J.A. Flow rate dynamics of pressure-compensating drippers under clogging effect. Rev. Bras. Eng. Agríc. Ambient. 2017, 21, 304–309. [Google Scholar] [CrossRef] [Green Version]
- Ebrahimi, H.; Hamzee, G.H.; Farsheh, T.A.; Nazarjani, M. Evaluation of emitter clogging in trickle irrigation with wastewater. J. Basic Appl. Sci. Res. 2012, 2, 5288–5291. [Google Scholar]
- Puig-Bargues, J.; Arbat, G.; Elbana, M.; Duran-Ros, M.; Barragán, J.; De Cartagena, F.R.; Lamm, F.R. Effect of flushing frequency on emitter clogging in microirrigation with effluents. Agric. Water Manag. 2010, 97, 883–891. [Google Scholar] [CrossRef] [Green Version]
Figure 1.
Diagram (a) and image (b) of the test set.

Figure 2.
Diagram of the micro-irrigation system. The basic experimental unit was a pipeline with 31 emitters separated by 0.5 m. The blocks were established based on the proximity to the water inlet (B1 the closest; B3 the farthest). In each block, there were 38 basic experimental units, one per emitter model (treatment). The distribution of treatments in the block was random.

Figure 3.
Sampling tables designed to be moved horizontally, with an individual capacity of 16 volume measurements.
Figure 3.
Sampling tables designed to be moved horizontally, with an individual capacity of 16 volume measurements.

Figure 4.
Initial (DU i) (a) and final (DU f) (b) distribution of flow uniformity coefficient, obtained in the first trial for the 38 models of drippers analyzed. Mean values and least significant difference interval (LSD) at 95% are represented.
Figure 4.
Initial (DU i) (a) and final (DU f) (b) distribution of flow uniformity coefficient, obtained in the first trial for the 38 models of drippers analyzed. Mean values and least significant difference interval (LSD) at 95% are represented.


Figure 5.
Initial, intermediate, and final distribution uniformity coefficient (DU) of the different emitter models analyzed, depending on the type of insertion of the dripper in the pipeline, in the first and second trials. Columns marked with different lowercase letters denote statistically significant differences between types of insertion of the dripper in the pipeline. Columns with different uppercase letters indicate statistically significant differences between sampling dates.

Figure 6.
Initial, intermediate, and final distribution uniformity coefficient (DU) of the different emitter models analyzed, depending on pressure compensating or non-compensating in the first and second trials. Columns marked with different lowercase letters denote significant differences between pressure-compensating or non-compensating emitters. Columns with different uppercase letters indicate statistically significant differences between sampling dates.

Figure 7.
Initial, intermediate, and final distribution uniformity coefficient (DU) of the different emitter models analyzed, depending on the type of insertion of the dripper in the pipeline and capacity of pressure compensation or not, in the first and second trials. Columns marked with different lowercase letters denote significant differences between pressure-compensating or non-compensating emitters.

Figure 8.
Initial (DU i) (a) and final (DU f) (b) flow distribution uniformity coefficient, obtained in the second trial for the 38 models of drippers analyzed. Mean values and least significant difference interval (LSD) at 95% are represented.
Figure 8.
Initial (DU i) (a) and final (DU f) (b) flow distribution uniformity coefficient, obtained in the second trial for the 38 models of drippers analyzed. Mean values and least significant difference interval (LSD) at 95% are represented.

Figure 9.
Percentage of clogging of the different models analyzed, depending on the type of insertion of the dripper in the pipeline, in the first and second trials. Columns with different lowercase letters indicate significant differences between trials.
Figure 9.
Percentage of clogging of the different models analyzed, depending on the type of insertion of the dripper in the pipeline, in the first and second trials. Columns with different lowercase letters indicate significant differences between trials.

Figure 10.
Percentage of clogging of the different models analyzed, depending on the capacity of compensating the pressure or not in the first and second trials. Columns with different lowercase letters indicate significant differences between trials. Columns with different uppercase letters indicate significant differences between pressure compensating or non-compensating.

Figure 11.
Percentage of clogging of the different models analyzed, depending on the type of insertion of the dropper in the pipeline and the capacity of compensating the pressure or not, in the first and second trials. Columns with different lowercase letters indicate significant differences between trials.


Table 1.
Emitter models analyzed.
| N 1 | Commercial Name | Manufacturer | Pipeline Insertion | Pressure Compensation | Emitter Equation 2 (Q = k Hx) | Manufacturer’s Coefficient of Variation (Cv) |
|---|---|---|---|---|---|---|
| 1 | JainEmitter | NaanDanJain Ibérica | On-line | Non-compensated | Q = 4.2358 H 0.482271 | 0.03 |
| 2 | Twin DropsAdvanced | Mondragon Soluciones | On-line | Non-compensated | Q = 3.98369 H 0.388491 | 0.01 |
| 3 | Key Orvel | ExtrulineSystems | On-line | Compensated | Q = 4.75822 H 0.153382 | 0.06 |
| 4 | Interline 12 | ExtrulineSystems | Inter-line | Non-compensated | Q = 3.40393 H 0.51944 | 0.03 |
| 5 | Demountable perforated | Hidroten | On-line | Non-compensated | Q = 4.17937 H 0.506763 | 0.02 |
| 6 | MB Escober GE3 | Marbroer | On-line | Compensated | Q = 3.19962 H −0.0745321 | 0.03 |
| 7 | ADO Metzerplas | ExtrulineSystems | On-line | Compensated | Q = 4.52218 H −0.0141037 | 0.05 |
| 8 | Interline 12 | Amacom | Inter-line | Non-compensated | Q = 3.26627 H 0.521201 | 0.03 |
| 9 | MB Escober GAE3 | Marbroer | On-line | Compensated | Q = 2.96746 H −0.0362502 | 0.01 |
| 10 | Pinchado autocompensante | Hidroten | On-line | Compensated | Q = 4.36964 H 0.121575 | 0.07 |
| 11 | Interline 12 | Hidroten | Inter-line | Non-compensated | Q = 3.22552 H 0.487763 | 0.02 |
| 12 | NYA | Prima-Ram | Inter-line | Non-compensated | Q = 3.48498 H 0.535236 | 0.04 |
| 13 | PCJ | Netafim | On-line | Compensated | Q =3.13308 H −0.0166151 | 0.03 |
| 14 | Demountable conical | Hidroten | On-line | Non-compensated | Q = 3.75943 H 0.430399 | 0.04 |
| 15 | Acuario | Gestirriego | On-line | Compensated | Q = 5.14509 H 0.0318056 | 0.05 |
| 16 | J-Turboline | NaanDanJain Ibérica | In-line | Non-compensated | Q = 3.06543 H 0.474679 | 0.02 |
| 17 | PC-CNL | Netafim | On-line | Compensated | Q = 2.86158 H 0.0914451 | 0.03 |
| 18 | IT-S Interline | Marbroer | Inter-line | Non-compensated | Q = 3.36957 H 0.484893 | 0.07 |
| 19 | Hydrogol | Rivulis | In-line | Non-compensated | Q = 2.96926 H 0.490086 | 0.03 |
| 20 | NaanPC | NaanDanJain Ibérica | On-line | Compensated | Q = 3.27609 H 0.104834 | 0.06 |
| 21 | Starcomp | Comercial Agrícola de Riegos | In-line | Compensated | Q = 4.38239 H 0.0246694 | 0.06 |
| 22 | AGR | Azud | Inter-line | Non-compensated | Q = 3.15374 H 0.498693 | 0.02 |
| 23 | AmnomDrip | NaanDanJain Ibérica | In-line | Compensated | Q = 1.99524 H 0.0276302 | 0.02 |
| 24 | Interline 16 | Hidroten | Inter-line | Non-compensated | Q = 3.79157 H 0.513929 | 0.05 |
| 25 | LIN | ExtrulineSystems | In-line | Non-compensated | Q = 3.15383 H 0.480486 | 0.04 |
| 26 | Interline 16 | Comercial Agrícola de Riegos | Inter-line | Non-compensated | Q = 3.29897 H 0.472523 | 0.07 |
| 27 | Interline 16 | Amacom | Inter-line | Non-compensated | Q = 3.21973 H 0.498309 | 0.02 |
| 28 | PRO | Azud | In-line | Non-compensated | Q = 4.18379 H 0.473664 | 0.03 |
| 29 | Interline 16 | ExtrulineSystems | Inter-line | Non-compensated | Q = 3.77026 H 0.508657 | 0.05 |
| 30 | Megadrip | Mondragon Soluciones | In-line | Compensated | Q = 1.9288 H 0.0273114 | 0.03 |
| 31 | Tifdrip | NaanDanJain Ibérica | In-line | Non-compensated | Q = 3.70889 H 0.444218 | 0.03 |
| 32 | Irridrip | Mondragon Soluciones | In-line | Non-compensated | Q = 1.98437 H 0.474063 | 0.03 |
| 33 | Demountable interline | Hidroten | Inter-line | Non-compensated | Q = 4.02549 H 0.528695 | 0.03 |
| 34 | Interline 16 | NaanDanJain Ibérica | Inter-line | Non-compensated | Q = 3.60934 H 0.463382 | 0.06 |
| 35 | Cardrip | Comercial Agrícola de Riegos | In-line | Non-compensated | Q = 3.34583 H 0.485898 | 0.04 |
| 36 | IT-N Interline | Marbroer | Inter-line | Non-compensated | Q = 3.95558 H 0.454687 | 0.10 |
| 37 | Hydro-PC | Rivulis | In-line | Compensated | Q = 3.74919 H −0.00899392 | 0.01 |
| 38 | DripNet PC | Netafim | In-line | Compensated | Q = 3.33987 H −0.0207132 | 0.01 |
1 N = reference number. A reference number has been assigned to each emitter model, to process the data. The assigned number corresponds to the situation that each emitter had in block 1 of the experimental device, after the random distribution. 2 Q = q: emitter discharge (L h−1), H: pressure (kPa), k: coefficient characterizing dripper dimension, x: dripper flow regime coefficient (flow exponent).
Table 2.
Mean values of effluent physical and chemical parameters at first and second trials. N = 8 for 1st trial, and N = 7 for 2nd trial. N = number of samples tested.
Table 2.
Mean values of effluent physical and chemical parameters at first and second trials. N = 8 for 1st trial, and N = 7 for 2nd trial. N = number of samples tested.
| Parameter | 1st Trial | 2nd Trial | ||
|---|---|---|---|---|
| Average Value | Range | Average Value | Range | |
| Turbidity (NTU) | 11.3 | 9.4–16.0 | 4.2 | 3.8–4.4 |
| Suspended solids (mg L−1) | 12.5 | 9.7–15.5 | 3.8 | 3.5–4.0 |
| pH | 8.2 | 8.1–8.3 | 7.8 | 7.7–7.9 |
| Biochemical oxygen demand—BOD5 (mg O2 L−1) | 8.6 | 7.5–11.2 | <5 | <5 |
| Chemical oxygen demand—COD (mg O2 L−1) | 35.3 | 30.1–45.7 | 22.1 | 20.1–25.3 |
| Electrical conductivity—EC (dS m−1) | 1.92 | 1.83–2.03 | 1.89 | 1.80–1.93 |
Table 3.
Classification of distribution uniformity coefficient (DU) by Merriam and Keller [40].
Table 3.
Classification of distribution uniformity coefficient (DU) by Merriam and Keller [40].
| DU | Classification |
|---|---|
| >95% | Excellent |
| 85–95% | Good |
| 80–85% | Fair |
| 70–80% | Poor |
| <70% | Unacceptable |
© 2020 by the authors. Licensee MDPI, Basel, Switzerland. This article is an open access article distributed under the terms and conditions of the Creative Commons Attribution (CC BY) license (http://creativecommons.org/licenses/by/4.0/).
Share and Cite
MDPI and ACS Style
Baeza, R.; Contreras, J.I. Evaluation of Thirty-Eight Models of Drippers Using Reclaimed Water: Effect on Distribution Uniformity and Emitter Clogging. Water 2020, 12, 1463. https://doi.org/10.3390/w12051463
AMA Style
Baeza R, Contreras JI. Evaluation of Thirty-Eight Models of Drippers Using Reclaimed Water: Effect on Distribution Uniformity and Emitter Clogging. Water. 2020; 12(5):1463. https://doi.org/10.3390/w12051463
Chicago/Turabian StyleBaeza, Rafael, and Juana I. Contreras. 2020. "Evaluation of Thirty-Eight Models of Drippers Using Reclaimed Water: Effect on Distribution Uniformity and Emitter Clogging" Water 12, no. 5: 1463. https://doi.org/10.3390/w12051463
Note that from the first issue of 2016, this journal uses article numbers instead of page numbers. See further details here.