Evaluation of Long-Term Impacts of CO2 Leakage on Groundwater Quality Using Hydrochemical Data from a Natural Analogue Site in South Korea


Abstract
:1. Introduction
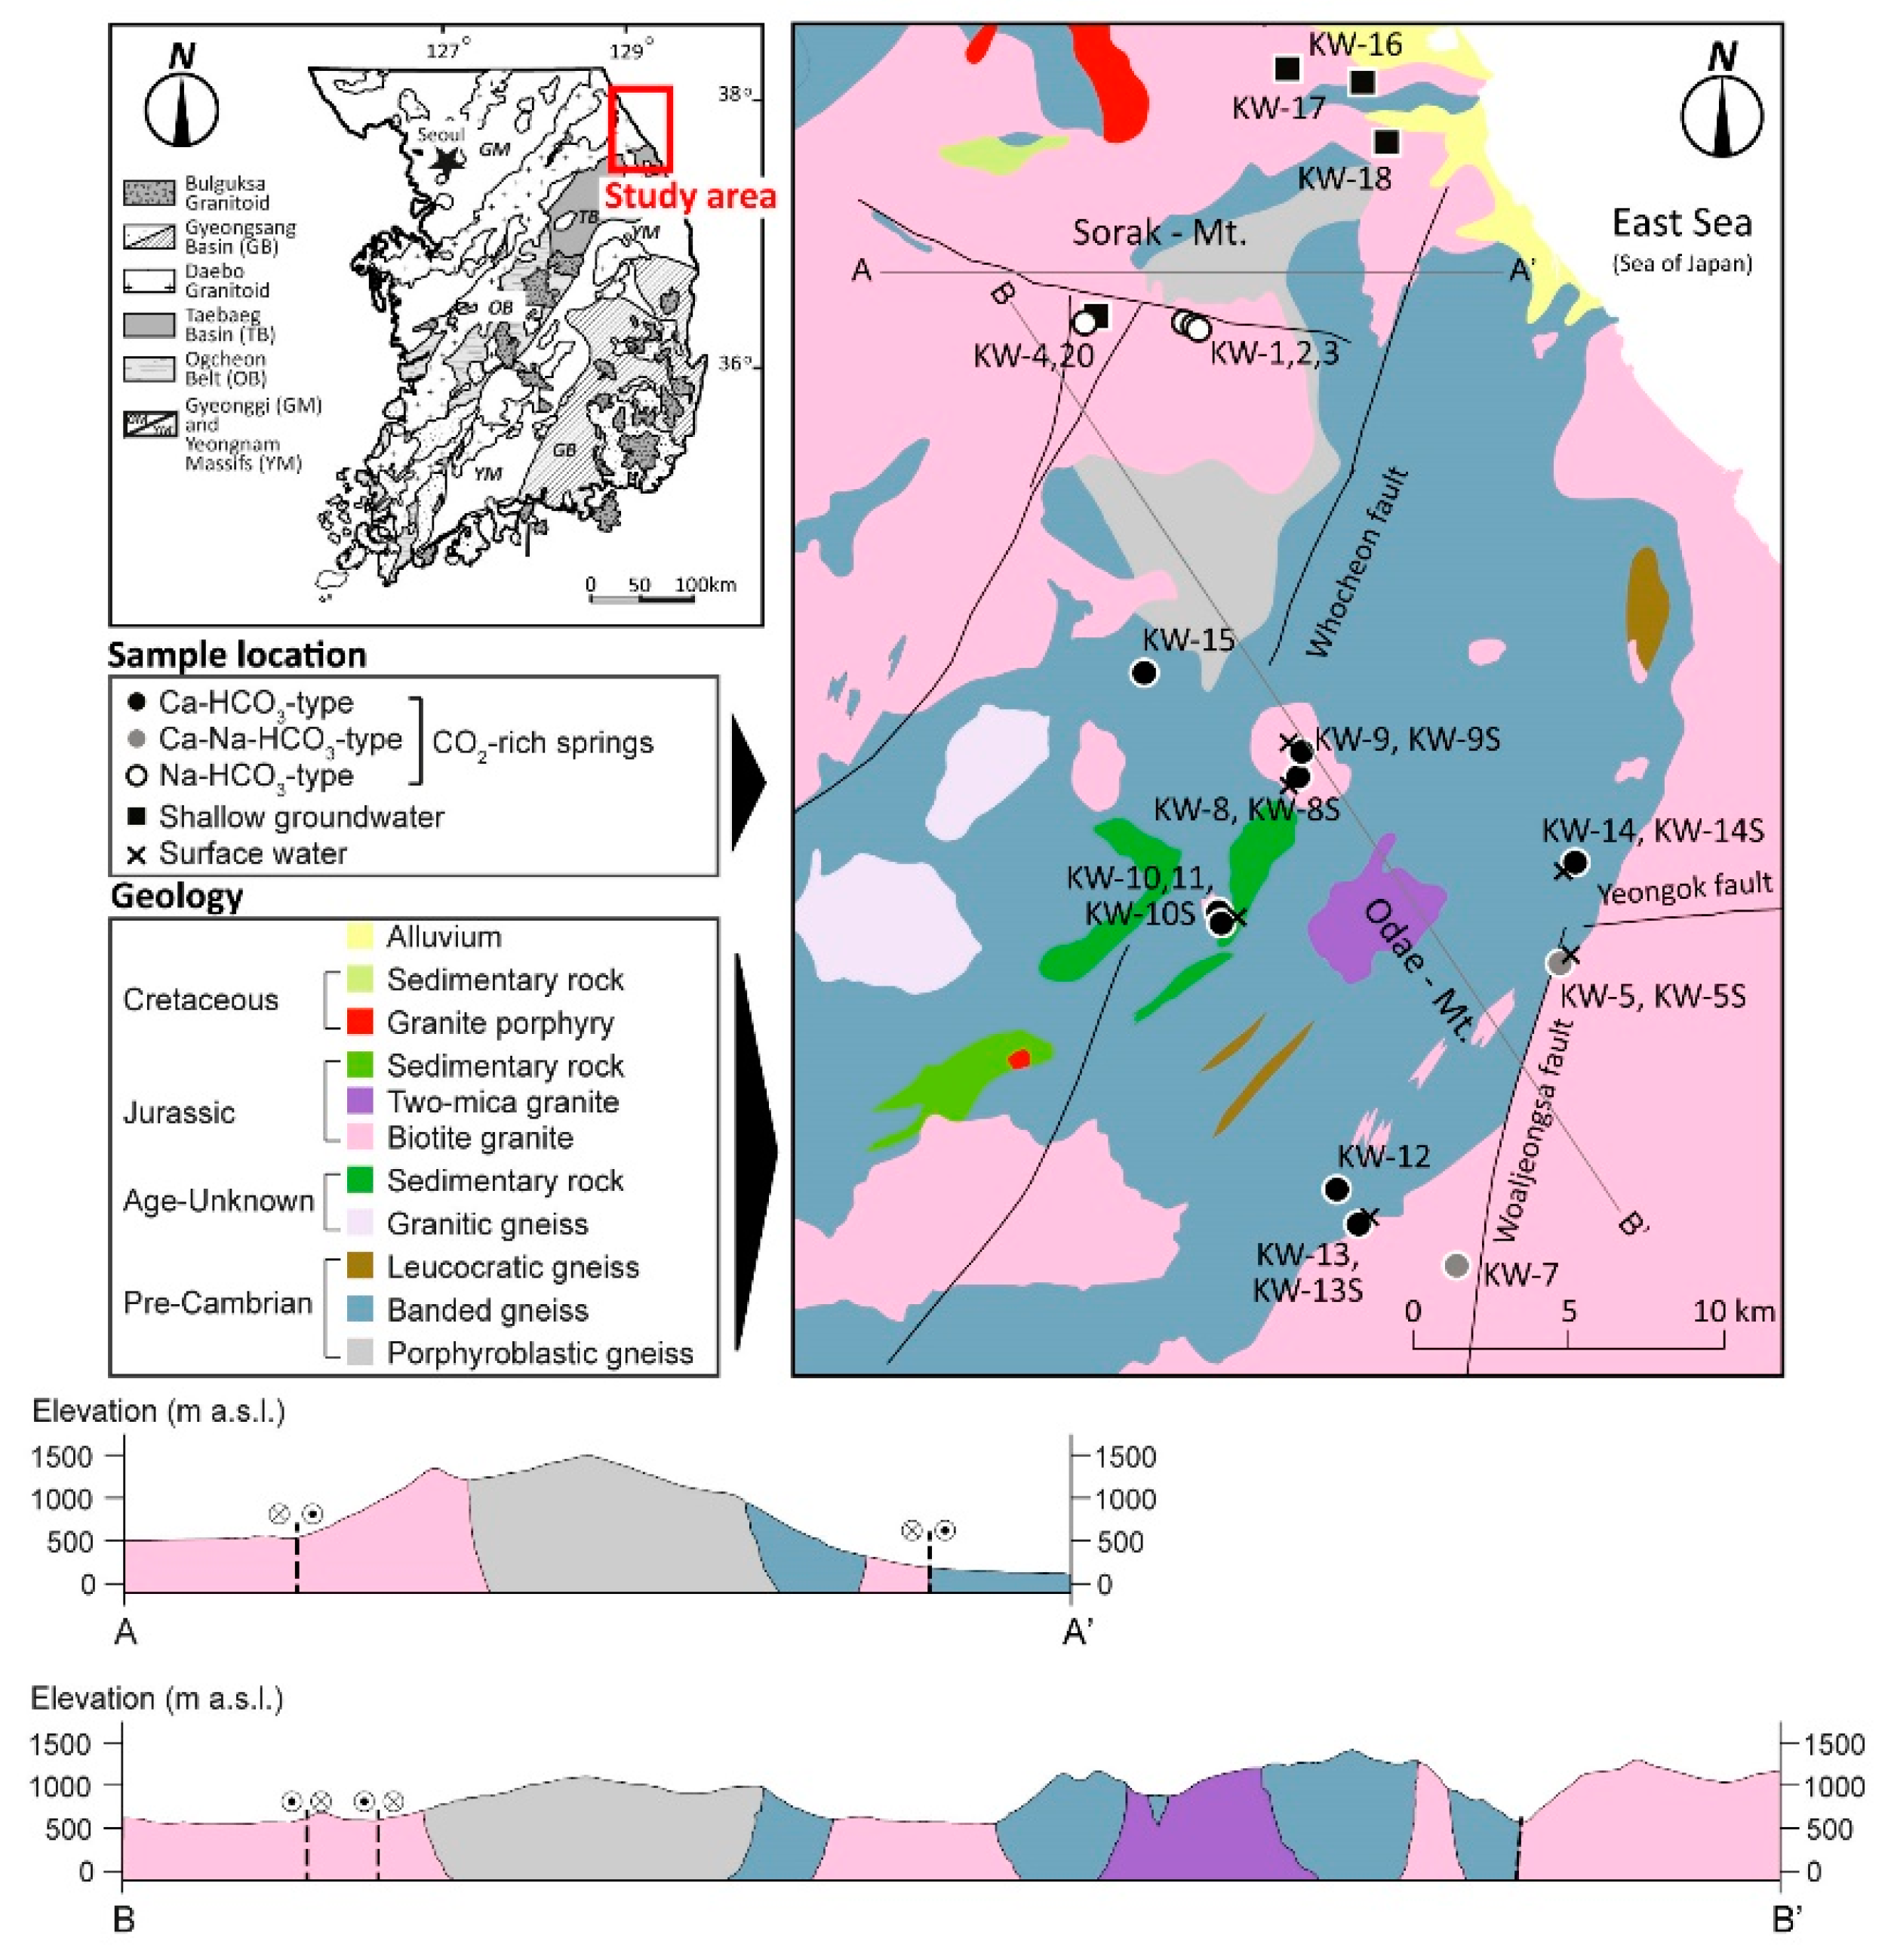
2. Study Area
3. Sampling and Analyses
4. Results and Discussion
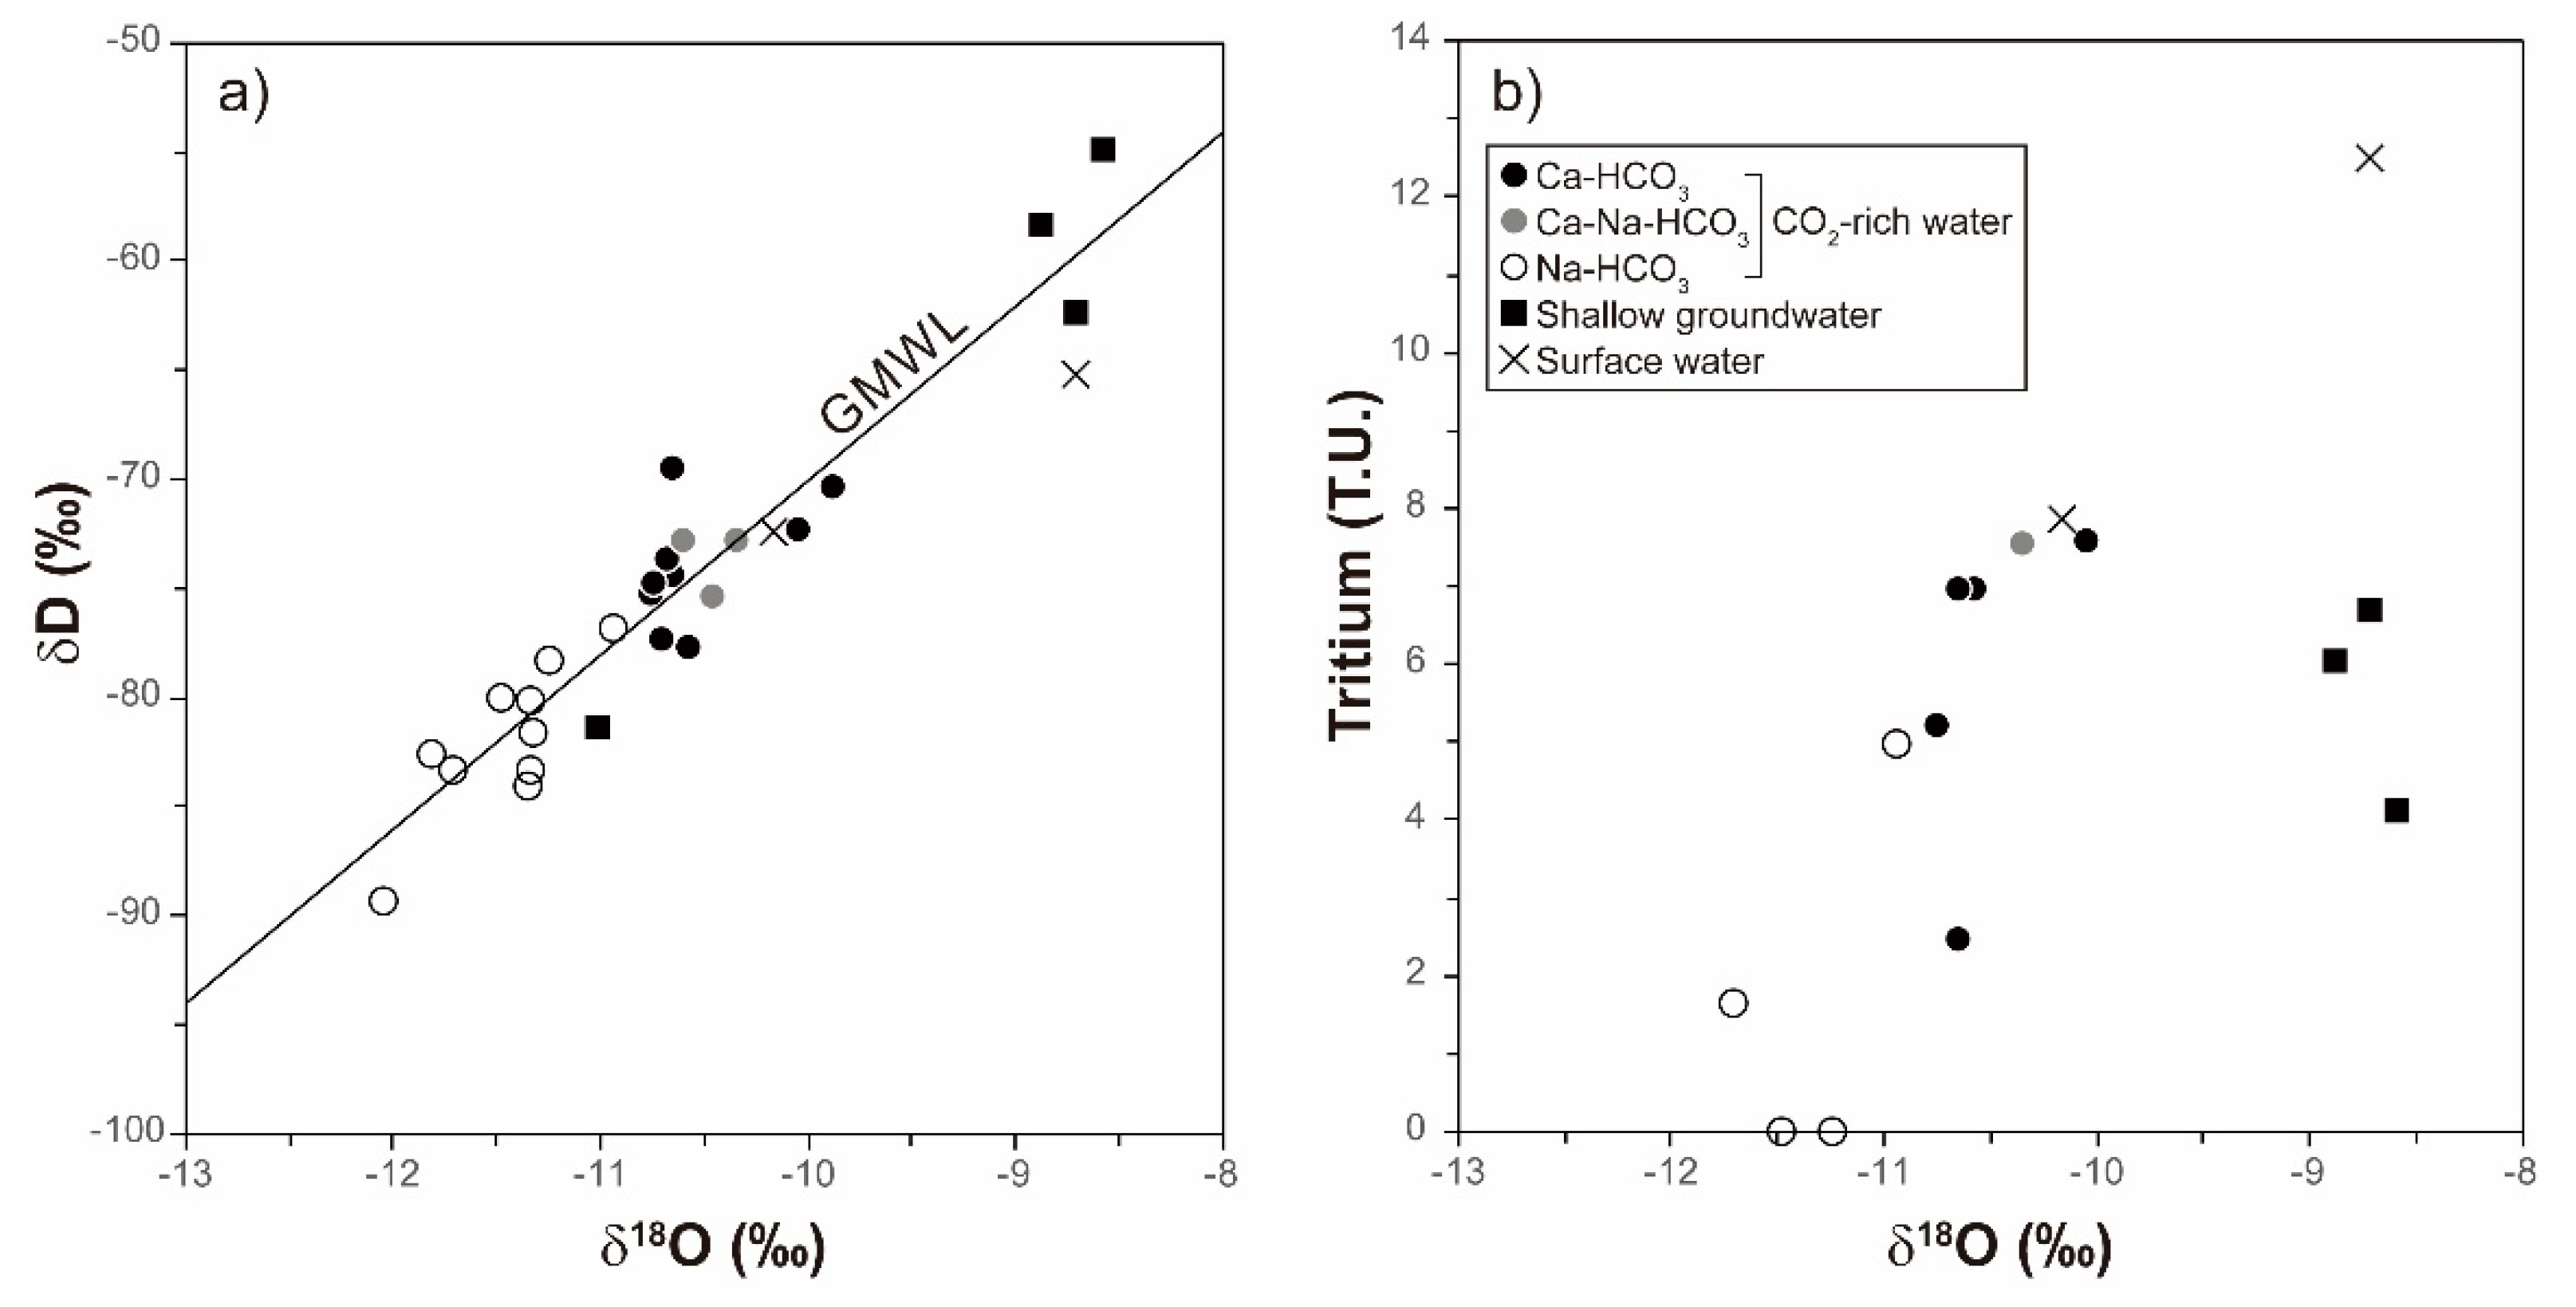
4.1. Hydrochemical and Isotopic Data
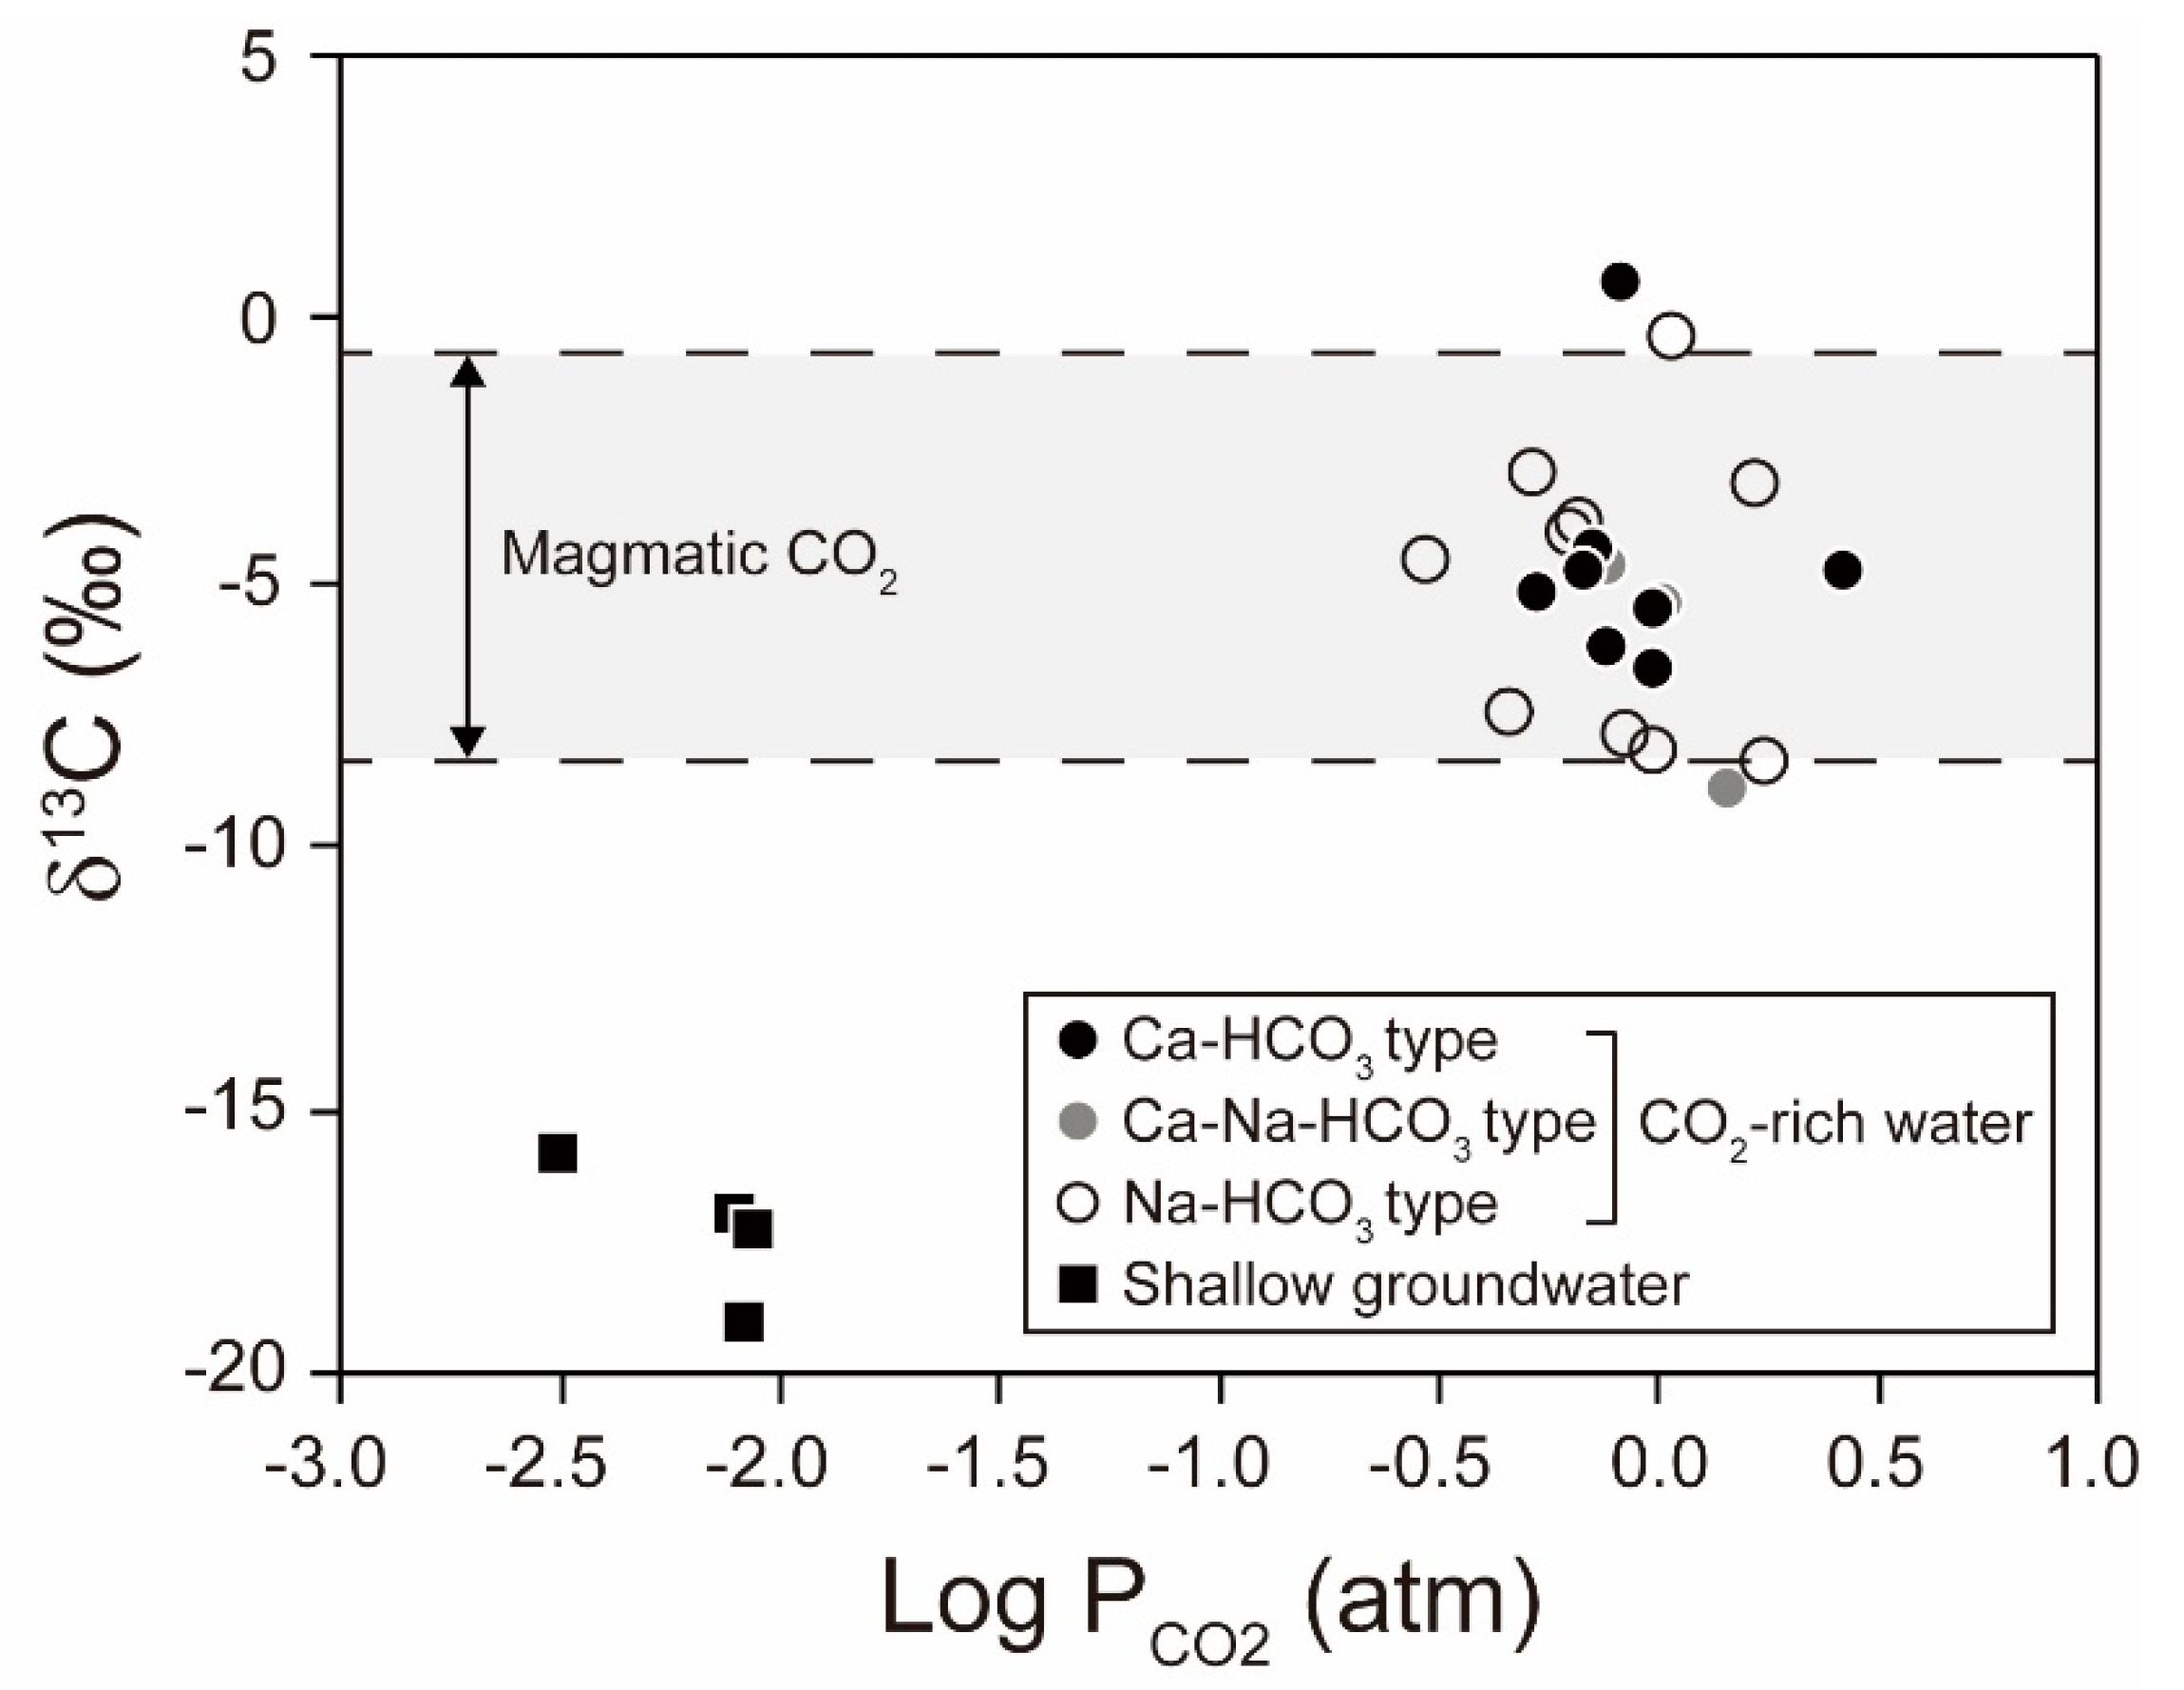
4.1.1. Origin of the CO2
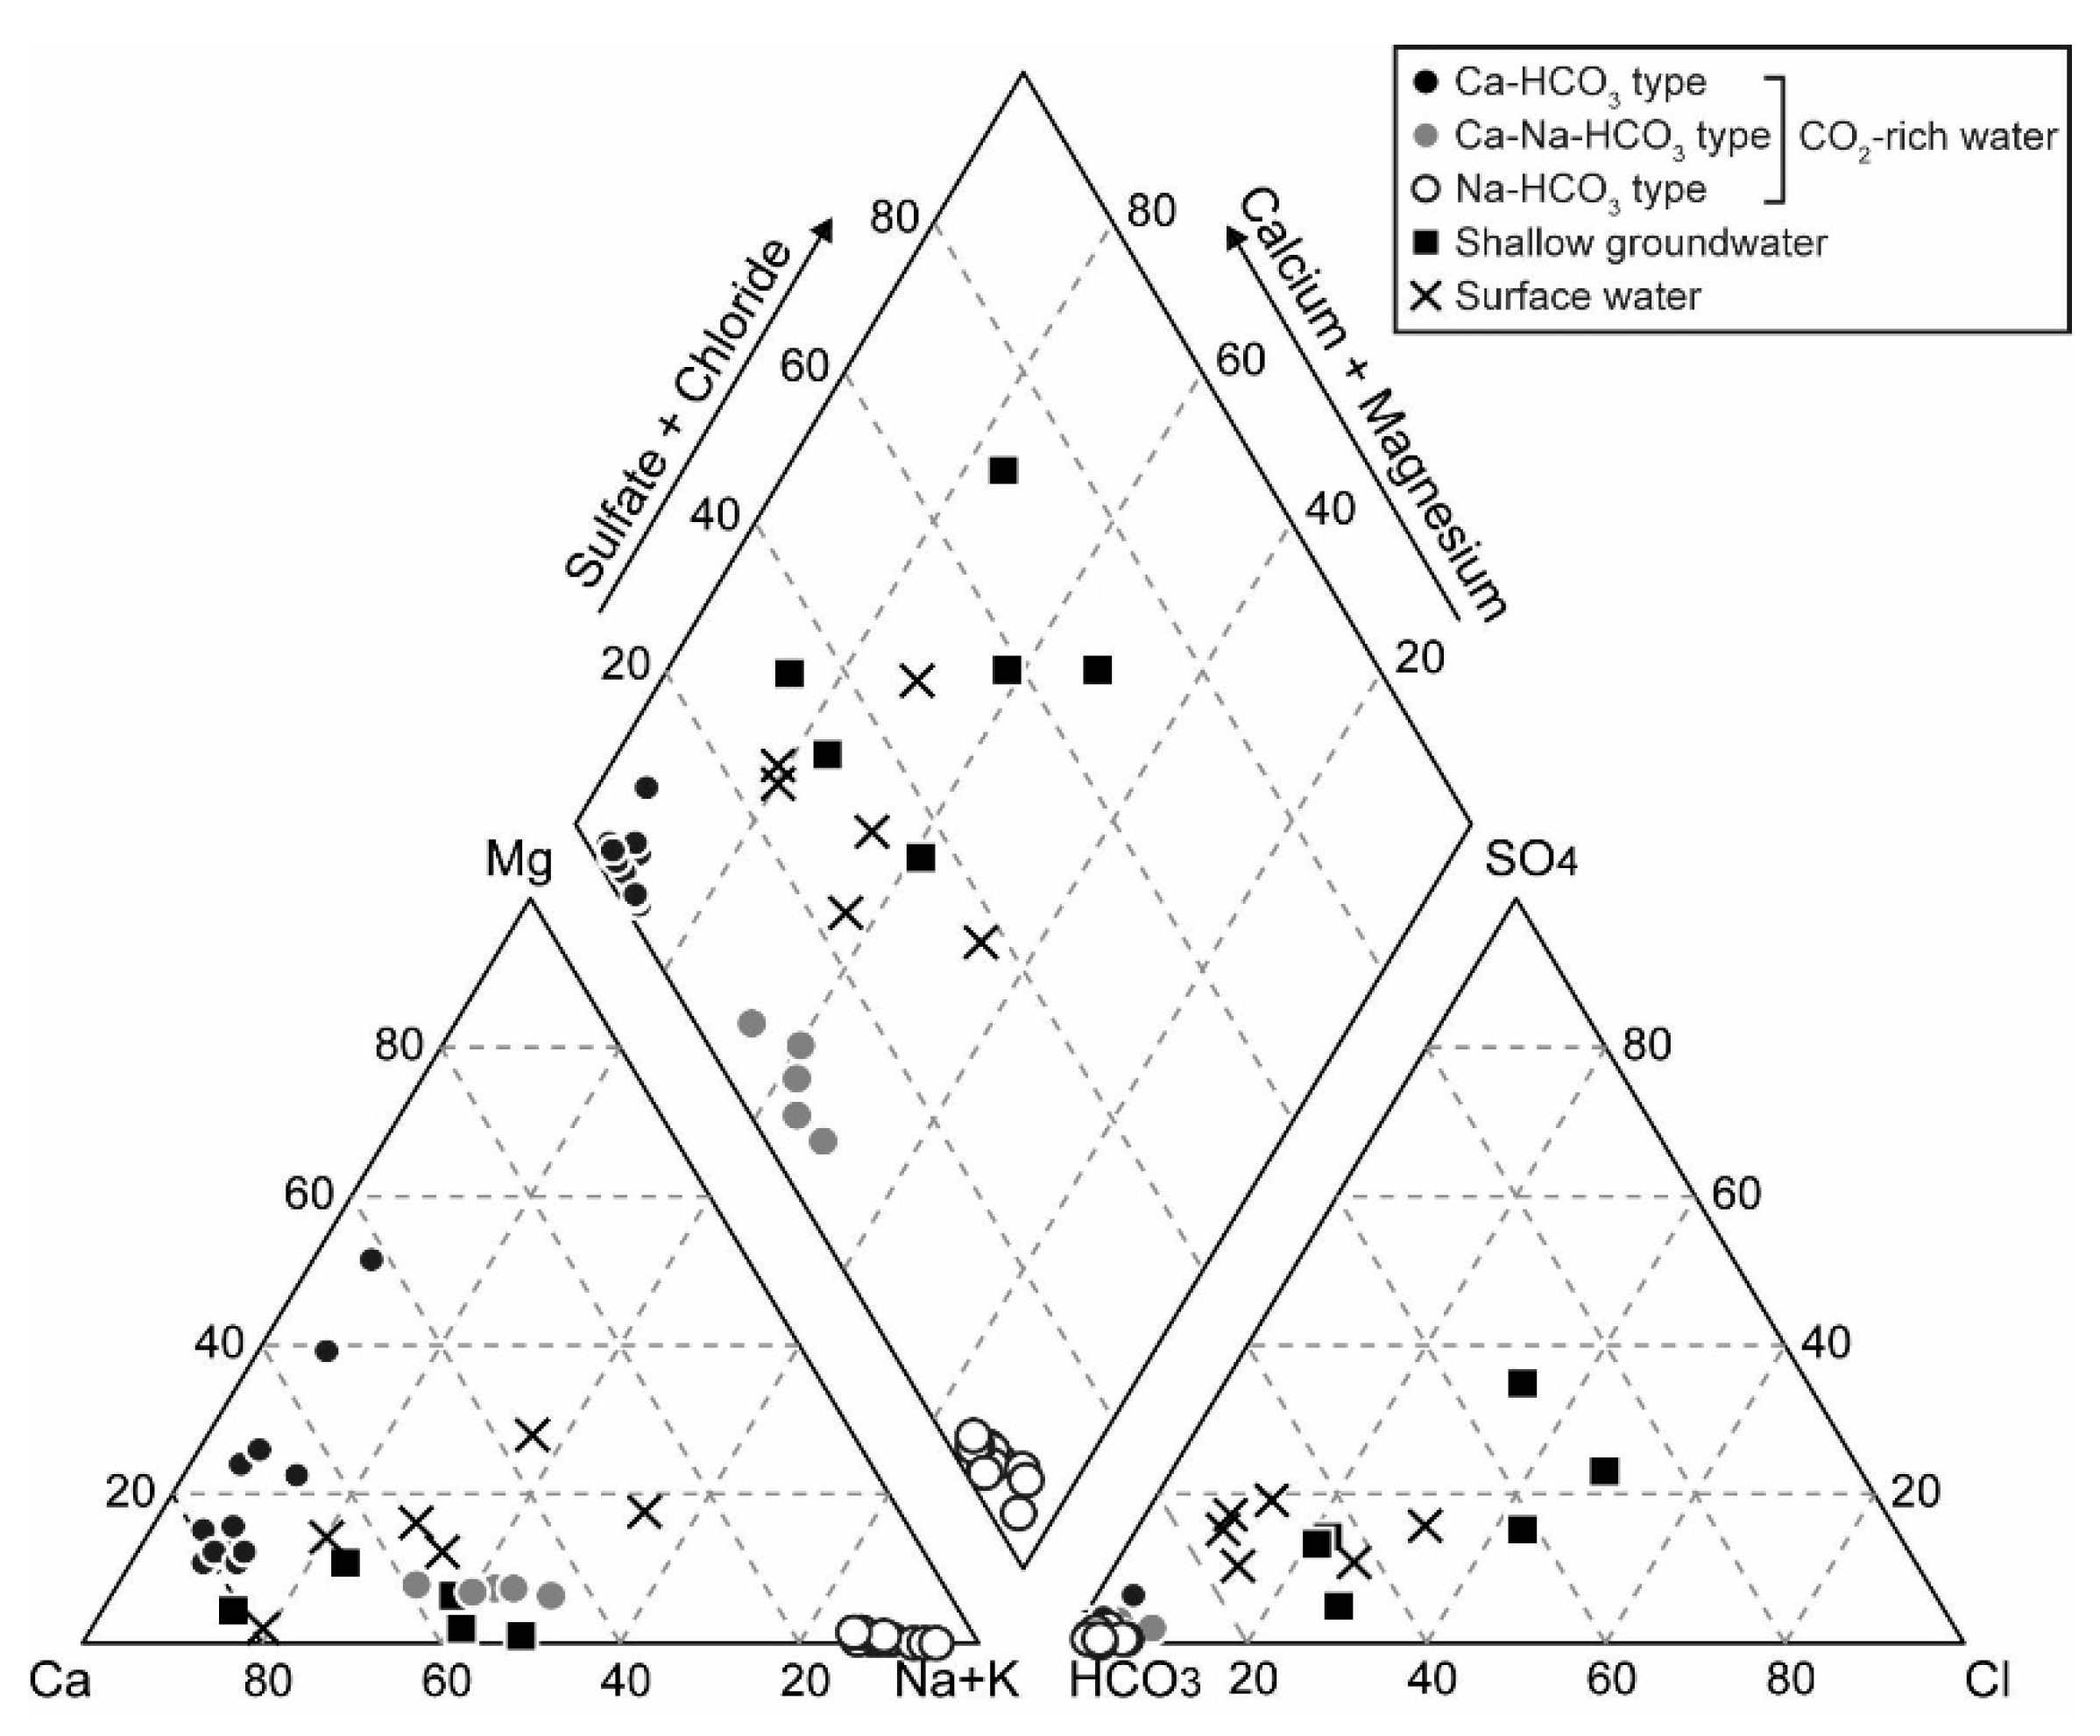
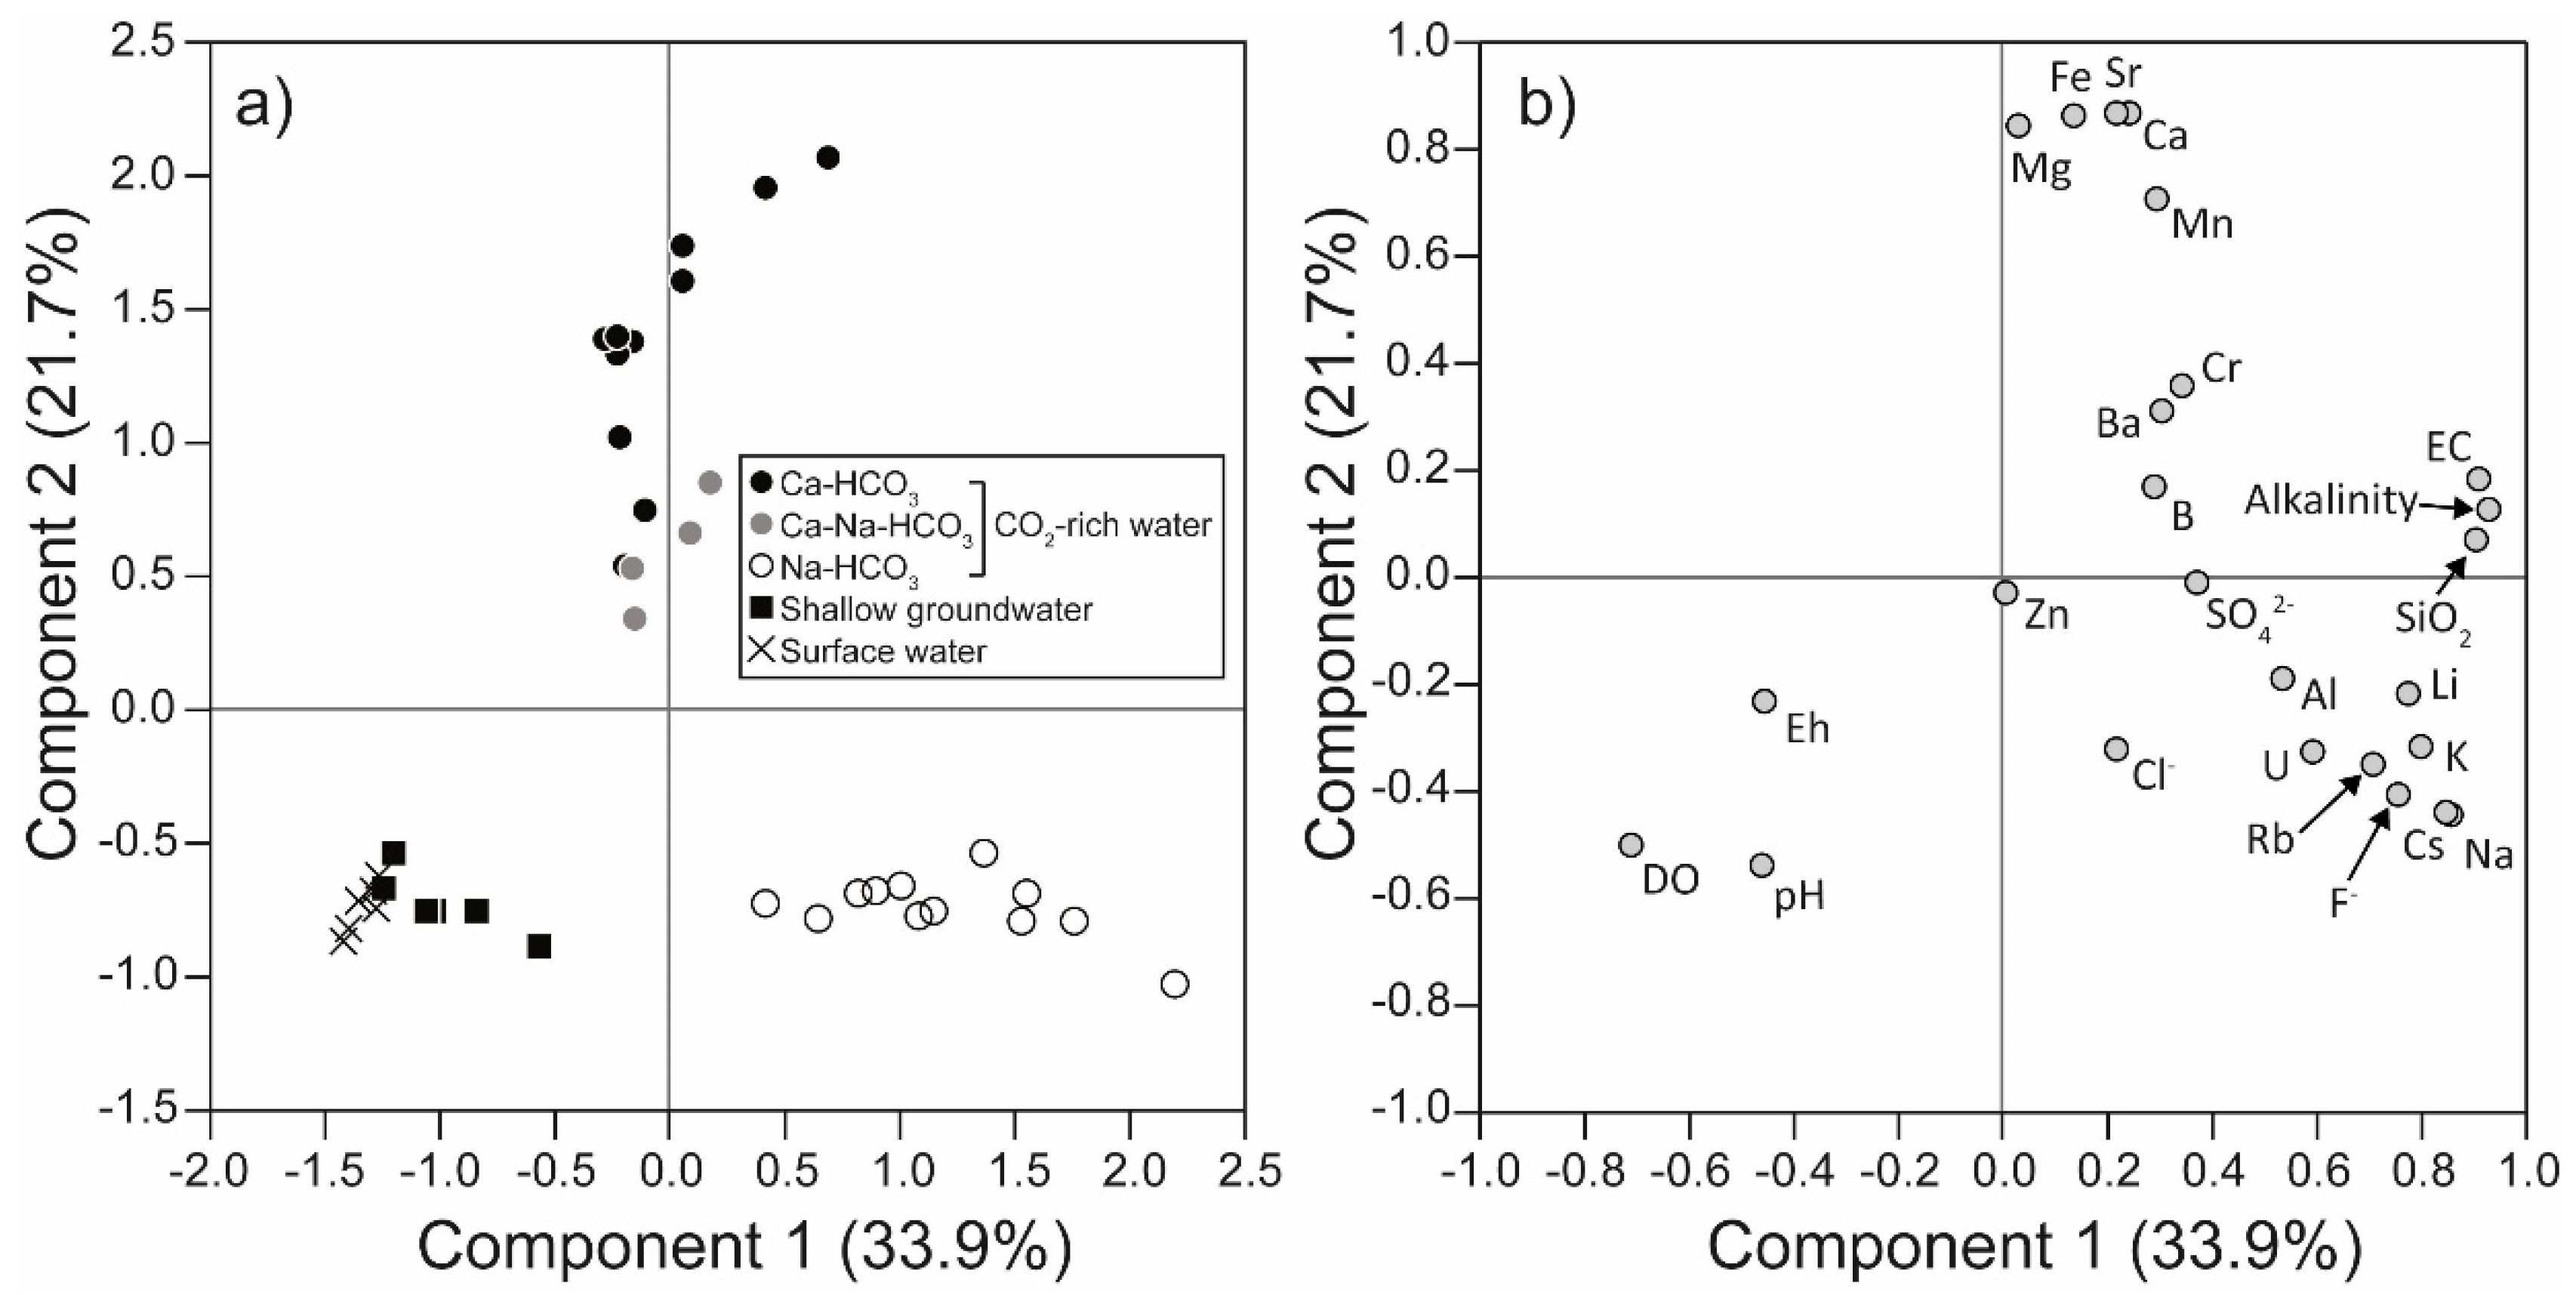
4.1.2. Three Water Types of CO2-Rich Water
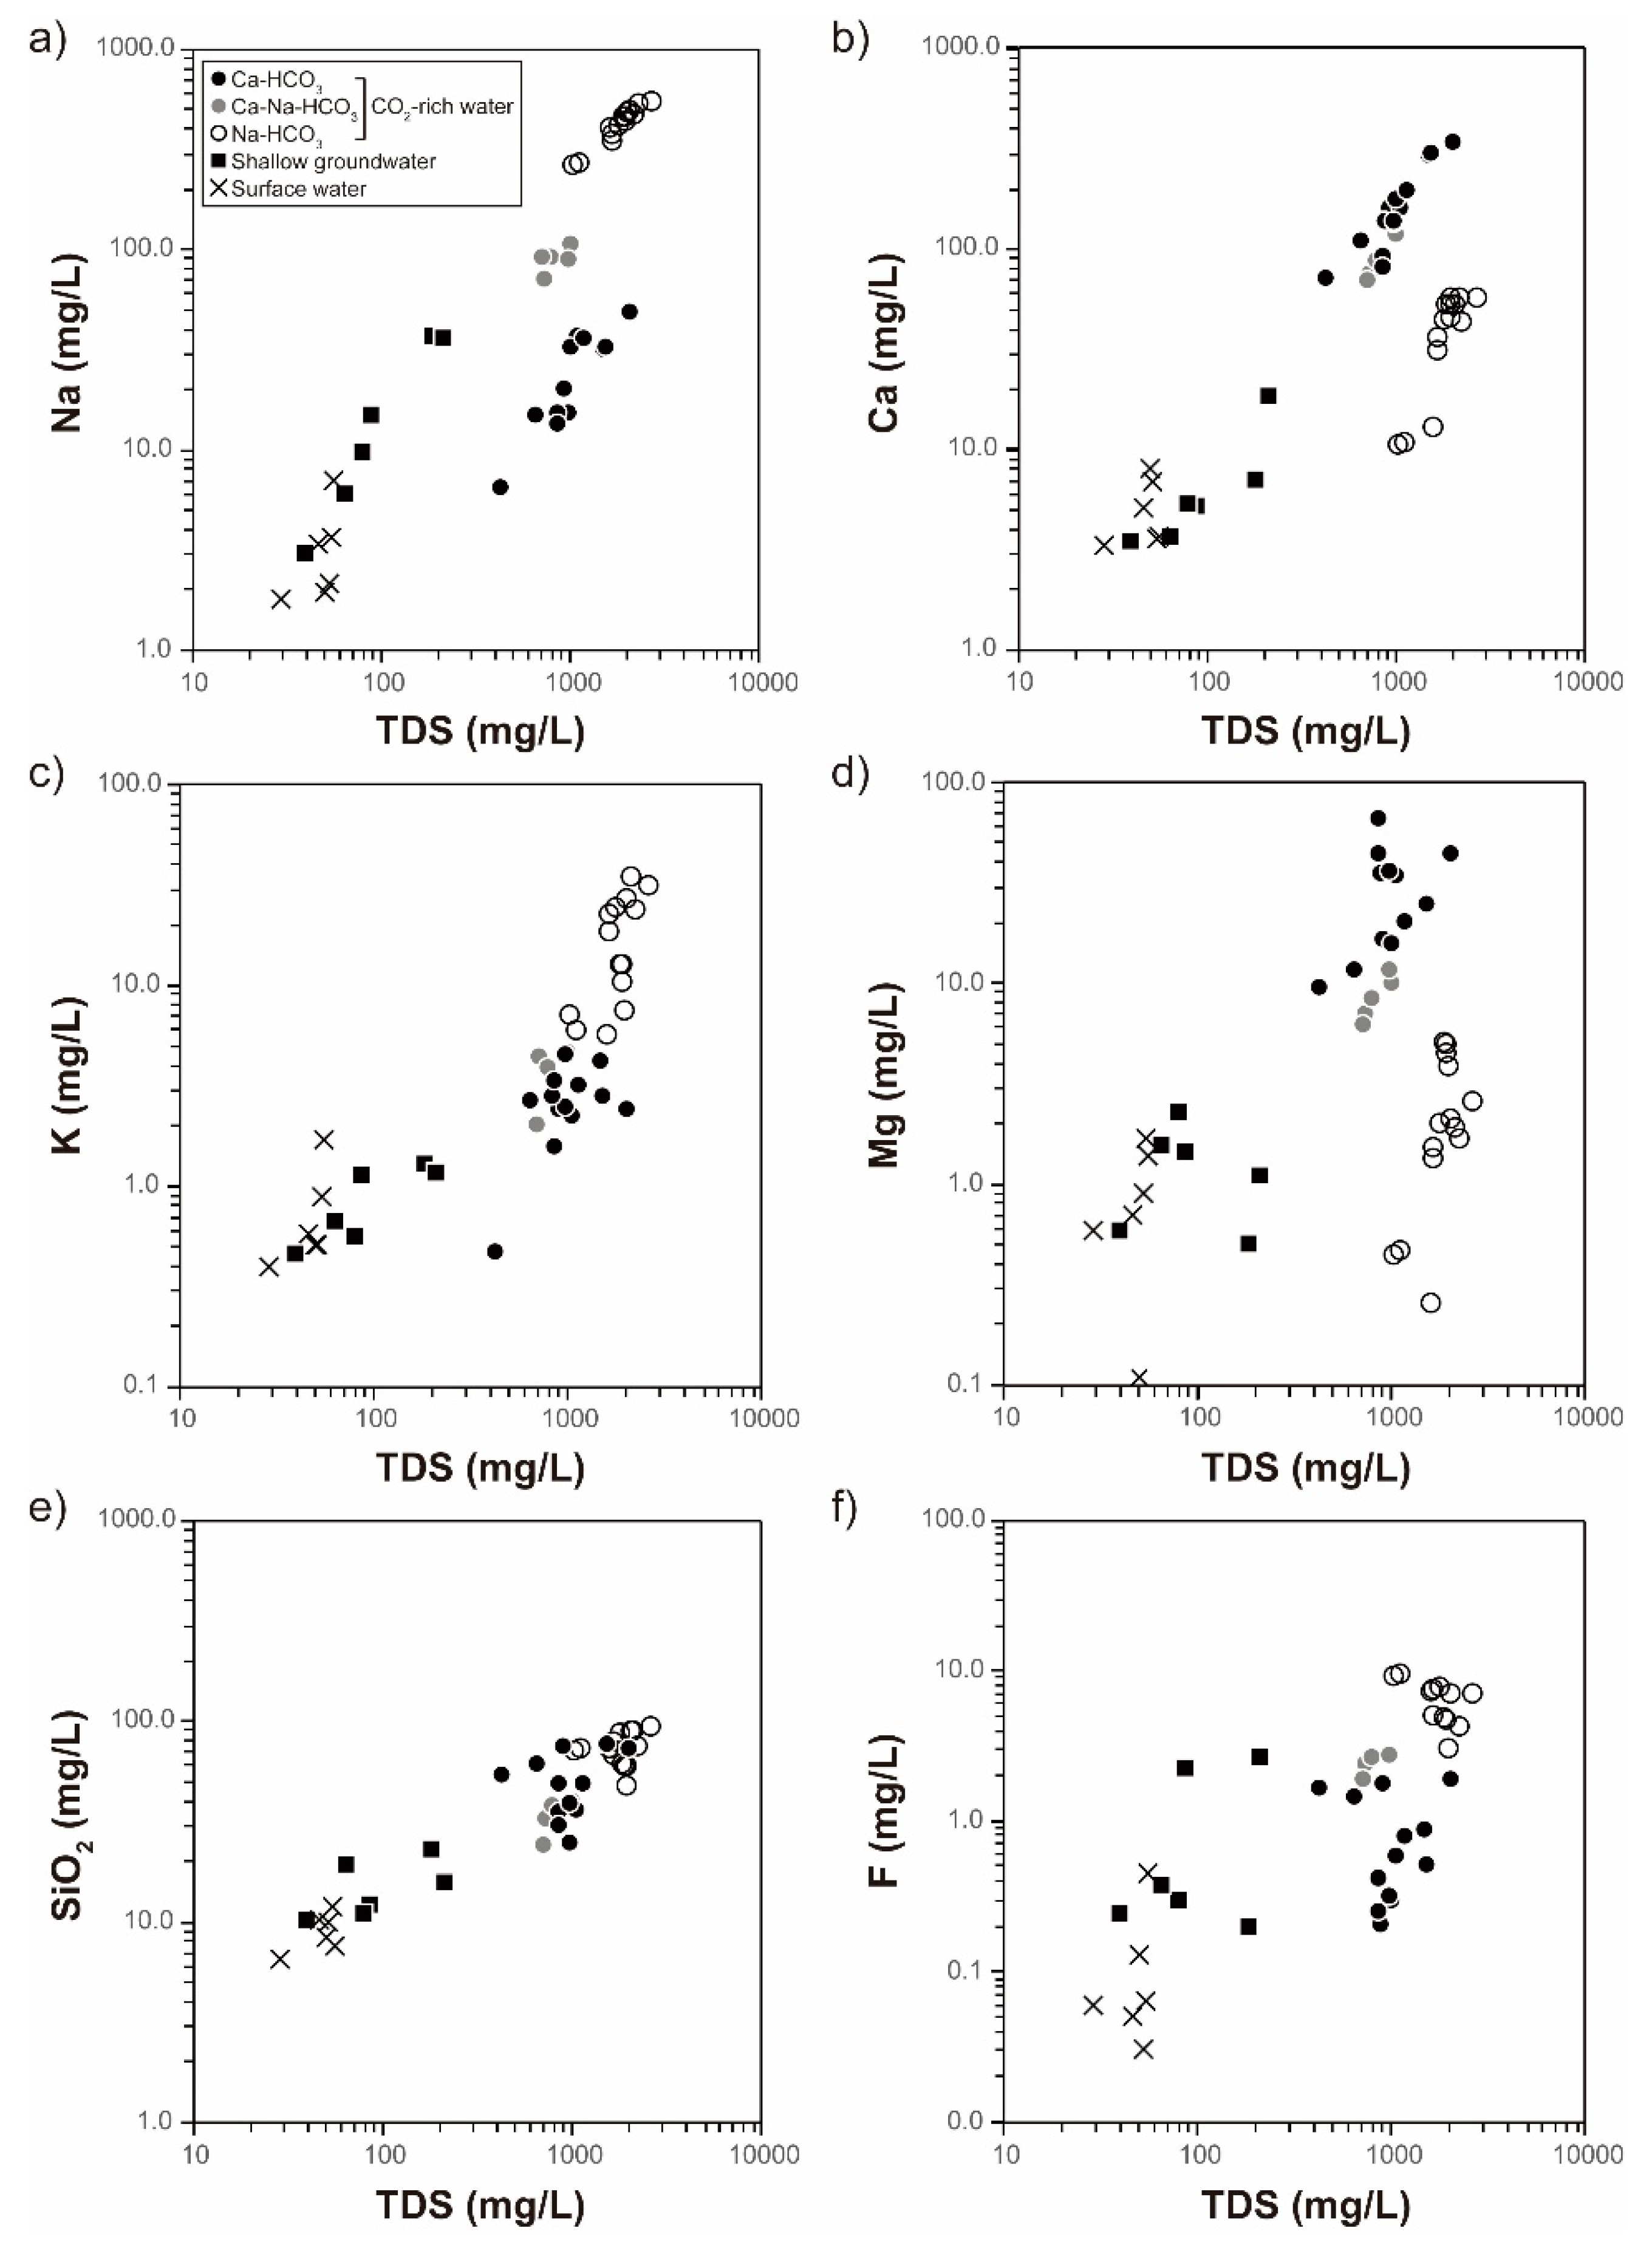
4.1.3. Evolutionary Processes for Each Water Type of CO2−Rich Water
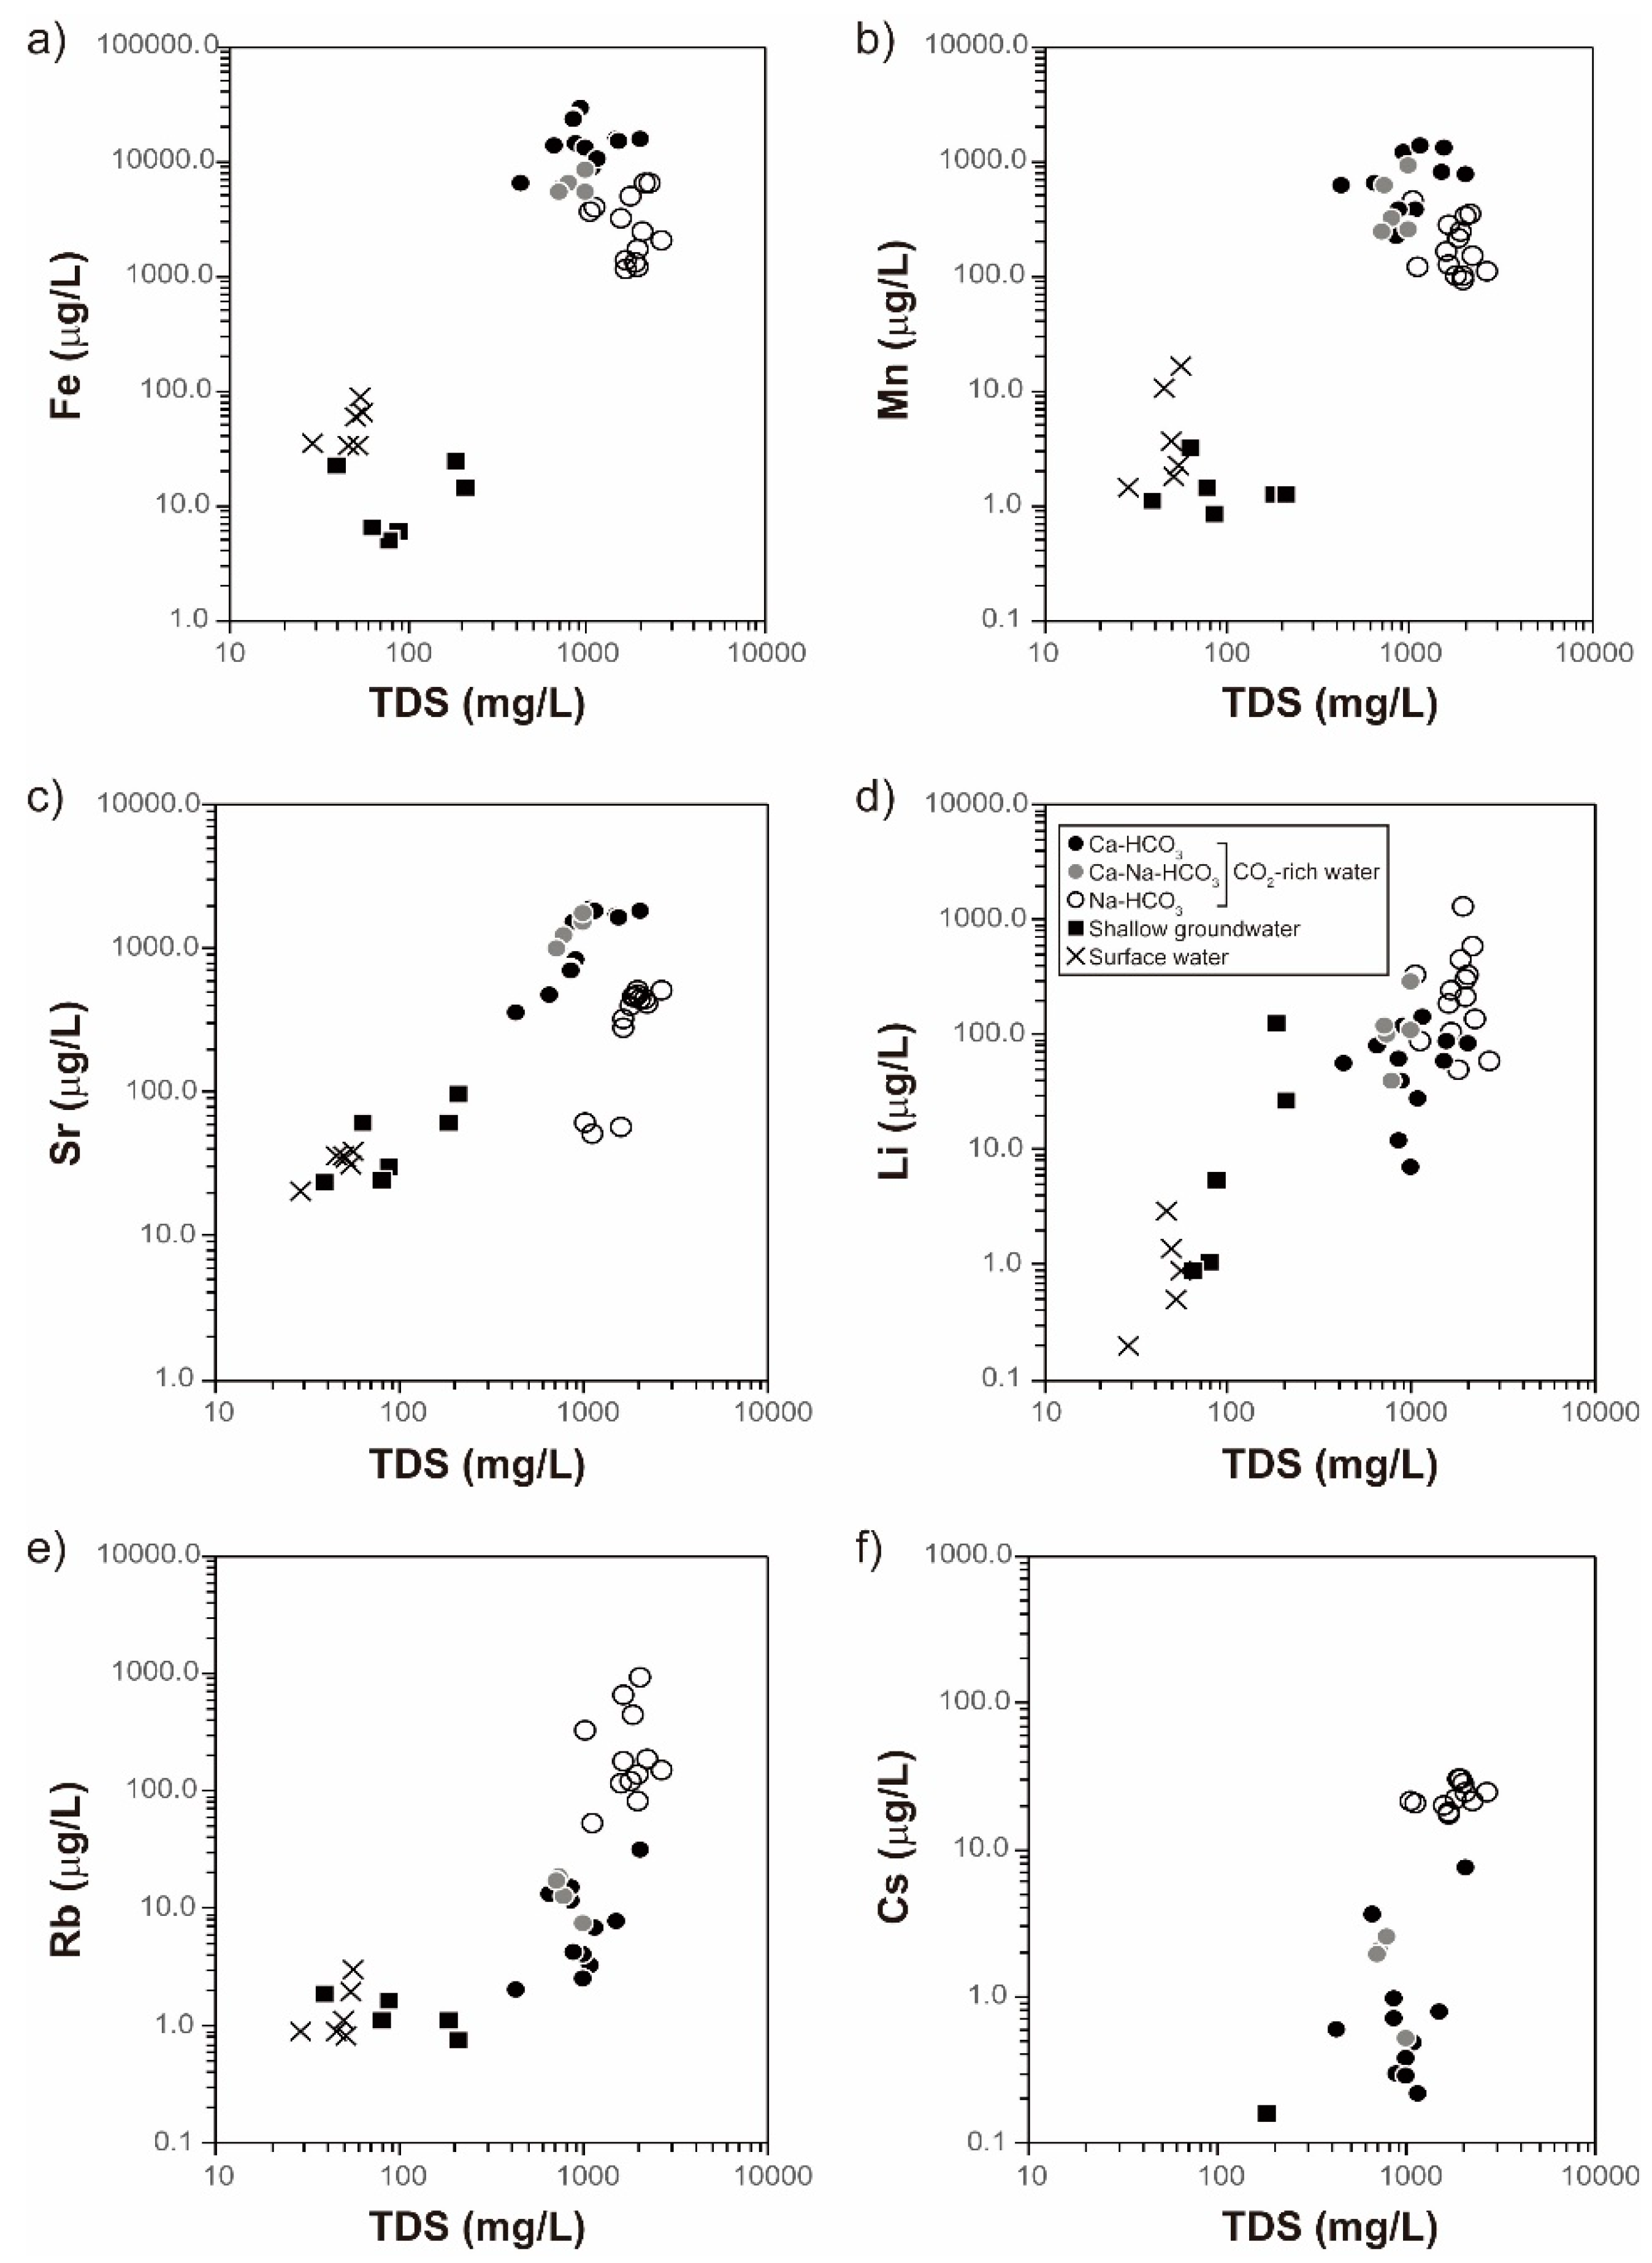
4.2. Behaviors of Trace Elements during Different Evolutional Processes
4.2.1. Extensive Water−Rock Interactions in the Na−HCO3 Type
4.2.2. Mixing and Cation Exchange in the Ca−HCO3 Type
4.3. Comparison with WHO Guidelines for Drinking−Water Quality
5. Summary and Conclusions
Author Contributions
Funding
Conflicts of Interest
References
- Bachu, S.; Bennion, D.B. Experimental assessment of brine and/or CO2 leakage through well cements at reservoir conditions. Int. J. Greenh. Gas Control 2009, 3, 494–501. [Google Scholar] [CrossRef]
- Harvey, O.R.; Qafoku, N.P.; Cantrell, K.J.; Lee, G.; Amonette, J.E.; Brown, C.F. Response to Comment on “Geochemical Implications of Gas Leakage associated with Geologic CO2 Storage—A Qualitative Review”. Environ. Sci. Technol. 2013, 47, 4951–4952. [Google Scholar] [CrossRef]
- Lemieux, J.-M. Review: The potential impact of underground geological storage of carbon dioxide in deep saline aquifers on shallow groundwater resources. Hydrogeol. J. 2011, 19, 757–778. [Google Scholar] [CrossRef]
- Metz, B.; Davidson, O.; De Coninck, H.C.; Loos, M.; Meyer, L.A. IPCC, 2005: IPCC Special Report on Carbon Dioxide Capture and Storage; Working Group III of the Intergovernmental Panel on Climate Change: Cambridge, UK; New York, NY, USA, 2005; p. 442. [Google Scholar]
- Pruess, K. On CO2 fluid flow and heat transfer behavior in the subsurface, following leakage from a geologic storage reservoir. Environ. Earth Sci. 2007, 54, 1677–1686. [Google Scholar] [CrossRef]
- Benson, S.M.; Cole, D.R. CO2 Sequestration in Deep Sedimentary Formations. Elements 2008, 4, 325–331. [Google Scholar] [CrossRef]
- DOEFE (USDOE Office of Fossil Energy (FE) (United States)). Report of the Interagency Task Force on Carbon Capture and Storage; DOEFE: Washington, DC, USA, 2010.
- Keating, E.; Fessenden, J.; Kanjorski, N.; Koning, D.J.; Pawar, R. The impact of CO2 on shallow groundwater chemistry: Observations at a natural analog site and implications for carbon sequestration. Environ. Earth Sci. 2009, 60, 521–536. [Google Scholar] [CrossRef] [Green Version]
- Kharaka, Y.K.; Thordsen, J.J.; Kakouros, E.; Ambats, G.; Herkelrath, W.N.; Beers, S.R.; Birkholzer, J.; Apps, J.A.; Spycher, N.F.; Zheng, L.; et al. Changes in the chemistry of shallow groundwater related to the 2008 injection of CO2 at the ZERT field site, Bozeman, Montana. Environ. Earth Sci. 2009, 60, 273–284. [Google Scholar] [CrossRef]
- Mickler, P.J.; Yang, C.; Scanlon, B.R.; Reedy, R.; Lu, J. Potential Impacts of CO2Leakage on Groundwater Chemistry from Laboratory Batch Experiments and Field Push–pull Tests. Environ. Sci. Technol. 2013, 47, 10694–10702. [Google Scholar] [CrossRef]
- Trautz, R.C.; Pugh, J.D.; Varadharajan, C.; Zheng, L.; Bianchi, M.; Nico, P.S.; Spycher, N.F.; Newell, D.; Esposito, R.A.; Wu, Y.; et al. Effect of Dissolved CO2on a Shallow Groundwater System: A Controlled Release Field Experiment. Environ. Sci. Technol. 2012, 47, 298–305. [Google Scholar] [CrossRef]
- Humez, P.; Lions, J.; Negrel, P.; Lagneau, V. CO2 intrusion in freshwater aquifers: Review of geochemical tracers and monitoring tools, classical uses and innovative approaches. Appl. Geochem. 2014, 46, 95–108. [Google Scholar] [CrossRef]
- Newell, D.; Larson, T.; Perkins, G.; Pugh, J.; Stewart, B.; Capo, R.; Trautz, R. Tracing CO2 leakage into groundwater using carbon and strontium isotopes during a controlled CO2 release field test. Int. J. Greenh. Gas Control 2014, 29, 200–208. [Google Scholar] [CrossRef] [Green Version]
- Schulz, A.; Vogt, C.; Lamert, H.; Peter, A.; Heinrich, B.; Dahmke, A.; Richnow, H.-H. Monitoring of a Simulated CO2Leakage in a Shallow Aquifer Using Stable Carbon Isotopes. Environ. Sci. Technol. 2012, 46, 11243–11250. [Google Scholar] [CrossRef]
- Choi, H.; Woo, N.C. Natural analogue monitoring to estimate the hydrochemical change of groundwater by the carbonating process from the introduction of CO2. J. Hydrol. 2018, 562, 318–334. [Google Scholar] [CrossRef]
- Navarre-Sitchler, A.K.; Maxwell, R.M.; Siirila-Woodburn, E.R.; Hammond, G.E.; Lichtner, P.C. Elucidating geochemical response of shallow heterogeneous aquifers to CO2 leakage using high-performance computing: Implications for monitoring of CO2 sequestration. Adv. Water Resour. 2013, 53, 45–55. [Google Scholar] [CrossRef]
- Yang, Q.; Matter, J.; Stute, M.; Takahashi, T.; O’Mullan, G.; Umemoto, K.; Clauson, K.; Dueker, M.E.; Zakharova, N.V.; Goddard, J.; et al. Groundwater hydrogeochemistry in injection experiments simulating CO2 leakage from geological storage reservoir. Int. J. Greenh. Gas Control 2014, 26, 193–203. [Google Scholar] [CrossRef] [Green Version]
- Humez, P.; Lagneau, V.; Lions, J.; Negrel, P. Assessing the potential consequences of CO2 leakage to freshwater resources: A batch-reaction experiment towards an isotopic tracing tool. Appl. Geochem. 2013, 30, 178–190. [Google Scholar] [CrossRef]
- Lu, J.; Partin, J.W.; Hovorka, S.D.; Wong, C. Potential risks to freshwater resources as a result of leakage from CO2 geological storage: A batch-reaction experiment. Environ. Earth Sci. 2009, 60, 335–348. [Google Scholar] [CrossRef]
- Ju, Y.; Beaubien, S.E.; Lee, S.-S.; Kaown, D.; Hahm, D.; Lee, S.; Park, I.-W.; Park, K.; Yun, S.-T.; Lee, K.-K. Application of natural and artificial tracers to constrain CO2 leakage and degassing in the K-COSEM site, South Korea. Int. J. Greenh. Gas Control 2019, 86, 211–225. [Google Scholar] [CrossRef]
- Cahill, A.G.; Marker, P.; Jakobsen, R. Hydrogeochemical and mineralogical effects of sustained CO2contamination in a shallow sandy aquifer: A field-scale controlled release experiment. Water Resour. Res. 2014, 50, 1735–1755. [Google Scholar] [CrossRef]
- Roberts, J.J.; Wilkinson, M.; Naylor, M.; Shipton, Z.K.; Wood, R.A.; Haszeldine, R.S. Natural CO2sites in Italy show the importance of overburden geopressure, fractures and faults for CO2storage performance and risk management. Geol. Soc. Spéc. 2017, 458, 181–211. [Google Scholar] [CrossRef]
- Chae, G.; Yu, S.; Jo, M.; Choi, B.-Y.; Kim, T.; Koh, D.-C.; Yun, Y.-Y.; Yun, S.-T.; Kim, J.-C. Monitoring of CO2-rich waters with low pH and low EC: An analogue study of CO2 leakage into shallow aquifers. Environ. Earth Sci. 2016, 75, 1–15. [Google Scholar] [CrossRef]
- Menció, A.; Guasch, H.; Soler, D.; Canelles, A.; Zamorano, M.; Brusi, D. Influence of regional hydrogeological systems at a local scale: Analyzing the coupled effects of hydrochemistry and biological activity in a Fe and CO2 rich spring. Sci. Total Environ. 2016, 569, 700–715. [Google Scholar] [CrossRef]
- Choi, H.-S.; Koh, Y.-K.; Bae, D.-S.; Park, S.-S.; Hutcheon, I.; Yun, S.-T. Estimation of deep-reservoir temperature of CO2-rich springs in Kangwon district, South Korea. J. Volcanol. Geotherm. Res. 2005, 141, 77–89. [Google Scholar] [CrossRef]
- Choi, H.-S.; Yun, S.-T.; Koh, Y.-K.; Mayer, B.; Park, S.-S.; Hutcheon, I. Geochemical behavior of rare earth elements during the evolution of CO2-rich groundwater: A study from the Kangwon district, South Korea. Chem. Geol. 2009, 262, 318–327. [Google Scholar] [CrossRef]
- Choi, B.-Y.; Yun, S.-T.; Kim, K.-H.; Choi, H.-S.; Chae, G.-T.; Lee, P.-K. Geochemical modeling of CO2–water–rock interactions for two different hydrochemical types of CO2-rich springs in Kangwon District, Korea. J. Geochem. Explor. 2014, 144, 49–62. [Google Scholar] [CrossRef]
- Jeong, C.H.; Kim, H.J.; Lee, S.Y. Hydrochemistry and genesis of CO2-rich springs from Mesozoic granitoids and their adjacent rocks in South Korea. Geochem. J. 2005, 39, 517–530. [Google Scholar] [CrossRef] [Green Version]
- Jeong, C.-H.; Yoo, S.-W.; Kim, K.-H.; Nagao, K. Hydrochemistry and Origin of Noble Gases and CO 2 Gas Within Carbonated Mineral Waters in the Kyeoungbuk-Kangwon Province, Korea. J. Eng. Geol. 2011, 21, 65–77. [Google Scholar] [CrossRef] [Green Version]
- Choi, B.-Y. Potential impact of leaking CO2 gas and CO2-rich fluids on shallow groundwater quality in the Chungcheong region (South Korea): A hydrogeochemical approach. Int. J. Greenh. Gas Control. 2019, 84, 13–28. [Google Scholar] [CrossRef]
- Lee, D.; Yun, S.; Kim, J. Explanatory Text of the Geological Map of Changchon Sheet; Sheet 6827 II, Scale 1: 50,000; Geological and Mineral Institute of Korea: Daejeon, South Korea, 1975; pp. 1–10. [Google Scholar]
- Cheong, C.H.; Won, C.K.; Cha, M.S.; Kang, K.W.; Lee, Y.C. Explanatory Text of the Geological Map of Odaesan Sheet (1:50,000); Geological and Mineral institute of Korea: Daejeon, South Korea, 1975. [Google Scholar]
- Kim, S.; Park, B.; Kim, O.; Yoo, B.; Kim, K. Explanatory Text of the Geological Map of Bugbunri Sheet, Sheet 6927-IV, Scale 1: 50,000; Geological and Mineral Institute of Korea: Daejeon, South Korea, 1975; pp. 1–5. [Google Scholar]
- Epstein, S.; Mayeda, T. Variation of O18 content of waters from natural sources. Geochim. Cosmochim. Acta 1953, 4, 213–224. [Google Scholar] [CrossRef]
- Kendall, C.; Coplen, T.B. Multi-sample conversion of water to hydrogen by zinc for stable isotope determination. Anal. Chem. 1985, 57, 1437–1440. [Google Scholar] [CrossRef]
- Parkhurst, B.D.L.; Appelo, C.J. User’s guide to PHREEQC (version 2): A computer program for speciation, batch-reaction, one-dimensional transport, and inverse geochemical calculations. Water-Resour. Investig. Rep. 1999, 99, 312. [Google Scholar]
- Guler, C.; Thyne, G.D.; McCray, J.E.; Turner, K.A. Evaluation of graphical and multivariate statistical methods for classification of water chemistry data. Hydrogeol. J. 2002, 10, 455–474. [Google Scholar] [CrossRef]
- Mayo, A.L.; Loucks, M.D. Solute and isotopic geochemistry and ground water flow in the central Wasatch Range, Utah. J. Hydrol. 1995, 172, 31–59. [Google Scholar] [CrossRef]
- Mayo, A.L.; Muller, A.B. Low temperature diagenetic–metamorphic and magmatic contributions of external CO2 gas to a shallow ground water system. J. Hydrol. 1997, 194, 286–304. [Google Scholar] [CrossRef]
- White, W.M. Geochemistry; John Wiley & Sons: Hoboken, NJ, USA, 2013; ISBN 1-118-48527-0. [Google Scholar]
- Lambrakis, N.; Kallergis, G. Contribution to the study of Greek thermal springs: Hydrogeological and hydrochemical characteristics and origin of thermal waters. Hydrogeol. J. 2004, 13, 506–521. [Google Scholar] [CrossRef]
- Koh, Y.-K.; Choi, B.-Y.; Yun, S.-T.; Choi, H.-S.; Mayer, B.; Ryoo, S.-W. Origin and evolution of two contrasting thermal groundwaters (CO2-rich and alkaline) in the Jungwon area, South Korea: Hydrochemical and isotopic evidence. J. Volcanol. Geotherm. Res. 2008, 178, 777–786. [Google Scholar] [CrossRef]
- Clark, I.D.; Fritz, P. Environmental Isotopes in Hydrogeology. Environ. Isot. Hydrogeol. 2013. [Google Scholar] [CrossRef]
- Deines, P.; Langmuir, D.; Harmon, R.S. Stable carbon isotope ratios and the existence of a gas phase in the evolution of carbonate ground waters. Geochim. Cosmochim. Acta 1974, 38, 1147–1164. [Google Scholar] [CrossRef]
- Kim, K.; Jeong, G.Y. Factors influencing natural occurrence of fluoride-rich groundwaters: A case study in the southeastern part of the Korean Peninsula. Chemosphere 2005, 58, 1399–1408. [Google Scholar] [CrossRef]
- Bernhard, G.; Geipel, G.; Reich, T.; Brendler, V.; Amayri, S.; Nitsche, H. Uranyl (VI) carbonate complex formation: Validation of the Ca2UO2(CO3)3(aq.) species. Radiochim. Acta 2001, 89, 89. [Google Scholar] [CrossRef]
- Dong, W.; Brooks, S.C. Determination of the Formation Constants of Ternary Complexes of Uranyl and Carbonate with Alkaline Earth Metals (Mg2+, Ca2+, Sr2+, and Ba2+) Using Anion Exchange Method. Environ. Sci. Technol. 2006, 40, 4689–4695. [Google Scholar] [CrossRef]
- Fox, P.M.; Davis, J.A.; Zachara, J.M. The effect of calcium on aqueous uranium(VI) speciation and adsorption to ferrihydrite and quartz. Geochim. Cosmochim. Acta 2006, 70, 1379–1387. [Google Scholar] [CrossRef] [Green Version]
- Merkel, B.; Schipek, M. (Eds.) The New Uranium Mining Boom: Challenge and Lessons Learned; Springer Geology; Springer: Berlin/Heidelberg, Germany, 2012; ISBN 978-3-642-22121-7. [Google Scholar]
- Shin, W.; Oh, J.; Choung, S.; Cho, B.-W.; Lee, K.-S.; Yun, U.; Woo, N.-C.; Kim, H.K. Distribution and potential health risk of groundwater uranium in Korea. Chemosphere 2016, 163, 108–115. [Google Scholar] [CrossRef]
- Hwang, J. Geological review on the distribution and source of uraniferous groundwater in South Korea. J. Eng. Geol. 2018, 28, 593–603. [Google Scholar]
- World Health Organization. Guidelines for Drinking-Water Quality, 4th ed.; World Health Organization: Geneva, Switzerland, 2017; ISBN 978-92-4-154995-0. [Google Scholar]
- Cornell, R.M.; Schwertmann, U. The Iron Oxides: Structure, Properties, Reactions, Occurrences and Uses; John Wiley & Sons: Hoboken, NJ, USA, 2003; ISBN 3-527-30274-3. [Google Scholar]


| Sample no. (1) | Sampling date | Temp. | pH | Eh (mV) | EC (μS/cm) | DO (mg/L) | TDS (mg/L) | Log PCO2 (atm) (2) | Concentrations (mg/L) | |||||||||
|---|---|---|---|---|---|---|---|---|---|---|---|---|---|---|---|---|---|---|
| (°C) | Na | K | Mg | Ca | SiO2 | Cl− | SO42− | NO3− | F− | Alk. (3) | ||||||||
| CO2-rich water (Na-HCO3 type) | ||||||||||||||||||
| KW-1(a) | Sep-01-98 | 19.4 | 6.04 | 318 | 1345 | 2.6 | 1629 | −0.02 | 345.0 | 23.0 | 1.6 | 31.5 | 79.6 | 7.0 | 12.9 | 0.1 | 7.5 | 1117 |
| KW-1′(a, c) | Jul-07-99 | 18.5 | 6.24 | 326 | 1348 | 3.1 | 1773 | −0.21 | 419.0 | 25.0 | 2.1 | 44.6 | 87.7 | 8.3 | 13.8 | n.d. | 7.7 | 1159 |
| KW-1″(b) | Apr-08-02 | 9.6 | 6.38 | 264 | 1469 | 4.2 | 1641 | −0.36 | 377.3 | 18.7 | 1.4 | 36.6 | 68.2 | 6.8 | 11.0 | 0.4 | 5.0 | 1113 |
| KW-2(a) | Sep-01-98 | 18.7 | 5.85 | 330 | 1268 | 3.8 | 2014 | 0.23 | 496.0 | 27.3 | 2.2 | 53.1 | 89.0 | 9.5 | 21.8 | 0.1 | 7.1 | 1302 |
| KW-2′(a, c) | Jul-07-99 | 18.2 | 6.21 | 337 | 2220 | 3.3 | 2625 | 0.02 | 544.0 | 32.1 | 2.6 | 57.1 | 93.1 | 2.5 | 22.4 | n.d. | 7.1 | 1861 |
| KW-2‴(b) | Apr-08-02 | 9.9 | 6.36 | 258 | 1941 | 2.3 | 2215 | −0.22 | 533.5 | 24.0 | 1.7 | 44.3 | 74.2 | 10.4 | 20.1 | n.d. | 4.2 | 1495 |
| KW-2″″(a) | Nov-19-10 | 6.1 | 6.31 | 284 | 2052 | 1.6 | 2118 | −0.19 | 472.7 | 35.4 | 2.0 | 58.2 | 90.4 | 14.0 | 20.1 | n.d. | n.d. | 1425 |
| KW-3 | Sep-01-98 | 15.8 | 5.87 | 317 | 864 | 3.1 | 1020 | −0.08 | 267.0 | 7.2 | 0.5 | 10.7 | 71.9 | 5.0 | 5.0 | 0.1 | 9.3 | 638 |
| KW-3′ | Jul-07-99 | 15.4 | 6.13 | 341 | 1058 | 2.8 | 1089 | −0.30 | 271.0 | 6.1 | 0.5 | 11.0 | 74.0 | 5.6 | 5.1 | 0.1 | 9.5 | 702 |
| KW-3‴(b, c) | Apr-08-02 | 11.2 | 6.55 | 235 | 1055 | 2.8 | 1569 | −0.55 | 408.1 | 5.7 | 0.3 | 12.9 | 73.7 | 4.4 | 3.7 | n.d. | 7.4 | 1052 |
| KW-4 | Sep-01-98 | 13.4 | 5.85 | 335 | 1956 | 1.2 | 1846 | 0.21 | 455.0 | 13.0 | 5.2 | 54.0 | 61.0 | 8.3 | 8.0 | 0.1 | 4.9 | 1233 |
| KW-4′ | Jul-07-99 | 19.8 | 6.43 | 343 | 1871 | 1.5 | 1921 | −0.35 | 457.0 | 10.5 | 5.1 | 53.2 | 60.1 | 8.6 | 7.3 | n.d. | 4.8 | 1312 |
| KW-4‴(b, c) | Apr-08-02 | 9.8 | 6.65 | 237 | 1713 | 0.5 | 1947 | −0.56 | 488.4 | 7.6 | 4.0 | 46.3 | 48.1 | 8.1 | 6.1 | n.d. | 3.1 | 1334 |
| KW-4″″ | Nov-19-10 | 9.7 | 6.62 | 280 | 1837 | 1.2 | 1903 | −0.54 | 433.7 | 13.0 | 4.6 | 57.8 | 59.5 | 21.7 | 8.8 | n.d. | n.d. | 1304 |
| CO2-rich water (Ca-Na-HCO3 type) | ||||||||||||||||||
| KW-5 | Jul-01-98 | 14.5 | 5.52 | 254 | 725 | 2.4 | 714 | 0.15 | 71.4 | 4.5 | 7.3 | 76.1 | 32.5 | 6.7 | 16.1 | 0.3 | 2.4 | 488 |
| KW-5′ | Jul-07-99 | 16.2 | 5.70 | 358 | 778 | 2.1 | 775 | 0.00 | 91.8 | 4.0 | 8.6 | 88.4 | 37.9 | 2.1 | 12.7 | n.d. | 2.6 | 519 |
| KW-5‴(b) | Apr-08-02 | 17.2 | 5.69 | 282 | 695 | 1.9 | 696 | −0.03 | 91.1 | 2.1 | 6.4 | 71.2 | 24.3 | 6.7 | 12.0 | n.d. | 1.9 | 473 |
| KW-5″″ | Nov-18-10 | 10.4 | 5.91 | 388 | 990 | 1.3 | 982 | −0.12 | 106.6 | 4.7 | 10.3 | 120.9 | 40.5 | 33.3 | 13.0 | n.d. | n.d. | 653 |
| KW-7(b, c) | Apr-08-02 | 13.5 | 6.45 | 237 | 894 | 2.1 | 967 | −0.66 | 89.7 | 2.4 | 11.9 | 134.2 | 37.5 | 11.2 | 7.9 | 5.4 | 2.7 | 656 |
| CO2-rich water (Ca-HCO3 type) | ||||||||||||||||||
| KW-8(a, c) | Oct-30-98 | 14.4 | 6.04 | 324 | 1528 | 3.5 | 1464 | −0.10 | 32.3 | 4.2 | 25.7 | 293.8 | 76.1 | 2.9 | 21.1 | 0.1 | 0.9 | 988 |
| KW-8′(a) | Nov-19-10 | 8.4 | 6.12 | 305 | 1451 | 1.6 | 1510 | −0.16 | 33.1 | 2.8 | 25.8 | 307.2 | 76.7 | 3.9 | 23.7 | 0.2 | 0.5 | 1036 |
| KW-9(a, b, c) | Oct-30-98 | 13.3 | 5.51 | 375 | 454 | 3.8 | 419 | −0.12 | 6.6 | 0.5 | 9.7 | 72.5 | 54.0 | 3.3 | 13.6 | 0.1 | 1.7 | 249 |
| KW-10(a, b, c) | Oct-30-98 | 10.7 | 5.88 | 406 | 677 | 5.1 | 642 | −0.29 | 15.0 | 2.7 | 11.9 | 109.7 | 60.8 | 2.6 | 10.5 | 0.3 | 1.5 | 411 |
| KW-10″(a) | Nov-19-10 | 6.4 | 5.93 | 326 | 909 | 1.7 | 900 | −0.18 | 20.4 | 2.5 | 17.0 | 163.6 | 75.1 | 4.0 | 16.5 | n.d. | 1.8 | 599 |
| KW-11(b) | Apr-08-02 | 7.3 | 6.34 | 170 | 1763 | 1.3 | 1993 | −0.24 | 49.1 | 2.4 | 45.9 | 348.7 | 73.4 | 5.9 | 12.3 | n.d. | 1.9 | 1434 |
| KW-12 | Jul-01-99 | 11.4 | 5.87 | 329 | 1034 | 1.6 | 1054 | −0.02 | 37.0 | 2.3 | 35.4 | 162.0 | 36.0 | 2.3 | 4.3 | 0.1 | 0.6 | 763 |
| KW-12′(b, c) | Apr-08-02 | 7.4 | 6.26 | 272 | 977 | 2.6 | 975 | −0.45 | 32.6 | 2.5 | 16.2 | 178.3 | 24.9 | 2.7 | 3.9 | 0.3 | 0.3 | 702 |
| KW-13 | Aug-01-98 | 16.2 | 5.81 | 343 | 873 | 0.8 | 856 | −0.06 | 14.8 | 1.6 | 36.1 | 140.0 | 35.1 | 2.1 | 9.2 | 0.1 | 0.2 | 598 |
| KW-13′ | Jul-07-99 | 10.4 | 5.75 | 393 | 915 | 0.6 | 964 | 0.06 | 15.5 | 4.6 | 37.2 | 140.0 | 39.2 | 2.3 | 7.8 | n.d. | 0.3 | 702 |
| KW-14(c) | Jul-07-99 | 14.1 | 5.78 | 317 | 921 | 2.1 | 834 | −0.02 | 15.2 | 2.9 | 46.1 | 93.0 | 30.2 | 2.1 | 7.6 | n.d. | 0.4 | 610 |
| KW-14′(b) | Apr-08-02 | 8.6 | 5.98 | 269 | 794 | 2.2 | 841 | −0.24 | 13.7 | 3.4 | 67.5 | 82.1 | 49.5 | 3.2 | 6.7 | n.d. | 0.3 | 589 |
| KW-15(c) | Oct-02-99 | 12.4 | 5.46 | 375 | 1098 | 3.6 | 1141 | 0.41 | 35.9 | 3.3 | 20.9 | 198.1 | 48.4 | 2.9 | 8.2 | n.d. | 0.8 | 808 |
| Average of CO2-rich water | 12.8 | 6.05 | 310 | 1234 | 2.3 | 1345 | −0.16 | 210.6 | 9.4 | 14.8 | 104.7 | 58.8 | 6.9 | 11.7 | 0.3 | 3.1 | 916 | |
| Standard deviation | 3.9 | 0.32 | 53 | 466 | 1.1 | 555 | 0.24 | 199.4 | 9.8 | 16.6 | 84.0 | 20.4 | 6.3 | 5.8 | 0.9 | 3.0 | 383 | |
| Shallow groundwater | ||||||||||||||||||
| KW−16 | Jul−01−98 | 20.2 | 6.56 | 379 | 125 | 5.8 | 86 | −2.11 | 15.1 | 1.1 | 1.5 | 5.3 | 12.3 | 11.2 | 8.0 | 1.4 | 2.3 | 27 |
| KW−16′ | Feb−17−00 | 6.8 | 6.78 | 342 | 101 | 6.5 | 78 | −2.51 | 9.8 | 0.6 | 2.4 | 5.4 | 11.0 | 14.8 | 11.6 | 4.1 | 0.3 | 18 |
| KW−16″ | Oct−16−00 | 22.0 | 6.13 | 317 | 268 | 7.5 | 181 | −1.47 | 36.7 | 1.3 | 0.52 | 7.2 | 23.1 | 25.8 | 39.0 | 1.7 | 0.2 | 45 |
| KW−17 | Sep−05−00 | 25.7 | 6.75 | 405 | 234 | 6.0 | 208 | −1.75 | 36.4 | 1.2 | 1.12 | 18.7 | 15.8 | 9.5 | 17.4 | 8.1 | 2.7 | 98 |
| KW−18(a) | Jul−01−98 | 13.7 | 6.49 | 452 | 69 | 7.0 | 63 | −2.09 | 6.0 | 0.7 | 1.6 | 3.7 | 19.4 | 4.8 | 1.4 | 0.4 | 0.4 | 24 |
| KW−20(a) | Jul−07−99 | 17.1 | 6.27 | 378 | 35 | 6.3 | 39 | −2.07 | 3.1 | 0.5 | 0.6 | 3.5 | 10.1 | 0.9 | 2.5 | 2.3 | 0.2 | 15 |
| Average of shallow GW | 17.6 | 6.50 | 379 | 139 | 6.5 | 109 | −2.00 | 17.8 | 0.9 | 1.3 | 7.3 | 15.3 | 11.2 | 13.3 | 3.0 | 1.0 | 38 | |
| Standard deviation | 6.1 | 0.24 | 43 | 85 | 0.6 | 63 | 0.32 | 13.7 | 0.3 | 0.6 | 5.2 | 4.7 | 7.9 | 12.7 | 2.5 | 1.1 | 28 | |
| Surface water | ||||||||||||||||||
| KW−5S | Jul−01−98 | 14.5 | 6.75 | 366 | 94 | 9.4 | 56 | −2.35 | 6.9 | 1.7 | 1.4 | 3.7 | 7.5 | 3.7 | 3.4 | 2.4 | 0.5 | 24 |
| KW−8S | Oct−30−98 | 13.4 | 7.77 | 354 | 53 | 9.4 | 52 | −3.36 | 2.1 | 0.5 | 0.9 | 6.8 | 9.9 | 1.0 | 4.1 | 1.4 | 0.0 | 25 |
| KW−9S | Oct−30−98 | 13.0 | 7.46 | 384 | 47 | 9.1 | 46 | −3.16 | 3.3 | 0.6 | 0.7 | 5.1 | 10.1 | 1.2 | 4.3 | 1.4 | 0.1 | 19 |
| KW−10S | Oct−30−98 | 10.2 | 6.86 | 389 | 60 | 9.6 | 50 | −2.46 | 1.9 | 0.5 | 0.1 | 8.1 | 8.4 | 0.9 | 4.5 | 1.0 | 0.1 | 24 |
| KW−13S | Aug−01−98 | 15.2 | 6.87 | 366 | 29 | 6.4 | 29 | −2.89 | 1.8 | 0.4 | 0.6 | 3.3 | 6.4 | 0.7 | 2.2 | 4.2 | 0.1 | 9 |
| KW−14S | Jul−01−99 | 17.2 | 6.89 | 358 | 46 | 8.7 | 54 | −2.45 | 3.6 | 0.9 | 1.7 | 3.6 | 11.8 | 1.7 | 2.8 | 1.5 | 0.1 | 26 |
| Average of surface water | 13.9 | 7.10 | 370 | 55 | 8.8 | 48 | −2.78 | 3.3 | 0.8 | 0.9 | 5.1 | 9.0 | 1.5 | 3.5 | 2.0 | 0.1 | 21 | |
| Standard deviation | 2.1 | 0.38 | 13 | 20 | 1.1 | 9 | 0.38 | 1.8 | 0.5 | 0.5 | 1.8 | 1.8 | 1.0 | 0.8 | 1.1 | 0.1 | 6 | |
| Sample no. (1) | Sampling Date | Concentrations (μg/L) | |||||||||||
|---|---|---|---|---|---|---|---|---|---|---|---|---|---|
| Fe | Sr | Mn | Al | Li | B | Cr | Zn | Rb | Cs | Ba | U | ||
| CO2−rich water (Na−HCO3 type) | |||||||||||||
| KW−1(a) | Sep−01−98 | 1465.0 | 284.1 | 294.0 | 961.0 | 254.0 | 104.0 | 24.0 | 15.7 | 666.0 | 18.1 | 218.0 | 2.6 |
| KW−1′(a, c) | Jul−07−99 | 5220.0 | 412.0 | 103.0 | 270.0 | 50.9 | 16.4 | 5.7 | 8.4 | 121.0 | 22.4 | 214.0 | 3.9 |
| KW−1″(b) | Apr−08−02 | 1215.0 | 337.5 | 133.0 | 457.5 | 107.2 | 69.6 | 2.1 | 26.6 | 178.4 | 17.4 | 188.4 | 3.9 |
| KW−2(a) | Sep−01−98 | 2543.0 | 453.6 | 341.0 | 1270.0 | 345.0 | 123.0 | 24.8 | 44.2 | 932.0 | 25.1 | 282.0 | 25.1 |
| KW−2′(a, c) | Jul−07−99 | 2123.0 | 524.0 | 113.0 | 117.0 | 61.9 | 22.9 | 10.7 | 8.3 | 150.0 | 24.9 | 170.0 | 25.0 |
| KW−2‴(b) | Apr−08−02 | 6752.0 | 420.0 | 154.2 | 196.0 | 141.6 | 107.0 | 14.6 | 29.7 | 189.9 | 21.8 | 118.3 | 16.9 |
| KW−2″″(a) | Nov−19−10 | 6617.4 | 464.5 | 358.7 | 1517.4 | 607.1 | 146.6 | n.d. | 38.3 | n.a. | n.a. | n.a. | n.a. |
| KW−3 | Sep−01−98 | 3752.0 | 62.4 | 469.0 | 308.0 | 340.0 | 62.0 | 16.0 | 51.1 | 334.0 | 21.5 | 105.0 | 10.0 |
| KW−3′ | Jul−07−99 | 4125.0 | 53.0 | 127.0 | 53.5 | 93.1 | 12.7 | 4.9 | 23.2 | 54.0 | 21.0 | 53.4 | 6.9 |
| KW−3‴(b, c) | Apr−08−02 | 3275.0 | 59.4 | 173.8 | 114.6 | 196.3 | 61.4 | 0.8 | 57.3 | 117.6 | 20.4 | 9.2 | 7.9 |
| KW−4 | Sep−01−98 | 1342.0 | 480.3 | 221.0 | 14.4 | 475.0 | 133.0 | 23.8 | 15.6 | 439.0 | 30.9 | 137.0 | 81.0 |
| KW−4′ | Jul−07−99 | 1794.0 | 495.0 | 95.4 | 3.1 | 220.0 | 37.4 | 8.0 | 12.9 | 80.8 | 30.0 | 105.0 | 56.5 |
| KW−4‴(b, c) | Apr−08−02 | 1235.0 | 519.4 | 105.7 | 8.4 | 317.8 | 123.0 | 2.9 | 23.3 | 137.7 | 28.4 | 44.3 | 60.4 |
| KW−4″″ | Nov−19−10 | 1824.8 | 476.1 | 260.4 | n.d. | 1336.2 | 138.1 | n.d. | 285.2 | n.a. | n.a. | n.a. | n.a. |
| Average | 3091.7 | 360.1 | 210.7 | 377.9 | 324.7 | 82.6 | 10.6 | 45.7 | 283.4 | 23.5 | 137.1 | 25.0 | |
| Std. Dev. | 1872.7 | 169.9 | 112.8 | 484.4 | 320.4 | 46.3 | 8.8 | 68.1 | 258.2 | 4.2 | 77.2 | 25.3 | |
| CO2−rich water (Ca−Na−HCO3 type) | |||||||||||||
| KW−5 | Jul−01−98 | 6267.0 | 1032.2 | 635.0 | 167.0 | 105.0 | 167.0 | 18.0 | 16.5 | 19.0 | 2.1 | 106.7 | 0.7 |
| KW−5′ | Jul−07−99 | 6702.0 | 1263.0 | 329.0 | 95.2 | 41.7 | 35.5 | 8.4 | 8.1 | 12.8 | 2.6 | 106.0 | 0.8 |
| KW−5‴(b) | Apr−08−02 | 5758.0 | 1031.0 | 254.7 | 101.4 | 125.5 | 80.4 | 2.0 | 13.6 | 17.6 | 2.0 | 90.1 | 1.1 |
| KW−5″″ | Nov−18−10 | 8987.0 | 1554.0 | 968.0 | 386.0 | 296.0 | 175.0 | n.d. | n.d. | n.a. | n.a. | n.a. | n.a. |
| KW−7(b, c) | Apr−08−02 | 5653.0 | 1848.0 | 261.7 | 24.3 | 114.5 | 95.9 | 0.9 | 5.9 | 7.7 | 0.5 | 810.2 | 8.2 |
| Average | 6673.4 | 1345.6 | 489.7 | 154.8 | 136.5 | 110.8 | 5.9 | 8.8 | 14.3 | 1.8 | 278.2 | 2.7 | |
| Std. Dev | 1216.4 | 316.2 | 276.7 | 124.1 | 84.9 | 53.1 | 6.7 | 5.8 | 4.4 | 0.8 | 307.2 | 3.2 | |
| CO2−rich water (Ca−HCO3 type) | |||||||||||||
| KW−8(b, c) | Oct−30−98 | 16309.0 | 1733.0 | 857.0 | 25.1 | 60.8 | 4.7 | 56.7 | 5.9 | 8.1 | 0.8 | 112.5 | n.d. |
| KW−8′(a) | Nov−19−10 | 15620.2 | 1704.5 | 1353.6 | n.d. | 91.4 | 97.5 | n.d. | 55.8 | n.a. | n.a. | n.a. | n.a. |
| KW−9(a, b, c) | Oct−30−98 | 6641.0 | 364.2 | 656.0 | 524.7 | 58.3 | 2.8 | 42.5 | 59.6 | 2.1 | 0.6 | 75.8 | 0.7 |
| KW−10(a, b, c) | Oct−30−98 | 14335.0 | 492.6 | 676.0 | 480.5 | 82.2 | 2.2 | 47.3 | 10.6 | 13.1 | 3.7 | 96.9 | n.d. |
| KW−10″(a) | Nov−19−10 | 29981.7 | 867.5 | 1235.5 | 723.7 | 123.5 | 153.6 | n.d. | 43.2 | n.a. | n.a. | n.a. | n.a. |
| KW−11(c) | Apr−08−02 | 16256.0 | 1859.0 | 795.7 | 83.4 | 85.5 | 13.4 | 9.8 | 2.3 | 31.5 | 7.7 | 80.7 | n.d. |
| KW−12 | Jul−01−99 | 9225.0 | 1954.0 | 404.0 | 3.8 | 29.2 | 7.3 | 9.9 | 12.5 | 3.3 | 0.5 | 218.0 | 1.1 |
| KW−12′(b, c) | Apr−08−02 | 8757.0 | 1848.0 | 293.1 | 13.9 | 117.8 | 12.7 | 1.9 | 20.3 | 4.1 | 0.4 | 243.2 | 1.2 |
| KW−13 | Aug−01−98 | 15231.0 | 1580.3 | 391.0 | 28.3 | 41.7 | 613.0 | 37.6 | 20.6 | 4.4 | 0.3 | 217.0 | 0.3 |
| KW−13′ | Jul−07−99 | 13812.0 | 1583.0 | 280.0 | 2.9 | 7.2 | 5.1 | 10.0 | 16.2 | 2.6 | 0.3 | 219.0 | 0.2 |
| KW−14(c) | Jul−07−99 | 25516.0 | 752.0 | 259.0 | 5.6 | 12.2 | 3.9 | 8.0 | 62.3 | 11.5 | 1.0 | 273.0 | n.d. |
| KW−14′(b) | Apr−08−02 | 24583.0 | 734.3 | 237.4 | 20.8 | 64.0 | 5.6 | 2.5 | 111.3 | 15.2 | 0.7 | 101.2 | 0.1 |
| KW−15(c) | Oct−02−99 | 10932.0 | 1912.0 | 1416.0 | 95.7 | 147.0 | 15.6 | 0.5 | 6.2 | 6.9 | 0.2 | 85.3 | 0.2 |
| Average | 3091.7 | 360.1 | 210.7 | 377.9 | 324.7 | 82.6 | 10.6 | 45.7 | 283.4 | 23.5 | 137.1 | 25.0 | |
| Std. Dev. | 1872.7 | 169.9 | 112.8 | 484.4 | 320.4 | 46.3 | 8.8 | 68.1 | 258.2 | 4.2 | 77.2 | 25.3 | |
| Shallow groundwater | |||||||||||||
| KW−16 | Jul−01−98 | 6.3 | 31.1 | 0.9 | 6.7 | 5.7 | 5.5 | 0.3 | 22.0 | 1.7 | n.d. | 46.1 | 0.3 |
| KW−16′ | Feb−17−00 | 5.2 | 25.3 | 1.5 | 15.4 | 1.1 | 3.8 | n.d. | 42.1 | 1.1 | n.d. | 76.8 | n.d. |
| KW−16″ | Oct−16−00 | 25.3 | 63.4 | 1.3 | 71.9 | 130.9 | 21.1 | 0.7 | 3.3 | 1.1 | 0.2 | 1.8 | 6.4 |
| KW−17 | Sep−05−00 | 15.2 | 98.6 | 1.3 | 7.0 | 27.6 | 16.4 | 0.3 | 217.7 | 0.8 | n.d. | 2.4 | 3.4 |
| KW−18(a) | Jul−01−98 | 6.7 | 63.0 | 3.4 | 4.0 | 0.9 | 1.9 | 2.7 | 7.1 | n.d. | n.d. | 44.2 | n.d. |
| KW−20(a) | Jul−07−99 | 23.0 | 24.0 | 1.2 | 17.0 | n.d. | 4.6 | 0.6 | 12.9 | 1.9 | n.d. | 38.4 | 0.3 |
| Average | 13.6 | 50.9 | 1.6 | 20.3 | 27.7 | 8.9 | 0.8 | 50.8 | 1.1 | 0.1 | 34.9 | 1.7 | |
| Std. Dev. | 8.2 | 26.9 | 0.8 | 23.5 | 47.1 | 7.2 | 0.9 | 75.7 | 0.6 | 0.0 | 26.2 | 2.4 | |
| Surface water | |||||||||||||
| KW−5S | Jul−01−98 | 67.3 | 38.7 | 16.9 | 53.6 | 0.9 | 19.5 | 2.1 | 5.9 | 3.0 | n.d. | 36.4 | n.d. |
| KW−8S | Oct−30−98 | 34.3 | 35.6 | 1.8 | 1.3 | 0.5 | n.d. | 4.3 | 0.8 | 0.8 | n.d. | 44.1 | n.a. |
| KW−9S | Oct−30−98 | 33.5 | 36.4 | 10.9 | 2.6 | 3.0 | n.d. | 4.1 | 1.3 | 0.9 | n.d. | 63.7 | 0.7 |
| KW−10S | Oct−30−98 | 61.2 | 36.2 | 3.7 | 6.0 | 1.4 | n.d. | 6.9 | 1.1 | 1.1 | n.d. | 38.3 | n.d. |
| KW−13S | Aug−01−98 | 35.2 | 20.8 | 1.5 | 14.4 | 0.2 | 33.8 | 3.1 | 2.6 | 0.9 | n.d. | 31.6 | n.a. |
| KW−14S | Jul−01−99 | 91.0 | 32.0 | 2.2 | 4.7 | n.d. | 2.6 | 0.9 | 1.4 | 2.0 | n.d. | 106.0 | n.d. |
| Average | 53.8 | 33.3 | 6.2 | 13.8 | 1.0 | 9.3 | 3.6 | 2.2 | 1.4 | − | 53.4 | − | |
| Std. Dev. | 21.4 | 5.9 | 5.8 | 18.3 | 1.0 | 13.0 | 1.9 | 1.8 | 0.8 | − | 25.7 | − | |
| Guidelines for Drinking−Water Quality in Chemical Aspects (WHO) | − | − | − | − | − | 2400 | 50 | − | − | − | 1300 | 30 | |
| Guidelines for Drinking−Water Quality in Acceptability Aspects (WHO) | 300 | − | 100 | 100 | − | − | − | 4000 | − | − | − | − | |
| Sample no. (1) | Sampling Date | δ18O (‰) | δD (‰) | δ13C (‰) | Tritium (T.U.) |
|---|---|---|---|---|---|
| CO2−rich water (Na−HCO3 type) | |||||
| KW−1 (a) | Sep−01−98 | −10.9 | −76.8 | −8.1 | 5.0 |
| KW−1′ (a) | Jul−07−99 | −11.3 | −81.6 | −4.0 | n.a. |
| KW−2 (a) | Sep−01−98 | −11.7 | −83.3 | −8.3 | 1.7 |
| KW−2′ (a) | Jul−07−99 | −12.1 | −89.3 | −0.3 | n.a. |
| KW−2″″ (a) | Nov−19−10 | −11.8 | −82.5 | −3.7 | n.a. |
| KW−3 | Sep−01−98 | −11.3 | −78.3 | −7.8 | 0.0 |
| KW−3′ | Jul−07−99 | −11.3 | −83.3 | −2.8 | n.a. |
| KW−4 | Sep−01−98 | −11.5 | −80.0 | −3.0 | 0.0 |
| KW−4′ | Jul−07−99 | −11.4 | −84.0 | −7.4 | n.a. |
| KW−4″″ | Nov−19−10 | −11.3 | −80.1 | −4.5 | n.a. |
| CO2−rich water (Ca−Na−HCO3 type) | |||||
| KW−5 | Jul−01−98 | −10.4 | −72.7 | −8.8 | 7.6 |
| KW−5′ | Jul−07−99 | −10.5 | −75.3 | −5.3 | n.a. |
| KW−5″″ | Nov−18−10 | −10.6 | −72.7 | −4.6 | n.a. |
| CO2−rich water (Ca−HCO3 type) | |||||
| KW−8 (a) | Oct−30−98 | −10.7 | −74.4 | 0.8 | 2.5 |
| KW−8′ (a) | Nov−19−10 | −10.7 | −73.6 | −4.3 | n.a. |
| KW−9 | Oct−30−98 | −10.1 | −72.3 | −6.1 | 7.6 |
| KW−10 | Oct−30−98 | −10.8 | −75.2 | −5.1 | 5.2 |
| KW−10″ (a) | Nov−19−10 | −10.7 | −74.7 | −4.7 | n.a. |
| KW−12 | Aug−01−98 | −10.6 | −77.7 | −5.4 | 7.0 |
| KW−13 | Aug−01−98 | −10.7 | −69.5 | n.a. | 7.0 |
| KW−13′ | Jul−07−99 | −10.7 | −77.3 | n.a. | n.a. |
| KW−14 | Jul−07−99 | −9.9 | −70.3 | −6.6 | n.a. |
| KW−15 | Sep−30−99 | n.a. | n.a. | −4.7 | n.a. |
| Shallow groundwater | |||||
| KW−16 | Jul−01−98 | −8.6 | −54.8 | −16.8 | 4.1 |
| KW−16′ | Feb−17−00 | −8.7 | −62.3 | −15.7 | 6.7 |
| KW−18 (a) | Jul−01−98 | −8.9 | −58.3 | −19.0 | 6.1 |
| KW−20 (a) | Jul−07−99 | −11.0 | −81.3 | −17.2 | n.a. |
| Surface water | |||||
| KW−5S | Oct−30−98 | −10.2 | −72.4 | n.a. | 7.9 |
| KW−8S | Jul−01−98 | −8.7 | −65.2 | n.a. | 12.5 |
| Rock Type (1) | Sample no. | SiO2 | Al2O3 | Fe2O3 | MnO | CaO | MgO | K2O | Na2O | P2O5 | TiO2 | Loss−on−Ignition | Sum |
|---|---|---|---|---|---|---|---|---|---|---|---|---|---|
| wt. % | |||||||||||||
| Na−HCO3 type | |||||||||||||
| Biotite granite | KW−1 | 74.68 | 13.85 | 1.33 | 0.11 | 0.52 | 0.12 | 4.20 | 3.14 | 0.03 | 0.03 | 0.55 | 98.56 |
| Biotite granite (a)) | “ | 73.83 | 13.99 | 1.67 | 0.05 | 0.96 | 0.40 | 4.99 | 2.83 | 0.04 | 0.17 | 0.54 | 99.47 |
| Biotite granite gneiss | “ | 73.43 | 13.99 | 2.04 | 0.05 | 0.83 | 0.19 | 5.48 | 3.21 | 0.03 | 0.19 | 0.27 | 99.71 |
| Porphyroblastic gneiss | “ | 71.16 | 15.16 | 2.15 | 0.04 | 1.23 | 0.24 | 5.55 | 3.50 | 0.04 | 0.22 | 0.29 | 99.58 |
| Biotite granite (a) | KW−2 | 73.17 | 14.30 | 1.94 | 0.08 | 1.75 | 0.30 | 4.04 | 3.14 | 0.06 | 0.23 | 0.34 | 99.35 |
| Granite gneiss | KW−3 | 74.91 | 14.21 | 1.55 | 0.06 | 1.25 | 0.15 | 4.24 | 3.06 | 0.02 | 0.06 | 0.39 | 99.90 |
| Biotite granite gneiss | KW−4 | 68.93 | 15.47 | 3.40 | 0.06 | 3.19 | 1.33 | 2.66 | 3.19 | 0.12 | 0.33 | 0.47 | 99.15 |
| Biotite granite | “ | 76.65 | 12.45 | 1.33 | 0.03 | 0.43 | 0.02 | 4.53 | 3.53 | − | 0.04 | 0.29 | 99.30 |
| Porphyroblastic gneiss | “ | 63.39 | 17.16 | 5.11 | 0.10 | 3.91 | 2.35 | 3.15 | 3.23 | 0.15 | 0.63 | 1.29 | 100.47 |
| Average | 72.24 | 14.51 | 2.28 | 0.06 | 1.56 | 0.57 | 4.32 | 3.20 | 0.06 | 0.21 | 0.49 | 99.50 | |
| Ca−HCO3 type | |||||||||||||
| Biotite granite gneiss | KW−8 | 73.90 | 14.81 | 1.43 | 0.02 | 0.97 | 0.29 | 4.69 | 3.02 | 0.05 | 0.19 | 0.69 | 100.06 |
| Biotite granite (a) | “ | 69.47 | 15.64 | 3.45 | 0.06 | 2.90 | 1.13 | 4.06 | 2.76 | 0.11 | 0.47 | 0.42 | 100.47 |
| Biotite granite (a) | “ | 72.40 | 14.70 | 2.33 | 0.04 | 2.08 | 0.63 | 4.03 | 2.89 | 0.09 | 0.32 | 0.48 | 99.99 |
| Biotite granite (a) | “ | 67.96 | 15.93 | 4.15 | 0.06 | 3.28 | 1.38 | 3.43 | 2.88 | 0.13 | 0.56 | 0.35 | 100.11 |
| Biotite granite (a) | KW−9 | 67.48 | 15.95 | 3.52 | 0.06 | 3.42 | 1.09 | 3.89 | 2.88 | 0.11 | 0.44 | 0.60 | 99.44 |
| Banded gneiss | KW−11 | 70.59 | 15.67 | 3.01 | 0.04 | 1.97 | 0.98 | 4.02 | 2.76 | 0.10 | 0.40 | 1.05 | 100.59 |
| Banded gneiss | KW−12 | 75.20 | 12.44 | 4.06 | 0.08 | 1.26 | 1.31 | 2.24 | 2.35 | 0.04 | 0.31 | 0.83 | 100.12 |
| Average | 71.00 | 15.02 | 3.14 | 0.05 | 2.27 | 0.97 | 3.77 | 2.79 | 0.09 | 0.38 | 0.63 | 100.11 | |
© 2020 by the authors. Licensee MDPI, Basel, Switzerland. This article is an open access article distributed under the terms and conditions of the Creative Commons Attribution (CC BY) license (http://creativecommons.org/licenses/by/4.0/).
Share and Cite
Do, H.-K.; Yun, S.-T.; Yu, S.; Ryuh, Y.-G.; Choi, H.-S. Evaluation of Long-Term Impacts of CO2 Leakage on Groundwater Quality Using Hydrochemical Data from a Natural Analogue Site in South Korea. Water 2020, 12, 1457. https://doi.org/10.3390/w12051457
Do H-K, Yun S-T, Yu S, Ryuh Y-G, Choi H-S. Evaluation of Long-Term Impacts of CO2 Leakage on Groundwater Quality Using Hydrochemical Data from a Natural Analogue Site in South Korea. Water. 2020; 12(5):1457. https://doi.org/10.3390/w12051457
Chicago/Turabian StyleDo, Hyun-Kwon, Seong-Taek Yun, Soonyoung Yu, Yon-Gyung Ryuh, and Hyeon-Su Choi. 2020. "Evaluation of Long-Term Impacts of CO2 Leakage on Groundwater Quality Using Hydrochemical Data from a Natural Analogue Site in South Korea" Water 12, no. 5: 1457. https://doi.org/10.3390/w12051457