Differences in the Effects of Storms on Dissolved Organic Carbon (DOC) in Boreal Lakes during an Early Summer Storm and an Autumn Storm


Climate Change Institute and School of Biology and Ecology, University of Maine, Orono, ME 04469, USA
*
Author to whom correspondence should be addressed.
Water 2020, 12(5), 1452; https://doi.org/10.3390/w12051452
Submission received: 6 March 2020
/
Revised: 8 May 2020
/
Accepted: 18 May 2020
/
Published: 20 May 2020
(This article belongs to the Special Issue Effect of Extreme Climate Events on Lake Ecosystems)
Abstract
:In boreal lakes, increased precipitation events have been linked to increased concentrations of dissolved organic carbon (DOC), however the effects of seasonal differences on DOC and how this may impact storm response remain unclear. We evaluated DOC concentration and a set of DOC quality metrics during an early summer storm and an autumn storm on a suite of six lakes in Acadia National Park in Maine, USA. to better understand differences in seasonal storm responses. Our results revealed differences in the response of DOC quality metrics to an early summer versus an autumn storm, with changes in DOC quality metrics varying by storm and lake features. During the early summer storm, we observed greater changes in various DOC quality metrics in deep lakes with longer residence times, whereas during the autumn storm, lakes with large watershed area to lake area ratios experienced the greatest changes. Land cover was highly correlated with changing DOC quality metrics in the early summer storm but did not play a significant role in the autumn storm response. Our research provides evidence of seasonal differences in the effects of storms on boreal lakes, which are ultimately mediated by a combination of lake and watershed characteristics as well as seasonal differences in climate such as solar radiation and antecedent weather conditions.
1. Introduction
Dissolved organic carbon (DOC) is an important regulator of ecosystem structure and function in lakes [1,2,3]. DOC concentration and DOC quality, which relate to the structure and composition of DOC, affects overall water transparency and thermal stratification [4,5], alters pH and alkalinity [6,7], impacts microbial production [8,9], and attenuates harmful ultraviolet radiation [10]. DOC quantity and quality in a lake are dependent on vegetation type, season, climate, hydrology, and disturbance to the surrounding watershed [11,12]. Further, changes in DOC quality play a key role in biogeochemical and photochemical processes in lakes [13]. Widespread increases in DOC and color in lakes in the Northern Hemisphere have been attributed to a combination of factors including increases in air temperatures [14,15], changes in the intensity of the hydrological cycle [16,17], and reductions in acid deposition [18].
Lakes respond rapidly to external pressures, including changes in weather and climate as well as land use [19]. In many regions across the globe, precipitation events have increased [20,21,22,23], particularly in the northeastern United States, with a 60–70% increase since the 1950s [24,25,26,27,28,29,30]. Since 1996, the northeastern U.S. has received 53% more extreme precipitation events compared to 1901–1995 [30]. Increased precipitation can lead to changes in water chemistry, nutrient loading, increased particulates, and increased DOC. Studies have examined relationships between rainfall and nutrients [31,32], but less is known about how changes in precipitation influence DOC. Much of the climate change literature with respect to limnology is dominated by the evaluation of long-term and global patterns that result from atmospheric warming [33], however more recent research investigates the influence of short-term precipitation events on lakes [34] and provides a comparison of short-term and longer-term lake changes caused by climate change [35,36]. Understanding how DOC responds to precipitation events at different times of the year is still poorly considered.
The timing of precipitation events is changing seasonally. Average annual precipitation across the U.S. has increased by 4% since 1901 with this increase attributed to more precipitation during the autumn season [23]. In the northeastern U.S. specifically, precipitation has increased by more than 15 percent in the autumn and by about 3% in the spring since 1901 [23], with the months of September and October contributing the most to increased extreme precipitation events due to an increase in the frequency of extreme events caused by tropical cyclones [30]. The frequency and intensity of extreme precipitation is predicted to continue to increase across all seasons, with June through October contributing more than other months, and September and October contributing the most to future increases in extreme precipitation events [37,38]. This variation in precipitation at different times of year may impact lake response to storm events, specifically DOC.
Examining lakewater DOC response to precipitation events during different seasons is important. For example, an increase in winter precipitation that results in substantial spring runoff may displace a large volume of the lake’s water downstream, therefore old DOC in the lake from previous seasons may be replaced by DOC from the catchment that is more labile compared to other seasons [39]. Increases in DOC concentration have been observed in summers with high rainfall [39] particularly after dry periods where the upper soils have been oxidized to produce labile DOC [40,41]. Antecedent conditions also affect the response of DOC to various climate variables. Gavin et al. [42] demonstrated an increase in DOC after a heavy precipitation month that had dry antecedent conditions. Increases in DOC concentrations were also noted in Canadian boreal lakes after 90% of mean summer precipitation fell in a four-day rain event [43]. Both the quantity of precipitation and the season in which the precipitation events occur influence DOC concentrations [39,44].
Season also affects lakewater DOC responses in other ways. Incident solar radiation, which varies seasonally, can have profound long- and short-term effects on DOC concentrations and quality in lakes. In one study, over 11 days, approximately 50% of stream DOC was lost under natural light conditions due to photodecomposition [45]. In another study, over the course of 12 years, it was estimated that photodecomposition processes had the potential to remove most of the allochthonous DOC entering lakes [46]. This radiation can impact lake thermal properties such as epilimnion thickness that also may influence DOC response to storm events. For example, DOC concentration can alter vertical structure in lakes [47,48]. Also, shallower epilimnia in early summer, near the summer solstice, may lead to more photobleaching of DOC, altering DOC quality and possibly the bioavailability of DOC, while deeper epilimnia in the autumn may lead to less light exposure, less photobleaching, and a different storm response compared to early summer.
While landscape features do not vary extensively between seasons, seasonal differences in effects of precipitation mediated by landscape features may contribute to variation of lakewater DOC response to storms. The ratio of the watershed area to the lake area (WA:LA) is related to DOC concentration and quality [49,50]. Additionally, the composition of the watershed, including coverage by wetlands [40,51] or amount of forested area [52,53] influences DOC concentration and quality. The influx and processing of DOC into the lake can be altered by residence time [50]. In a recent study, in lakes with shorter residence times, DOC concentration and allochthonous DOC increased in response to storm events [34]. Increases in the amount and rate of stream, groundwater, and subsurface inflows into lakes occur from extreme precipitation events [54], therefore watershed characteristics can contribute to flushing of DOC from upper soil horizons into lakes [55]. This flushing of DOC into lakes can impact bacterial processes within the lake, subsequently affecting DOC quality [56]. Depending on the amount of precipitation during a particular time of year, these landscape features around lakes are also important for evaluating the impacts of storm events on changing DOC.
The goal of this study was to investigate relationships between the quantity and quality of lakewater DOC and the seasonal timing of precipitation events. Does DOC respond differently to a rain event in the early summer compared to a rain event in the autumn? Specifically, how does DOC concentration and how do DOC quality metrics change due to a precipitation event in the early summer versus autumn? To address this question, a set of DOC concentration and quality metrics (SUVA254, a*320, a*380, E2:E3, and S275–295) were measured during a storm event in June and a storm event in October of 2016 in six boreal lakes located in Acadia National Park, Maine, USA. Lake and landscape features associated with each lake vary, but the lakes are located in the same geographic region, which enables evaluation of lake response to the same climate and weather patterns. We evaluated changes in DOC concentration and changes in DOC quality using metrics that represent the balance of allochthonous inputs (SUVA254, a*320, a*380), photobleaching (S275–295), and bacterial processing (E2:E3). Each lake was sampled 1–2 days prior to the storm, and 1–2 days as well as 4 days after a rain event.
We predicted that DOC concentration would increase after a precipitation event in lakes with shorter residence times in both the early summer and autumn storms due to rapid influx of organic matter from the watershed. We also predicted that, during the early summer storm, DOC quality metrics indicative of photobleaching would increase and DOC metrics that represent allochthonous inputs would decrease most in deeper lakes due to higher solar radiation. In the early summer, with higher solar radiation, photodecomposition within lakes can remove allochthonous DOC entering the lake [46] and shallower epilimnia can also lead to increased photobleaching [47]. Deeper lakes that have longer residence times may have slower inputs of allochthonous DOC and stronger thermal stratification, which would support the predicted increased photobleaching and a decrease in allochthonous DOC. We predicted that, during the autumn storm, DOC quality metrics that represent allochthonous inputs would increase and DOC metrics indicative of bacterial processing would decrease most in lakes with large watershed to lake area ratios due to larger amounts of accumulated organic matter being flushed into these lakes, and additional organic matter can contribute to increased bacterial processing [56].
2. Materials and Methods
2.1. Study Site and Lake Selection
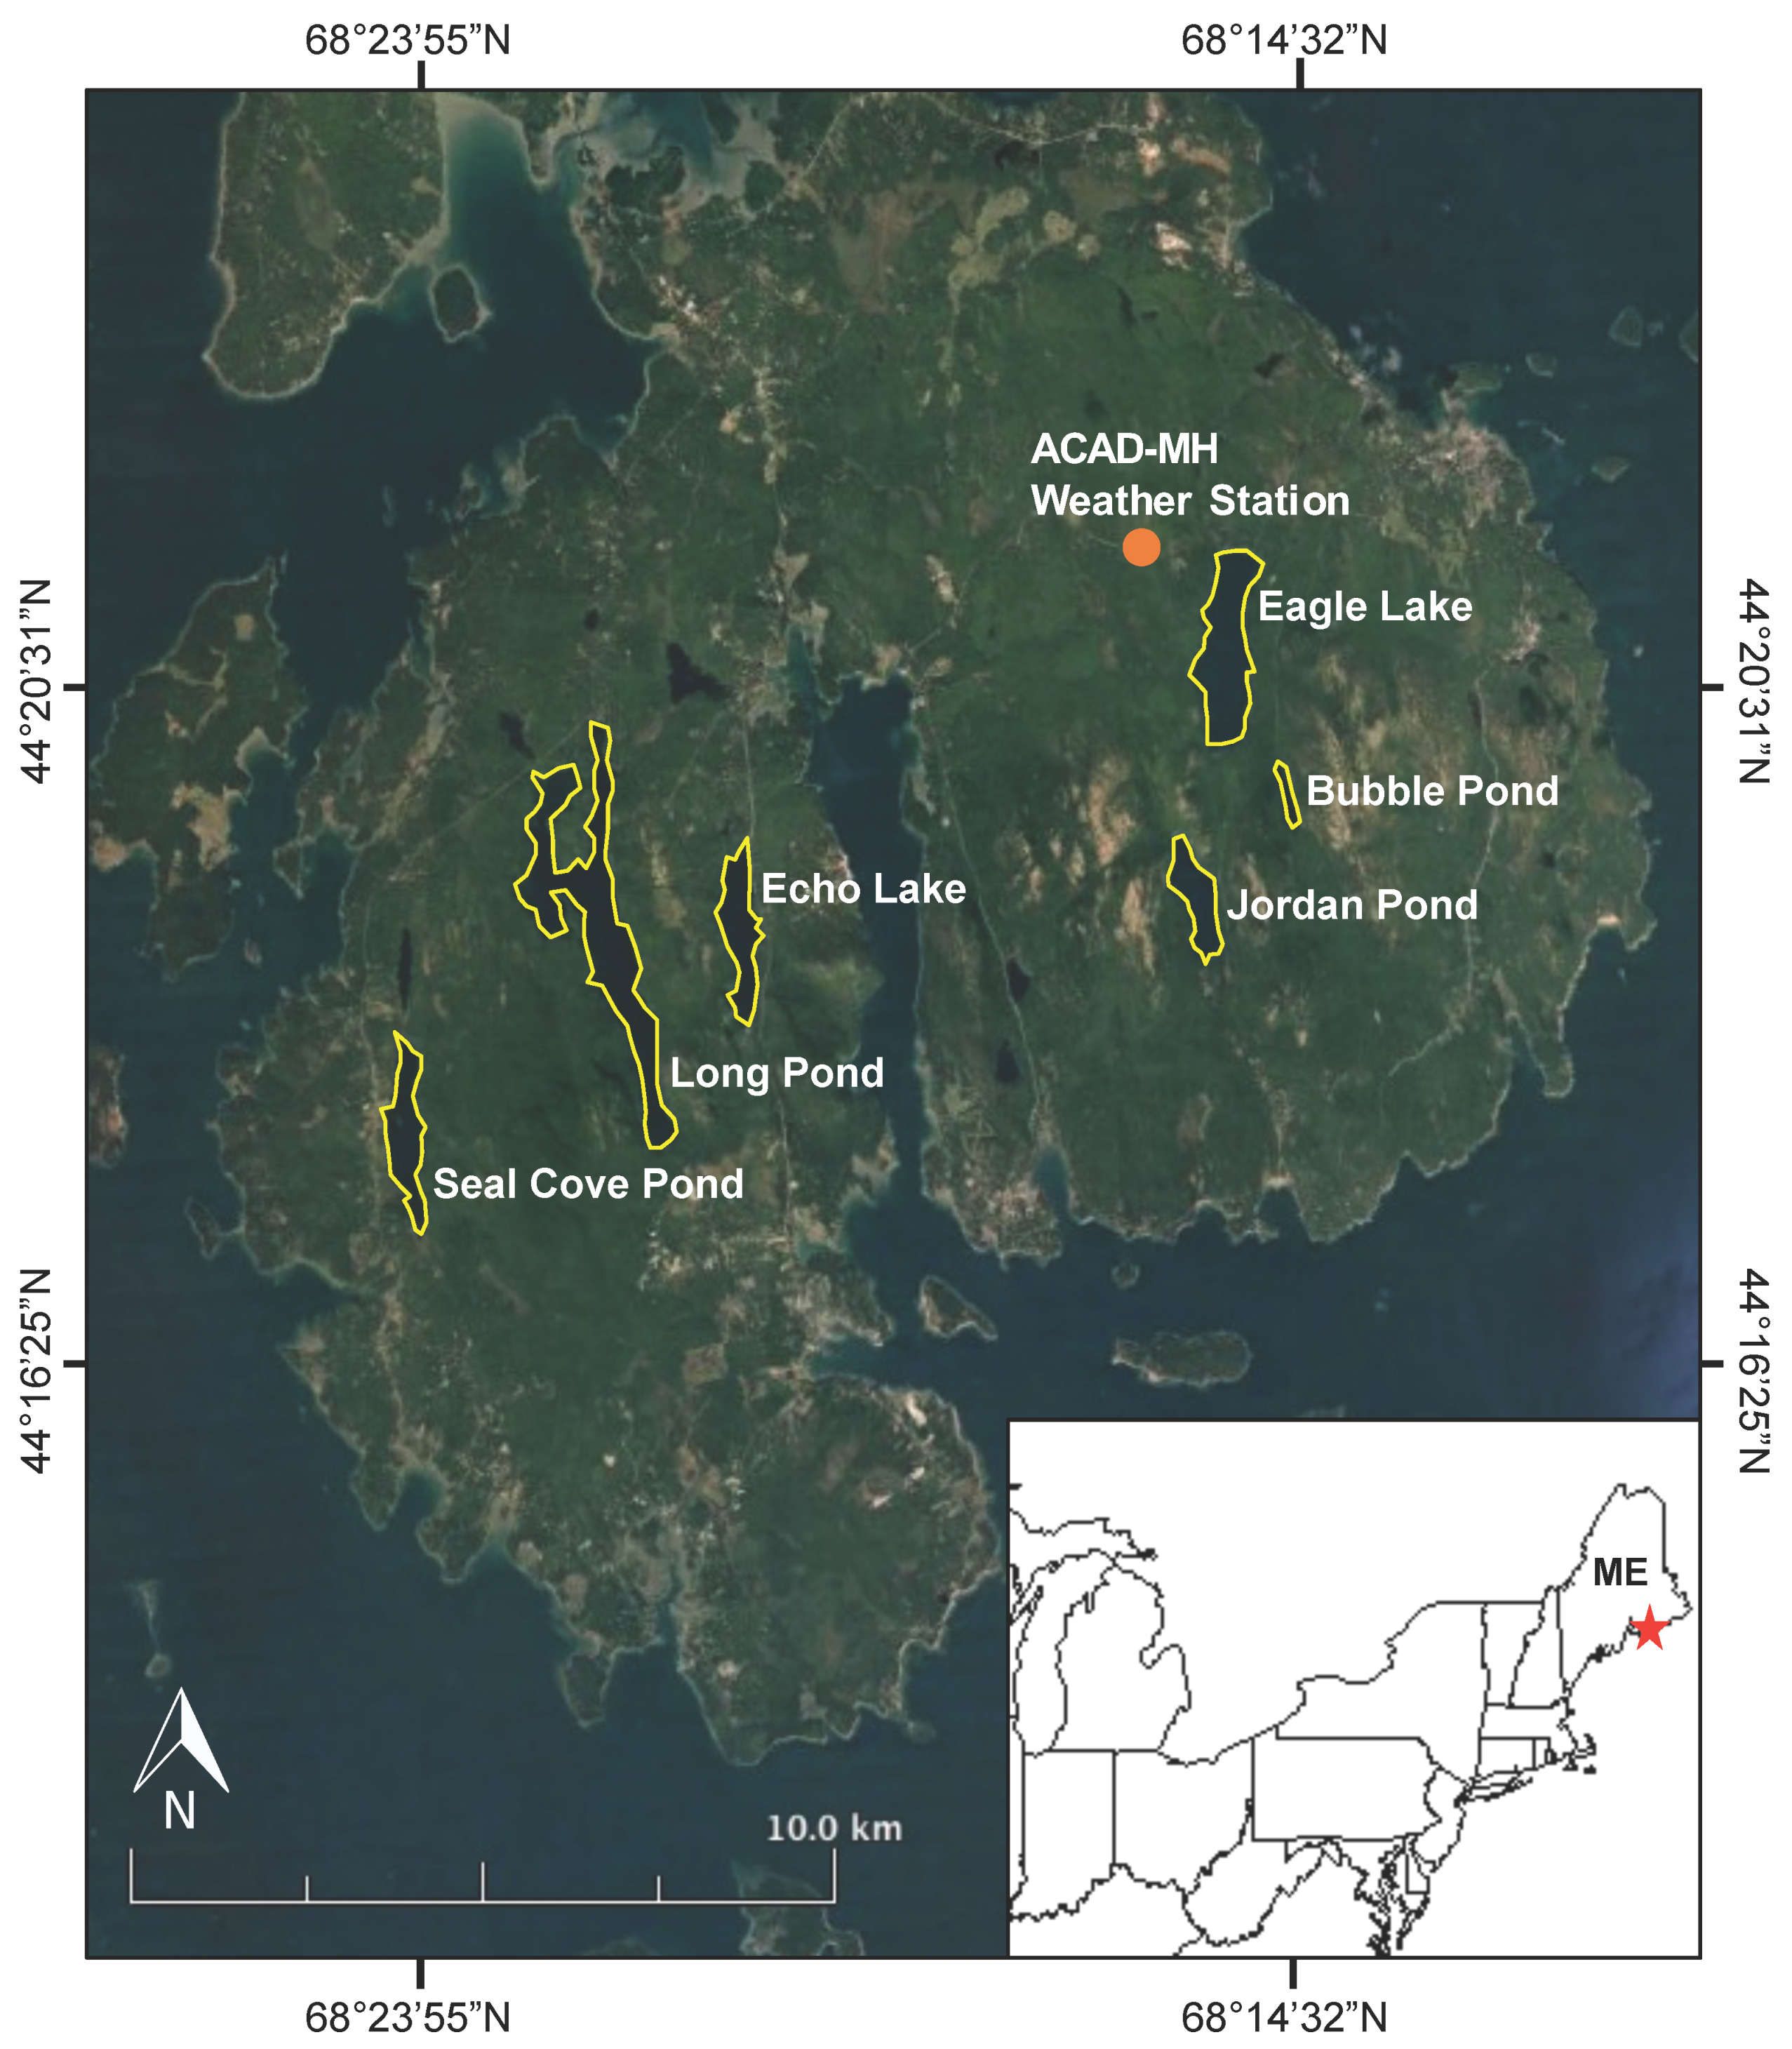
The lakes in this study are located in Acadia National Park in Maine, USA (Figure 1; Table 1). Within the 35,000-acre park, lakes cover approximately 2600 acres. Granite dominates the landscape throughout the park and soils in Acadia are derived from granite and schist tills [57]. Spruce-fir forests, representative of the northern boreal forest, cover much of the landscape in Acadia with stands of oak, maple, and beech, typical of the eastern deciduous forest, dominant in some areas that were burned in a fire in 1947.
We selected a suite of six lakes in Acadia National Park to conduct our study. Prior research has revealed that DOC concentrations have increased over the past two decades [58] in these six lakes. DOC concentrations ranged from 1.9 to 4.7 mg L−1 (Table 1). Lake sizes, measured in surface area, ranged from 0.1 to 3.8 km2, and maximum lake depth ranged from 12 to 46 m (Table 1). Residence time ranged from 0.5 to 5.9 years, and the ratio of the watershed area to lake (surface) area (WA:LA) ranged from 3 to 13.5 (Table 1). We selected lakes in the park that have been studied before and vary in lake and landscape features. This is important to compare the responses of lakes with low versus high DOC concentrations, varying depths and residence times, and also different land cover combinations within the watershed. We selected lakes located in the same geographic region to effectively compare lake response to storm events and evaluate changes in DOC concentration and quality.
Climate conditions in Acadia National Park have been changing in recent decades. Average annual temperatures have been increasing at a rate of 0.076 °C per year since 1983 [58]. Precipitation data from the Acadia National Park McFarland Hill (ACAD-MH) weather station (shown in Figure 1) suggests increases in precipitation and number of heavy rainfall events in recent decades. Average total annual precipitation was 1358.4 mm from 1982 to 1999 and 1431.3 mm from 2000 to 2016. Average total precipitation from June through October was 459.2 mm from 1982 to 1999 and 534.7 mm from 2000 to 2016. Additionally, the average number of precipitation events greater than 25.4 mm from June through October was 3.6 from 1982 to 1999 and 5.4 from 2000 to 2016. On average, in September and October, there were 1.8 precipitation events greater than 25.4 mm from 1982 to 1999 and 2.9 precipitation events greater than 25.4 mm from 2000–2016.
2.2. Storm Events and Sample Collection
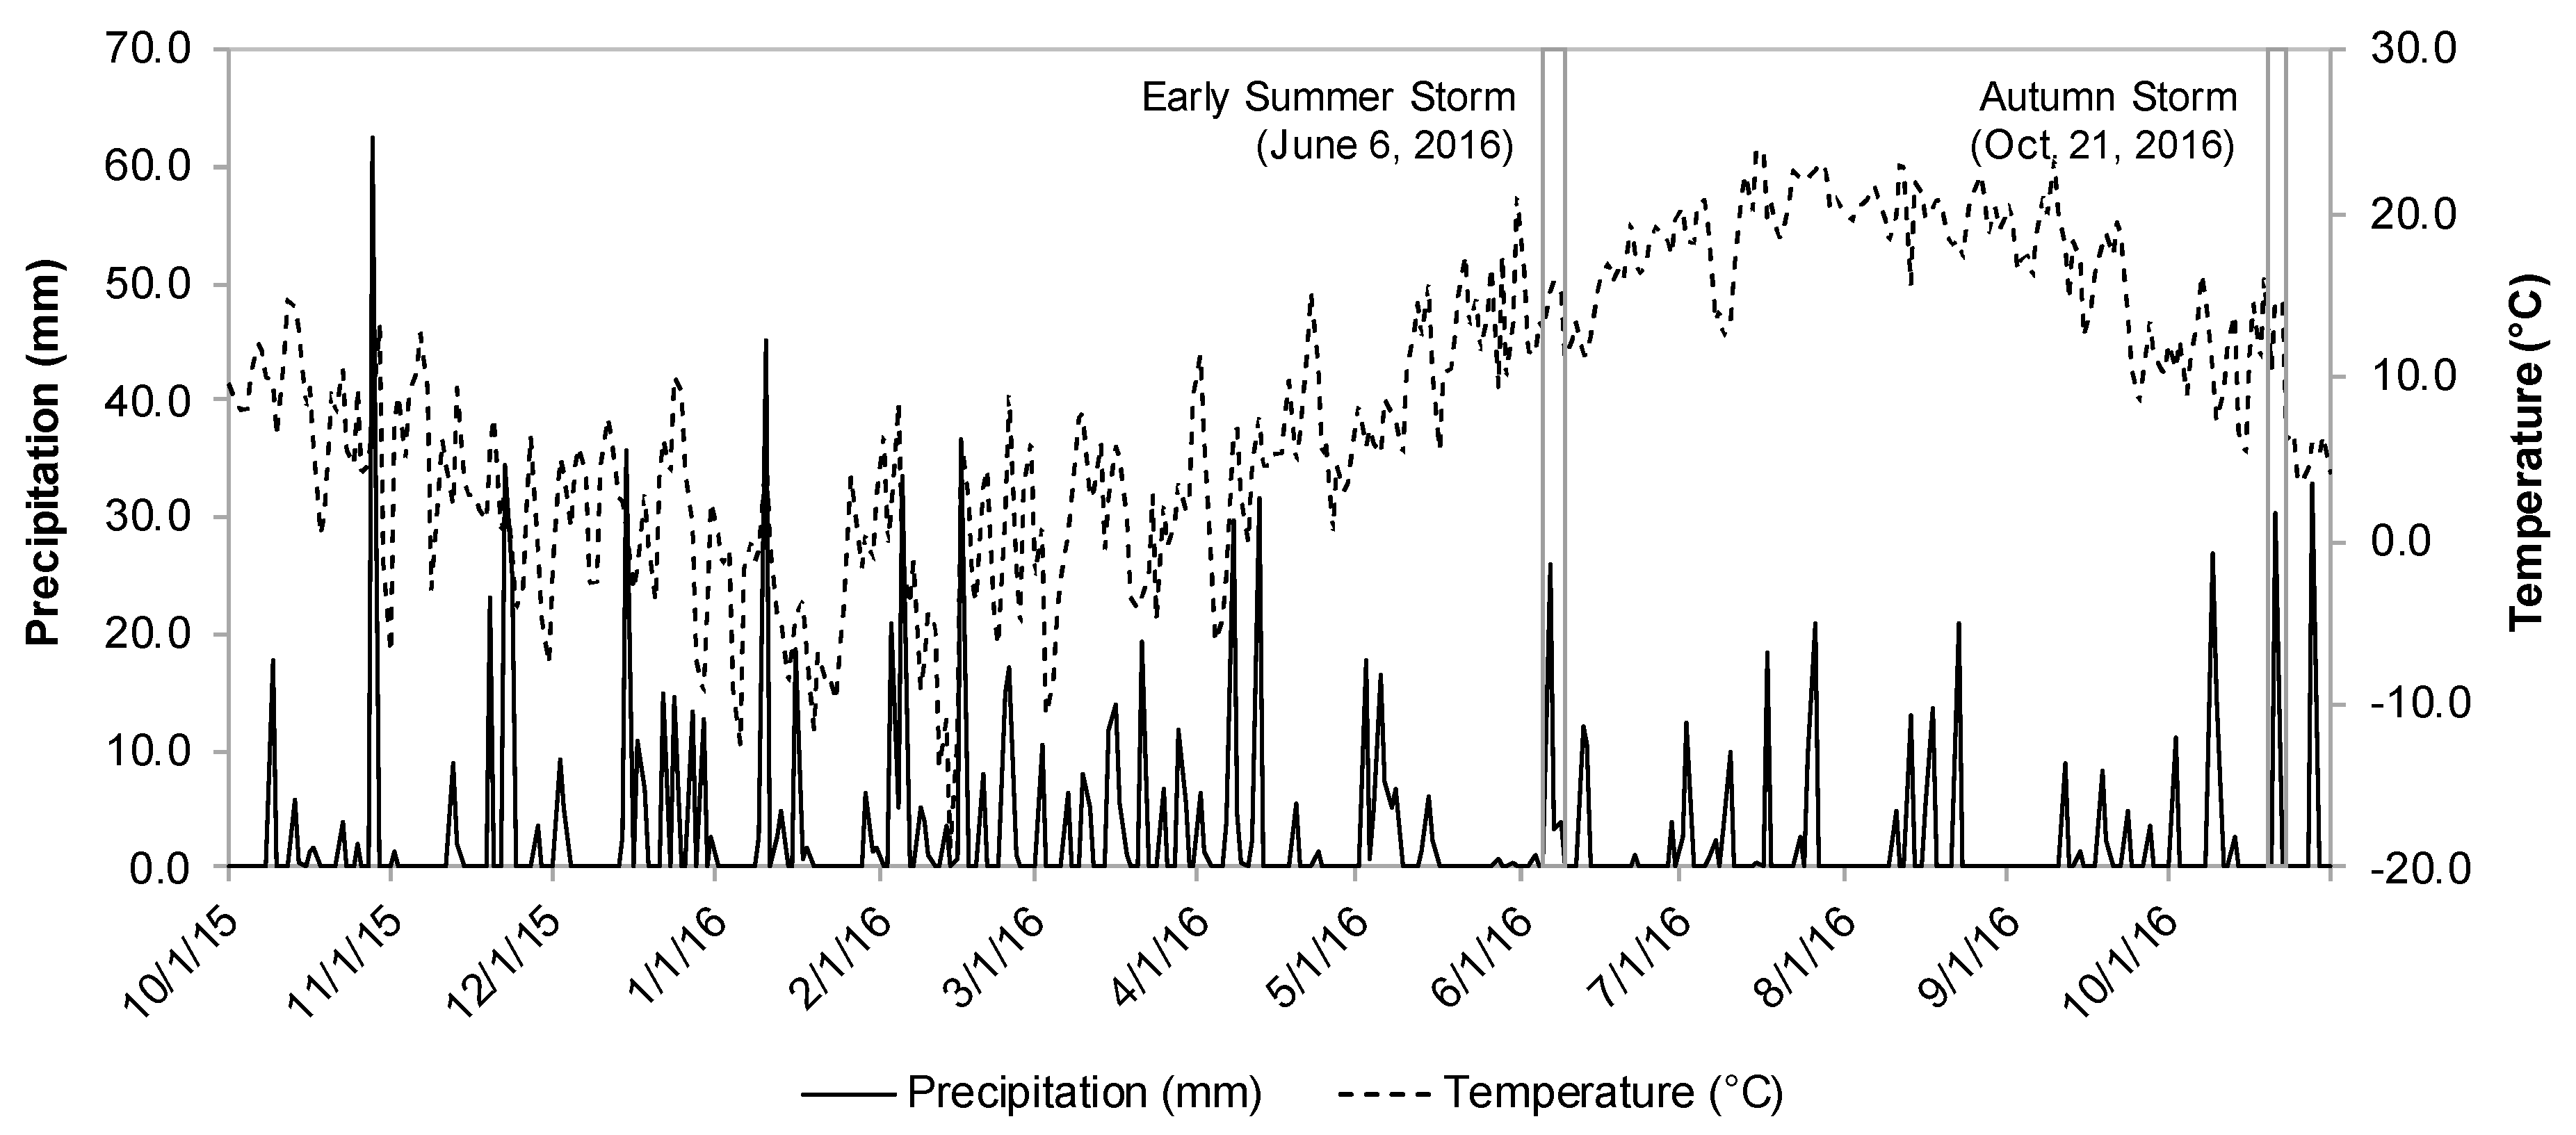
We sampled two events, one in June and one in October, representing an early summer rain event and an autumn rain event. Precipitation and air temperature data were collected from the ACAD-MH weather station. Hourly climate data were converted to daily climate data from 1 October 2015 to 31 October 2016. These events had 25.9 mm of rain within 24 h in June and 30.2 mm of rain in 24 h in October (Figure 2; Table 2). The goal of the study was to evaluate the response of extreme precipitation events, which is typically defined as a set amount in a 24-h period, i.e., [24,59,60,61] and others, or events that fall into the highest 1–2% of all precipitation events for a given year or range of years. While these rain amounts may not be considered extreme rain events, these storms still constituted the top rain events for the year, falling into the top 2.2% of highest rainstorms between 1 May 2016 and 31 October 2016.
Samples were collected at each lake at 3 time periods for each storm: 1–2 days before (Pre), 1–2 days after (P1), and 4 days after (P2) the rain events (Table 2). One liter of water was collected from the epilimnion using a van Dorn bottle at each lake for the analysis of DOC concentration and quality metrics.
2.3. Analysis of DOC Concentration and Quality
All samples were analyzed for DOC concentration and quality immediately upon receipt. DOC samples were filtered through Whatman Puradisc GF/F filters pre-rinsed with deionized water. DOC concentration was analyzed on a Shimadzu Total Organic Carbon Analyzer (Shimadzu Corporation, Kyoto, Japan). The fraction of DOC that absorbs ultraviolet and visible light is largely responsible for the optical properties of natural waters [62], which is how we quantified DOC quality. A Varian Cary UV-VIS spectrophotometer (Agilent Technologies, Santa Clara, CA, USA) was used to measure the absorbance properties within 200–800 nm wavelengths to assess DOC quality. Corrected absorbance values were calculated by subtracting a Milli-Q deionized water blank from the raw absorbance values. The following equation was used to calculate Napierian dissolved absorption coefficients [63,64]:
where D is the decadal optical density value from the spectrophotometer and r (measured in meters) is the path length of the quartz cuvette. Specific ultraviolet absorbance (SUVA254), a*320, and a*380 were calculated by dividing ad by the DOC concentration (mg L−1). Napierian coefficients were used to evaluate the ratio of a250 to a365 (known as E2:E3). To calculate spectral slopes over the 275–295 nm range (S275–295), linear regression was used to estimate the slope of the relationship between ln ad and wavelength, expressed as a positive number. SUVA254 correlates strongly with aromaticity [65], providing an indication of the source and biological availability of the DOC. Increases in a*320 are driven by inputs of terrestrially derived DOC that introduces less photobleached DOC and may decrease transparency [63]. Chromophoric dissolved organic carbon (CDOM) may be represented by a*380 which absorbs ultraviolet light and visible light [63], is primarily responsible for optical properties, and plays an important role in shielding biota from harmful UV radiation [62]. E2:E3 tracks changes in the relative size of DOC molecules. This ratio is negatively related to average molecular DOC weight and positively correlated with low molecular weight DOC compounds, therefore the ratio increases with UV light processing and decreases in response to bacterial DOC processing [56]. DOC photobleaching largely drives increases in S275–295 [63] which indicates increases in exposure to sunlight. These DOC quality metrics were used to evaluate the response to storm events and reflect the balance of allochthonous inputs, photobleaching, and bacterial processing.
Percent change of DOC concentration, SUVA254, a*320, a*380, E2:E3, and S275–295 were calculated for the early summer and autumn storms. P1 and P2 samples were each normalized to the Pre sample: Percent change = ((Post X/Pre) – 1) × 100, where X is the P1 or P2. Percent change values less than zero indicate a decrease in that metric, positive values indicate an increase, and zero indicates no change. Percent change values were used in all data analyses.
2.4. Land Cover Data
Land cover data were measured using the National Elevation Dataset from the United States Geological Survey (Table 3). The United States Geological Survey 2011 dataset was used to collect national land cover data (NLCD). Slope was calculated using digital elevation models collected from the Maine Office of GIS.
2.5. Data Analysis
To assess differences in the response of DOC concentration, SUVA254, a*320, a*380, E2:E3, and S275–295 between Pre (1–2 days before) and P2 (4 days after) for each storm and between early summer and autumn across all six lakes, one-way analysis of variance (ANOVA) was used. Levene’s test for homogeneity and the Shapiro–Wilk normality test were used to test for the assumptions of ANOVA. A significance level of p < 0.05 was used.
Pearson’s correlation coefficient was used to evaluate correlations between the percent change of DOC metrics (DOC concentration, SUVA254, a*320, a*380, E2:E3, and S275–295) and select lake characteristics (surface area, volume, maximum depth, WA:LA, and residence time) for each storm. A significance level of p < 0.10 was used. A p-value of 0.10 was used for this analysis (as opposed to 0.05 or a custom p-value) in order to capture a larger range of DOC variables that might be affected by lake characteristics. This research is an initial study that captures only two storms, therefore more exploratory analyses were used to identify potential drivers of change in DOC during storm events. Pearson’s correlation coefficient was also used to evaluate correlations between the percent change of DOC metrics (DOC concentration, SUVA254, a*320, a*380, E2:E3, and S275–295) and landcover for both storms. A significance level of p < 0.05 was used. Since Pearson’s correlation was used for an exploratory data analysis in order to identify possible driving variables, adjustment for multiple comparisons was not used.
A principle component analysis (PCA) was conducted to expand understanding of the response of DOC metrics to environmental variables (lake and landcover characteristics) and study sites to an early summer storm and an autumn storm. PCA was used to determine relationships between the percent change in DOC metrics and lake characteristics and to determine relationships between the percent change in DOC metrics and landcover. All variables were standardized prior to analysis and the R vegan package was used. All statistical analyses were conducted using R (version 3.5.1, R Development Core Team, 2016, Vienna, Austria)
3. Results
3.1. Comparison of Responses Across Lakes and Seasons
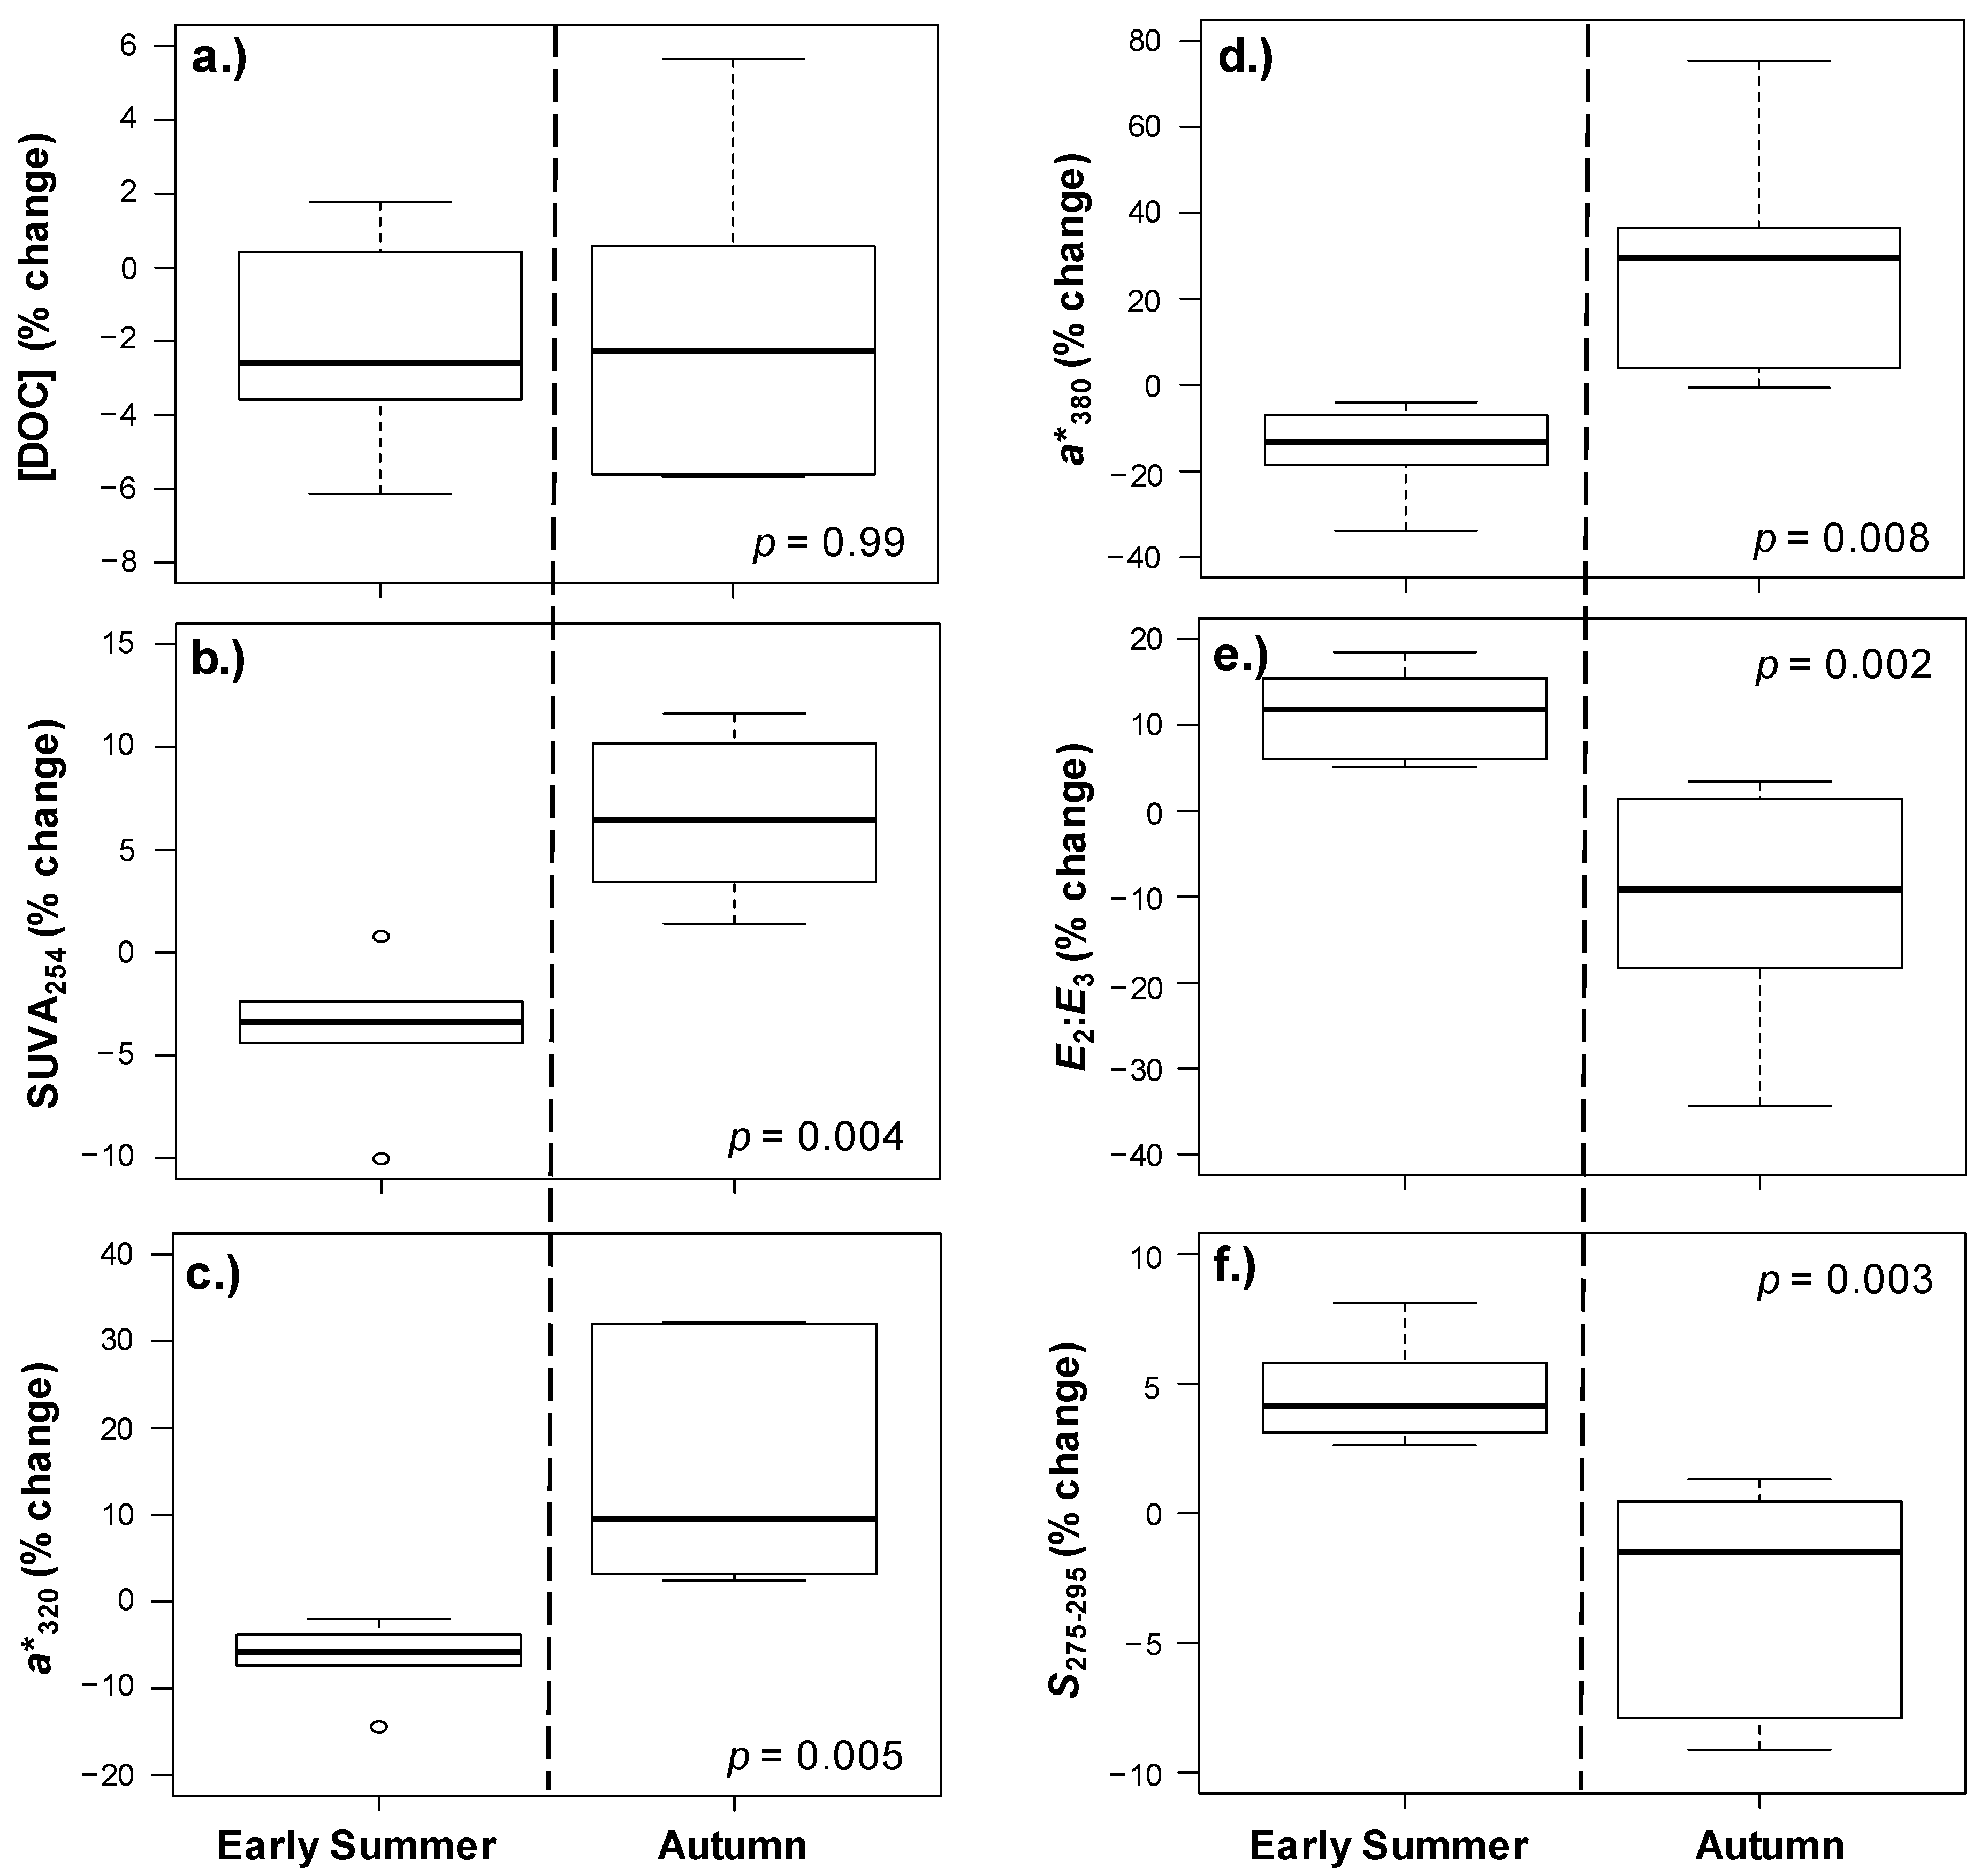
Across lakes, the response of DOC concentration to the early summer and autumn storms did not differ (p = 0.99), however the responses of DOC quality metrics between Pre (1–2 days before) and P2 (4 days after) were different between the two seasons (p < 0.01). SUVA254, a*320, and a*380 decreased in response to the early summer storm, whereas they increased after the autumn storm (Figure 3). SUVA254 decreased by 3.8 ± 1.4 percent in the early summer and increased by 6.6 ± 1.8 percent in the autumn (p = 0.004, Figure 3b). a*320 and a*380 decreased by 6.6 ± 1.8 percent and 15.0 ± 4.3 percent respectively in the early summer and increased by 14.8 ± 5.7 percent and 29.1 ± 11.2 percent in the autumn (p = 0.005, p = 0.008, Figure 3c–d). The percent change of E2:E3 and S275–295 was opposite of SUVA254, a*320, and a*380, increasing in the early summer and decreasing in the autumn. E2:E3 increased by 11.4 ± 2.1 percent in the early summer and decreased by 11.0 ± 5.7 percent in the autumn (p = 0.002, Figure 3e). S275–295 increased by 4.7 ± 0.8 percent in the early summer and decreased by 3.0 ± 1.8 percent in the autumn (p = 0.003, Figure 3f). Storm response was more variable in the autumn compared to the early summer. Detailed information for pre-storm values, and percent change for P1 and P2 in early summer and autumn seasons for each of the six study lakes individually can be found in the supplementary information online (Supplementary Table S1; Supplementary Figure S1).
3.2. Correlations between DOC Metrics and Lake Characteristics
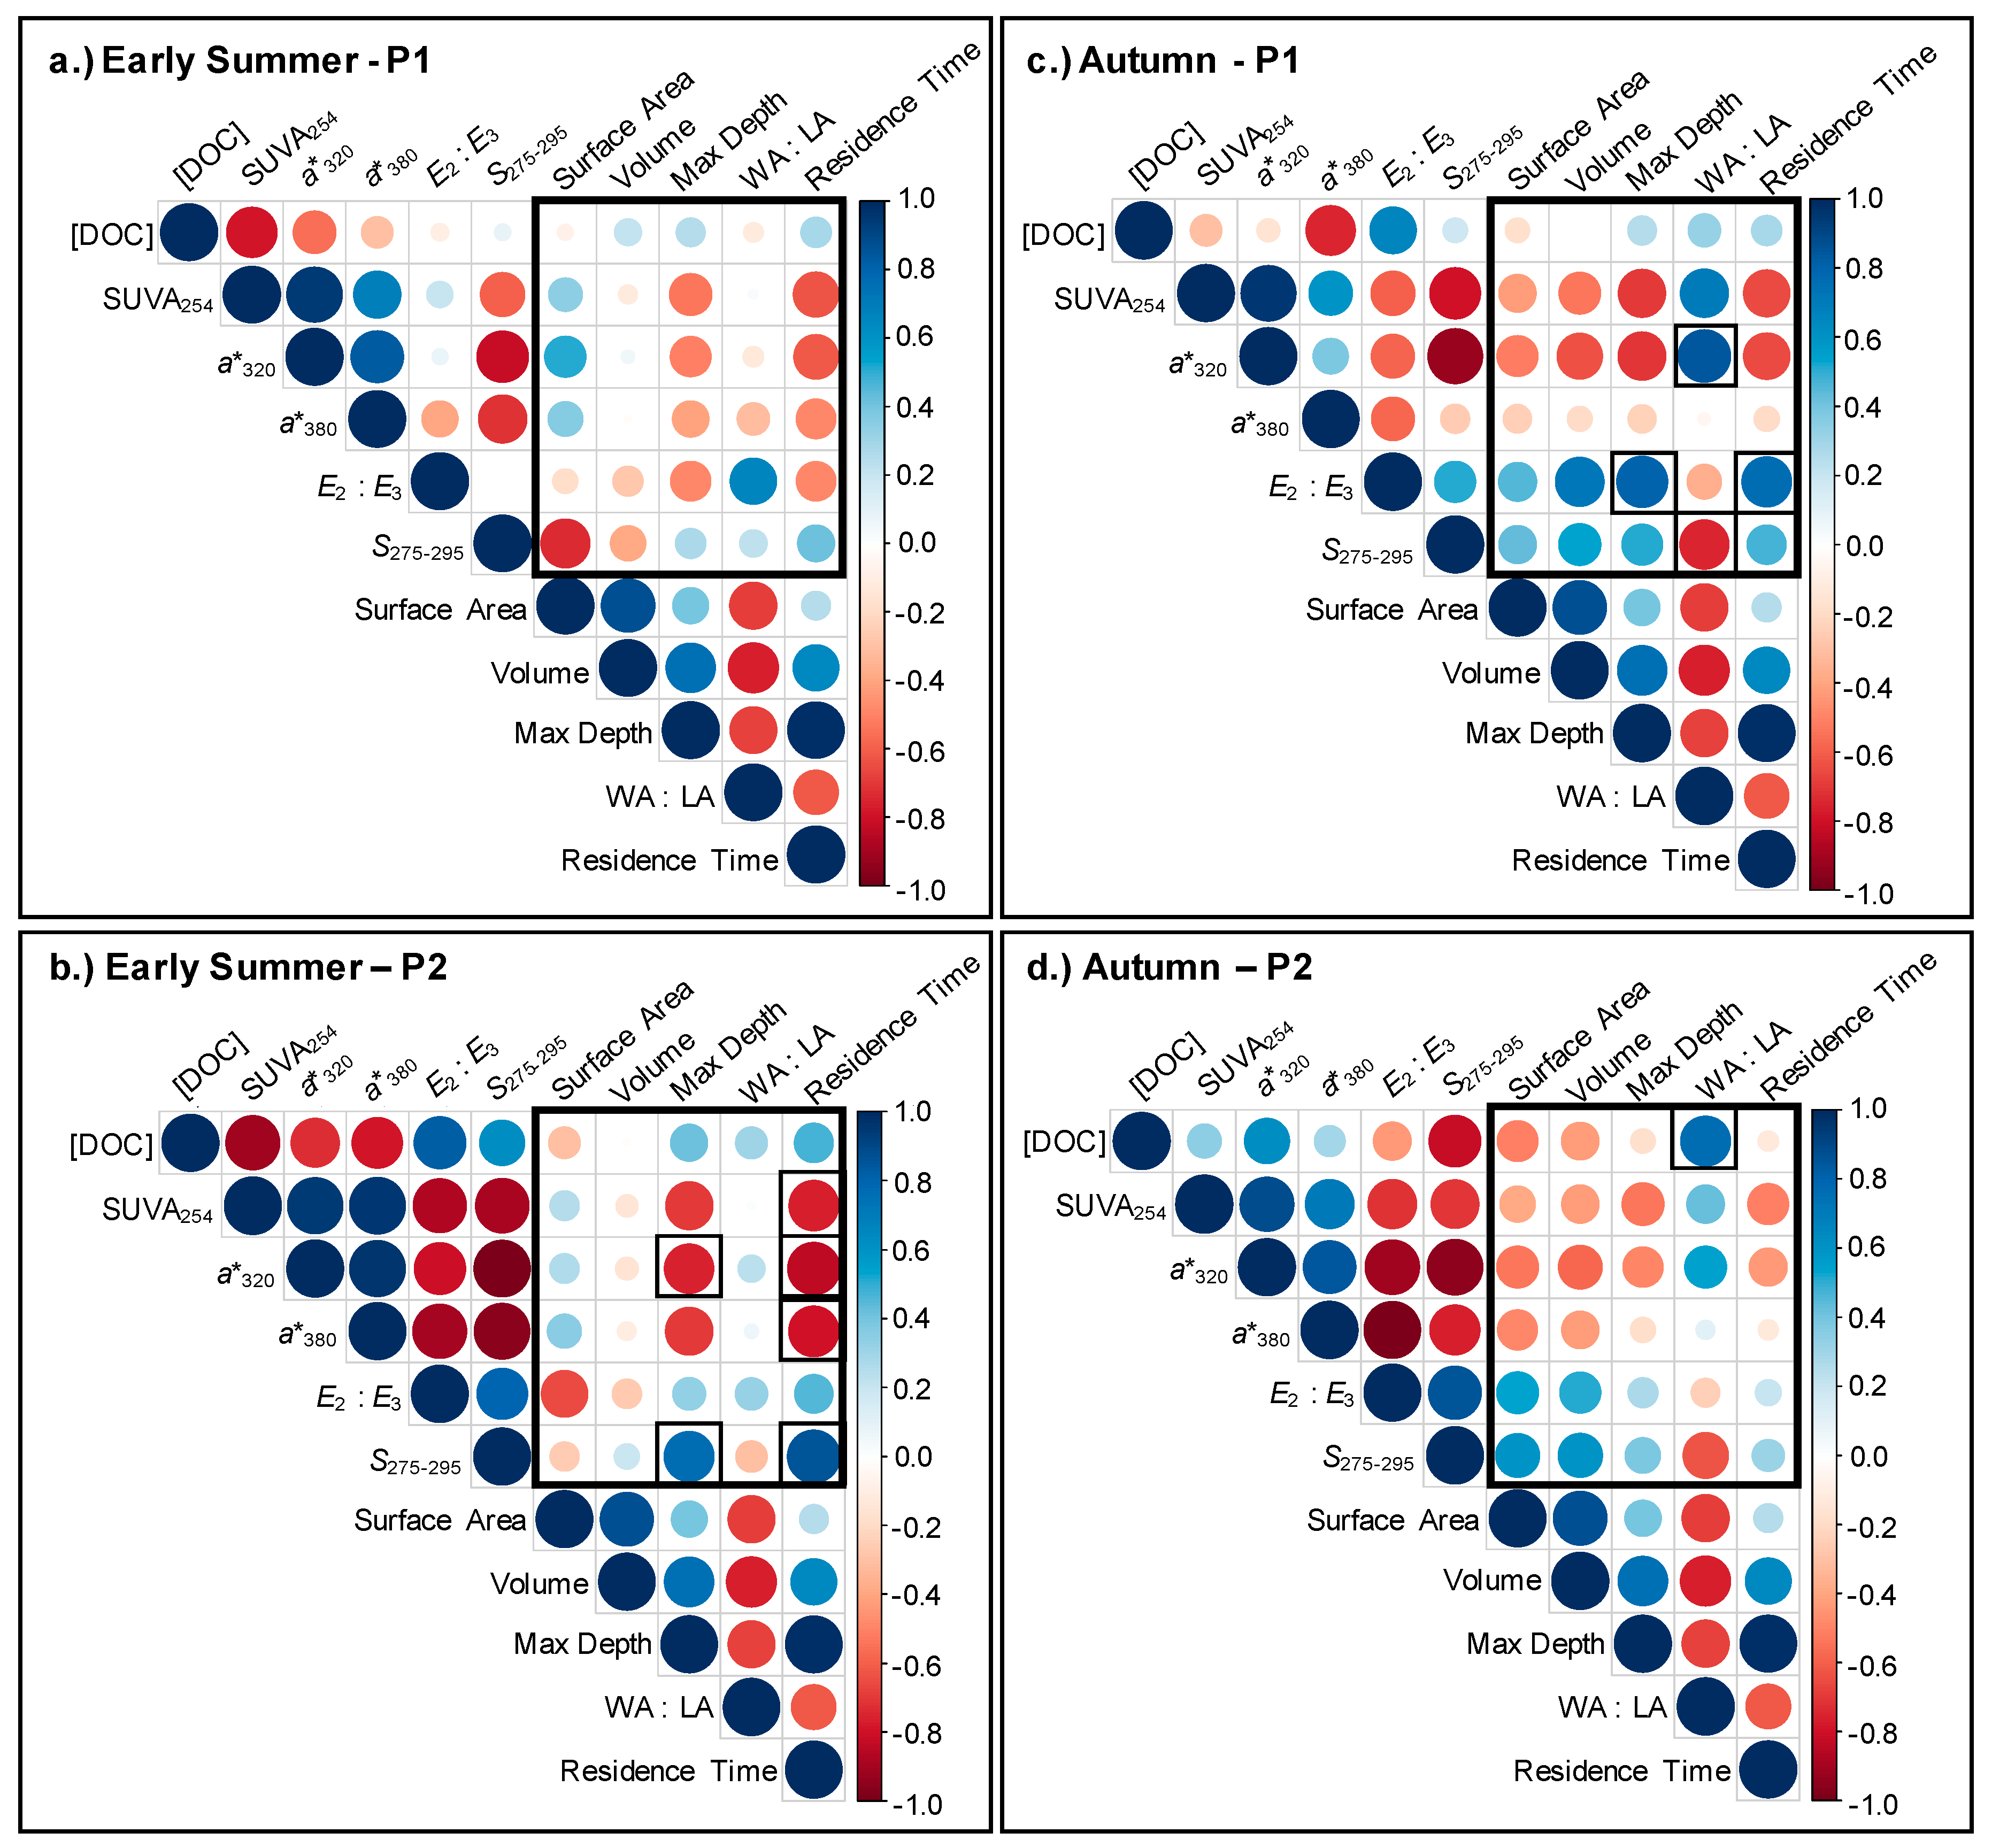
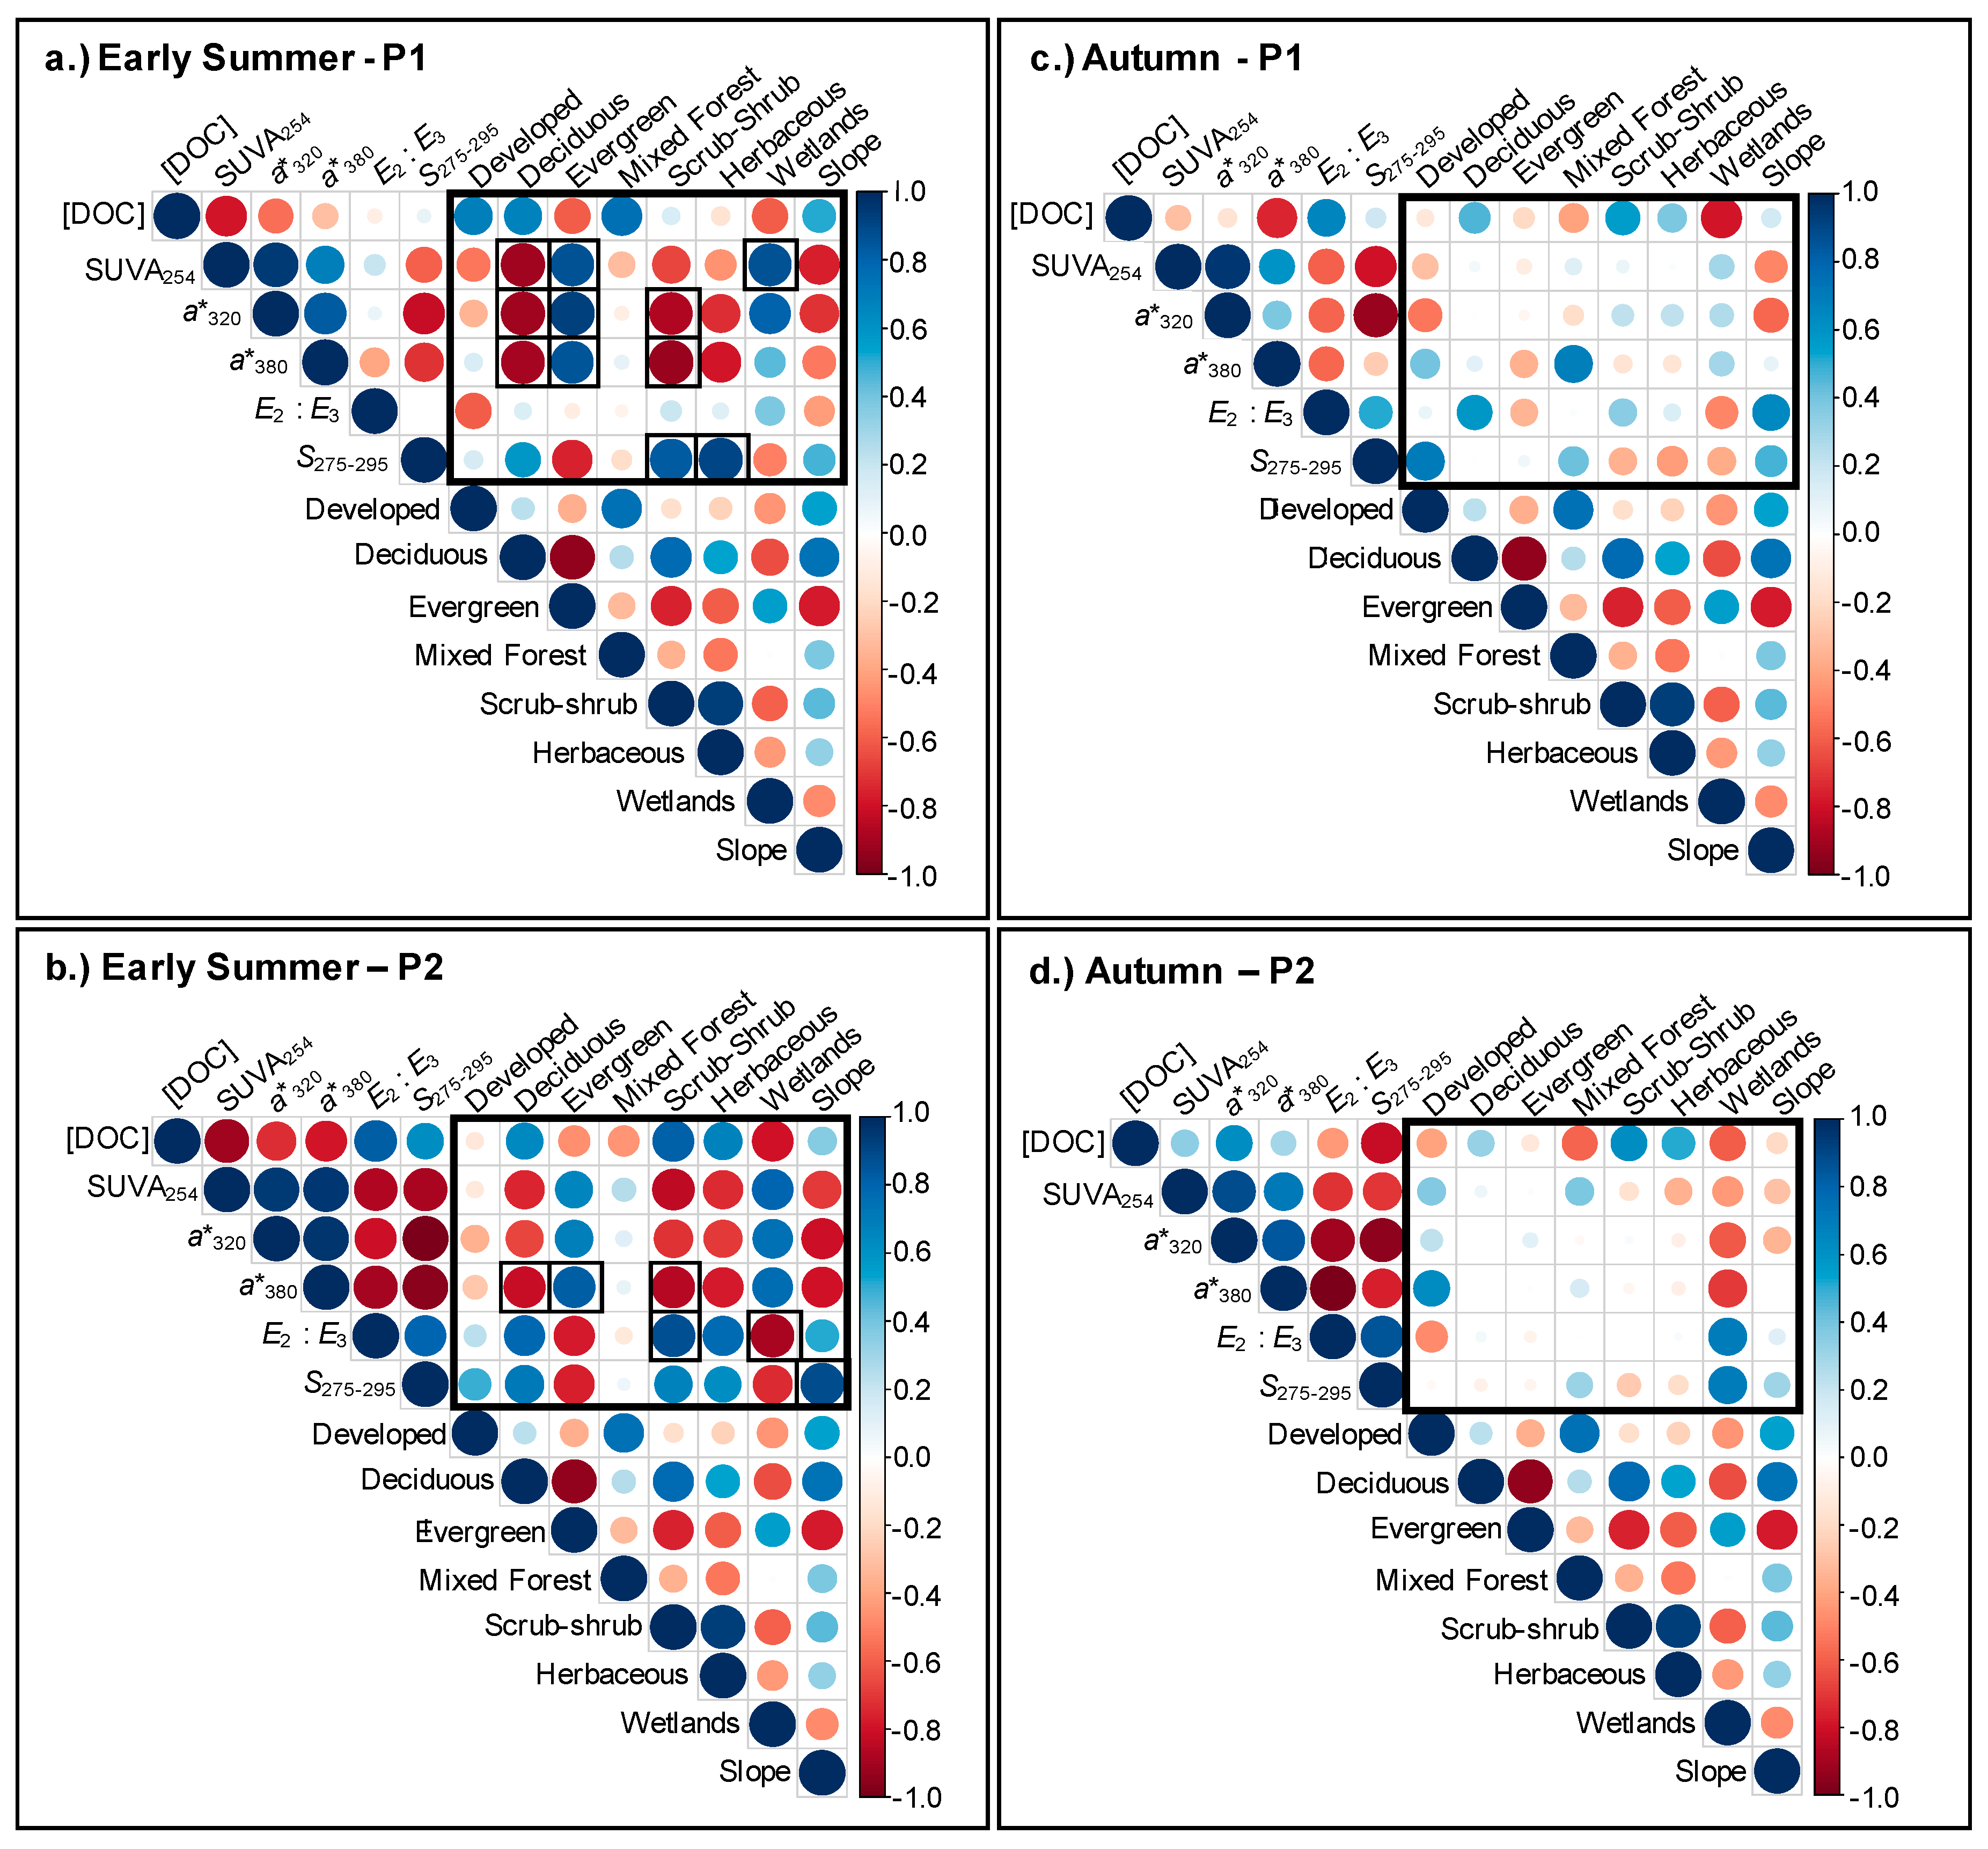
Correlations between percent change of DOC metrics suggest differences between seasons and post-storm periods. In the early summer, DOC concentration was negatively correlated to SUVA254, a*320, and a*380 at both P1 and P2, while in the autumn DOC concentration was negatively correlated to SUVA254, a*320, and a*380 at P1 and positively correlated at P2 (Figure 4). In the early summer, DOC concentration was not strongly correlated to E2:E3 or S275–295 at P1 and positively correlated at P2, and in the autumn DOC concentration was also not strongly correlated to E2:E3 or S275–295 at P1 and negatively correlated at P2 (Figure 4). Correlations among DOC concentration and DOC quality metrics appeared stronger at P2 compared to P1. Significant correlations during each season and time period vary. In the early summer at P2, there was a negative correlation between DOC concentration and SUVA254 (r = −0.91, p = 0.01; Figure 4b) and a positive correlation between DOC concentration and E2:E3 (r = 0.83, p = 0.04, Figure 4b). In the autumn at P2, there was a negative correlation between DOC concentration and S275–295 (r = −0.82, p = 0.04, Figure 4d).
Correlations between lake characteristics and the percent change of DOC metrics to storms differed between seasons. Overall, during the early summer there were more correlations between percent change in DOC metrics and residence time and depth, while in the autumn there were more correlations between percent change in DOC metrics and WA:LA. During the early summer at P2, across the six lakes, residence time was negatively correlated with changes in SUVA254 (r = −0.76, p = 0.08), a*320 (r = −0.84, p = 0.04), and a*380 (r = −0.76, p = 0.06), and maximum depth was negatively correlated with changes in a*320 (r = −0.75, p = 0.08, Figure 4b; Table 4). At the same early summer P2 sampling, changes in S275–295 were positively correlated with maximum depth (r = 0.77, p = 0.07) and residence time (r = 0.85, p = 0.03, Figure 4b; Table 4). At the autumn P1 sampling, changes in a*320 were positively correlated with WA:LA (r = 0.84, p = 0.04) and changes in E2:E3 were positively correlated with maximum depth (r = 0.80, p = 0.05) and residence time (r = 0.76, p = 0.08, Figure 4c; Table 4). At P1 in the autumn, changes in S275–295 were negatively correlated with WA:LA (r = −0.74, p = 0.09, Figure 4c; Table 4). At the P2 sampling after the autumn storm, changes in DOC concentration were positively correlated with WA:LA (r = 0.76, p = 0.08, Figure 4d; Table 4). Although only significant for the early summer P2 sampling, during all sampling periods, changes in SUVA254, a*320, and a*380 were negatively correlated with maximum depth and residence time (Figure 4). Correlations for changes in E2:E3 and S275–295 were variable across seasons and sample periods (Figure 4).
3.3. Correlations between DOC Metrics and Land Cover
Correlations between land cover variables and the percent change of DOC metrics differed between early summer and autumn. Various correlations were significant at P1 and P2 during the early summer, however there were no significant correlations between land cover and DOC metrics at either of the autumn storm samplings (Figure 5). At P1 in the early summer, changes in SUVA254, a*320, a*380 were negatively correlated with deciduous land cover (r > −0.89, p < 0.02), and positively correlated with evergreen land cover (r = −0.87, p < 0.03; Figure 5a). During the same sampling, change in SUVA254 was positively correlated with wetlands (r = 0.87, p = 0.03) and changes in a*320 and a*380 were negatively correlated with scrub-shrub (r > −0.87, p < 0.03; Figure 5a). Change in S275–295 was positively correlated with scrub-shrub (r = 0.83, p = 0.04) and with herbaceous land cover (r = 0.90, p = 0.01; Figure 5a). At P2 in the early summer, there were some consistencies between changes in SUVA254, a*320, a*380, and land cover and some changes in correlations for E2:E3 and S275–295. A change in a*380 was again negatively correlated with deciduous land cover (r = −0.82, p = 0.04), positively correlated with evergreen land cover (r = 0.82, p = 0.04), and negatively correlated with scrub-shrub (r = −0.85, p = 0.03; Figure 5b). Change in E2:E3 was positively correlated with scrub-shrub (r = 0.88, p = 0.02) and negatively correlated with wetlands (r = −0.88, p = 0.02; Figure 5b); and changes in S275–295 had a positive correlation with slope (r = 0.88, p = 0.02; Figure 5b).
3.4. Effects of Storms on DOC Metrics, Lake Characteristics, and Land Cover
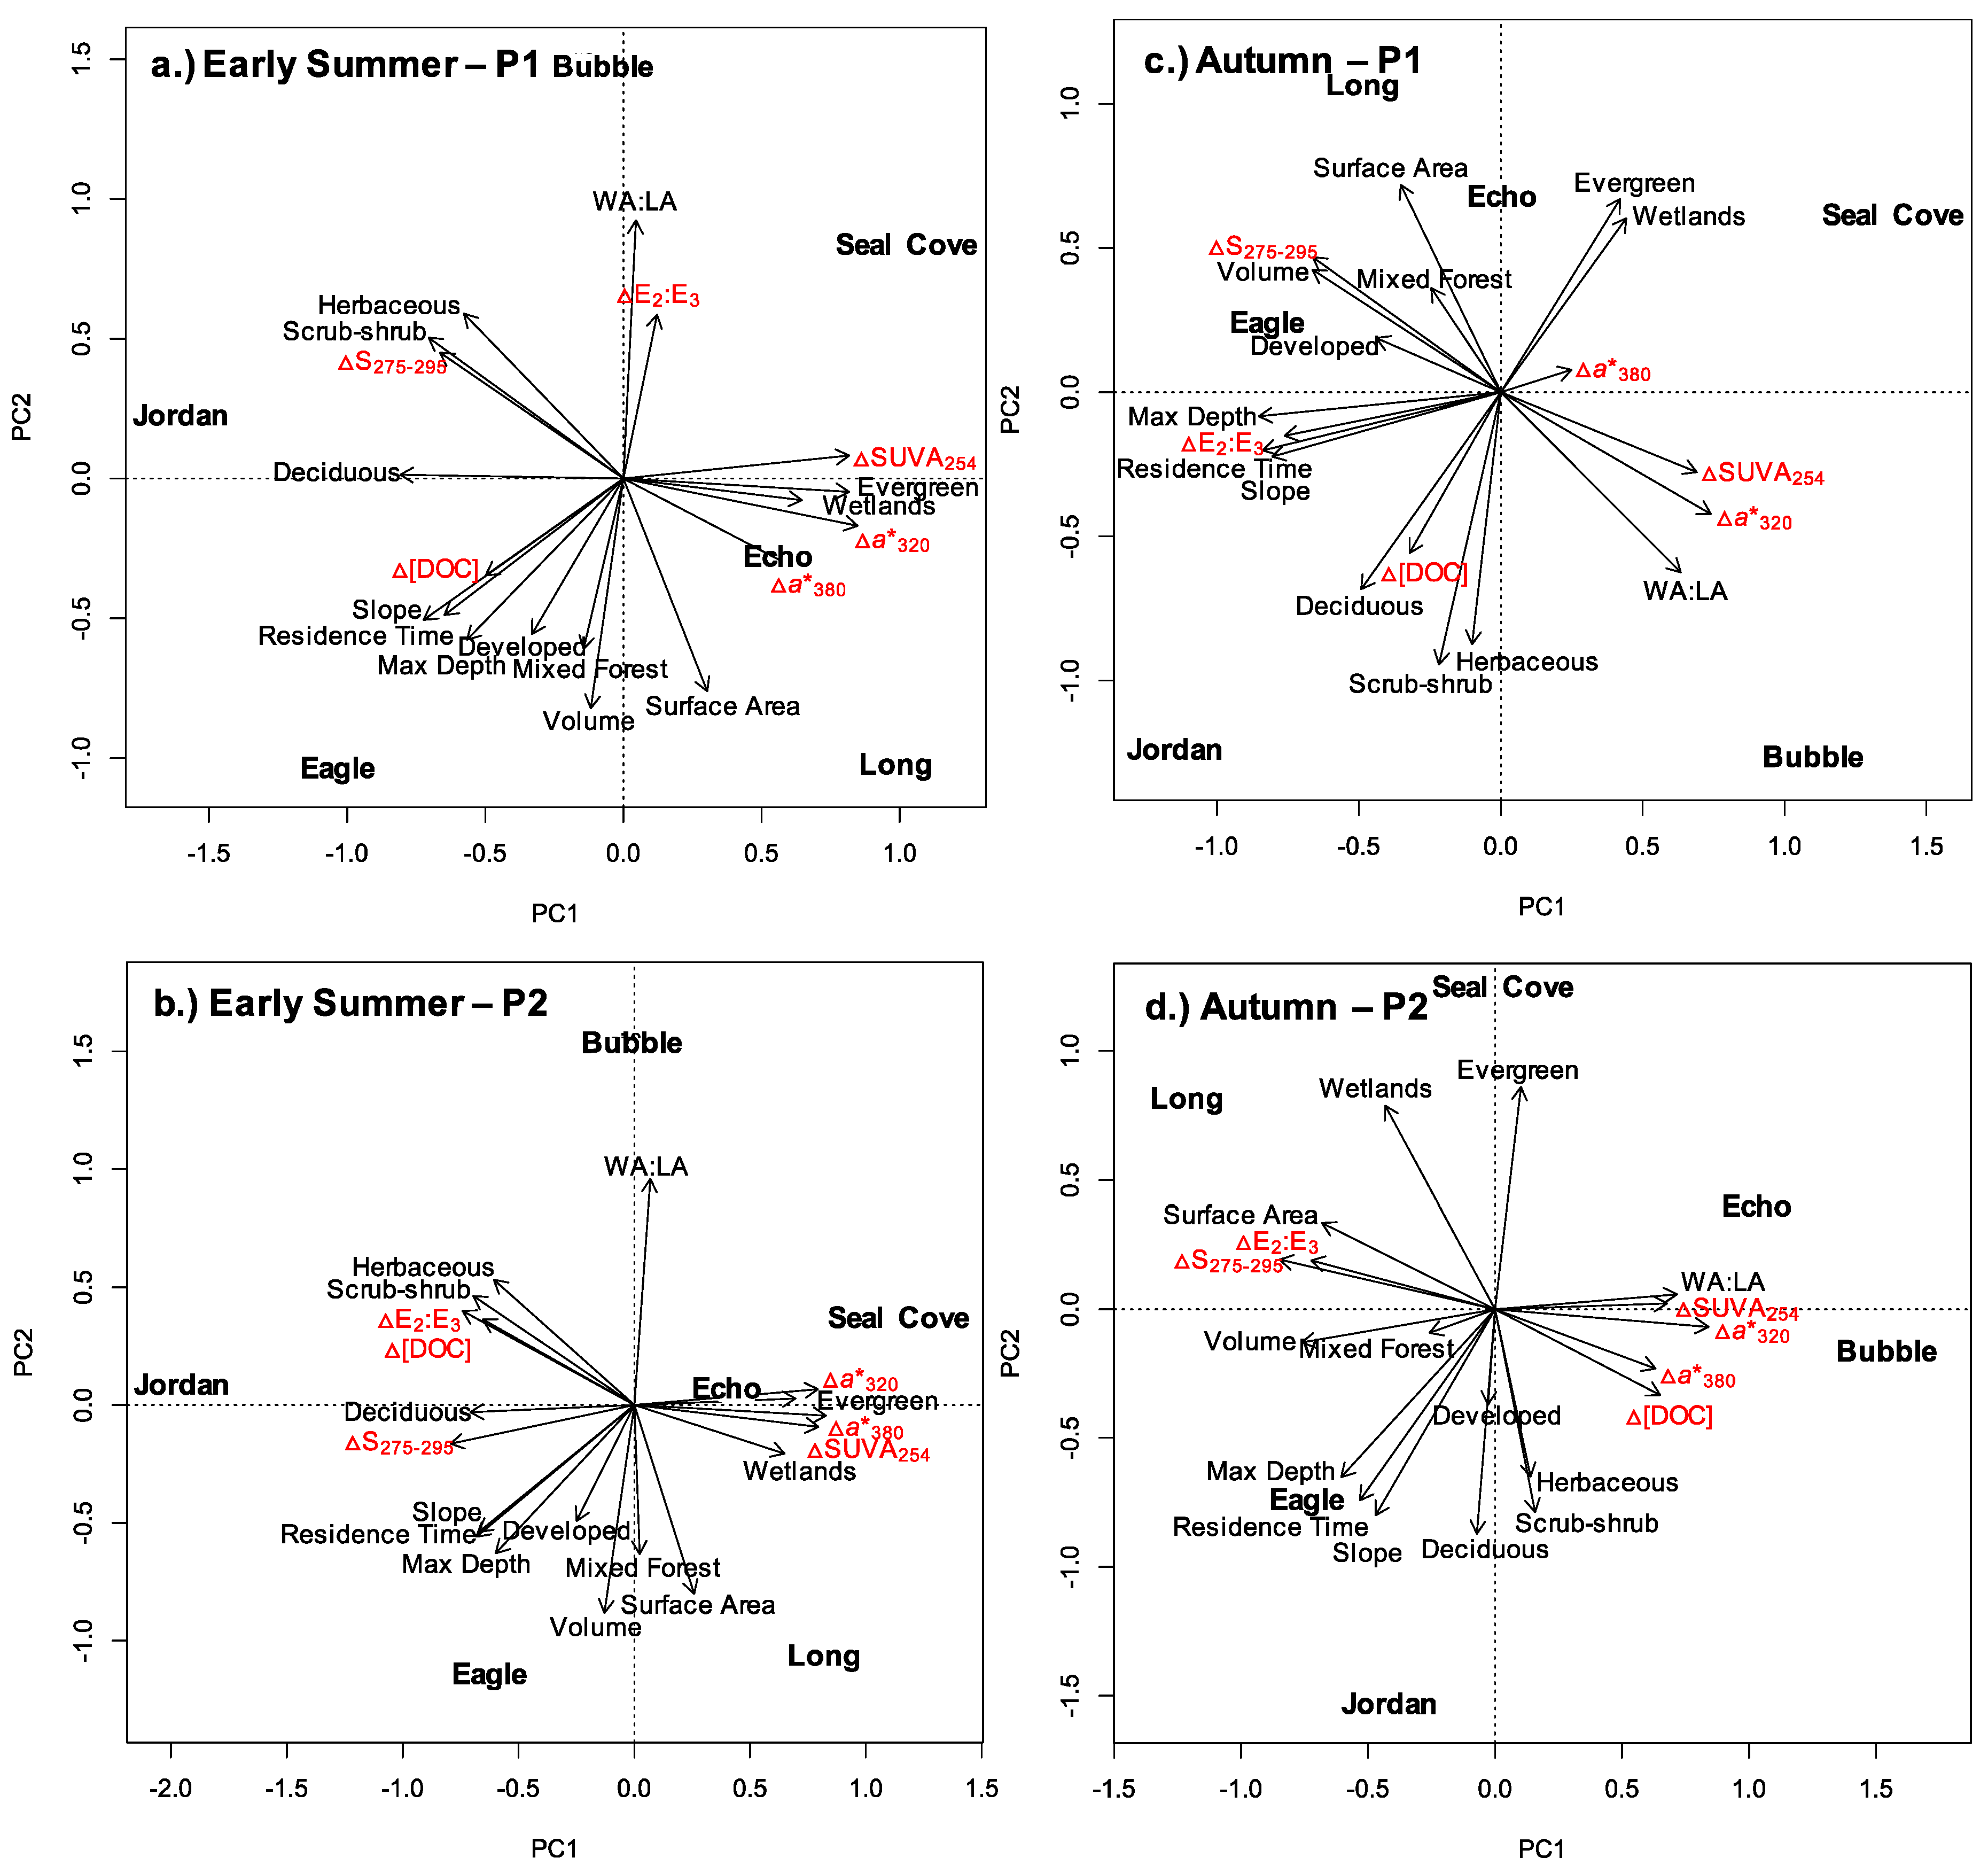
Results from the PCA support the findings from the correlation plots that relationships between percent change in DOC and percent change in DOC quality metrics appear stronger at P2 than at P1 for both the early summer and autumn storms. Percent change in DOC concentration was negatively correlated to percent change in SUVA254, a*320, and a*380 and positively correlated to E2:E3 and S275–295 during the early summer at P2 (Figure 6a,b). In the autumn, percent change in DOC concentration was positively correlated to percent change in SUVA254 and a*320 and negatively correlated to percent change in E2:E3 and S275–295 at P2 (Figure 6c,d).
Overall, during early summer, the plots suggest that maximum depth and residence time are key lake characteristics associated with differences in DOC metrics and deciduous, evergreen, scrub-shrub, and wetland cover as well as slope also influence DOC metrics. In the early summer, at P1, the first PCA axis explained 47% of the variance and the second axis explained 27%. During the early summer, at P1, the percent change in SUVA254, a*320, and a*380 decreased and S275–295 increased in response to storms in lakes that had longer residence times (Figure 6a). In the early summer, at P1, deciduous and scrub-shrub cover as well as slope and were negatively associated with percent change in SUVA254, a*320, and a*380, and positively associated with percent change in S275–295 (Figure 6a). Evergreen and wetland cover were positively associated with percent change in SUVA254, a*320, and a*380, and negatively associated with percent change in S275–295 (Figure 6a). These variables correlated with PCA axis 1. Surface area, volume, and WA:LA correlated with PCA axis 2 (Figure 6a). At P2, during the early summer, the first PCA axis explained 55% of the variance and the second axis explained 25%. In the early summer, at the P2 sampling, percent change in SUVA254, a*320, and a*380, decreased in response to storms in lakes that were deeper and had longer residence times, while percent change in E2:E3 and S275–295 increased (Figure 6b). At P2, deciduous, scrub-shrub, and herbaceous cover as well as slope were negatively associated with a percent change in SUVA254, a*320, and a*380, and positively associated with percent change in S275–295 and E2:E3 (Figure 6b). Evergreen and wetland cover were positively associated with percent change in SUVA254, a*320, and a*380, and negatively associated with percent change in S275–295 and E2:E3 (Figure 6b). These variables correlated with PCA axis 1. Surface area, volume, and WA:LA correlated with PCA axis 2 (Figure 6b).
During the autumn, the PCA plots suggest that changes in DOC metrics between P1 and P2 are more variable compared to early summer. WA:LA and volume are key lake characteristics related to observed percent change in DOC metrics at both P1 and P2 (Figure 6c–d). In the autumn, at P1, 40% of the variance was explained by PCA axis 1 and 27% of the variance was explained by PCA axis 2. In shallow lakes with lower volume, larger WA:LA, and shorter residence time percent change in SUVA254 and a*320 increased and percent change E2:E3 and S275–295 decreased at P1 (Figure 6c). Slope was negatively correlated with SUVA254 and a*320 and positively correlated with E2:E3 and S275–295. These variables correlated with PCA axis 1. Scrub-shrub and herbaceous cover and surface area were correlated with PCA axis 2 (Figure 6c). At P2, during the autumn, 38% of the variance was explained by PCA axis 1 and 30% of the variance was explained by PCA axis 2. In autumn, at P2, lakes with smaller volume and surface area and larger WA:LA had increases in the percent change in SUVA254, a*320, and DOC concentration and decreases in the percent change in E2:E3 and S275–295 (Figure 6d). These variables were correlated with PCA axis 1. Residence time, and deciduous, evergreen, scrub-shrub, and wetland cover as well as slope were correlated with PCA axis 2 (Figure 6d).
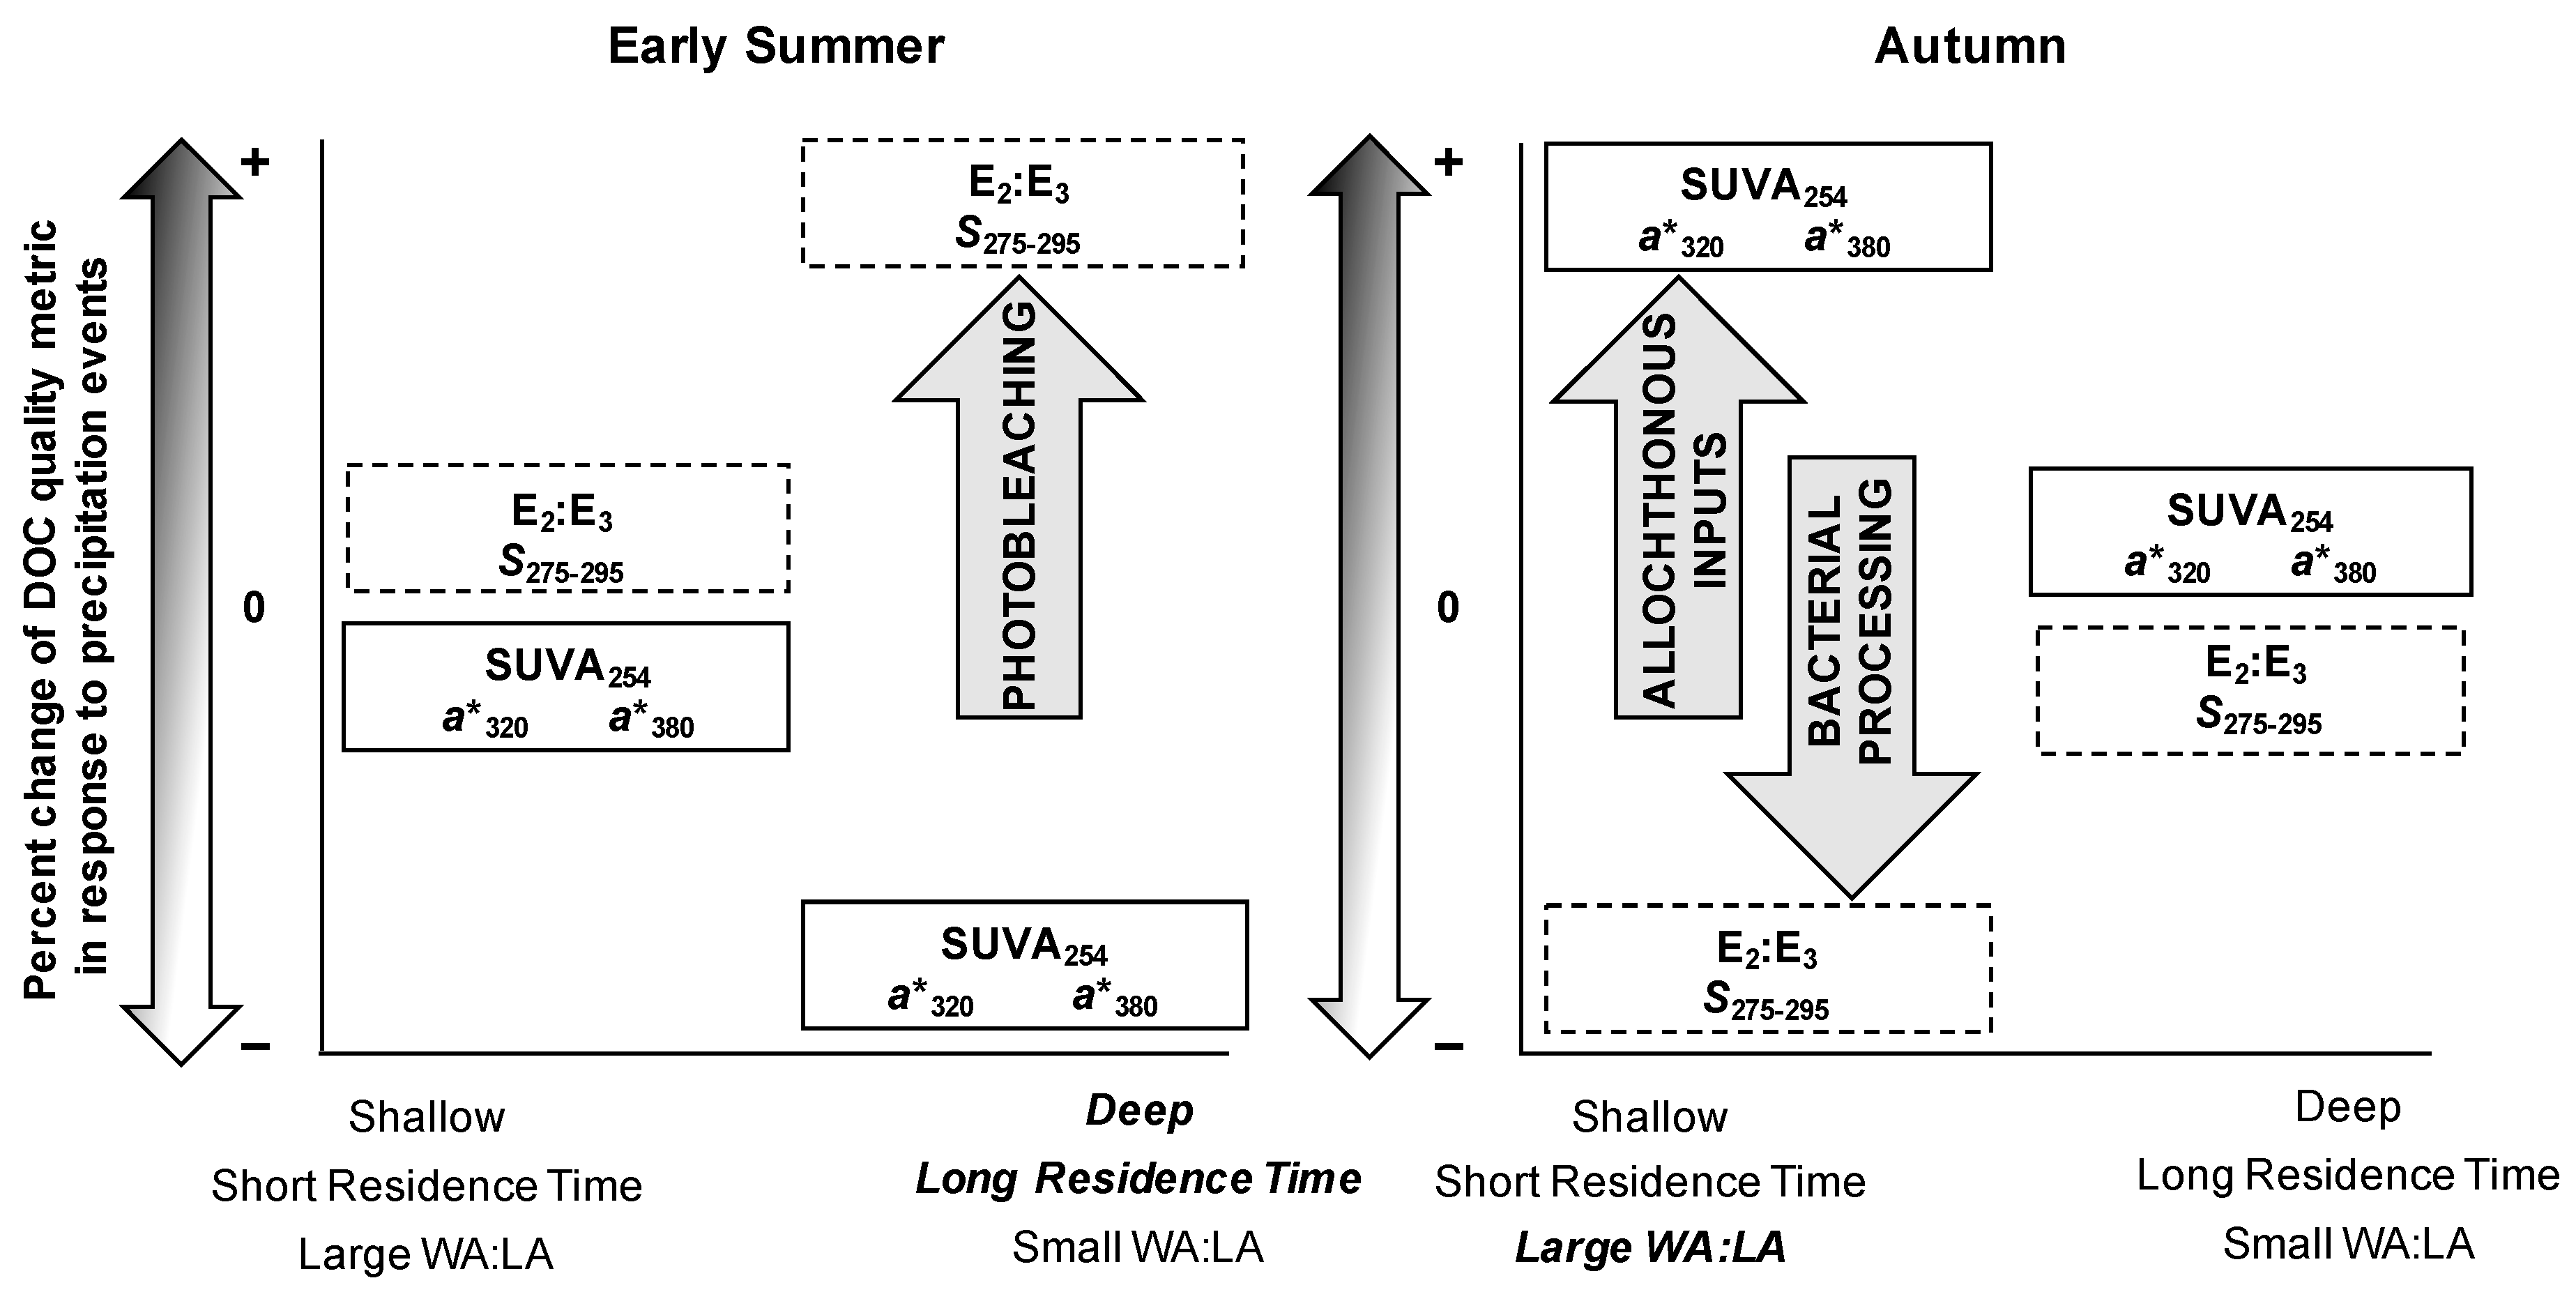
4. Discussion
For the two storms measured in this study, our results reveal the response of mean DOC concentration for the six lakes was similar, however there were differences in the response of DOC quality metrics during each storm event. Our analyses suggest that the response of DOC quality metrics to storms was mediated by different lake and watershed characteristics in the early summer versus autumn. In the early summer storm, deep lakes with longer residence times experienced a greater positive response in E2:E3 and S275–295, and a greater negative response in SUVA254, a*320, and a*380. In the autumn storm, lakes with large WA:LA ratios experienced a greater positive response in SUVA254, a*320, and a*380 and a greater negative response in E2:E3 and S275–295 (Figure 7). The balance of the response of DOC quality metrics during the early summer storm suggest photobleaching was the dominant process, whereas the balance of the response of DOC quality metrics during the autumn storm suggest increased allochthonous inputs and bacterial processing were the dominant processes contributing to change. Land cover was more highly correlated with changing DOC quality metrics in the early summer storm and did not play a significant role in the autumn storm response. Our results indicate that there are seasonal differences in the effects of the early summer and the autumn storm.
In the early summer storm event, solar radiation and dry antecedent weather conditions likely contributed to the observed increases in E2:E3 and S275–295 and decreases in SUVA254, a*320, and a*380. In early summer, exposure to solar radiation was higher and the epilimnion was shallower than in the autumn. These factors would contribute to increased photobleaching which contributes to the processing and degradation of DOC as it flows through the system [19], ultimately contributing to a rapid loss of allochthonous DOC and increased transparency and may influence the observed positive response of E2:E3 and S275–295 during this period. This response was largely observed in deep lakes with long residence times. The deep lakes with longer residence times had increases in S275–295 suggesting more photobleaching occurred during the early summer [19,63]. The positive response of E2:E3 supports increased photobleaching during this early summer period, as an increase in this ratio suggests an increase in UV light processing [56]. Literature suggests the role of residence time in storm response is important as it correlates to the loading of fresh DOC and determines the history of DOC exposure to light, which can influence the photosensitivity of DOC [66]. However, it is important to note this study evaluates changes between pre- and post-storm events, therefore the time period in which changes were observed was the same. Thus, the mechanism of observed change likely includes mixing of older photobleached DOC in the epilimnia by the storm. The lakes with longer residence time likely already had more photobleached DOC pre-storm [66], and photobleaching is a dominant mechanism of changes in DOC quality in the epilimnia of these relatively clear lakes [56]. Conversely, DOC quality metrics indicative of allochthonous inputs decreased in response to the early summer storm. Dry antecedent conditions to the early summer storm may contribute to more increased photobleaching, rather than an influx of terrestrially derived, or allochthonous, DOC. It is important to note that antecedent conditions may vary annually, therefore the magnitude of DOC response during this time could also vary from year to year. Key functions of DOC, including the effects on water transparency and attenuation of harmful ultraviolet radiation, may be altered by storm events and have subsequent negative effects on aquatic ecosystem structure and function.
During the autumn storm event, wetter conditions, decay of organic matter in the watersheds from spring to autumn, and reduced solar radiation may have contributed to the observed increases in SUVA254, a*320, and a*380 decreases in E2:E3 and S275–295. This response was largely observed in lakes with a larger WA:LA ratio. A larger watershed area allows for a larger potential source of allochthonous DOC that may be flushed into the lakes by autumn storms. Increased a*320 results from these fresh inputs of terrestrial DOC [63,67] and reduced photobleaching. Allochthonous DOC is often less biolabile [35], therefore with increased storminess, particularly in the autumn months, increased terrestrially derived DOC could have important implications for aquatic ecosystems. The negative correlation between changes in S275–295 and WA:LA supports increased allochthonous inputs that introduce non-photobleached DOC [68]. Additionally, a reduction in the ratio of E2:E3 suggests an increase in bacterial DOC processing [56]. This bacterial processing is often thought to degrade DOC [69]. Temperature, nutrients, and light all influence the bioavailability of DOC [70] and changing seasonal and storm conditions could impact material that is flushed into lakes. The variation in decay or breakdown of plant matter in the watersheds during autumn versus early summer could impact temperature, nutrients, and light in the lakes during storm events, contributing to the vulnerability of lake ecosystems to changing DOC quality with increased frequency of storm events.
During the early summer storm, land cover is more highly correlated with changes in DOC quality metrics, whereas it does not play a significant role in the autumn. The negative correlation between changes in SUVA254, a*320, and a*380 and deciduous cover corresponds to a strong negative response or decrease in these DOC quality metrics in response to storm events. Lake watersheds with more deciduous cover and less evergreen cover have a greater negative response in DOC quality metrics to storm events than lake watersheds with more evergreen cover in the early summer. Measured DOC concentration is often higher in soils under coniferous forests than DOC measured in soils under deciduous forests [71]. Additionally, the percent of deciduous cover was low across all watersheds, therefore in the autumn, there was likely a negligible effect of deciduous forest similar to boreal streams in northern Sweden, where the presence of deciduous forest had a negligible effect on DOC during the wet period [72]. Thus, in the autumn storm, the size of the watershed contributes to larger inputs of terrestrial matter or allochthonous material, therefore WA:LA is more influential to changes in DOC quality as opposed to forest type. In the early summer storm, the positive correlation between changes in S275–295 and slope support the larger positive response of DOC quality metrics in the deep lakes with higher residence time, as these lakes’ watersheds also have the steepest slopes. Wetlands often contribute to changing DOC in lakes [40,51]. Surprisingly, wetlands and DOC concentration are negatively correlated in the autumn, however changes in DOC quality were variable and, while not significant in this study, DOC quality may be more indicative of wetland influence on lakes. Relationships between DOC quality and land cover contribute to the explanation of seasonal variability in lake response to storm events.
DOC quality metrics can be highly responsive to changes in precipitation, temperature, and solar radiation. Hudson et al. [39] evaluated DOC data over 21 years in a set of lakes in Canada and found that solar radiation explained 50% of the variation in DOC concentration across seasons. In a shallow lake in Hungary, DOC exports from the catchment were driven by both the availability of flushable terrestrial carbon and the seasonality of precipitation, which is also a common pattern in many temperate and boreal lakes [19]. Additionally, research by Aulló-Maestro et al. [19] supports that photobleaching plays a key role in the processing and degradation of DOC during times of high solar radiation. This processing of DOC by photobleaching can influence carbon cycling and also increase the transparency of the water column [73] as well as change optical properties [74]. This supporting evidence, among others, paired with our research, suggests that correlations between optical properties and lake characteristics as well as land cover may provide us with the knowledge to produce a framework for how DOC in lakes respond to storm events. Although this study provides only a small snapshot, does not encompass all seasonal differences, and is based on a single early summer and a single autumn storm, it supports the literature on how DOC quality metrics can be a powerful tool to examine lake response and also contributes to understanding potential implications from storm events.
Storms may contribute to increased variability of seasonal DOC. While DOC quality fluctuates seasonally, storm events may introduce additional variability, and potentially cause abrupt changes in lake ecosystems. It has been acknowledged that the relationship between DOC concentrations and precipitation over multiple years is variable and inconsistent, therefore suggesting that long-term climate change and acidification in addition to weather events are driving changing trends in DOC [42]. The effect of weather events on changes in DOC is being increasingly researched, however few studies attempt to explain the specific differences in seasonal DOC quality metrics and how this may impact storm response.
This research provides insight into key differences between lakewater DOC responses to an early summer versus an autumn storm. In the early summer storm, the response of the DOC quality metrics suggests that photobleaching was the primary process contributing to the observed changes in deep lakes with long residence times. In the autumn storm, the response of the DOC quality metrics suggests that more allochthonous inputs and increased bacterial processing were the primary processes contributing to the observed changes in lakes with large WA:LA ratios (Figure 7). Changes in climate such as solar radiation and antecedent weather conditions, that lead to subsequent changes in lake thermal structure, also influence DOC response to storm events. With storm events predicted to increase in frequency and intensity, particularly in the autumn months, increased variability in lakewater DOC metrics may be expected in the future. This study provides an important first step towards better understand relationships among storms, seasons, and DOC concentration and quality.
Supplementary Materials
The following are available online at https://www.mdpi.com/2073-4441/12/5/1452/s1, Table S1: Initial pre-storm values and percent change for P1 and P2 samplings, Figure S1: Percent change for each lake in response to the Early Summer storm and the Autumn storm.
Author Contributions
Conceptualization, K.A.W. and R.A.F.; methodology, K.A.W. and R.A.F.; validation, K.A.W.; formal analysis, K.A.W.; investigation, K.A.W.; resources, J.E.S.; data curation, K.A.W.; writing—original draft preparation, K.A.W.; writing—review and editing, K.A.W., J.E.S., R.A.F.; visualization, K.A.W.; supervision, J.E.S.; project administration, K.A.W., R.A.F., J.E.S.; funding acquisition, J.E.S., K.A.W. and R.A.F. All authors have read and agreed to the published version of the manuscript.
Funding
This work was supported by the US National Science Foundation Adaptation to Abrupt Climate Change IGERT program (grant number DGE-1144423), the Schoodic Institute Research Fellowship and the Maine Agricultural and Forest Experiment Station Project (ME021409).
Acknowledgments
We are grateful to Benjamin Burpee, Matthew Fowler, Mike Handley, Robert Northington, Nora Theodore, Carl Tugend, and Shannon Wiggin for field assistance. We are also grateful to William Gawley who provided weather data and logistical support in Acadia National Park. We thank Craig Williamson for reviewing and strengthening the content of this manuscript.
Conflicts of Interest
The authors declare no conflict of interest.
References
- Williamson, C.E.; Morris, D.P.; Pace, M.L.; Olson, O.G. Dissolved organic carbon and nutrients as regulators of lake ecosystems: Resurrection of a more integrated paradigm. Limnol. Oceanogr. 1999, 44, 795–803. [Google Scholar] [CrossRef] [Green Version]
- Tranvik, L.J.; Downing, J.A.; Cotner, J.B.; Loiselle, S.A.; Striegl, R.G.; Ballatore, T.J.; Dillon, P.; Finlay, K.; Fortino, K.; Knoll, L.B.; et al. Lakes and reservoirs as regulators of carbon cycling and climate. Limnol. Oceangr. 2009, 64, 2298–2314. [Google Scholar] [CrossRef] [Green Version]
- Brown, R.; Nelson, S.J.; Saros, J.E. Paleolimnological evidence of the consequences of recent increased dissolved organic carbon (DOC) in lakes of the northeastern USA. J. Paleolimnol. 2017, 57, 19–35. [Google Scholar] [CrossRef]
- Snucins, E.; Gunn, J. Interannual variation in the thermal structure of clear and colored lakes. Limnol. Oceanogr. 2000, 45, 1647–1654. [Google Scholar] [CrossRef]
- Solomon, C.T.; Stuart, S.E.; Weidel, B.C.; Buffam, I.; Fork, M.L.; Karlsson, J.; Larsen, S.; Lennon, J.T.; Read, J.S.; Sadro, S.; et al. Ecosystem consequences of changing inputs of terrestrial dissolved organic matter to lakes: Current knowledge and future challenges. Ecosystems 2015, 18, 376–389. [Google Scholar] [CrossRef]
- Oliver, B.G.; Thurman, E.M.; Malcolm, R.I. The contribution of humic substances to the acidity of colored natural waters. Geochim. Cosmochim. Acta 1983, 47, 203–2035. [Google Scholar] [CrossRef]
- Evans, C.D.; Monteith, D.T.; Cooper, D.M. Long-term increases in surface water dissolved organic carbon: Observations, possible causes and environmental impacts. Environ. Pollut. 2005, 137, 55–71. [Google Scholar] [CrossRef]
- Tranvik, L.J. Allochthonous dissolved organic matter as an energy source for pelagic bacteria and the concept of the microbial loop. Hydrobiologia 1992, 229, 107–114. [Google Scholar] [CrossRef]
- Wetzel, R.G.; Hatcher, P.G.; Bianchi, T.S. Natural photolysis by ultraviolet irradiance of recalcitrant dissolved organic matter to simple substrates for rapid bacterial metabolism. Limnol. Oceanogr. 1995, 40, 1369–1380. [Google Scholar] [CrossRef]
- Morris, D.P.; Zagarese, H.; Williamson, C.E.; Balseiro, E.G.; Hargreaves, B.R.; Modenutti, B.; Moeller, R.; Queimalinos, C. The attenuation of solar UV radiation in lakes and the role of dissolved organic carbon. Limnol. Oceanogr. 1995, 40, 1381–1391. [Google Scholar] [CrossRef] [Green Version]
- Cronan, C.S. Patterns of organic acid transport from forested watersheds to aquatic ecosystems. In Organic Acids in Aquatic Ecosystems; Perdue, E.M., Gjessing, E.T., Eds.; Wiley: Hoboken, NJ, USA, 1990; pp. 245–260. [Google Scholar]
- Vinvent, W.F.; Pienitz, R. Sensitivity of high-latitude freshwater ecosystems to global change: Temperature and solar ultraviolet radiation. Geosci. Can. 1997, 23, 231–236. [Google Scholar]
- Mopper, K.; Kieber, D.J. Photochemistry and the cycling of carbon, sulfur, nitrogen and phosphorus. In Biogeochemistry of Marine Organic Matter; Hansell, D., Carlson, C., Eds.; Academic Press: Cambridge, MA, USA, 2002; pp. 455–489. [Google Scholar]
- Lepistö, A.; Futter, M.N.; Kortelained, P. Almost 50 years of monitoring show that climate, not forestry, controls long-term organic carbon fluxes in a large boreal watershed. Glob. Change Biol. 2014, 20, 1225–1237. [Google Scholar] [CrossRef] [PubMed]
- Pagano, T.; Bida, M.; Kenny, J.E. Trends in levels of allochthonous dissolved organic carbon in natural water: A review of potential mechanisms under a changing climate. Water 2014, 6, 2862–2897. [Google Scholar] [CrossRef] [Green Version]
- Weyhenmeyer, G.A.; Froberg, M.; Karltun, E.; Khalili, M.; Kothawala, D.; Temnerud, J.; Tranvik, L.J. Selective decay of terrestrial organic carbon during transport from land to sea. Glob. Chang. Biol. 2012, 18, 349–355. [Google Scholar] [CrossRef]
- Fasching, C.; Ulseth, A.J.; Schelker, J.; Steniczka, G.; Battin, T.J. Hydrology controls dissolved organic matter export and composition in an Alpine stream and its hyporheic zone. Limnol. Oceanogr. 2016, 61, 558–571. [Google Scholar] [CrossRef] [Green Version]
- Monteith, D.T.; Stoddard, J.L.; Evans, C.D.; de Wit, H.A.; Forsius, M.; Hogasen, T.; Wilander, A.; Skjelkvale, B.L.; Jeffries, D.S.; Vuorenmaa, J.; et al. Dissolved organic carbon trends resulting from changes in atmospheric deposition chemistry. Nature 2007, 450, 537–540. [Google Scholar] [CrossRef]
- Aulló-Maestro, M.E.; Hunter, P.; Spyrakos, E.; Mercatoris, P.; Kovács, A.; Horváth, H.; Preston, T.; Présing, T.; Palenzuela, J.T.; Tyler, A. Spatio-seasonal variability of chromophoric dissolved organic matter absorption and responses to photobleaching in a large shallow temperate lake. Biogeosciences 2017, 14, 1215–1233. [Google Scholar] [CrossRef] [Green Version]
- Groisman, P.Y.; Karl, T.R.; Easterling, D.R.; Knight, R.W.; Jamason, P.F.; Hennessy, K.J.; Suppiah, R.; Page, C.M.; Wibig, J.; Fortuniak, K.; et al. Changes in the probability of heavy precipitation: Important indicators of climate change. Clim. Change 1999, 42, 243–283. [Google Scholar] [CrossRef]
- Jentsch, A.; Beierkuhnlein, C. Research frontiers in climate change: Effects of extreme meteorological events on ecosystems. C.R. Geosci. 2008, 340, 621–628. [Google Scholar] [CrossRef]
- Donat, M.G.; Alexander, L.V.; Yang, H.; Durre, I.; Vose, R.; Dunn, R.J.H.; Willett, K.M.; Aguilar, E.; Brunet, M.; Caesar, J.; et al. Updated analyses of temperatures and precipitation extreme indicies since the beginning of the twentieth century: The HadEX2 dataset. J. Geophys. Res. 2013, 118, 2098–2118. [Google Scholar]
- Easterling, D.R.; Kunkel, K.E.; Arnold, J.R.; Knutson, T.; LeGrande, A.; Leung, L.R.; Vose, R.S.; Waliser, D.E.; Wehner, M.F. Precipitation change in the United States. In Climate Science Special Report: Fourth National Climate Assessment; Wuebbles, D.J., Fahey, D.W., Hibbard, K.A., Dokken, D.J., Stewart, B.C., Maycock, T.K., Eds.; U.S. Global Change Research Program: Washington, DC, USA, 2017; Volume 1, pp. 207–230. [Google Scholar] [CrossRef]
- Madsen, T.; Figdor, E. When it Rains, it Pours: Global Warming and the Rising Frequency of Extreme Precipitation in the United States; Environment America Research and Policy Center: Denver, CO, USA, 2007. [Google Scholar]
- Spierre, S.G.; Wake, C.; Guttekk, R.; Hurtt, F.; Kelly, T.; Markham, A.; Schaefer, D.; VanDeveer, S. Trends in Extreme Precipitation Events for Northeastern United States 1948–2007; Carbon Solutions New England; University of New Hampshire: Durham, NH, USA, 2010. [Google Scholar]
- Madsen, T.; Wilcox, N. When It Rains, It Pours: Global Warming and the Increase in Extreme Precipitation from 1948 to 2011; Environment America Research and Policy Center: Denver, CO, USA, 2012. [Google Scholar]
- Melillo, J.M.; Richmond, T.C.; Yohe, G.W. (Eds.) Climate Change Impacts in the United States: The Third National Climate Assessment; U.S. Global Change Research Program: Washington, DC, USA, 2014; p. 841. [CrossRef]
- Frei, A.; Kunkel, K.E.; Matonse, A. The seasonal nature of extreme hydrological events in the northeastern United States. J. Hydrometeorol. 2015, 16, 2065–2085. [Google Scholar] [CrossRef]
- Huang, H.; Winter, J.M.; Osterberg, E.C.; Horton, R.M.; Beckage, B. Total and extreme precipitation changes over the northeastern United States. J. Hydrometeorol. 2017, 18, 1783–1798. [Google Scholar] [CrossRef]
- Huang, H.; Winter, J.M.; Osterberg, E.C. Mechanisms of abrupt extreme precipitation change over the northeastern United States. J. Geophys. Res. Atmos. 2018, 123, 7179–7192. [Google Scholar] [CrossRef]
- Reichwaldt, E.S.; Ghadouani, A. Effects of rainfall patterns on toxic cyanobacterial blooms in a changing climate: Between simplistic scenarios and complex dynamics. Water Res. 2012, 46, 1372–1393. [Google Scholar] [CrossRef]
- Morabito, G.; Rogora, M.; Austoni, M.; Ciampittiello, M. Could the extreme meteorological events in Lake Maggiore watershed determine a climate-driven eutrophication process? Hydrobiologia 2018, 824, 163–175. [Google Scholar] [CrossRef]
- Woodward, G.; Bonada, N.; Brown, L.E.; Death, R.G.; Durance, I.; Gray, C.; Hladyz, S.; Ledger, M.E.; Milner, A.M.; Ormerod, S.J.; et al. The effects of climatic fluctuations and extreme events on running water ecosystems. Philos. Trans. R. Soc. B Biol. Sci. 2016, 371, 20150274. [Google Scholar] [CrossRef] [Green Version]
- Warner, K.A.; Saros, J.E. Variable responses of dissolved organic carbon to precipitation events in boreal drining water lakes. Water Res. 2019, 156, 315–326. [Google Scholar] [CrossRef]
- Williamson, C.E.; Brentrup, J.A.; Zhang, J.; Renwick, W.H.; Hargreaves, B.R.; Knoll, L.B.; Overholt, E.P.; Rose, K.C. Lakes as sensors in the landscape: Optical metrics as scalable sentinel responses to climate change. Limnol. Oceanogr. 2014, 59, 840–850. [Google Scholar] [CrossRef] [Green Version]
- Williamson, C.E.; Overholt, E.P.; Brentrup, J.A.; Pilla, R.M.; Leach, T.H.; Schladow, S.G.; Warren, J.D.; Urmy, S.S.; Sadro, S.; Chandra, S.; et al. Sentinal responses to droughts, wildfires, and floods: Effects of UV radiation on lakes and their ecosystem services. Front. Ecol. Environ. 2016, 14, 102–109. [Google Scholar] [CrossRef]
- Howarth, M.E.; Thorncroft, C.D.; Bosart, L.F. Changes in extreme precipitation in the Northeast United States: 1979–2014. J. Hydrometeorol. 2019, 20, 673–689. [Google Scholar] [CrossRef]
- Huang, B.; Shin, C.-S. Predictive skill and predictable patterns of the U.S. seasonal precipitation in CFSv2 reforecasts of 60 years (1958–2017). J. Clim. 2019, 32, 8603–8637. [Google Scholar] [CrossRef]
- Hudson, J.J.; Dillon, P.J.; Somers, K.M. Long-term patterns in dissolved organic carbon in boreal lakes: The role of incident radiation, precipitation, air temperature, southern oscillation and acid deposition. Hydrol. Earth Syst. Sc. 2003, 7, 390–398. [Google Scholar] [CrossRef]
- Dillon, P.J.; Molot, L.A. Effect of landscape form on export of dissolved organic carbon, iron, and phosphorus from forested stream catchments. Water Resour. Res. 1997, 33, 2591–2600. [Google Scholar] [CrossRef]
- Tranvik, L.J. Availability of dissolved organic carbon for planktonic bacteria in oligotrophic lakes of differing humic content. Microb. Ecol. 1998, 16, 311–322. [Google Scholar] [CrossRef] [PubMed]
- Gavin, A.L.; Nelson, S.J.; Klemmer, A.J.; Fernandez, I.J.; Strock, K.E.; McDowell, W.H. Acidification and climate linkages to increased dissolved organic carbon in high-elevation lakes. Water Resour. Res. 2018, 54, 5376–5393. [Google Scholar] [CrossRef]
- Couture, S.; Houle, D.; Gagnon, C. Increases of dissolved organic carbon in temperate and boreal lakes in Quebec, Canada. Environ. Sci. Pollut. Res. 2012, 19, 361–371. [Google Scholar] [CrossRef]
- Urban, N.R.; Bayley, S.E.; Eisenreich, S.J. Export of dissolved organic carbon and acidity from peatlands. Water Resour. Res. 1989, 25, 1619–1628. [Google Scholar] [CrossRef]
- Gennings, C.; Molot, L.A.; Dillon, P.J. Enhanced photochemical loss of organic carbon in acidic waters. Biogeochemistry 2001, 52, 339–354. [Google Scholar] [CrossRef]
- Molot, L.A.; Dillon, P.J. Photolytic regulation of dissolved organic carbon in northern lakes. Glob. Biogeochem. Cycles 1997, 11, 357–365. [Google Scholar] [CrossRef]
- Fee, E.J.; Hecky, R.E.; Kasian, S.E.M.; Cruikshank, D.R. Effects of lake size, water clarity, and climatic variability on mixing depths in Canadian Shield lakes. Limnol. Oceanogr. 1996, 41, 912–920. [Google Scholar] [CrossRef]
- Read, J.S.; Rose, K.C. Physical responses of small temperate lakes to variation in dissolved organic carbon concentrations. Limnol. Oceanogr. 2013, 58, 921–931. [Google Scholar] [CrossRef]
- Schindler, D.W. A hypothesis to explain differences and similarities among lakes in the Experimental Lakes Area, northwestern Ontario. J. Fish. Res. Board. Can. 1971, 28, 295–301. [Google Scholar] [CrossRef]
- Xenopoulos, M.A.; Lodge, D.M.; Frentress, J.; Kreps, T.A.; Bridgham, S.D.; Grossman, E.; Jackson, C.J. Regional comparisons of watershed determinants of dissolved organic carbon in temperate lakes from the Upper Great Lakes region and selected regions globally. Limnol. Oceanogr. 2003, 48, 2321–2344. [Google Scholar] [CrossRef] [Green Version]
- Temnerud, J.; Hytteborn, J.K.; Futter, M.N.; Kohler, S.J. Evaluating common drivers for water color, iron, and organic carbon in Swedish watercourses. AMBIO 2014, 43, 30–44. [Google Scholar] [CrossRef] [PubMed] [Green Version]
- Nguyen, H.V.-M.; Lee, M.-H.; Hur, J.; Schlautman, M.A. Variations in spectroscopic characteristics and disinfection byproduct formation potentials of dissolved organic matter for two contrasting storm events. J. Hydrol. 2013, 481, 132–142. [Google Scholar] [CrossRef]
- Chen, M.; He, W.; Choi, I.; Hur, J. Tracking the monthly changes of dissolved organic matter composition in a newly constructed reservoir and its tributaries during the initial impounding period. Environ. Sci. Pollut. Res. 2016, 23, 1274–1283. [Google Scholar] [CrossRef] [PubMed]
- Lee, H.; Swamikannu, X.; Radulescu, D.; Kim, S.J.; Stenstrom, M.K. Design of stormwater monitoring programs. Water Res. 2007, 41, 4186–4196. [Google Scholar] [CrossRef]
- Hinton, M.J.; Schiff, S.L.; English, M.C. The significance of storms for the concentration and export of dissolved organic carbon from two Precambrian Shield catchments. Biogeochemistry 1997, 36, 147–165. [Google Scholar] [CrossRef]
- Berggren, M.; Klause, M.; Selvam, B.P.; Strom, L.; Laudon, H.; Jansson, M.; Karlsson, J. Quality transformation of dissolved organic carbon during water transit through lakes: Contrasting controls by photochemical and biological processes. Biogeosciences 2018, 15, 457–470. [Google Scholar] [CrossRef] [Green Version]
- Gilman, R.A.; Chapman, C.A.; Lowell, T.V.; Borns, H.W., Jr. The Geology of Mount Desert Island: A Visitors Guide to the Geology of Acadia National Park; Maine Geological Survey: Orono, ME, USA; Department of Conservation: Augusta, ME, USA, 1998; pp. 1–50.
- Strock, K.E.; Theodore, N.; Gawley, W.G.; Ellsworth, A.C.; Saros, J.E. Increasing dissolved organic carbon concentrations in northern boreal lakes: Implications for lake water transparency and thermal structure. J. Geophys. Res. Biogeosci. 2017, 122, 1022–1035. [Google Scholar] [CrossRef]
- Karl, T.R.; Knight, R.W.; Plummer, N. Trends in high-frequency climate variability in the twentieth century. Nature 1995, 377, 217–220. [Google Scholar] [CrossRef]
- Kunkel, K.E. North American trends in precipitation. Nat. Hazards 2003, 29, 291–305. [Google Scholar] [CrossRef]
- Fernandez, I.J.; Schmitt, C.V.; Birkel, S.D.; Stancioff, E.; Pershing, A.J.; Kelley, J.T.; Runge, J.A.; Jacobson, G.L.; Mayewski, P.A. Maine’s Climate Future: 2015 Update; University of Maine: Orono, ME, USA, 2015; p. 24. [Google Scholar]
- Walsh, J.J.; Weisberg, R.H.; Dieterle, D.A.; He, R.; Darrow, B.P.; Jolliff, J.K.; Lester, K.M.; Vargo, G.A.; Kirkpatrick, G.J.; Fanning, K.A.; et al. Phytoplankton response to intrusions of slope water on the West Florida Shelf: Models and observations. J. Geophys. Res. Ocean. 2003, 108, 21–31. [Google Scholar] [CrossRef] [Green Version]
- Helms, J.R.; Stubbins, A.; Ritchie, J.D.; Minor, E.C.; Kieber, D.J.; Mopper, K. Absorption spectral slopes and slope ratios as indicators of molecular weight, source, and photobleaching of chromophric dissolved organic matter. Limnol. Oceanogr. 2008, 53, 955–969. [Google Scholar] [CrossRef] [Green Version]
- Kirk, J.T.O. Light and Photosynthesis in Aquatic Ecosystems, 3rd ed.; Cambridge University Press: Cambridge, UK, 2011; p. 662. [Google Scholar]
- Weishaar, J.L.; Aiken, G.R.; Bergamaschi, B.A.; Fram, M.R.; Fugii, R.; Mopper, K. Evaluation of specific ultraviolet absorbance as an indicator of the chemical composition and reactivity of dissolved organic carbon. Environ. Sci. Technol. 2003, 37, 4702–4708. [Google Scholar] [CrossRef]
- Vachon, D.; Lapierre, J.F.; del Giorgio, P.A. Seasonality of photochemical dissolved organic carbon mineralization and its relative contribution to pelagic CO2 production in northern lakes. J. Geophys. Res. Biogeosci. 2016, 121, 864–878. [Google Scholar] [CrossRef] [Green Version]
- SanClements, M.D.; Oelsner, G.P.; McKnight, D.M.; Stoddard, J.L.; Nelson, S.J. New insights into the source of decadal increases of dissolved organic matter in acid-sensitive lakes of the Northeastern United States. Environ. Sci. Technol. 2012, 46, 3212–3219. [Google Scholar] [CrossRef]
- Hargreaves, B.R. Water column optics and penetration of UVR. In UV Effects in Aquatic Organisms and Ecosystems. Comprehensive Series in Photochemistry and Photobiology; Helbling, E.W., Zagarese, H.E., Eds.; Royal Society of Chemistry: London, UK, 2003; pp. 59–105. [Google Scholar]
- Lu, Y.; Bauer, J.E.; Canuel, E.A.; Yamashita, Y.; Chamber, R.M. Photochemical and bacterial alteration of dissolved organic matter in temperate headwater streams associated with different land use. J. Geophys. Res. Biogeo. 2013, 118, 1–15. [Google Scholar] [CrossRef] [Green Version]
- Guillemette, F.; del Giorgio, P.A. Simultaneous consumption and production of fluorescent dissolved organic matter by lake bacterioplankton. Environ. Microbiol. 2012, 14, 1432–1443. [Google Scholar] [CrossRef]
- Khomotova, T.E.; Shirshova, L.T.; Tinz, S.; Rolland, W.; Richter, J. Mobilization of DOC from sandy loamy soils under different land use (Lower Saxony, Germany). Plant Soil 2000, 219, 13–19. [Google Scholar] [CrossRef]
- Ågren, A.; Buffam, I.; Jansson, M.; Laudon, H. Importance of seasonality and small streams for the landscape regulation of dissolved organic carbon export. J. Geophys. Res. 2007, G03003. [Google Scholar] [CrossRef] [Green Version]
- Osburn, C.L.; O’Sullivan, D.W.; Boyd, T.J. Increases in the longwave photobleaching of chromophoric dissolved organic carbon in coastal waters. Limnol. Oceangr. 2009, 54, 145–159. [Google Scholar] [CrossRef]
- Yamashita, Y.; Nosaka, Y.; Suzuki, K.; Ogawa, H.; Takahashi, K.; Saito, H. Photobleaching as a factor controlling spectral characteristics of chromophoric dissolved organic matter in open ocean. Biogeosciences 2013, 10, 7207–7217. [Google Scholar] [CrossRef] [Green Version]
Figure 1.
Map of the study area in Acadia National Park, Maine, USA with the six study lakes outlined in yellow and weather station designated by the orange dot.
Figure 1.
Map of the study area in Acadia National Park, Maine, USA with the six study lakes outlined in yellow and weather station designated by the orange dot.

Figure 2.
Total daily precipitation in mm and mean daily temperature in °C for the water year beginning 1 October 2015 through 31 October 2016. Precipitation is indicated by the solid line, temperature is indicated by the dashed line, and gray bars indicate the two storms.
Figure 2.
Total daily precipitation in mm and mean daily temperature in °C for the water year beginning 1 October 2015 through 31 October 2016. Precipitation is indicated by the solid line, temperature is indicated by the dashed line, and gray bars indicate the two storms.

Figure 3.
Responses of the six study lakes for (a) [DOC], (b) SUVA254, (c) a*320, (d) a*380, (e) E2:E3, and (f) S275–295 of Early Summer versus Autumn storms represented by percent change from Pre to P2 (n = 6). The p values indicate differences between Early Summer and Autumn.
Figure 3.
Responses of the six study lakes for (a) [DOC], (b) SUVA254, (c) a*320, (d) a*380, (e) E2:E3, and (f) S275–295 of Early Summer versus Autumn storms represented by percent change from Pre to P2 (n = 6). The p values indicate differences between Early Summer and Autumn.

Figure 4.
Correlations between the percent change of [DOC], SUVA254, a*320, a*380, E2:E3, S275–295 and select lake characteristics (outlined in the larger boxes) during the Early Summer for (a) P1 and (b) P2 and Autumn (c) P1 and (d) P2 storm samplings. Bold borders on cells (within the larger boxes) indicate significant relationships (p < 0.10) between DOC metrics and lake characteristics. Larger circles indicate stronger correlations, red circles indicate negative correlations and blue circles indicate positive correlations. WA:LA indicates the ratio of watershed area to lake area.

Figure 5.
Correlations between the percent change of [DOC], SUVA254, a*320, a*380, E2:E3, and S275–295 and land cover (outlined in the larger boxes) during the Early Summer for (a) P1 and (b) P2 and Autumn (c) P1 and (d) P2 storm samplings. Bold borders on cells (within the larger boxes) indicate significant relationships (p < 0.05) between changes in DOC metrics and land cover. Larger circles indicate stronger correlations, red circles indicate negative correlations and blue circles indicate positive correlations.

Figure 6.
PCA plot illustrating changes between the percent change of [DOC], SUVA254, a*320, a*380, E2:E3, and S275–295 and environmental variables (lake characteristics land cover) during the Early Summer for (a) P1 and (b) P2 and Autumn (c) P1 and (d) P2 storm samplings. DOC metrics are indicated by red font, environmental variables are in black font.

Figure 7.
Conceptual figure of the dominant processes contributing to changes in DOC quality metrics for the Early Summer and Autumn storms. All responses are indicated by the percent change in DOC quality to a precipitation event, and the lake characteristics that influence a particular response. E2:E3 and S275–295 are indicated by dashed boxes and SUVA254, a*320, and a*380 are indicated by solid boxes. Gray arrows indicate dominant processes that contribute to DOC quality response and bold italics indicate key lake characteristics. SUVA254 provides information on the source and biological availability of DOC, a*320 is indicative of inputs of terrestrially derived DOC, a*380 can indicated changes in color, E2:E3 tracks changes in the relative size of DOC molecules, and S275–295 is indicative of exposure to sunlight.


Table 1.
Select characteristics of the six study lakes.
| Lake | Watershed Area (km2) | Lake Area (km2) | Watershed Area: Lake Area | Volume (×106 m3) | Maximum Depth (m) | Residence Time (years) | Mean DOC (mg L−1) |
|---|---|---|---|---|---|---|---|
| Jordan | 4.0 | 0.8 | 5.3 | 17.0 | 46 | 5.9 | 1.9 |
| Bubble | 1.8 | 0.1 | 13.5 | 0.6 | 12 | 0.5 | 2.3 |
| Eagle | 5.6 | 1.9 | 3.0 | 22.4 | 34 | 3.8 | 2.1 |
| Echo | 5.1 | 1.0 | 5.3 | 6.2 | 20 | 1.6 | 3.0 |
| Long | 13.1 | 3.8 | 3.4 | 33.4 | 34 | 3.1 | 3.1 |
| Seal Cove | 7.6 | 1.0 | 7.3 | 3.9 | 13 | 0.5 | 4.7 |
Table 2.
Dates of storms and sampling events for the six lakes.
| Season | Storm Dates | Sampling Dates | Storm Total Precipitation (mm) | ||
|---|---|---|---|---|---|
| Pre | P1 | P2 | |||
| Early Summer | 6 June 2016 | 4 June 2016 | 7 June 2016 | 10 June 2016 | 25.9 |
| Autumn | 21 October 2016 | 19 October 2016 | 23 October 2016 | 25 October 2016 | 30.2 |
Table 3.
Landscape characteristics for each of the six lakes.
| Lake | Slope (Degrees) | Landcover (%) | ||||||
|---|---|---|---|---|---|---|---|---|
| Developed | Deciduous | Evergreen | Mixed Forest | Scrub-Shrub | Herbaceous | Wetlands | ||
| Jordan | 47.5 | 6.2 | 10.0 | 34.7 | 13.6 | 24.7 | 8.2 | 2.6 |
| Bubble | 17.7 | 3.2 | 7.8 | 48.0 | 15.3 | 17.6 | 4.6 | 3.6 |
| Eagle | 45.1 | 12.0 | 9.8 | 34.3 | 29.4 | 8.4 | 1.6 | 4.6 |
| Echo | 23.4 | 9.8 | 1.1 | 64.4 | 17.8 | 1.8 | 1.4 | 3.6 |
| Long | 27.7 | 3.4 | 3.5 | 64.2 | 17.5 | 2.4 | 0.4 | 8.6 |
| Seal Cove | 17.1 | 4.1 | 0.8 | 59.2 | 16.9 | 4.8 | 3.2 | 11.0 |
Table 4.
Correlation (r) and p values for significant correlations between [DOC], SUVA254, a*320, a*380, E2:E3, and S275–295 and select lake characteristics (p < 0.10) at P1 and P2 storm samplings for Early Summer and Autumn storms. Italics indicate a negative relationship.
Table 4.
Correlation (r) and p values for significant correlations between [DOC], SUVA254, a*320, a*380, E2:E3, and S275–295 and select lake characteristics (p < 0.10) at P1 and P2 storm samplings for Early Summer and Autumn storms. Italics indicate a negative relationship.
| DOC Metric | Early Summer | Autumn | ||
|---|---|---|---|---|
| P1 | P2 | P1 | P2 | |
| [DOC] | WA:LA (r = 0.76; p = 0.08) | |||
| SUVA254 | Residence Time (r = −0.76; p = 0.08) | |||
| a*320 | Max Depth (r = −0.75; p = 0.08) Residence Time (r = −0.84; p = 0.04) | WA:LA (r = 0.84; p = 0.04) | ||
| a*380 | Residence Time (r = −0.79; p = 0.06) | |||
| E2:E3 | Max Depth (r = 0.80; p = 0.05) Residence Time (r = 0.76; p = 0.08) | |||
| S275–295 | Max Depth (r = 0.77; p = 0.07) Residence Time (r = 0.85; p = 0.03) | WA:LA (r = −0.74; p = 0.09) | ||
© 2020 by the authors. Licensee MDPI, Basel, Switzerland. This article is an open access article distributed under the terms and conditions of the Creative Commons Attribution (CC BY) license (http://creativecommons.org/licenses/by/4.0/).
Share and Cite
MDPI and ACS Style
Warner, K.A.; Fowler, R.A.; Saros, J.E. Differences in the Effects of Storms on Dissolved Organic Carbon (DOC) in Boreal Lakes during an Early Summer Storm and an Autumn Storm. Water 2020, 12, 1452. https://doi.org/10.3390/w12051452
AMA Style
Warner KA, Fowler RA, Saros JE. Differences in the Effects of Storms on Dissolved Organic Carbon (DOC) in Boreal Lakes during an Early Summer Storm and an Autumn Storm. Water. 2020; 12(5):1452. https://doi.org/10.3390/w12051452
Chicago/Turabian StyleWarner, Kate A., Rachel A. Fowler, and Jasmine E. Saros. 2020. "Differences in the Effects of Storms on Dissolved Organic Carbon (DOC) in Boreal Lakes during an Early Summer Storm and an Autumn Storm" Water 12, no. 5: 1452. https://doi.org/10.3390/w12051452
Note that from the first issue of 2016, this journal uses article numbers instead of page numbers. See further details here.