Article

A Zero-Liquid Discharge Model for a Transient Solar-Powered Desalination System for Greenhouse

1
Department of Engineering, University of Exeter, Exeter EX4 4QF, UK
2
City of Scientific Research and Technological Applications (SRTA), Alexandria 21934, Egypt
3
Environmental Engineering Department, School of Energy Resources, Environment, Chemical and Petrochemical Engineering, Egypt-Japan University of Science and Technology, Alexandria 21934, Egypt
4
Water and Water structures Engineering Department, Faculty of Engineering, Zagazig University, Zagazig 44519, Egypt
*
Authors to whom correspondence should be addressed.
Water 2020, 12(5), 1440; https://doi.org/10.3390/w12051440
Submission received: 18 April 2020 / Revised: 7 May 2020 / Accepted: 10 May 2020 / Published: 19 May 2020
(This article belongs to the Section Water Resources Management, Policy and Governance)

Abstract

:
The need for sustainable desalination arises from fast-occurring global warming and intensifying droughts due to increasing temperatures, particularly in the Middle East and North African (MENA) regions. Lack of water resources has meant that the countries in these regions have had to desalinate seawater through different sustainable technologies for food supplies and agricultural products. Greenhouses (GH) are used to protect crops from harsh climates, creating a controlled environment requiring less water. In order to have a sustainable resilient GH, a zero-liquid-discharge system (ZLD) was developed by using solar still (SS) desalination techniques, humidification-dehumidification (HDH), and rainwater harvesting. An experiment was designed and carried out by designing and manufacturing a wick type solar still, together with an HDH system, implemented into a GH. Using a pyrometer, the solar intensity was recorded, while the microclimate conditions (temperature and relative humidity) of the GH were also monitored. The GH model was tested in the UK and was shown to be a successful standalone model, providing its water requirements. In the UK, for one solar still with a surface area of 0.72 m2, maximum amount of 58 mL of distilled water was achieved per day. In Egypt, a maximum amount of 1090 mL water was collected per day, from each solar still. This difference is mainly due to the differences in the solar radiation intensity and duration in addition to the temperature variance. While dehumidification generated 7 L of distilled water, rainwater harvesting was added as another solution to the greenhouse in the UK, harvested a maximum of 7 L per day from one side (half the area of the greenhouse roof). This helped to compensate for the less distilled water from the solar stills. The results for the developed greenhouses showed how GHs in countries with different weather conditions could be standalone systems for their agricultural water requirement.

1. Introduction

Global warming is a contemporary issue that plays an important role in the water cycle system. It causes several climate changes, which lead to food and water insecurity. Since open field agriculture requires a large amount of water and controlling its conditions is implausible, agricultural greenhouses are commonly used in the production of fruit and vegetables. Covered in glass or plastic, these greenhouses (GHs) can create a controlled microclimate environment ideal for plant growth. GHs are also used to protect vegetation from climatic factors such as high wind speeds, intense solar radiation, high or low temperature and humidity levels [1,2]. These parameters can be controlled by opening/closing vents [3] or increasing/decreasing the humidity levels of the GH cavity [4,5,6] to maintain optimal ranges of temperature and humidity for the plants’ growth [7,8]. In order to have sustainable horticulture, energy and water demands should be planned in advance. Depending on the location and weather conditions, the temperature within the GHs should increase/decrease, using heating or cooling technologies, natural or forced ventilation, which may require electricity to provide energy for such systems [9,10]. In terms of water resilience, desalination, humidification-dehumidification, and rainwater harvesting are among the solutions to provide a sustainable zero-liquid-discharge (ZLD) system [11]. Incorporating such a system within a GH could lead to zero liquid discharge enabling farmers to continuously supply water to their crops without adding supplementary water to the system. The ZLD system would, therefore, be a system to collect and recycle water with minimum depletion of water. ZLD was mainly used in wastewater management [12,13], hitherto, ZLD systems had not been implemented in a GH.
Water desalination is commonly used in large scale processes to desalinate seawater for several industries and agriculture [14]. These desalination plants are usually large facilities and can produce up to 330,000 m3 of desalinated water a day using the popular, reverse osmosis procedure which consists of forcing saline water through a membrane (acting as a filter), using hydraulic pressure pumps [15]. Making distilled water has always been an expensive way to produce potable water and is an unpopular method of producing drinking water due to the high electrical power used by the reverse osmosis process to power the pumps [16]. Reverse osmosis requires high levels of energy to power these pumps for large water output and may not be suitable for small scale agricultural sites [17]. Therefore more sustainable solutions have been suggested using the available energy resources for cleaner production [9,10].
Solar stills (SS) are known found to be the cheapest method to produce drinking water using solar energy [17]. This system relies on evaporation to separate minerals from the water and as the water vapor rises, it will cool down, condense and trickle into a collector. The process can produce a significant volume of distilled water. In the previous studies, the main aim of solar stills has been to produce drinking water for communities with limited water resources and it has been shown that it can be used as a way to purify contaminated water sources through distillation. However, its application in agriculture has not been fully investigated. Solar stills trap the radiated solar energy for evaporation. This heating causes water to evaporate into an overlying membrane. As the water vapor comes into contact with the cooler surface, it condenses and trickles down to a collecting pipe as desalinated water. This process is also a popular purifying technique that was adopted several decades ago to separate minerals and pathogens from water [18,19]. SS panels make use of gravity for water droplets to flow downwards after condensation. Previous studies have shown that the optimum angle from the horizontal is between 35° and 45° [20,21,22,23,24]. It has been shown that the difference in tilt angles for different SSs is related to the latitude where the panel is located, and the type of distiller used [20,23]. Mashaly et al. [24] presented a design with a fixed angle of 29° to the horizontal. Although there are similarities in the angle used, high freshwater production requires a change in angle with different seasons by lowering the angles in the summer time for maximum solar penetration and maximum yield [18].
In the design of SS, the choice of the material used to absorb and maintain high thermal energy within the solar still panel is important. Previous studies have shown that aluminum is suitable due to its high thermal conductivity to retain heat [25,26], while also being light and easy to manufacture. Kabeel et al. [26] tested the evaporation rate of water with both aluminum and galvanized iron and concluded that aluminum was more effective at storing and conducting heat. It is also an ideal material with hydrophilic properties to help water spread evenly over the absorbing fabric [27].
A glass cover is commonly used for solar irradiance penetration into the solar still and was shown through testing to be effective [25]. Poblete et al. [22] studied the efficiency of different components of a solar distiller and concluded that the cover material is least significant for high water production of the solar still. While glass cover has been suggested as a more durable material, plastic can also be used for shorter periods of time [25]. In some studies, a polycarbonate cover has been implemented, as it is lighter than glass, is a good insulator, and has high strength and high solar transmittance [22,25,27,28]. Mashaly et al. [27] employed an antifogging coat on to the inside of the solar still polycarbonate cover to prevent fogging and help water droplets trickle down the cover faster, which would counteract the hydrophilic properties of such a polymer [29]. Fogging can also be the cause of less solar irradiance penetration into the still, and hence reduce the efficiency of the system [30,31]. Since the process is adiabatic, proper insulation of the frame was suggested in previous studies [32,33,34,35,36]. Wooden insulating shells enclosing a thin layer of plastic or wool are popular in basin type solar stills, as wood has less thermal conductivity [37,38,39]. Plastics have also been used for their lightweight and reliable characteristics to insulate the whole system [33,34]. Styrofoam has also been utilized due to its ease of implementation and its good quality insulation preventing heat from the bottom of the panel escaping to the outside [33,34].
Wick type solar stills use an absorbing material which is then heated by solar irradiance to evaporate the saline water [40,41]. Focusing on the fabric type, and testing on sportswear, it was found that the evaporation rate does not depend on the material type, but the quantity of water it absorbs [42]. Solar stills, therefore, require a large amount of water to be held by a thin fabric for optimum production rate. Among tilted solar still panels, common fabrics used are dark colored wick and jute [41,43]. However, there is limited research on different types of absorbents.
The use of jute was contradicted due to poor durability, including pore blockage and degradation of color causing a reduction in the distilled water production efficiency from the decreased radiation absorption [43]. Therefore, the use of a charcoal cloth type material which consists of a viscose material coated by chemicals to increase its durability and efficiency was suggested in another study [44]. Viscose has not been used widely in solar stills, however, it is used on a daily basis in sports and work wear, showing high durability, quick absorbance and evaporation of moisture [45]. The specifications of viscose satisfy the evaporation rate increase due to a higher quantity of water absorption by the fabric [42]. Viscose would therefore be an ideal fit for a system requiring a durable material with quick and high absorbance. The efficiency of the solar still desalination depends highly on the solar intensity it receives. While some studies showed its inefficiency [46], others obtained 0.95 L/m2 distilled water per hour [27]. Therefore, to increase the maximum yield, multiple panels could be set up to obtain a substantial output of distilled water for certain applications such as agriculture.
In order to achieve zero liquid discharge (ZLD), a humification-dehumidification (HDH), can be added to the system to provide a second sustainable source of water for small size greenhouses. This technique works automatically by condensating the excess water vapor, mainly from plants’ transpiration, within the GH cavity before it leaves the system through the vent, and if the vapor levels reach a certain lower amount, it will stop. This is a functional method with low running costs, limited need for maintenance and requiring a relatively low amount of energy. It can also be used in any GH [47]. HDH is commonly used to desalinate water by evaporating brine water using a heater and proceeding to dehumidify the moist air to collect distilled water [47,48]. Previous studies have shown different values such as 3.6 L per day [49], and 0.55 L per hour [50], mainly during summer. Using SS and HDH will generate highly concentrated brine water which can be used for salt harvesting [51], aquaculture [52], especially artemia shrimps which can live in highly salinized water [53]. The produced brine can, therefore, be an excellent food source for fish and larger crustaceans [52]. A gutter was also used to harvest the rainwater for watering the plants as another management scenario for water resources, especially for the UK.
Standalone horticultural systems have been mainly focused on energy requirements rather than water needs [54,55,56]. Although desalination was studied in the literature for the greenhouse water requirements, they mainly used reverse osmosis [57,58]. In the study by Farrell et al. [59], water was produced via humidification-dehumidification and reverse osmoses. The advantage of using solar still for desalination is that it uses renewable energy unlike Reverse Osmosis (RO) that requires a significant amount of energy to provide the high-pressure difference on the membrane. In addition, solar still is used to reduce the cooling load of the GH, especially for the Egyptian GH where it uses the extra solar radiation (beyond the plant needs). However, solar still needs a relatively large area to produce the same amount of water produced by the RO unit in a small area. Therefore, the novelty of this study is presenting a combination of sustainable solutions for providing horticultural water demands from the system’s local advantage, solar desalination for Egypt, and rainwater harvesting for the UK, while dehumidification could be used for both systems.

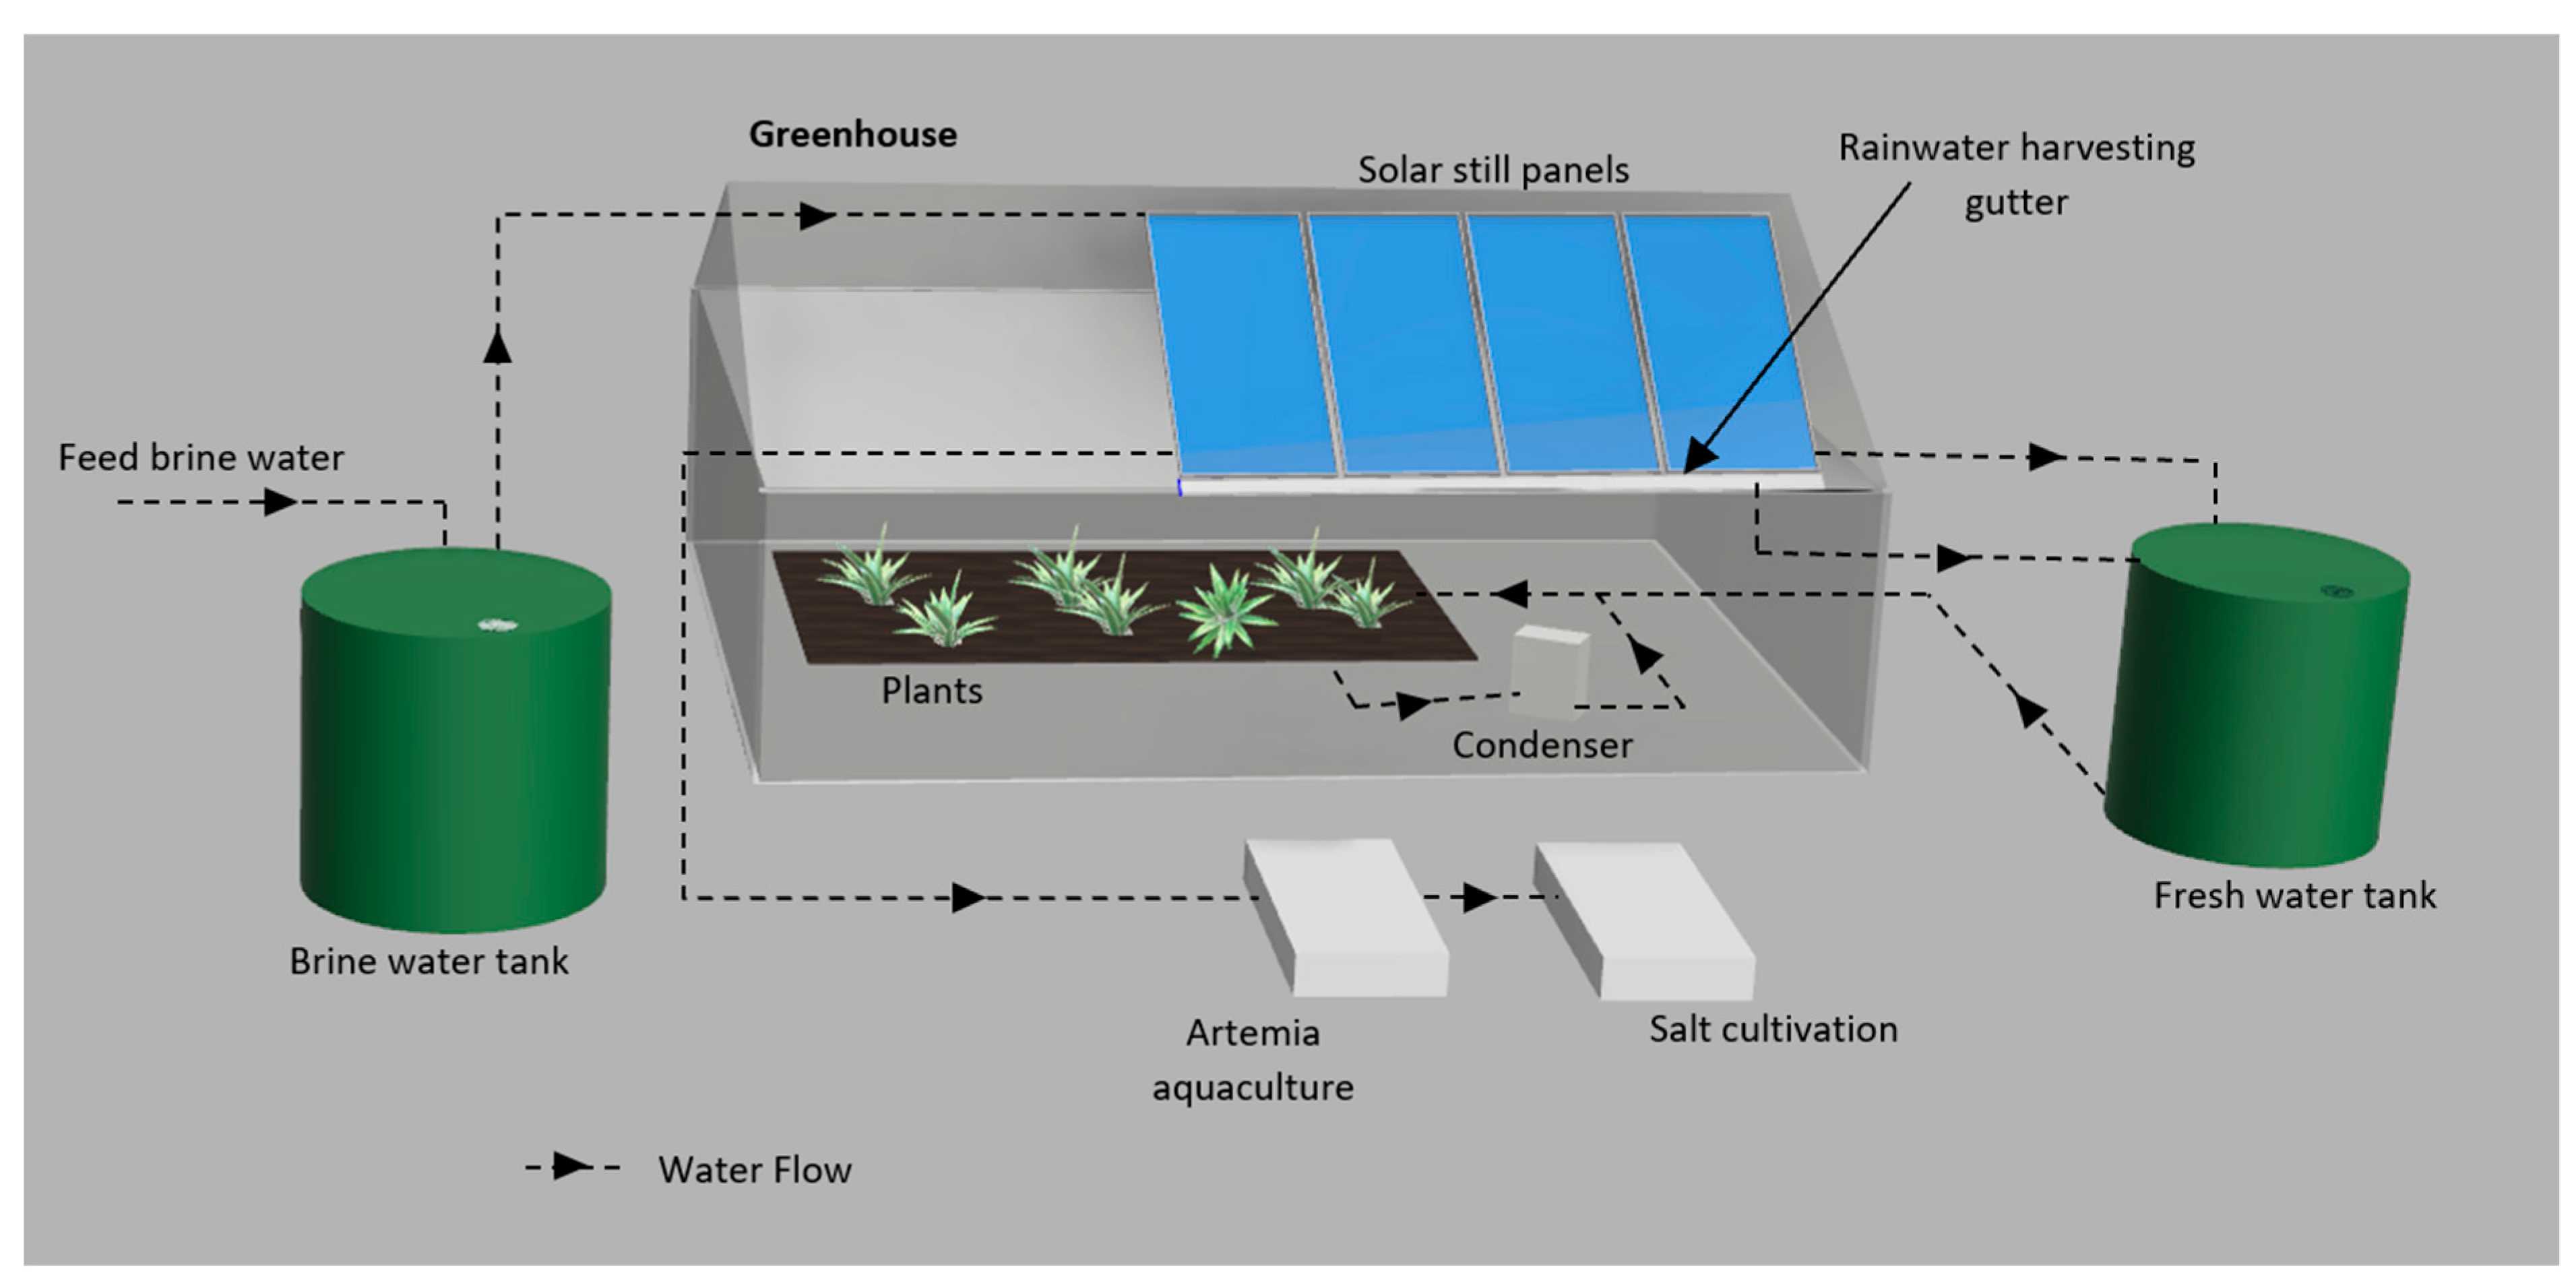
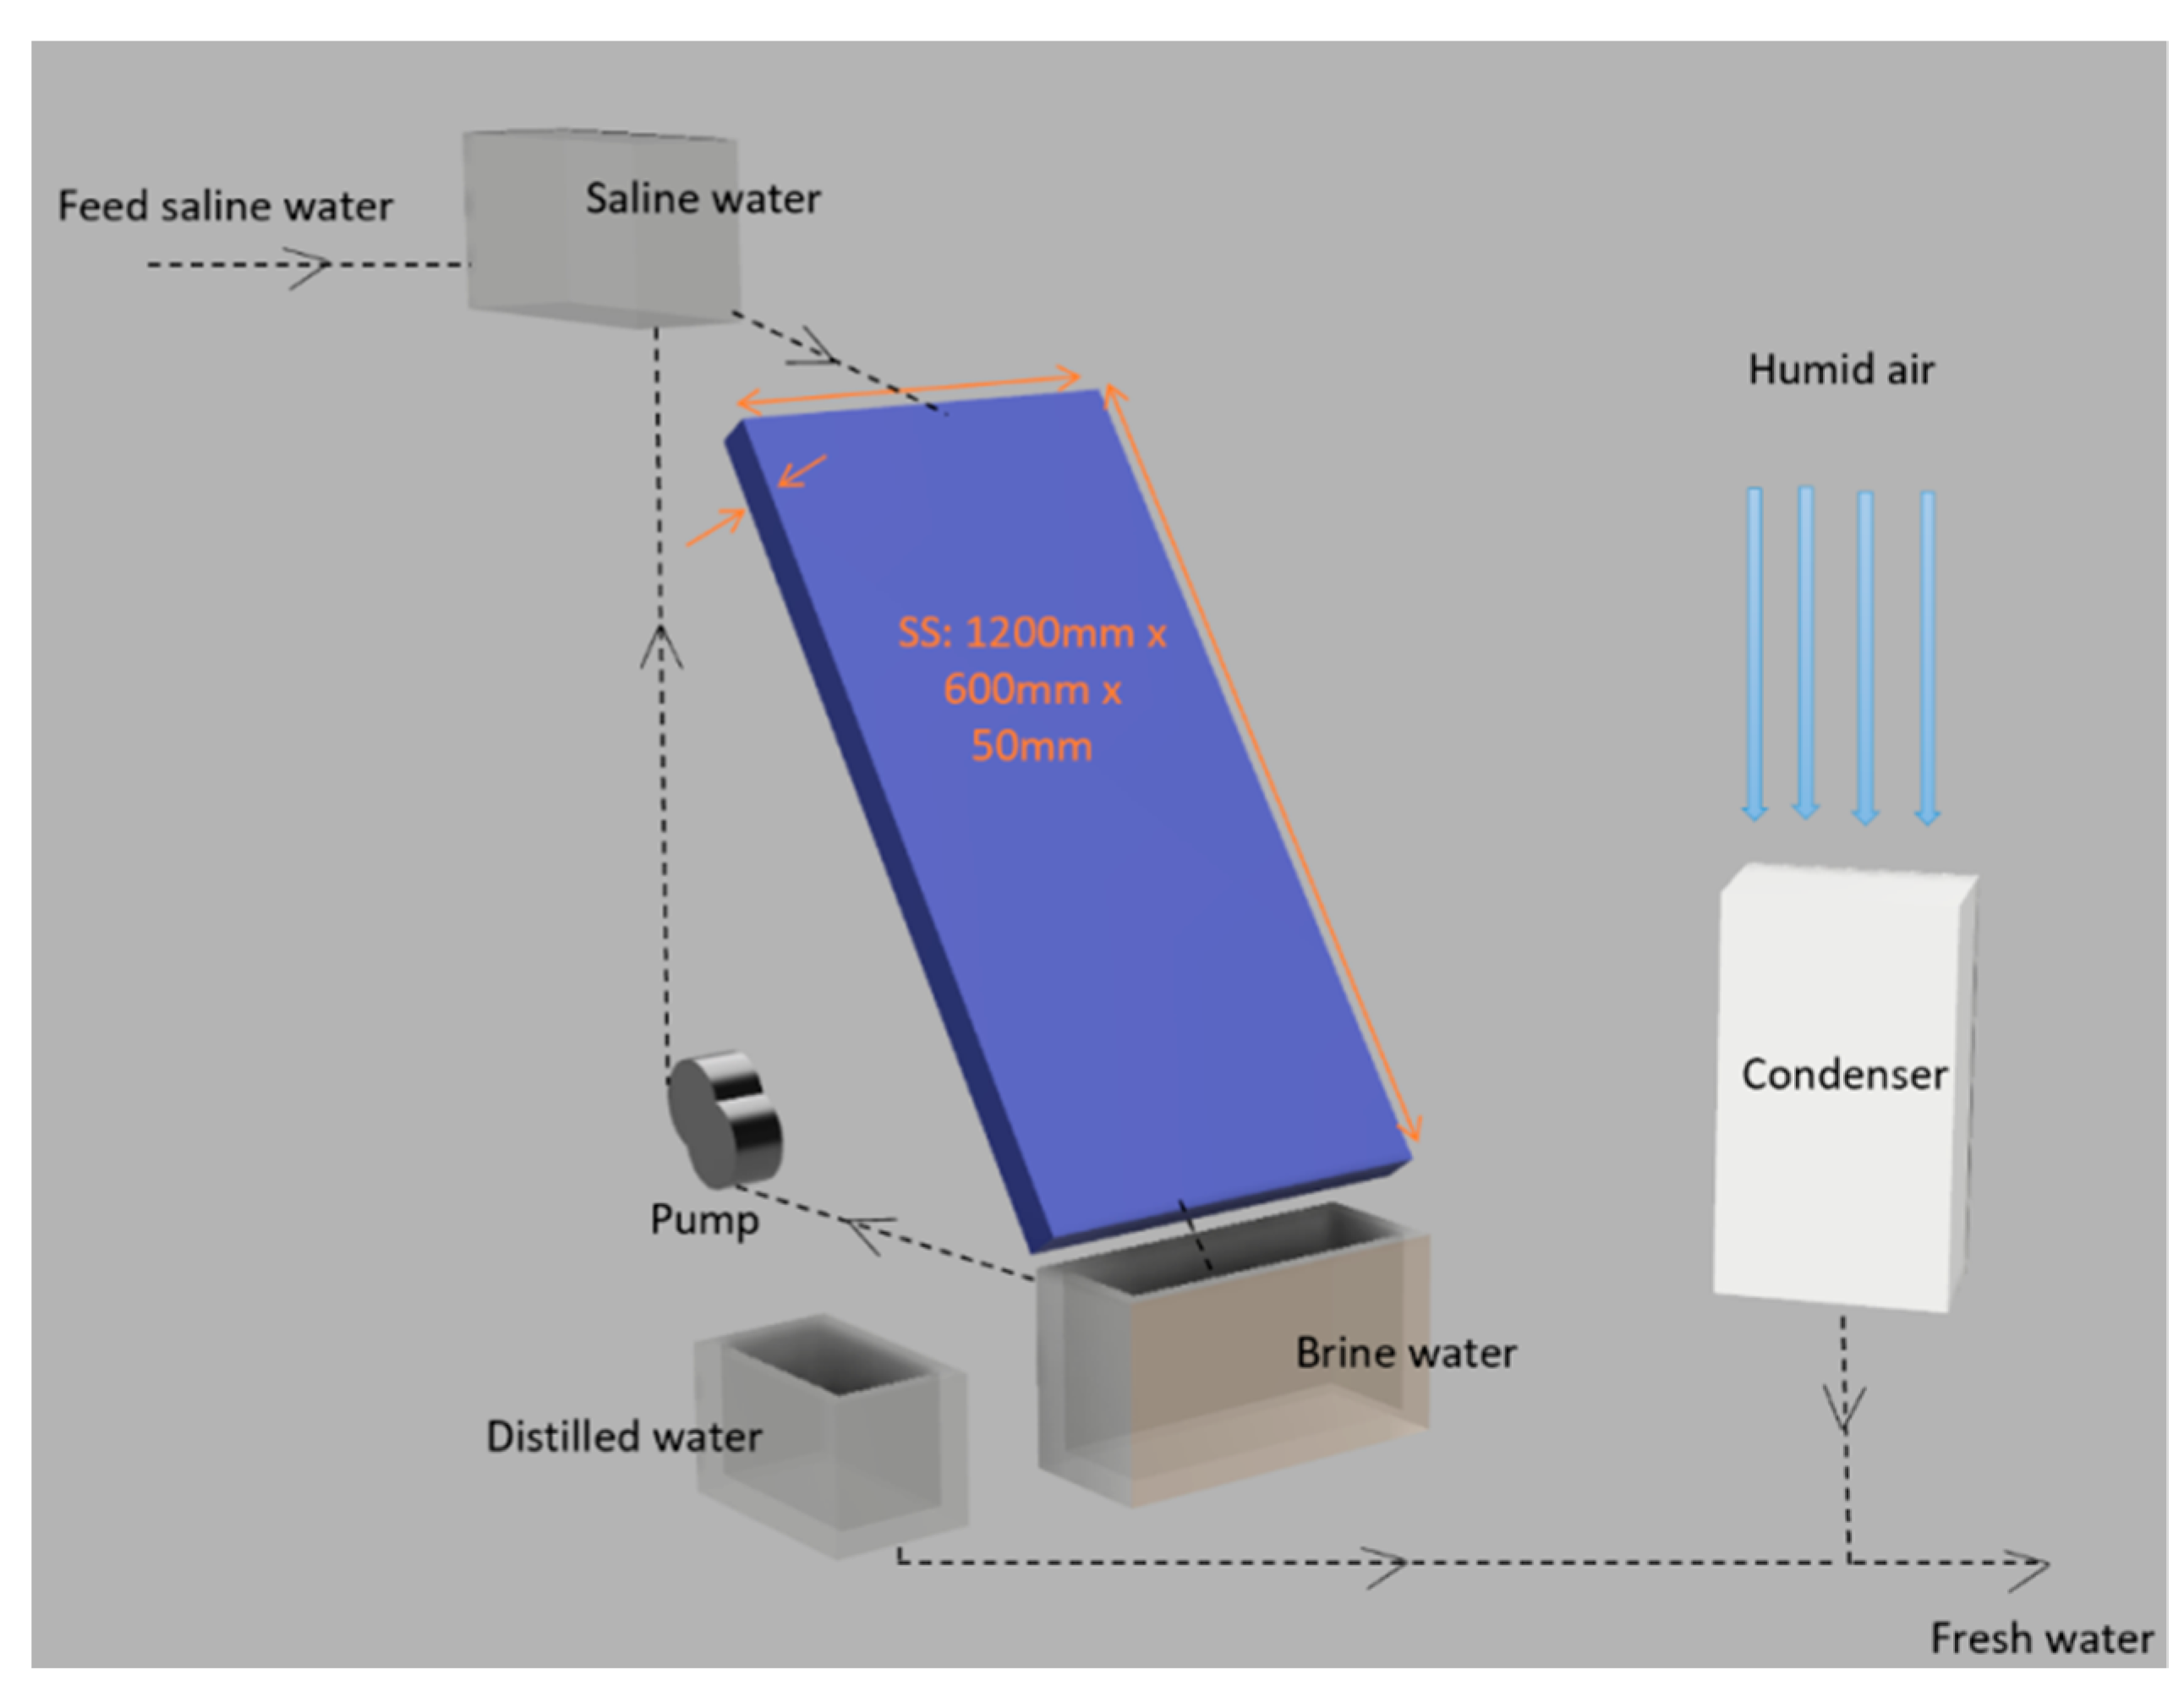
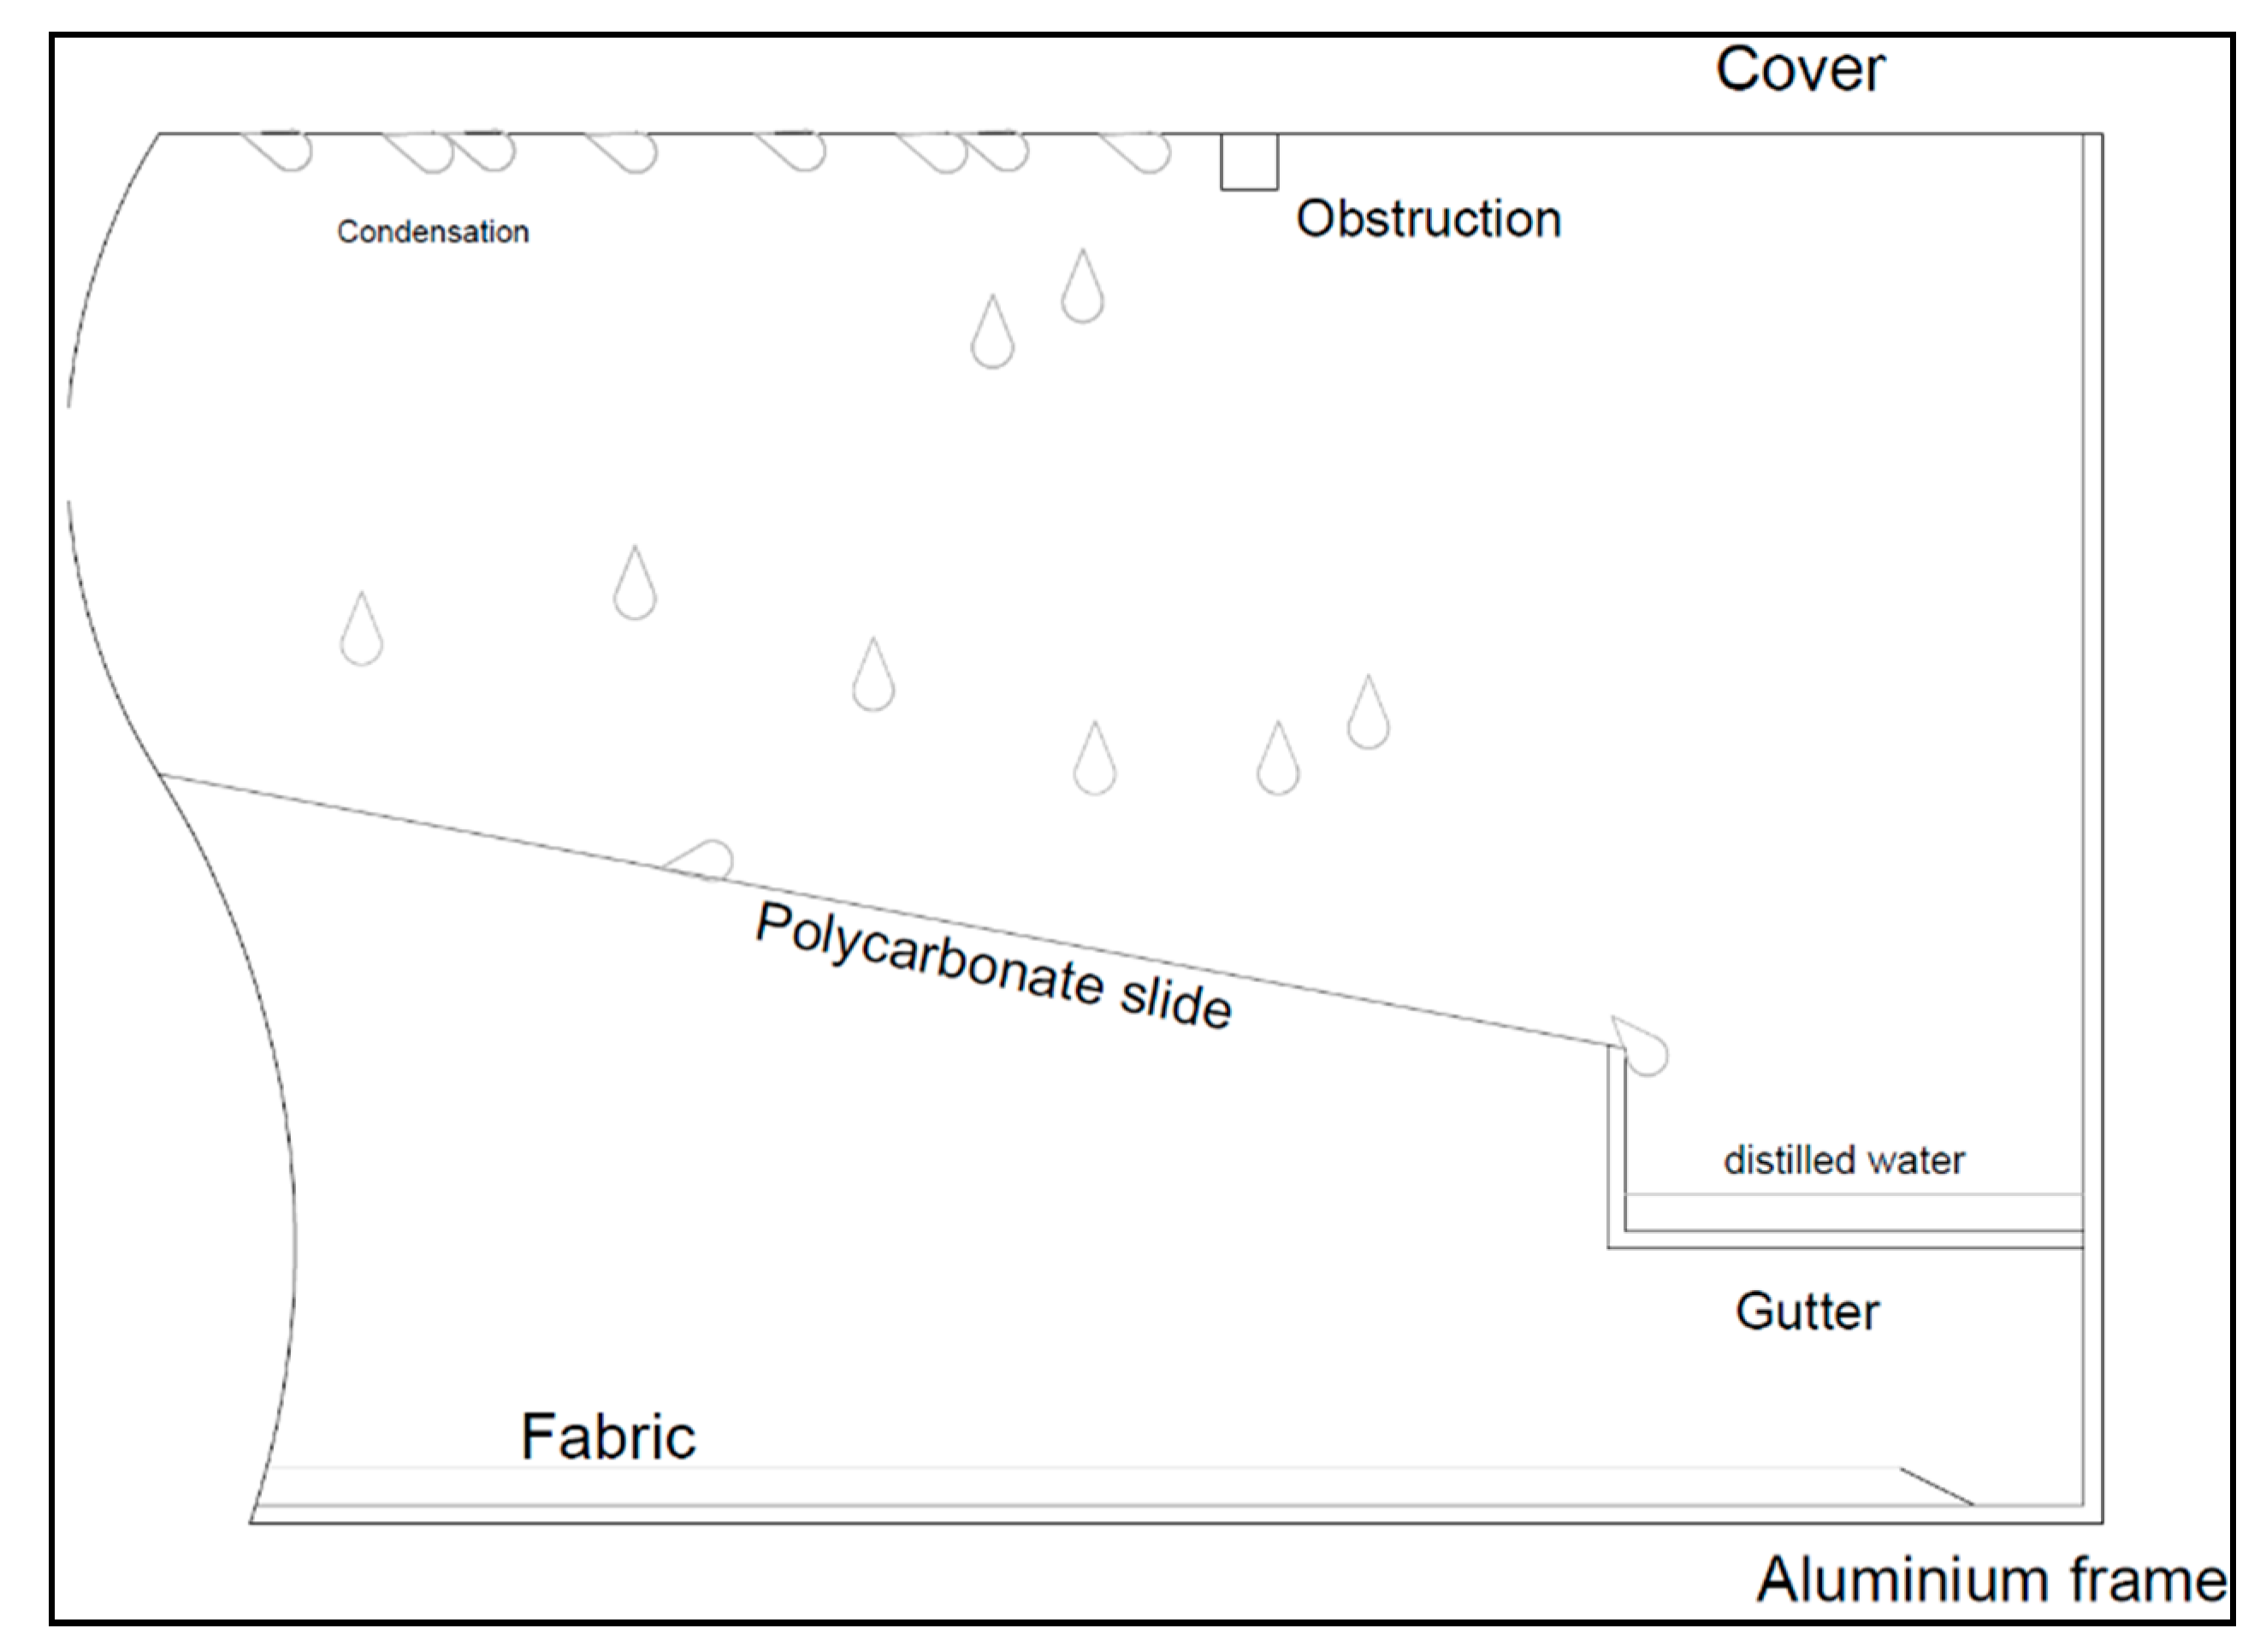
2. Materials and Methods

A schematic design for a ZLD system consisting of a solar still, a condenser (dehumidifier), and a gutter for harvesting rainwater is shown in Figure 1.
In this study, a wick type SS with an absorbing fabric and overlying transparent cover held at an angle between 30 and 45 degrees to the horizontal is used to absorb and trap thermal energy emitted by the sun (see Figure 2). In the model, water stored within the fabric accumulates heat energy, inducing evaporation. A water tank feeds saline water to the tilted SS. Water flows into the panel and is absorbed by a thin viscose fabric until it is saturated. The remaining stream of water flows into a brine water collection bucket. A small pump transfers this brine back to the saline water tank to start the process again. The water absorbed by the fabric is exposed to solar radiation acting on the fabric, therefore increasing its internal thermal energy to reach the latent heat of evaporation (see Figure 3). The water vapor then accumulates on an overlying membrane, causing condensation.
The utilized solar still consists of a polycarbonate sheet setup on the aluminum frame held at an angle from the horizontal. The choice of still (wick type) was due to the lack of experimental results on such a design in previous studies and its high yield discovered by previous studies [27]. The dimensions (width of 600 mm and length of 1200 mm) were chosen so that mobility would not be an issue.
The initial idea of speed fit pipe connector was changed by flaring a piece of copper pipe with a blow torch and a hammer, fitting it into the output holes and sealing them with a silicone sealant. A handheld drill with 4 mm and 10 mm drill bits was used to make the holes required for screws and water flow pipes, respectively. An aluminum cover was also welded to allow the polycarbonate film to be sealed and attached to the frame using silicone sealant and screws. A thin Styrofoam shell was used to ensure the sealed condition and harness a maximum amount of heat inside the panel [32]. A thin layer of dark colored viscose fabric membrane was attached to the bottom of the frame using screws, to absorb water. The distiller was set up south-west facing as this is the optimum angle for the surface of the still to allow the maximum exposure to sunlight throughout the day. A small sheet (600 mm × 200 mm) of polycarbonate was placed on the edge of the gutter and attached to the aluminum walls using silicon, between the cover and the absorbing fabric as shown in Figure 2. This meant that condensation happening before the obstruction dropped on to the polycarbonate catchment, acting as a slide, resulting in droplets flowing down to the collecting gutter, finally producing a more substantial water outflow.
One SS was used for the developed GH, with one Netta 20 litre portable digital Dehumidifier with timer, Manchester, UK. This electric dehumidifier requires an energy input of 450 W, and produces an average water production of 20 L/day (30 °C, 80% Rh). The produced water from this system was collected every 24 h at the same time as the solar still.
In order to test the functionality of the system, microclimate data, including temperature, relative humidity and incoming solar radiation, were collected from the GH. Temperature and relative humidity data were collected using the humidity and temperature logger ThermaData HTD, ETI, West Sussex, UK, every second. Incoming solar radiation from the sun was collected using a pyranometer, Campbell Scientific, Utah, USA, to record the energy rate of incident irradiance on the unit surface area. A reading was taken every 105 s.
In parallel, recorded parameters were analyzed for the efficiency and optimum environment for the distiller (Table 1). A computer ran continuously inside the GH, monitoring temperature, relative humidity and incoming solar radiation. To achieve this, the computer was connected to several data loggers, which were synchronized with sensors through the Wifi system. Distilled water was collected at the same time daily to maximize the accuracy of the reading. The angle of the still (the control variable in this experiment), was manually changed in 5° increments starting from 30° to 45°, as these are the most optimum angles according to earlier studies [20,21,22,23].
The water cycle through the ZLD system in the experiment is shown in Figure 4. The first step in this process starts with the saline water being inserted into an elevated jerry can. This is opened to flow into the SS panel, and the water is either distilled or disposed of as brine water in a collection tank. Distilled water is directed to a storage container and, is then used to water plants within the greenhouse. The brine water is recycled using a pump back into the jerry can. After a few cycles, the saline content of the brine increases. Plants absorb water and, through the process of respiration, they transpire, causing an increase in humidity. The dehumidifier uses a cooling mechanism to change the water vapor into liquid. This can, therefore, be used to water the plants. As water is lost through ventilation, saline water is added to the solar still and the loop continues.
To ensure sustainable irrigation for the greenhouse plants, the Irrigatia weather responsive smart irrigation controller, North Yorkshire, UK, were used. This solar-powered system can detect weather and change the watering demands based on the sensed conditions and also the season.

3. Results

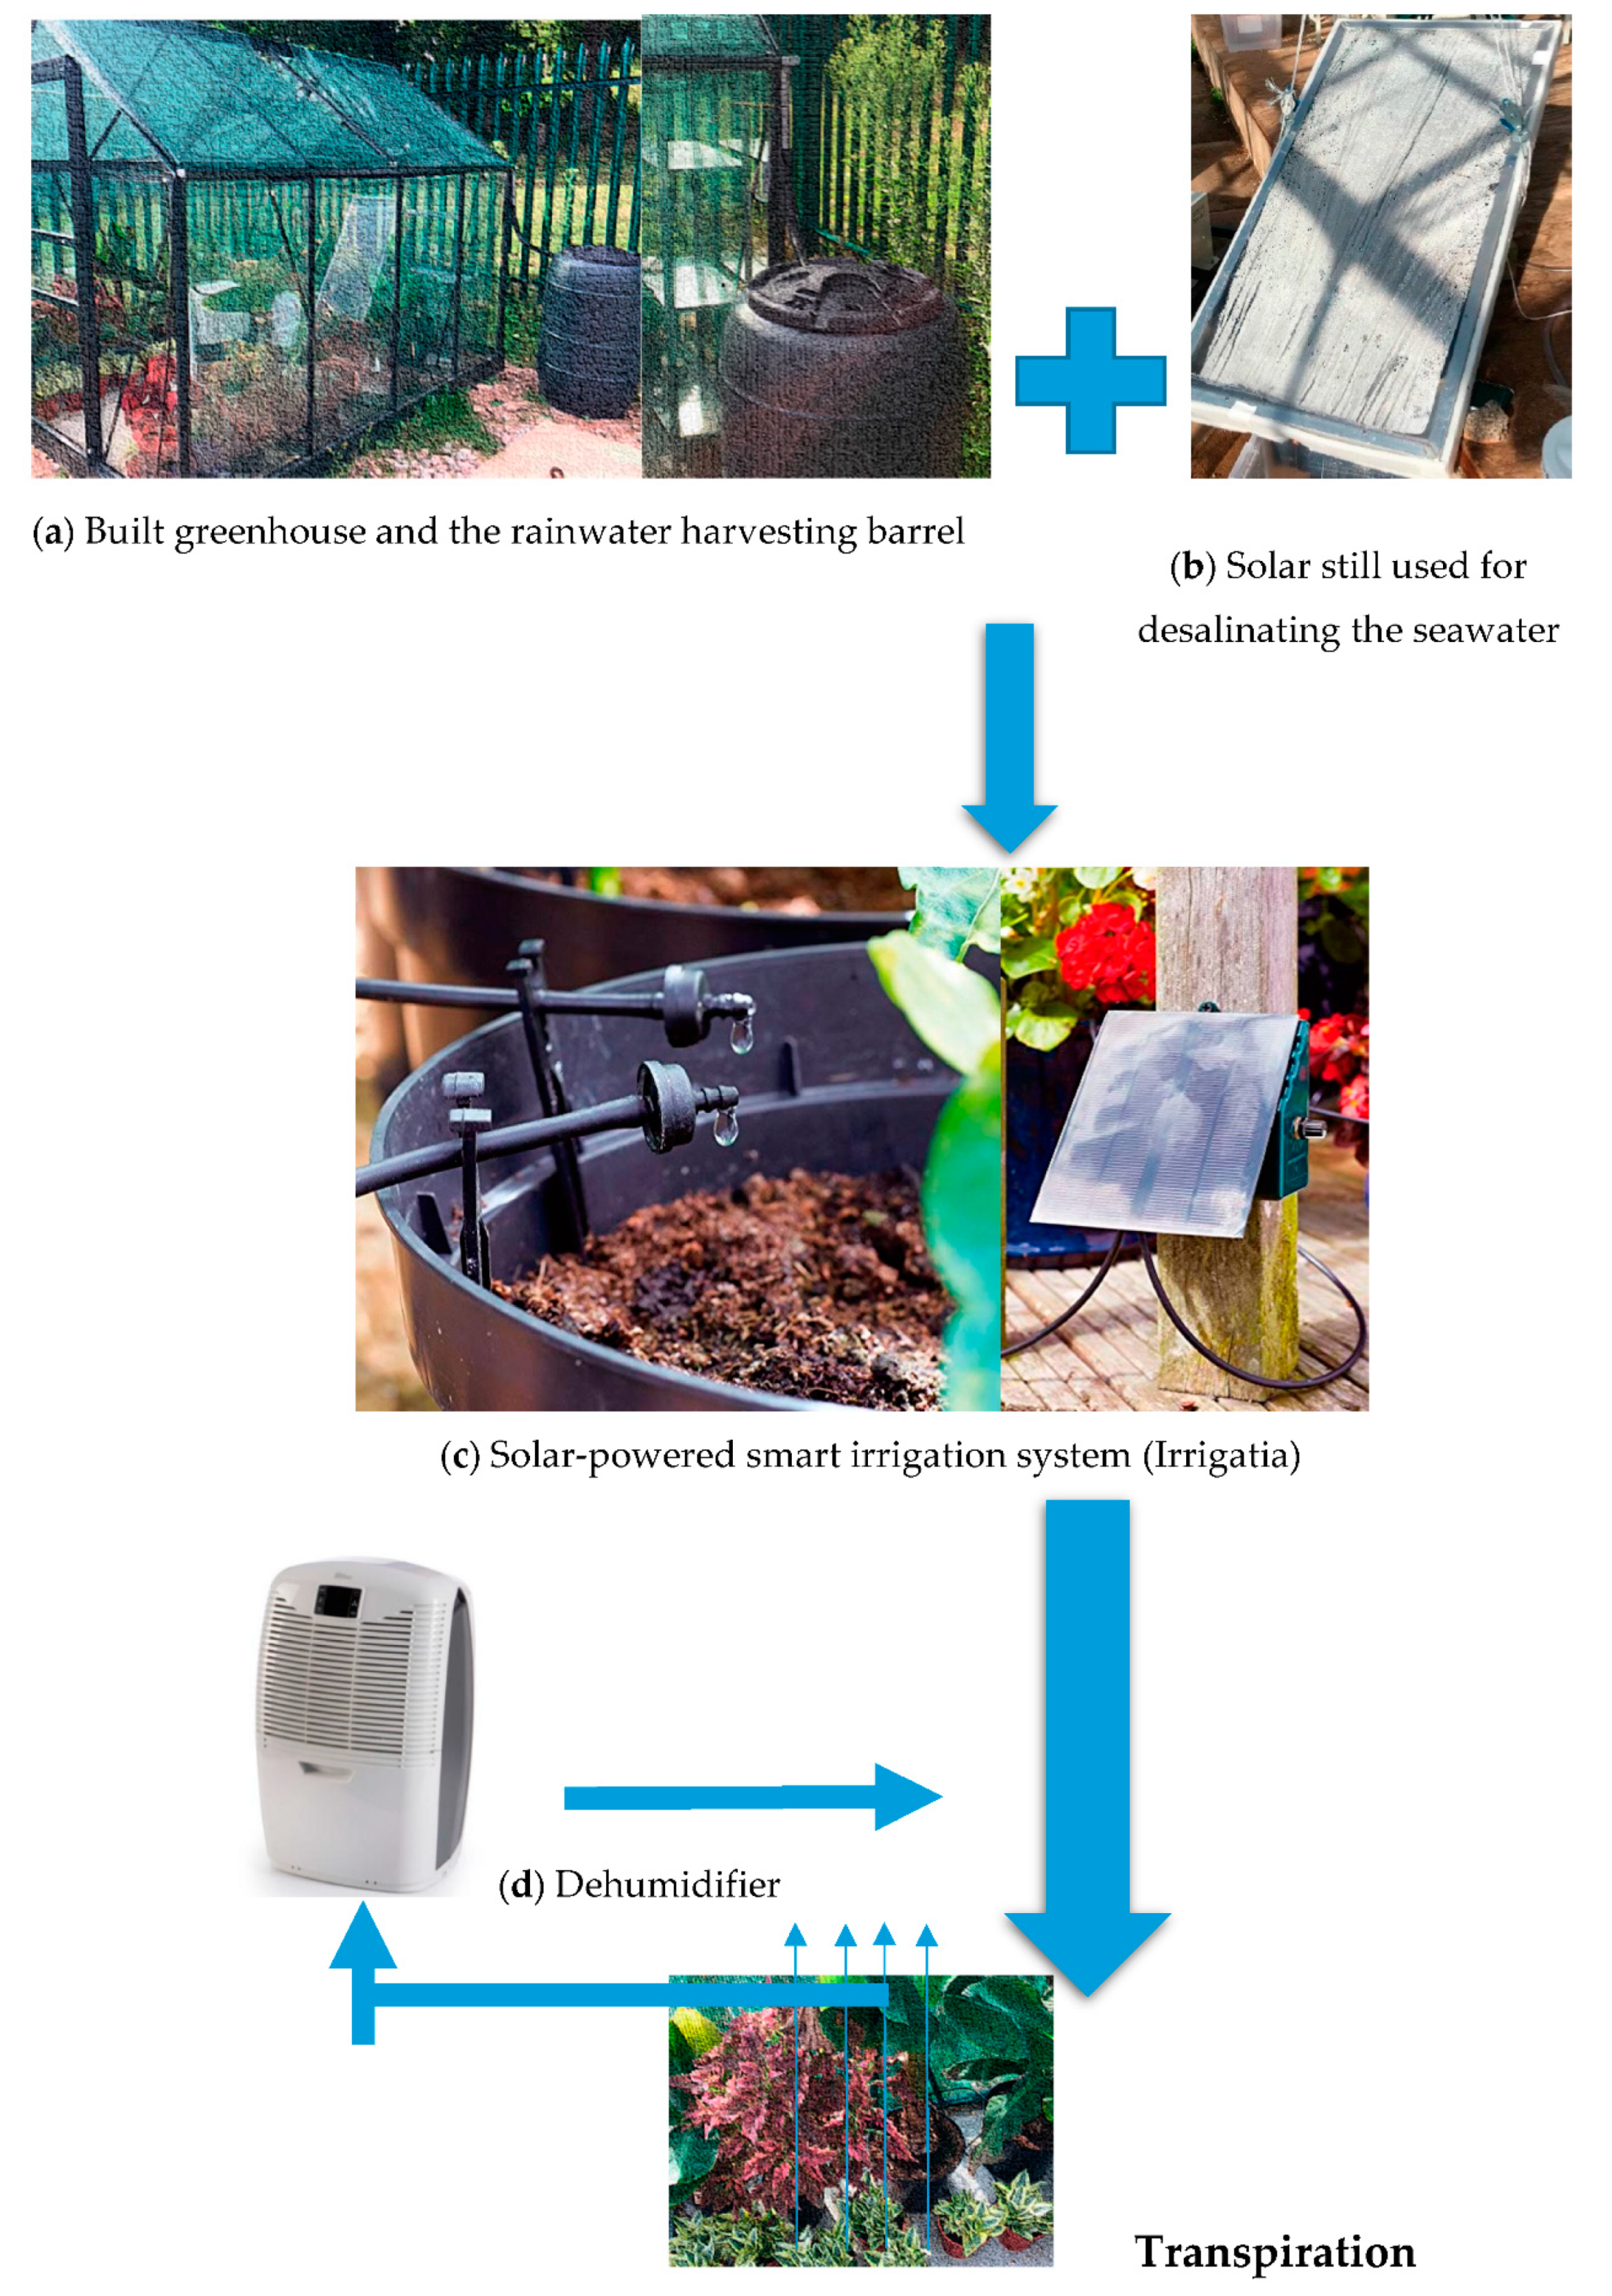
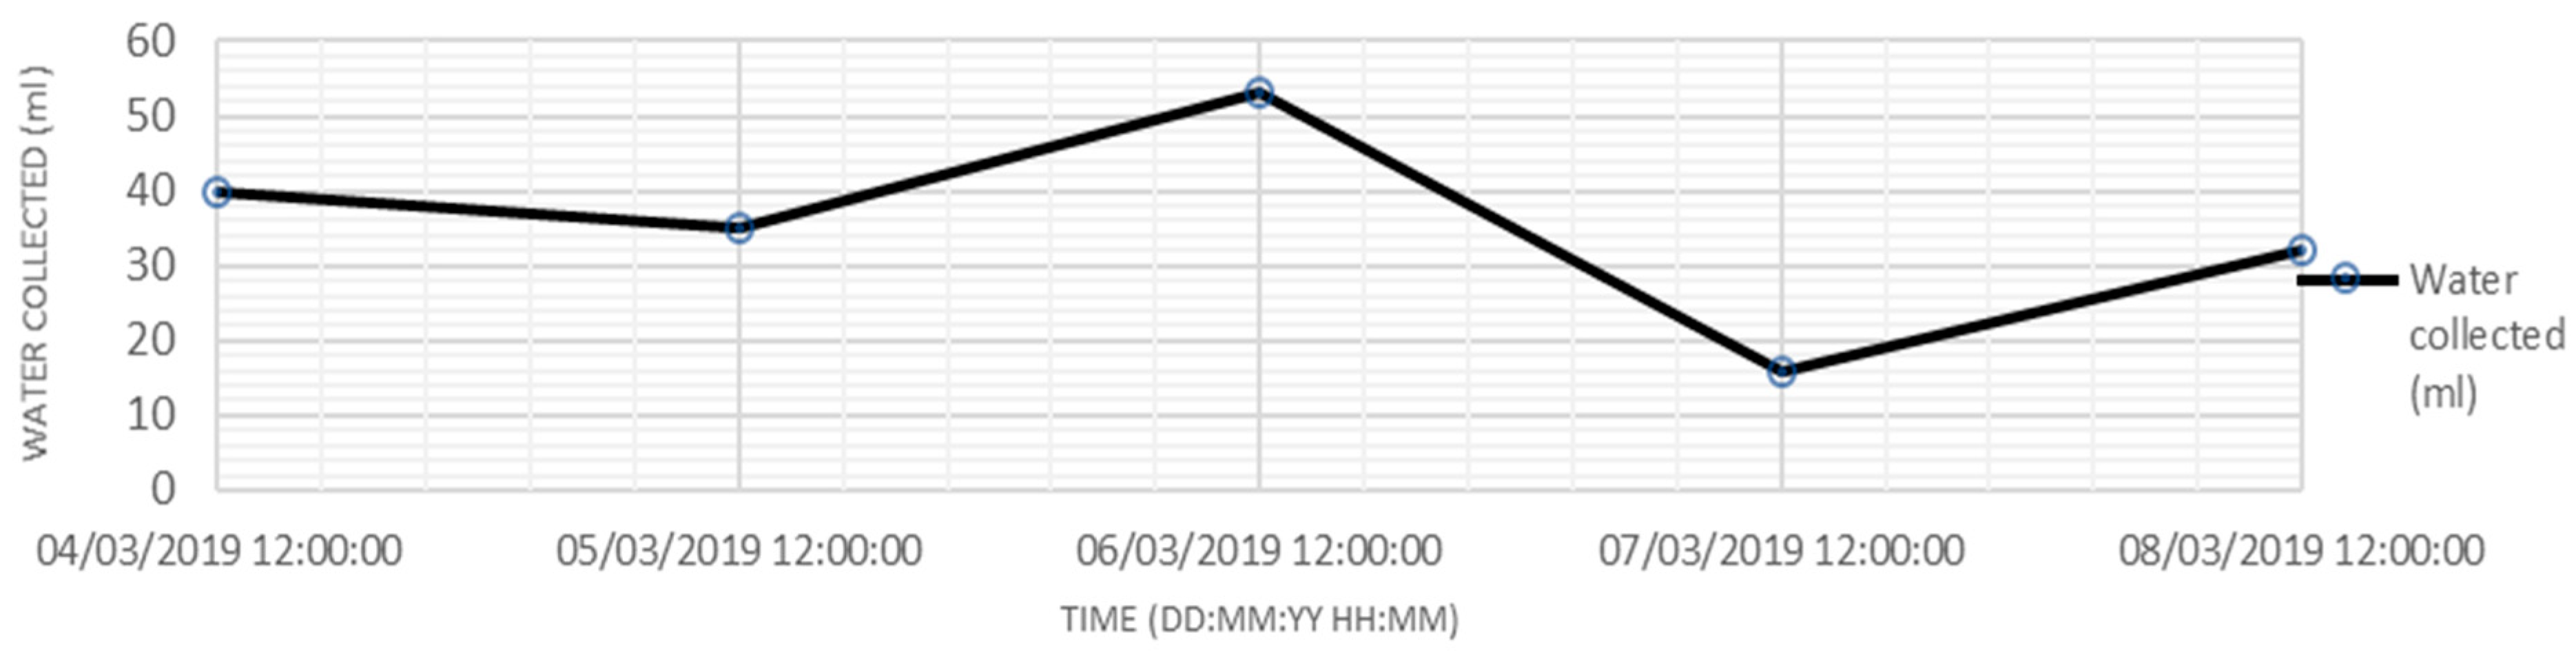
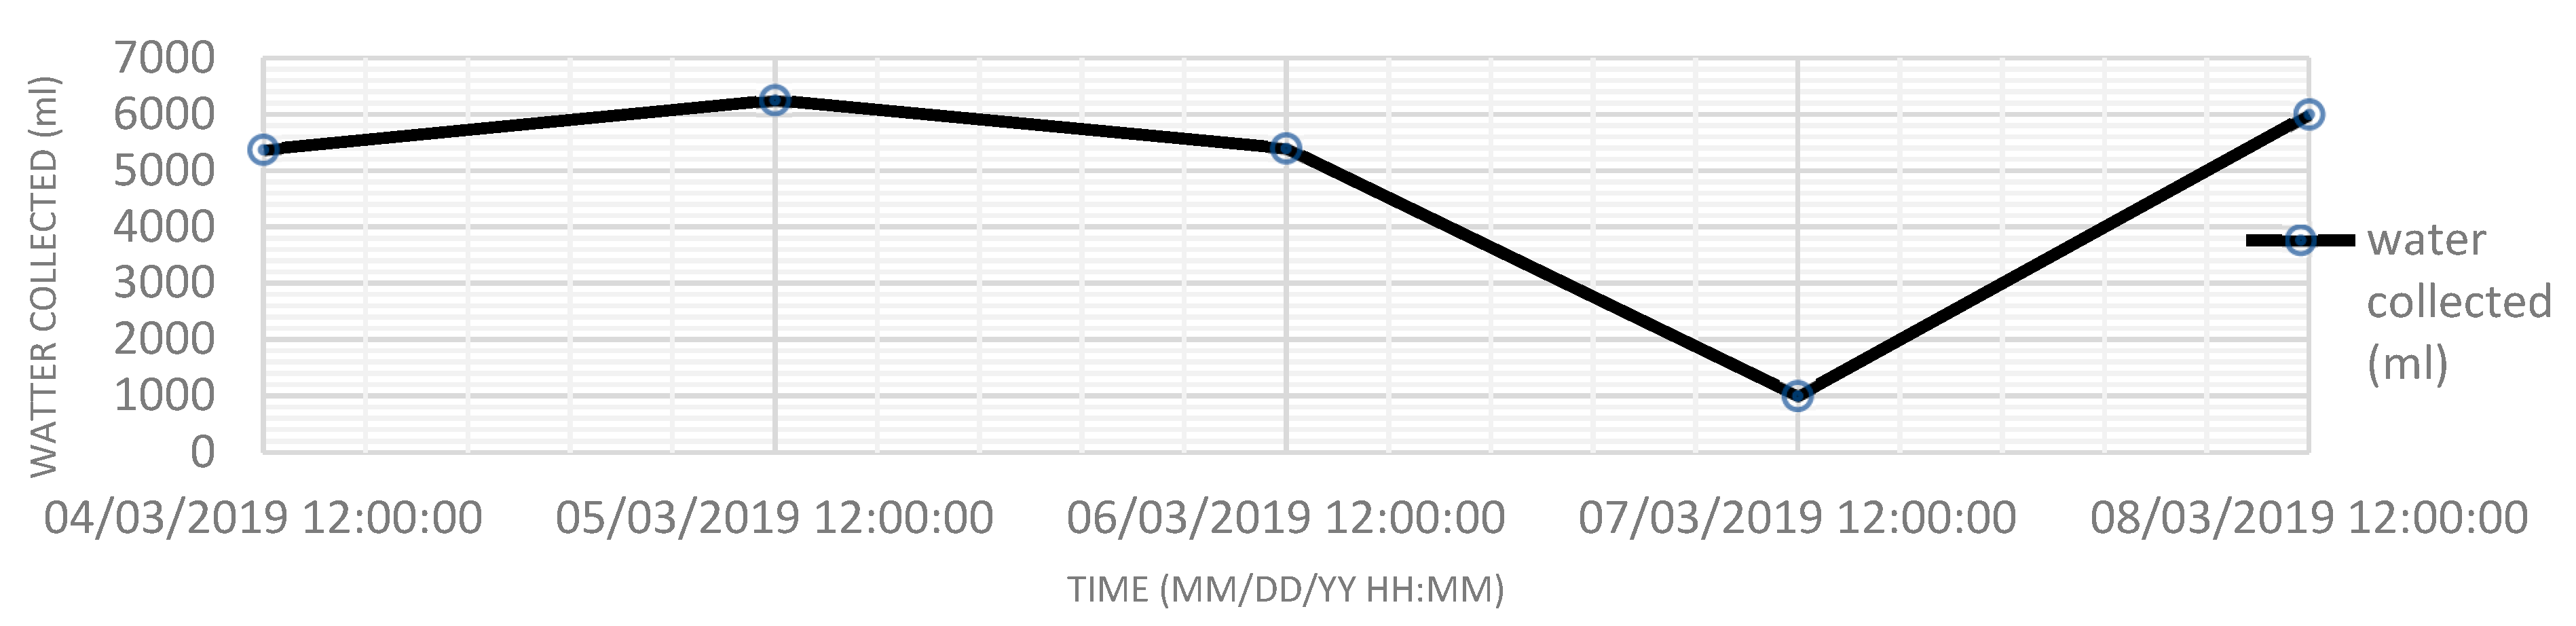
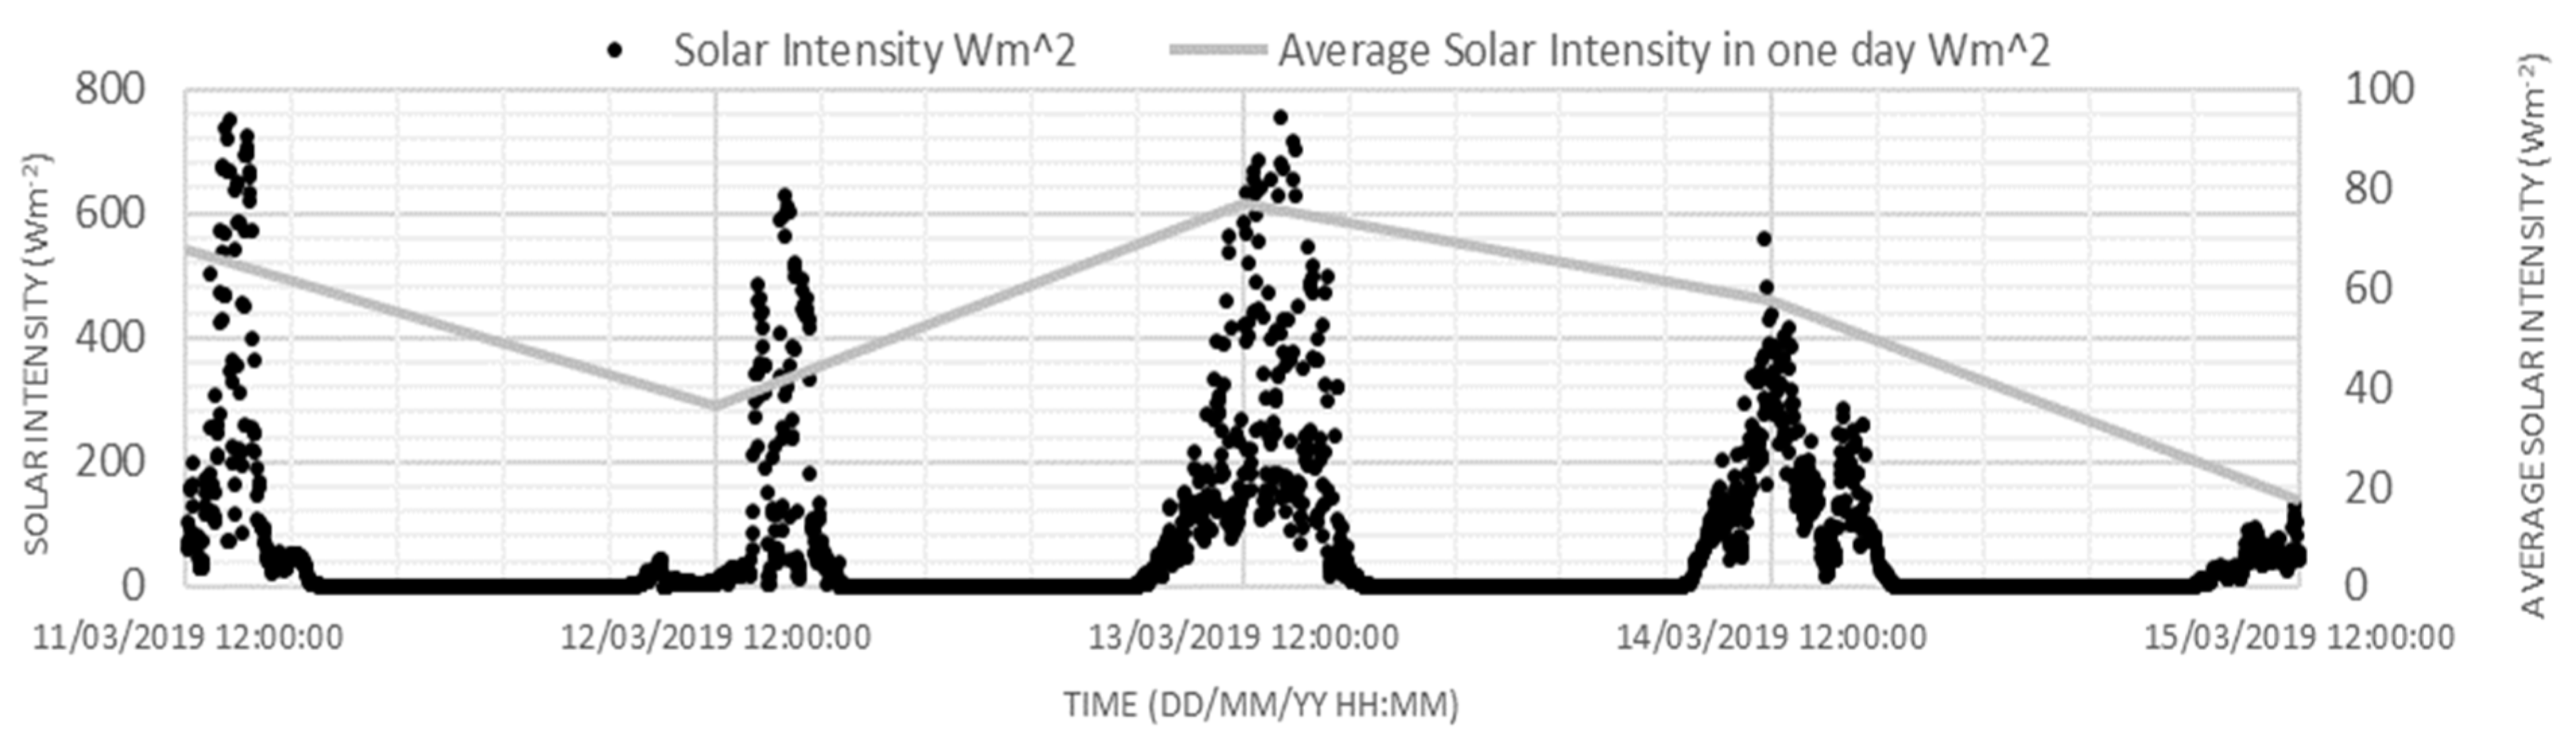
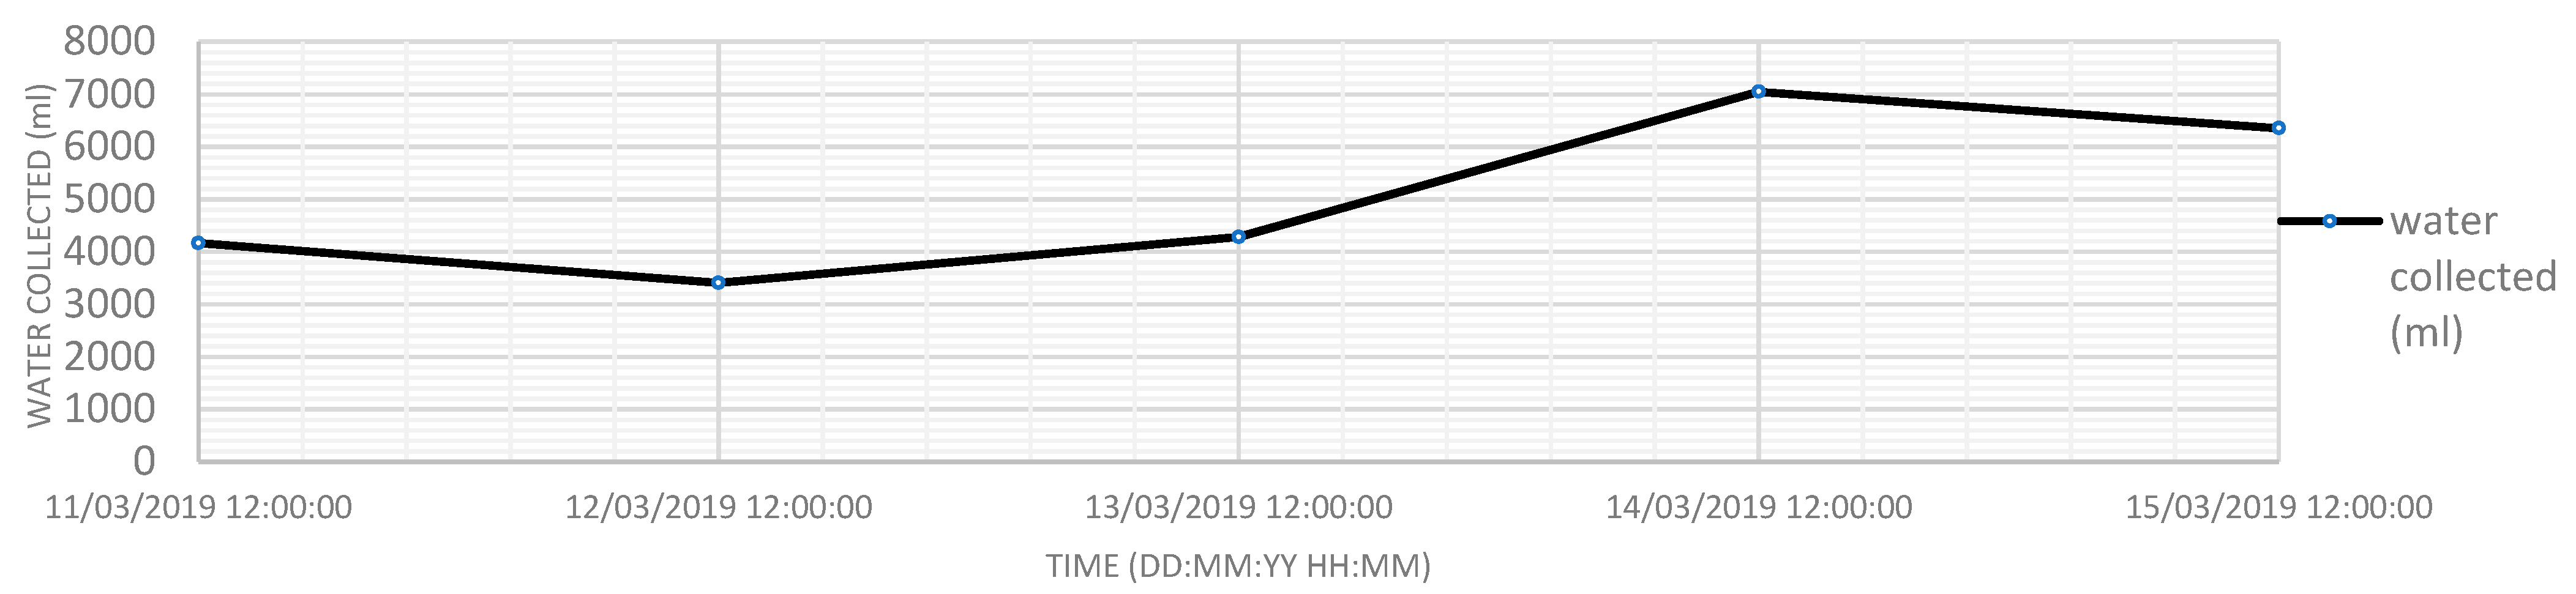
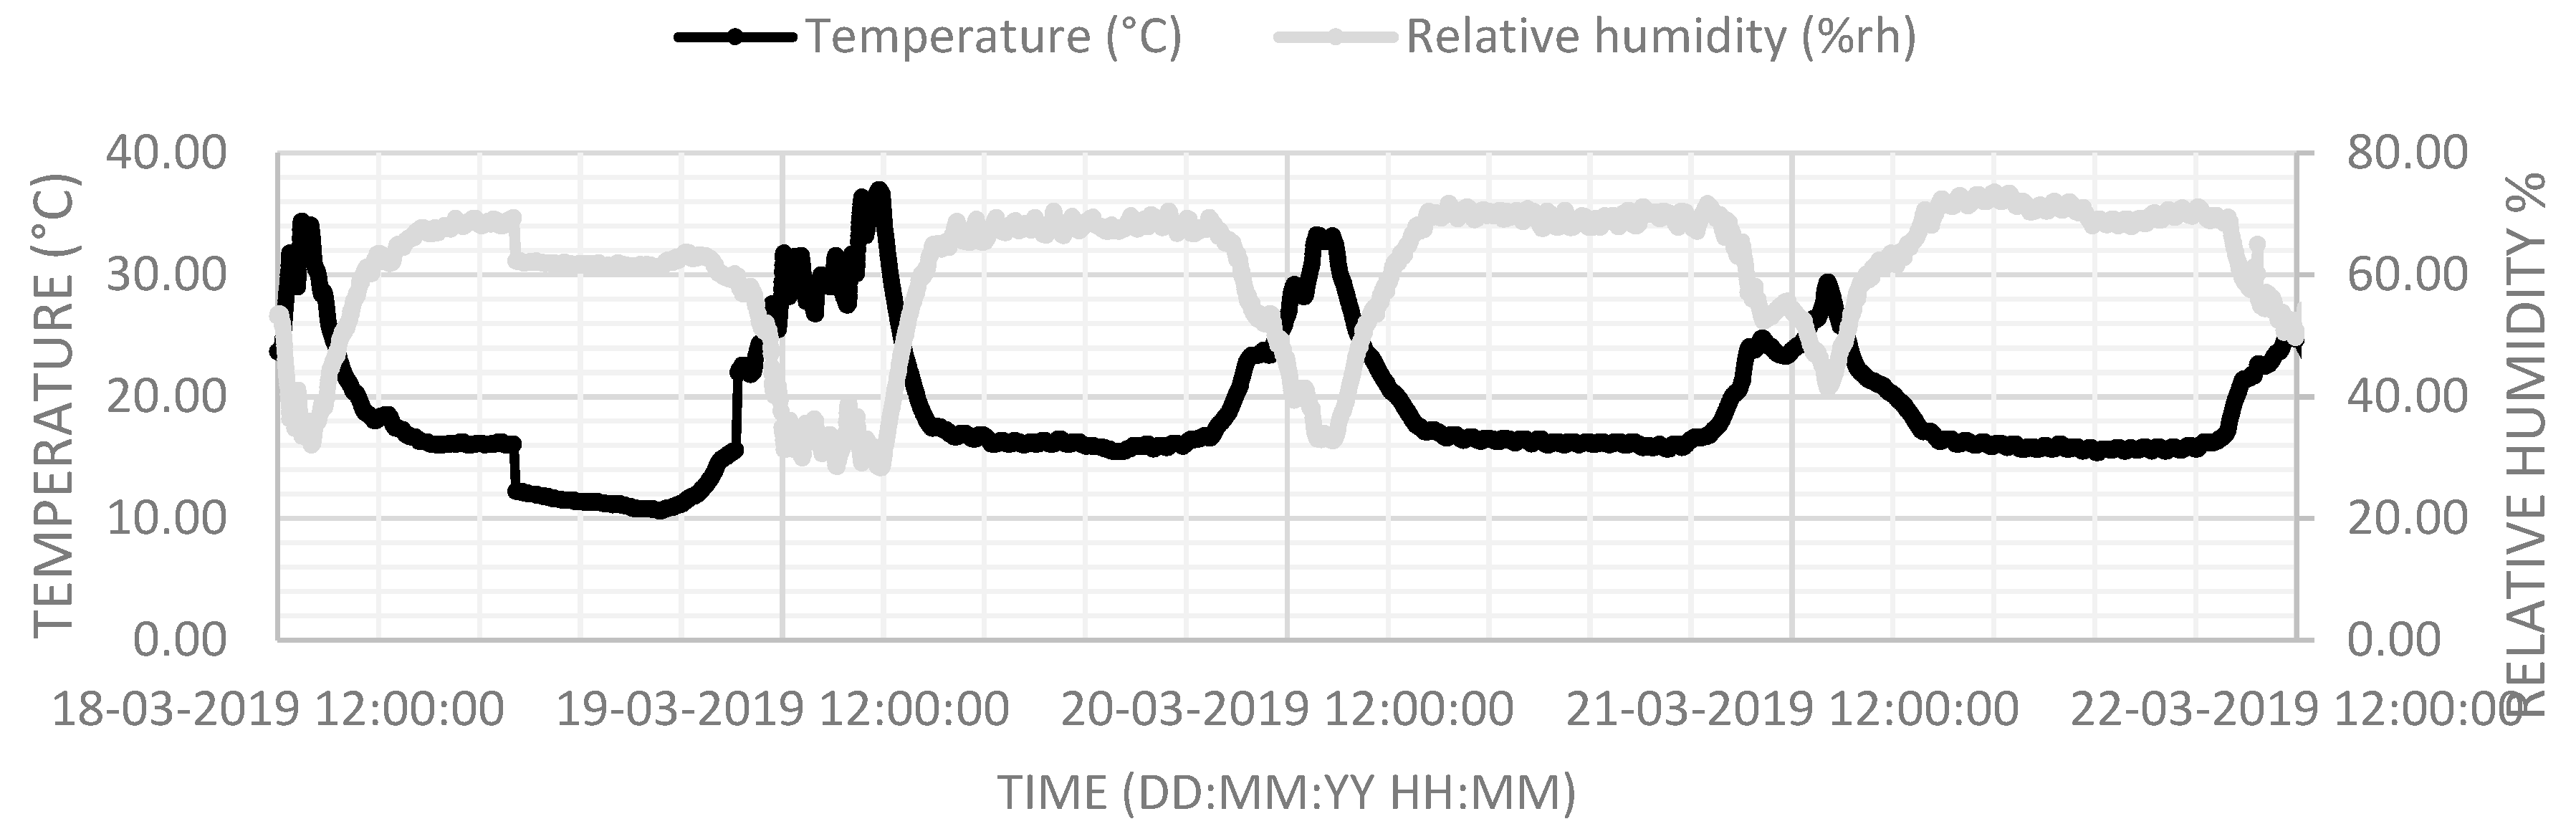
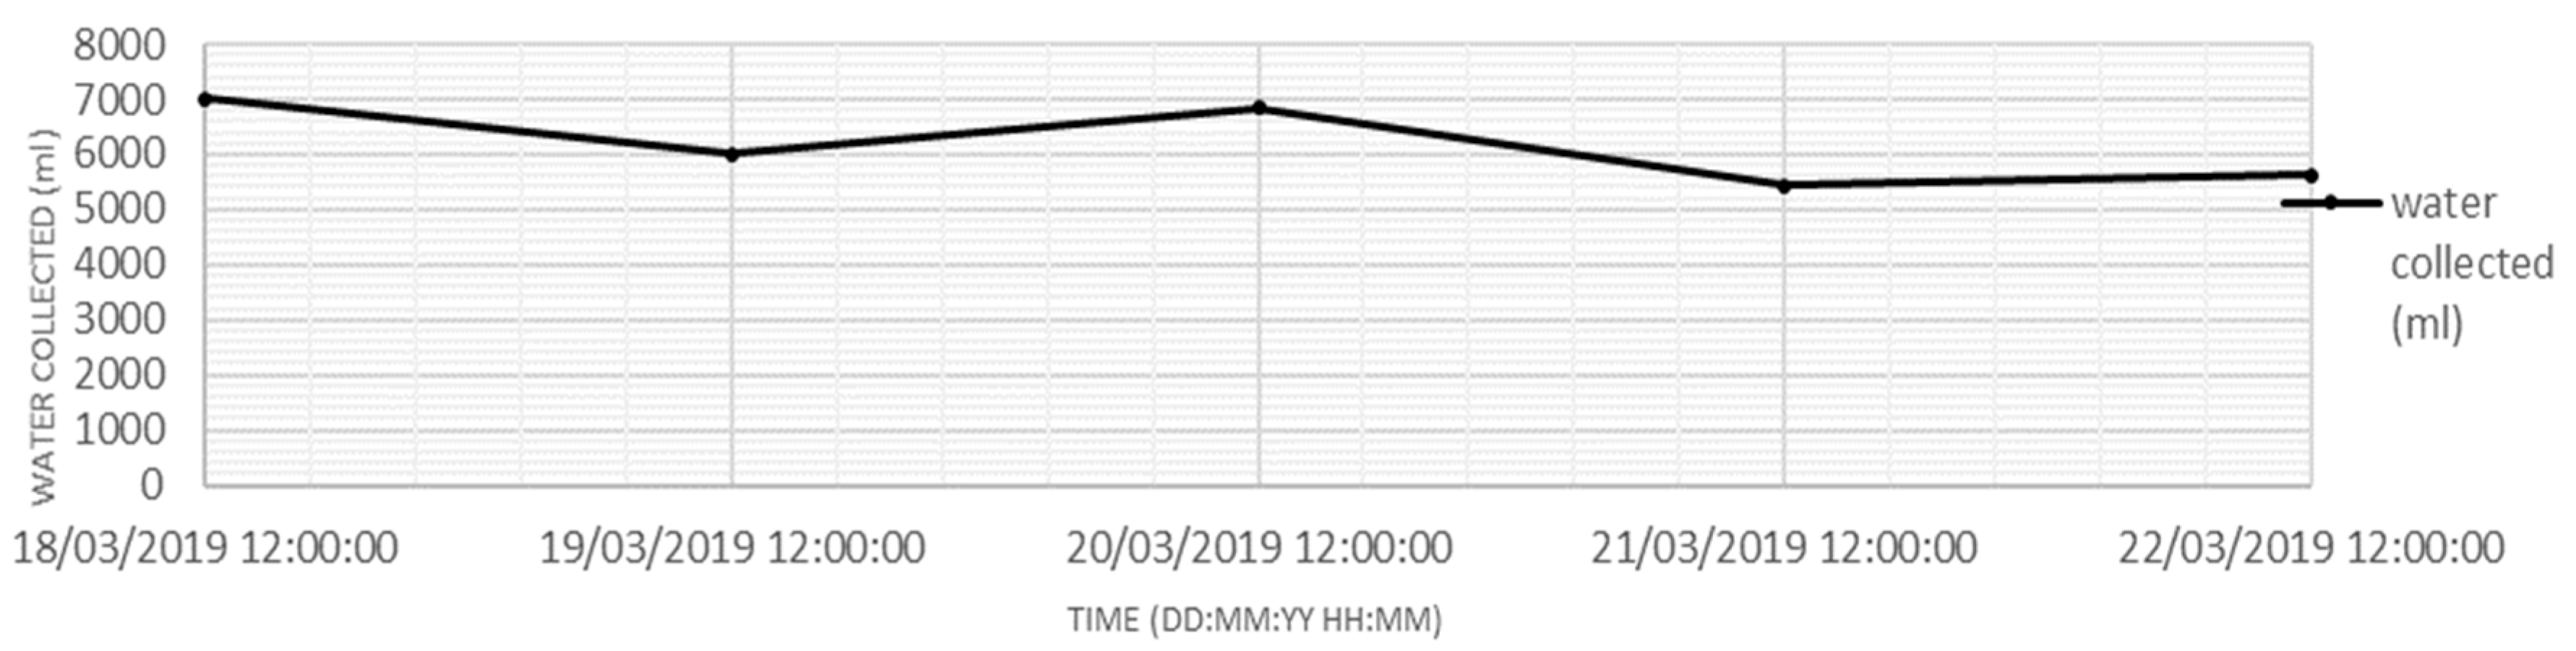
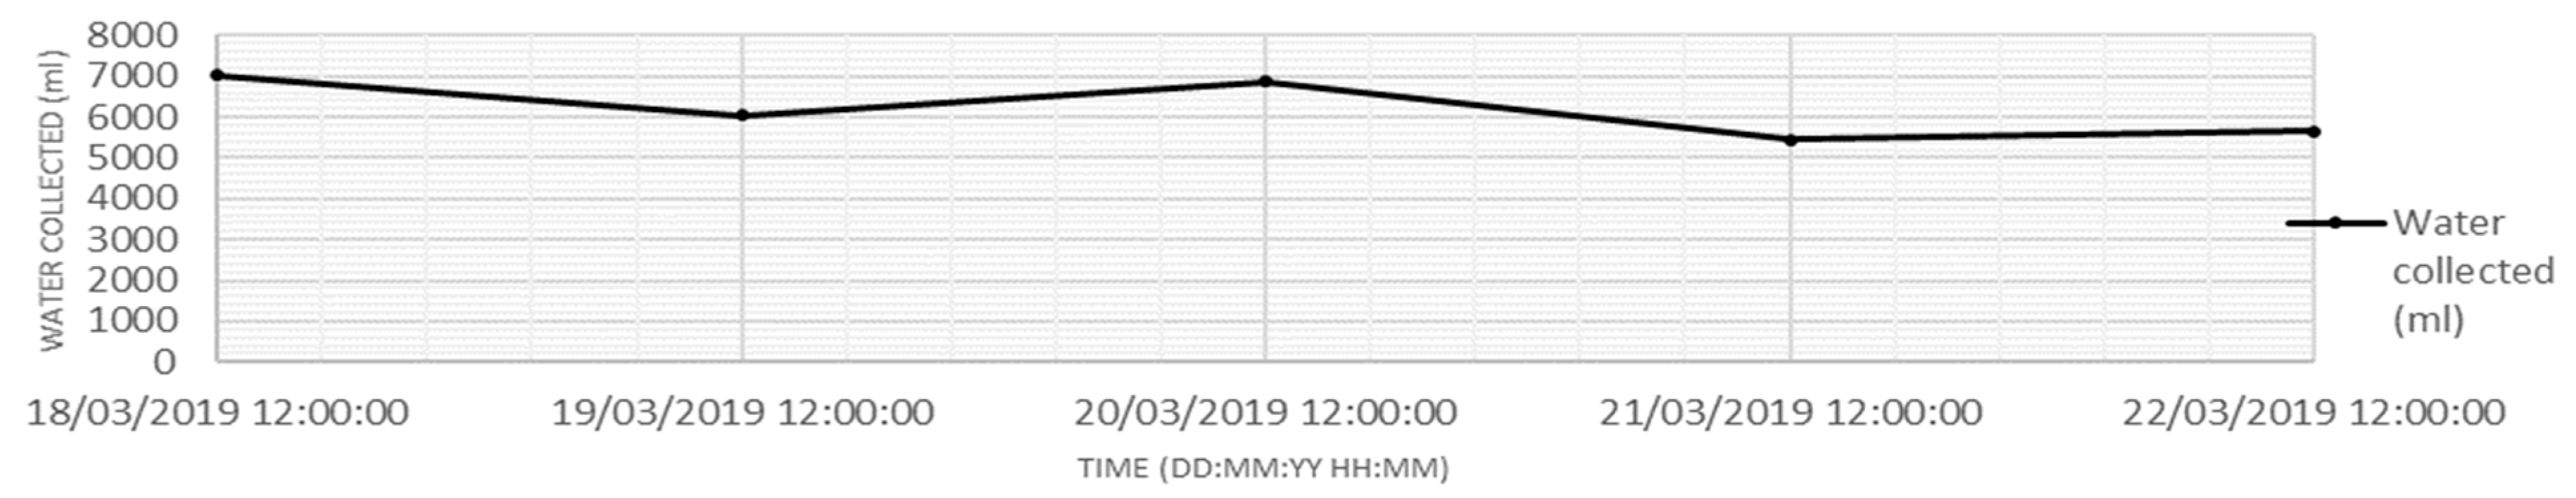
3.1. Greenhouse in UK

Experiments were run for 5 days continuously for 3 consecutive weeks with readings taken every 24 h for the built greenhouse (see Figure 5). The solar still was tilted at an angle of 40° to the horizontal in week 1, 30° in week 2 and 45° in week 3 to compare the output flow of each setting. The results showed the water collection of the solar still, the dehumidifier and the combination of both apparatuses. The dehumidifier, which is running continuously, is expected to harvest the humidity of the greenhouse and convert the vapor into a liquid state. The average solar intensity is an average for a full 24-h day, which is plotted at 12:00 as a base mark, but this does not mean that it was at peak value at this time.
During week 1, when the solar still was angled at 40° to the horizontal, the water production was in the range of 16–54 mL per day (see Figure 6), with the maximum achieved in a day having the highest solar intensity of 850 Wm−2 (see Figure 7).
The dehumidifier was much more efficient than the solar still, with a production of 6100 mL and a minimum collected value of 1000 mL (see Figure 8).
Temperature is seen to increase during the day and drop dramatically at night. This shows the poor ability of the greenhouse to retain heat during the night. The temperature on the 5th March 2019 did not exceed 30 °C and relative humidity was as low as 40% during the peak temperature, which peaked on the 6th and 7th of the same month at 45 °C and 43 °C respectively (see Figure 9).
High temperatures caused the relative humidity to reach a minimum point. Accordingly, it dropped from 70% at night to 25% during the day on the 6th March 2019 and 60% to 23% on the 7th March 2019 in correlation with variations in temperature. Throughout the week, the maximum amount of water collected using the SS and HDH systems was 6250 mL on the 5th March 2019 and the minimum amount was 1020 mL on the 7th March 2019 (see Figure 10).
These results indicate that although the solar intensity was high and the temperature inside the greenhouse spiked, this meant that the warm air inside the greenhouse was very similar to the air inside the solar still, hence producing a very small temperature difference between the inside surface of the polycarbonate sheet and the outside surface. This low-temperature difference will have an effect on the condensation rate and, consequently, the collection rate. The difference in temperature between the two sides of the medium needs to be high enough for latent heat to produce condensation [60]. This means that the internal thermal energy of the still needs to be high, and the ambient temperature of the greenhouse should be low for the highest yield.
In week 2, the solar still was angled at 30° to the horizontal, and the solar still produced a minimum of 29 mL on the 15th March 2019 and a high of 58 mL on the 13th of the same month (see Figure 11).
The dehumidifier was shown to have a different dynamic compared to the SS producing a peak value of 7000 mL of water on the 14th March 2019 and the minimum value on the 12th March 2019 with 3800 mL (see Figure 12).
The temperature seems to be lower than the preceding week with a high on the 13th March 2019 of 40 °C, and only 25 °C on the 15th March 2019 (see Figure 13). These can be compared with 32 °C on the 12th March 2019 and the 38 °C peak of the 14th in the same month. Relative humidity in week 2 was very inconsistent, showing lows of 20% on the 11th March 2019 and remarkably high 90% humidity in the morning of the 15th March 2019. On the 12th March 2019, 20% humidity was recorded as the low compared to 30% and 35% relative humidity on the 13th and 14th March 2019, respectively.
The average solar intensity was shown to have a peak on the 13th March 2019 at 780 Wm−2, then declining to 190 Wm−2 on the 15th March 2019; this being the day with the least amount of sunlight (see Figure 14).
The overall system collected a maximum of 7050 mL of freshwater on the 14th March 2019 and the minimum total water output was 3410 mL on the 12th March 2019 (see Figure 15).
These results show that the maximum amount of water harvested by the SS was when the maximum average solar radiation occurred on the 13th March 2019. However, the maximum water collected by the dehumidifier was collected on an average cloudy day with a solar intensity of only 490 Wm−2. It is important to note that most of the production occurred during the night time where humidity levels were at 70%. This can be compared to the previous day (12th March 2019), when solar intensity was high during the day, causing low day-time humidity. Nevertheless, night-time humidity was shown to be 15% lower than the 13th March 2019 and this could be the cause of such a different value. The jump in humidity from 65% to 90% on the 15th March 2019 was due to precipitation occurring outside the greenhouse. The precipitation causes the entrapment of humidity within the greenhouse. It can, therefore, be deduced that even during rainy days with extremely low sunlight when the solar still does not produce much water, the system is still able to produce a sustainable amount of useable water with the aid of a dehumidifier, as it is more functional during humid days.
In the third week, the SS was angled at 45° to horizontal. The system desalinated a maximum of 40 mL on the 19th March 2019 due to the highest average solar intensity of 850 Wm−2 and the lowest production (10 mL) was on the 18th March 2019 with 480 Wm−2 solar intensity (see Figure 16).
This shows a notable correlation between water production and peak temperature, as the 18th March 2019 shows the lowest production, however, the SS absorbed the least solar radiation on the 22nd in the same month (see Figure 17).
Considering the highest temperatures for both of these days (34 °C and 25 °C, respectively), it is evident that the low-temperature difference within the greenhouse and solar still disrupts the condensation process, where the air within the distiller is as warm as the outside air (see Figure 18).
The dehumidifier was relatively stable in this week, presenting maximum fluctuations between 7013 mL and 5800 mL on the 18th and the 22nd March 2019 respectively. Relative humidity within the greenhouse was seen to be stable apart from a slight decline on the 18th at around 23:00 (see Figure 19).
The total system collected between 5450 mL and 7020 mL in one day that week with the condenser and SS (see Figure 20). Ideally, the average relative humidity should be between 60% and 90% [1]. Although the addition of plants would require more water, the transpiration rate will be increased, thereby increasing the internal relative humidity of the GH.
Although there is no control on the climate conditions, the results show that by increasing the solar intensity, the performance of the solar stills improves. On the other hand, dehumidifiers worked well in a cloudy and rainy day or when the humidity inside the greenhouse increased, for example during the night time. This demonstrates that the solar radiation does not have a direct impact on the dehumidifier’s water production. However, it can indirectly influence it since the vents need to open when the temperature rises and this causes some portions of transpirated air to leave the GH before being condensed. Besides desalinating the seawater using the solar still and dehumidifying the excess transpirated water, the rainwater was also harvested in this study. The amount of harvested rainwater showed a maximum value of 20 L per day, for only one roof side of the built greenhouse. This was added to the system as another source of water.

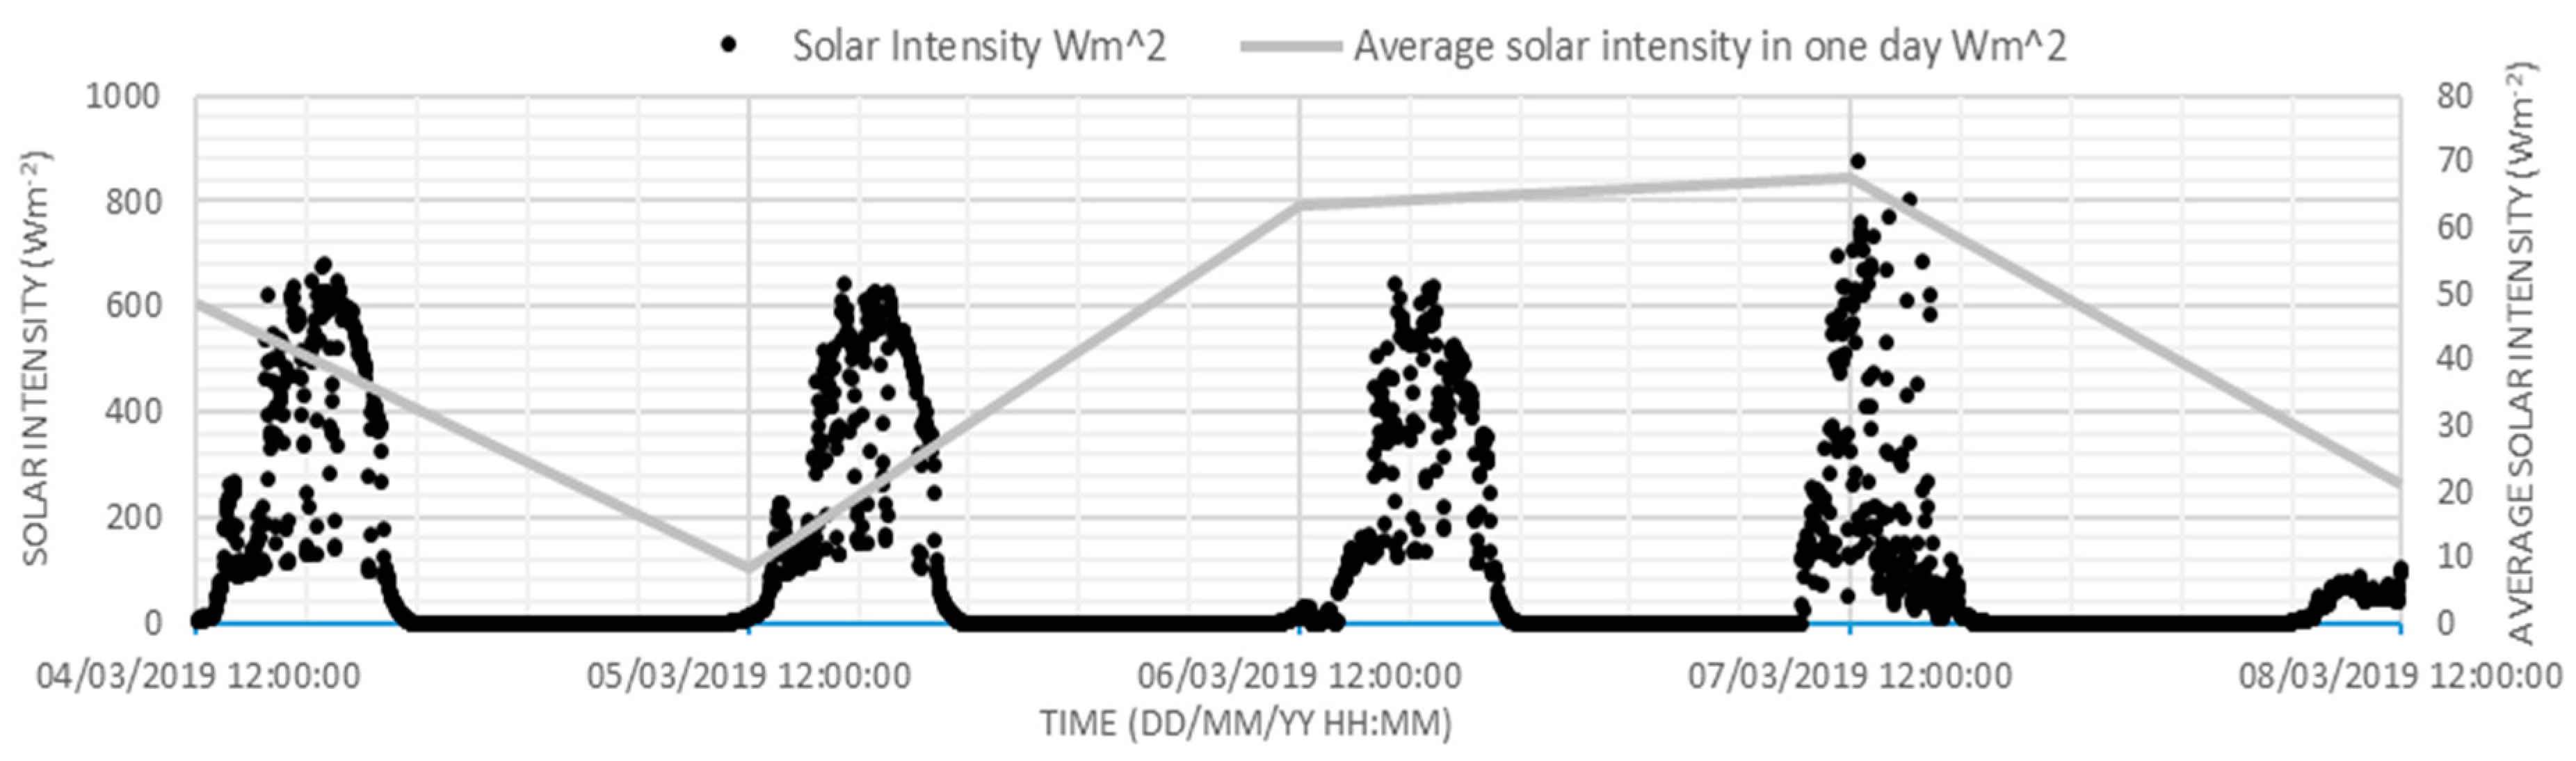
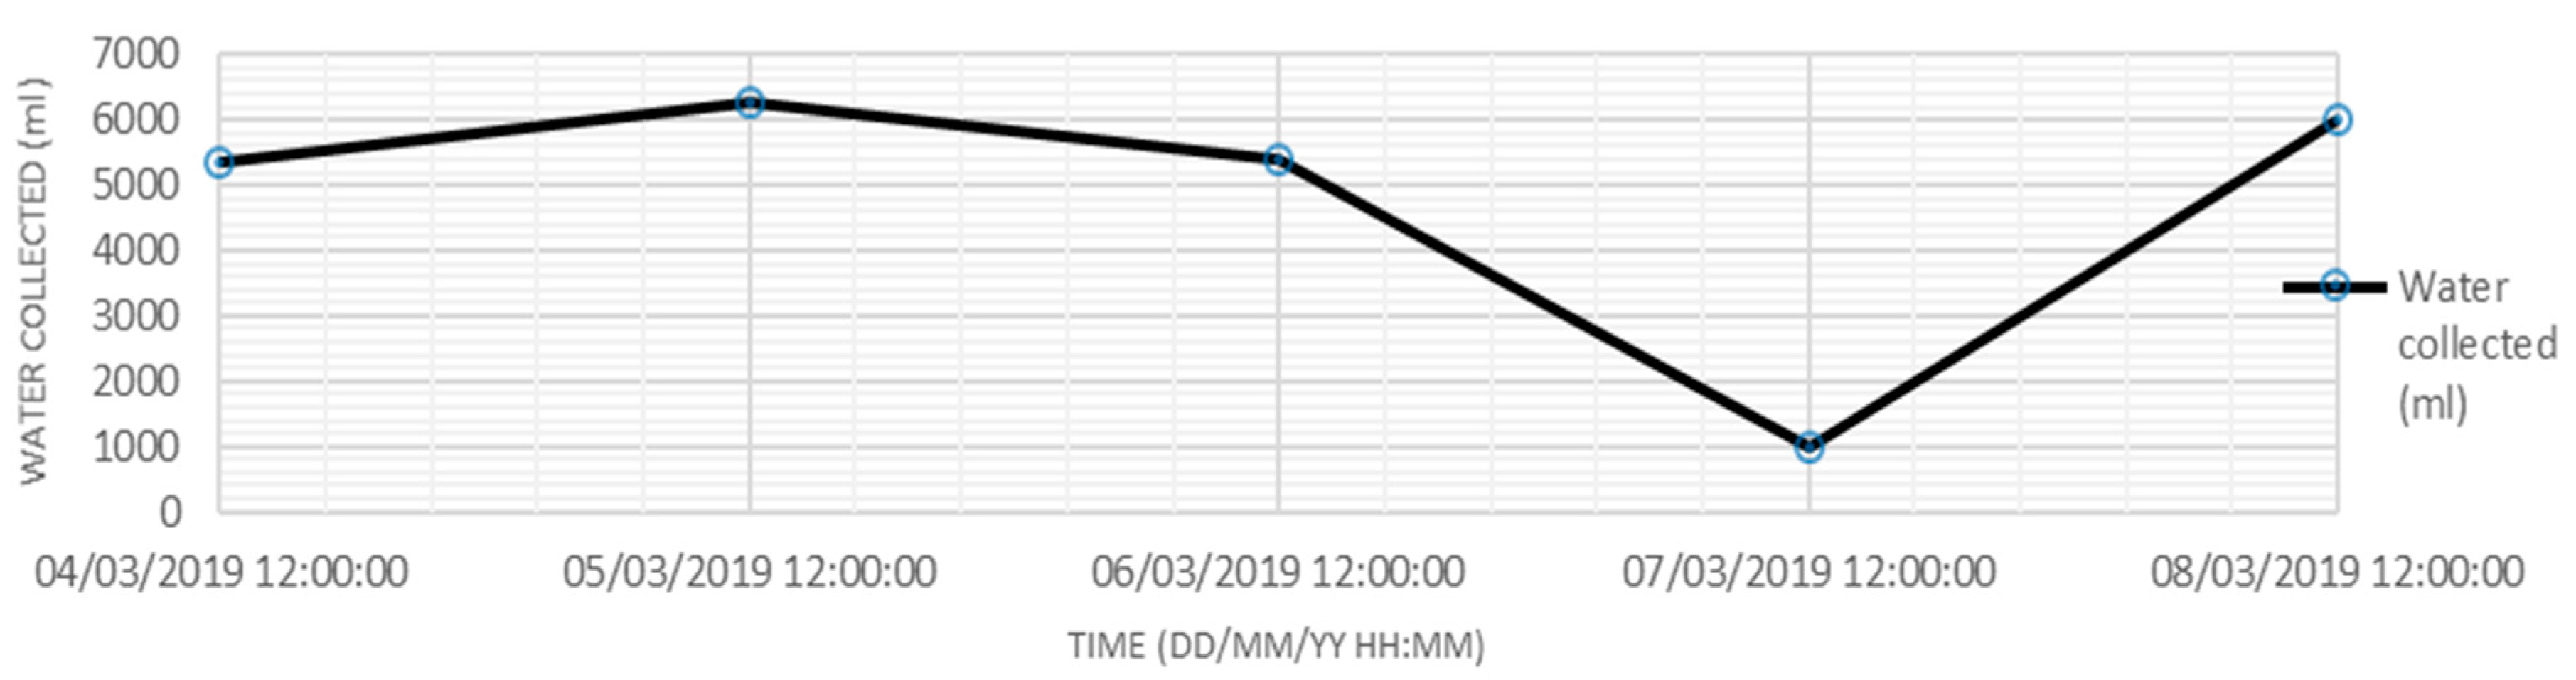
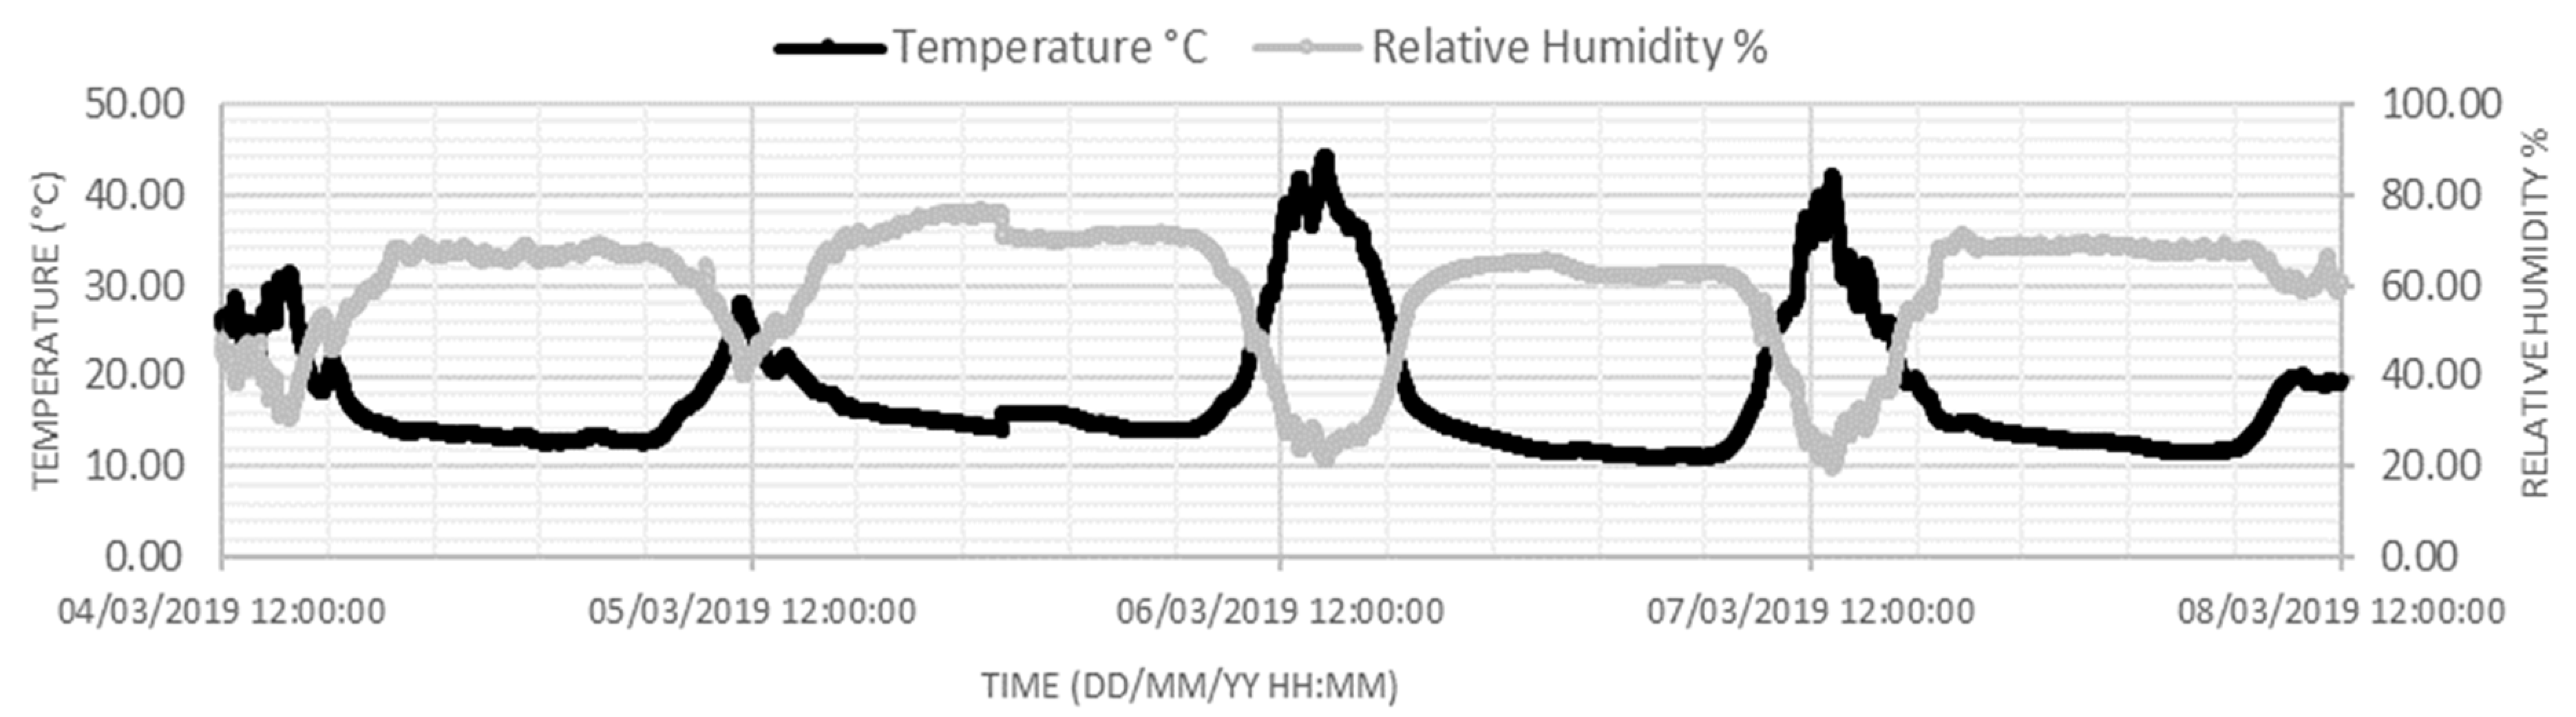
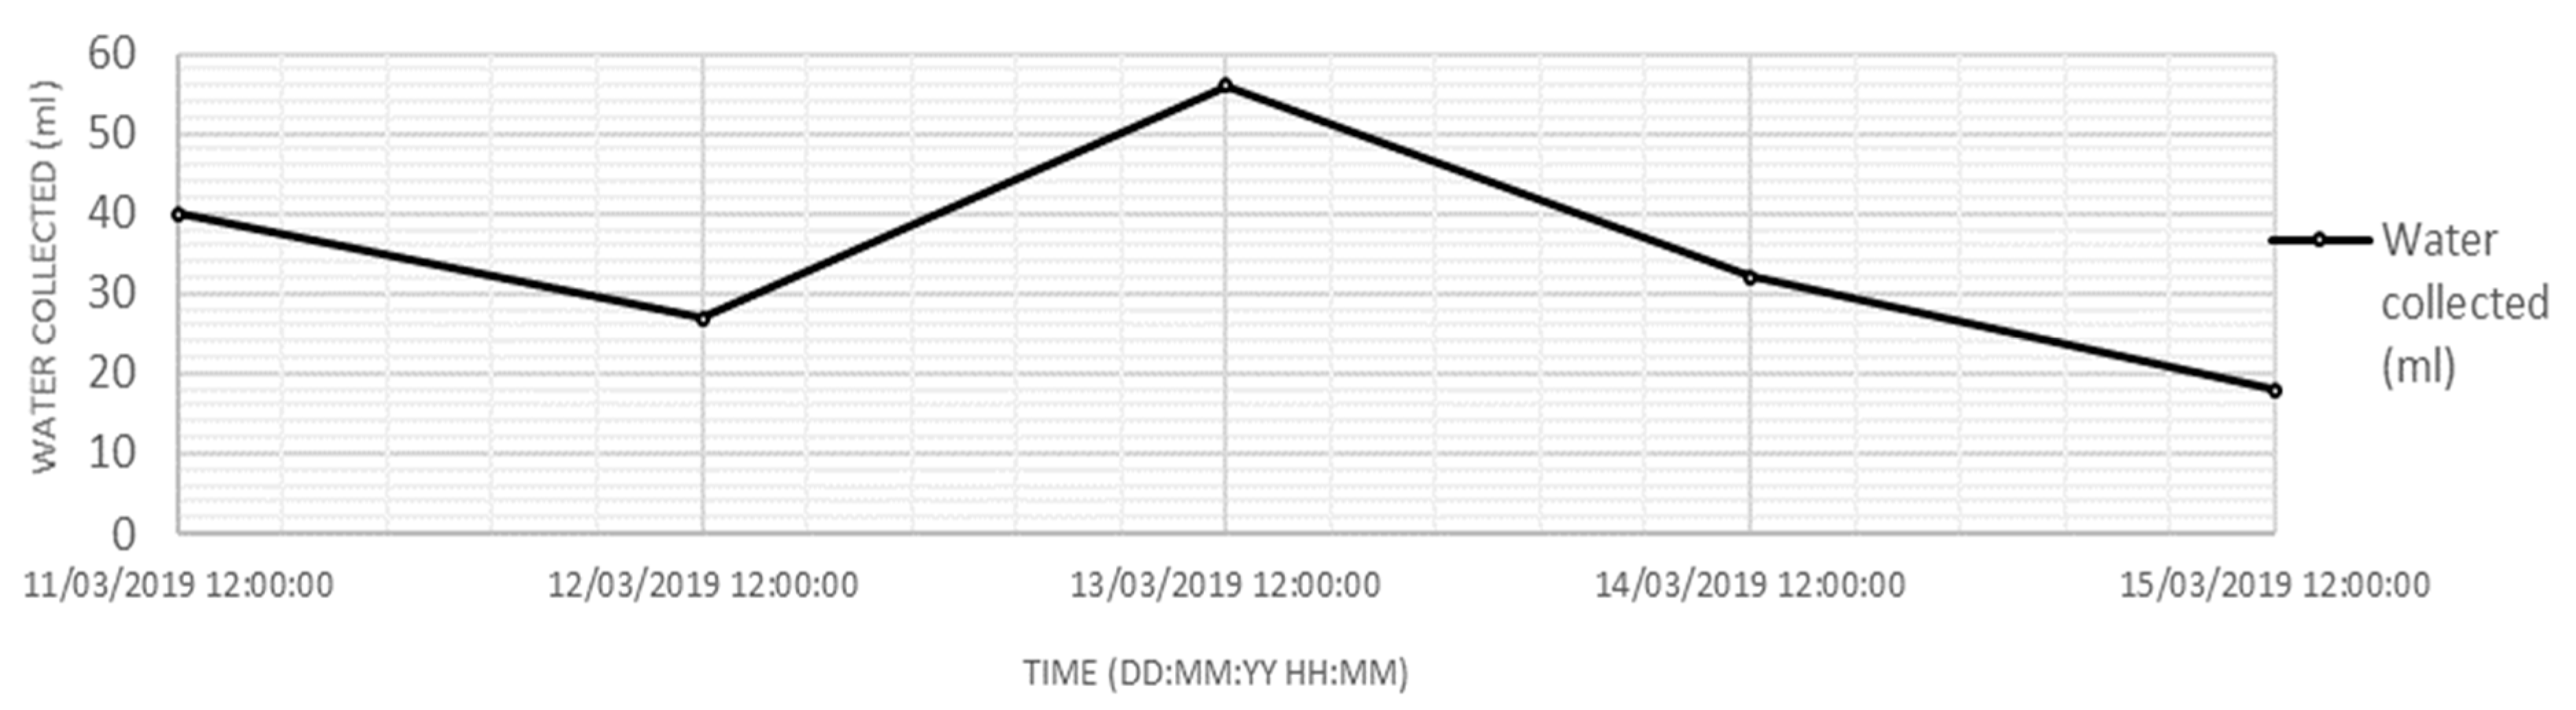
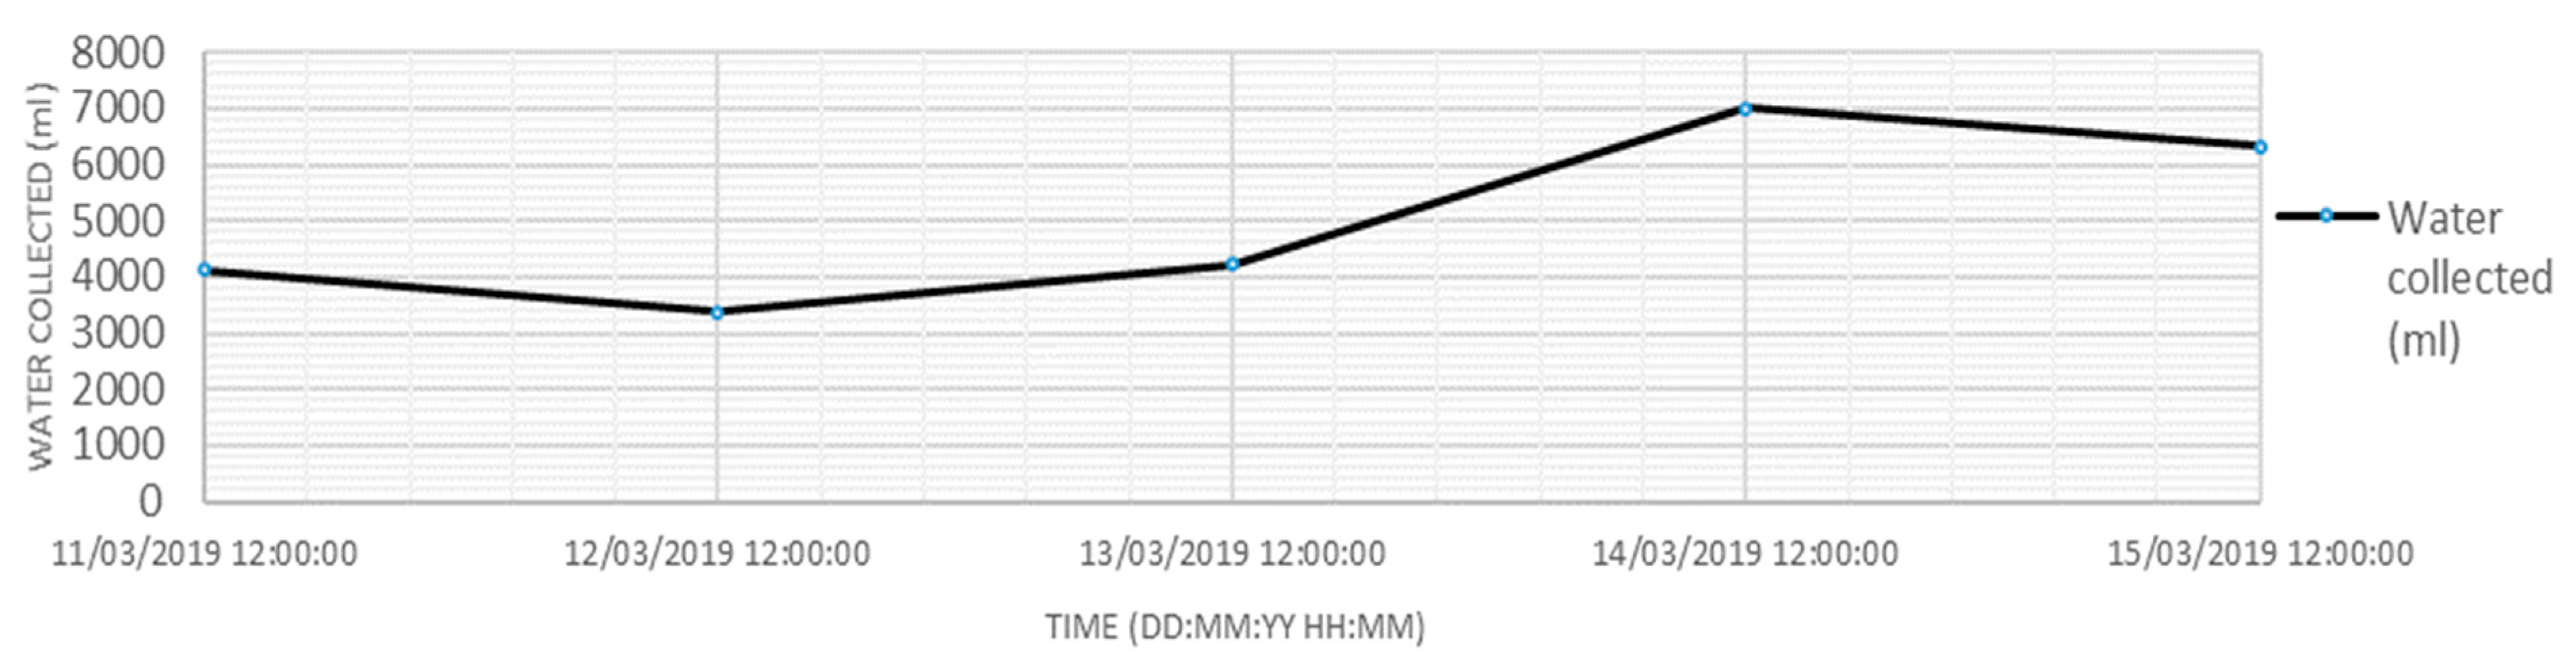
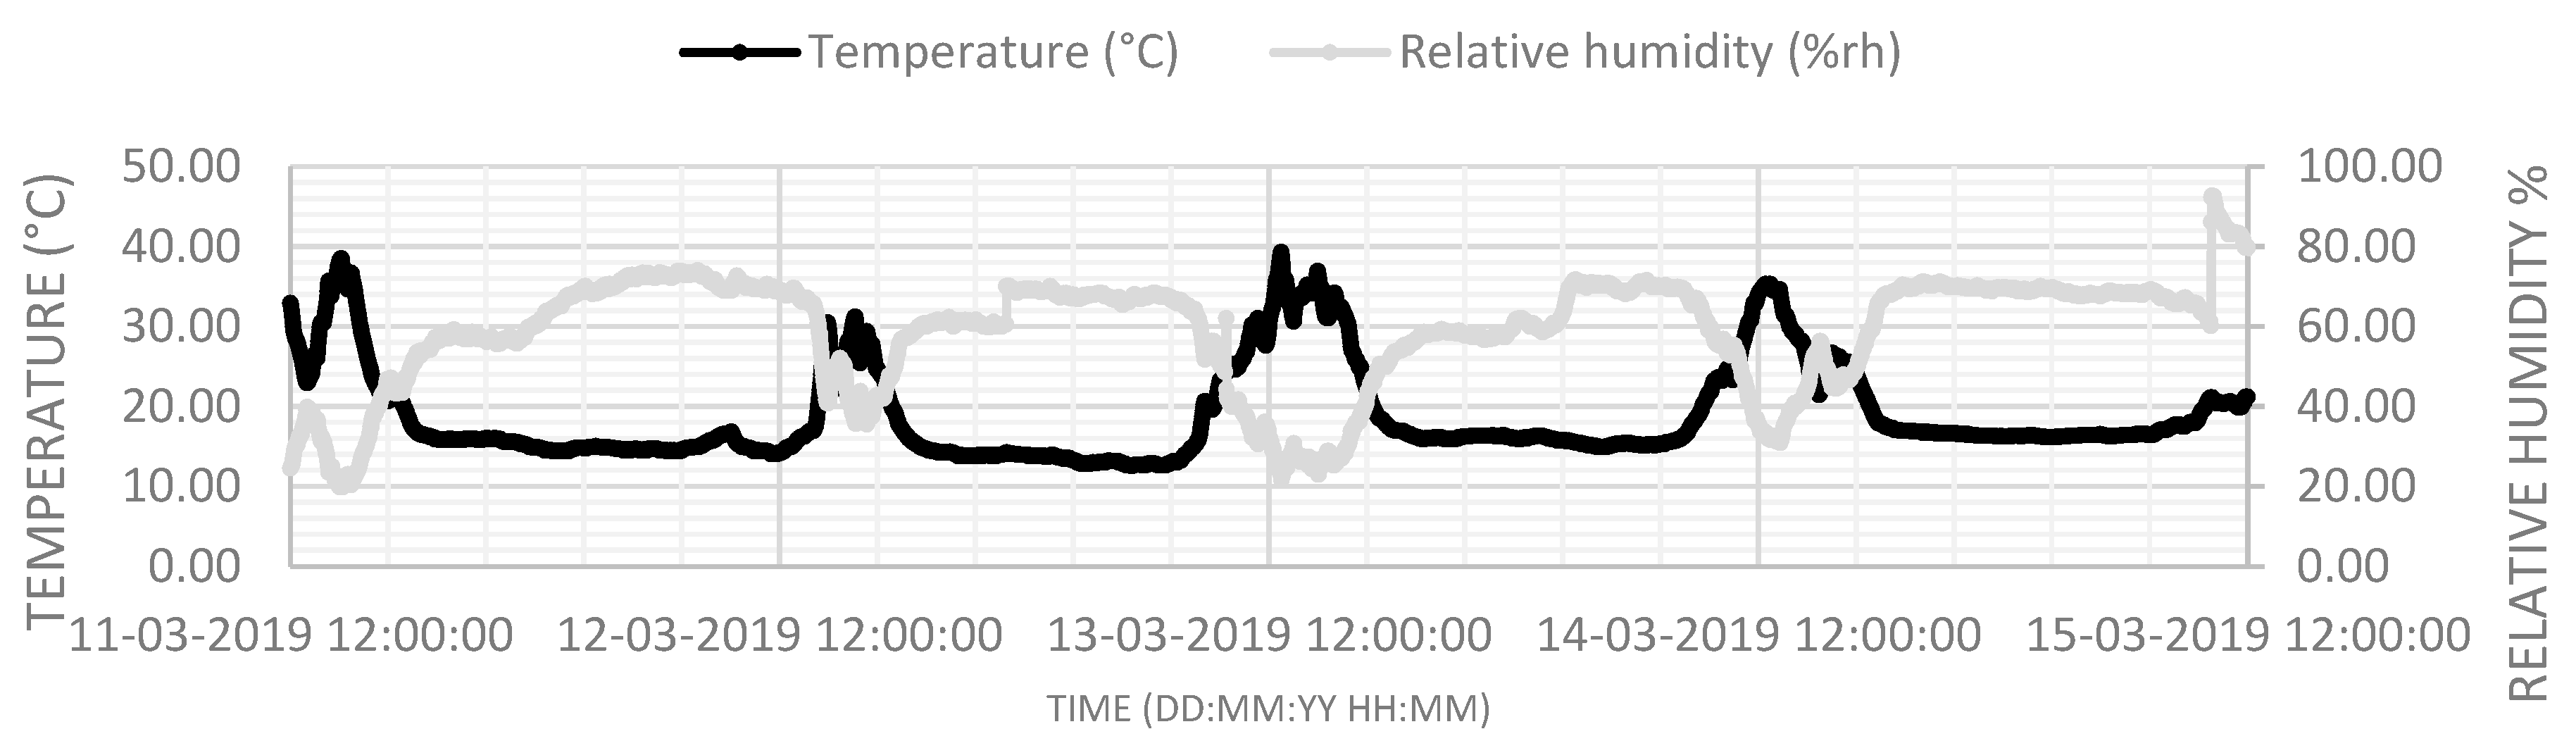
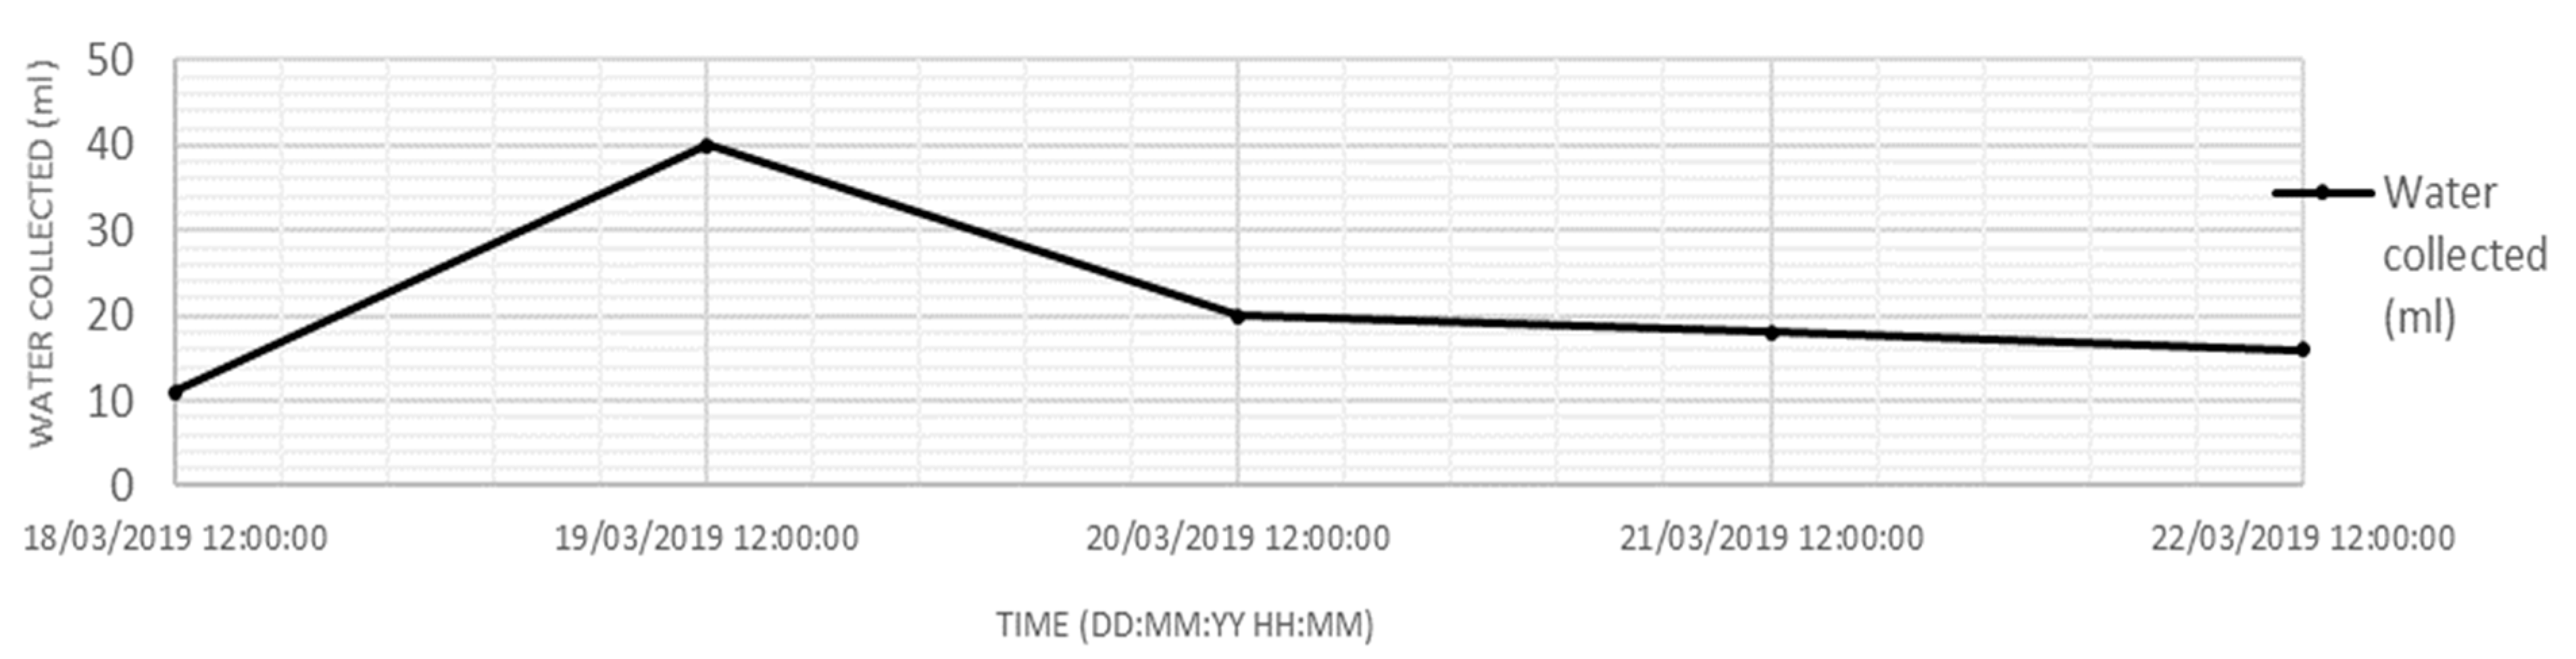
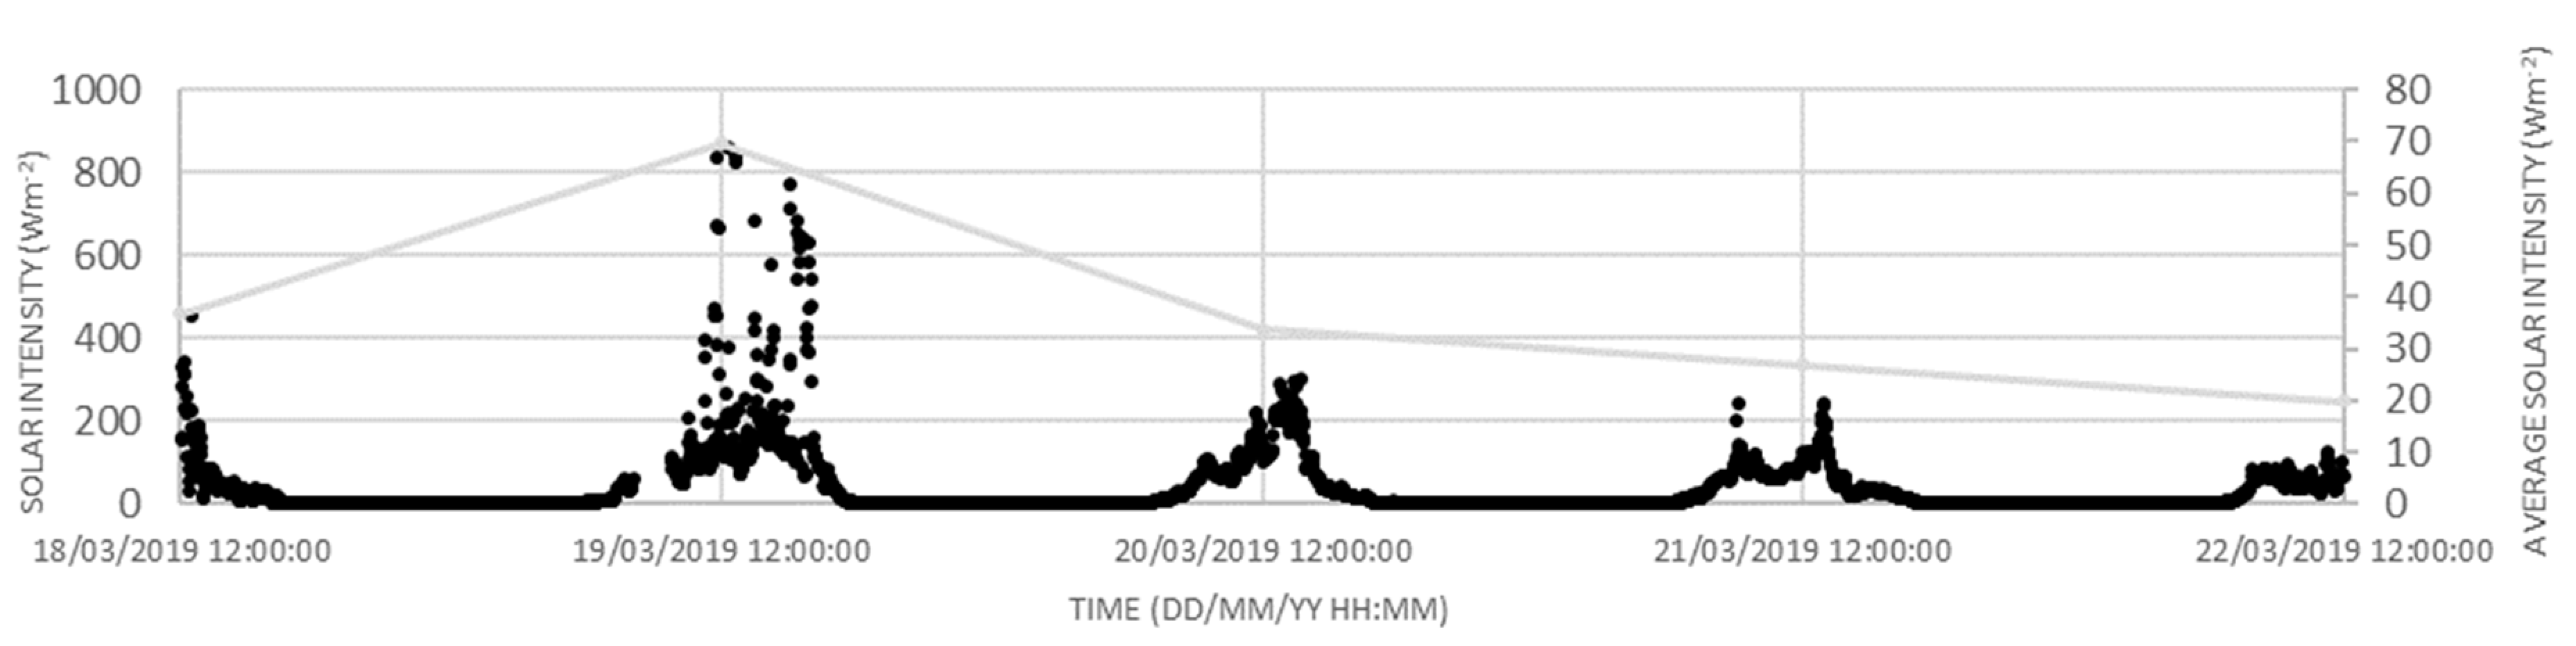
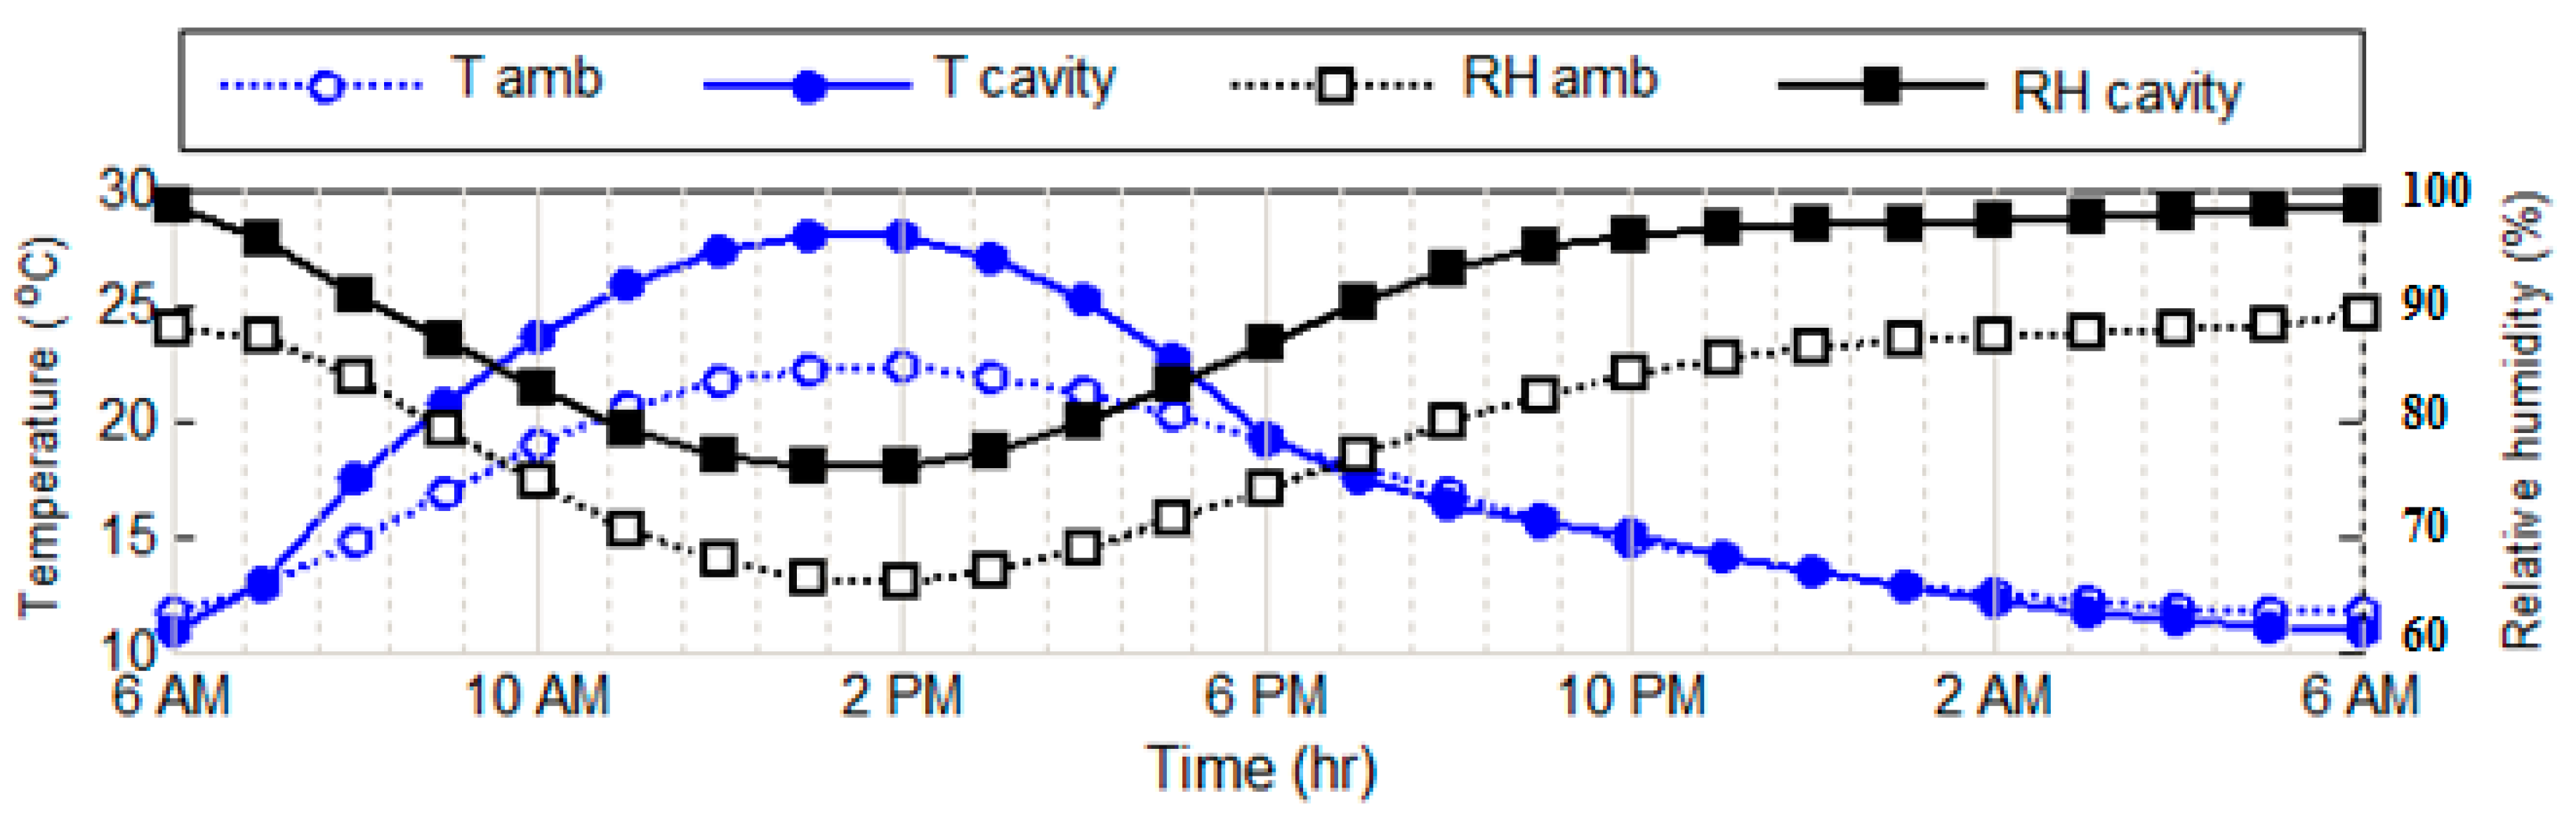
3.2. Greenhouse in Egypt

Another GH was designed based on a similar concept for water desalination in Egypt (See Figure 21). In this GH utilizes the extra solar radiation, beyond the plants’ photosynthetic needs, to desalinate saline water using transparent solar still units placed on the GH roof [61]. Another source for water production is the plant transpiration which is partially recovered using a condenser which acts as a dehumidifier at the GH exit.
A mathematical model was developed by Salah et al. [61] based on mass and heat transfer equations to predict the GH performance based on Clear Sky Day Model [62,63] for solar radiation. The active area of this GH is (8 m × 20 m), and it is east-west oriented. Nine rows of 20 east-west oriented solar still units with a slope of 30° are placed on this GH; three rows in the vertical risers with a vertical spacing of 750 mm, and six rows in the inclined riser with a horizontal spacing of 500 mm. The dimensions of each solar still unit are (0.75 m × 1 m).
The condenser shown in Figure 21 is bypassed by 75% of the cavity air (i.e., only 25% of GH cavity air passes through the condenser), and 90% of GH cavity air is recirculated via the down-cumer which is mixed with 10% fresh air before entering the GH cavity again.
The study was conducted in a typical day of spring (21st March), in Borg El-Arab, Egypt. The used meteorological data for that day are calculated based on the average values over ten years (2004–2014) [64]. The mathematical model and the input parameters used in the model are explained in Salah et al. [61].
The GH cavity temperature varies from 10 °C at night to about 28 °C at the peak (1:00 pm) (See Figure 22), and the relative humidity ranges from 65% to 97% which both make the GH suitable for a wide range of plants. However, the relative humidity at night is relatively high, so more ventilation is required to reduce it. It is noticeable that the temperature inside the GH in Egypt is slightly less than the GH in the UK due to the use of a condenser in the Egyptian GH.
In Egypt, the sun shines 12 h per day in the spring season with a peak intensity of about 1000 W/m2 (See Figure 23). This intensity is about five times the solar radiation intensity in the UK and also the sunshine hours are more than the UK. So, it is expected to produce more desalinated water via solar stills in Egypt.
While each solar still unit placed in the vertical riser, with dimensions of (0.750 m × 1 m), produced 667 mL water per day, each solar still unit placed in the inclined riser produced 1090 mL/day. This production is very large compared to the solar stills in the UK as expected due to the difference in solar radiation time and intensity in addition to the temperature variance. The production of solar stills in the vertical riser is about half that of the solar still in the inclined riser because itis directly exposed to cooled air exiting from the condenser. In order to determine the share of each source in water production for the GH system, the total production of each source is divided by GH active area. All solar still units produce about one-third of the total water production in the GH, and the other two third is produced via the condenser. The total water production is about 3000 mL/m2 (See Figure 24) of GH area which meets the plant requirements in earlier stages when plant needs from 2 to 8 L/m2·day. However, the produced water is of zero salinity, so it can be mixed partially blended with saline water to increase the quantity in order to meet plant needs in the later stages.

4. Discussion

The agriculture-GH system was tested in the UK and Egypt, which has a considerably less solar intensity, with an average of 200 Wm−2 compared to the countries located closer to the equator, for example, the Middle East and North African (MENA) countries with an average of 700 Wm−2 of irradiance [65] which the seawater desalination works better [66,67]. In this study, the maximum solar radiation reached 900 Wm−2 in the UK, which only lasted a few minutes. It can be concluded that although limitations were found within the SS panel, the UK’s climate does not permit a high yield and the low output is not surprising. The small temperature difference between the inside and outside of the cover also causes a slow condensation rate. In the countries with higher solar intensity, this can be compensated for by allowing cool air from wind to reduce the temperature of the outside cover. The advantage of using solar still for desalination is that it uses renewable energy, unlike RO that consumes a large amount of energy to overcome the high-pressure difference on the membrane. In addition, solar still is used to reduce the cooling load of the GH, especially for the Egyptian GH where it uses the extra solar radiation (beyond the plant needs). However, solar still needs a relatively large area to produce the same amount of water produced by the RO unit in a small area. Manufacturing solar stills is cheaper than other desalination systems such as RO. But the amount of water each solar still can produce is less than the RO. Therefore, choosing a solution for the greenhouses is mainly dependent on its size. For small-medium sized greenhouses, solar desalination is cost-effective, while for larger horticultural systems, RO would be more beneficial. In addition, the operational and maintenance costs of the solar still systems are extremely less than other similar methods. Insulation is the most important factor for the solar stills, since its desalination is based on an adiabatic thermodynamic process, and any incomplete insulation would decrease its functionality.
For the HDH, solar radiation does not affect the freshwater output directly, but instead causes humidity to rise or fall. The humidifier does not require high solar radiation as low average radiation usually means a rainy and wetter day, therefore increasing the condenser’s output due to the higher relative humidity within the GH. Humidification-dehumidification is not only used for water production, especially in the GH in Egypt, but also to obtain suitable climate conditions for plant growth. The total amount of water collected via SS and HDH can potentially support 2 m2 of tomato crops [68]. In the UK, subsequent collection by the HDH would enable more crops due to high humidity levels, achieving a higher water production so more crops can be used for agriculture. The absorbing fabric showed some discoloration and slight deterioration. As mentioned in the literature review, the evaporation rate varies depending on the quantity of water held by the material [42]. In terms of the size of a solar still, the one used in this study was 0.72 m2 and it desalinated a maximum amount of 58 mL of water. Considering these solar stills are planned to be located on the built greenhouse of an area of 29.5185 m2 [3], it can potentially generate a maximum of 2.5 L of water per day in the UK (for 40 solar stills of the same size) and this amount can increase in the countries located closer to the equator that have much greater quantities of solar energy (nearly up to 8–10 times).

5. Conclusions

This study shows the feasibility of using SS, HDH and rainwater harvesting within horticultural systems. Solar stills could potentially be used for desalinating the seawater for sustainable greenhouses, while the HDH can also help to recirculate partially recover the excess humidity inside the greenhouse cavity, particularly in the warm arid countries. Implementing a series of solar stills on a greenhouse could provide sufficient resources for watering the plants using smart irrigation systems. While harvesting the rain is a resilient solution for countries such as the UK, desalination and dehumidification are also other potential resources during the warm seasons, generating a zero-liquid-discharge system. Solar distillers are feasible in Egypt where it endowed with high solar radiation over the whole year. GH integrated with cooling system is suitable for Egyptian climate conditions. In our future studies, the effects of some parameters such as air flow rates, condenser bypass ratio, fresh air ratio, and condenser temperature on the performance of the GH will be evaluated. This will help to optimize the GH structure and functionality towards a more sustainable solution.

Author Contributions

Conceptualization, M.A., A.H.S., M.P., H.E.S.F., A.A.J., and A.N.; methodology, M.A., M.P. and M.D.; investigation, A.A.J., R.F., and A.N.; writing—original draft preparation, M.A., M.P., M.D., A.H.S., A.A.J.; writing—review and editing, M.A., A.A.J., A.N., M.D., A.H.S., R.F., H.E.S.F. All authors have read and agreed to the published version of the manuscript.

Funding

This work was supported by the British Council (BC) of UK (No. 332435306) and Science and Technology Development Fund (STDF) of Egypt (No. 30771), through the project titled “A Novel Standalone Solar-Driven Agriculture Greenhouse-Desalination System: That Grows its Energy and Irrigation Water” via the Newton-Musharafa funding scheme.

Acknowledgments

The authors would like to appreciate the anonymous reviewers for their insightful comments and suggestions.

Conflicts of Interest

The authors declare no conflicts of interest.

References

  1. Hassan, G.E.; Salah, A.H.; Fath, H.; Elhelw, M.; Hassan, A.M.; Saqr, K.M. Optimum operational performance of a new stand-alone agricultural greenhouse with integrated-TPV solar panels. Sol. Energy 2016, 136, 303–316. [Google Scholar] [CrossRef]
  2. Akrami, M.; Salah, A.H.; Javadi, A.; Fath, H.; Hassanein, M.; Farmani, R.; Dibaj, M.; Negm, N.A. Towards a Sustainable Greenhouse: Review of Trends and Emerging Practices in Analysing Greenhouse Ventilation Requirements to Sustain Maximum Agricultural Yield. Sustainability 2020, 12, 2794. [Google Scholar] [CrossRef] [Green Version]
  3. Akrami, M.; Javadi, A.; Hassanein, M.; Farmani, R.; Dibaj, M.; Tabor, G.R.; Negm, N.A. Study of the Effects of Vent Configuration on Mono-Span Greenhouse Ventilation Using Computational Fluid Dynamics. Sustainability 2020, 12, 986. [Google Scholar] [CrossRef] [Green Version]
  4. Sablani, S.; Goosen, M.; Paton, C.; Shayya, W.; Al-Hinai, H. Simulation of fresh water production using a humidification-dehumidification seawater greenhouse. Desalination 2003, 159, 283–288. [Google Scholar] [CrossRef]
  5. Goosen, M.; Sablani, S.; Paton, C.; Perret, J.; Al-Nuaimi, A.; Haffar, I.; Al-Hinai, H.; Shayya, W. Solar energy desalination for arid coastal regions: Development of a humidification–dehumidification seawater greenhouse. Sol. Energy 2003, 75, 413–419. [Google Scholar] [CrossRef]
  6. Zarei, T.; Behyad, R.; Abedini, E. Study on parameters effective on the performance of a humidification-dehumidification seawater greenhouse using support vector regression. Desalination 2018, 435, 235–245. [Google Scholar] [CrossRef]
  7. Yunis, H.; Elad, Y.; Mahrer, Y. Effects of air temperature, relative humidity and canopy wetness on gray mold of cucumbers in unheated greenhouses. Phytoparasitica 1990, 18, 203–215. [Google Scholar] [CrossRef]
  8. Fernández, M.D.; Bonachela, S.; Orgaz, F.; Thompson, R.B.; Lopez, J.C.; Granados, M.R.; Gallardo, M.; Fereres, E.; Bonachela, S. Measurement and estimation of plastic greenhouse reference evapotranspiration in a Mediterranean climate. Irrig. Sci. 2010, 28, 497–509. [Google Scholar] [CrossRef] [Green Version]
  9. Rizzuti, L.; Ettouney, H.M.; Cipollina, A. Solar Desalination for the 21st Century: A Review of Modern Technologies and Researches on Desalination Coupled to Renewable Energies; Springer Science & Business Media: Berlin, Germany, 2007. [Google Scholar]
  10. Siddiqui, O.; Dincer, I. Examination of a new solar-based integrated system for desalination, electricity generation and hydrogen production. Sol. Energy 2018, 163, 224–234. [Google Scholar] [CrossRef]
  11. Ahmadvand, S.; Abbasi, B.; Azarfar, B.; Elhashimi, M.; Zhang, X.; Abbasi, B. Looking Beyond Energy Efficiency: An Applied Review of Water Desalination Technologies and an Introduction to Capillary-Driven Desalination. Water 2019, 11, 696. [Google Scholar] [CrossRef] [Green Version]
  12. Ranade, V.V.; Bhandari, V.M. Industrial Wastewater Treatment, Recycling, and Reuse; Elsevier BV: Amsterdam, The Netherland, 2014; pp. 1–80. [Google Scholar]
  13. Tong, T.; Elimelech, M. The Global Rise of Zero Liquid Discharge for Wastewater Management: Drivers, Technologies, and Future Directions. Environ. Sci. Technol. 2016, 50, 6846–6855. [Google Scholar] [CrossRef] [PubMed]
  14. Burn, S.; Hoang, M.; Zarzo, D.; Olewniak, F.; Campos, E.; Bolto, B.; Barron, O. Desalination techniques—A review of the opportunities for desalination in agriculture. Desalination 2015, 364, 2–16. [Google Scholar] [CrossRef]
  15. Sauvet-Goichon, B. Ashkelon desalination plant—A successful challenge. Desalination 2007, 203, 75–81. [Google Scholar] [CrossRef]
  16. Hsu, S.; Cheng, K.; Chiou, J. Seawater desalination by direct contact membrane distillation. Desalination 2002, 143, 279–287. [Google Scholar] [CrossRef]
  17. Joyce, A.; Loureiro, D.; Rodrigues, C.; Castro, S. Small reverse osmosis units using PV systems for water purification in rural places. Desalination 2001, 137, 39–44. [Google Scholar] [CrossRef]
  18. Manikandan, V.; Shanmugasundaram, K.; Shanmugan, S.; Janarthanan, B.; Chandrasekaran, J. Wick type solar stills: A review. Renew. Sustain. Energy Rev. 2013, 20, 322–335. [Google Scholar] [CrossRef]
  19. Edalatpour, M.; Aryana, K.; Kianifar, A.; Tiwari, G.; Mahian, O.; Wongwises, S. Solar stills: A review of the latest developments in numerical simulations. Sol. Energy 2016, 135, 897–922. [Google Scholar] [CrossRef]
  20. Cooper, P. The maximum efficiency of single-effect solar stills. Sol. Energy 1973, 15, 205–217. [Google Scholar] [CrossRef]
  21. Montoya-Marquez, O.; Flores-Prieto, J.J. The Effect of the Angle of Inclination on the Efficiency in a Medium-Temperature Flat Plate Solar Collector. Energies 2017, 10, 71. [Google Scholar] [CrossRef] [Green Version]
  22. Poblete, R.; Salihoğlu, G.; Salihoğlu, N.K. Investigation of the factors influencing the efficiency of a solar still combined with a solar collector. Desalin. Water Treat. 2016, 57, 1–10. [Google Scholar] [CrossRef] [Green Version]
  23. Sathyamurthy, R.; El-Agouz, S.; Nagarajan, P.K.; Subramani, J.; Arunkumar, T.; MageshBabu, D.; Madhu, B.; Bharathwaaj, R.; Prakash, N. A Review of integrating solar collectors to solar still. Renew. Sustain. Energy Rev. 2017, 77, 1069–1097. [Google Scholar] [CrossRef]
  24. Postel, S.L.; Daily, G.C.; Ehrlich, P.R. Human Appropriation of Renewable Fresh Water. Science 1996, 271, 785–788. [Google Scholar] [CrossRef]
  25. Qiblawey, H.; Banat, F. Solar thermal desalination technologies. Desalination 2008, 220, 633–644. [Google Scholar] [CrossRef]
  26. Kabeel, A.; Bassuoni, M.; Rozza, M. Performance study of an innovative heating technique for a modified solar still. Sci. Iran. 2017, 25, 721–727. [Google Scholar] [CrossRef] [Green Version]
  27. Mashaly, A.; Alazba, A.; Al-Awaadh, A.; Mattar, M.A. Predictive model for assessing and optimizing solar still performance using artificial neural network under hyper arid environment. Sol. Energy 2015, 118, 41–58. [Google Scholar] [CrossRef]
  28. Eldalil, K.M. Improving the performance of solar still using vibratory harmonic effect. Desalination 2010, 251, 3–11. [Google Scholar] [CrossRef]
  29. Jankowski, P.; Garstecki, P. Stable hydrophilic surface of polycarbonate. Sens. Actuators B Chem. 2016, 226, 151–155. [Google Scholar] [CrossRef]
  30. Coffey, J.; Duddy, J. Self Cleaning, Tubular Solar Still. Google Patents Patent 3,785,931, 15 January 1974. Available online: https://patents.google.com/patent/US3785931A/en?q=Self+Cleaning%2c+Tubular+Solar+Still.&oq=Self+Cleaning%2c+Tubular+Solar+Still (accessed on 10 May 2020).
  31. Turton, J.; Brown, R. A comparison of a numerical model of radiation fog with detailed observations. Q. J. R. Meteorol. Soc. 1987, 113, 37–54. [Google Scholar] [CrossRef]
  32. Pillai, R.; Libin, A.T.; Mani, M. Study into solar-still performance under sealed and unsealed conditions. Int. J. Low Carbon Technol. 2013, 10, 354–364. [Google Scholar] [CrossRef] [Green Version]
  33. Dev, R.; Abdul-Wahab, S.A.; Tiwari, G. Performance study of the inverted absorber solar still with water depth and total dissolved solid. Appl. Energy 2011, 88, 252–264. [Google Scholar] [CrossRef]
  34. Radhwan, A.M. Transient analysis of a stepped solar still for heating and humidifying greenhouses. Desalination 2004, 161, 89–97. [Google Scholar] [CrossRef]
  35. Al-Karaghouli, A.; Alnaser, W. Performances of single and double basin solar-stills. Appl. Energy 2004, 78, 347–354. [Google Scholar] [CrossRef]
  36. Blaga, A. Use of plastics in solar energy applications. Sol. Energy 1978, 21, 331–338. [Google Scholar] [CrossRef] [Green Version]
  37. Ahmed, S. Study of single-effect solar still with an internal condenser. Sol. Wind. Technol. 1988, 5, 637–643. [Google Scholar] [CrossRef]
  38. Maalej, A. Solar still performance. Desalination 1991, 82, 197–205. [Google Scholar] [CrossRef]
  39. Sharshir, S.; Yang, N.; Peng, G.; Kabeel, A. Factors affecting solar stills productivity and improvement techniques: A detailed review. Appl. Therm. Eng. 2016, 100, 267–284. [Google Scholar] [CrossRef]
  40. Tanaka, H. Tilted wick solar still with flat plate bottom reflector. Desalination 2011, 273, 405–413. [Google Scholar] [CrossRef]
  41. Tanaka, H.; Nakatake, Y. Improvement of the tilted wick solar still by using a flat plate reflector. Desalination 2007, 216, 139–146. [Google Scholar] [CrossRef]
  42. Crow, R.M.; Osczevski, R.J. The Interaction of Water with Fabrics. Text. Res. J. 1998, 68, 280–288. [Google Scholar] [CrossRef]
  43. Omara, Z.; Eltawil, M.A.; Elnashar, E.A. A new hybrid desalination system using wicks/solar still and evacuated solar water heater. Desalination 2013, 325, 56–64. [Google Scholar] [CrossRef]
  44. Mahdi, J.T. An Experimental and Theoretical Investigation of a Wick-Type Solar Still for Water Desalination. Ph.D. Thesis, Brunel University School of Engineering and Design, Brunel, UK, 1992. [Google Scholar]
  45. Kofler, P.; Herten, A.; Heinrich, D.; Bottoni, G.; Hasler, M.; Faulhaber, M.; Bechtold, T.; Nachbauer, W.; Burtscher, M. Viscose as an alternative to aramid in workwear: Influence on endurance performance, cooling, and comfort. Text. Res. J. 2013, 83, 2085–2092. [Google Scholar] [CrossRef]
  46. Narayan, G.P.; Sharqawy, M.H.; Summers, E.K.; Zubair, S.M.; Antar, M. The potential of solar-driven humidification–dehumidification desalination for small-scale decentralized water production. Renew. Sustain. Energy Rev. 2010, 14, 1187–1201. [Google Scholar] [CrossRef]
  47. Chehayeb, K.M.; Narayan, G.P.; Zubair, S.M. Thermodynamic balancing of a fixed-size two-stage humidification dehumidification desalination system. Desalination 2015, 369, 125–139. [Google Scholar] [CrossRef] [Green Version]
  48. Xu, L.; Chen, Y.-P.; Wu, P.-H.; Huang, B.-J. Humidification–Dehumidification (HDH) Desalination System with Air-Cooling Condenser and Cellulose Evaporative Pad. Water 2020, 12, 142. [Google Scholar] [CrossRef] [Green Version]
  49. Yıldırım, C.; Yildirim, C.; Solmuş, I. A parametric study on a humidification–dehumidification (HDH) desalination unit powered by solar air and water heaters. Energy Convers. Manag. 2014, 86, 568–575. [Google Scholar] [CrossRef]
  50. Giwa, A.; Fath, H.E.; Hasan, S.W. Humidification–dehumidification desalination process driven by photovoltaic thermal energy recovery (PV-HDH) for small-scale sustainable water and power production. Desalination 2016, 377, 163–171. [Google Scholar] [CrossRef]
  51. Ahmed, M.; Shayya, W.H.; Hoey, D.; Mahendran, A.; Morris, R.; Al-Handaly, J. Use of evaporation ponds for brine disposal in desalination plants. Desalination 2000, 130, 155–168. [Google Scholar] [CrossRef]
  52. Sorgeloos, P.; Bossuyt, E.; Laviña, E.; Baeza-Mesa, M.; Persoone, G. Decapsulation of Artemia cysts: A simple technique for the improvement of the use of brine shrimp in aquaculture. Aquaculture 1977, 12, 311–315. [Google Scholar] [CrossRef]
  53. Agh, N.; Van Stappen, G.; Bossier, P.; Sepehri, H.; Lotfi, V.; Rouhani, S.R.; Sorgeloos, P. Effects of salinity on survival, growth, reproductive and life span characteristics of Artemia populations from Urmia Lake and neighboring lagoons. Pak. J. Boil. Sci. 2008, 11, 164–172. [Google Scholar] [CrossRef] [Green Version]
  54. Esen, M.; Yuksel, T. Experimental evaluation of using various renewable energy sources for heating a greenhouse. Energy Build. 2013, 65, 340–351. [Google Scholar] [CrossRef]
  55. Yildirim, N.; Bilir, L. Evaluation of a hybrid system for a nearly zero energy greenhouse. Energy Convers. Manag. 2017, 148, 1278–1290. [Google Scholar] [CrossRef]
  56. Jolliet, O.; Danloy, L.; Gay, J.-B.; Munday, G.; Reist, A. HORTICERN: An improved static model for predicting the energy consumption of a greenhouse. Agric. For. Meteorol. 1991, 55, 265–294. [Google Scholar] [CrossRef]
  57. Davies, P.; Hossain, A. Development of an integrated reverse osmosis-greenhouse system driven by solar photovoltaic generators. Desalin. Water Treat. 2010, 22, 161–173. [Google Scholar] [CrossRef]
  58. Davies, P.; Hossain, A.; Vasudevan, P. Stand-alone groundwater desalination system using reverse osmosis combined with a cooled greenhouse for use in arid and semi-arid zones of India. Desalin. Water Treat. 2009, 5, 223–234. [Google Scholar] [CrossRef]
  59. Farrell, E.; Hassan, M.I.; Tufa, R.A.; Tuomiranta, A.; Avci, A.H.; Politano, A.; Curcio, E.; Arafat, H.A. Reverse electrodialysis powered greenhouse concept for water- and energy-self-sufficient agriculture. Appl. Energy 2017, 187, 390–409. [Google Scholar] [CrossRef]
  60. Henderson-Sellers, B. A new formula for latent heat of vaporization of water as a function of temperature. Q. J. R. Meteorol. Soc. 1984, 110, 1186–1190. [Google Scholar] [CrossRef]
  61. Salah, A.H.; Hassan, G.E.; Fath, H.; Elhelw, M.; Elsherbiny, S. Analytical investigation of different operational scenarios of a novel greenhouse combined with solar stills. Appl. Therm. Eng. 2017, 122, 297–310. [Google Scholar] [CrossRef]
  62. Amarananwatana, P.; Sorapipatana, C. An assessment of the ASHRAE clear sky model for irradiance prediction in Thailand Nuntiya. Asian J. Energy Environ. 2007, 8, 523–532. [Google Scholar]
  63. American Society of Heating, Refrigerating and Air Conditioning Engineers (ASHRAE). ASHRAE Handbook of Fundamentals; ASHRAE: Atlanta, GA, USA, 1993. [Google Scholar]
  64. Smith, H.J. Weather underground. Science 2015, 348, 1328. [Google Scholar] [CrossRef] [Green Version]
  65. Mohamed, A.; El-Minshawy, N. Theoretical investigation of solar humidification–dehumidification desalination system using parabolic trough concentrators. Energy Convers. Manag. 2011, 52, 3112–3119. [Google Scholar] [CrossRef]
  66. Caldera, U.; Bogdanov, D.; Afanasyeva, S.; Breyer, C. Role of Seawater Desalination in the Management of an Integrated Water and 100% Renewable Energy Based Power Sector in Saudi Arabia. Water 2017, 10, 3. [Google Scholar] [CrossRef] [Green Version]
  67. Trieb, F.; Müller-Steinhagen, H. Concentrating solar power for seawater desalination in the Middle East and North Africa. Desalination 2008, 220, 165–183. [Google Scholar] [CrossRef]
  68. Radhwan, A.M.; Fath, H.E. Thermal performance of greenhouses with a built-in solar distillation system Experimental study. Desalination 2005, 181, 193–205. [Google Scholar] [CrossRef]
Figure 1. A schematic model of the greenhouse with a zero liquid discharge system.
Water 12 01440 g001
Figure 2. Water flow from the saline water barrel to the solar stills (SS) added to the condenser.
Water 12 01440 g002
Figure 3. Cross-section (side) of the solar still panel showing the obstruction and polycarbonate sheet position.
Water 12 01440 g003
Figure 4. Water flow through the system including the desalination and zero-liquid-discharge (ZLD).
Water 12 01440 g004
Figure 5. Different parts of the sustainable ZLD greenhouse model. (a) Built greenhouse and the rainwater harvesting barrel. (b) Solar still used for desalinating the seawater. (c) Solar-powered smart irrigation system (Irrigatia). (d) Dehumidifier.
Water 12 01440 g005
Figure 6. The amount of water collected by the solar still in the first week.
Water 12 01440 g006
Figure 7. Measured solar intensity in the first week.
Water 12 01440 g007
Figure 8. The amount of water collected by the dehumidifier in the first week.
Water 12 01440 g008
Figure 9. Measured temperature and relative humidity in the first week.
Water 12 01440 g009
Figure 10. Total collected water from SS and HDH in the first week.
Water 12 01440 g010
Figure 11. The amount of water collected by solar still in the second week.
Water 12 01440 g011
Figure 12. The amount of water collected by dehumidifier in the second week.
Water 12 01440 g012
Figure 13. Measured temperature and relative humidity in the second week.
Water 12 01440 g013
Figure 14. The measured solar intensity in the second week.
Water 12 01440 g014
Figure 15. Total collected water from SS and humidification-dehumidification (HDH) in the second week.
Water 12 01440 g015
Figure 16. The amount of water collected by solar still in the third week.
Water 12 01440 g016
Figure 17. The measured solar intensity in the third week.
Water 12 01440 g017
Figure 18. Measured temperature and relative humidity in the third week.
Water 12 01440 g018
Figure 19. The amount of water from the dehumidification process in the third week.
Water 12 01440 g019
Figure 20. The total amount of water collected by SS and HDH in the third week.
Water 12 01440 g020
Figure 21. Egypt GH structure [61].
Water 12 01440 g021
Figure 22. Climate conditions—Egyptian GH—for a typical day of 21st March, Borg El-Arab, Egypt.
Water 12 01440 g022
Figure 23. Solar radiation—Egyptian GH—for a typical day of 21st March, Borg El-Arab, Egypt.
Water 12 01440 g023
Figure 24. Accumulated water production from different resources—Egyptian GH—for a typical day of 21st March, Borg El-Arab, Egypt.
Water 12 01440 g024
Table 1. Units and accuracy for each experimental parameter. Accuracy was derived from equipment manuals.
ParametersUnitsAccuracyType of Variable
DATE(dd/mm/yyyy) -Continuous
TIMEtime (hh:mm:ss)-Continuous
Temperature°C±0.5Independent
Relative humidity%±3Independent
Solar radiationWm−2±5Independent
Distilled water productionmL±0.1Dependent
Tilt angle of solar still (SS)° to horizontal±0.1Control

