1. Introduction
Among emerging contaminants, pharmaceuticals are one of the major concerns, due mainly to their toxicity, low biodegradability and extensive use [
1]. In fact, hospital wastewater is an important source of pollution, not only due to pharmaceuticals and antibiotics not absorbed by the body, but mainly due to the metabolites excreted by patients. In Colombia, most of the hospitals do not have wastewater treatment systems and their effluents are directly discharged into the sewer system, then into the rivers. Drinking water treatment plants are not designed to completely remove substances from hospitals; therefore, direct consumption of tap water could arise as a major public health concern [
2].
In Colombia, before 2015, the disposal of hospital wastewater was not regulated by environmental authorities, creating a serious problem of public health and sanitary risk [
3]. Nowadays, local environmental authorities, such as DAGMA (Santiago de Cali Administrative Department of Environmental Management) and local public service provider companies such as EMCALI have the power of imposing sanctions in case of non-fulfillment of environmental regulations [
4]. For example, between 2017 and 2018 in Santiago de Cali (Colombia), many rehabilitation centers, institutes of radiology, skin centers and clinics have been financially penalized for not complying with wastewater discharge parameters.
Advanced oxidation processes (AOPs) are technically feasible alternatives for the oxidation of the compounds found in hospital wastewater. These methods are based on physicochemical processes which are capable of modifying the chemical structure of the pollutants using highly reactive transient species such as the hydroxyl radicals [
5]. Among the AOPs, the photocatalytic process is one of the most studied due to its high efficiency and low implementation costs at commercial level; furthermore, the catalysts can be designed and tuned to absorb energy in certain regions of the visible spectrum, enhancing the process according to the local environmental conditions.
Hospital wastewater contains a complex mixture of active pharmaceutical ingredients and microorganisms. Often, this wastewater is discharged to municipal wastewater treatment plants (WWTPs) without any pre-treatment. The municipal WWTPs are not designed to remove persistent pharmaceuticals. In addition, hazardous wastewater may spread during flooding and combined sewer overflow events. Internationally, there is increasing focus on the potential environmental effects of pharmaceuticals in water environments. Hospitals have been identified as a key source of pharmaceuticals that can act as potent micropollutants. Painkillers such as diclofenac and hormones, for example, can have fatal effects on fish, crustaceans and algae at very low doses. Nowadays, there are now new technologies for treatment of hospital wastewater; conventional methods have been coupled with advanced oxidation processes to obtain high reductions in organic matter content.
For instance, oil and grease traps, sedimentation, homogenization tanks, filtration beds, Fenton processes and the implementation of new photocatalysts are the technologies used for treatment of hospital wastewater with a high content of drug compounds. The study of tetracycline content in hospital wastewater has been important: the use of boron-doped titanium catalysts which absorb visible and UV light enhances the reduction of organic matter content. On the other hand, processes which include upflow anaerobic sludge blankets, anaerobic filters, aerobic processes, and activated sludge extended aeration with final chlorination are only accepted as suitable and efficient technologies for cities with less than 10,000 inhabitants.
In 2019, Monte and collaborators evaluated a hospital wastewater treatment system consisting of a membrane-coupled bioreactor with advanced oxidation, where they showed that the biological phase of the treatment required approximately 20 h of retention, while the advanced oxidation phase took only 5 h, which ensures that processes involving radical hydroxyls as oxidizing agents decrease the production of sludge and involve short residence times. In advanced oxidation processes, groups such as double-bond C-C, activated aromatic groups and non-protonated amines and those antibiotics with higher electronic density have greater affinity with the ozonation process; that is, they will be oxidized more efficiently and quickly [
6].
In the same year, Hoang and collaborators, considering the need to implement efficient processes of the reduction of organic and inorganic load, coupled a traditional process of filtration with gravel and sand followed by a biological process of enzymes and plants like
Scirpus validus, in order to reduce the organic load attributed mainly by acetaminophen. However, it took 15 days to achieve decreases of more than 60%, which shows that traditional processes are not recommended for hospital-type wastewater treatment. At the end of the study, the authors state that, depending on the antibiotic, the biological environment can be used and, if it can be implemented, the minimum retention time should be 40 days. These conclusions lead to the consideration that advanced oxidation processes should prevail over biological processes for the hospital waters, because the flows managed are greater than 5 L/s [
7].
In Colombia, there is little research associated with hospital wastewater treatment. In this field, we can mention the preliminary treatment carried out at the Quindío University Departmental Hospital called a fat and oil trap, whose function is to retain suspended solids by sedimentation and by flotation. The fatty material was subjected to a flow homogenization process, ending with a coagulation—flocculation process, which takes care of the removal and reduction of BOD, DOC and suspended solids. The coupling of these three technologies has an efficiency of 59% in the reduction of percentages of organic load in times of residence longer than 24 h, which evidences that it is not feasible for flows greater than 0.2 L/s [
8].
In general, most of the recalcitrant compounds found in hospital sewage are difficult to mineralize, and conventional processes do not guarantee the reduction of organic and phenolic-type loads that are present and are continuously monitored by Colombian standards.
Previous research [
9] showed that a combination of different semiconductor materials supported on graphene moves the absorption spectra to the visible region, enhancing photocatalytic activity. Characteristics and applications of titanium dioxide (TiO
2) on carbon-supported materials such as activated carbon, fullerene, graphene, carbon nanotubes, etc., have been studied extensively [
10]. However, there is no published research on the use of romarchite phase tin oxide (SnO) supported on graphene for photocatalytic processes. The use of SnO as a catalyst seems to be interesting due its physical properties: high surface area, structure, colour and size; SnO could also exhibit high photocatalytic activity due its properties as a semiconductor [
11]. In this work, we evaluated the efficiency of two photocatalysts (TiO
2 and SnO) supported on graphene for the treatment of wastewater from a hospital centre in Cali-Colombia. The effect of the catalyst type and catalyst concentration on the organic matter removal efficiency was studied.
The results of this study are a proof of concept based on punctual sampling of hospital wastewater from the Valle de Lili Foundation, which aims to demonstrate the possible interactions of variables associated with the concentrations of recalcitrant contaminants and synthesized catalysts. These results will allow us to analyse and evaluate the oxidative process of this type of wastewater using advanced oxidation processes.
2. Materials and Methods
2.1. Materials and Reagents
Graphite (99 wt%), sodium nitrate (>99 wt%), sulfuric acid (95–97 wt%), glacial acetic acid (>99 wt%), hydrochloric acid (37 wt%), potassium permanganate (99 wt%), hydrogen peroxide (30 wt%), ammonium hydroxide (28 wt%) and ethanol (>99.9 wt%) were purchased from Merck (Darmstadt, Germany) and were used without further purification. Stannous chloride (>99 wt%) was obtained from Panreac (Barcelona, Spain) and titanium tetrachloride (>99 wt%) from Fisher (Pittsburgh, PA). Industrial grade nitrogen was obtained from Cryogas (Cali, Colombia). Milli-Q type water was obtained after two successive steps of filtration, followed by deionization and distillation.
2.2. Synthesis of Graphene Oxide (GO)
In a typical procedure, 0.5 g of graphite powder and 0.5 g of sodium nitrate were mixed in a beaker, then 23 mL of sulphuric acid (H
2SO
4) was added to the beaker, which was previously immersed in a water bath. A quantity of 3 g of potassium permanganate (KMnO
4) was added slowly into the solution and dissolved using 20 min of low-intensity (70 W, 60 Hz) indirect sonication. Next, 100 mL of water and 3 mL of hydrogen peroxide were added into the solution, and finally 40 mL of water was added [
12].
The solution was centrifuged using an Ortoalresa centrifuge Digitor 20 C at 1900 rpm for 5 min; subsequently, the supernatant was decanted away, and the residual was washed with a 10% hydrochloric acid solution. This mixture was centrifuged, decanted and washed again. The washed solution was dried using a forced convection oven at 80 °C for 48 h to obtain the graphene oxide powder.
2.3. Synthesis of Romarchite Phase SnO and GO Impregnation
Firstly, an aqueous solution of GO was prepared by dissolving 2.1 g of GO in 210 mL of water. This solution was then mixed with the tin precursor solution, which was prepared by mixing 6.67 g of SnCl2∙2H2O in 100 mL of 20 M acetic acid solution at 80 °C. Then, five drops of HCl fuming were added into the solution, and it was left to stand for 24 h.
The solution was quantified by titration with ammonium hydroxide (28%) up to pH 8.0 and was allowed to settle for 24 h at ambient temperature. Then, the solution was dried using a forced convection oven at 100 °C for 3 h. Finally, the dry solid was calcined using a continuous flow of N
2 in an oven with a temperature program as follows: initially, 40 °C for 1 min; then, a first ramp up to 100 °C at a rate of 4 °C/min; 100 °C was then maintained over 25 min; then, a second ramp up to 150 °C at a rate of 1 °C/min; and, finally, 150 °C was maintained over 2.5 h [
13].
2.4. Synthesis of TiO2 and GO Impregnation
A solution was prepared by dissolving 0.0905 g of titanium tetrachloride TiCl
4 into 20 mL of anhydrous methanol, then 3 mL of HCl fuming and 20 mL of water were added to the solution. A GO solution prepared by adding 0.1 g of GO in 10 mL of water was added dropwise to the titanium oxide solution by the wet impregnation method [
13]. The resulting solution was introduced into a forced convection oven at 100 °C for three hours to obtain a dry powder. Finally, the dry solid was calcined using a continuous flow of N
2 in an oven with a temperature program as follows: initially, 40 °C for 1 min; then, a first ramp up to 100 °C at a rate of 4 °C/min; 100 °C was maintained over 1 h; then, the same rate was used to ramp up to 200 °C; this temperature was maintained for 20 min; then, a third ramp up to 400 °C at a rate of 4 °C/min; and, finally, 400 °C was maintained over 1 h [
13].
2.5. Characterization
2.5.1. Photocatalysts
A FT/IR spectrometer (JASCO FT/IR-4100, USA) equipped with an ATR cell was used to characterize the functional groups of the support and the photocatalysts. Diffuse reflectance measurements were carried out with a spectrometer (Ocean Optics, USB 4000, Orlando, FL, USA) using a broadband halogen fiber optic illuminator as a light source (Nikon Inc., NI-30, Orlando, FL, USA). A scanning electron microscope (SEM JEOL, JSM 6490 LV, North Billerica, MA, USA) was used to determine the shape and size distribution of crystalline particles. For the analysis, each sample was coated with gold (Denton Vacum, Desk, North Billerica, MA, USA) and then analyzed at the microscope in a back-scattered mode with an acceleration voltage of 20 kV. Micrographs were taken at 500×.
2.5.2. Samples Analysis
Dissolved organic carbon measurements were carried out in a TOC analyser (Shimadzu TOC, VCPH, Japan) according to Standard Method 5310B. Chemical oxygen demand determinations were made following the Standard Method 5220B, samples were digested for 2 h under closed-reflux at 150 °C, and then a spectrophotometer (Shimadzu, UV 1800, Switzerland) at 610 nm was used to measure the light absorbed by the sample. Phenolic compound measurements were carried out using the Hanna Instruments HI3864 kit.
2.6. Experimental Procedure
Hospital wastewater for the photocatalytic experiments was obtained from a hospital of Cali, Colombia and was prepared by mixing the samples collected from different sewer pipes: oncology department, clinical laboratory, hospitalization rooms, and laundry. Samples were stored in glass recipients and refrigerated at 4 °C. Additionally, for adequate preservation and for COD and phenol characterization, samples were mixed with sulphuric acid. Prior to the experiments, each sample was well stirred to ensure homogeneity of the aliquots.
For this research, hospital wastewater samples were collected specifically to assess the proof of concept. In subsequent stages of this preliminary research, compound sampling periods will be established. The inspection box detected for the sampling of the hospital wastewater involves all the discharges associated with the clinical laboratory, hospitalization, deliveries, oncology and surgery. The wastewater at this sampling point includes fats and oils from coffee shops and laundries. Wastewater samples were taken once monthly during three months in the afternoon.
Quantities of 0.25, 0.75 and 1.5 g of each catalyst were added to 1000 mL volumetric flasks and diluted to the mark with the hospital wastewater. Then, aliquots of 20 mL were exposed to a simulated solar radiation level of 250 W/m
2 for 1 h and under constant stirring (180 rpm). Photocatalytic experiments were carried out using solar simulator equipment (Atlas, Suntest CPS+, Linsengericht, Germany). After each experiment, the sample was analysed according to
Section 2.5.1.
3. Results and Discussion
3.1. Characterization of GO, SnO-GO and TiO2-GO by Means of FT/IR and SEM
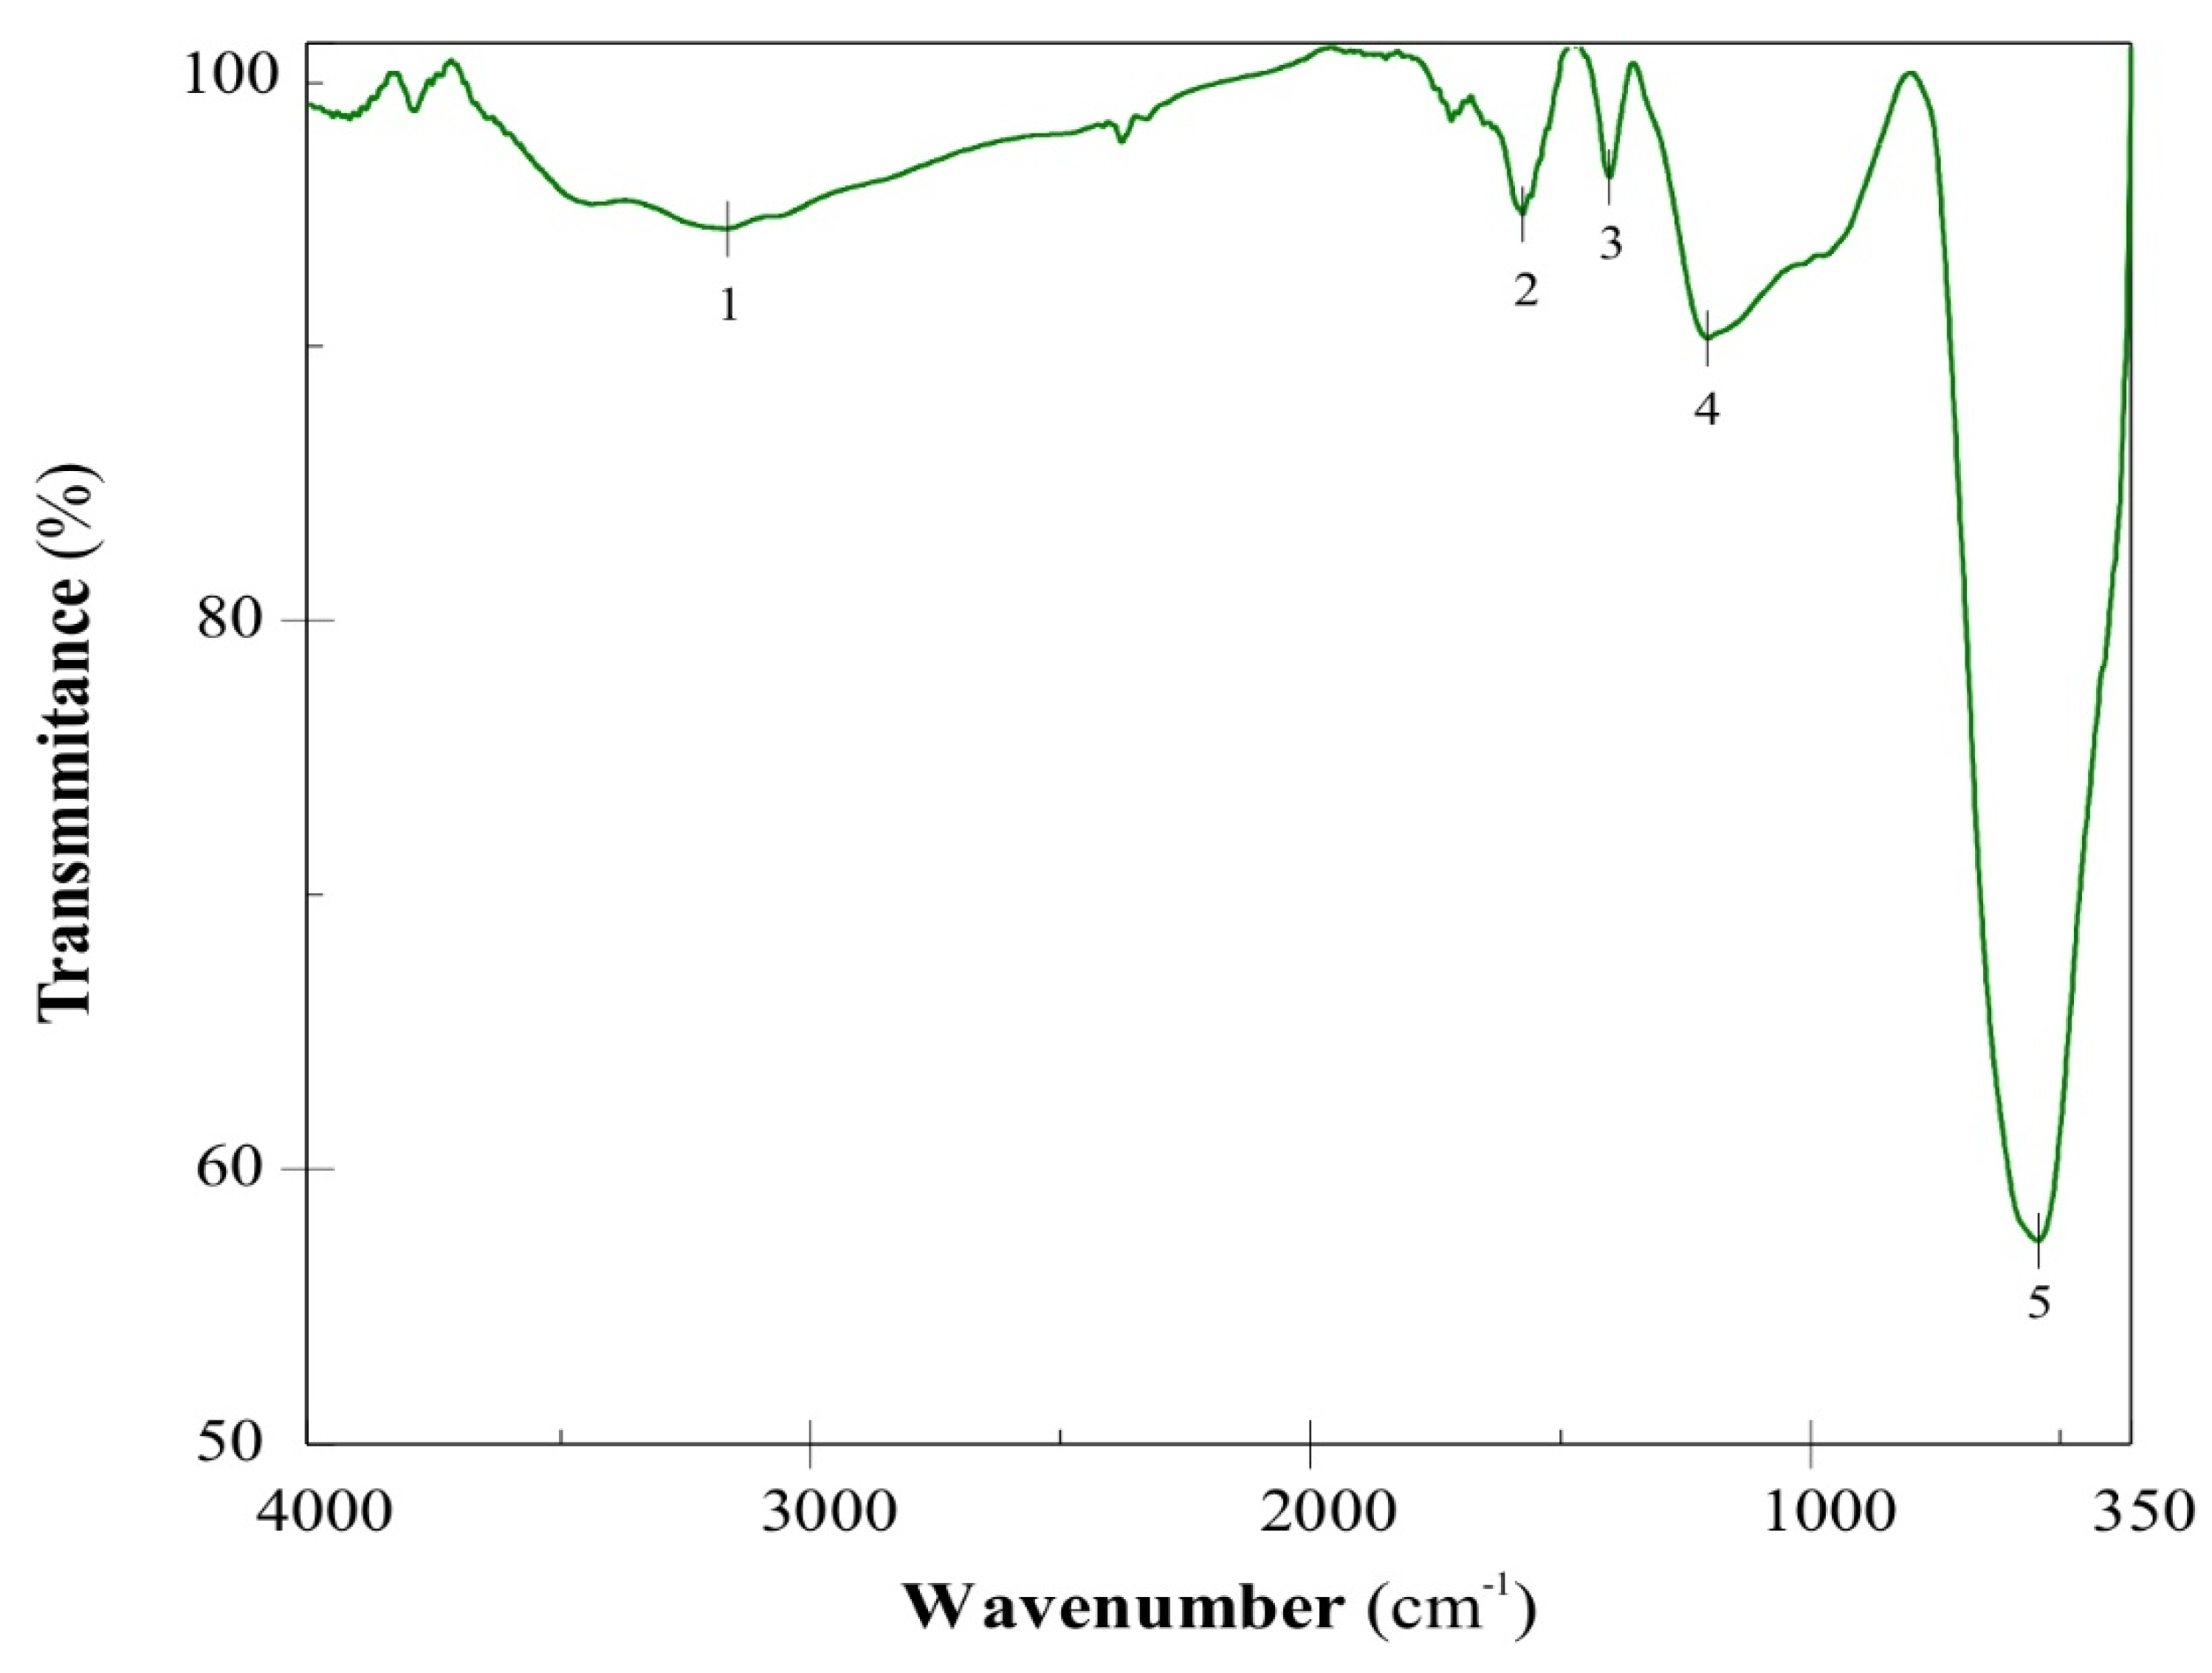
Figure 1 shows the FT/IR spectrum of the GO. The tension peak of the hydroxyl group is seen at 3225 cm
−1 (peak 1), which represents the water absorbed by the graphene oxide. Peaks 2 and 3 at 1713 cm
−1 and 1621 cm
−1, can be assigned to carbonyl bonds (C=O) and double bonds C=C, respectively. The absorption peak 4 at 1041 cm
−1 is assigned to the C–O stretching vibrations [
14]. The presence of C=O and C–O bonds are evidence of the oxidation of graphite [
12].
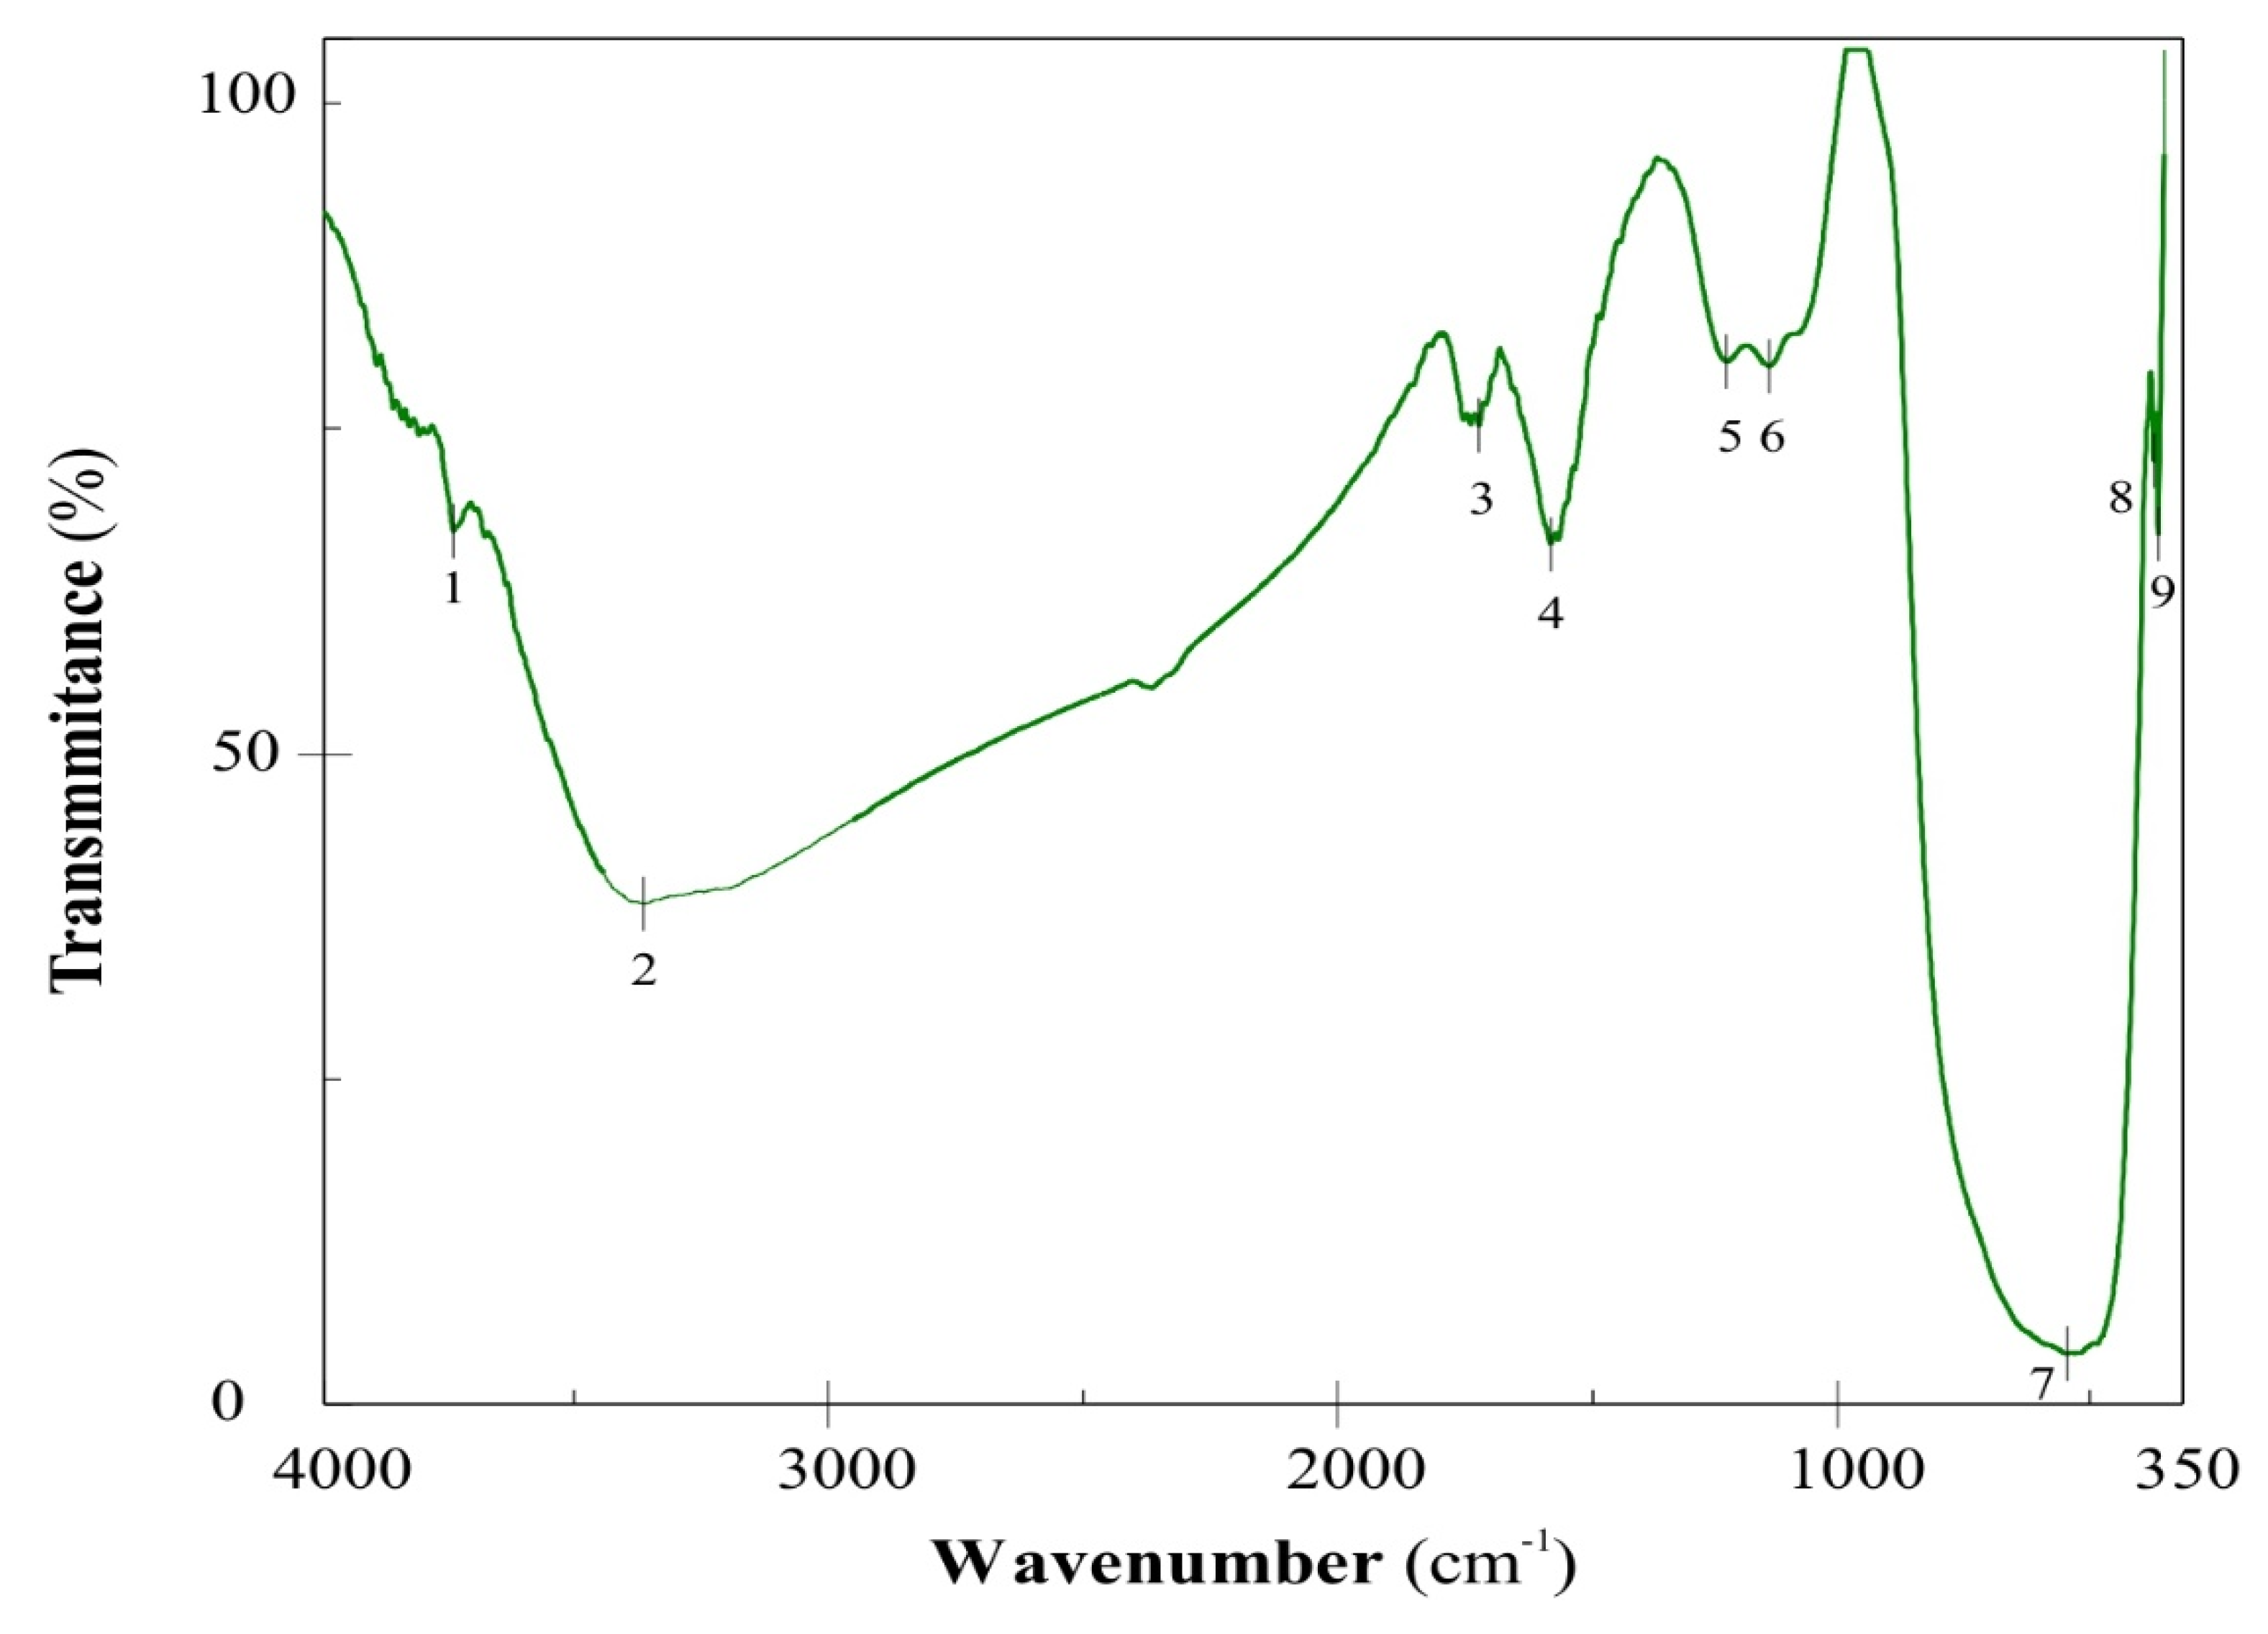
The characteristic FT/IR spectrum of a SnO-GO photocatalyst is depicted in
Figure 2. The absorption peak 1 at 3124 cm
−1 can be assigned to the water absorbed, which cannot be completely removed during the synthesis at 150 °C. Another characteristic peak (2) appears at 1567 cm
−1 and can be assigned to C=O stretching of carboxylic and/or carbonyl moiety functional groups. The C–H deformation peak (3) can be noticed at 1398 cm
−1. The absorption peak (4) at about 1206 cm
−1 is assigned to the C–O stretching vibrations. Finally, near to the inorganic region of the spectrum, the characteristic band of the Sn–O–H bond is seen, at 560.2 cm
−1. On the other hand, it is important to point out that peaks 2 and 3 can be also assigned to an overtone band of a second vibration of the O–Sn–O bond [
15].
Figure 3 shows the FT/IR spectrum of the TiO
2-GO photocatalyst. Peaks 1 and 2 at 3740 cm
−1 and 3363 cm
−1 represent hydroxyl groups. Meanwhile, peaks 3 and 4 at 1707.6 cm
−1 and 1565.9 cm
−1 can be assigned to the carbonyl groups and the C=C bonds, respectively. Peaks at 1217.8 cm
−1 and 1132.9 cm
−1 appear due the presence of methyl groups in the graphene oxide. In the inorganic region of the spectrum at 541 cm
−1 the characteristic peak of the Ti-O-Ti bond is seen [
14].
As is mentioned above, peak 1 in the spectrum can be assigned to the hydroxyl groups. It can be noticed that if the drying or calcination temperature increases, the band is decreased, due mainly to the fact that water absorbed decreases as the temperature increases. Meanwhile, the increase of peak 3 intensity in
Figure 3 can be explained due the TiO-H interaction, which is more marked due to the high calcination temperature, greater than 300 °C [
15].
Comparing the spectrum of GO with the spectrums of SnO-GO and TiO2-GO, it can be observed that the wavelengths are shifted to shorter wavelengths, towards the inorganic spectrum. This can be assumed to be due to titanium and tin interactions with oxygen and carbon, and the other compounds’ interactions.
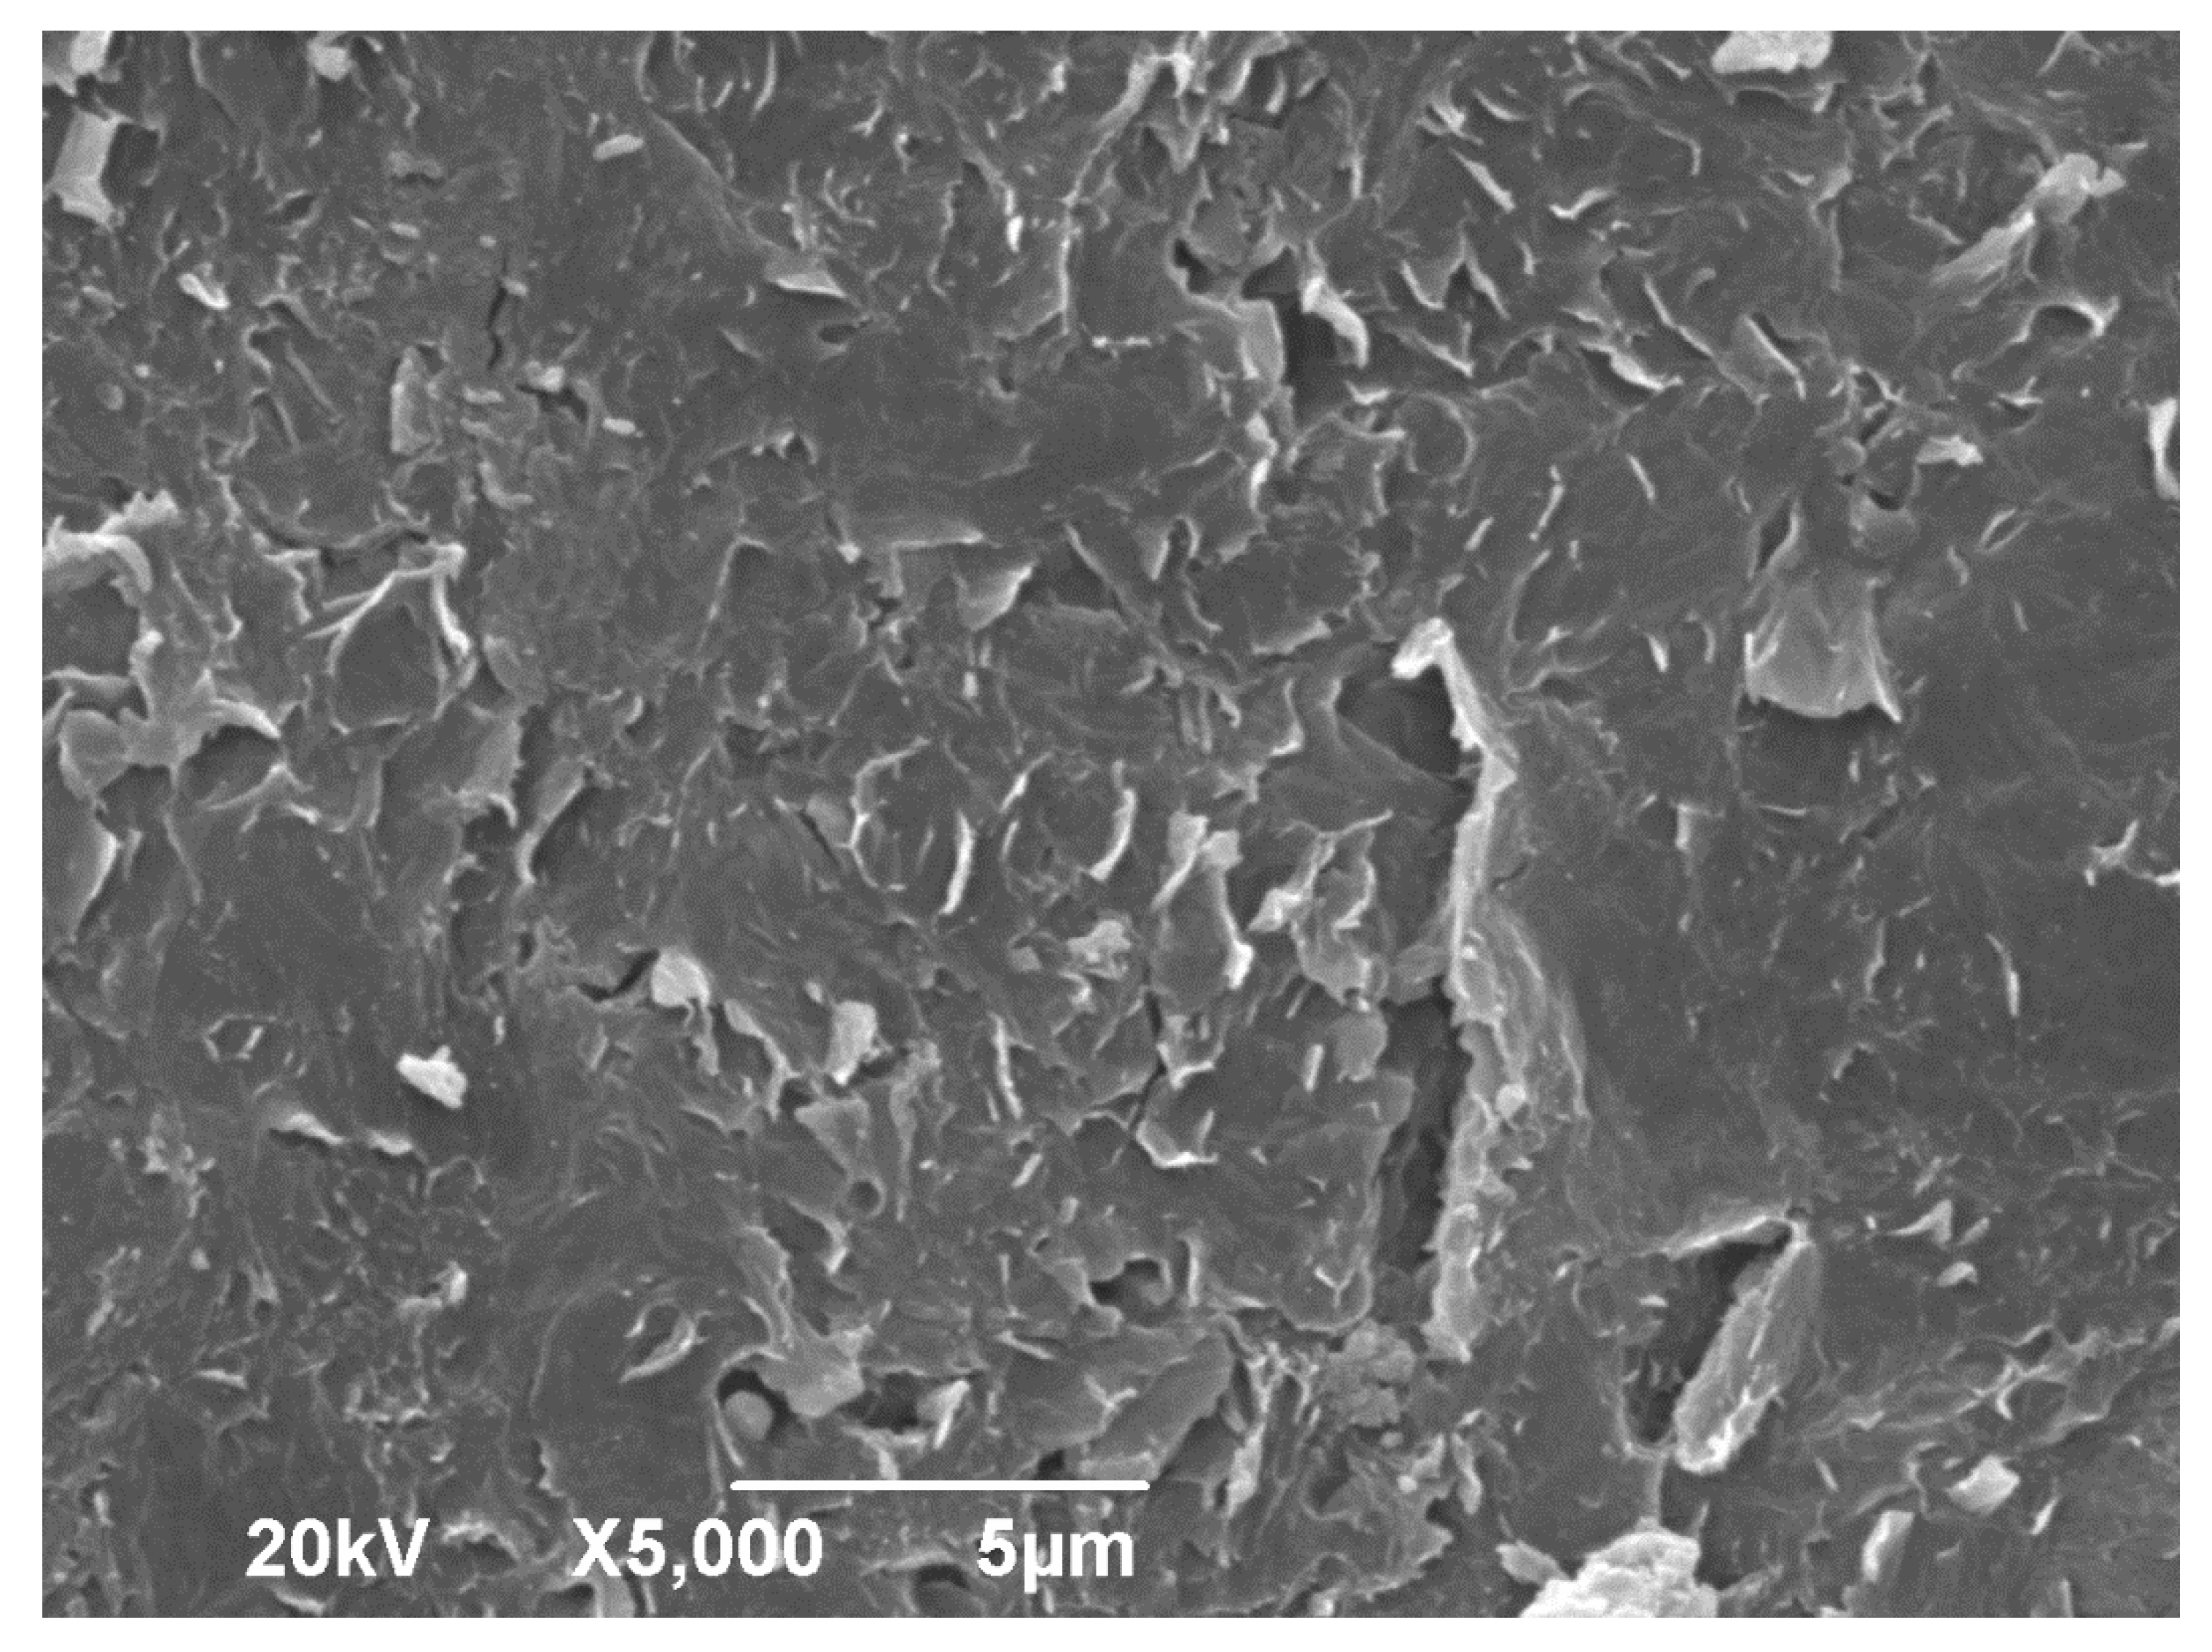
Figure 4 shows the SEM micrograph of the GO. The micrograph shows an irregular and wrinkled appearance and a close surface morphology, which can be attributed to the exfoliation of the GO layers during the ultrasonic process [
16].
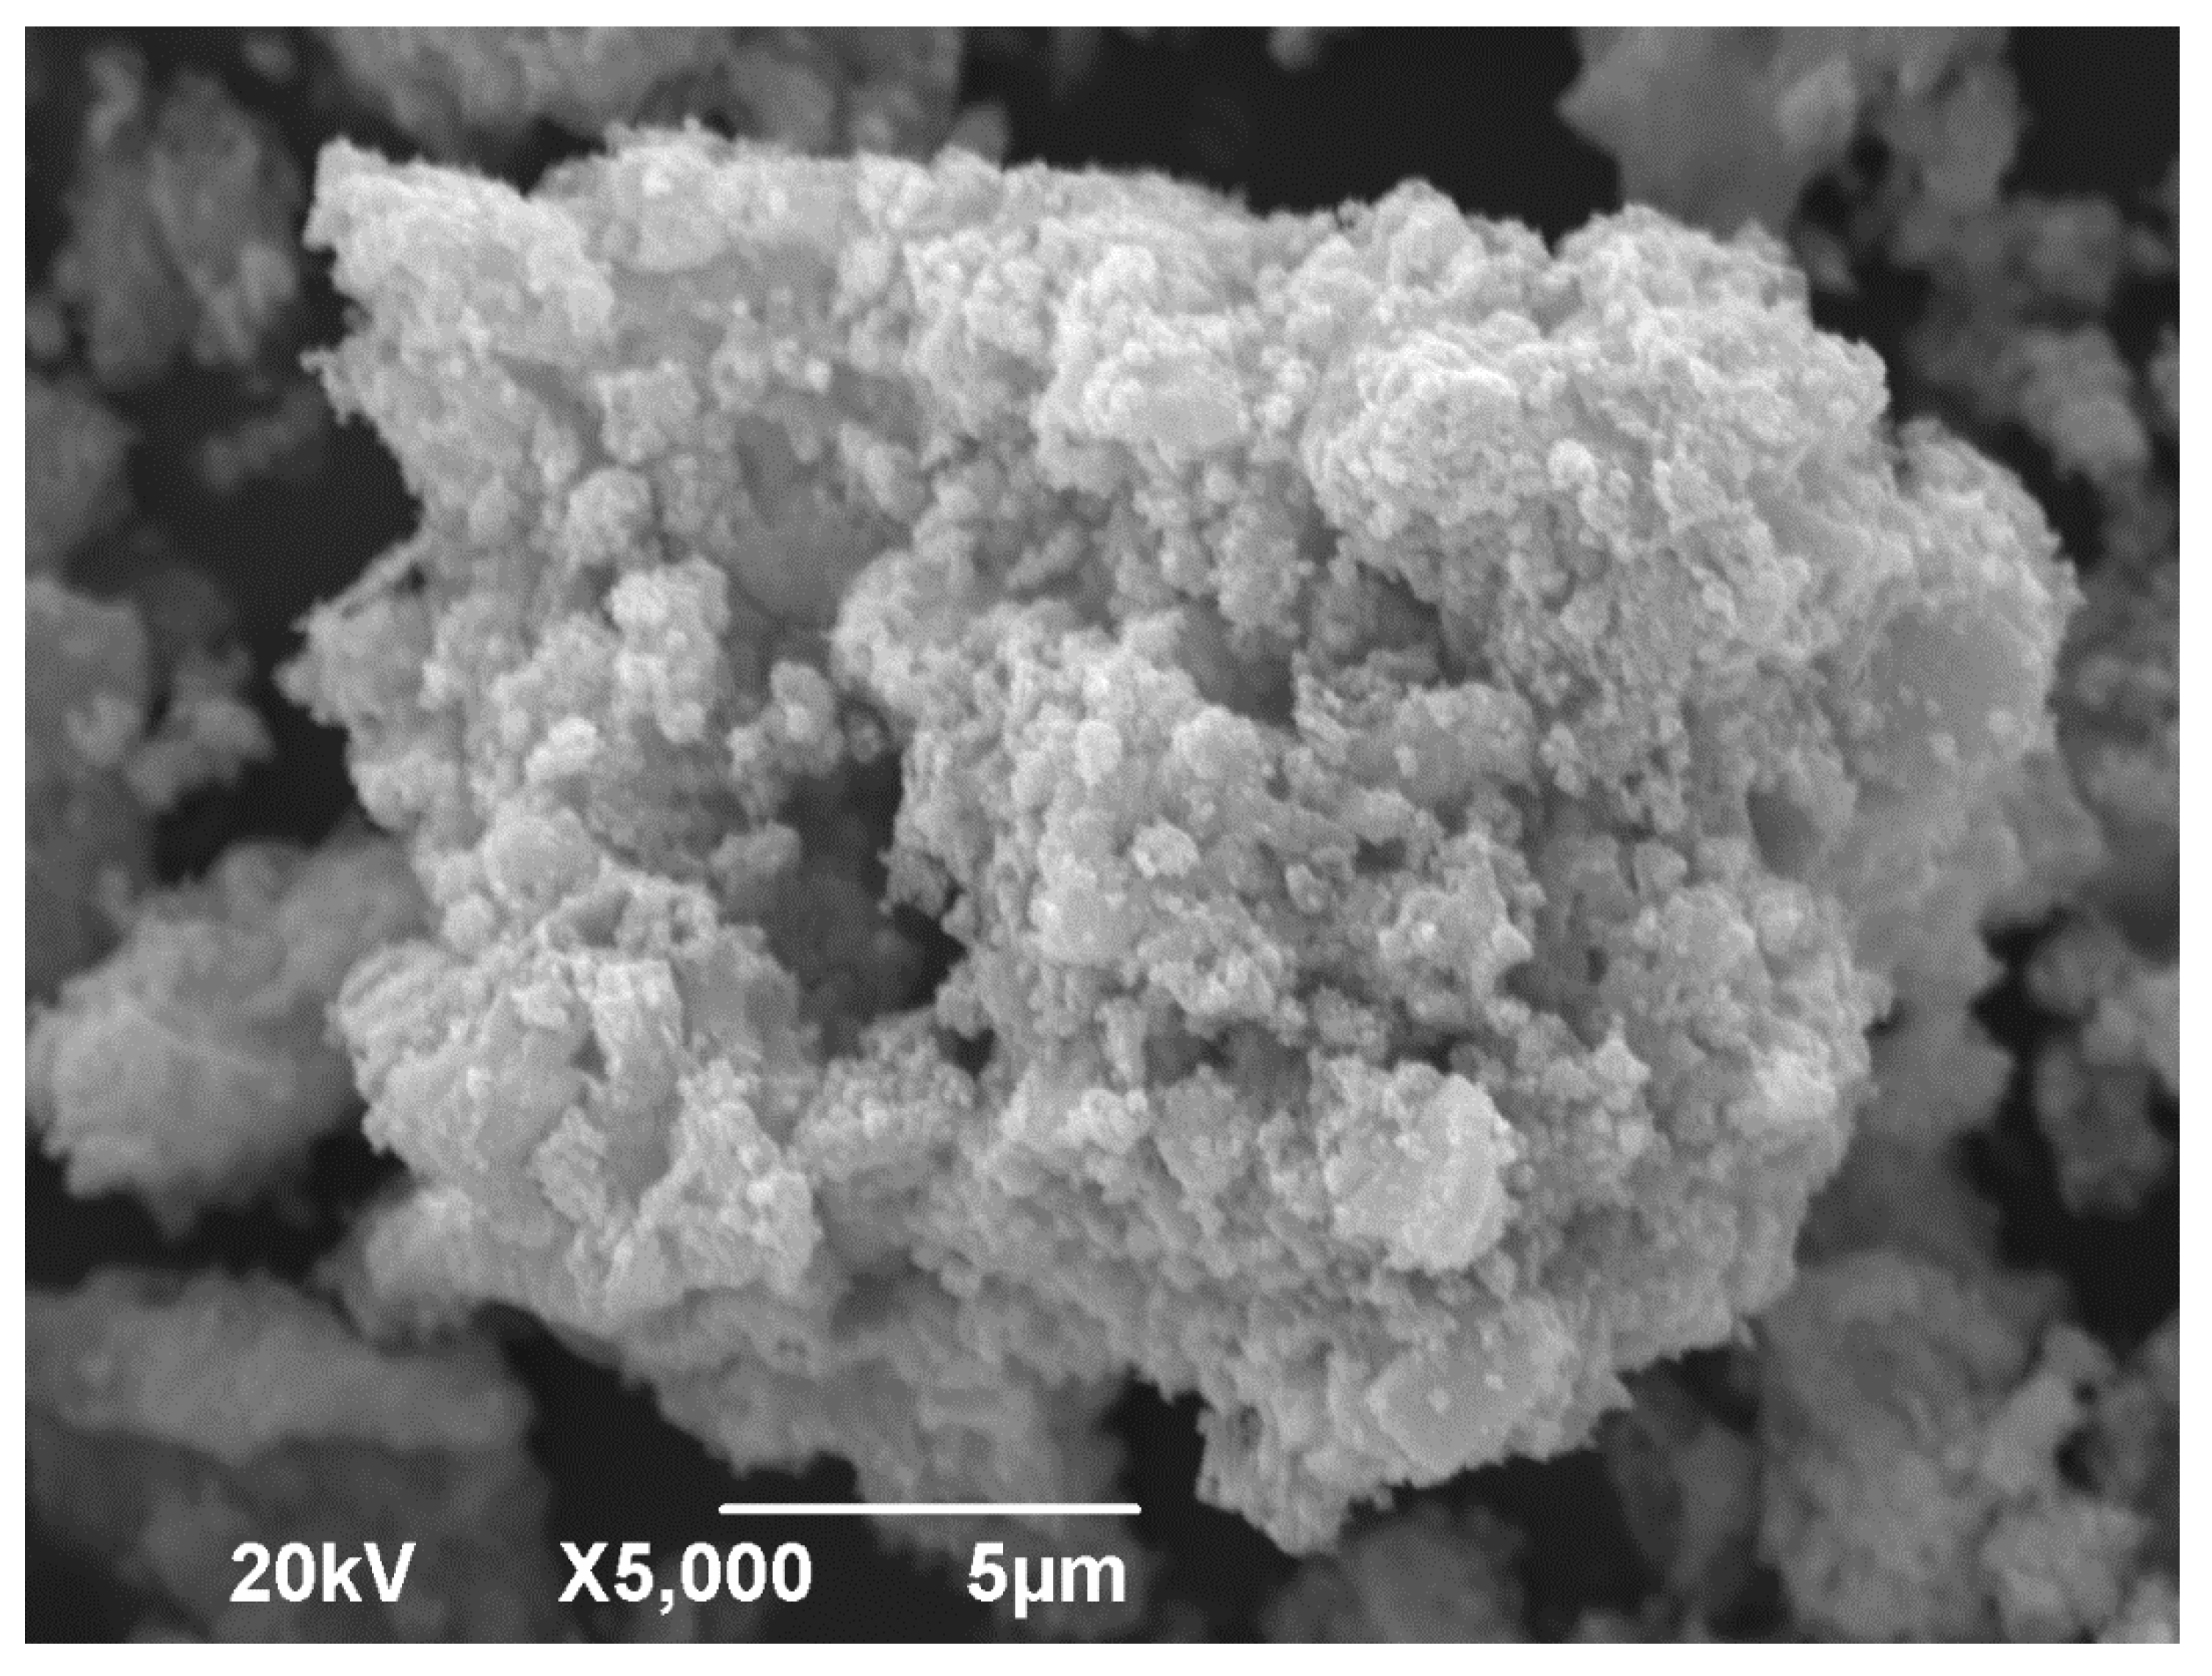
Figure 5 shows the SEM micrograph of the SnO-GO; it can be seen that the romarchite impregnated in the GO presents a thin micrometric cluster, approximating a spherical shape. The surface irregularity can be attributed to the acetic acid [
17]. Finally,
Figure 6 shows the SEM micrograph of the TiO
2-GO. Clusters of crystalline particles with irregular surface can be noticed [
18].
SEM characterization shows the presence of chlorine in the SnO-GO catalyst (around 3.5% w/w) mainly due to the use of SnCl2∙2H2O as the precursor.
Diffuse reflectance measurements allow us to conclude that all photocatalysts supported on graphene absorb around 80% of the electromagnetic radiation in the visible region (see
Figures S1 and S2 Supplementary Information).
3.2. Evaluation of the Photocatalytic Process
Table 1 shows the raw hospital wastewater characterization parameters and the limit values applicable to discharge of wastewater into the public sewer in Colombia [
7]. Characterization parameters were evaluated according to
Section 2.5.1.
In Colombia, unfortunately, environmental resolution 0631 of 2015 does not include dissolved organic carbon (DOC) measurement as a physicochemical control parameter; therefore, only the detection limit of the method used in the measurement is reported.
A GC-MS analysis of organic compounds in the hospital wastewater allows us to determine the functional groups of pollutants present in the wastewater, in order to know which of the photocatalysts has greater efficiency in the treatment of hospital waters. These were found: sulphonamides, phenols (3,5-dioctoxyphenol) and aromatic compounds. Moreover, we found several compounds with different functional groups, such as esters, ketones, aromatics and amines.
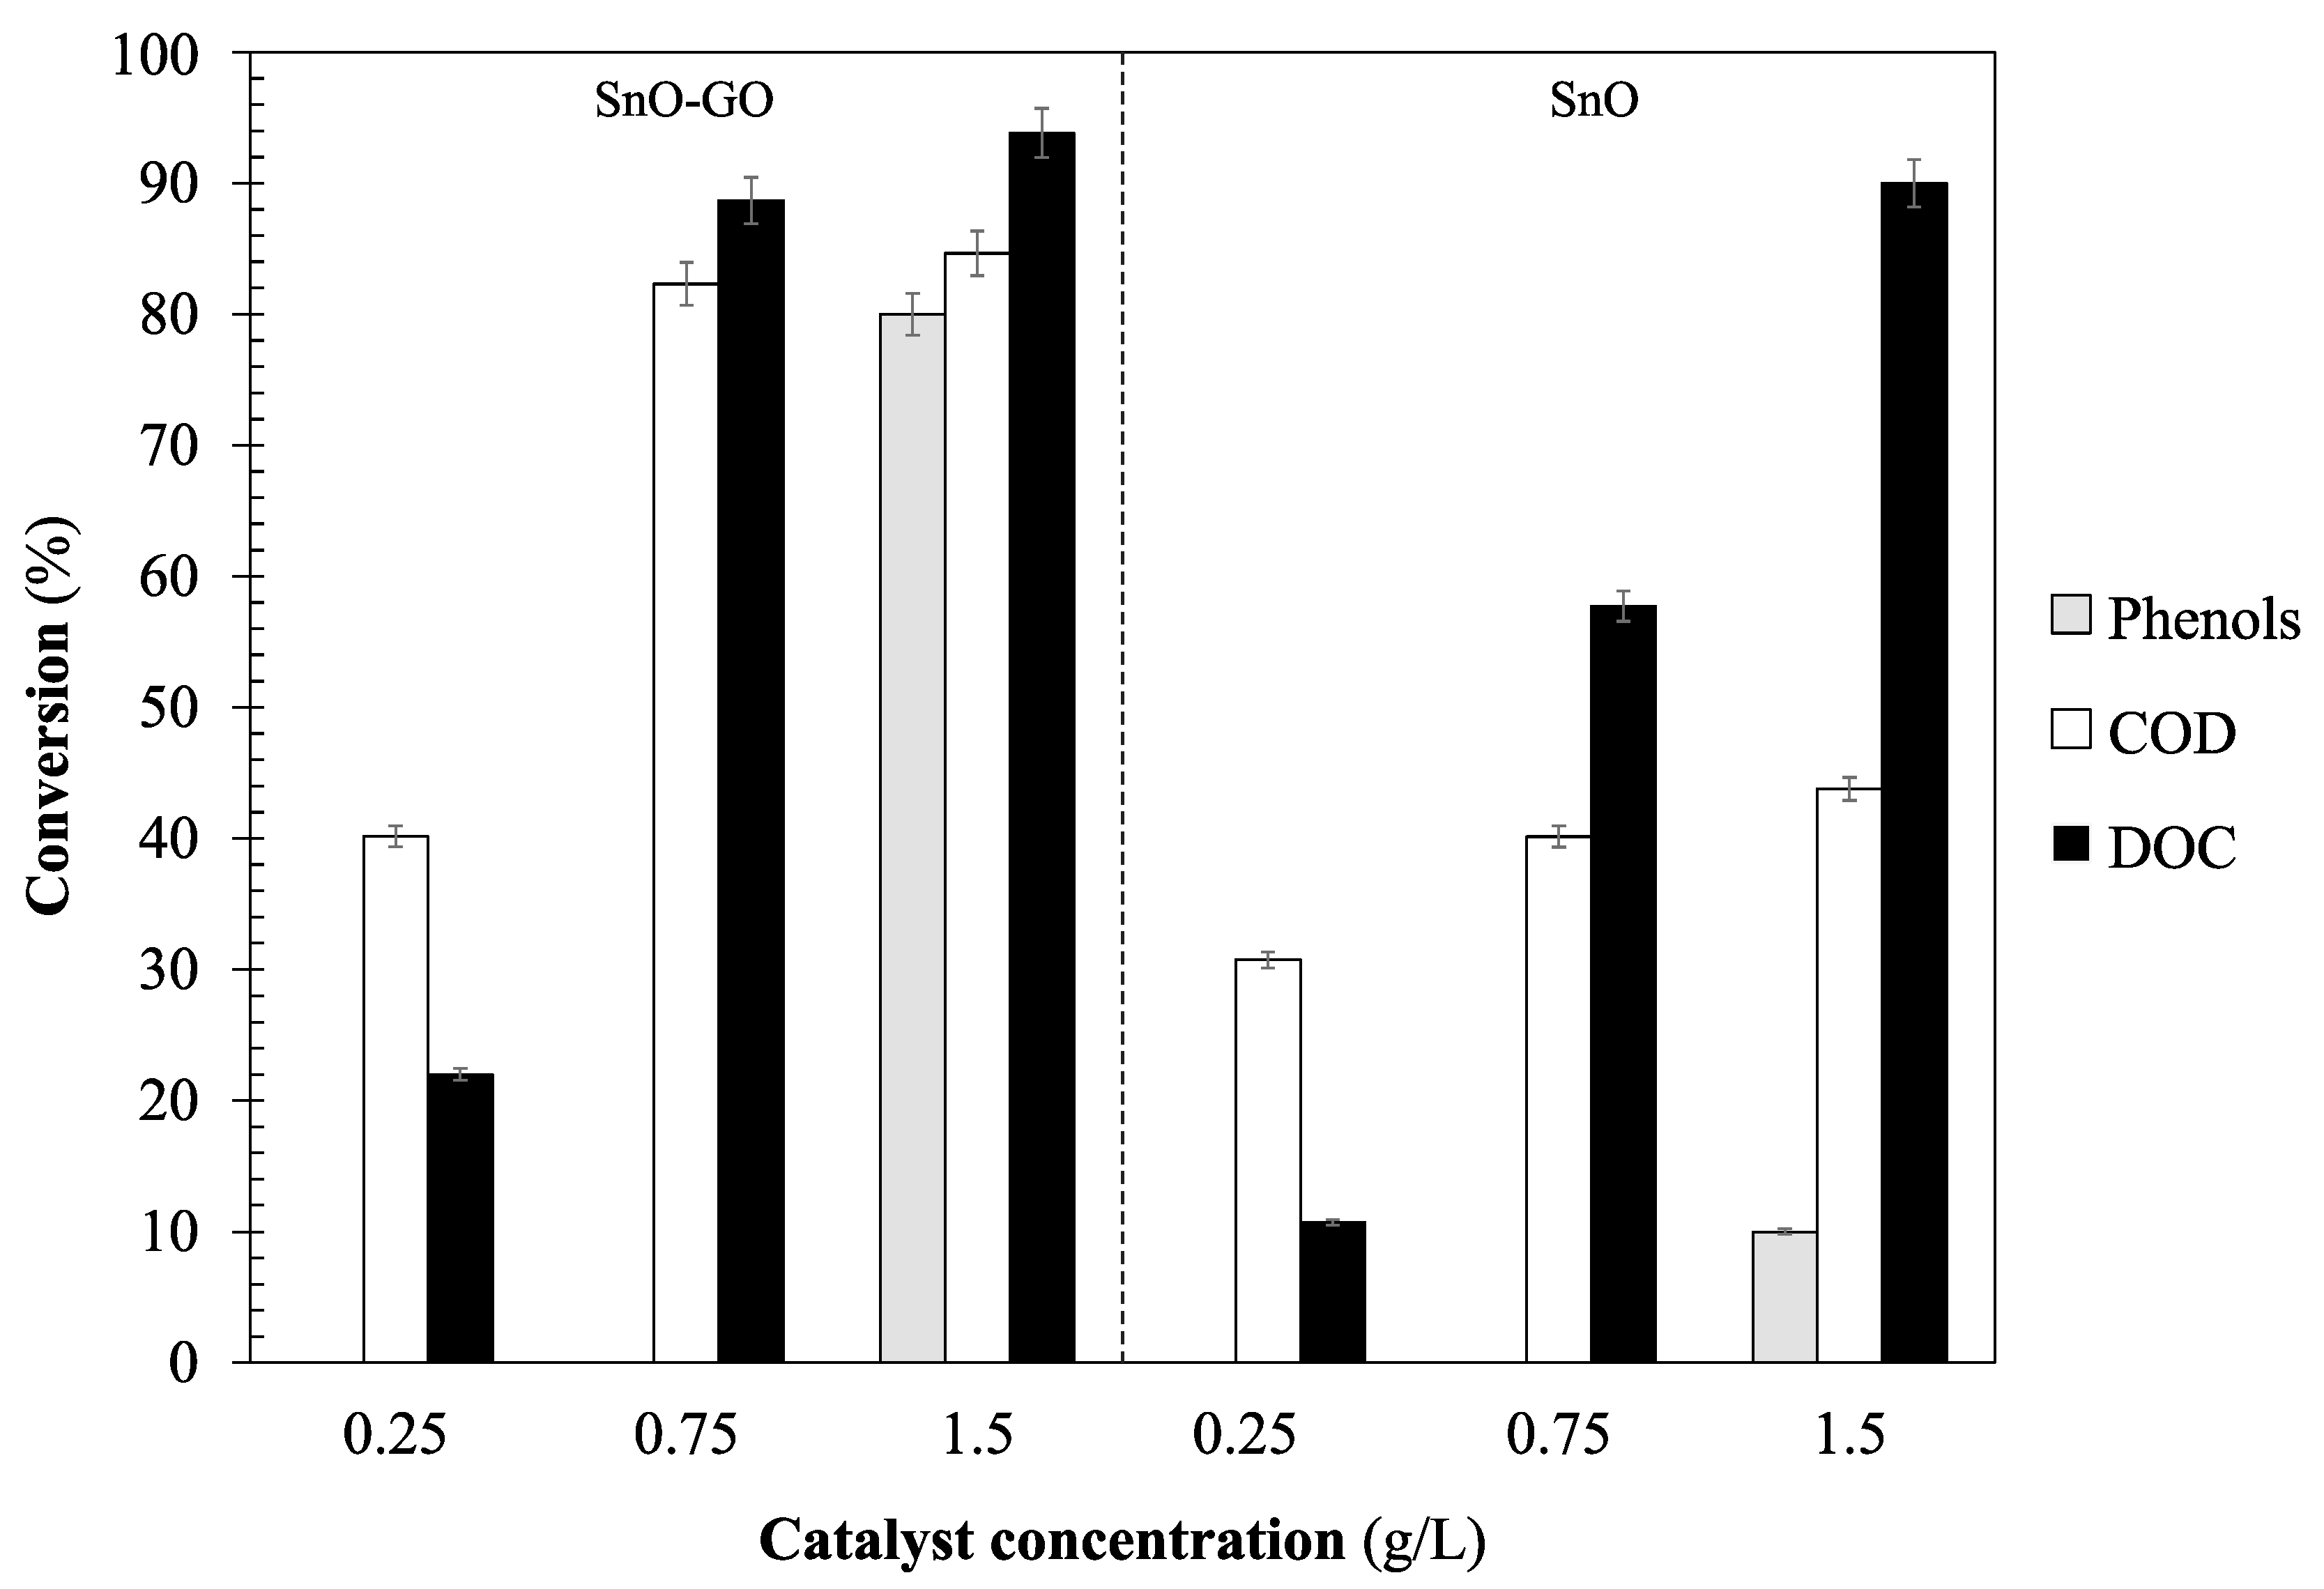
Figure 7 shows the removal efficiencies obtained after the photocatalytic process with Sn-GO and SnO catalysts. The highest organic matter removal efficiency with the Sn-GO photocatalyst was obtained using a concentration of 1.5 g/L; conversely, the lowest efficiency was obtained using a concentration of 0.25 g/L. Similar trends were obtained with the SnO catalyst. It is important to point out that phenol concentrations in the experiments in which we used 0.25 and 0.75 g/L of catalyst remained unaltered, which indicates that there was no phenol conversion. Moreover, a comparison between the catalysts shows that the highest efficiencies were achieved when the TiO
2-GO catalysts were used.
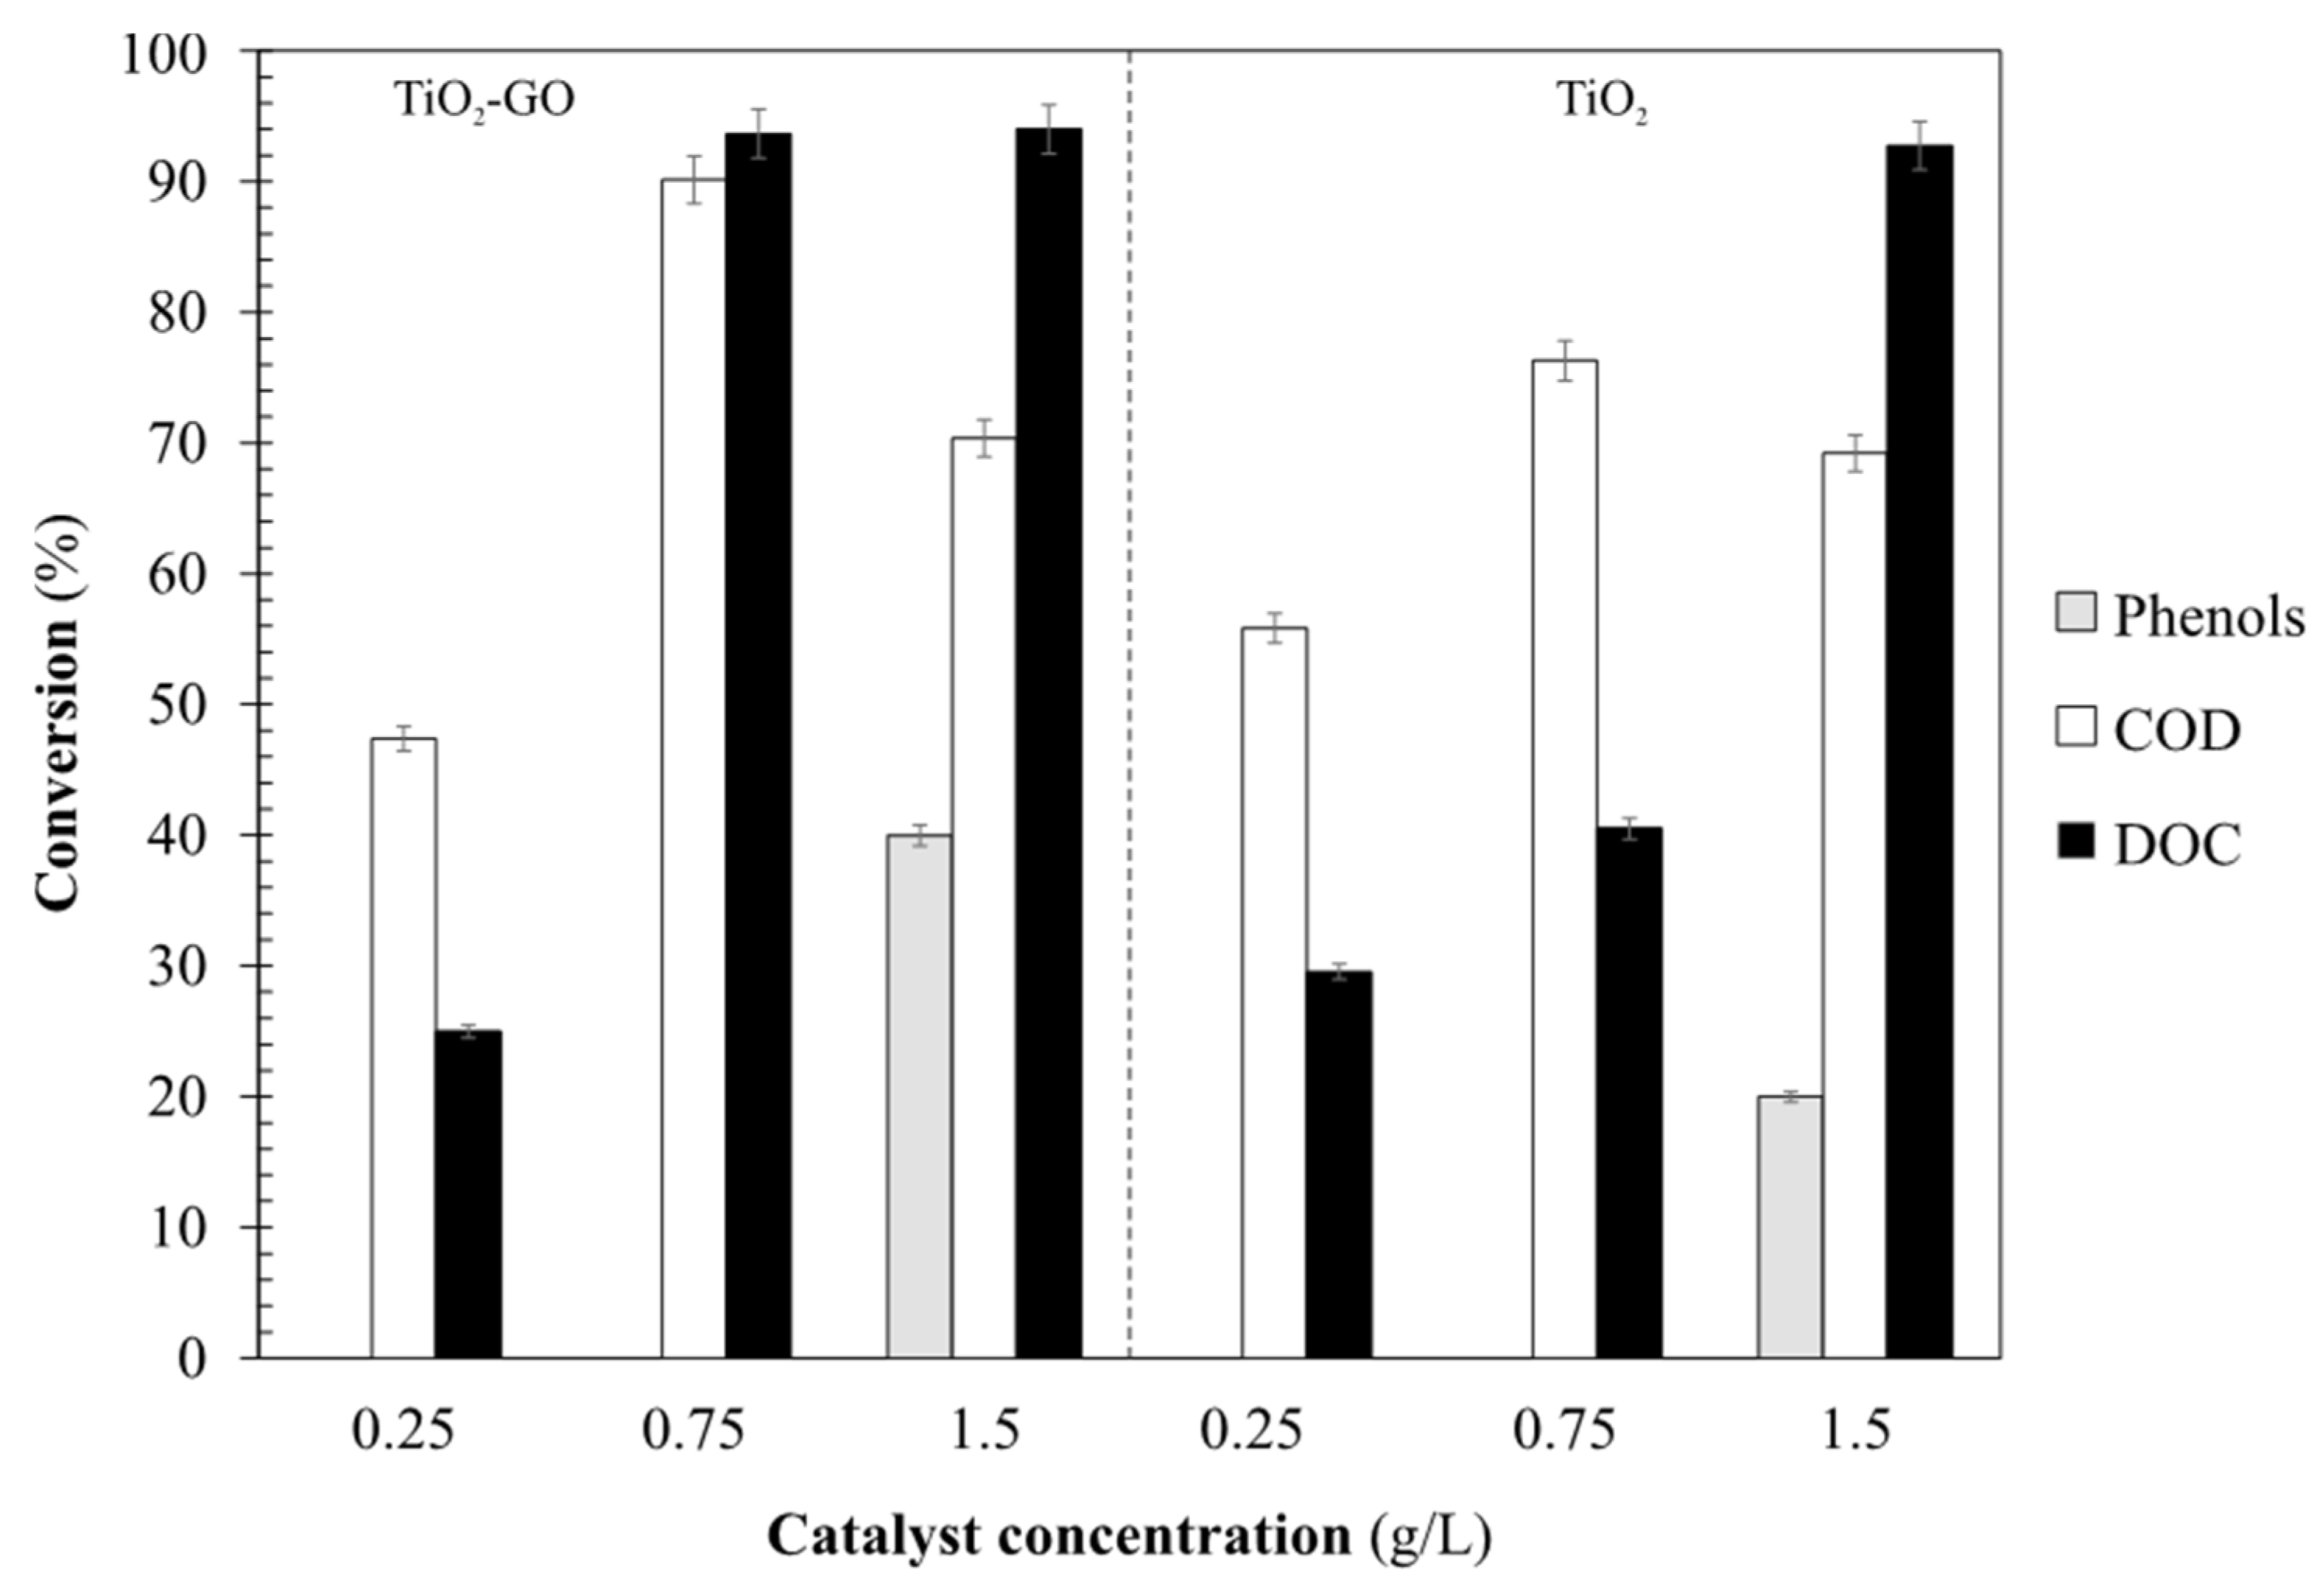
Figure 8 shows the removal efficiencies obtained after the photocatalytic process with TiO
2-GO and TiO
2 catalyst. Similar trends are obtained comparing these results with the ones obtained with the SnO-GO catalyst; lower efficiencies were achieved at low catalyst concentrations. As can be noticed, at low concentrations of catalysts (0.25 g/L and 0.75 g/L), concentrations of phenols remain almost unaltered. At the highest catalyst concentrations (0.75 g/L) removal efficiencies of 80%, 85% and 94% for phenols, chemical oxygen demand and dissolved organic matter were obtained, respectively. The use of TiO
2-GO significantly increases the removal efficiencies compared with the TiO
2 catalyst.
The trends obtained suggest that the generation of hydroxyl radicals increases with increasing photocatalyst concentrations, which enhances the organic matter removal efficiency. However, if the concentration of catalyst is too high, it can produce a “shielding” effect or dimming effect, due to the turbidity created by the suspended catalyst.
As was mentioned above, low concentrations of chemical oxygen demand were obtained at the end of the photocatalytic process due to the degradation of organic matter. However, specific compounds such as phenols were not completely mineralized, achieving conversions lower than 91%.
pH of wastewater does not seem to affect the photocatalytic treatment; high removal efficiencies were obtained in a wide range of pH values. Nevertheless, some publications report that pH affects some properties of the catalysts, such as the particle size, the surface charge, and the maximum and minimum of TiO
2 band values due to its amphoteric nature [
19].
The concentration of phenol in hospital wastewater is high. In this work, we report a phenol removal efficiency up to 80%, a higher value compared to the values obtained with other methods such as wet air oxidation [
20] and adsorption [
21], in which conversions of 14% and 10% were respectively reported. The high removal efficiencies obtained with the photocatalytic process can be assigned to the presence of chlorine, to the high amount of absorbed energy and to the properties of the GO-supported catalysts, which enhance the photocatalytic activity.
In advanced oxidation processes that involve hydroxyl radicals, phenol firstly oxidizes to hydroquinone and then to p-benzoquinone. Then, ring opening reactions take place to form maleic acid, which is the main product of the process. Maleic acid can be oxidized in malonic acid, oxalic acid and formic acid [
22]. Malonic acid oxidizes to acetic acid; oxalic acid can be converted into formic acid and vice versa. Finally, most of the carboxylic acids can be directly oxidized to CO
2 and H
2O [
22].
Figure 9 shows the removal efficiencies obtained in the photocatalytic process with SnO-GO and TiO
2-GO. As can be noticed, the highest organic matter removal efficiencies were obtained when the SnO-GO photocatalyst was used.
3.3. Statistical Analysis
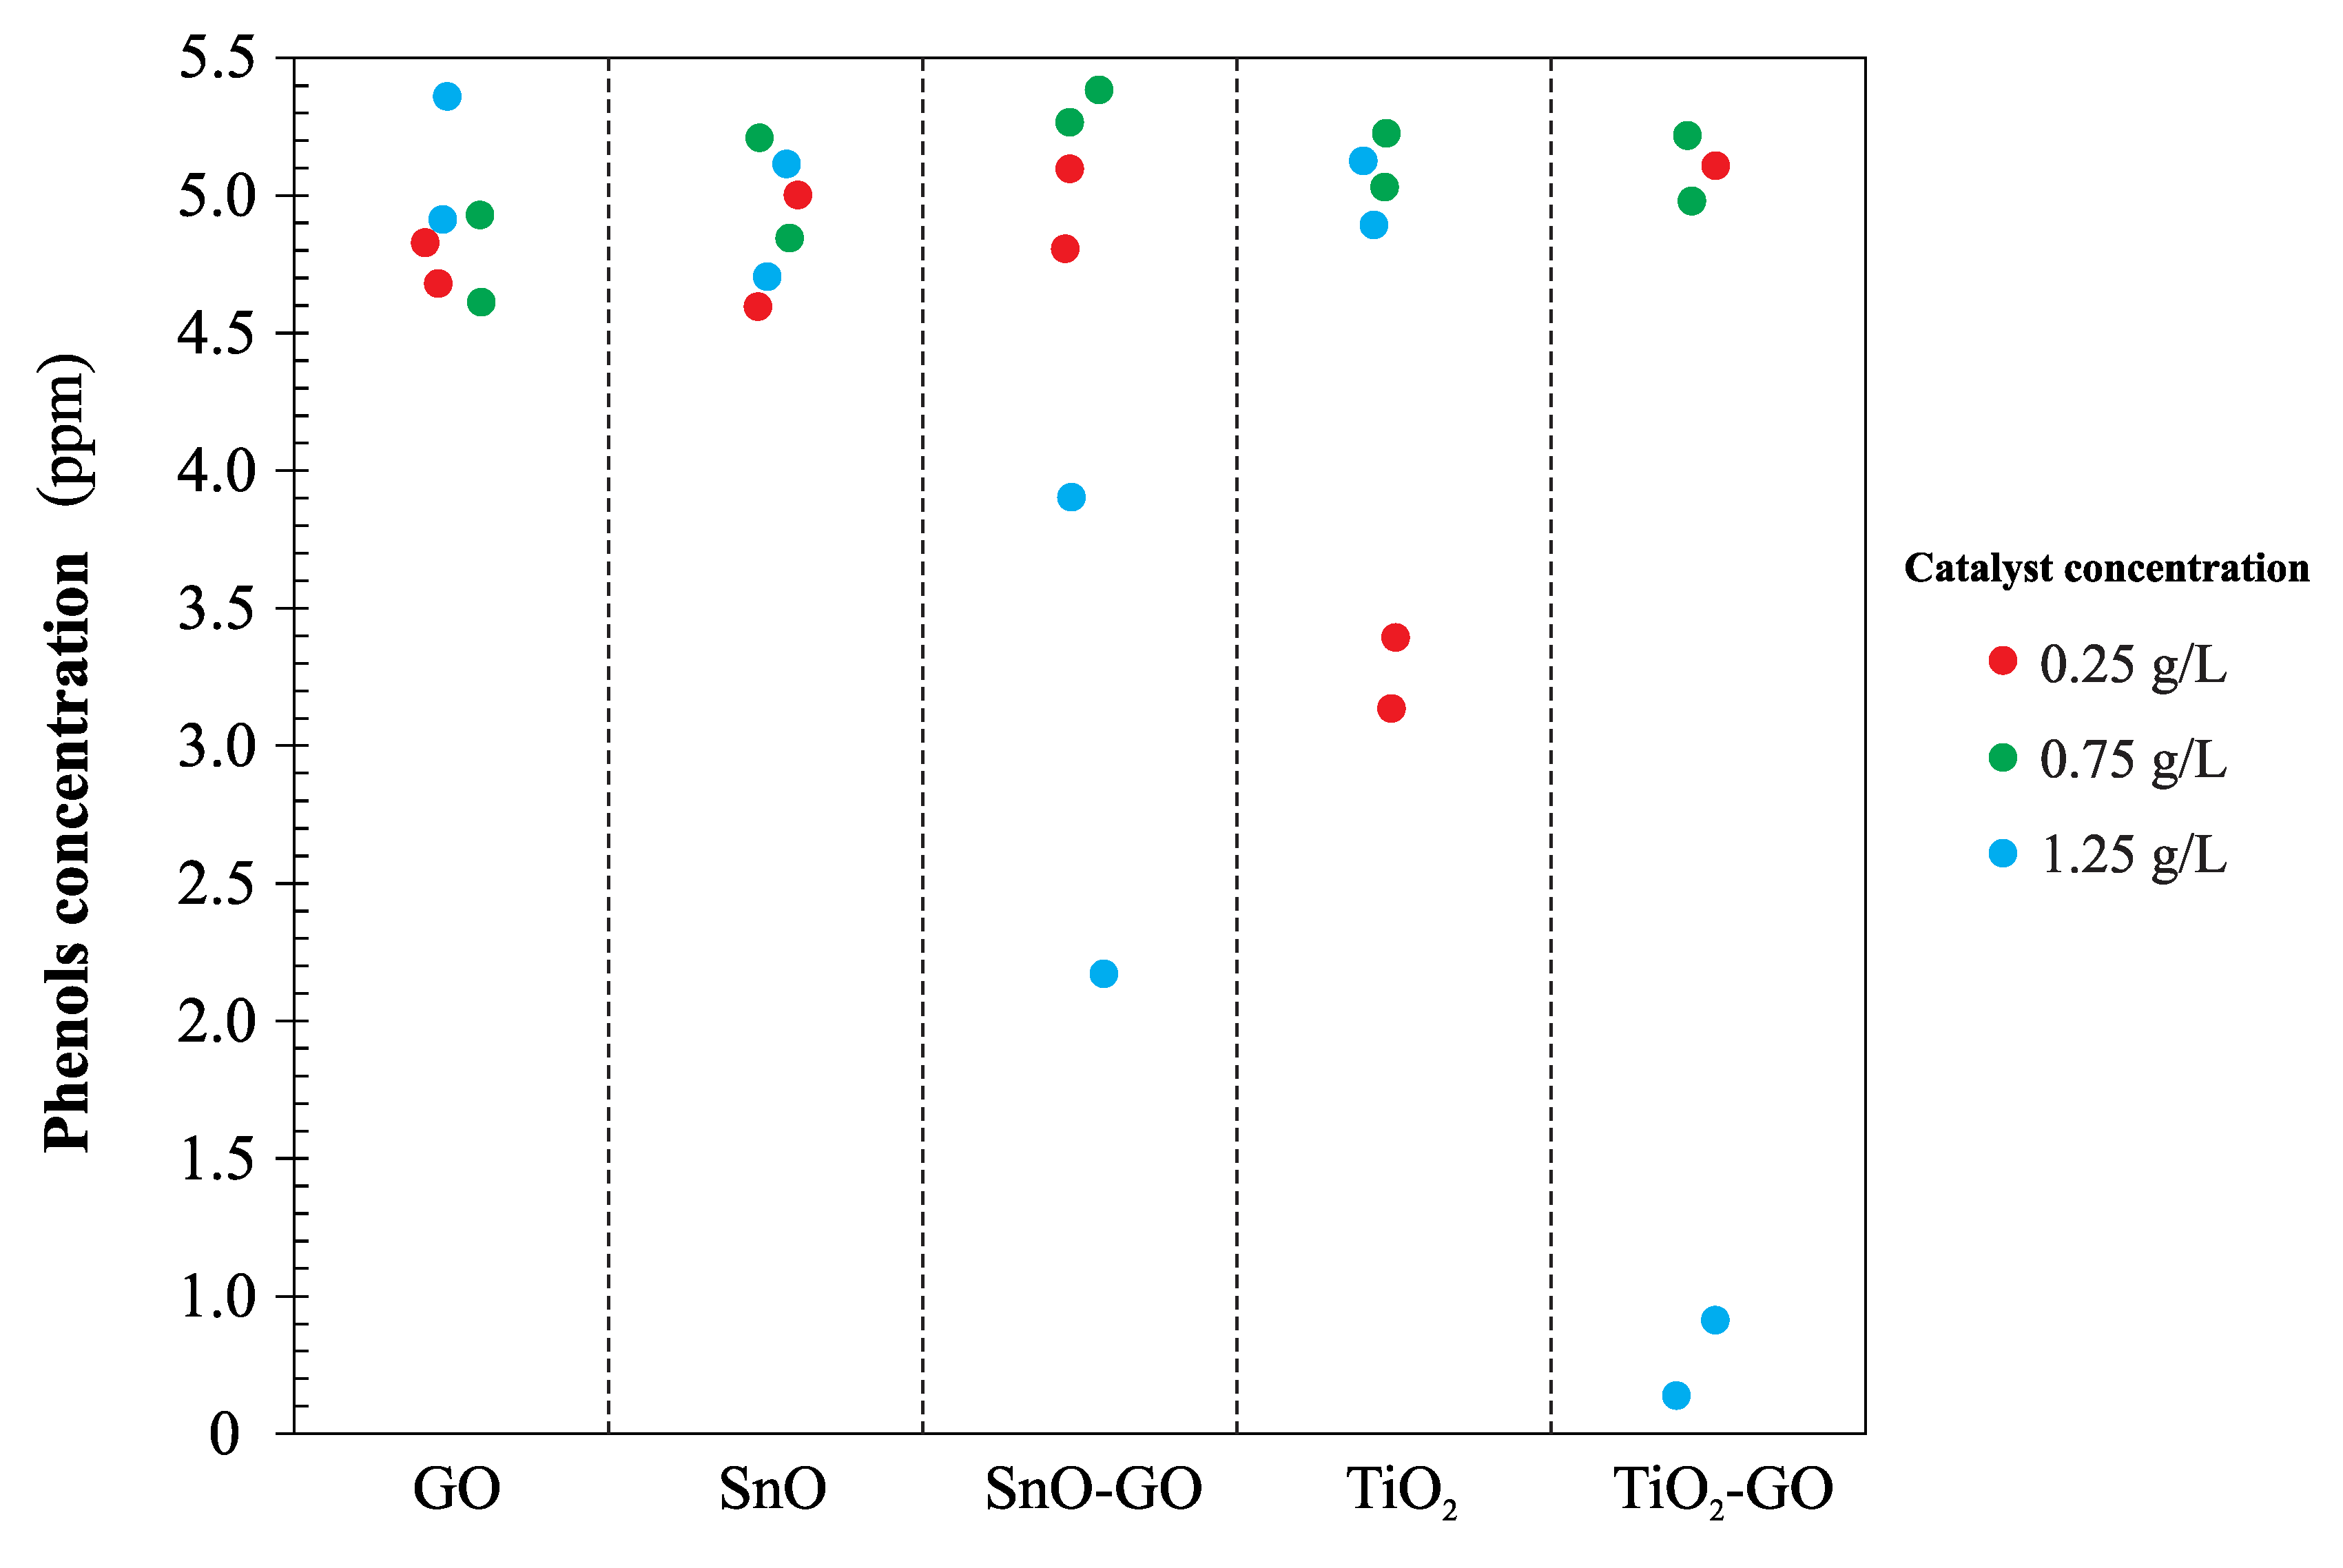
Figure 10 shows the concentration of phenols in the effluent after the photocatalytic treatment with each one of the catalysts synthesized. As it can be seen, the pattern of concentration is identical for all catalysts; low removal efficiencies were achieved in all cases, except when TiO
2-GO with a concentration of 1.5 g/L was used.
Figure 11 shows the concentrations of COD in the effluent after the photocatalytic treatment with each one of the catalysts synthesized. As can be noticed, the concentrations of catalysts used in the treatment have different effects on the COD removal efficiency; for instance, the lowest COD concentration was achieved using the SnO-GO catalyst with a concentration of 0.75 g/L, while at the same concentration but using the SnO catalyst, the highest COD concentration was obtained.
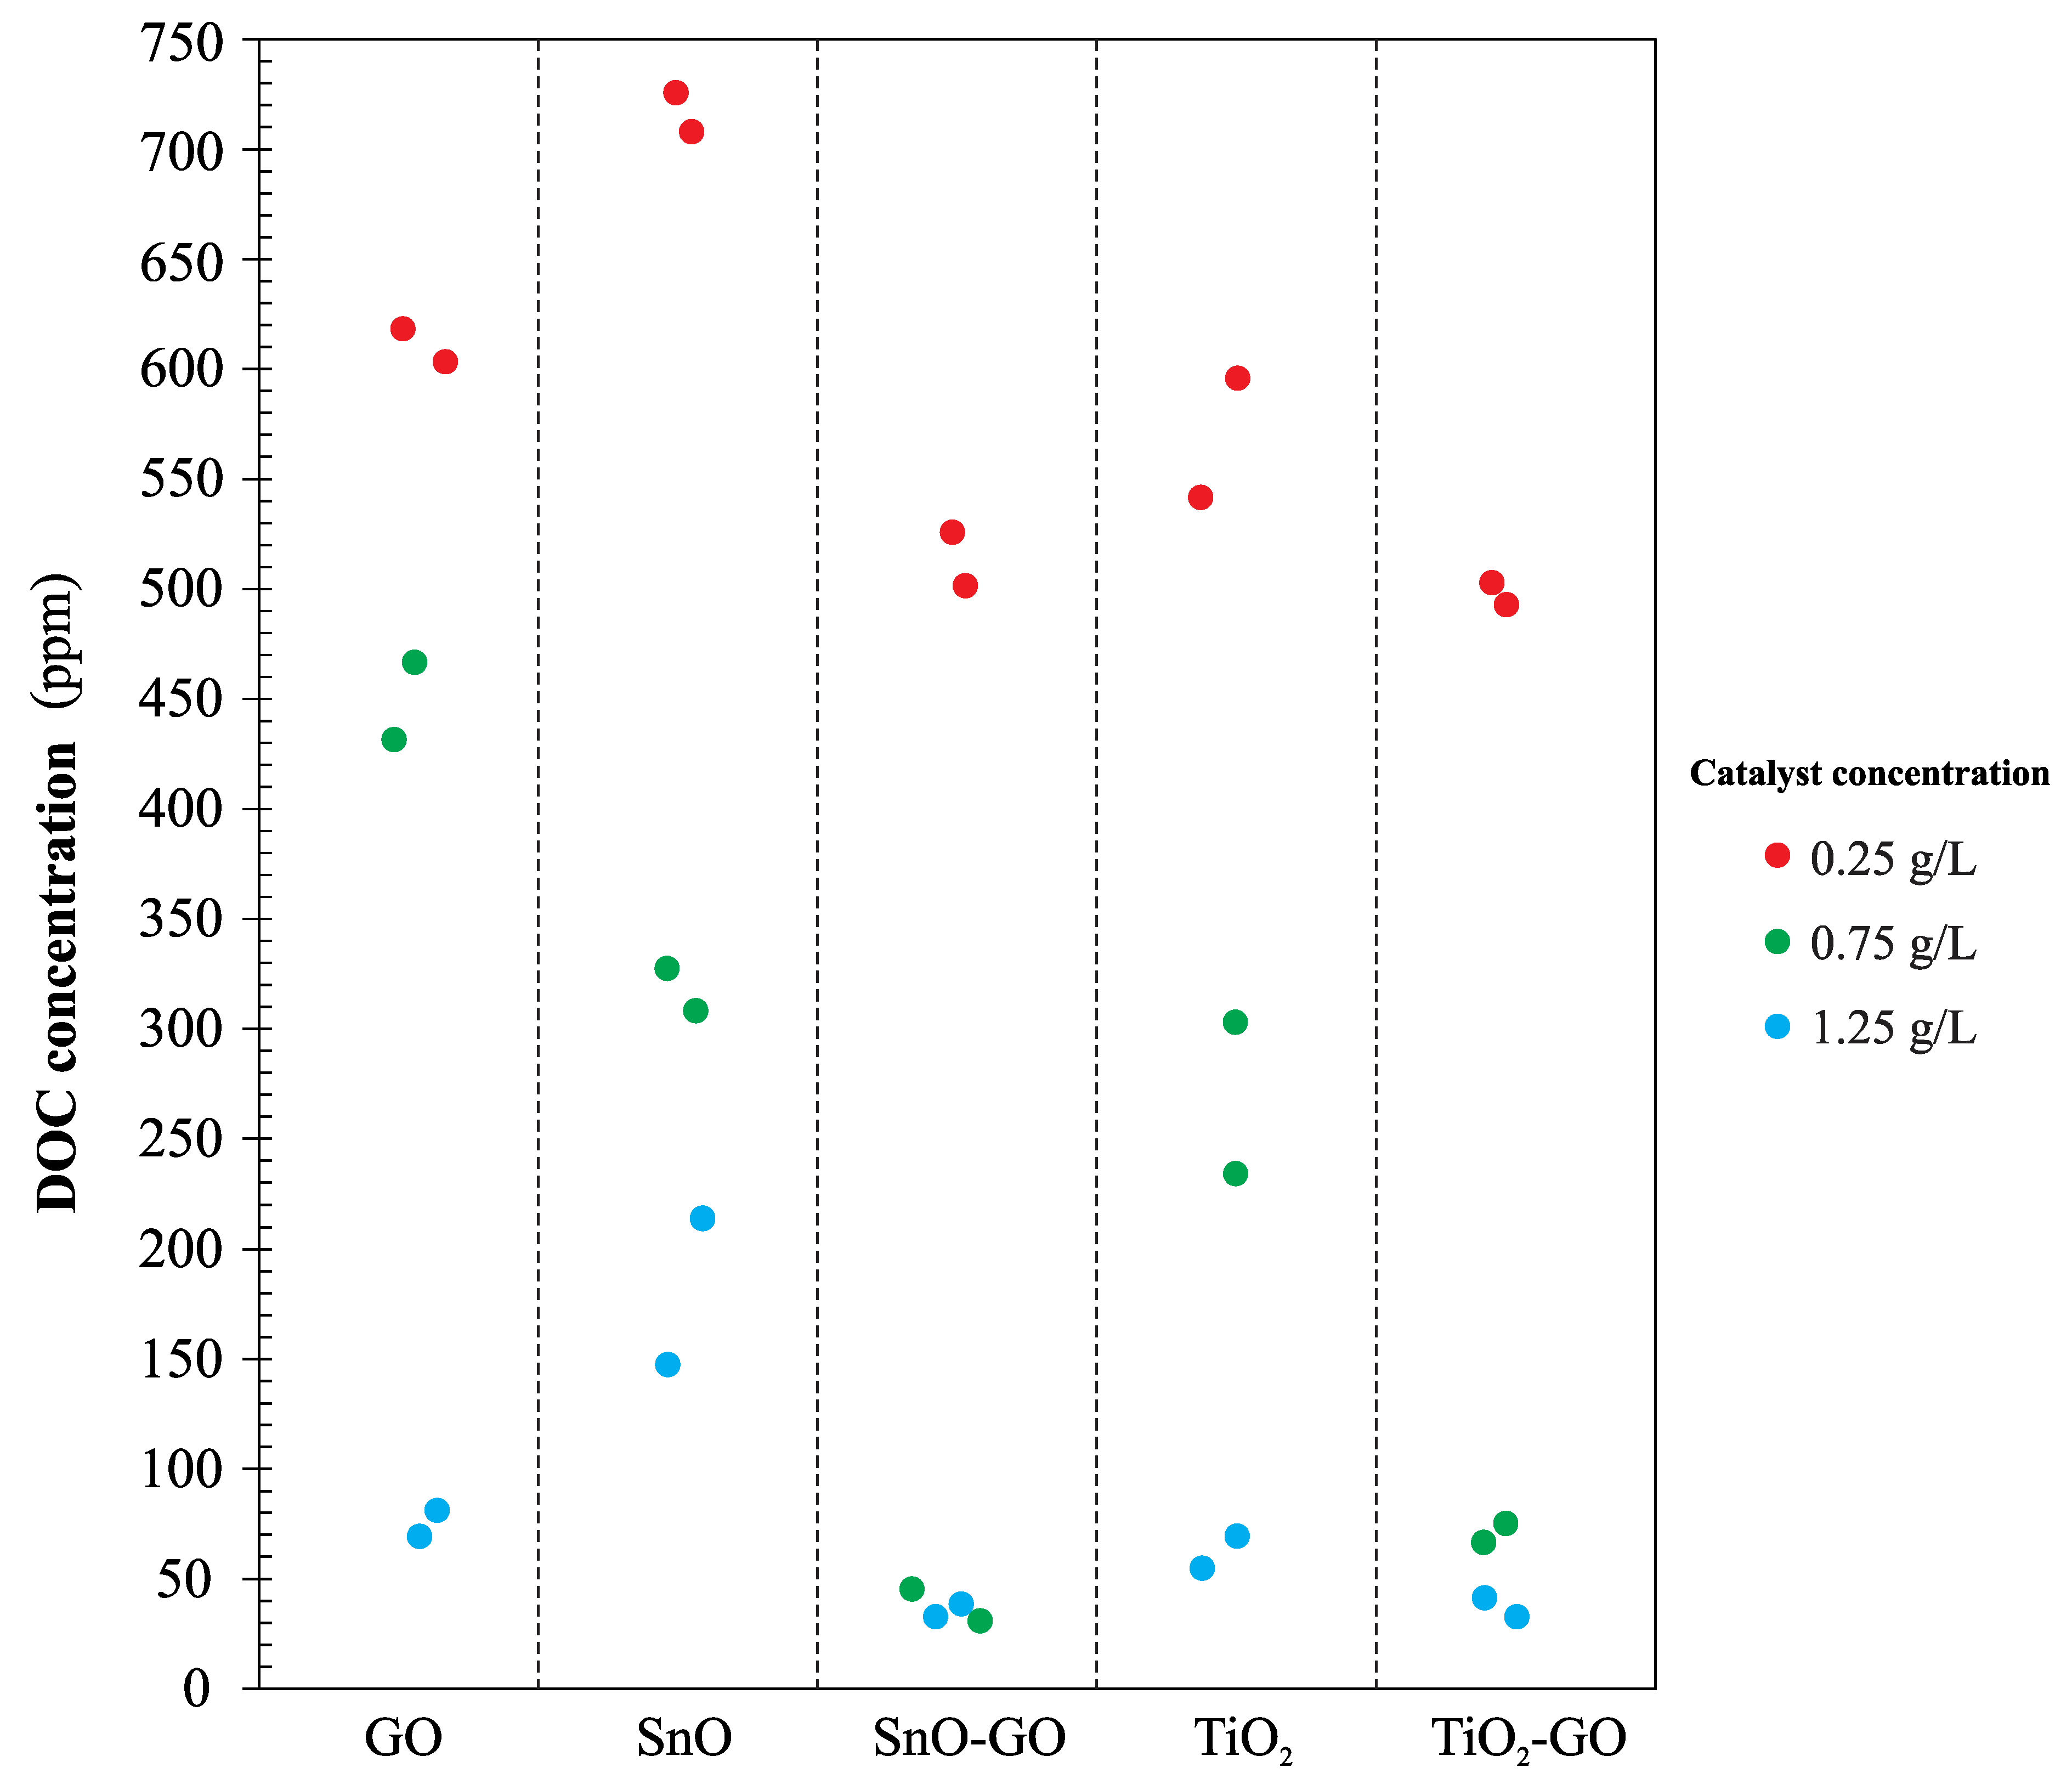
Figure 12 shows the concentrations of DOC in the effluent after photocatalytic treatment with each one of the catalysts synthesized. In this case, the effect of catalyst concentration on the DOC removal efficiency is proportional; efficiency increases when catalyst concentration increases. The highest DOC removal efficiency was obtained using the SnO-GO catalyst.
A statistical analysis was carried out using the free distribution software R version 3.5.1 (R Development Core Team, 2018). Differences between the photocatalytic treatments at a significance level of 10% were determined. From the F-test, it can be concluded that the interaction (concentration level and catalyst type) has a significant effect on the COD and DOC removal efficiencies. Taking into account the descriptive analysis summarized in
Figure 11 and
Figure 12 and the results from the F-test, we performed post-ANOVA Duncan tests. In these tests, we compared the interactions at which the highest COD removal efficiencies were obtained: SnO-GO with a concentration of 0.75 g/L and TiO
2-GO with concentrations of 0.75 and 1.5 g/L. We found statistically significant differences between the comparing groups; from this, and considering the phenol removal efficiencies, we can suggest that the TiO
2-GO photocatalyst with a concentration of 1.5 g/L can be used to obtain the highest COD, DOC and phenol removal efficiencies.

 and
and 


