Article

Fuzzy-Probabilistic Model for a Risk Assessment of Groundwater Contamination: Application to an Urban Zone in the City of Belém, Pará, Brazil

by
Érico Gaspar Lisboa
1,*,
Ronaldo Lopes Rodrigues Mendes
2,
Manuel Maria Pacheco Figueiredo
3 and
Leonardo Augusto Lobato Bello
4
1
Faculty of Sanitary-Environment Engineering, Federal University of Pará, Belém 66075-110, Brazil
2
Graduate-Program in Natural Resource Management and Local Development in the Amazon, Federal University of Pará, Belém 66075-110, Brazil
3
Faculty of Engineering, University of Porto, 4200-465 Porto, Portugal
4
Graduate-Program in Development and Urban Environment, University of Amazon, Belém 66060-902, Brazil
*
Author to whom correspondence should be addressed.
Water 2020, 12(5), 1437; https://doi.org/10.3390/w12051437
Submission received: 15 February 2020 / Revised: 19 March 2020 / Accepted: 20 March 2020 / Published: 19 May 2020
(This article belongs to the Section Water Resources Management, Policy and Governance)

Abstract

:
This study proposes a fuzzy-probabilistic modelling approach for groundwater contamination risk assessment (FPM-risks) regarding underground fuel storage tanks (UFST). Considering the subjective measures of hydrogeological parameters, a fuzzy inference system is proposed to assess the intrinsic vulnerability of aquifers (Y). Measurement of the UFST hazard degree (H) and natural groundwater quality (Q) is considered as a pattern framing issue, such that they were quantified by fuzzy-analytic hierarchy process (AHP) of the recognizing patterns model. Though the association among Q and the probability of using groundwater reserves (G), estimated by the Monte Carlo method, the consequences of contamination (C) were measured. Associating Y, H, and C, the basic and value-weighted risk assessment of groundwater contamination was performed in the urban zone of Belém city, Pará state, Brazil. The results showed that the majority of UFSTs concentrated in the more urbanized zone were classified by FPM-risks as high basic risk and very high value-weighted risk of groundwater contamination. Although the risk assessment should be updated regularly because of the dynamic characteristics of hazards from the USFTs, the FPM-risks was shown as a tool to be considered for managing groundwater resources, as these models overcome subjectivities and address uncertainties, thereby providing a higher level of accuracy than usual risk methods and possibly become a decision-making way.

1. Introduction

Risk is usually defined by the association of the terms origin–pathway–target [1,2]. The “origin” refers to the identification of polluting agents and contaminant loads associated with the source hazards (H). The “pathway” is associated with the intrinsic vulnerability (Y) of an aquifer for contamination. For association among H and Y, the authors of [
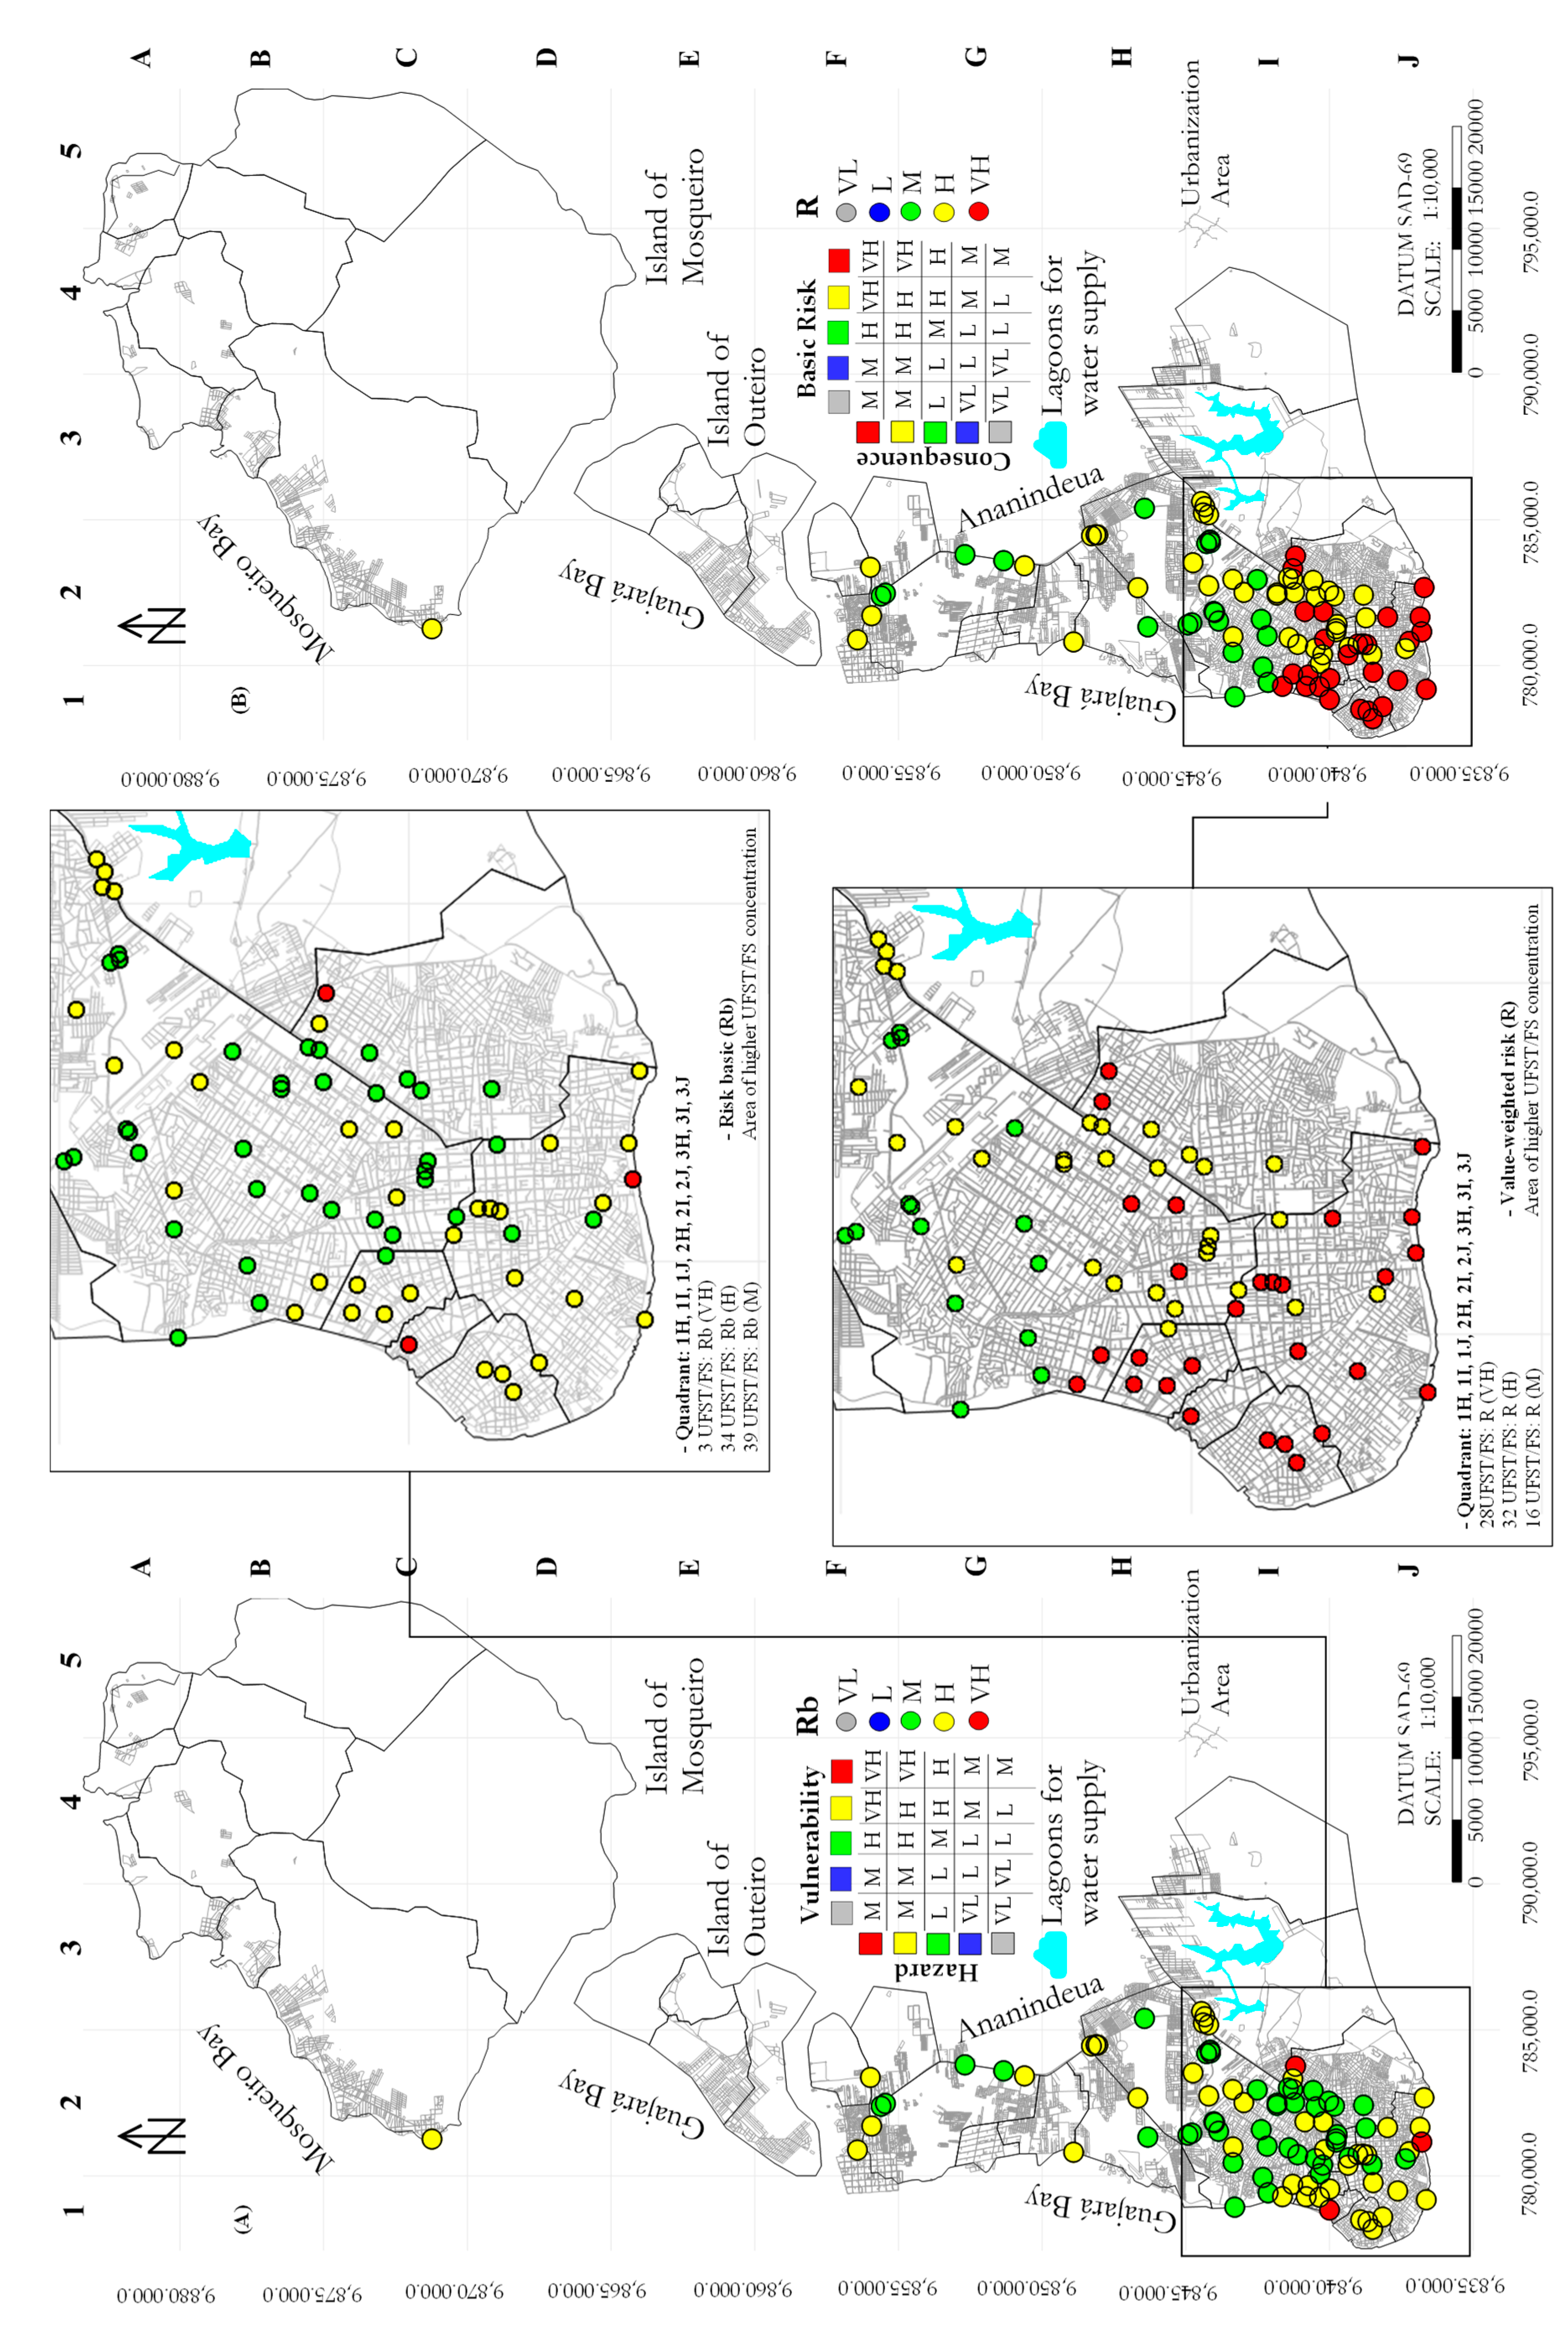
2] suggested a basic risk (Rb) to express it by the following: Rb = Y × H. The “target” is related to the possible consequences of contamination events (socioeconomic and environmental impacts). According to the authors of [2], the consequence of contamination (C) is associated with the product of the groundwater reserve (G) and the quality (Q) of the groundwater (i.e., C = G × Q). Thus, a type of risk known as the value-weighted risk (R) is calculated by the following equation: R = Rb × C.
However, the commonly used methods to evaluate intrinsic vulnerability, to quantify the hazard degree of a contamination source, to classify the quality, and to estimate the use of groundwater reserves are subjective (shallow or deeper aquifers). Additionally, the lack of available geological, hydro-geochemical, and hydro-geological data is a source of uncertainty that can lead to errors in risks assessments. Therefore, proposing a risk model that can handle these limitations, that is, the subjectivities and uncertainties, is valuable for risk assessment.

1.1. Theoretical Background and Limitations

1.1.1. To Assessment Intrinsic Vulnerability

The typical way of assessing vulnerability involves methods structured by a Y-index, which results in the association of input data (X) (x1, x2, ...xi), that is, of hydrogeological parameters. In general, this format imposes subjectivity on the methods, denoting them as conceptual (usual methods seek a simplified interpretation to explain complex interactions that occur in a simultaneous and systemic manner, such as vertical water flow phenomena and contaminant transport, as well as biophysical, chemical, and physical processes) and ambiguous (they define the universal set of X-parameters in imprecise terms, which are used to classify the Y-index into specific degrees of vulnerability).
Although recent work has been developed to overcome the assessment vulnerability limitations [3], this subjective, conceptual, and ambiguous nature has been circumvented using “intelligent models”, for example, the application of fuzzy models. The works of [4,5,6,7] applied a multi-criteria fuzzy model to assess vulnerability based on the X-parameters of the DRASTIC method [8]. Other works [9,10,11,12,13,14] proposed a fuzzy inference system (FIS) that permits systematic and simultaneous interactions of X-parameters to evaluate the Y-index.
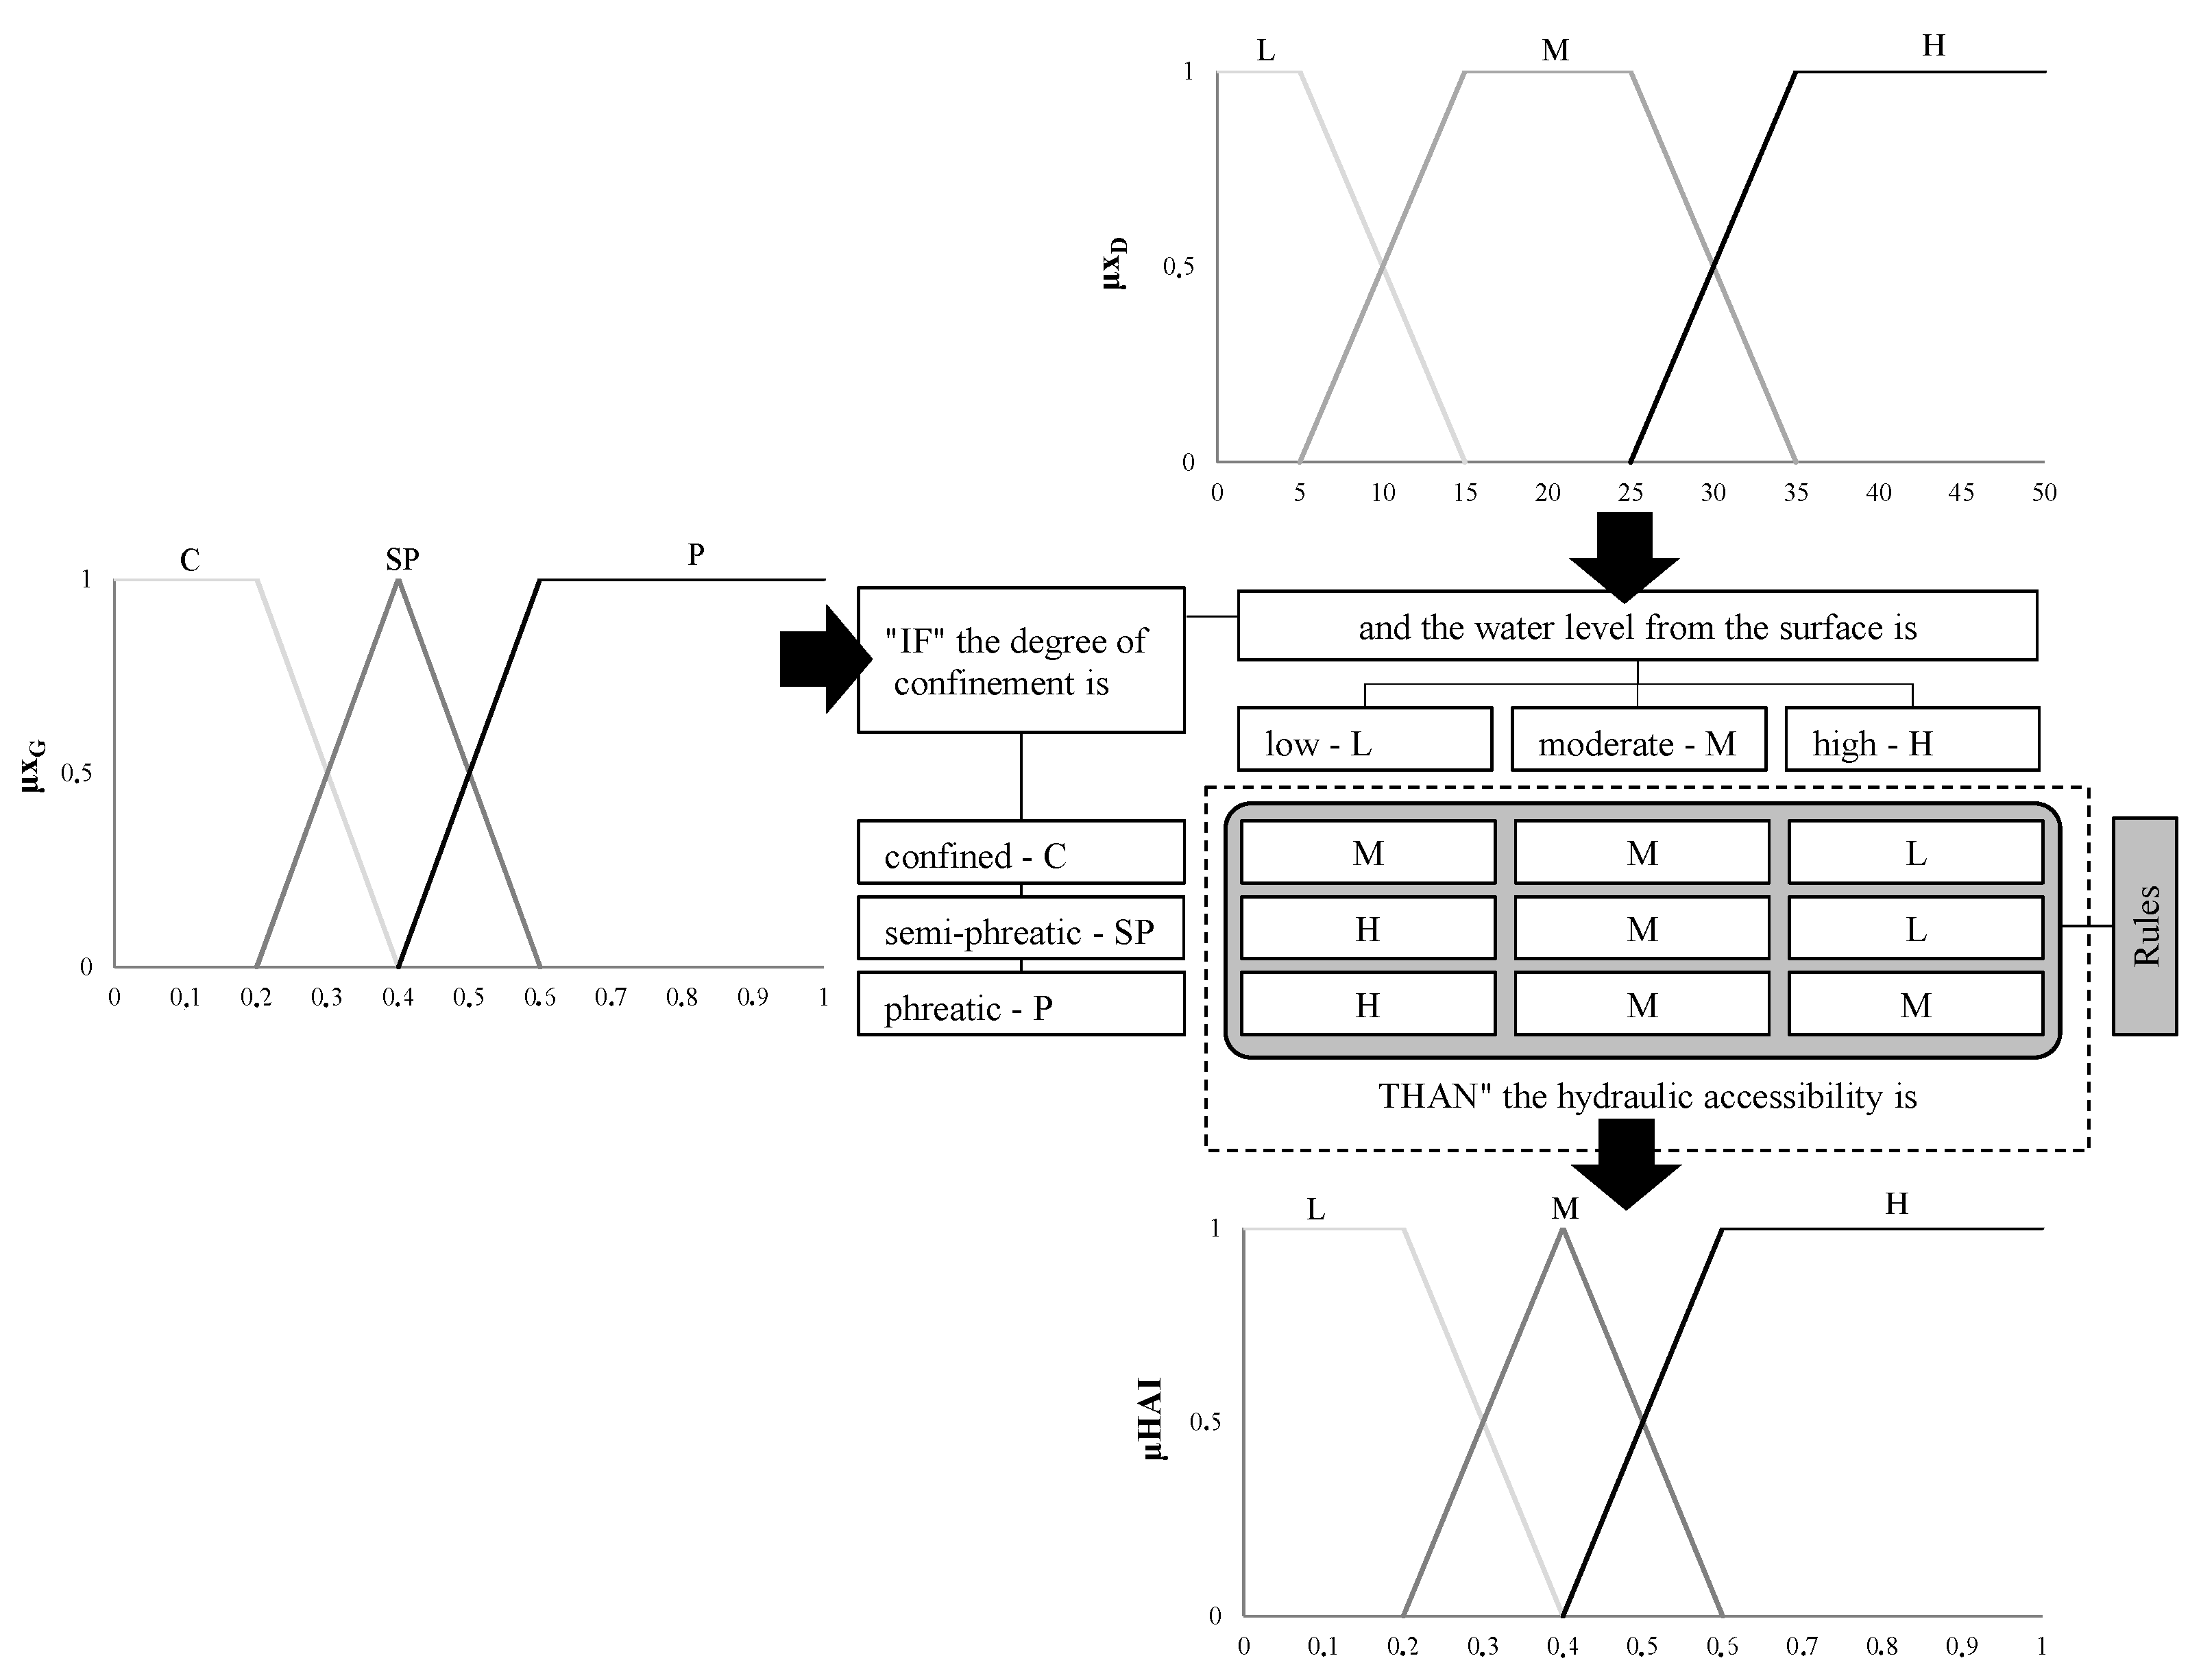
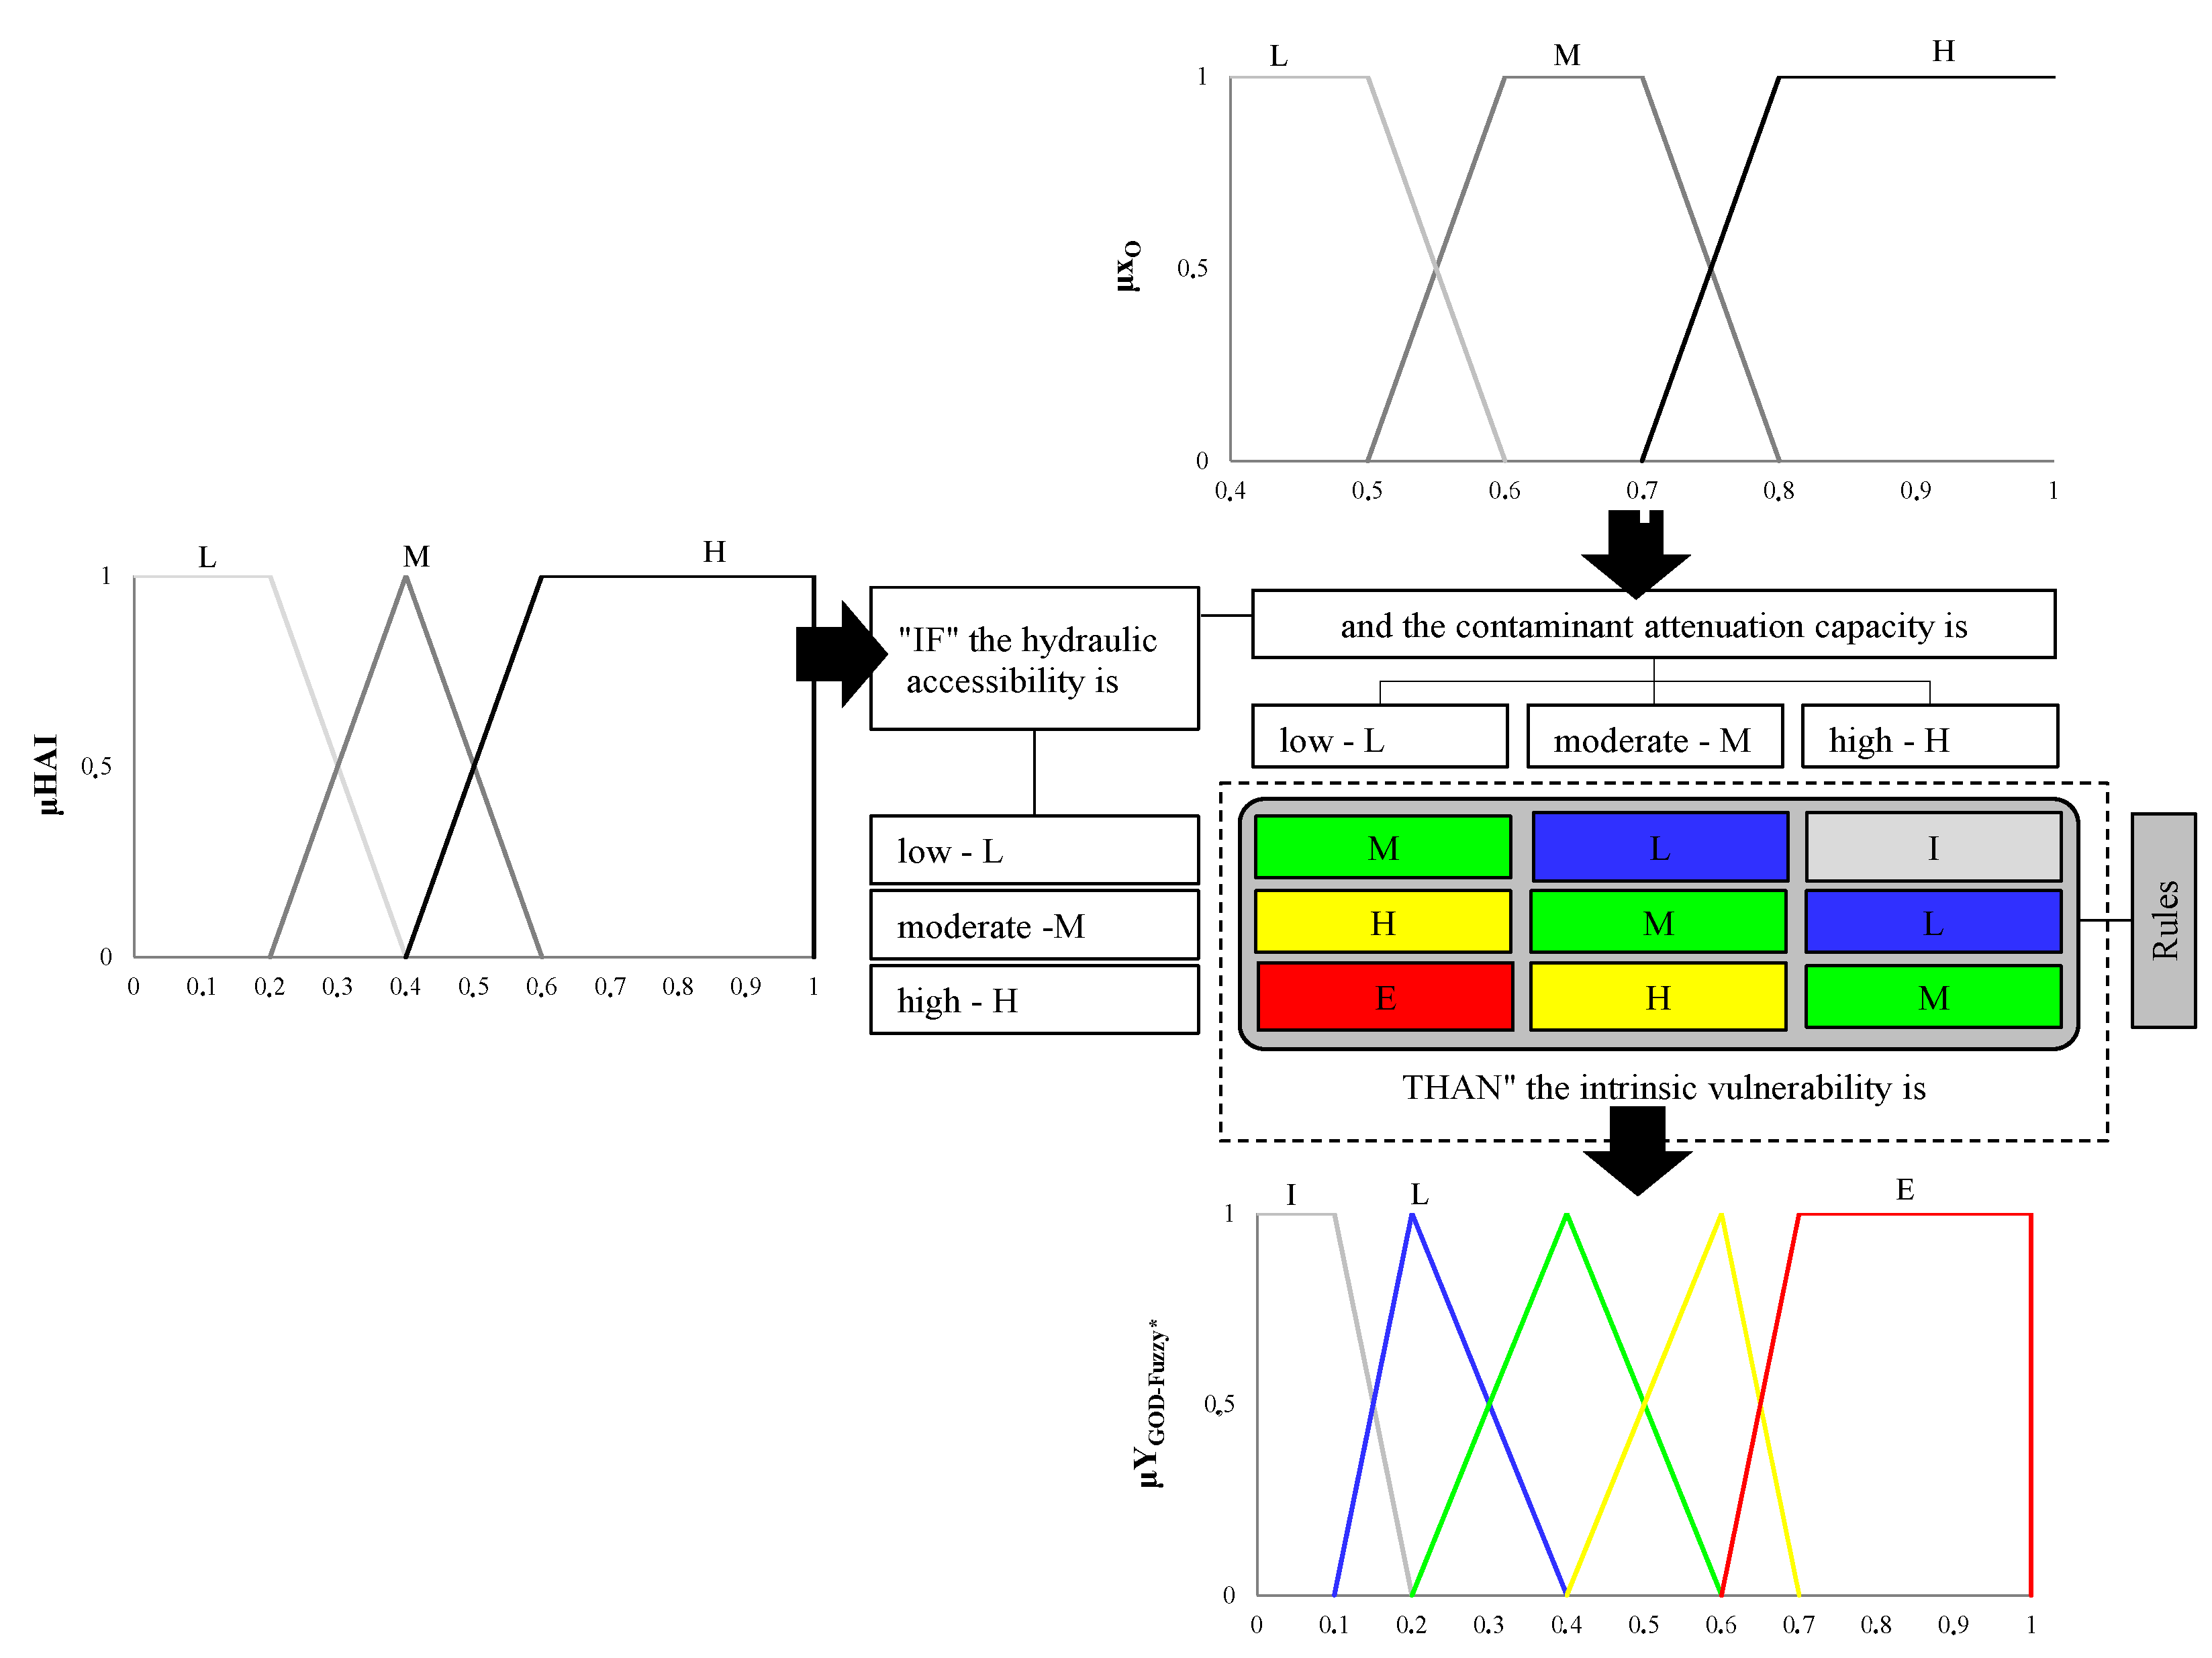
Constructing an FIS requires the following three steps: “fuzzification”, inference, and “defuzzification”. The “fuzzification” is defined by attributing linguistic variables to the X-parameters and to the Y-index and by selecting a type of membership function (mf). Although this function can assume many different forms, the usual forms are triangular (mftri), trapezoidal (mftrap), and gaussian functions (mfgau). In the inference, all the applications of one type of FIS to assess the intrinsic vulnerability follow the Mamdani model [15], as they do in the “defuzzification” using the centroid method [16]. The FIS was not validated, nor were the performances measured in studies that apply a fuzzy model to assess vulnerability. In these studies, the FIS was only compared to the base-method.

1.1.2. Assessment of the Hazard Degree from Contamination Sources

It is necessary to identify the polluting agents and quantify the contaminant loads. This identification refers to the registration of sources [17,18]. The pollutant origin and its surcharge hydraulically (POSH) method, which classifies sources into levels of contaminant load generation, was proposed [19]. This approach considers the type of activity, contaminant-generating capacity, and associated hydraulic head. Recently, some studies proposed hazard indices (H), a function of the physico-chemical properties of contaminants [1,2,20,21,22]. In general, the studies reviewed that classify the hazard degree are based on the importance of the relationship among physico-chemical properties. Thus, they represent a pattern framing issue with an approach by the multi-criteria method, the objective of which is to classify the hazard degree. However, limitations include the operational difficulty of inserting n-properties and weighting these properties to quantify the hazard degree.

1.1.3. Assessment of the Natural Groundwater Quality

The Piper diagram is one of the methods proposed to assess the groundwater quality. The Piper diagram is used for the initial hydro-chemical analysis. Diagrams such as the U.S. Salinity Laboratory diagram and the Schoeller–Berkalof diagram classify water quality for use in agriculture or for human consumption, respectively. However, these diagrams do not synthesize information about the water quality and do not find organics or special contaminations as indices.
Thus, the works of [23,24,25] developed methods capable of classifying the groundwater quality with a Q-index using subjective, conceptual, and ambiguous formulations (the same is justified about limitations of the Y-index). An FIS may be used to overcome these limitations. Indices are used to classify water quality standards, the parameter weighting of which can be associated with the final intended use (e.g., potable or non-potable water). Thus, adopting a multi-criteria model that manages, in addition to the mentioned limitations, a judgment on the importance between parameters for multiple water use purposes is an asset during this process.

1.1.4. Estimation of the Groundwater Reserves

Although recent work has developed a stochastic assessment of nonpoint source contamination [26], a similar method was not applied to estimate the probability of use of groundwater reserves. In turn, the various forms of deterministic calculations of the groundwater reserves (G), the sum of permanent reserves (GP), and regulating reserves (GR) [27,28] consist of variables with large variability. The authors of [29] adopted average values for the saturated thickness of aquifers (b), effective porosity (ηe), area of occurrence (A), and water level variation (Δh) (during the dry and rainy season), which denote uncertainties that can be overcome using a probabilistic approach.
The probability that the GP reserve will be used can be estimated with the safe use of the GR reserve (and vice-versa). The objective of this study is thus to propose an fuzzy-probabilistic modelling approach for groundwater contamination risk assessment (FPM-risk) for groundwater contamination assessment, and its methodology is described and prescribed below. Its application was conditioned by strategies for the acquisition, identification, and cataloging of geological and hydrogeological data, source characteristics, water physicochemical parameters, and the physical variables of the shallow aquifer.

2. Proposed Modeling

2.1. FIS for Assessing the Intrinsic Vulnerability

The vulnerability assessment relied on the proposed implementation of a type of FIS, which uses the Fuzzy Logic Toolbox from Matlab® (version R2020a, development by MathWorks, Inc., Natick, MA, USA). For this purpose, the GOD-based method was used to obtain YGOD [30]—an index that refers to the acronym of the GOD method; that is, groundwater hydraulic confinement, overlaying strata, and depth to groundwater table—YGOD = (xG) × (xO) × (xD), which classifies intrinsic vulnerability as insignificant (I), low (L), moderate (M), high (H), or extreme (E). The GOD method was utilized because it does not demand a significant parameter number and could used in a sedimentary aquifer.
The proposal to use an FIS to build the GOD-fuzzy model considered the following two principles: the hydraulic inaccessibility and contaminant attenuation capacity of the strata overlaying the vadose zone of the aquifer, which are associated with the aquifer lithology. Therefore, the parameters xG, xO, and xD and YGOD were fuzzily. Thus, through the interaction among the degree of confinement (xG) and the distance of the water level from the surface (xD), the hydraulic accessibility index (HAI) was obtained and qualified in degrees as L, M, or H (Figure 1).
The fuzzification of vulnerability, xG, xO, xD, HAI, and YGOD-Fuzzy* is illustrated in Figure 1 and Figure 2. The inference is processed by the Mamdani model, which is driven by the interaction among the xi parameters and activated by rules. The number of rules is equal to the number of linguistic variables raised to the number of X-parameters [12]. Thus, there are nine rules that express the premise among xG and xD and the consequence of the HAI (e.g., Rule: “IF” the degree of confined is “Confined”, and the water level from the surface is “L”, “THAN” the hydraulic accessibility is “M”).
The fuzzy index of intrinsic vulnerability (YGOD-Fuzzy*) is obtained through the interaction among the lithology (xO) and HAI (Figure 2).
There are nine rules to define the relationships among xO and HAI, resulting in YGOD-Fuzzy* (e.g., Rule: “IF” the hydraulic accessibility is “L”, and the contaminant attenuation capacity is “L”, “THAN” the intrinsic vulnerability is “M”). The defuzzification is processed using the centroid method, by calculating the HAI and YGOD-Fuzzy*.
The application of the FIS is preceded by a performance analysis and subsequent validation. The performance of the GOD-fuzzy model is analyzed via error minimization. Therefore, the lower the relative errors, the better the performance of the GOD-fuzzy model, which is calculated as follows:
R E = 1 N i = 1 N | Y GOD Y GOD Fuzzy * | m á x ( Y GOD , Y GOD Fuzzy * ) × 100 ,
where RE refers to the relative error (%), “N” is the number of data points, YGOD is the output value of the GOD method, and YGOD-Fuzzy* is the output value of the FIS.
The GOD-fuzzy model has better performance when used to classify a larger degree of vulnerability relative to the GOD-based method. Thus, more preventative interpretations of vulnerability by the FIS are suggested. The GOD-fuzzy model is validated by inserting samples of the primary contaminant tracer from a contamination source on the vulnerability map. If the samples indicate higher-than-normal values and are in areas in which the degree of vulnerability does not correspond to these values, the rules of the FIS are adjusted. The vulnerability map is produced by the spatial interpolation of the YGOD-Fuzzy* index.

2.2. Fuzzy-Analytic Hierarchy Process (AHP) Model to Assess Hazard and Classify the Groundwater Quality

2.2.1. Hazard Pattern Definitions

The contamination sources considered here are fuel stations (FS), which handle and store BTEX (benzene—boluene—ethylbenzene—xylene), benzo(a)pyrene, and naphthalene compounds. Therefore, this source fits into five hazard classes (very low “VL”, low “L”, moderate “M”, high “H”, and very high “VH”). The classes are functions of the five criteria associated with the physico-chemical properties of the contaminant, including its toxicity (p1), mobility (p2), degradability (p3), solubility (p4), and contaminant volume (p5).
  • p1: refers to the adverse effects of the interaction of the chemicals with the human body. Therefore, the lower the permitted concentration in potable water, the more toxic the action of the compound. It is expressed in mg/L.
  • p2: quantified by the water-octanol partition coefficient (KOC) and associated with the mobility of a given compound and its displacement in the direction of the aquifer. Therefore, the lower log(KOC), the more recalcitrant the compound tends to be, that is, there will be negligible adsorption to soils and sediments and rapid migration to groundwater.
  • p3: an index produced using the EPI Suite™ (Estimation Program Interface) application, which was developed by the authors of [31]. The lower the index, the greater the resistance of the compound to chemical and biochemical degradation.
  • p4: associated with the saturated concentration of a compound in water, conditioned to a given temperature and pressure, and inversely proportional to the KOC. Thus, p4 indicates that compounds with elevated solubility are more susceptible to biodegradation and negligible sorption by soils and sediments, and rapid migration potential to groundwater.
  • p5: refers to the amount of contaminant stored by the underground fuel storage tank (UFST). The authors of [32] indicated that an UFST has a capacity of 15 m³/fuel station (FS).
Thus, to define the p1, p2, p3, and p4 standards, the compounds most frequently used in the FS are considered by using the prescription referred to in [2], and they are expressed in Table 1. Using Table 1, an apparent hazard pattern matrix was developed (Table 2).
However, some contaminants are of greater importance in defining the value of pn-properties. Thus, the average weighted value for each pn (pn(m)) is calculated, referring to the main contaminants of the FS activity. The weights are obtained using an AHP method (analytic hierarchy process) [33]. The Appendix A shows the acquisition of the referenced weights. The value of pn(m) is thus determined (product of wc—the weight of contaminant c, and the value of pn).
p n ( m ) = i = 1 m w c p n .
Using this procedure, it is possible, for example, to define that compounds such as BP and B are most important for the value p1, because they are more toxic than the other compounds.

2.2.2. Natural Groundwater Quality Pattern Definitions

To classify the groundwater quality within various types of hydrogeological domains (sedimentary, metasedimentary, karst, and crystalline types), the base method proposed in [24] was used. This method weighs the use of the pH (q1), chloride (q2), total residuals (q3), hardness (q4), nitrate (q5), and fluorine (q6) parameters, evaluating the water quality using a Q-index, which is qualified by degrees. These degrees are optimal “Op” (80 < Q ≤ 100), good “Go” (52 < Q ≤ 79), acceptable “Ac” (37 < Q ≤ 51), and unfit “Un” (0 ≤ Q ≤ 36). This base method is restricted to classifying the natural quality of groundwater for human consumption. However, classifying the groundwater quality is considered a multi-criteria pattern classification problem, and the weighting of parameters is an important issue, even during the definition of the water use type. For potable purposes, the weighting of qn-parameters is preceded by a qualitative analysis, related to the natural origins of the impurities that can place the potability of groundwater at risk and contribute to the emergence of illnesses as follows:
  • q1: at pH~5.5, meteoric water interacts with iron sulfides in mining areas, and its acidity increases. More acidic waters attack most rocks and minerals, increasing the percentage of heavy metals with toxic potential in solution and creating toxic conditions [34].
  • q2: during water treatment by chlorination and depending on the water quality, potentially carcinogenic chloride can be formed. The World Health Organization (WHO) recommends chloride concentrations of <250 mg/L.
  • q3: to classify the natural groundwater quality, a weight is conferred that is also referenced in the proposal in [35].
  • q4: when ingesting hard and very hard waters, renal and cardiovascular diseases can develop [34]. CaCO3 concentrations <50 mg/L are soft, 50 to 100 mg/L are slightly hard, 100 to 200 mg/L are hard, and >200 mg/L are very hard.
  • q5: although NO3- at low concentrations is slightly toxic to humans, this substance can be reduced in the body (the stomach, intestines, or liver) into nitrite ions (NO2), causing the emergence of illnesses. In addition to methemoglobinemia, the authors of [34] noted that NO2 in the human body can react with amine substances, resulting in nitrosamine (carcinogenic agent). The maximum permitted concentration of nitrogen-nitrate (N-NO3) in groundwater for human consumption was set by the WHO at ≤50 mg of N-NO3/L.
  • q6: fluorine concentrations >1.5 mg/L can cause dental fluorosis. Concentrations of ≥0.5 mg/L to ≤1.5 mg/L act as a natural tooth protectant, aiding in the avoidance of cavities. Concentrations of ≥4 mg/L can cause skeletal fluorosis (pains in the back and neck bones). Concentrations of >10 mg/L are associated with the appearance of deforming fluorosis, which causes bone hyperdensity, leading to disability, and excessive doses can lead to death [34].
Thus, as a function of these qualitative analyses, q5, q2, q6, q1, q4, and q3 make up the hierarchy of parameters for classifying the natural quality of groundwater for potable uses, as evaluated by AHP (Appendix A). Thus, a multi-criteria model is structured when defining the parameters (criteria) and water uses (alternatives). Therefore, a multi-criteria fuzzy model is adopted for pattern recognition [36]. Initially, the relative pattern matrix is defined with regard to the potable water uses, which is conceived as a function of qn-parameter. It is categorized by four “h” classes relative to the degrees: 4 “Op”, 3 “Go”, 2 “Ac”, or 1 “Un”. Thus, the Zq matrix is defined, and its terms are zqn,h (Table 3).
The patterns indicated by the Brazilian Ministry of Health, U.S. EPA (United State of Environmental Protection Agency), National Council on the Environment (Conselho Nacional do Meio Ambiente—CONAMA), and World Health Organization (WHO) for determining the natural water quality were used. For values below the maximum permitted values, the designations “Op” and “Go” are given. For values equal to the maximum permitted, “Ac” is given, and those above the permitted maximum are designated “Un”.

2.2.3. Fuzzy-AHP Multi-Criteria Model for Recognizing Patterns

The multi-criteria model for recognizing the fuzzy patterns proposed in [36] was used to fit the dataset to the previously established hazard degree and groundwater quality patterns. Both the data and the patterns must be placed in matrices. Therefore, the number of contaminating sources, associated pn, and water samples related to qn must be fit to the patterns defined by the matrices Zp (Table 2) and Zq (Table 3).
To perform the fitting, the terms of the data matrixes Xp and Xq, and xp,j and xq,j, respectively, must be made uniform by normalization or harmonization, thus becoming xp,j’ and xq,j’, respectively. When the hazard and quality increase with increases in p and q, the normalization proceeds and harmonization decreases. This process proceeds in the same manner with the terms of the pattern matrices zp,h and zq,h. Thus, if zp,h’ and zq,h’ are equal to 1, a source or water sample belongs completely to class h, while if zp,h’ and zq,h’ are equal to 0, it is completely outside of class h.
The recognition model assumes the degree of belonging of each sample j to class h, considering a matrix U whose terms are designated by uh,j. To classify the hazard degree or the water quality, the value of h can be 1–5 or 1–4, considering the existence of five and four h-classes, respectively. The authors of [36] stated that, according to the fuzzy sets theory ([37]), U is subject to the following restriction:
h = 1 h u h , j = 1   .
Given this restriction, pn and qn are important for classifying their respective degrees. The fuzzy pattern recognition model considers a distance that separates j from its degree h equal to the following:
d h , j = { ( p , q ) = 1 ( p , q ) [ w ( p , q ) ( x ( p , q ) , j ' z ( p , q ) , h ' ) ] 2 } 1 / 2   ,
in which w(p,q) is the weight of wpn and wqn that influences the hazard assessment and water quality classification, respectively. The attribution of weights was measured by AHP ([33]) (see Appendix A). After wpn and wqn are defined from the perspective of the fuzzy theory, the term uh,j is considered as a weight for dh,j. Thus, a weighted distance (Dh,j) is defined; it separates j from its class h and is equal to uh,j*dh,j. To solve uh,j, the following objective function must be minimized:
M i n { F ( u h , j ) = h = 1 h D h , j 2 } .
To obtain a Lagrangian function and optimize the classification process by restriction,
L ( u h , j , λ j ) = h = 1 h D h , j 2 λ j ( h = 1 5 u h , j 1 ) ,
in which λj is a Lagrange multiplier. The resolution of the optimal value that fits a source or sample j to the degree of pertinence h by uh,j meets two conditions, namely, (i) ∂L(uh,j,λj)/ ∂L(uh,j) = 0 and (ii) L(uh,jj)/ ∂L(λj) = 0. Using the partial derivatives of the Lagrange function, the pertinence function of uh,j is obtained for class h by using the following:
u h , j = ( d h , j 2 h = 1 h 1 d h , j 2 ) 1 .
Equation (8) is conditioned to dh,j ≠ 0. When dh,j = 0, the j sample belongs to level h, and thus uh,j is equal to 1. However, in using Equation (8), a classification can be performed only by the extremes of the h classes (i.e., the data matrixes Xp’ and Xq’, which could be grouped into two levels of h classes corresponding to the pattern matrices Zp’ and Zq’, that is, uh,j = 0 or uh,j = 1). The data matrices Xp’ or Xq’ can be fit to the interval between 0 and 1, such that they can correspond to the categories of h classes and are associated with their respective values (from category 1 to 5 and from 1 to 4).
Therefore, uh,j*, as terms of the matrix U*, which represents a matrix of pertinence of each sample j belonging to each class h, will vary from 1 to 5 and from 1 to 4. Classification into one of the h categories cannot be effected directly by matrix U*, and thus the uj* terms that are equal to (u1,j, u2,j, u3,j, u4,j, and u5,j) are considered. Therefore, when vector uj* is associated with category h, a hazard index is obtained, Hj(P), as an index of the natural quality of groundwater for potable uses, Hj(Q).
H j ( P , Q ) = ( 1 , 2 , 3 , 4 , 5 ) u j * = h = 1 5 u h , j * h   ,
where Hj(P,Q) refers to the indices Hj(P) and Hj(Q). To classify water quality, h varies from 1 to 4.

2.2.4. Probabilistic Estimate of Groundwater Reserve Use

The total groundwater reserve (G) can be calculated by summing up the GP and GR reserves. The GP reserve corresponds to the volume of groundwater in the saturated zone, which is below the minimum position of the seasonal variation of the aquifer. The GR reserve corresponds to the infiltrated water volume or annual recharging of the aquifers. The estimate for groundwater reserves meeting the demand refers to the probability that the annual consumption for multiple uses is met such that it does not present a risk to the GR reserves, and the GP reserves are conserved. However, the lack of data for calculating the variables that make up the calculation of GP and GR is an aspect that denotes uncertainties.
A strategy that considers the random nature of the variables ηe and Δh is used with the adoption of a probabilistic method. The Monte Carlo simulation (MCS) method requires a random sampling method, in addition to information about the shapes of the frequency distributions of a variable and its statistical attributes (e.g., its mean and standard deviation). Simple random sampling (SRS) is used to simulate ηe and Δh. In this research, 10,000 iterations are considered. The random value is sampled from each distribution of the random variable under study. The probability density function of the regulation of groundwater reserves, f(GR), is determined as follows: (i) generation of pseudo-random numbers for ηe and Δh and (ii) acquisition of f(GR) by the following:
f(GR) = A × f(Δh) × fe).
The term A (area of occurrence of the aquifer) was considered to be a deterministic variable. To generate pseudo-random numbers, the supplement NtRand® was used, which was installed in Microsoft Excel® (version 2016, development by Microsoft Corporation, Redmond, Washington, USA). A conservative concept was adopted in which the annual average GR must be fully exploited, given that part of this reserve must ensure river flows. A number W of inhabitants is considered that requires a quantity of water such that it is possible to estimate the average annual consumption.
If this volume of water is removed from GR (it can be used without harming the aquifer), there is a probability that the exploited volume is less than that required for annual consumption. Therefore, the larger this probability is, the greater the chances are that GR cannot be used safely, thus requiring the use of GP. In these terms, the following was adopted when the probability percentage is as given below:
  • ≤10%: very low probability “VL” of GR being used without the need to use GP.
  • >10% and ≤30%: low probability “L” of GR being used such that part of GP can be used.
  • >30% and ≤50%: moderate probability “M” of GR being used, with partial use of GP.
  • >50% and ≤70%: high probability “H” of GR being used, requiring the use of GP.
  • >70%: very high probability “VH” of GR being used, requiring a large use of GP.

3. Case Study: Belém Urban Zone

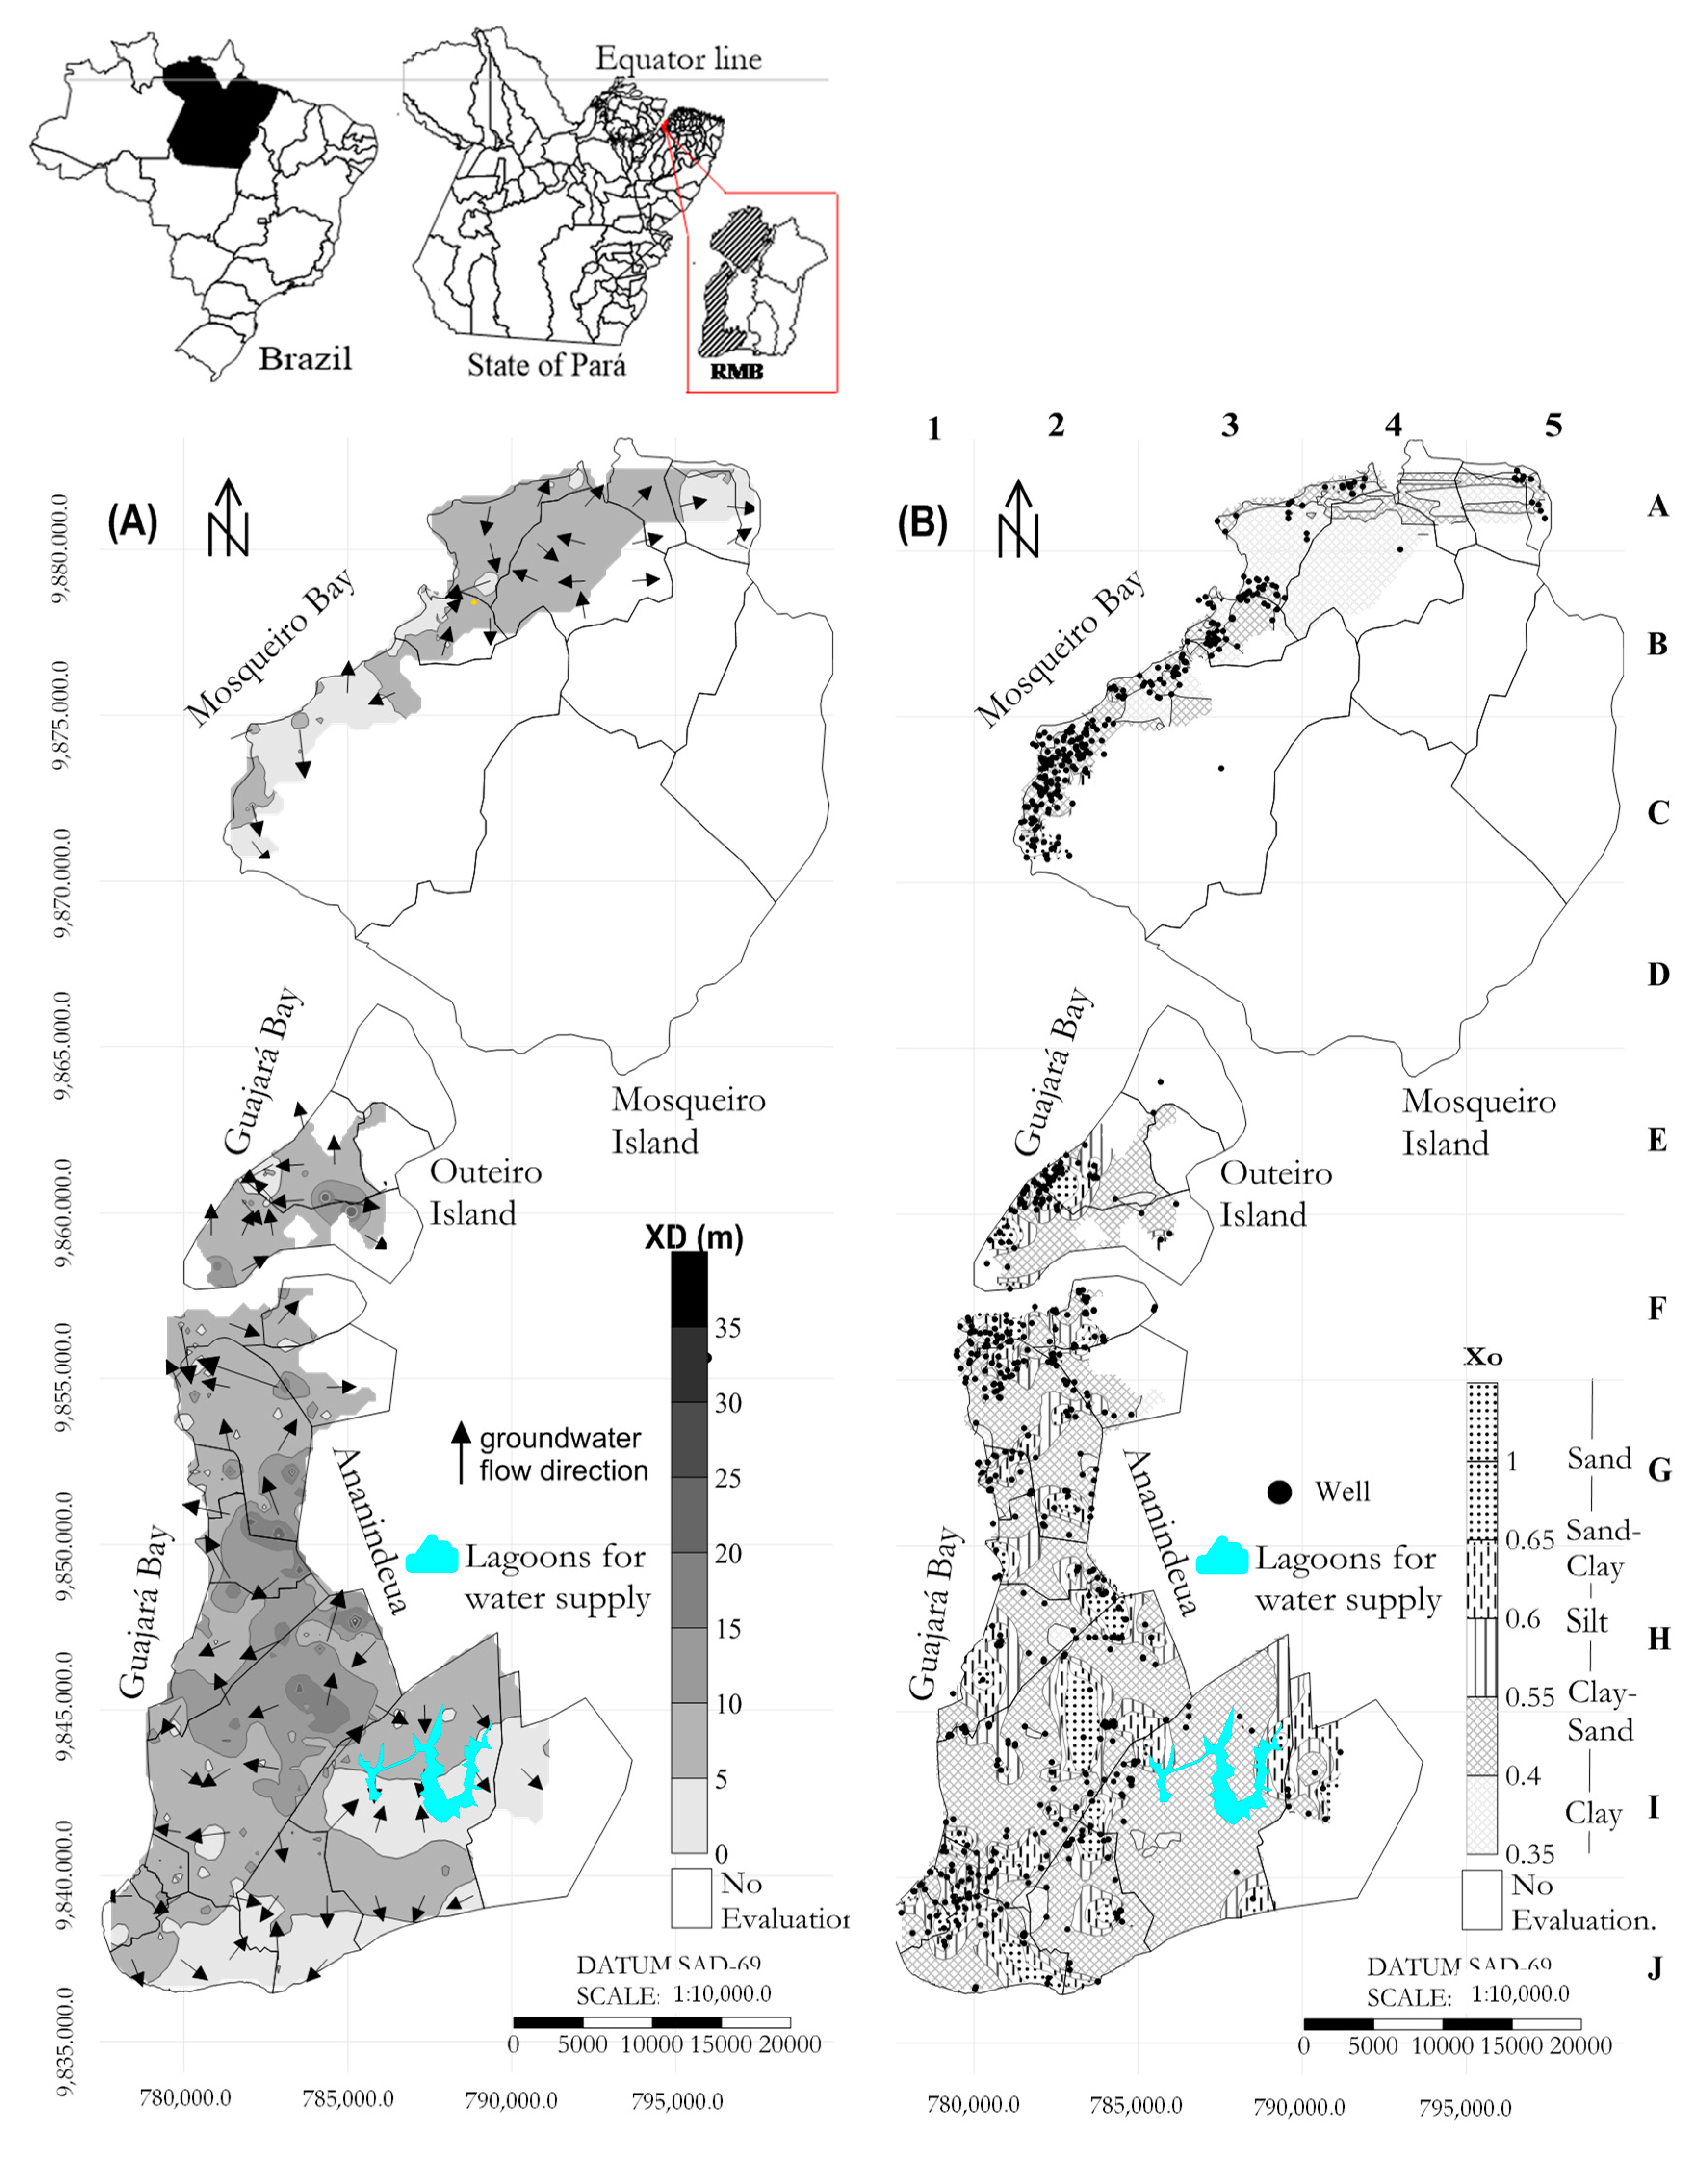
The application of the fuzzy-probabilistic approach was conditioned by data acquisition strategies for a domain that corresponds to the urban zone of Belém city, in the northern region of Brazil, which is an integral part of the metropolitan region of Belém (MRB). In addition to belonging to the hydrogeological province of the Amazon River, which is one of the largest in Brazil with a volume of greater than 30 thousand km³, the selection of this spatial domain is justified by the fact that evidence of hydrocarbon contamination from leaking UFST has been found.
To apply the risk model, the geological and hydrogeological data were initially extracted to evaluate the intrinsic vulnerability. Thus, data were extracted from the Groundwater Information System (Sistema de Informação de Águas Subterrâneas—SIAGAS), which was generated by the Research and Mineral Resources Company (Companhia de Pesquisa e Recursos Minerais—CPRM, Serviço Geológico do Brasil) belonging to the Brazilian Geological Service. A total of 762 data points from wells were catalogued. The information referred to the hydrostatic level and the lithological and construction profiles of the unsaturated zone (to a depth of less than 2 m), the spatial distribution of which is illustrated in Figure 3A,B.
The vulnerability of the referenced urban zone was measured in shallow aquifers in which a large portion of contamination events began in the most superficial layers of the underground environment. The authors of [38,39,40] discussed the hydrogeological aspects of the metropolitan region of Belém (MRB).
In this vulnerable environment, UFST leaks have already occurred. In northern Brazil, there are currently 2798 registered fuel stations. Their average monthly sales volume as recorded through the end of 2013 was greater than 160 m3/station. Data from the National Petroleum, Natural Gas, and Biofuel Agency of Brazil (
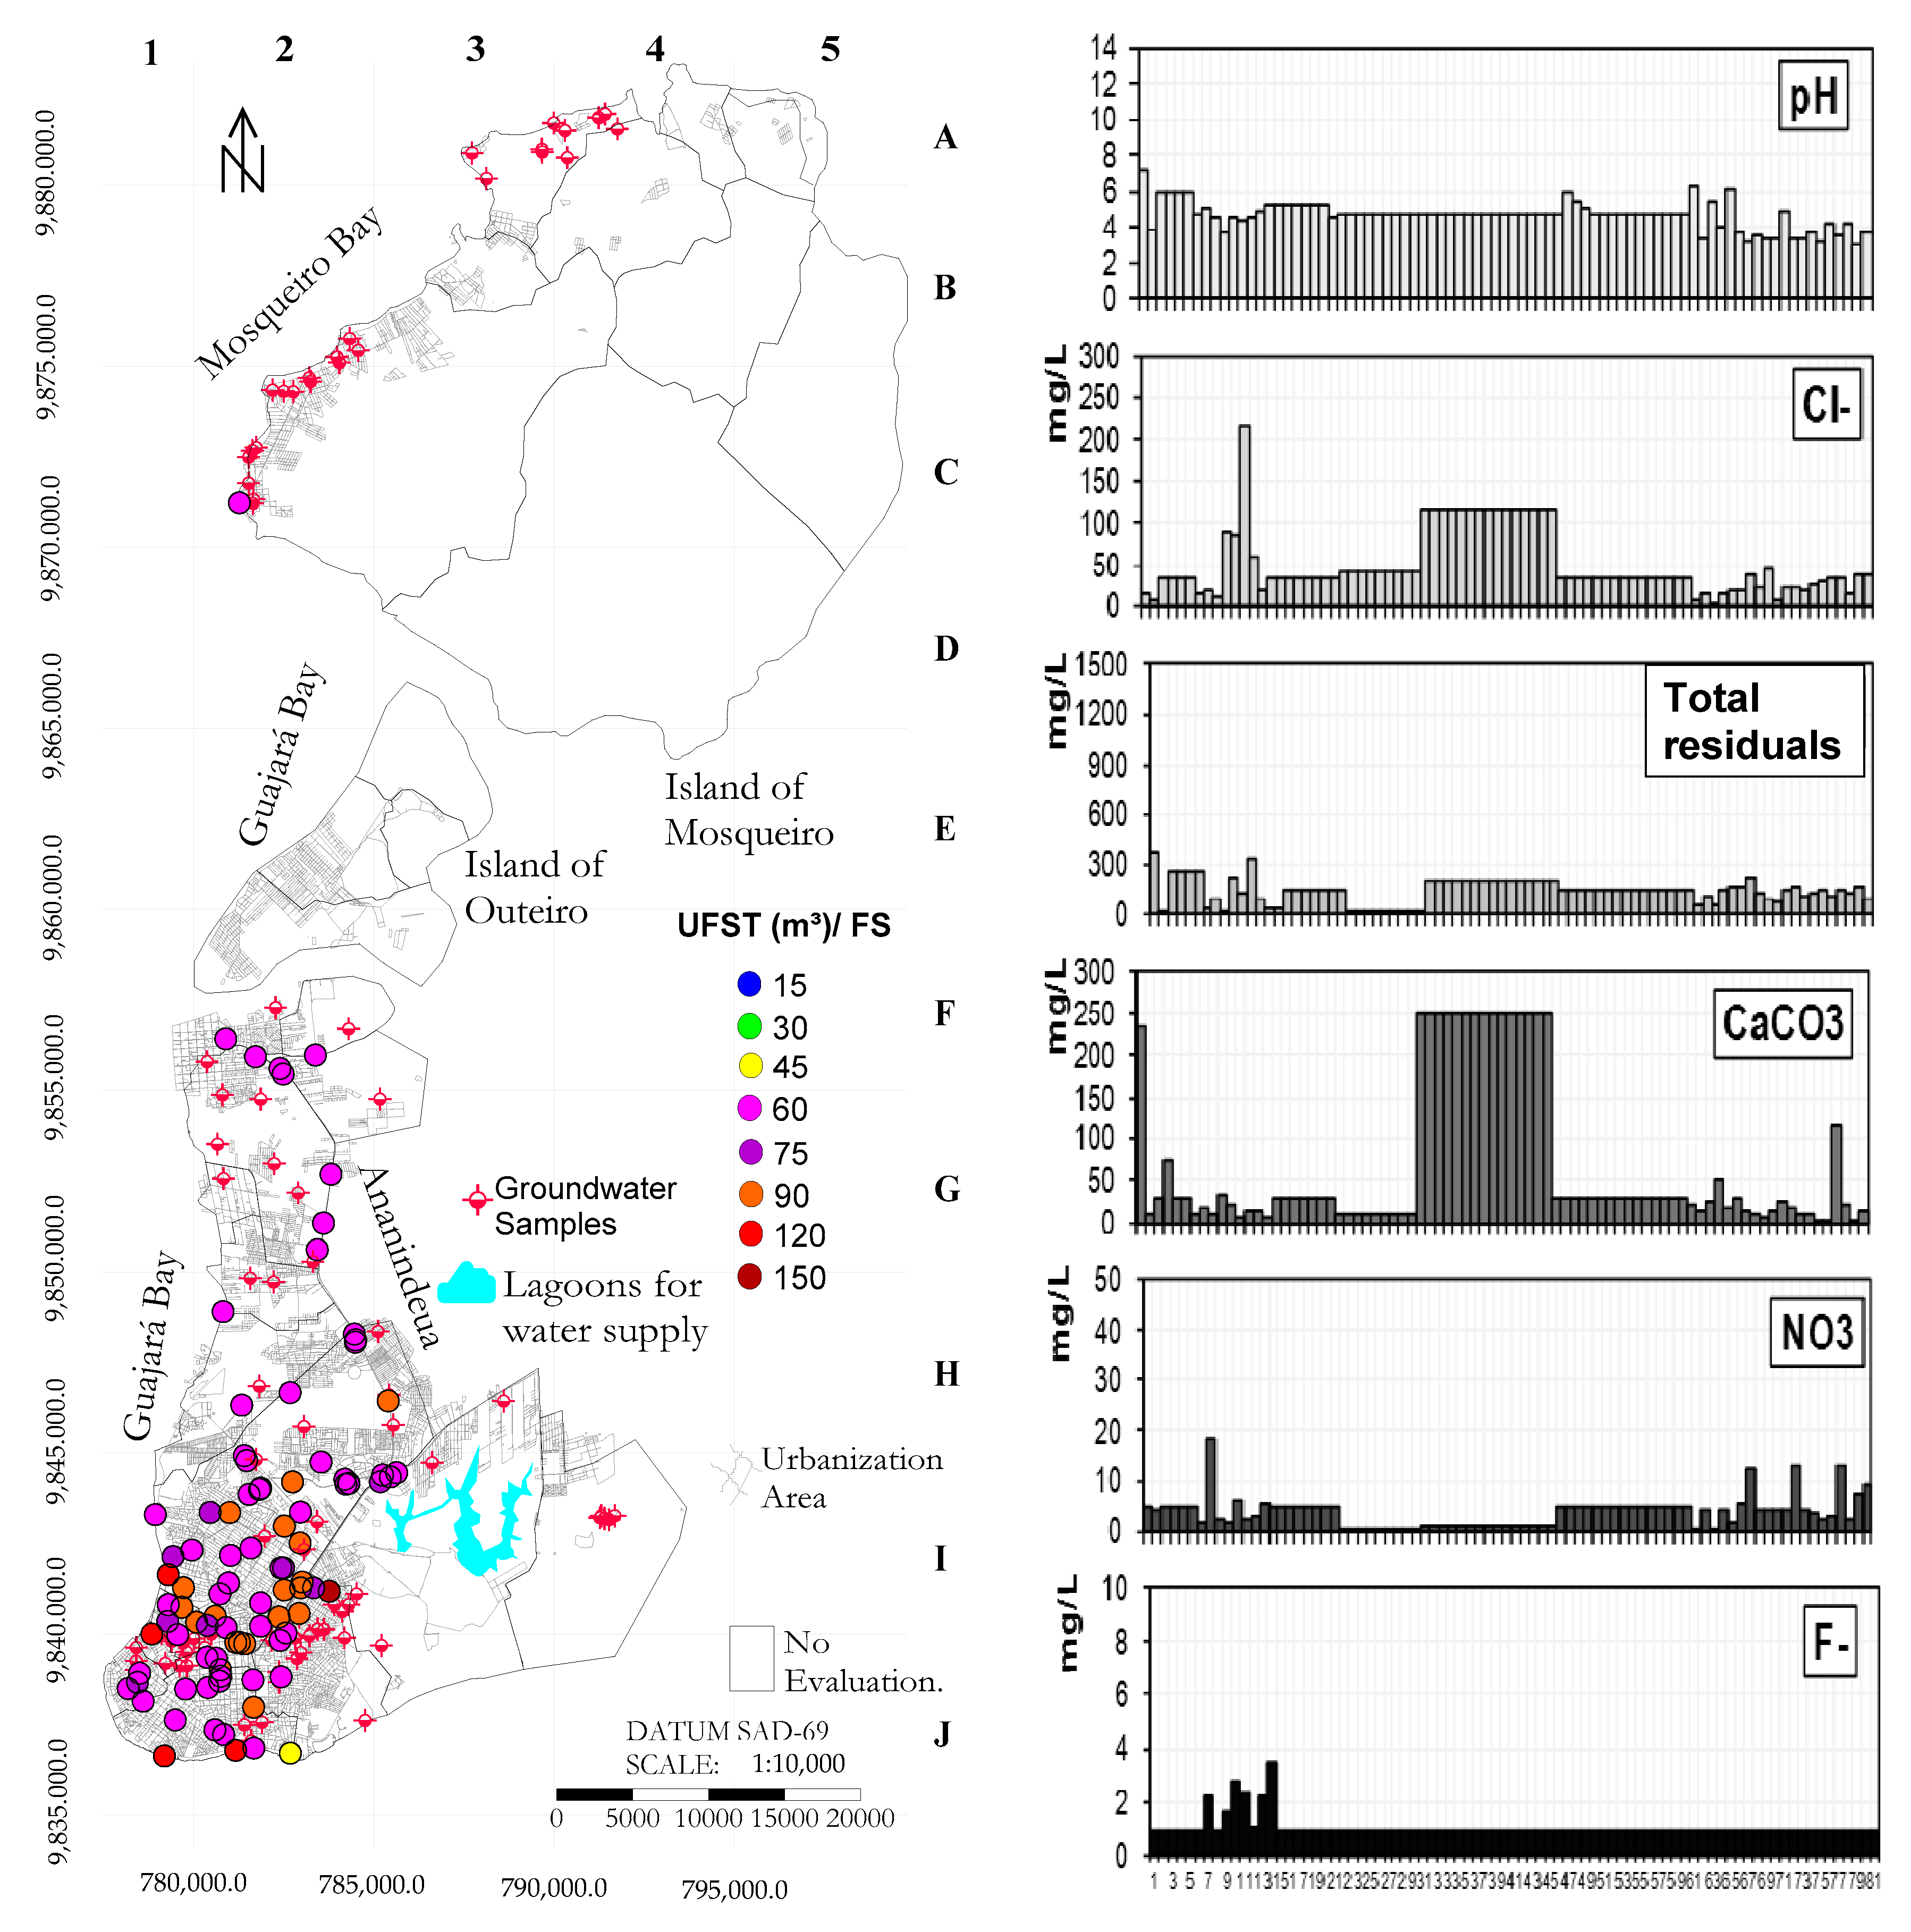
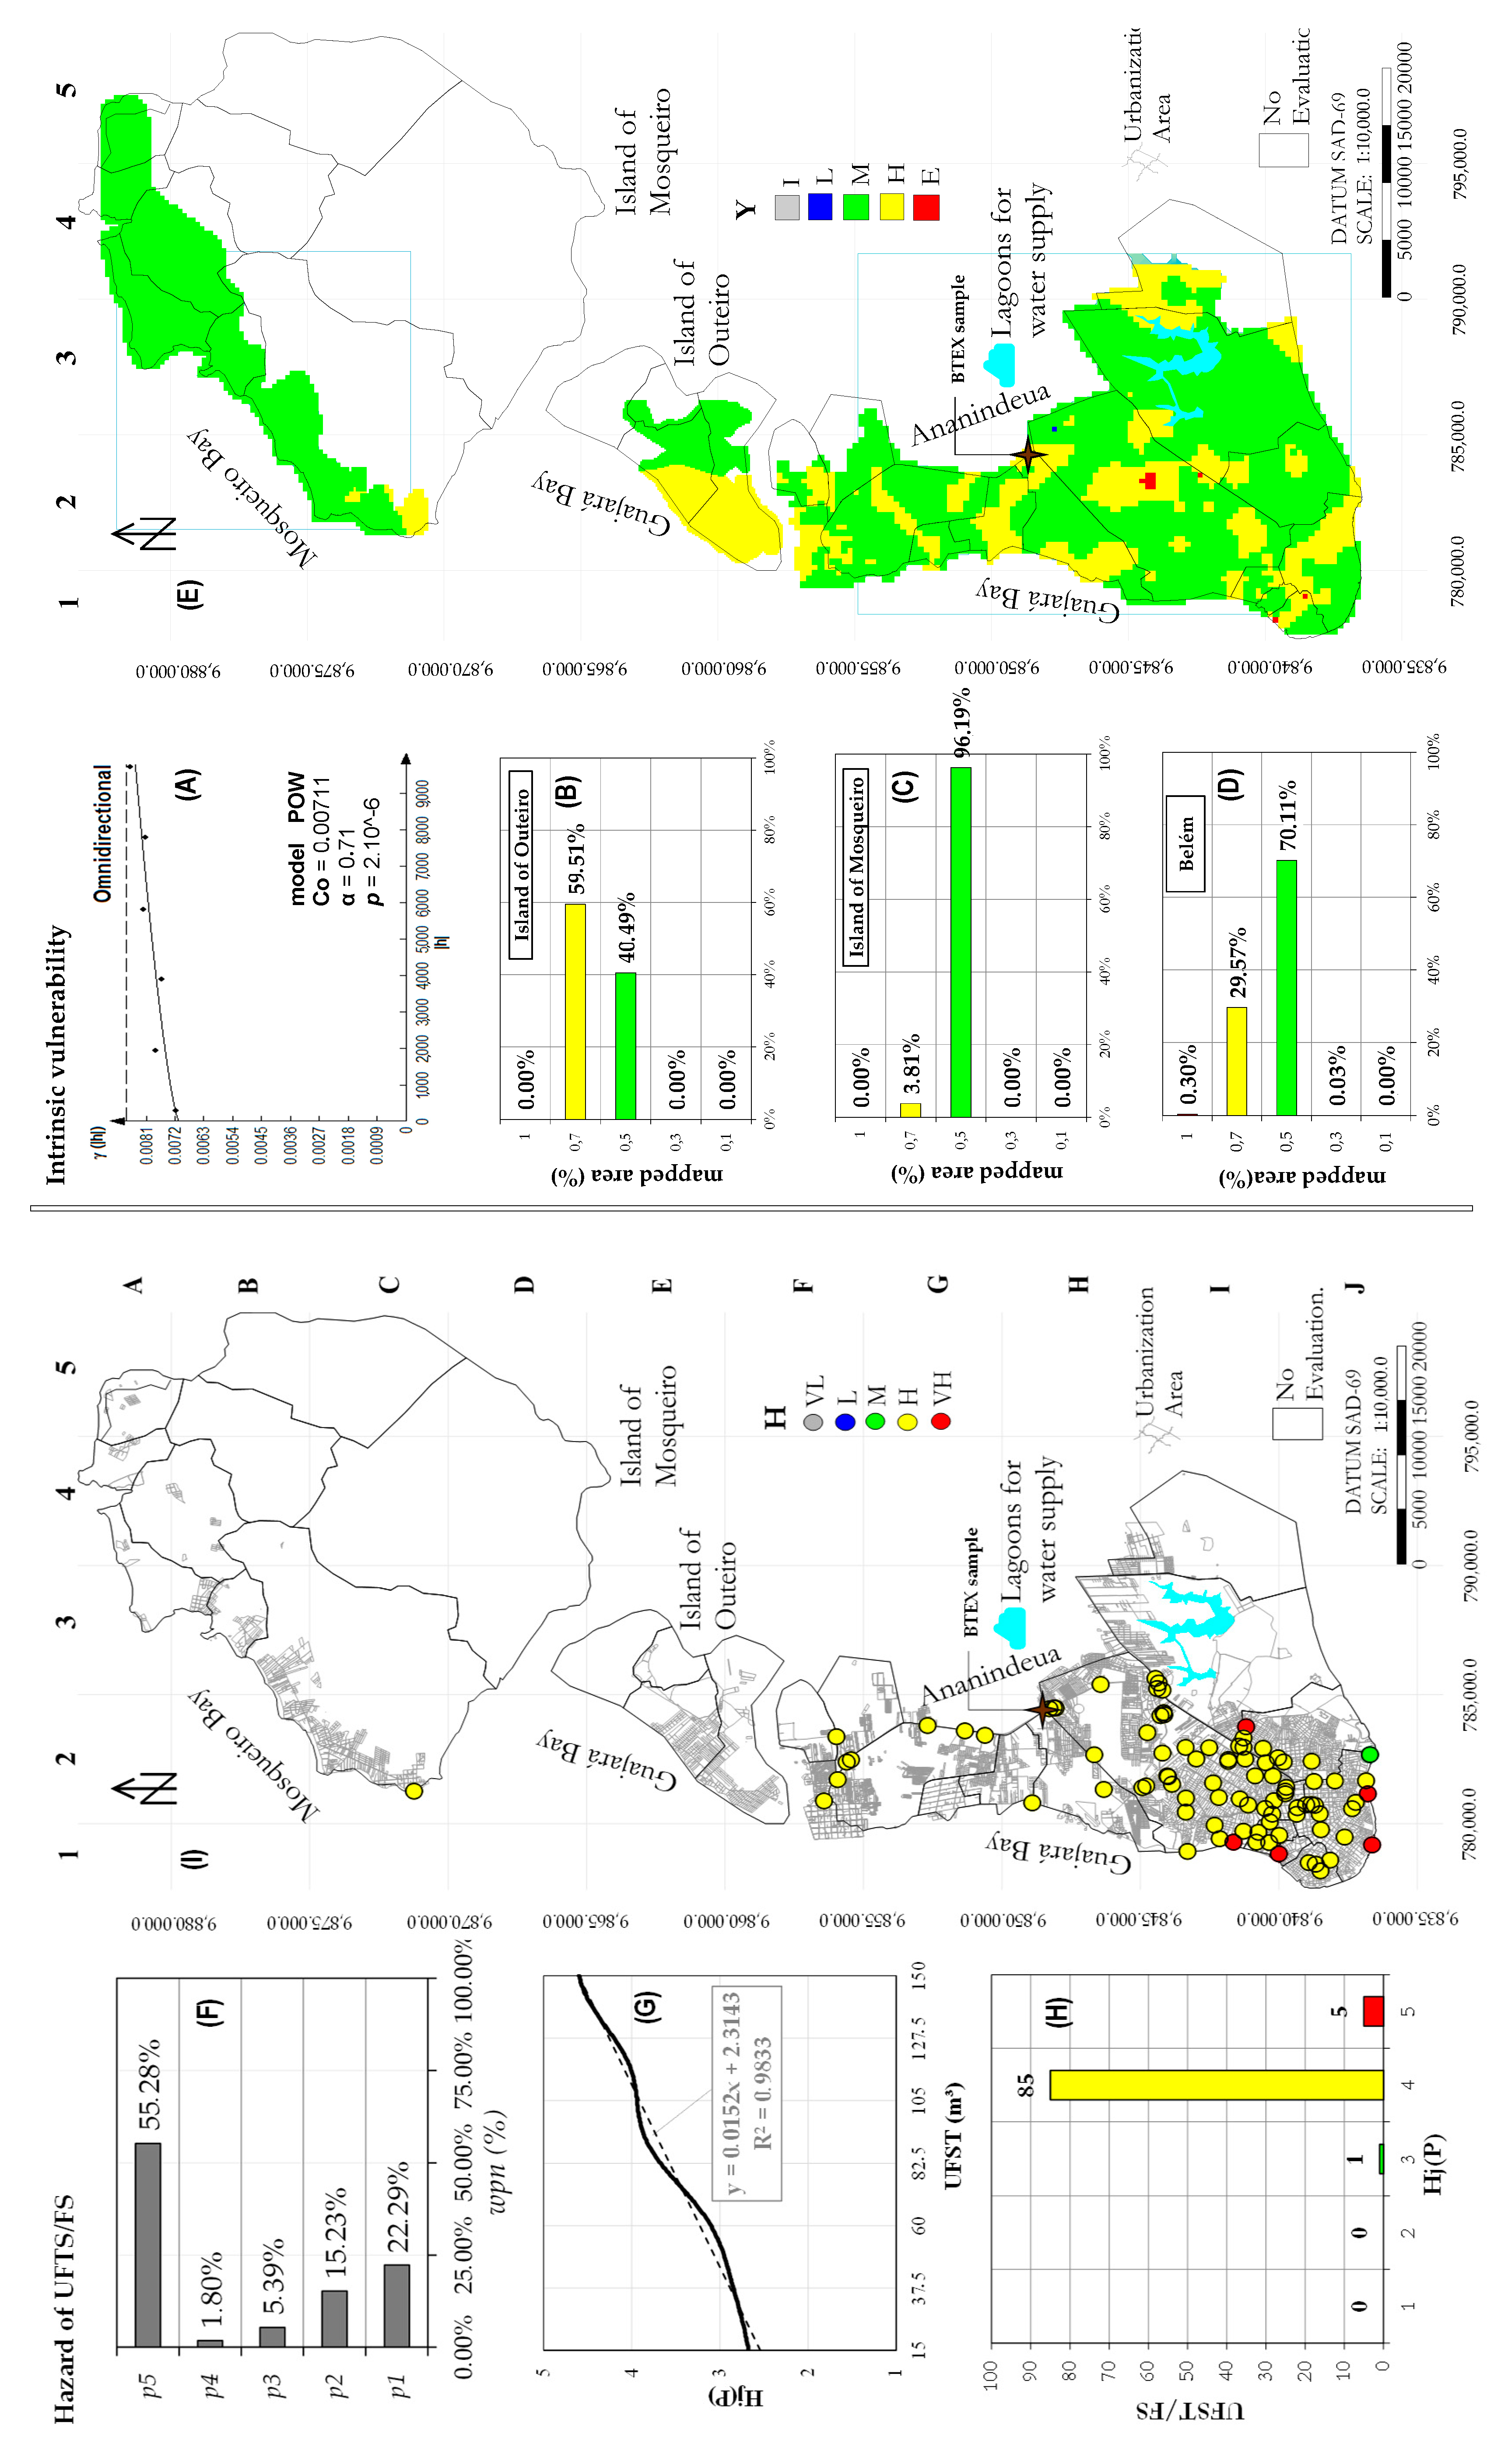
Agência Nacional do Petróleo, Gás Natural e Biocombustível do Brasil—ANP) show that, in the MRB, there are more than 200 registered fuel stations. In the urban zone of the city of Belém and its islands, there were 91 FS, and their storage capacity is illustrated in Figure 4. Volumetric data are available on the ANP platform.
With regard to groundwater quality evaluations, recent studies have restricted the analysis to tracers of anthropogenic contamination (e.g., pH, NO3, and fecal coliforms) [41,42,43]. This information is pertinent because the shallow aquifers are more exposed to contamination than confined aquifers (which are “naturally” protected). However, the natural quality of groundwater evaluated in studies in [44] showed that, in shallow wells (depths ≤ 50 m), the pH varied from 3.4 to 5.2 and directly corresponded to low levels of electrical conductivity, hardness, and bicarbonate alkalinity, classifying them as chlorinated sodium, sulfated calcium, and sodium bicarbonate when using the Piper diagram.
The samples made available by the authors of [44] showed the physicochemical parameters that make up the natural quality analyses of groundwater, which can also be tabulated. In turn, 14 data points were inventoried from water analyses of wells (from shallow aquifer) in the urban and periurban zones of the city of Belém and its islands, extracted from the work of [44]. The authors of [41] analyzed 20 samples from wells, which captured groundwater from the phreatic aquifer, in June 2002.Nevertheless, data from an experimental water sampling campaign were collected from 13 wells in [42] from June 2000 to March 2002, and the average values were used. Data catalogued in [43] were also used, and they were from water collected from 24 wells in the urban and periurban portion of the island of Mosqueiro during two seasons, namely, the dry season in October 2010 and the rainy season in March 2011 (average values were used). Owing to the lack of data from the island of Outeiro, the natural quality of the groundwater there was analyzed as being equal to the portion that corresponds to the urban zone of the island of Mosqueiro. Figure 4 shows all of the sampling used.
The demand for groundwater was characterized in a study conducted by [38], which indicated a water quantity of slightly greater than 430,000 m³/day, of which approximately 20% comes from aquifers (around 86 thousand m³/day). The growing urban demand for treated water for industrial and domestic uses combined with the current inefficiency and insufficiency of the water supply network in the urban and periurban zones of Belém and its islands is reflected in the increased capture of groundwater from phreatic wells. A per capita demand of 200 liters/day was adopted, as projected for the year 2033 [45], considering that 50% of the potable and non-potable demand by the city of Belém comes from wells, that is, for approximately 750,000 inhabitants (the population of the city of Belém is close to 1.5 million inhabitants, according to data in [46]), the daily volume is close to 150,000 m³ (54.75 million m³/year).
The island zones are dependent on capturing groundwater to supply demand for multiple uses. With an estimated population of close to 50,000 inhabitants, the island of Mosqueiro demands a volume of close to 10,000 m³/day (3.65 million m³/year). For the island of Outeiro, with a population of close to 90,000 inhabitants, the daily demand is close to 18,000 m³ (6.57 million m³/year). Therefore, from these annual demands for potable and non-potable uses, the probability that the GR reserve will be used safely is estimated, without the need to use the GP reserve of the confined aquifers.

4. Results and Discussions

4.1. Assessment of Fuzzy Intrinsic Vulnerability

Although the GOD-fuzzy model shows a relative error (RE) of 10.92% compared with the GOD method, the FIS was used to evaluate the intrinsic vulnerability, because the GOD method (i) could lead to vague or diffuse conclusions and (ii) has no alternative to classifying the intrinsic vulnerability in an Aristotelian way, for example, the lithology of the aquifer is either sandy-clay (true) or not (false). These interpretations are not considered by the fuzzy principle model, as the lithology of the aquifer, for example, can be more or less clay-sandy and then become clay, sandy, or even sandy-clayey. Thus, using a non-fuzzy approach could compromise the assessment of the aquifer intrinsic vulnerability. Therefore, an interpolation of the YGOD-Fuzzy* index was performed, such that your spatial distribution is isotropic and was adjusted by a power model (POW), identifying the nugget effect “C0” and the constant term “α” and power “p” (Figure 5A) (the details of which are described in Appendix B).
The fuzzy vulnerability map in a large portion of the spatial domain was classified as moderate, or “M”, in degree. The mapping of Outeiro Island indicated that more than 50% of the urban and periurban zone has high “H” intrinsic vulnerability to contamination and that slightly more than 40% of the referenced zone was classified as having moderate “M” intrinsic vulnerability (Figure 5B). Figure 5C shows the high “H” intrinsic vulnerability coverage of the shallow aquifer that surfaces in the urban and periurban zone of the island of Mosqueiro, which was less than 4%, compared with the 90% classified as “M”. Less than 30% of the urban and periurban zone of Belém was classified as having high “H” intrinsic vulnerability for the contamination of the shallow aquifer. Slightly more than 70% of this zone was classified as having moderate “M” intrinsic vulnerability (Figure 5D).
The results obtained by the interpolation of the YGOD-Fuzzy* index partially aligned with the results obtained by the authors of [40]. Lastly, the fuzzy intrinsic vulnerability map was validated (Figure 5E). For this purpose, well water samples were included, which, after analysis, demonstrated contamination by BTEX [46] in a zone classified by the GOD-fuzzy method as having high intrinsic vulnerability.

4.2. Fuzzy-AHP Classification of the Hazard Degree of UFST

Before the application, the configured fuzzy-AHP model was measured to group the fuel stations by patterned hazard degree. Figure 5F shows the results of physicochemical properties weighted by the AHP method. Because the volumetric capacity of the UFST was the only property that varied between the stations, a linear simple regression was fitted for this measurement, which can be used to classify the hazard (Figure 5G). The application of the fuzzy-AHP model quantified the hazard or potential to cause damage to groundwater from 91 FS (see Figure 4). The fuzzy-AHP model classified four UFST/FS as a very high “VH” hazard. However, 60 UFST/FS were classified as having moderate risk “M”, and more than 29% were classified as having high risk “H” (Figure 5H). The stations catalogued in the spatial domain that showed the most potential to cause damage are located in the city of Belém. Only one station was catalogued on the island of Mosqueiro, which was classified as having moderate “M” hazard (Figure 5I).

4.3. Fuzzy-AHP Classification of the Natural Quality of Groundwater

The fuzzy-AHP model was configured to classify the natural quality of groundwater for potable uses. Figure 6A shows the results of physicochemical parameters weighted by the AHP method. Figure 6D shows the mapping of the natural quality of groundwater in the urban zone of Belém city by geostatistical interpolation of the Hj(Q)-index, adjusted for exponential model (EXP), identifying the “C0” and sill (C) (Figure 6B) (detailed in Appendix B). This way, 81% of the mapped area was framework acceptable “Ac” quality, and the remaining 19% was framework good “Go” quality (Figure 6C).

4.4. Probability of Groundwater Reserve Use

For the variable ηe, the data obtained by the authors of [38] showed a probable value of 10%. Given the lack of data, a triangular distribution was adopted by considering an empirical criterion of ±10% of the probable value, showing a minimum of 0.05% and a maximum of 15%. Likewise, the lack of a monitoring network for the water column of wells justified the adoption of a probable value for Δh equal to 1.8 m, as referenced in [38] for aquifers that surface in the city of Belém.
Thus, a triangular distribution was also adopted, with the minimum value under consideration of 0.8 m and the maximum value of 2.6 m, which are justifiable variations for Amazon water levels. On the basis of these considerations, pseudo-random numbers were generated for the physical variables ηe and Δh by simple sampling, which resulted in the triangular probability distribution functions (t-PDFs) illustrated in Figure 6E,F, respectively.
Thus, considering a surfacing area of the shallow aquifer systems of approximately 1200 km², which corresponds to the saturation water [38,44], combined with the PDF of the variables ηe and Δh, f(GR) was obtained. In general, through the PDF of the GR reserve, f(GR), the probability of safely using these reserves without the need to use the GP reserves was obtained. The following approximations were adopted:
  • A per capita water demand of 200 L/day, as projected in the spatial domain for the year 2033 and referenced in [45].
  • Fifty percent of the consumption in the city of Belém comes from wells, that is, approximately 750,000 inhabitants demand a daily volume of 150,000 m³ (54.75 million m³/year).
  • On the island of Mosqueiro, which depends on groundwater to supply an estimated population of approximately 50,000 inhabitants, the water volume demand is close to 12,500 m³/day (4.5 million m³/year). On the island of Outeiro, which also depends on groundwater, the population of close to 90,000 inhabitants demands approximately 22,500 m³ per day (8.2 million m³/year).
According to these considerations, the probability of using the regulating reserve (GR) in the city of Belém was estimated at almost 11%. Thus, the probability that GP would be used was classified as low “L”, so the GR reserve can be safely used. On the island zones, the probability that the GP would be used was classified as very low “VL” (5.09% and 5.45%), so the GR reserve can be used with complete safety.
Although the Municipal Plan for Basic Sanitation, Water Supply, and Sanitary Sewer of Belém—Pará [45] projected a time horizon of 20 years to universalize the coverage of the water supply network, there are no studies suggesting that the demand for groundwater will decrease or increase. Nevertheless, the more than 5000 wells that have been drilled for potable and non-potable uses will not abruptly cease to operate. Thus, considering the low recharge of the shallow aquifer, an accumulated volume of five years in the city of Belém, island of Mosqueiro, and island of Outeiro was projected such that the demand increased to 273.75, 22.5, and 41 million m³, respectively.
In this scenario, the probability of using the GR reserve in Belém was estimated at slightly more than 61%. Thus, the probability that the GP reserve would be used was classified as high “H”, so the use of the GR reserve was considered as unsafe. However, in the island zones, the very low classification “VL” for the probability of GP being used (6.94% and 9.15%) was not changed, meaning that GR can be safely used (Figure 6G). Thus, to assess the consequence of contamination, the relationship among the natural quality degree of groundwater and probability of use groundwater was adopted (Figure 6I).

4.5. Contamination Risk Assessment

The basic contamination risk was assessed (Rb) from the point sources located in the urban zone of the city of Belém and its islands using a risk matrix. This matrix relates YGOD-Fuzzy* and Hj(P), and the product is Rb. The results from this relationship were obtained by inputting the hazard quantification for each UFST/FS into the vulnerability map. The degrees of basic groundwater contamination risk by point sources are indicated in Figure 7A.
To assess the value-weighted risk (R), the degree of consequence from groundwater contamination was initially quantified by finding a relationship among the degrees of natural groundwater quality and the probability of GP of the phreatic aquifer being used. The contamination of optimal-quality water, for which the probability of the GR reserve being used is very high with the activation of a small portion of the GP reserve, shows the consequence of contamination to be very high or “VH”. The contamination of groundwater with an unfit natural quality extracted from phreatic aquifers, for which the probability of the GR being used is very low, thus requiring a large portion of the GP reserve, has a very low or “VL” consequence.
In a large portion of the urban zone of Belém, the impact of contamination in zones classified as having good natural water quality was considered very high or “VH”. In the urban and periurban zones of the islands of Mosqueiro and Outeiro, the contamination impact was classified as moderate or “M”. Thus, the degrees of value-weighted risk relating to the contamination of the groundwater from point sources are indicated, and the results are distributed in the urban zone of Belém (Figure 7B).

5. Conclusions and Recommendations

The groundwater contamination risk assessment method proposed here is a preventive alternative to be considered during the management of groundwater resources, as it overcomes subjectivities and addresses uncertainties in the assessment of intrinsic vulnerability, risk, and water quality and the estimation of groundwater reserve use. The GOD-fuzzy model was proposed to overcome subjective and ambiguous limitations, which are generally associated with the GOD method, and it was used for an intrinsic vulnerability assessment. The GOD-fuzzy model was processed by employing a systematic and simultaneous relationship between “fuzzifier” hydrogeological parameters, which was shown as an alternative with a more preventative nature than the GOD method through an intelligent controller.
For specific hydrogeological configurations, the knowledge base of the GOD-fuzzy model can be readapted such that the interval for the ranges of values for the linguistic variables that defined the fuzzifier of the hydrogeological parameters under consideration can be changed. Thus, the set of rules can also be adjusted, functioning as a type of calibrator for the referenced fuzzy model. In turn, depending on the type of aquifer, other base methods can be used, for example, SINTACS or AVI methods, to measure the fuzzy intrinsic vulnerability.
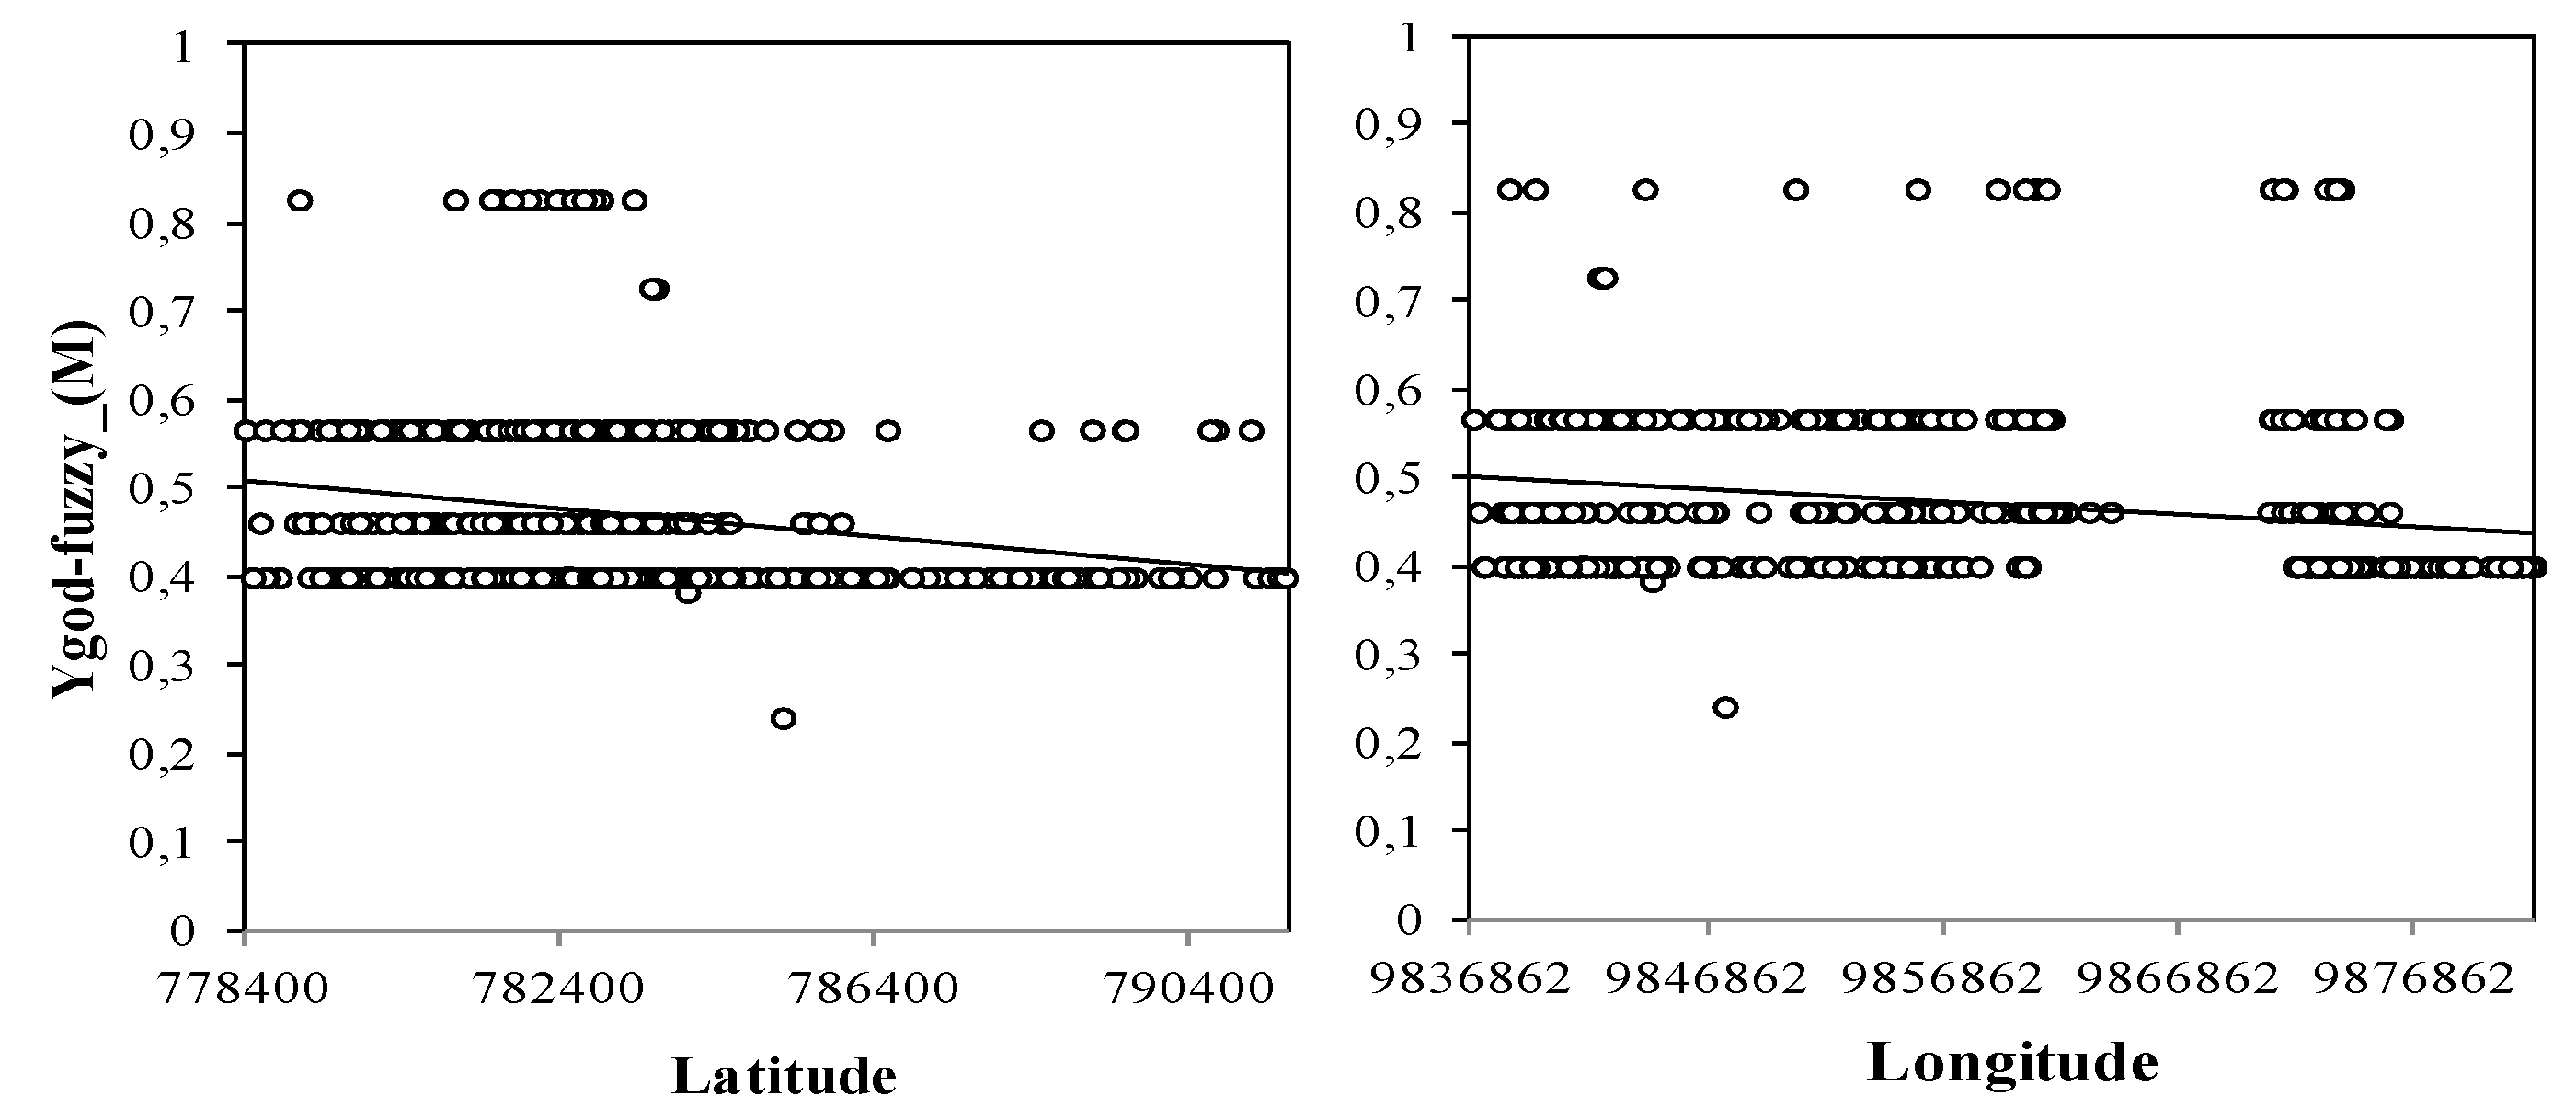
Within the scope of applying the Mamdani-type fuzzy controller, the use of “defuzzifier” methods other than the centroid method used in this study is suggested. The use of other “defuzzifier” methods can cause significant changes in the final results, and consequently, in the intrinsic vulnerability map. Therefore, the YGOD-Fuzzy* index produced by the GOD-fuzzy model was interpolated in the environment within the urban zone of Belém, and the shallow aquifer intrinsic vulnerability map was produced.
The point sources were located in this environment, namely, fuel stations (associated with the UFST), whose degrees of hazard were quantified with an Hj(P) index generated by a multi-criteria fuzzy pattern recognition model integrated with AHP. The judgment of the importance of the physical and chemical properties (toxicity, degradability, mobility, solubility, and quantity) considered to quantify the degree of hazard can be evaluated. Thus, the classification of a specific degree of hazard can differ from that obtained in this study. Likewise, the inclusion of other properties, for example, the half-life, can lead to hazard classifications different from those obtained in this study. The fuzzy-AHP model designed to classify the hazard is flexible to the point that it performs the following:
  • adapts to types of patterns established by any regulation;
  • performs convenient judgments of importance for each type of contamination source, including for scenarios with vehicles;
  • inserts n physical and chemical contaminant properties.
To quantify the groundwater consequence of contamination, a concept was used that measures the socioeconomic and environmental value of groundwater, which is a function of the association between the degrees of natural water quality and the estimated use of the aquifer reserves. For this purpose, the natural quality of the groundwater for potable uses was classified using a multi-criteria fuzzy-AHP model. This model was configured to classify the natural quality of groundwater from the weighting of the pH, chloride, total residue, hardness, nitrate, and fluorine parameters in the same manner as mentioned previously.
Considering the uncertainties and stochastic nature of the physical variables of an aquifer, a probabilistic proposal was adopted using the MCS method. Thus, the degree of probability of using the GR reserves without activating the GP reserves was estimated. These results can undergo changes if a less conservative concept is adopted, namely, the probability of using the GP reserves while also requiring the GR reserves. For future studies, the inclusion of a stochastic assessment of other physical variables is recommended, as is the use of other algorithms for the generation of pseudo-random numbers, for example, a Latin hypercube.
Finally, using the proposed FPM-risks, strategies can be developed to manage contamination sources to protect underground springs when considering a contamination event in a dense urban environment. The implementation of this model must not be the sole strategy for groundwater protection. Thus, strategies that can be integrated and coordinated with the characteristics of the proposed risk model must be adopted, such as the following:
  • Imposing compliance with special requirements for handling chemical and toxic substances and persistent wastewater in any industrial zone located in zones of low or moderate vulnerability, which includes the adoption of devices that can prevent and monitor flows;
  • Widespread weighted risk management must be implemented.
Thus, the fuzzy and probabilistic models proposed for risk assessment permitted the establishment of a connection between groundwater users and decision-makers through the following:
  • The synthesis and simplification of the hydrogeological conditions by the GOD-fuzzy model;
  • The quantification of the hazard posed by contamination sources and the classification of the natural groundwater quality for potable uses using the fuzzy-AHP model;
  • The probabilistic estimation of the use of GR reserves, without using GP reserves;
  • The generation of thematic maps, in particular.
Although, technically, the risk assessment should be updated regularly because of the dynamic characteristics of hazards from the USFT, the FPM-risks was shown as a tool to be considered for managing groundwater resources. On the order hand, as these models overcome subjectivities and address uncertainties, thereby providing a higher level of accuracy than usual risk methods, a better way for decision making became available. In practice, this study is presented as a strategy to expand the public's consciousness and understanding about the need to protect groundwater.

Author Contributions

É.G.L. must be given credit the conceptualization, formal analysis, investigation, methodology, and writing (original draft and review & editing). R.L.R.M. gave important contributions for review & editing (especially about geological and hydrogeological issue). M.M.P.F. and L.A.L.B. gave important contributions for writing—review & editing. All authors have read and agreed to the published version of the manuscript.

Funding

The study was supported by the National Council for Scientific and Technological Development (CNPq) (Grant no. 246869/ 2012-7, GDE mode) and the Foundation for Research Development of the Federal University of Pará ((PROPESP/FADESP/UFPA): PAPQ 01/2020.

Conflicts of Interest

The authors declare no conflict of interest.

Appendix A. Analysis Hierarchy Process Application

To define the importance (weight) between the contaminants—cn (criterial), IR = 1.24 (for n = 6).
Table A1. Toxicity—p1.
ContaminantsBTEXBPNTcn(ga)wcn
B17551/352.5830.28%
T1/711/51/51/51/70.232.75%
E1/55131/531.1012.97%
X1/551/311/51/50.495.73%
BP3535153.2237.92%
NT1/571/351/510.8810.36%
ΣC4.7430.009.8719.202.1314.348.50100%
λmáx6.93
IC0.19
CR15.07%
Table A2. Mobility—p2.
ContaminantsBTEXBPNTcn(ga)wcn
B1555754.0445.89%
T1/5133731.8320.79%
E1/51/313731.2714.41%
X1/51/31/31730.889.99%
BP1/71/71/71/711/50.212.37%
NT1/51/31/31/3510.586.55%
ΣC1.947.149.8112.4834.0015.208.81100%
λmáx6.84
IC0.17
CR13.53%
Table A3. p3.
Table A3. p3.
ContaminantsBTEXBPNTcn(ga)wcn
B15551/51/31.4216.50%
T1/511/31/51/51/50.283.30%
E1/5311/31/51/50.455.18%
X1/55311/51/30.768.86%
BP5555153.8244.31%
NT35531/511.8921.85%
ΣC9.6024.0019.3314.532.007.078.63100%
λmáx7.10
IC0.22
CR17.68%
Table A4. Solubility—p4.
ContaminantesBTEXBPNTcn(ga)wcn
B11/51/71/51/51/70.232.72%
T511/51/31/51/50.495.66%
E7511/31/51/50.8810.24%
X53311/31/51.2013.96%
BP5553133.2237.49%
NT75551/312.5829.94%
ΣC30.0019.2014.349.872.274.748.60100%
λmáx7.02
IC0.20
CR16.41%
Benzene (B), Toluene (T), Xylene (X), Ethylbenzene (E), Benzo(a)pyrene (BP), Naphthalene (NT).
Table A5. To define the importance (weight) between the proprieties of contaminants—pn (criterial), IR = 0.90 (for n = 4).
pnp5p1p2p3p4pn(ga)wpn
p5133552.9430.10%
p11/313552.0120.56%
p21/31/31770.717.28%
p31/51/51/7190.242.43%
p41/51/51/71/913.8739.62%
ΣC4.737.2918.1127.002.079.78100%
λmáx4.46
IC0.153
CR16.97%
Toxicity (p1), Mobility (p2), Degradability (p3), Solubility (p4).
Table A6. To define the importance (weight) between the water quality parameters—qn (criterial), IR = 1.24 (for n = 6).
qnq5q2q6q1q4q3qn(ga)wqn
q51333352.7235.28%
q21/3133351.8924.46%
q61/31/313351.3116.96%
q11/31/31/31350.9111.76%
q41/31/31/31/3150.638.15%
q31/51/51/51/51/510.263.39%
ΣC2.535.207.8710.5313.2026.007.71100%
λmáx6.70
IC0.139
CR11.23%
pH (q1), chloride (q2), total residuals (q3), hardness (q4), nitrate (q5) and fluorine (q6). Symbols, Consistency Ratio, CR; Consistent Index, IC.
Table A7. Random Index, IR (Saaty, 2008).
n123456789101112131415
IR0.000.000.580.901.121.241.321.411.451.491.511.481.561.571.59
Criterial number, n; Sum of the columns, ΣC; Geometric average of the row, Criterialn (ga); Eigenvector, λmáx; Weight, wCriterial n.
Equations.
CR = IC/IR
IC =máx−n)/(n−1)
Condition.
CR ≤ 20% (is consistent with the judgment of importance between the criteria)

Appendix B. Spatial Interpolation by Geostatistical Method

To Map the Intrinsic Vulnerability Fuzzy.
Table A8. Exploratory analysis of well data.
AttributeAverageStandard DeviationMinimumMaximumModeMedianVarianceVariation Coefficient
YGOD-Fuzzy0.4750.0530.2740.7720.4000.4770.00311.21%

Appendix B.1. Preliminary Analysis of Drift Formation

Although the YGOD-Fuzzy index presented a certain slope of the regression line, it was considered that this slope is not accentuated to the point of not varying in average in a well-defined behavior, in accordance with the latitude and longitude. Therefore, it was assumed that the respective indices did not present a drift phenomenon.
Figure A1. Preliminary drift analysis for the spatial domain.
Water 12 01437 g0a1
The GOD-Fuzzy index estimates that assessing the intrinsic vulnerability of the urban zone of Belém and islands is valid and consistent without the need for corrective (e.g., trend kriging) filtering. It should be noted that the preliminary analysis, statistical and spatial description, pointed to a situation of homogeneity (only one population).

Appendix B.2. Variography

After several empirical attempts, through a preliminary approach of the geostatistical proposal, lag was adopted in the x and y direction, equal to 700 and 1600 m, respectively; and a lag number equal to 15, obtaining the variographic surface. Due to these conditions, a situation of slight anisotropy in the N–W and S–E directions occurred, because within the search circle, the pixels of blue tones below the variance were predominant (Figure A2A).
Figure A2. (A) Variographic surface; (B) omnidirectional and directional variogram—Belém urban zone.
Water 12 01437 g0a2
On the other hand, an analysis of the variable surface suggests an isotropic tendency that can be modeled via the omnidirectional variogram model. To confirm this finding, after several empirical attempts, the tolerance, lag, and maximum bandwidth equaled to 550, 1950, and 650 m, respectively.
The omnidirectional variogram confirmed the nonexistence of the trend of YGOD-Fuzzy data. In these terms, it has been observed that the graph illustrated by Figure A2B points to a pure “white noise” nugget effect so that, in this case, the spatial correlation is tenuous, so as to call into question the advantage of a geostatistical approach to map the intrinsic vulnerability. Thus, the distribution of the isotropic YGOD-Fuzzy index was considered, adjusting the omnidirectional variogram via the power (POW) theoretical model (Figure A3).
Figure A3. Omnidirectional and directional variogram—Belém urban zone.
Water 12 01437 g0a3
Therefore, it was not possible to make adjustments to the theoretical models with sill, because it is not possible to gauge the priority of a better fit for the points relative to the smallest distances (the first points). Thus, the application of the linear model POW, not sill, was the one that best fit the pairs of points of the omnidirectional variogram.
Thus, to compose the studies on an intrinsic vulnerability analysis, the map obtained via spatial interpolation of the YGOD-Fuzzy index, adjusted by the POW model, was adopted. Thus, cross-validation of the variographic model revealed a root mean square error (RMSE) of around 0.086414.
To Map the Groundwater Nature Quality fuzzy.
Table A9. Exploratory analysis of groundwater samples.
AttributeAverageStandard DeviationMinimumMaximumModeMedianVarianceVariation Coefficient
Hj(Q)2.070.101.802.512.172.040.014.91%

Appendix B.3. Preliminary Analysis of Drift Formation

Although the Hj(Q) index presented a certain slope of the regression line, it was considered that this slope is not accentuated to the point of not varying in average in a well-defined behavior, in accordance with the latitude and longitude. Therefore, it was assumed that the respective indices did not present a drift phenomenon (Figure A4).
Figure A4. Preliminary drift analysis for the spatial domain.
Water 12 01437 g0a4

Appendix B.4. Variography

In order to measure the spatial distribution of the fuzzy index Hj(Q) via a geostatistical approach, after several empirical attempts, a lag in the x and y direction was adopted at 8000 and 5600 m, respectively; and a lag number equal to 5, obtaining the variographic map. Under these conditions, little anisotropy in the N–S and E–W directions was observed; therefore, within a small search radius, the pixels of blue tones whose hue was below the variance were detected based on the map of the variographic surface (Figure A5A).
After several empirical attempts, the tolerance, lag, and maximum bandwidth were found to equal to 2100, 4100, and 2000 m, respectively. Therefore, through the omnidirectional variogram, we confirmed the nonexistence of a trend in the index data set Hj(Q), ratified by the preliminary spatial drift analysis. The omnidirectional variogram reached the sill for a distance of about 8000 m.
It was also observed that the directional variograms for 0º, 45º, and 90°, with an angular tolerance of 45°, presented similarities, entering a state of randomness after an 8000 m distance (Figure A5B). Although anisotropy was observed on the variographic surface when the directional variogram was observed at 135°, it was considered that the omnidirectional variogram behaved as an average in relation to the directional ones.
Figure A5. (A) Variographic surface; (B) omnidirectional and directional variogram—Belém urban zone.
Water 12 01437 g0a5
Thus, without using any “normalization”, by adopting a small search radius, the distribution of the Hj(Q) index was considered as isotropic, adjusting the omnidirectional variogram via the spherical (SPH), exponential (EXP), and Gaussian (GAU) models (Figure A6).
Figure A6. Adjustments via theoretical models to the omnidirectional variogram. (A): Co = 0.00234, C = 0.00602; (B): Co = 0.00081, C = 0.00763; (C): Co = 0.00333, C = 0.00502.
Water 12 01437 g0a6
The best theoretical adjustment was associated with the EXP model. Adjusted via the aforementioned EXP model, the variability of the Hj(Q) index was estimated via normal kriging. In addition to being used to choose the EXP model, among others, the cross-validation process of the variographic model revealed a statistical indicative RMSE which was equal to 0.08715.

References

  1. Zwahlen, F. Vulnerability and Risk Mapping for the Protection of Carbonate (Karst) Aquifers, final report (COST action 620); European Commission: Brussels, Belgium, 2004; p. 297. ISBN 92-894-6416-X. [Google Scholar]
  2. Wang, J.; He, J.; Chen, H. Assessment of groundwater contamination risk using hazard quantification, a modified DRASTIC model and groundwater value, Beijing Plain, China. Sci. Total Environ. 2012, 432, 216–226. [Google Scholar] [CrossRef] [PubMed]
  3. Zhang, Y.; Weissmann, G.S.; Fogg, G.E.; Lu, B.; Sun, H.; Zheng, C. Assessment of Groundwater Susceptibility to Non-Point Source Contaminants Using Three-Dimensional Transient Indexes. Int. J. Environ. Res. Public Health 2018, 15, 1177. [Google Scholar] [CrossRef] [PubMed] [Green Version]
  4. Huicheng, Z.; Guoli, W.; Qing, Y. A multi-objective fuzzy pattern recognition model for assessing groundwater vulnerability based on the DRASTIC system. Hydrol. Sci. J. 1999, 44, 611–618. [Google Scholar] [CrossRef]
  5. Shouyu, C.; Guangtao, F.U. A DRASTIC-based fuzzy pattern recognition methodology for groundwater vulnerability evaluation. Hydrol. Sci. J. 2003, 48, 211–220. [Google Scholar] [CrossRef]
  6. Carvalho, F.A.L.; Pacheco, G.J.P. Vulnerability Analysis to Groundwater Contamination in the Sordo River Hydrographic Basin (Vila Real) by the FUZZY-DRASTIC Method. Recur. Hídricos 2010, 31, 65–76. (In Portuguese) [Google Scholar]
  7. Aller, L.; Bennett, T.; Lehr, J.H.; Petty, R.J.; Hackett, G. DRASTIC: A Standardized System for Evaluating Groundwater Pollution Potential Using Hydrogeological Settings; Oklahoma US Environmental Protection Agency: Washington, DC, USA, 1987.
  8. Uricchio, V.F.; Giordano, R.; Lopez, N. A fuzzy knowledge-based decision support system for groundwater pollution risk evaluation. J. Environ. Manag. 2004, 73, 189–197. [Google Scholar] [CrossRef] [PubMed]
  9. Dixon, B. Groundwater vulnerability mapping: A GIS and fuzzy rule based integrated tool. Appl. Geogr. 2005, 25, 327–347. [Google Scholar] [CrossRef]
  10. Gemitzi, A.; Petalas, C.; Tsihrintzis, V.A.; Pisinaras, V. Assessment of groundwater vulnerability to pollution: A combination of GIS, fuzzy logic and decision making techniques. Environ. Geol. 2006, 49, 653–673. [Google Scholar] [CrossRef]
  11. Afshar, A.; Marino, M.A.; Ebtehaj, M.; Moosavi, J. Rule-Based Fuzzy System for Assessing Groundwater Vulnerability. J. Environ. Eng. 2007, 133, 532–540. [Google Scholar] [CrossRef]
  12. Pathak, D.R.; Hiratsuka, A. An integrated GIS based fuzzy pattern recognition model to compute groundwater vulnerability index for decision making. J. Hydroenviron. Res. 2011, 5, 63–77. [Google Scholar] [CrossRef]
  13. Lisbôa, É.G.; Barp, A.R.B.; Mendes, R.L.R. Fuzzy-Geostatistics Approach for Mapping the Intrinsic Vulnerability of Aquifers. Braz. J. Water Resour. 2013, 18, 111–123. (In Portuguese) [Google Scholar]
  14. Mamdani, E.H. Application of fuzzy algorithms for control of simple dynamic plant. Proc. IEEE 1974, 121, 1585–1588. [Google Scholar] [CrossRef]
  15. Lee, C.-C. Fuzzy logic in control systems: Fuzzy logic controller. I. IEEE Trans. Syst. Man Cybern. 1990, 20, 404–418. [Google Scholar] [CrossRef] [Green Version]
  16. US Environmental Protection Agency. Guide for Conduction Contaminant Source Inventories for Public Drinking Water Supplies: Technical Assistance Document; US Environmental Protection Agency: Washington, DC, USA, 1991.
  17. Zaporozec, A.; Conrad, J.E.; Hirata, R.; Per-Olof, J. Groundwater Contamination Inventory: A Methodological Guide; UNESCO: Paris, France, 2002; Volume 2. [Google Scholar]
  18. Foster, S.; Hirata, R.; Gomes, D.; D'Elia, M.; Paris, M. Groundwater Quality Protection; The World Bank: Washington, DC, USA, 2002. [Google Scholar]
  19. Andreo, B.; Goldscheider, N.; Vadillo, I.; Vías, J.M.; Neukum, C.; Sinreich, M.; Jiménez, P.; Brechenmacher, J.; Carrasco, F.; Perles, M.J.; et al. Karst groundwater protection: First application of a Pan-European Approach to vulnerability, hazard and risk mapping in the Sierra de Libar (Southern Spain). Sci. Total Environ. 2006, 357, 54–73. [Google Scholar] [CrossRef] [PubMed]
  20. Nobre, R.C.M.; Rotunno Filho, O.C.; Mansur, W.J.; Nobre, M.M.M.; Cosenza, C.A.N. Groundwater vulnerability and risk mapping using GIS, modeling and a fuzzy logic tool. J. Contam. Hydrol. 2007, 94, 277–292. [Google Scholar] [CrossRef] [PubMed]
  21. Mimi, Z.A.; Assi, A. Intrinsic vulnerability, hazard and risk mapping for karst aquifers: A case study. J. Hydrol. 2009, 364, 298–310. [Google Scholar] [CrossRef]
  22. Melloul, A.J.; Collin, M. A proposed index for aquifer water-quality assessment: The case of Israel’s Sharon region. J. Environ. Manag. 1998, 54, 131–142. [Google Scholar] [CrossRef]
  23. Oliveira, I.B.; Negrão, F.I.; Silva, A.G.L.S. Mapping of the Aquifers of the State of Bahia using the Natural Quality of Groundwater Index—NQGI. Águas Subterrâneas. 2007, 21. (In Portuguese) [Google Scholar] [CrossRef]
  24. Cadilhac, L.; Albinet, M. Système d’Évaluation de la Qualité des Eaux Souterraines-Rapport de Présentation, Version 0; Agences de l’eau et le Ministère de l’Ecologie et du Développement Durable: Paris, France, 2003. (In French) [Google Scholar]
  25. Vincent Henri, C.; Harter, T. Stochastic Assessment of Nonpoint Source Contamination: Joint Impact of Aquifer Heterogeneity and Well Characteristics on Management Metrics. Water Resour. Res. 2019, 55, 6773–6794. [Google Scholar] [CrossRef]
  26. Costa, W.D. Evaluation of reserve, potentiality and availability of aquifers. Águas Subterrâneas. 1998. Available online: https://aguassubterraneas.abas.org/asubterraneas/article/view/22276/0 (accessed on 24 October 2019).
  27. Celligoi, A. Hydrogeology of the Caiuá Formation in the State of Paraná (Brazil); University of São Paulo: São Paulo, Brazil, 2000. (In Portuguese) [Google Scholar]
  28. Oliva, A.; Chang, H.K.; Seixas, W. Calculation of underground water reserves of aquifer Rio Claro using Monte Carlo simulation. Águas Subterrâneas. 2010, 24. (In Portuguese) [Google Scholar] [CrossRef] [Green Version]
  29. Foster, S.S.D.; Hirata, R.C.A. Groundwater pollution risk assessment; a methodology using available data. In Groundwater Pollution Risk Assessment; a Methodology Using Available Data; Council of European Professional Informatics Societies: Brussels, Belgium, 1988. [Google Scholar]
  30. U.S. Environmental Protection Agency. Estimation Programs Interface SuiteTM for Microsoft® Windows; U.S. Environmental Protection Agency: Washington, DC, USA, 2011.
  31. Siqueira, W.; dos Anjos, G.C.; de Souza, E.L. Preliminary Assessment of Potential Risks of Contamination of Groundwater by Fuel Stations in the Municipality of Belém. In XII Brazilian Congress of Hydrogeology; Associação Brasileira de Águas Subterrâneas (ABAS): São Paulo, Brasil, 2002; (In Portuguese). Available online: https://aguassubterraneas.abas.org/asubterraneas/article/view/22825 (accessed on 13 June 2019).
  32. Saaty, T.L. Decision Making for Leaders: The Analytic hierarchy Process for Decisions in a Complex World; RWS Publications: Pittsburgh, PA, USA, 1999; Volume 2. [Google Scholar]
  33. Cortecci, G. Geology and Health; Università degli Studi di Bologna: Bologna, Italy, 2002. (In Italian) [Google Scholar]
  34. Brown, R.M.; McClelland, N.I.; Deininger, R.A.; Tozer, R.G. A Water Quality Index—Do We Dare; v. 117, n. 10; Water & Sewage Works: Chicago, IL, USA, October 1970; pp. 339–343. [Google Scholar]
  35. Chen, S. Nonstructured decision making analysis and fuzzy optimum seeking theory for multiobjective systems. J. Fuzzy Math. 1996, 4, 835–842. [Google Scholar]
  36. Zadeh, L. Fuzzy Sets: Information and Control. Inf. Control 1965, 8, 338–353. [Google Scholar] [CrossRef] [Green Version]
  37. Matta, M.A. Hydrogeological Bases for Integrated Management of Water Resources in the Belém/Ananindeua-Pará Region, Brazil. Doctoral Thesis, UFPA, Centro de Geociências, Belém, Brazil, 2002. (In Portuguese). [Google Scholar]
  38. Palheta, E.S. Study of the Compartmentalization and Neotectonic Framework of the Island of Mosqueiro, Pará, Used in Underground Water Prospecting; Federal University of Pará (UFPA): Belém, Brazil, 2008. (In Portuguese) [Google Scholar]
  39. Lisbôa, É.; Carvalho, J.; Mendes, R. The Use of Geostatistics in the Assessment of Hydrogeological Parameters to Map the Composition of the Intrinsic Vulnerability of Aquifers. Rev. Bras. Recur. Hídricos 2016, 21, 188–199. (In Portuguese) [Google Scholar] [CrossRef]
  40. Almeida, F.M.; Matta, M.A.S.; Dias, E.R.F.; Silva, D.P.B.; Figueiredo, A.B. Quality of Groundwater of the Aquifer System Barriers in the Tucunduba Basin—Belém/PA (Brazil). In XIII Brazilian Congress of Hydrogeology; Associação Brasileira de Águas Subterrâneas (ABAS); São Paulo, Brasil: São Paulo, Brasil, 2004; (In Portuguese). Available online: https://aguassubterraneas.abas.org/asubterraneas/article/view/23595 (accessed on 11 April 2019).
  41. Cabral, N.M.; Lima, L. Quality of Water from the Barreiras Aquifer in some Domains of Belém/Pará (Brazil). Águas Subterr. 2005, 19, 37–54. (In Portuguese) [Google Scholar]
  42. Lopes, R.; Mesquita, K.F.; Santos, M.L.; Pereira, J.A. Quality of water consumed in Mosqueiro island, Belém-PA. Rev. DAE 2017, 2, 5–20. (In Portuguese) [Google Scholar] [CrossRef]
  43. CPRM (Content Protection for Recordable Media). Project Hydrogeological Studies of the Belém Metropolitan Area and Adjacencies; CPRM/Brasil: Belém, Brazil, 2002. (In Portuguese)
  44. AMAE (Municipal Water and Sewage Regulatory Agency of Belém). Municipal Water and Sanitary Sewage Plan of Belém-Pará; AMAE/PMB: Belém, Brazil, 2014. (In Portuguese) [Google Scholar]
  45. IBGE (Brazilian Institute of Geography and Statistics). Estimates of the Resident Population in Brazil and Units of the Federation with Reference Data on July 1, 2015; IBGE: Brasília, Brazil, 2015. (In Portuguese) [Google Scholar]
  46. Reis Júnior, J. Study of Contamination Plume by Fuel with the GPR Method and Development of Geophysical Simulator for Educational Purposes; Federal University of Pará (UFPA): Belém, Brazil, 2009. (In Portuguese) [Google Scholar]
Figure 1. Fuzzy inference system (FIS) for assessing the hydraulic accessibility degree by the hydraulic accessibility index (HAI).
Water 12 01437 g001
Figure 2. FIS for assessing the intrinsic vulnerability degree by YGOD-Fuzzy*. GOD—groundwater hydraulic confinement, overlaying strata, and depth to groundwater table.
Water 12 01437 g002
Figure 3. Spatial distribution of (A) depth to groundwater table (xD) (m); (B) overlaying strata (xO).
Water 12 01437 g003
Figure 4. Spatial distribution: underground fuel storage tank (UFST) (m³)/fuel station (FS), groundwater sampling points, natural quality samples.
Water 12 01437 g004
Figure 5. (AE) Intrinsic vulnerability; (FI) hazard of UFST/FS.
Water 12 01437 g005
Figure 6. (AD) Quality groundwater; (EH) consequence of contamination.
Water 12 01437 g006
Figure 7. (A) Basic risk of contamination (Rb); (B) value-weighted risk (R).
Water 12 01437 g007
Table 1. Contaminant properties (pn).
ContaminantsProperties—pn
p1 (mg/L)p2p3p4 (mg/L)
Benzo(a)pyrene (BP)10−55.951.8410−3–10−1
Benzene (B)10−21.752.44104
Toluene (T)0.702.072.94104
Xylene (X)0.502.252.91104
Ethylbenzene (E)0.302.232.81104
Naphthalene (NT)0.305.951.84104
Table 2. Hazard pattern matrix (Zp). VL—very low; L—low; M—medium; H—high; VH—very high.
Properties—pnClasses of Apparent Hazard Standards—h
1 (VL)2 (L)3 (M)4 (H)5 (VH)
p1 (mg/L)1035050.510−5
p25.954.503.502.501.50
p34.753.752.751.750.50
p4 (mg/L)10−310−110103104
p5 (m³)153045100150
Table 3. Natural groundwater quality pattern matrix (Zq). Un—unfit; Ac—acceptable; Go—good; Op—optimal.
Parameters—qnNatural Groundwater Quality Degree—Qn
1 “Un”2 “Ac”3 “Go”4 “Op”
q1<6–>96–97–87.5
q2 (mg/L)>350250–350200–500150
q3 (mg/L)>1000100–1000200–500350
q4 (mg/L)>3500350300200
q5 (mg/L)5045205
q6 (mg/L)>1.51.51.20.6–1

