Water Resources Management Strategies for Irrigated Agriculture in the Indus Basin of Pakistan


1
Institute for Landscape Ecology and Resources Management (ILR), Research Centre for BioSystems, Land Use and Nutrition (IFZ), Justus Liebig University, 35392 Giessen, Germany
2
Department of Irrigation and Drainage, University of Agriculture, Faisalabad 38040, Pakistan
3
Department of Farm Machinery and Power, University of Agriculture, Faisalabad 38040, Pakistan
4
Department of Agricultural and Biological Engineering, Penn State University, University Park, PA 16802, USA
5
Centre for International Development and Environmental Research (ZEU), Justus Liebig University, 35390 Giessen, Germany
*
Author to whom correspondence should be addressed.
Water 2020, 12(5), 1429; https://doi.org/10.3390/w12051429
Submission received: 5 April 2020
/
Revised: 6 May 2020
/
Accepted: 15 May 2020
/
Published: 17 May 2020
(This article belongs to the Special Issue Water Footprint Assessment Research)
Abstract
:Agriculture of Pakistan relies on the Indus basin, which is facing severe water scarcity conditions. Poor irrigation practices and lack of policy reforms are major threats for water and food security of the country. In this research, alternative water-saving strategies are evaluated through a high spatio-temporal water footprint (WF) assessment (1997–2016) for the Punjab and Sindh provinces, which cover an irrigated area of 17 million hectares in the Indus basin of Pakistan. The SPARE:WATER model is used as a spatial decision support tool to calculate the WF and establish alternative management plans for more sustainable water use. The average water consumption (WFarea) is estimated to 182 km3 yr−1, composed of 75% blue water (irrigation water from surface water and groundwater sources), 17% green water (precipitation) and 8% grey water (water used to remove soil salinity or dilute saline irrigation water). Sugarcane, cotton, and rice are highly water-intensive crops, which consume 57% of the annual water use. However, WFarea can be reduced by up to 35% through optimized cropping patterns of the existing crops with the current irrigation settings and even by up to 50% through the combined implementation of optimal cropping patterns and improved irrigation technologies, i.e., sprinkler and drip irrigation. We recommend that the economic impact of these water-saving strategies should be investigated in future studies to inform stakeholders and policymakers to achieve a more sustainable water policy for Pakistan.
1. Introduction
Irrigated agriculture in Pakistan is mostly associated with the Indus plains where 100% of cash and 90% of food crops depend on irrigation [1,2]. Surface water resources of Pakistan originate from the Indus basin that consists of five tributaries (Indus, Chenab, Jhelum, Sutlej, and Ravi). The average flow of these tributaries are 171 km3 yr−1. Approximately 75% of the water is diverted to the canal network for irrigation. Of the available water, only 43 km3 (34%) reaches the farm’s gate. Large amounts of the water is lost in channels due to poor conveyance efficiency of the irrigation system [3,4]. The effective rainfall adds another 16 km3 yr−1 water to the basin (long-term average) [2,5]. However, the combination of surface water and rainfall cannot satisfy crop water demands of the plain [6]. Therefore, a vast amount of groundwater is used to achieve 40–60% of the irrigation needs [7,8]. The unsustainable rate of groundwater pumping results in a decline of the groundwater table. The government of Pakistan reported that the groundwater table of 5–15% of the irrigated areas has dropped to inaccessible depths, mainly in the Punjab province [9,10]. Additionally, groundwater quality is deteriorating, mainly due to increasing salinity. The main sources of salinity are saline pockets that existed naturally in the shallow aquifer and the Indus rivers system which added about 16.6 million tons salts annually in the basin via irrigation [11,12]. While salinity varies between 0.5–4.5 dS m−1 in the upper part (Punjab province), it drops down to 9 dS m−1 in the lower part of the Indus basin (Sindh province) [6]. Qureshi et al. [6] report that for 23% of the irrigated area in Punjab, and even 78% of the area in Sindh are affected by poor water quality, even though they are not reporting how they did define “poor water quality”. On top of the water quality issues, Pakistan has crossed the threshold limits of water scarcity of 1000 m3/capita/year and is likely to reach even absolute water scarcity conditions (<500 m3/capita/year) by 2035 [13,14]. Therefore, it has become a big challenge to ensure water security and related to this, food security, for the growing population, keeping in mind that climate change is further impacting crop production wand water availability [15].
Recently (2018), the government of Pakistan has established a water policy to overcome water scarcity [16]. This policy aims at developing future strategies and action plans through the concept of more crop per drop. Various management practices have been proposed to support this concept. Examples include deficit irrigation to improve water productivity [17], irrigation technologies to reduce field irrigation losses [18], cultivation of drought-resistant crops [19], substitution of water-intensive crops with less water demanding crops [20], soil mulching to preserve soil moisture [21], or conservation tillage to enhance water use efficiency of the crops [22]. In this study, we focus on the evaluation of two alternative strategies, which have been also discussed in water policy as prospective options, i.e., substitution of high water-intensive crops with less water demanding crops and shifting traditional irrigation practices (surface) to more advanced irrigation technologies.
Water footprint (WF) [23] assessment can be used to investigate alternative management strategies for water governance [24,25,26]. The WF is defined as the volume of water used to produce goods and services by individuals, communities or delineated areas such as watersheds or nations. The WF consists of three main components according to the sources of water use. In agriculture, green water is provided from precipitation. Blue water is the amount of freshwater taken from natural resources such as surface water or groundwater and supplied via irrigation. Grey water is the amount of water needed to dilute pollutants [23], for example, to wash out salts from the root zone to facilitate crop growth or to reduce harmful chemical concentrations in recharging groundwater. Nouri et al. [27] studied the impact of soil mulching and drip irrigation through WF assessment in the upper Litani basin of Lebanon and concluded that these alternatives practices have the potential to reduce the WF of all major crops, but their benefits are insufficient to control the overconsumption of water. Cao et al. [28] analyzed water-saving strategies to improve water use efficiency of irrigated grain crops in China by using the WF assessment approach and proposed that the government should invest in advanced water-saving technologies to reduce the pressure on water resources in order to increase the food security of the country. Multsch et al. [29] evaluated various cropping patterns and irrigation technologies in Saudi Arabia and recommended that substitution of fodder crops with vegetables and cereal crops have a great potential to reduce water consumption in the country. Tsakmakis et al. [30] investigated the impact of irrigation technologies on cotton crop through WF assessment in northern Greece and confirmed that drip irrigation technology has a high potential to save the loss of unproductive water compared to sprinkler irrigation.
In this study, we use the SPARE:WATER model [31] to estimate the WF of crops in Pakistan and evaluate a number of water-saving strategies. SPARE:WATER is a spatial decision support system to estimate site-specific crop water requirements. It follows the principles to calculate the crop water requirement during the vegetation period in accordance with the FAO56 guidelines [32]. The SPARE:WATER package has been used in a number of studies to assess the regional water footprint and crop water requirement [33,34,35,36,37]. Since salinity of irrigation water has a high impact on soil salinization and crop production, we consider the leaching requirement as the dominant component of the grey water fraction of the WF as discussed by Multsch et al. [29,31]. The leaching requirement in this regard is the water needed to dilute the salts present in the irrigation water and the soil.
The objectives of the current study are: (1) to develop alternative cropping patterns for improving the WF, considering the salinity of the irrigation water as it affects the leaching requirement, and (2) to investigate the impact of improved irrigation technologies on water savings. The objectives are investigated in two different steps. The WF is estimated for crops and the entire region in the first step, whereas alternative cropping patterns are evaluated in the second step by considering two different irrigation settings, i.e., existing traditional irrigation methods and improved irrigation technologies.
2. Materials and Methods
2.1. Study Area
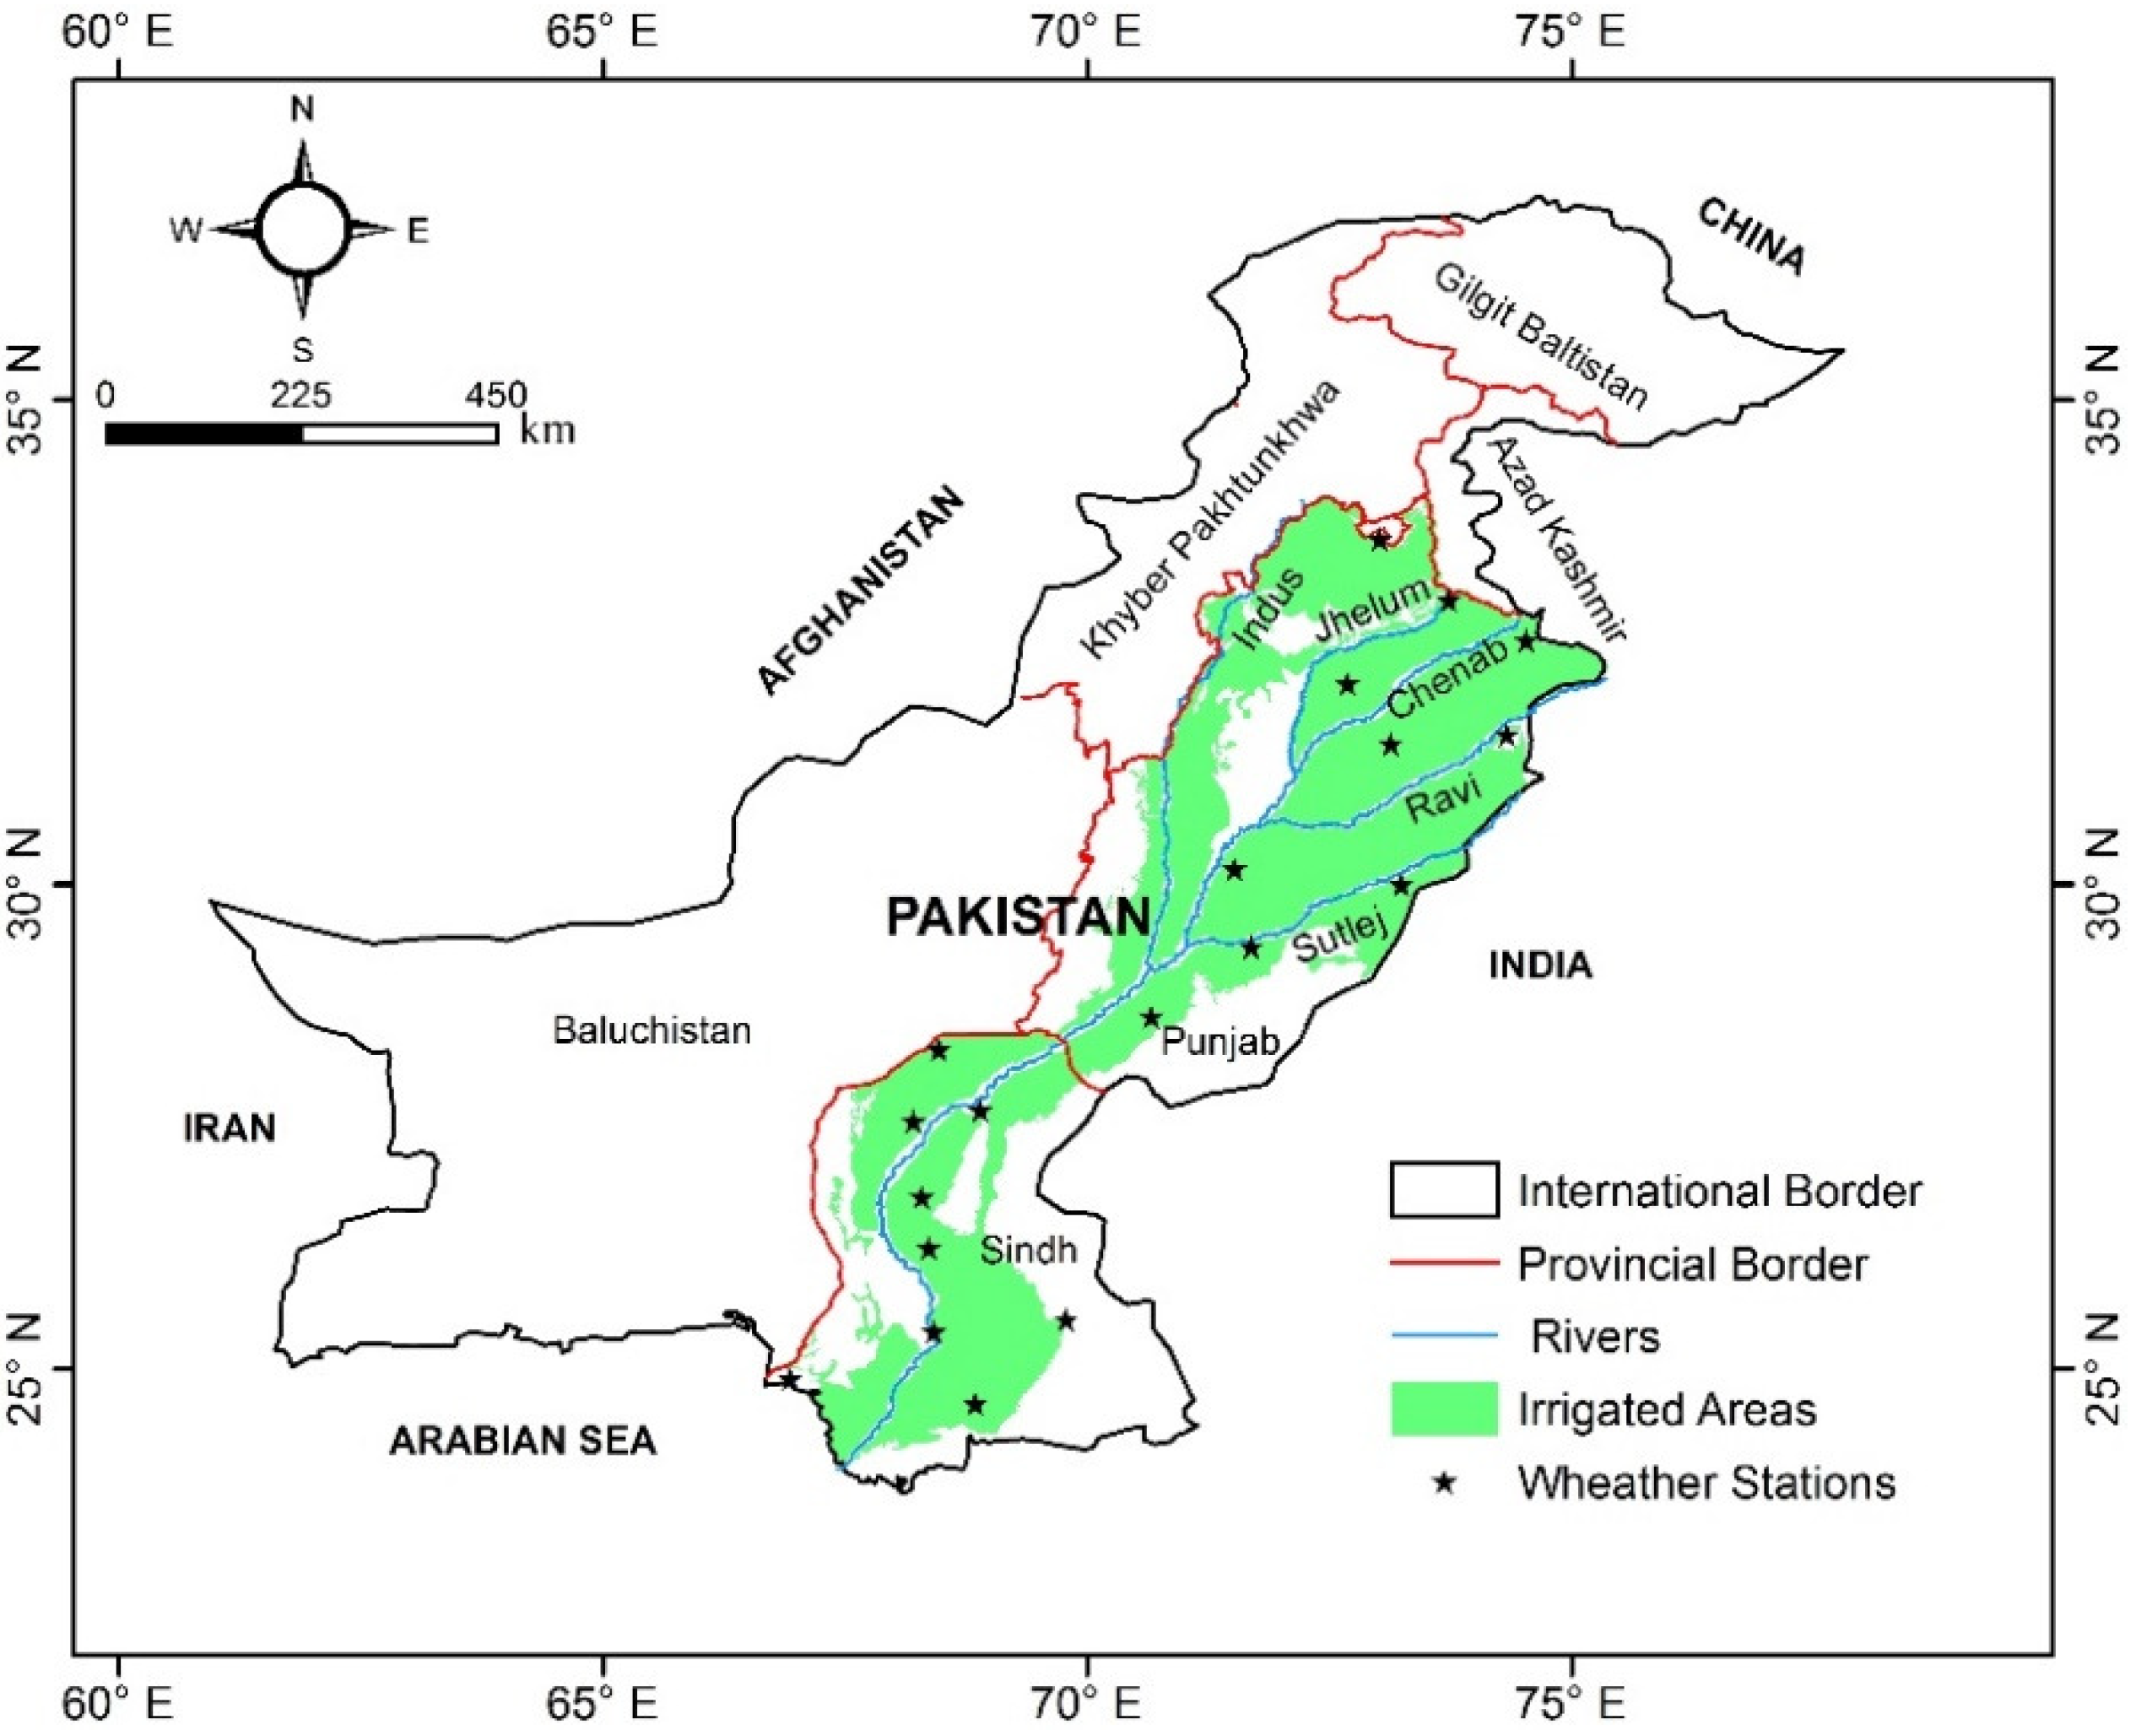
This study focuses on the irrigated zones of the Punjab and Sindh provinces (24.03° to 34.10°N, 67.40° to 74.69°E), which cover approximately 17 million hectares of the Indus basin within Pakistan (Figure 1). The surface topography is characterized by hills of up to 540 m a.s.l. in the north and flat lowlands of up to 4 m a.s.l. in the south. The basin has a semi-arid to arid climate with significant spatial and temporal variation in temperature and rainfall. The summer season extends from April to September with average maximum temperatures (Tmax) of 34–44 °C. The winter season is short from December to February with Tmax 20–28 °C. Average annual rainfall of 372 mm (1997–2016) peaks in the summer season. There are two common cropping seasons called Kharif (April-September), dominated by sugarcane, cotton, rice, and fodder crops as well as the dry Rabi season (October–March), in which mainly wheat and fodder crops are grown. Sugarcane, cotton, and rice are grown as cash crops while wheat is cultivated to meet the domestic food demand.
The Indus River system provides irrigation water through a network of canals, distributaries, and watercourses. Groundwater is used in areas as a primary source where there is no access to canal water or where the quantity of surface water is insufficient for irrigation. In all other areas, groundwater is used as a secondary source of irrigation to meet the crop water requirements. Groundwater is pumped from small private tube wells, which are easy to install and operate due to the cheap availability of drilling machinery at local level and the subsidized costs of electricity for farmers. However, this only applies as long as the groundwater level does not sink too far. Water is applied to fields through surface irrigation in furrows (e.g., cotton, sugarcane) or as flood irrigation (e.g., rice, wheat and fodder crops) with low application efficiencies of 45 to 60%. High-efficiency irrigation systems (drip and sprinkler irrigation) are only installed at a small scale (50,000 ha) through a subsidized project of the World Bank and the government of Punjab (PIPIP 2012–2021).
2.2. The Spare:Water Model
The SPARE:WATER [31] model is used to calculate the water footprint of crops and the entire region. SPARE:WATER follows the general concept of estimating the water footprint according to Hoekstra et al. [23] and is based on the widely used FAO56 Guidelines for computing crop water requirements [32]. The regional WF (WFarea, km3 yr−1) is estimated by summing up the products of all crop productions (t yr−1) multiplied by their crop water footprint (WFcrop; m3 t−1). The WFcrop is calculated by adding the green, blue and grey WF components which are determined by dividing the water requirements (m3 ha−1) by the crop yield (t ha−1). The water requirements of these components are calculated according to the sources of water use, i.e., “green” water requirement is equal to the minimum of crop evapotranspiration (ETc) or effective rainfall (Peff), “blue” water requirement is the irrigation requirement (IRR) and the “grey” water requirement is estimated as the leaching requirement (LR).
where Peff, IRR and LR are effective rainfall, irrigation requirement, and leaching requirement, respectively, in [m3 ha−1] and Y is crop yield in [t ha−1].
SPARE:WATER requires two kinds of data inputs. First, a set of spatial model input data is used to initialize and run the model on the selected spatial domain. Second, the model needs to be parameterized to simulate crop specific evapotranspiration rates.
2.3. Spatial Model Input Data
The input data required by SPARE:WATER includes climatic data, crop data and irrigation data (Table 1). The input data is provided in grid maps to calculate the crop water requirements and footprints for each grid cell. For a comprehensive list of all input data and further model parameters needed see Multsch et al. [31]. The efficiencies of the irrigation systems are set according to the FAO as 60%, 75%, and 90% for surface, sprinkler, and drip irrigation, respectively [38]. The grey WF is estimated considering a local groundwater quality dataset collected by IWASRI during 2010–2014. We used the ArcGIS Geostatistical Analyst extension to interpolate the 3500 point data from well measurements by ordinary kriging using an exponential semi-variogram. As no information is available on the quality of surface water, we used the same gridded data derived from the groundwater well measurements.
As this step introduces some uncertainty in our study, we performed sensitivity analyses to check the effect of irrigation water quality on the grey WF by changing the water quality input data. We set the EC of irrigation water as ±10, ±20 and ±30% to examine the consequence for the grey WF. Further, we also investigated the sensitivity of the irrigation efficiency on the blue and grey WF by varying the efficiency of the irrigation system. It is evaluated by changing the values from 45% to 75% in an interval of 5%. We neglected higher potential irrigation efficiencies through drip irrigation as this kind of irrigation is currently hardly applied in Pakistan.
2.4. Parameterization
The crop evapotranspiration is determined by multiplying the reference evapotranspiration (ET0) with crop coefficient (Kc). The reference evapotranspiration is derived from the Penman-Monteith equation [32], which is based on climatic data (i.e., humidity, temperature, solar radiation, and wind speed). The Kc value is adjusted by dividing the crop development period into four stages as initial (Lin), development (Ldev), mid (Lmid) and late (Llate) stage. The length of the crop development stages is taken from information provided from the Nation Agromet Center of Pakistan. We use Kc values corrected for crop height presented by Ullah et al. [40]. Missing Kc values of some crops, i.e., vegetables, fruits and fodder crops, are taken from a FAO dataset for sub humid regions [32] (see Kc values in Table A1). We also obtained information on crop height from the same source to adjust the FAO Kc values for specific weather conditions as described by Multsch et al. [31]. The effective rainfall Peff is estimated by deducting the runoff losses (RO) from net rainfall (P), which is derived as a constant ratio of 20% of rainfall (RO = P × 0.2) [32]. The irrigation requirement is estimated by combining the productive and unproductive portions of irrigation water. Productive irrigation water is calculated by subtracting the effective rainfall from crop evapotranspiration (ETc). If the effective rainfall is larger than ETc, no irrigation is needed and vice versa. The unproductive irrigation water is calculated based on the efficiency of the irrigation system by considering the additional volume of water that is lost due to deep percolation or direct surface evaporation. Off-farm water losses such as seepage and evaporation from irrigation channels are neglected. The leaching requirement in the SPARE:WATER is estimated according to the salinity tolerance limits of each crop as defined by Ayers and Westcot [41] e.g., cotton > 7.7 dS m−1 and wheat > 6 dS m−1 have relatively high tolerance levels whereas sugarcane > 1.7 dS m−1, rice >3 dS m−1 and vegetables 1.0–2.5 dS m−1 have low salinity tolerance abilities.
2.5. Scenario Evaluation
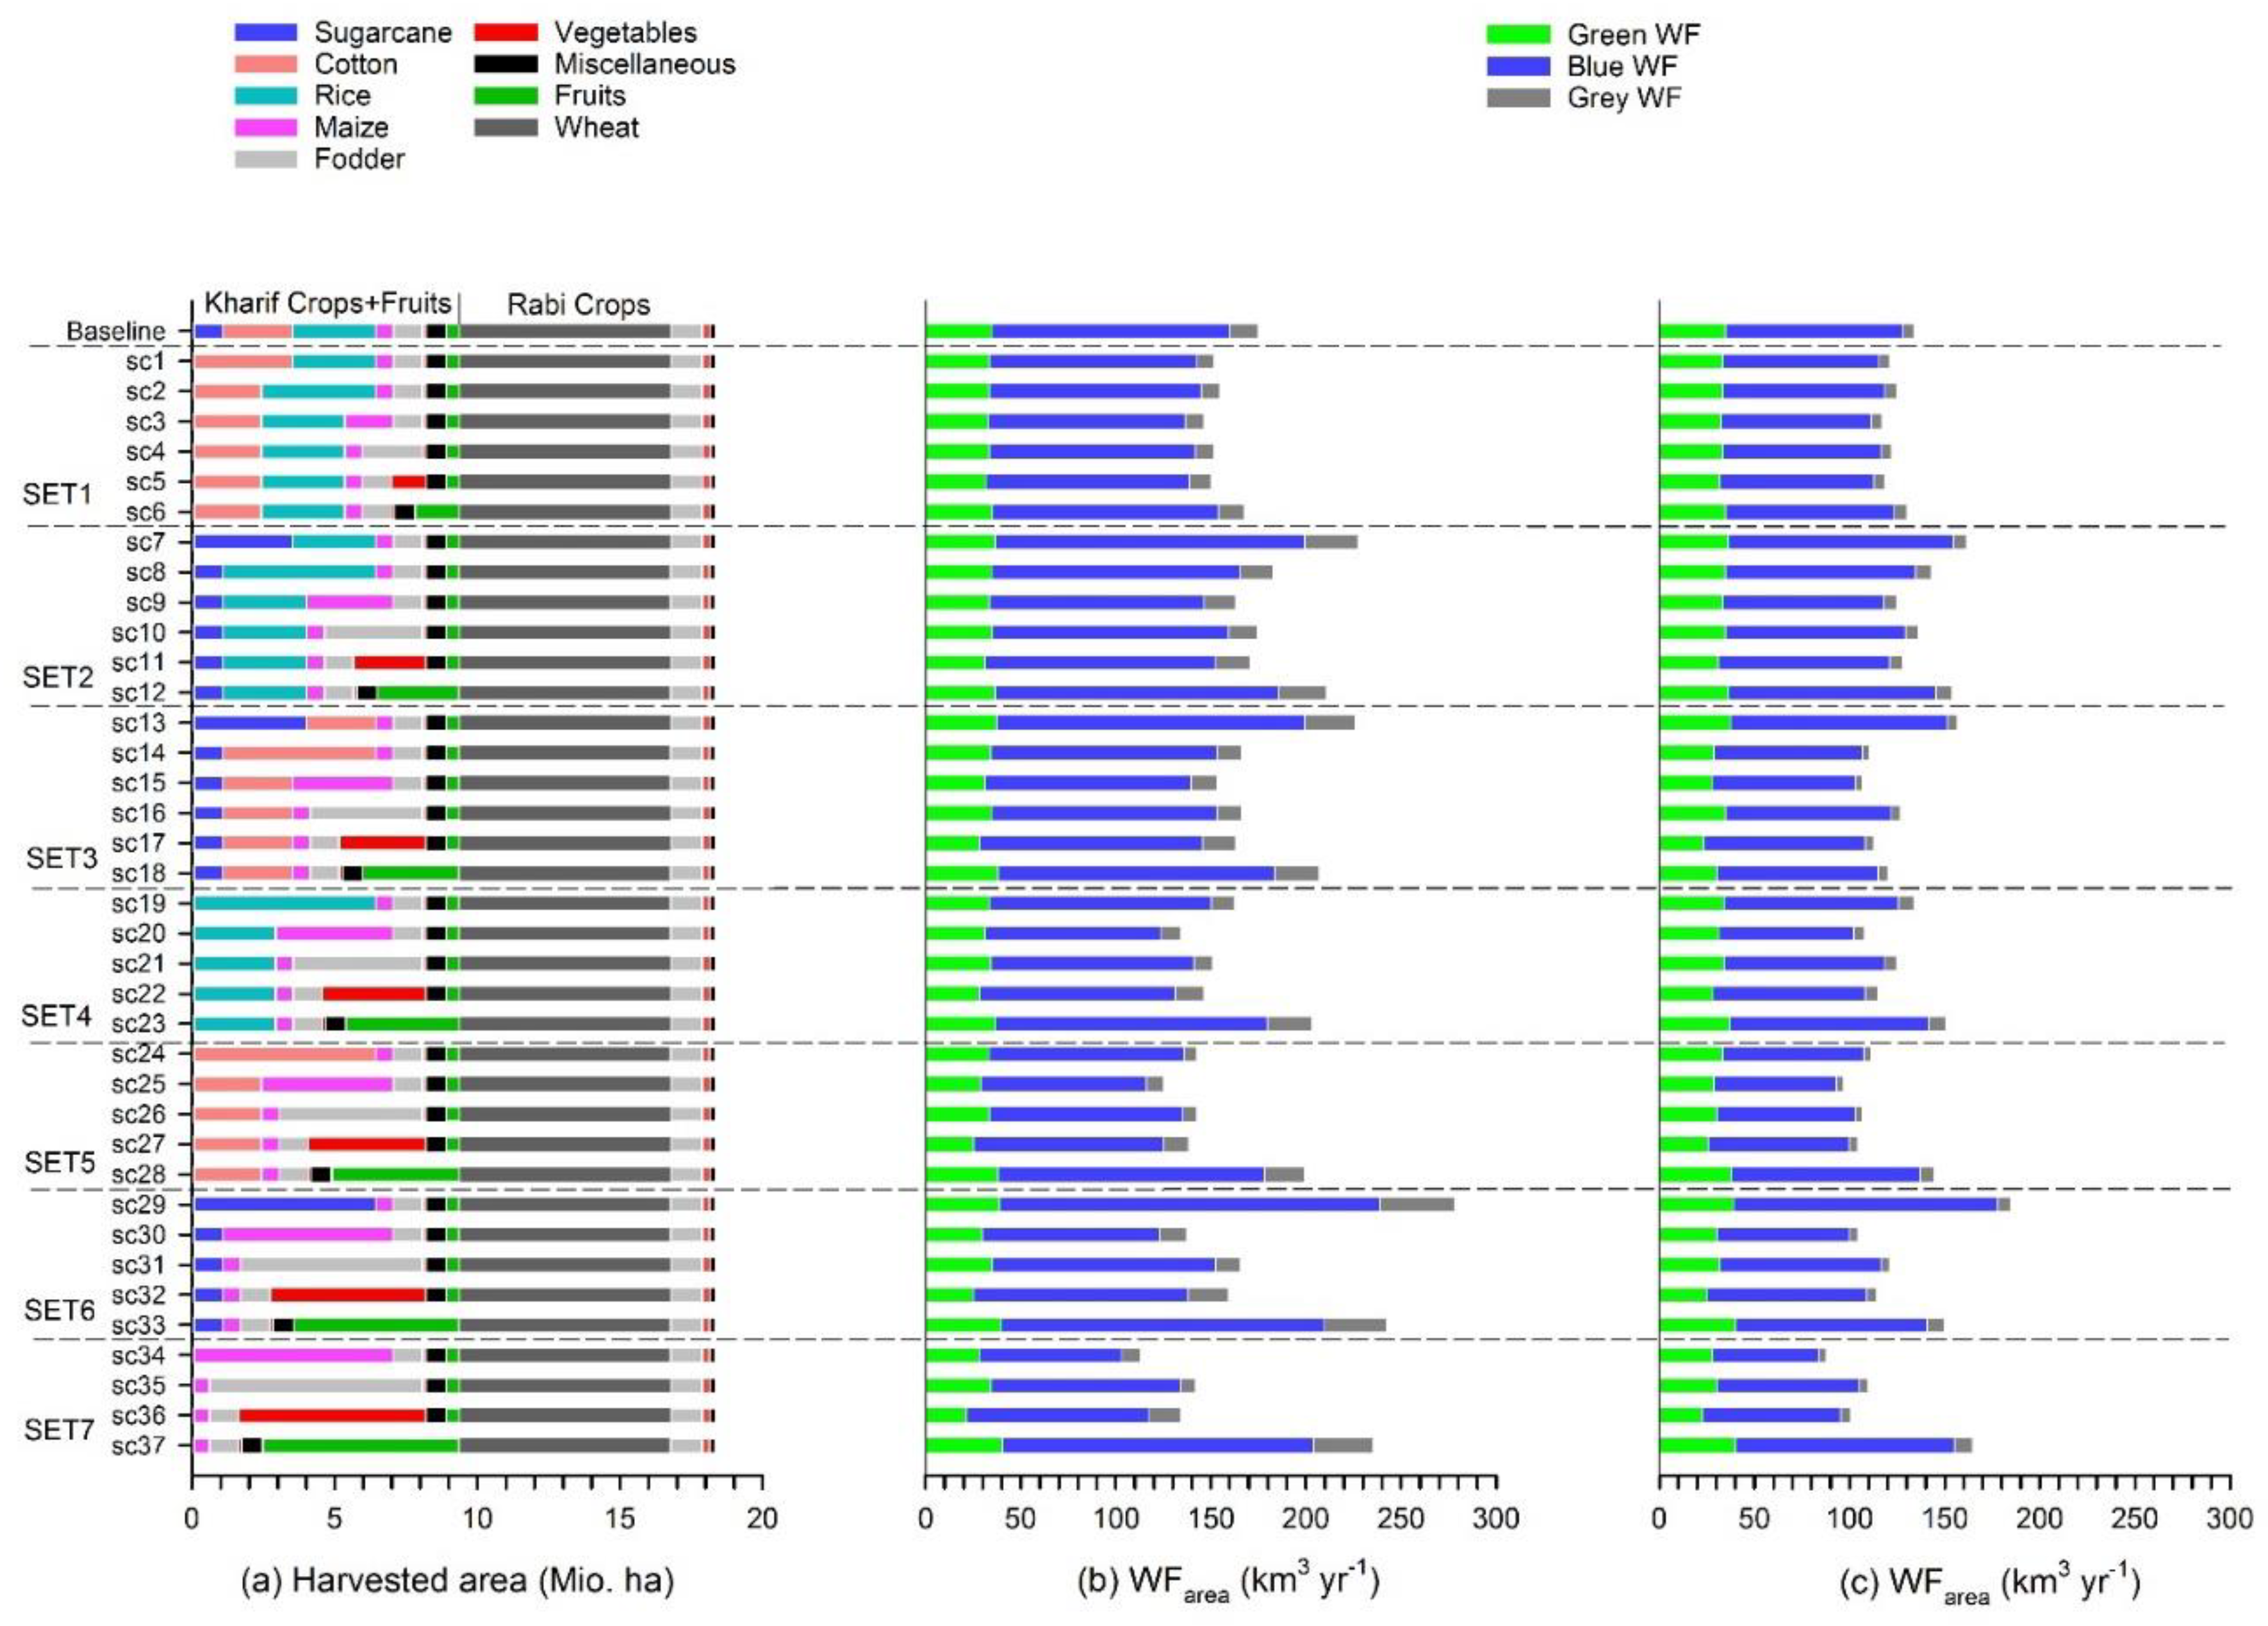
A number of straightforward scenarios (n = 37) are analyzed to derive optimal cropping sets in view of available water resources (Table A2). Scenarios are defined on the basis of the SPARE:WATER results. The year 2016 is considered as a baseline with a harvested area of 18.35 million hectares (49% Rabi, 48% Kharif and 3% annual crops) and a WFarea of 174 km3 (Figure A1). As can be seen, most of the water is consumed during the Kharif season with 64% of the annual WFarea. Whereas, Rabi and annual crops require 30% and 6% of the WFarea, respectively. In the Kharif season, cash crops i.e., sugarcane, cotton, and rice are dominating the WFarea by 85% (equal to 57% of the annual WFarea). Therefore, we developed multiple scenarios by substituting these three most water-intensive crops (with regard to their WFarea) in the form of a single crop replacement (or a set of two, and three crops with others) with other potential Kharif and annual crops (fruits), including other water demanding cash crops (i.e., sugarcane, cotton, and rice). We kept those water demanding crops in the scenarios to see potential effects of changes in irrigation efficiency on the total WF in different configurations of crop patterns. For the scenarios, we assume a constant total harvested area as given in the Baseline scenario year. For each scenario, the entire cropped area of one of the water-intensive crops is fully allocated to a single other crop (Table A2). In SET1 (sc1–sc6), sugarcane is replaced six times by another crop. Similarly, in SET2 (sc7–sc12) and SET3 (sc13–sc18), cotton and rice crops are replaced with other potential crops respectively. SET4–6 are similar setups but consider two crops to be substituted at a time allocated to one other crop i.e., sugarcane and cotton in SET4 (sc19–sc23), sugarcane and rice in SET5 (sc24–sc28) and cotton and rice in SET6 (sc29–sc33). Finally, SET7 (sc34–sc37) includes a full replacement of all water-intensive crops i.e., sugarcane, cotton, rice with other potential crops.
3. Results
3.1. Model Plausibility
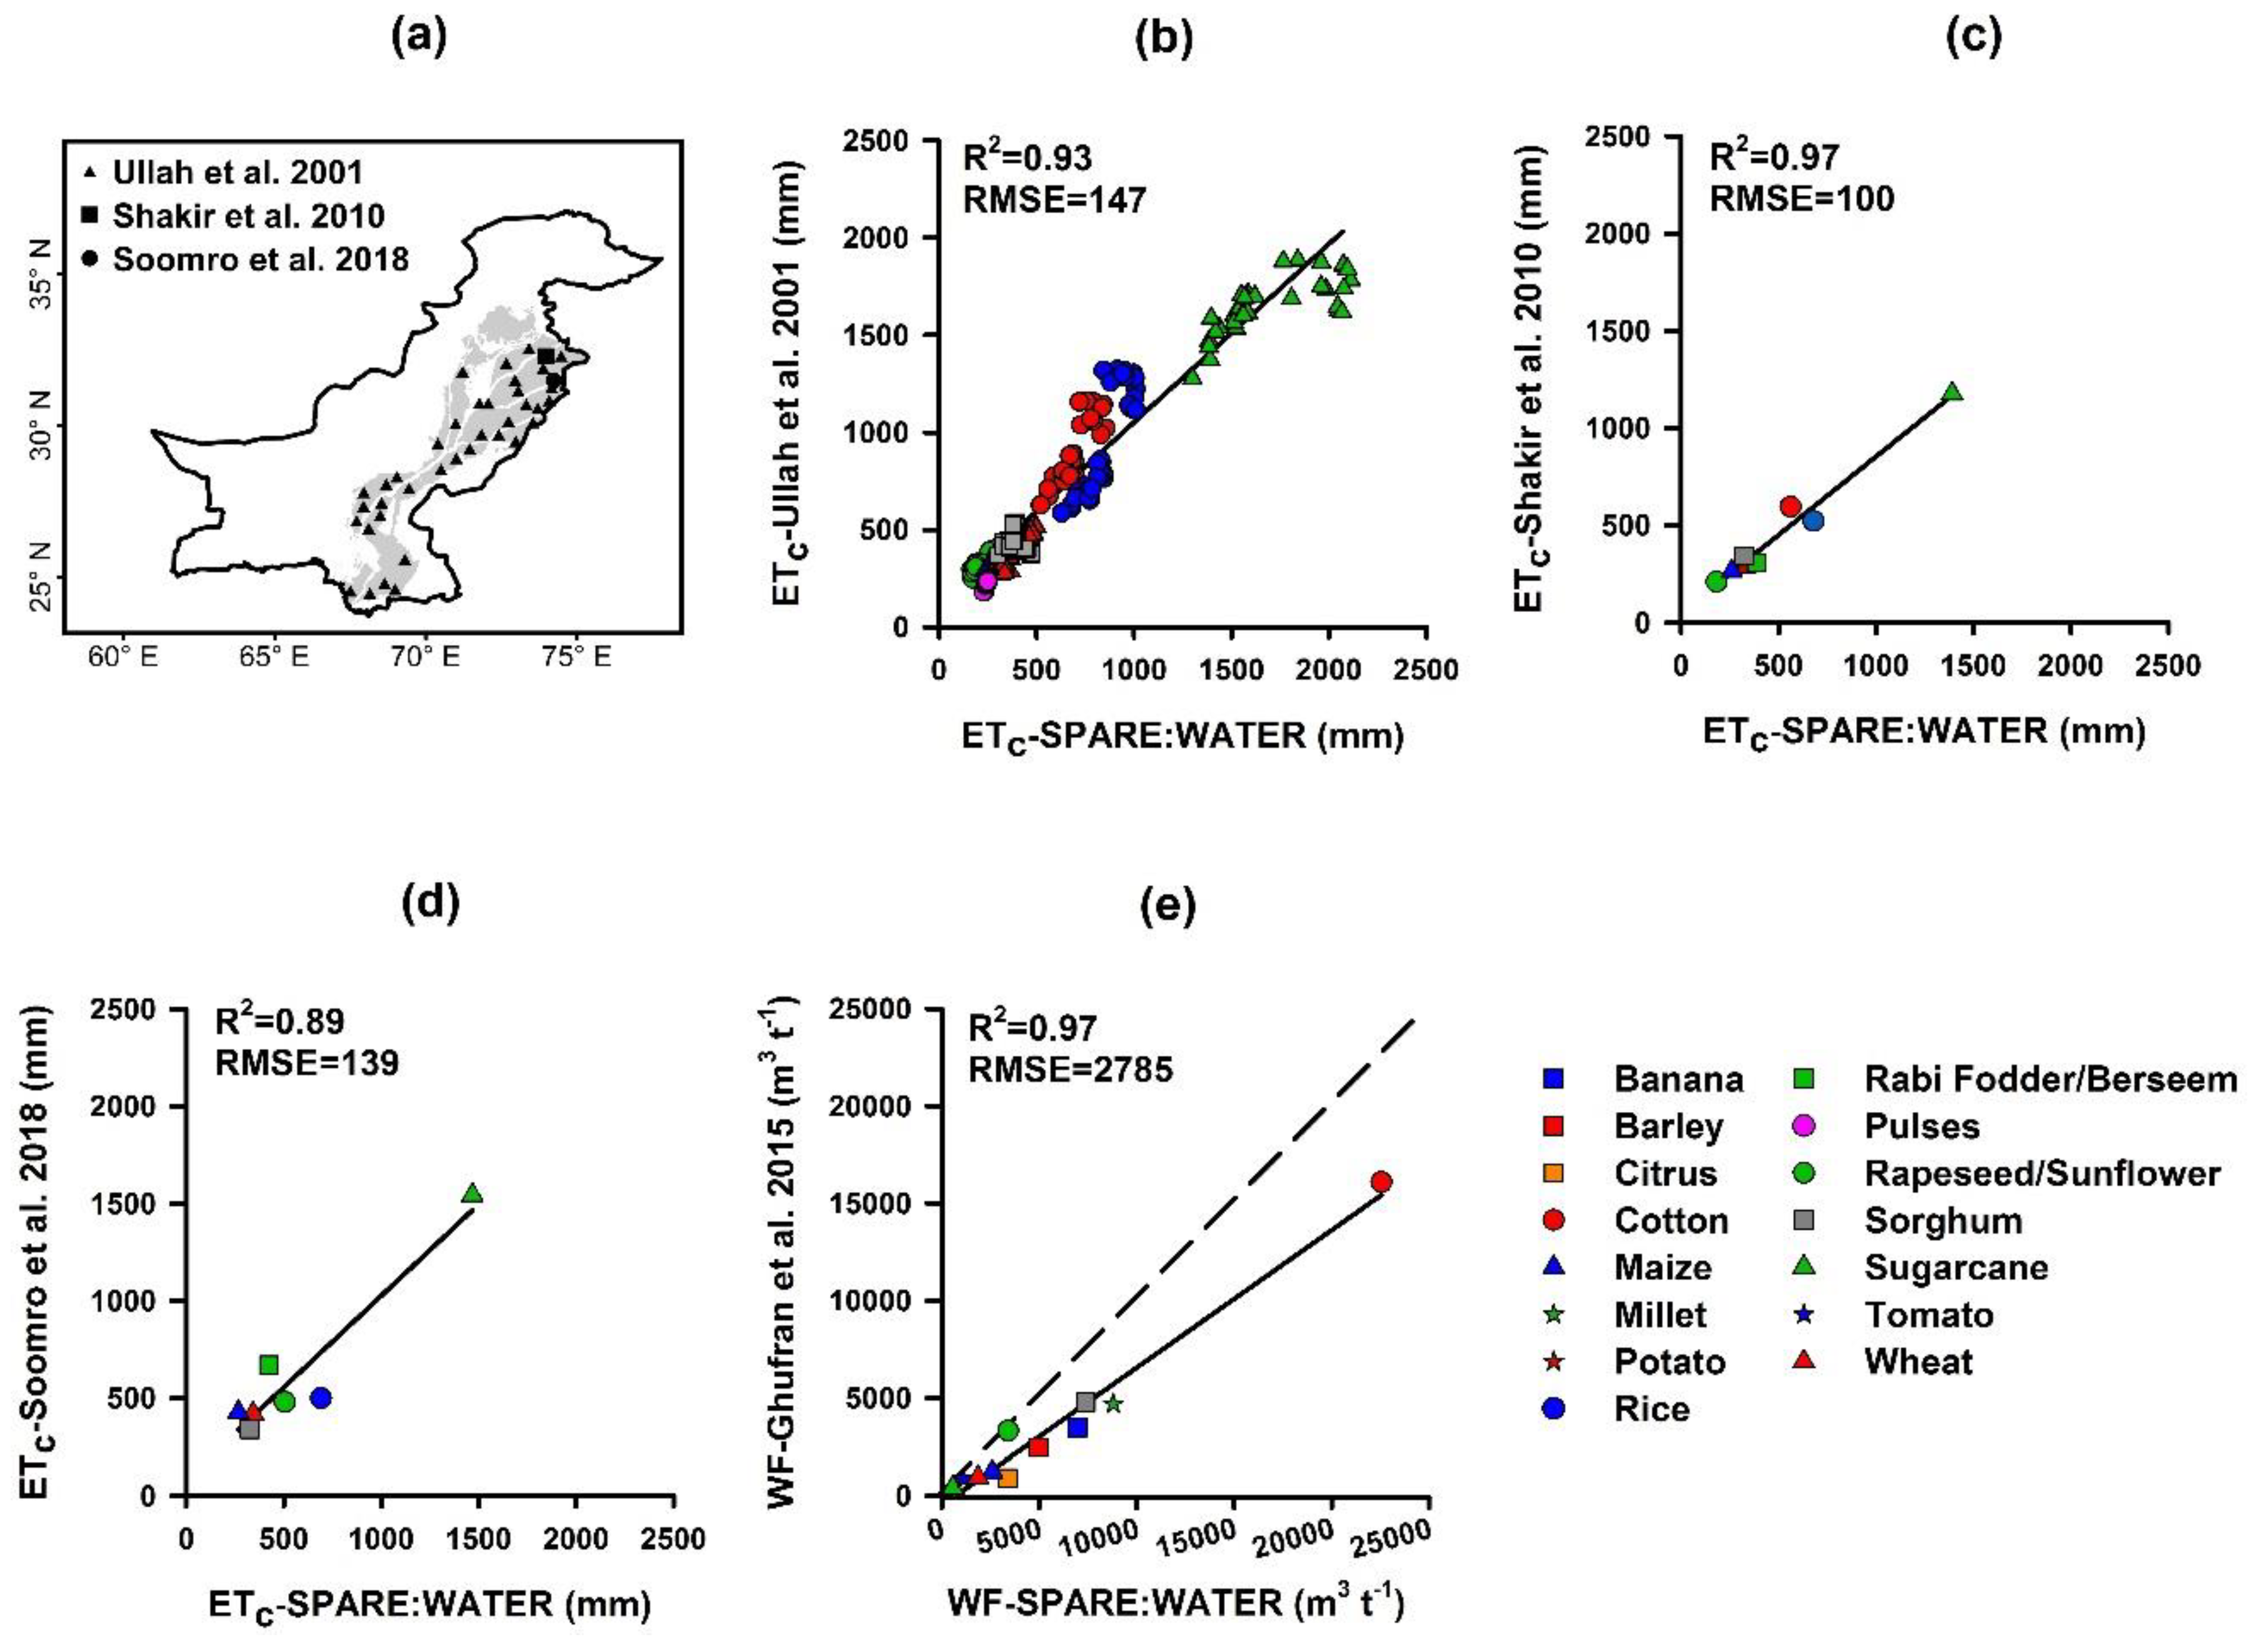
The results of SPARE:WATER are compared with literature data in two ways to test the plausibility of model. First, we contrast simulated ETc by selecting specific grid cells from SPARE:WATER for which corresponding published information is available (Figure 2a–d). In a second approach, we compare our simulations of WFcrop with other simulations (Figure 2e).
A comprehensive dataset of crop evapotranspiration for 8 main crops at 37 sites across the Indus basin of Pakistan has been published by Ullah et al. [40]. Their results are in line with ours (R2 = 0.93) (Figure 2a,b). The RMSE is also low (147 mm) indicating a very good match even for single crops. We conclude no structural deviation between the two assessments. Shakir et al. [42] have estimated the crop evapotranspiration for 8 main crops at one site in the Indus basin (Figure 2a,c). These results are also in the same range as SPARE:WATER, again with a high R2 = 0.97 and a low RMSE = 100 mm. Part of both high correlations can be explained by similar approaches on how ETc is estimated. Ullah et al. applied the FAO CROPWATER model that is based on the same FAO56 guideline that we used to estimate ETc in our SPARE:WATER set up. Similarly, Shakir et al. calculated their ETc values also on the principle of this guideline, and used—similar to SPARE:WATER—the same crop coefficients and lengths of growing seasons as presented by Ullah et al. Hence, the differences of ETc are due to different simulation periods (SPARE:WATER 1997–2016; Ullah et al., 20–25 years average without information on years; Shakir et al. 1999–2006). The simulation study by Soomro et al. [43] is also well aligned with the SPARE:WATER estimates given an R2 = 0.89 and RMSE = 139 mm (Figure 2a,d). They also followed the same FAO56 guidelines but estimated Kc values through a lysimetric approach and reported good agreement with the empirical values of Ullah et al. The correlation shows that ETc of rice is partially lower, whereas in the case of Rabi fodder it is somewhat higher than the SPARE:WATER results. This can be explained by different lengths of the growing season in the model set ups for rice (SPARE:WATER, Ullah et al. and Shakir et al. 190 days; Soomro et al. 104 days) and for Rabi fodder (SPARE:WATER 180 days; Soomro et al. 208 days).
With regard to the WFcrop, the SPARE:WATER values highly correlate with results published by Ghufran et al. [44]. However, the 1:1 line in Figure 2e indicates that the two models systematically deviate from each other, as the WFcrops reported by Ghufran et al. are always lower. One reason is that Ghufran et al. have not considered the grey WF in their simulations. Further, it remains unclear how (and if at all) Ghufran et al. considered irrigation losses as there is no description on how they set this value in the CROPWAT model (version 8.0) they used. Finally, another reason why absolute values of WFcrop can differ is the scale of application. SPARE:WATER calculates site specific WFcrop whereas Ghufran et al. [44] have estimated the WFcrop at the national level. Disregarding the difference in absolute values, results are highly correlated with R2 = 0.97 and RMSE 2785 m3 t−1. Overall the plausibility analysis shows that the SPARE:WATER results are comparable with literature data, both with regard to ETc and WFcrop.
3.2. Average Water Footprint of Crops
The green, blue, grey and total WF of major crops [45] are presented in Table 2 according to the cropping seasons. In the Kharif season, the highest value of WFcrop is estimated for cotton with 20,690 m3 t−1 because of the high IRR and a low crop yield of 0.53 t ha−1. Other crops such as rice, millet, sesame and sorghum have a somewhat lower, but still relatively high WFcrops of 7001, 10,240, 17,423 and 8997 m3 t−1, respectively. At the lower end of our estimation are maize, fodder and vegetables crops (i.e., maize 2969 m3 t−1, fodder 875 m3 t−1, okra 1766 m3 t−1, gourd 1515 m3 t−1, onion 862 m3 t−1 and tomato 1184 m3 t−1). Sugarcane has the lowest WFcrop in the Kharif season with 655 m3 t−1, but it has the highest IRR. This is due to the high biomass production of sugarcane with 50 t ha−1.
In the Kharif season, the fractions of the blue WFcrops are 58%–78%, and thereby only slightly lower compared to the Rabi season. The green WFcrop of cotton, rice, maize, fodder, and miscellaneous crops are larger in the range of 21%–33%, whereas vegetables and sugarcane have low green WFcrops of 8% to 12%, respectively. The grey WFcrop of vegetables and sugarcane are higher in the Kharif season by 28% and 17%, respectively, whereas all other crops range between 3%–14%.
In the Rabi season, highest WFcrops are calculated for wheat and miscellaneous crops. The values for vegetables and fodder crops are at the lower range because of the high yields of these crops, with on average 13 and 31 t ha−1, respectively. The fractions of the blue WF are in the range of 67%–85% and the green one of 6%–18%. The grey WF fractions are minor for most commodities except for vegetables (19–26%) and fodder (14%). In the case of annual crop (fruits), banana has the highest WFcrop with 7279 m3 t−1 whereas the WFcrops of other fruits are moderate, ranging between 1822 and 3397 m3 t−1, respectively. The blue WF fractions are high in the case of all annual crops with 70%–78%, while green WF fractions are in the range of 12%–25%. The grey WF fraction is comparatively higher with 6–17%.
3.3. Regional Water Footprint for the Period 1997–2016
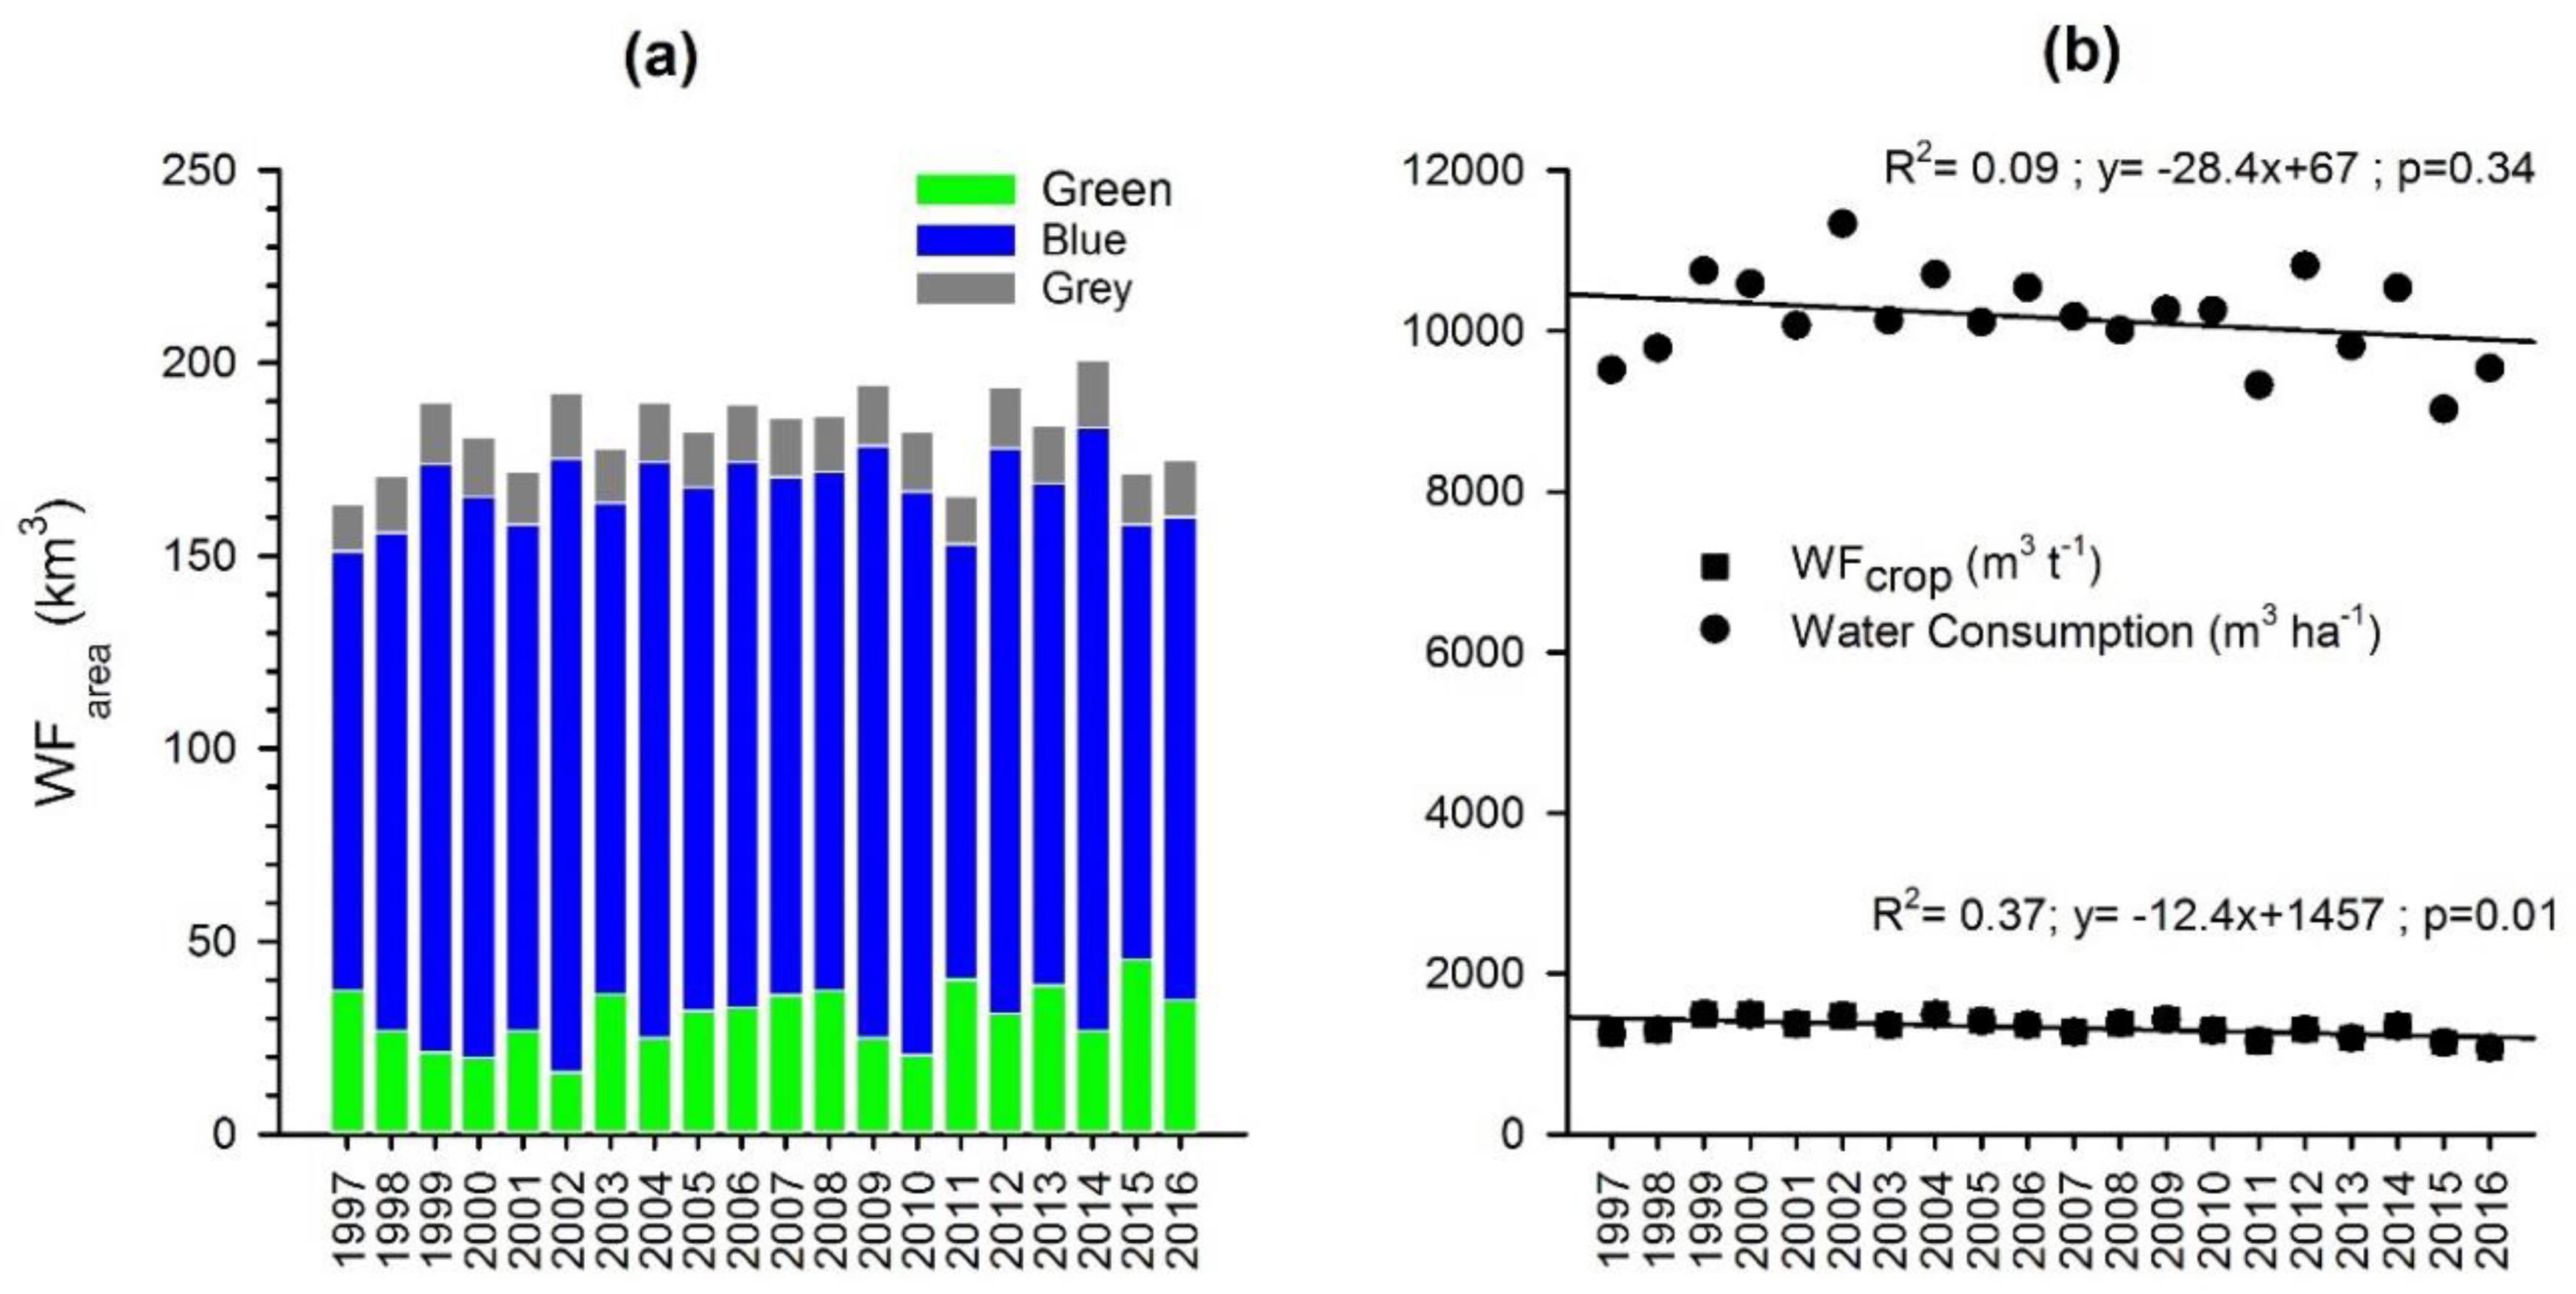
Results of the estimation of the WFarea for 1997–2016 is depicted in Figure A2a. There is a strong inter-annual variation with the lowest WFarea in 1997 (163 km3 yr−1) and the highest in 2014 (201 km3 yr−1). We find an overall negative trend of water productivity (m3 t−1) and water consumption (m3 ha−1) from 1997–2016 (Figure A2b). The modified Mann–Kendall test revealed that the trend is significant for water productivity (p = 0.01), but not significant for water consumption (p = 0.34). The average WFarea is estimated to 182 km3 yr−1, of which the blue WFarea component accounts for 75% (137 km3 yr−1), followed by the green and grey WFarea of 17% (30 km3 yr−1) and 8% (15 km3 yr−1), respectively.
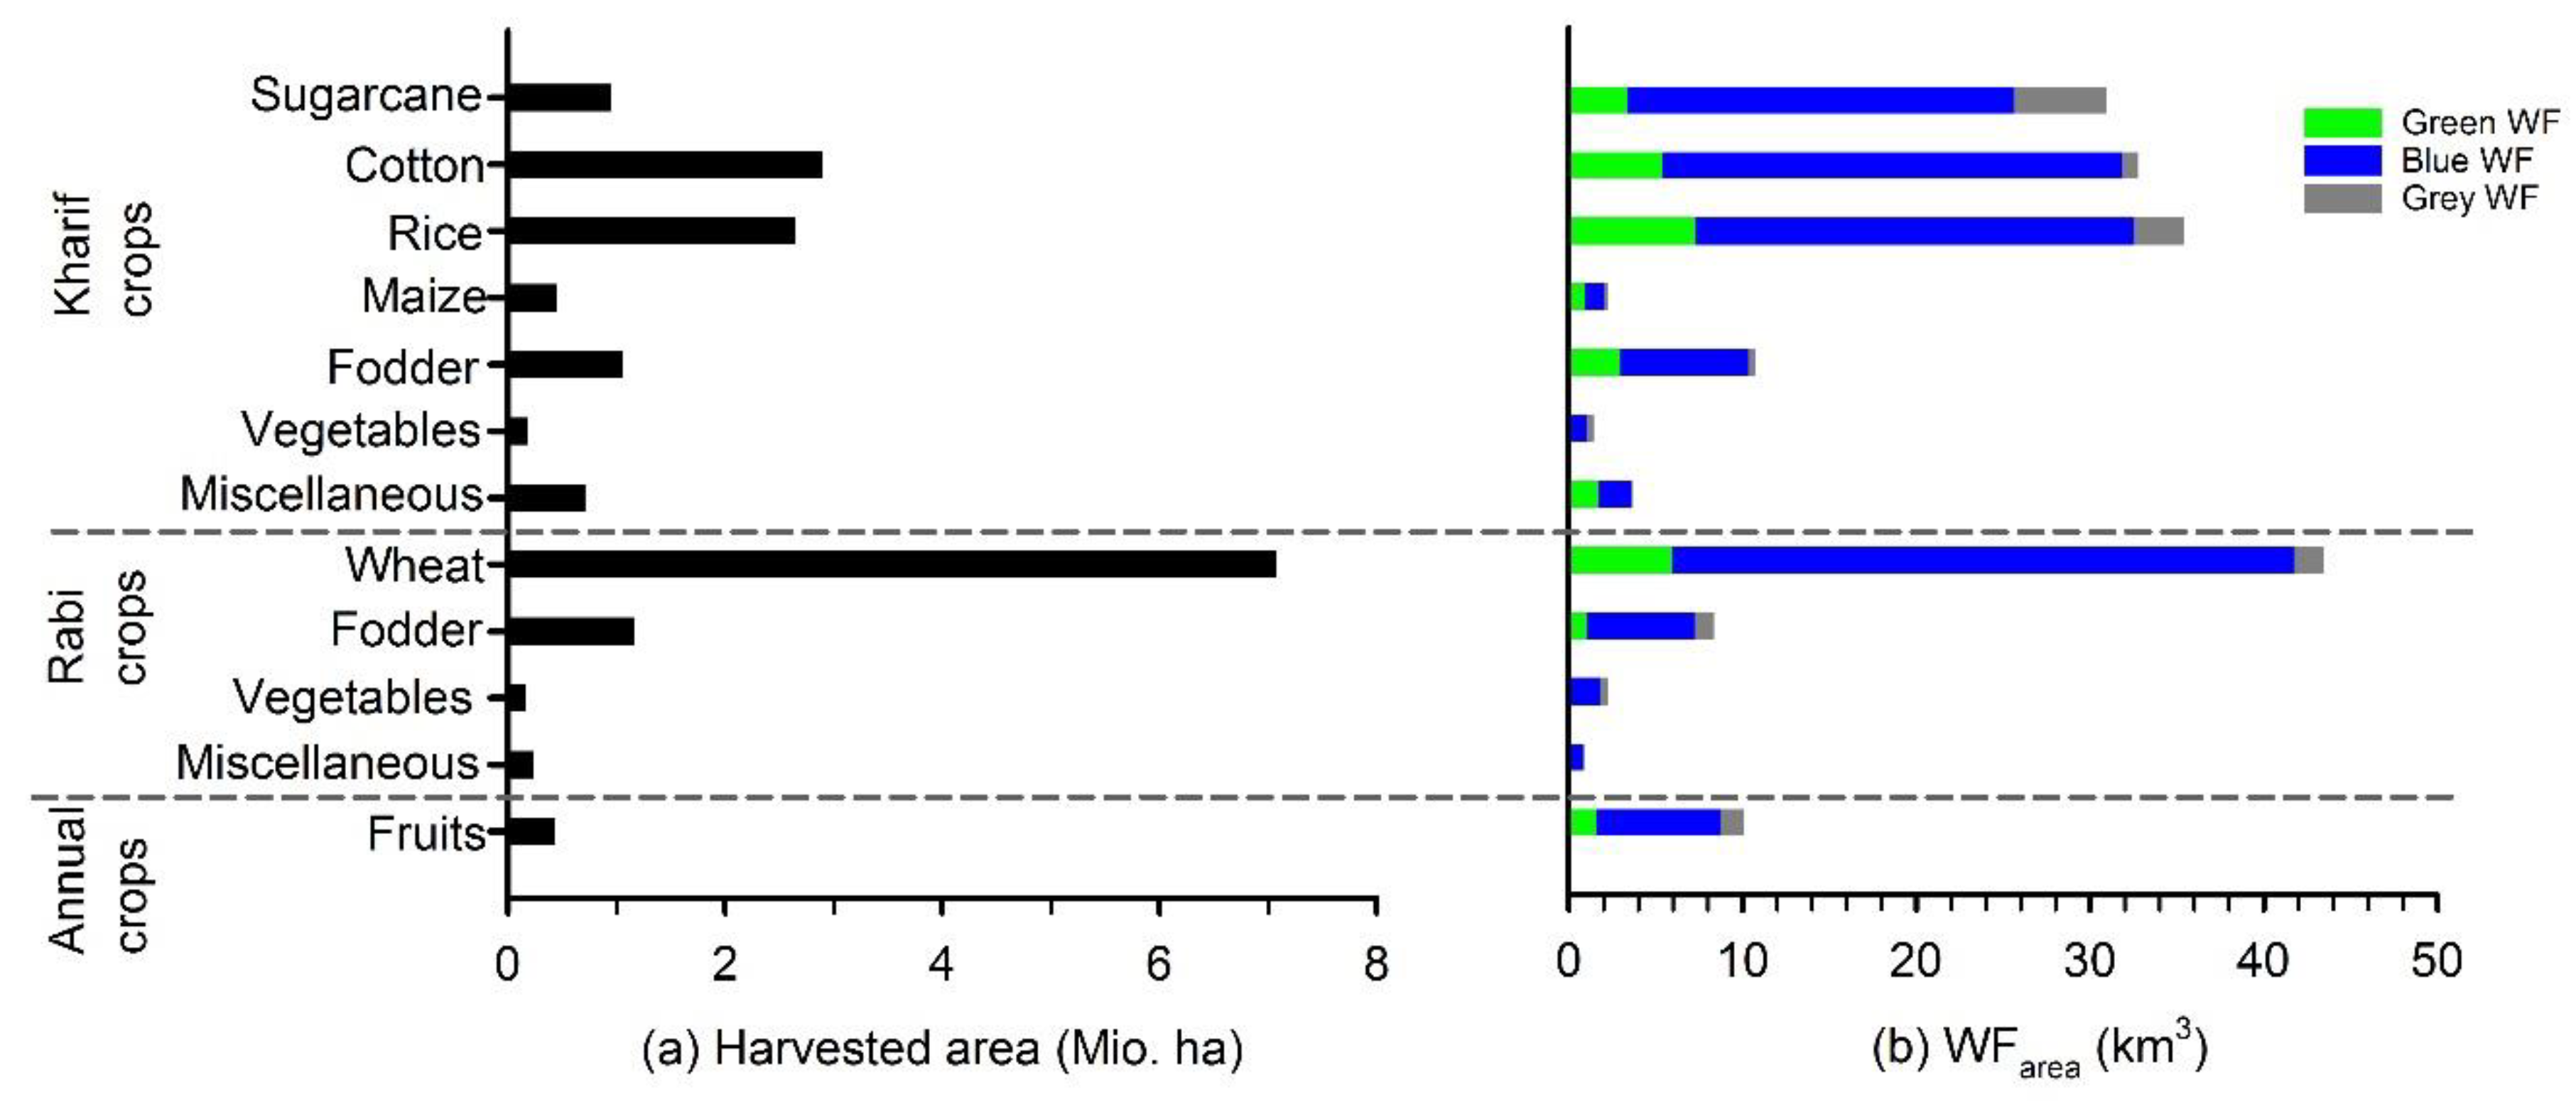
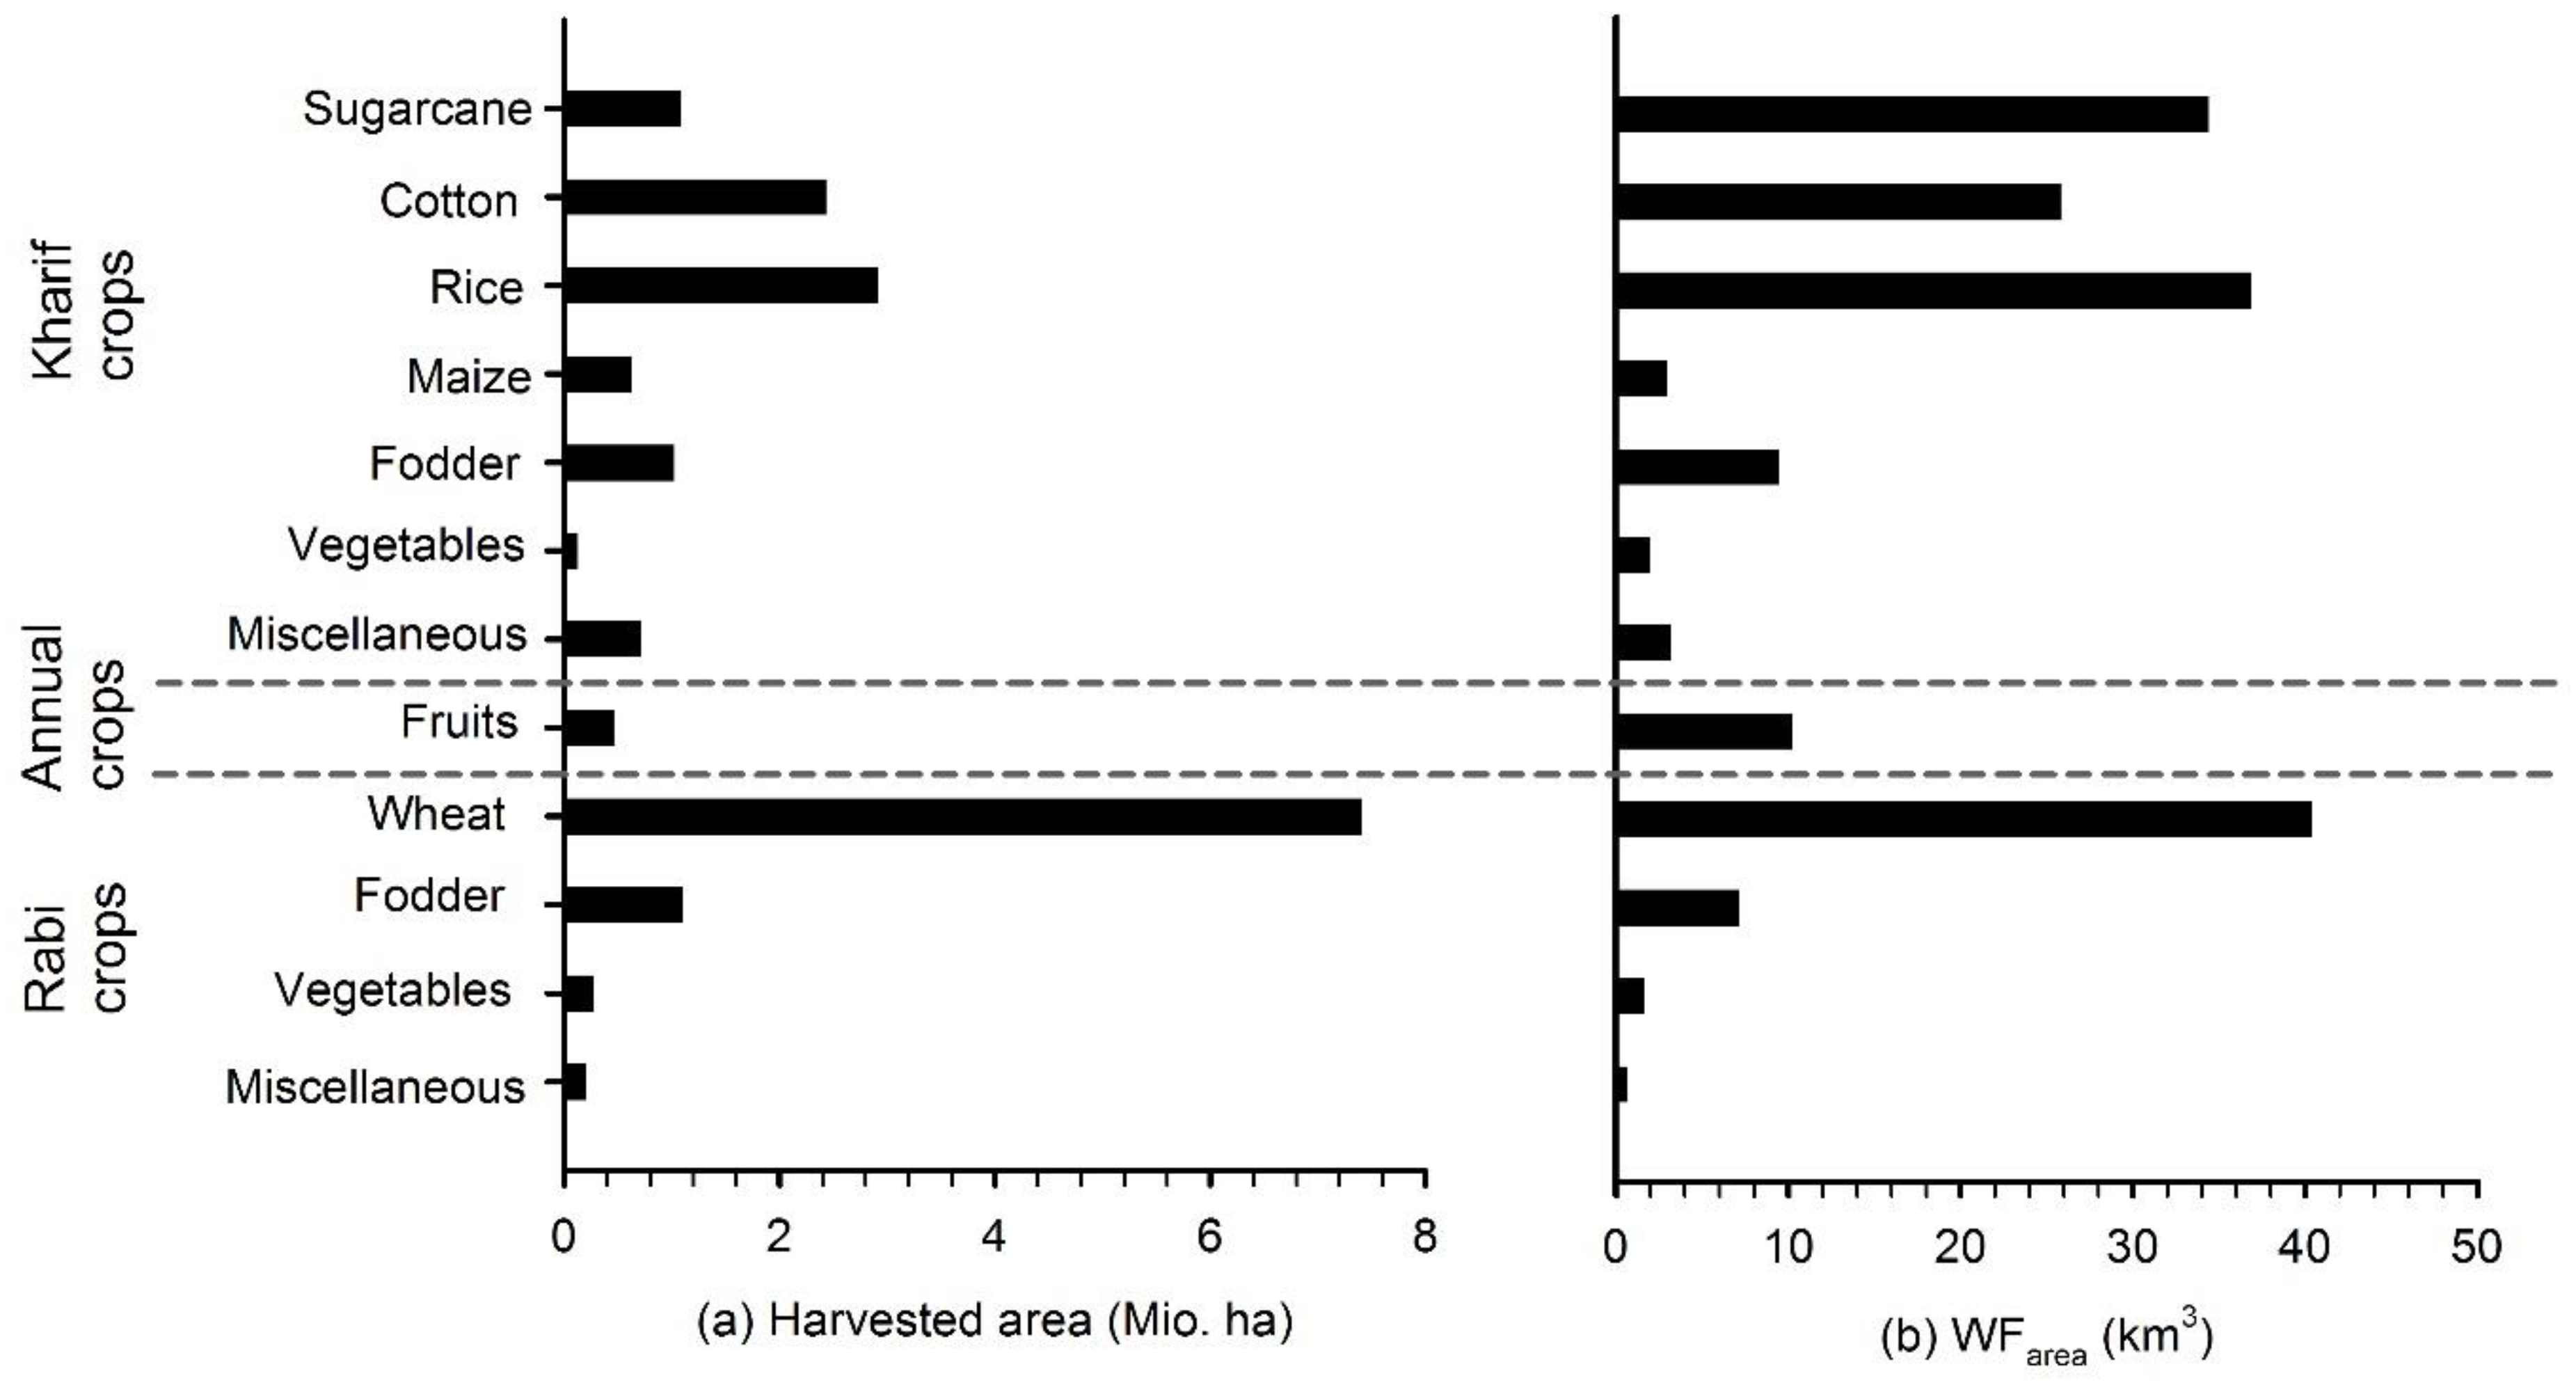
On a seasonal basis, the cropped area between the Rabi and Kharif remains stable while the share of commodities grown differ substantially (Figure 3a). The Rabi season is most important for wheat production (81% of the total area), which is the major food staple for the Pakistan people. Crop production is more diversified in the Kharif season with cotton, rice, fodder, and sugarcane sharing 33%, 30%, 12%, and 11% of the harvested area. On an annual basis, production of wheat requires the largest harvested area (39%) while cash crops (cotton, rice, sugarcane; note that rice is seen as a cash crop in Pakistan [46]) and all other crops are grown on 36% and 25% of the area, respectively. The Kharif crops have the largest share in the annual WFarea with 64%, followed by Rabi crops (30%) and annual crops with 6% (Figure 3b). Consumption of water in the Rabi season is dominated by wheat which consumes 79% of the Rabi WFarea. Cash crops consume a large volume of water in the Kharif season with 28%, 30%, and 27% of the total. On an annual basis, the cash crops consume 57% of the WFarea, while wheat requires only 24% of the WFarea. The share of all other crops is 19% in the annual comparison. Note that the seasonal attribution of WF we show here depends on the allocation of single crops to crop groups. Sorghum, for example, is grown in the Kharif season as a cereal crop while it is also utilized as a fodder crop in the same season. Shakir et al. [42] have not made this distinction and thus the cropping patterns they published deviate from ours.
3.4. Sensitivity Analysis
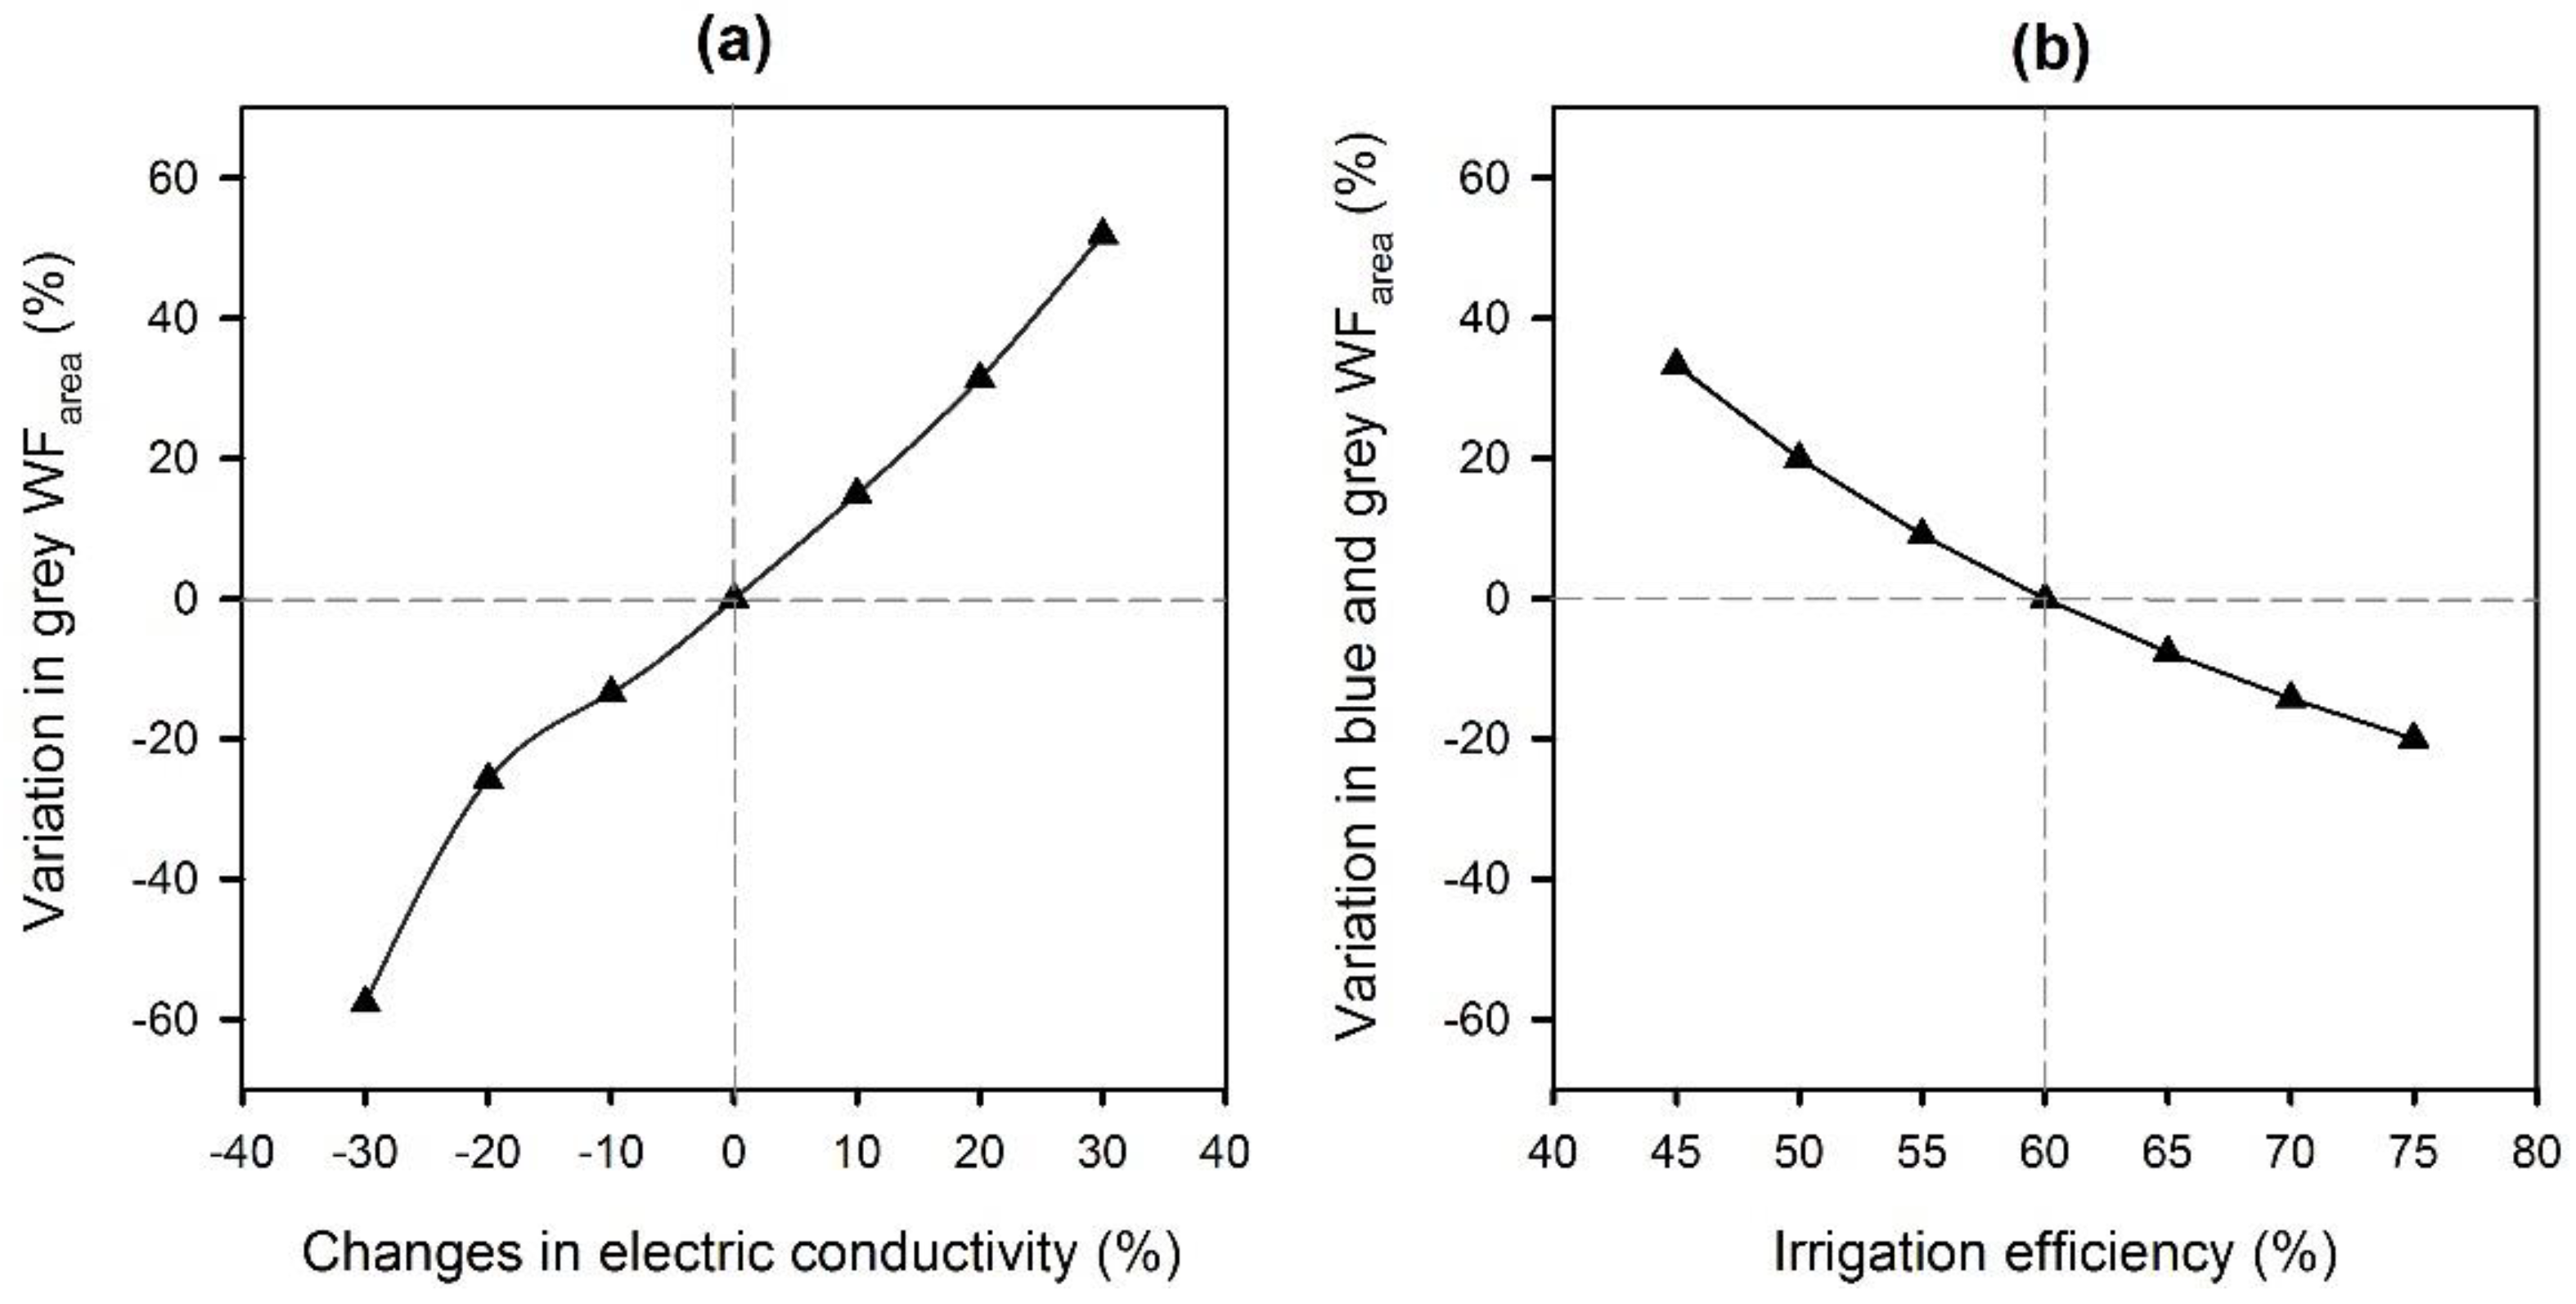
A sensitivity analysis is performed similar to the one factor at a time methodology, i) to investigate the dependence of the grey WFarea by changing the salinity of the irrigation water, and ii) to examine the effect of irrigation efficiency on the blue and grey WFarea. The results indicate that the grey WFarea increased up to 52% when salinity, expressed as electric conductivity (EC) of irrigation water, increases by 30%. Similarly, the grey WFarea decreased up to 58% when the EC decreased by 30% (Figure 4a). However, as the grey WFarea only amounts to 8% of the total WFarea, the effect of accounting a potentially erroneous salinity of the irrigation water does not change the overall results of our study.
This is different for the second component of our sensitivity analysis. As we have assumed a field efficiency of the surface irrigation method of 60%, this efficiency was set as a reference. The result shows that the blue and grey WFarea increased substantially by up to 33% for an efficiency of 45%, and decreased by 20% when the field efficiency improved from 60% to 75% (Figure 4b). Related to the total WFarea, such a change would increase/decrease the total WFarea by +24/−19%.
3.5. Scenario Analysis
Cash crops are high water-intensive crops in the Kharif season, consuming 57% of the annual water (see baseline in Figure A1). As an alternative, we established in total 37 scenarios by replacing each cash crop (or two/three cash crops) with a single other crop (Table A2, Figure 5a). Scenarios are grouped in sets according to the cash crop(s) replaced. As replacing crops, we considered all other Kharif crops including the cash crops and annual crops (i.e., sugarcane, cotton, rice, maize, fodder, vegetables, and fruits), but excluded miscellaneous crops. The changes in the WFarea for all scenarios are presented in Figure 5b. Figure 5c depicts an additional change of the irrigation efficiency and reduced salinities as outlined in the sensitivity analysis.
In SET1 (sc1–sc6), we substituted sugarcane which leads to a decrease in the WFarea of −4 to −16%. The largest decrease in sc3 is induced by increasing the cropped area of maize. SET2 (sc7–sc12) focused on replacing cotton, resulting in a diverse change of the WFarea with an increase of up to 30% (sc7) a reductions of up to −7% (sc9). The rice scenarios in SET3 (sc13–sc18) lead to increases of 29% (sc13) and 18% (sc18), and reductions of −5% to −12% for all other replacements. The fourth set of scenarios SET4 (sc19–sc23) considers the substitution of sugarcane and cotton with improvements in the WFarea of up to −23% (sc20) and a single combination with an increasing WFarea of 16% (sc23). SET5 (sc24–sc28) does not consider sugarcane and rice, achieving improvements of the WFarea by up to −28% (sc25) when growing maize and an increase when fruits are cultivated (sc28, +14%). The worst results are found for scenarios of SET6 (sc29–sc33) when sugarcane (+59%, sc29) and fruits (+39%, sc33) replace both, cotton and rice crops. Again, growing more maize leads to lowering the WFarea by −21% (sc30). Finally, in SET7 (sc34–sc37) sugarcane, cotton, rice are fully supplanted by maize, fodder, vegetables, and fruits, yielding reductions of −35%, −18%, −23% and an increase by 35%, respectively.
In all scenarios for which results are given in Figure 5b we assumed the traditional irrigation method (surface irrigation) as the current practice in Pakistan. To estimate the potential effect of improved irrigation technologies (i.e., application of drip irrigation for cotton, sugarcane, maize, vegetables and fruits whereas sprinkler for all other commodities) we re-run all scenarios (Figure 5c).
Water consumption of the current cropping pattern (baseline) can be reduced by −23% through improved irrigation. The overall highest WFarea reduction of −50% is found for sc34 by substituting sugarcane, cotton, and rice with maize, followed by sc25 (−44%, sugarcane, and rice substituted with maize), sc36 (−43%, sugarcane, cotton, and rice substituted with vegetables) and sc27 (−41%, sugarcane and rice substituted by vegetables). These results confirm that improved irrigation technologies have a very positive impact on water saving.
4. Discussion
4.1. Water Consumption and Policy Implication
In 2018, Pakistan’s government has developed a water policy to ensure water and food security for the growing population. It specifies that future cropping patterns should be adjusted at the low delta crops through improved irrigation technologies. This policy has been established at the federal level as a national framework and it has been directed to provinces to make a master plan for the management of water resources. This study support the development of alternative water management strategies, through the evaluation of the water footprint. Numerous studies have suggested that a WF assessment can be a useful approach to evaluate management practices [47,48,49]. It has been also discussed as a tool for policy implication in various regions. Spain’s government has officially linked the WF analysis to decision making for new developing projects [50,51]. Liu et al. [52] argued that current water policies of China are based on blue water consumption. However, it should be revised to take green water into account to further improve the water use efficiency. The potential of WF assessment as a performance indicator was also discussed by Dong et al. [53] for policy implication in the Liaoning province of China.
Here we analyzed the WF of Pakistan’s agriculture to estimate the volume of water used during 1997–2016 to produce crops. Such type of analysis is useful to derive how much green versus blue water is needed for crop production [54]. According to our estimates, the average water consumption in the study area is 182 km3 yr−1, of which 75% are allocated to blue water, 17% to green water and 8% to grey water, respectively. Sugarcane, cotton, and rice (cash crops) in Kharif and wheat in the Rabi season are the most commonly grown crops. Among them, sugarcane is the most water-intensive crop, followed by rice and cotton. These three crops are cultivated on 36% of the annual harvested area in the Kharif season, but consume about 57% of the annual WFarea. Wheat is cultivated as a food crop on 39% of the annual harvested area in the Rabi season. However, it consumes only 24% of the annual WFarea.
4.2. Alternative Water Management Practices
In line with Pakistan’s ambition to reduce water consumption, we analyzed a number of simply water-saving strategies, i.e., by optimization of cropping patterns and through improvements of applied irrigation technologies. Adjusted cropping pattern allow to reduce the WFarea by up to −35% (sc34) through substituting the cash crops (i.e., sugarcane, cotton, and rice) with maize, while keeping the total cropped area constant. Apart from this ultimate scenario, sc1 (i.e., substitute sugarcane with cotton) and sc24 (i.e., substitute sugarcane and rice with cotton) are more balanced cropping patterns which reduce the water consumption by −13% and −18%, respectively. In light of these findings, we recommend to grow cotton in the harvested area of all cash crops if the absolute termination of all cash crops is not applicable. Various other studies conducted in different regions also indicate that the optimization of cropping patterns is a key approach to reduce the WF of a region or catchment [55,56,57]. Ghasemi et al. [58] showed that the redistribution of cropping patterns can be linked to the effective use of water resources in Iran. Zheng et al. [59] confirmed that the adjustment of cropping pattern is a key solution for water management of arid and semi-arid regions.
In the second part, we investigated the impact of optimal cropping patterns along with improvements of irrigation technologies. The results indicate that water consumption of the baseline cropping pattern (2016) can be reduced by up to −23 % through technological optimization alone. The WFarea of scenarios can even be decreased by up to −50% through the combined implementation of optimal cropping patterns and improved irrigation technologies. The technology changes lead to a decrease in water consumption for all cropping scenarios except for sc29 (i.e., cotton and rice replaced with sugarcane) as compared to the baseline cropping pattern at current irrigation settings. The benefits of improved irrigation have been also discussed in other studies. For examples, Maisiri et al. [60] investigated the impact of irrigation technologies on maize and vegetable crops at an experimental site in the Limpopo basin of Zimbabwe, and Liu et al. [61] found that less water was consumed when wheat was irrigated with sprinkler than surface irrigation in North China.
In Pakistan, most agricultural fields are irrigated with surface irrigation methods [62]. Although various efforts have been made over the last three decades to introduce more efficient irrigation technologies, the results are not remarkable [63,64]. The high initial cost is one of the main reasons for the adoption of these technologies [65]. Rodrigues et al. [66] studied the economic impacts of drip and sprinkler irrigation on maize crops in southern Brazil and concluded that the comparative advantages of water-saving are insufficient to recover the initial cost of the system. The Punjab government and World Bank have introduced a joint project (PIPIP, 2012–2021) on a subsidy basis to install high-efficiency irrigation systems on approximately 50,000 hectares in the Punjab province [67]. Such types of projects can help to promote irrigation technologies among farmers by reducing the initial investment. Qamar et al. [68] investigated the implementation strategies in the Punjab province for the sustainability of irrigation systems and recommended that water prices need to be sufficiently high to promote water-saving technologies among farmers. In another study, Kahlown et al. [69] do not expect an adaptation of irrigation technologies in the Indus basin command areas due to the low price of water. However, further investigation should be conducted on water price formulation to encourage the farmers for improvements of irrigation technologies.
5. Conclusions
In this paper, we have evaluated a number of water-saving strategies in the irrigated areas of the Punjab and Sindh provinces in Pakistan. We have shown that substantial reductions in water consumption are possible through changes in cropping patterns. In the scenarios of changing cropping patterns, we substituted water-intensive cash crops (i.e., sugarcane, cotton, rice) with less water-intensive crops (i.e., maize, fodder, and vegetables) or replaced comparatively high water-intensive cash crops with less water-intensive cash crops. We further show that water savings are possible by shifting the irrigation method from surface irrigation to improved irrigation technologies (sprinkler and drip irrigation).
Additionally, socio-economic aspects may have an important role in the adoption of alternative management practices. Abdulai et al. [70] showed that the household and farm characteristics such as age, education, income, loan accessibility, farm size, and location of the irrigation sources played a vital role in south Ghana for the selection of irrigation technologies and cropping patterns. Rehman et al. [71] investigated the economic impact of major crops on the GDP of Pakistan and indicated that cotton, wheat, rice, and maize crops have a positive relationship with GDP while sugarcane crops have a negative effect. In another study, Mujtabai et al. [72] recognized that stopping the exports of agriculture commodities is not a wise decision for the economic perspective of a country, so net benefits of alternative cropping patterns should be close to the current benefits. Aldaya et al. [50] highlighted that ‘more crop per drop’ investigation should also consider economic aspects to achieve ‘more cash per drop’ at the same time.
Apart from economic considerations, the impact of future climate changes in the Indus basin should also be considered. Rasul et al. have shown that these changes can reduce crop productivity and degrade the available water resources in upcoming years due to spatial and temporal changes in temperature and rainfall [73]. Awan et al. [74] predicted that climate changes will cause to rise the irrigation requirements by 7%–11% in the region due to fluctuations in temperature and rainfall. Henceforth, we propose that joint social, economic and climate change impacts of alternative practices should be assessed in future studies to achieve sustainable development in water policy implications.
The current study is conducted to evaluate the water-saving strategies at the basin-level by choosing a random combination of crops. Future optimization strategies should include spatially adapted crop combinations, preferably in dependence of localized accessibility of groundwater and its quality. Multsch et al. [36] have shown the value of such an optimization tool for the use of a limited water resource obtained from desalination in Saudi-Arabia. In addition, a similar type of a user-friendly decision support tool could be developed for field level application. Such a tool could provide farmers directly with information on optimal cropping patterns. We also recommend that apart from the proposed water-saving strategies, other alternative management techniques, directed to off-farm (i.e., improved infrastructure to reduce water losses due to poor conveyance efficiency) and on-farm (e.g., deficit irrigation or soil mulching) management, should be evaluated in future studies to develop a comprehensive water policy for Pakistan.
Author Contributions
Conceptualization of the M.M. and L.B.; methodological set up M.M.; data analysis M.M., L.B. and A.Z.; writing of the original draft M.M.; review and editing M.M., L.B. and A.Z. All authors have read and agreed to the published version of the manuscript.
Funding
This research has not received any external funding.
Acknowledgments
M.M. acknowledges the Higher Education Commission of Pakistan (HEC), the German Academic Exchange services (DAAD) and the University of Agriculture Faisalabad-Pakistan for supporting this study (DAAD-91716371). The authors are thankful to the Pakistan Metrological Department (PMD), the International Water logging and Salinity Institute, Lahore (IWASRI) and the Pakistan Bureau of Statistics for providing data for this research. We would also like to thank Sebastian Multsch for clarification of specific questions regarding the SPARE:WATER software.
Conflicts of Interest
The authors have no conflict of interests.
Appendix A
Figure A1.
(a) Harvested area; and (b) WFarea of crop production for the baseline year 2016.

Figure A2.
Trends of (a) water footprint components; and (b) water productivity (m3 t−1); and water consumption (m3 ha−1) from 1997–2016.
Figure A2.
Trends of (a) water footprint components; and (b) water productivity (m3 t−1); and water consumption (m3 ha−1) from 1997–2016.


Table A1.
Crop coefficients (Kc) used in this study.
| Category | Crops | Crop Coefficients | Source | ||
|---|---|---|---|---|---|
| Kc in | Kc mid | Kc end | |||
| Cereal | Maize | 0.15 | 0.82 | 0.47 | Ullah et al. [40] |
| Rice | 0.28 | 1.26 | 0.44 | ||
| Sorghum | 0.23 | 0.92 | 0.52 | ||
| Wheat | 0.36 | 1.16 | 0.40 | ||
| Fiber | Cotton | 0.44 | 1.11 | 0.38 | |
| Sugar | Sugarcane | 0.52 | 1.17 | 0.88 | |
| Oilseed | Rapeseed | 0.25 | 0.97 | 0.32 | |
| Leguminous | Pulses | 0.37 | 0.95 | 0.34 | |
| Cereal | Barley | 0.30 | 1.15 | 0.25 | FAO Dataset [32] |
| Millet | 0.30 | 1.00 | 0.30 | ||
| Vegetables | Carrot | 0.70 | 1.05 | 0.95 | |
| Garlic | 0.70 | 1.00 | 0.70 | ||
| Gourd | 0.50 | 1.00 | 0.80 | ||
| Onion | 0.70 | 1.05 | 0.75 | ||
| Okra | 0.70 | 1.05 | 0.95 | ||
| Spinach | 0.70 | 1.00 | 0.95 | ||
| Tomato | 0.60 | 1.15 | 0.70 | ||
| Turnip | 0.50 | 1.10 | 0.95 | ||
| Spice | Pepper | 0.60 | 1.05 | 0.90 | |
| Tuber | Potato | 0.50 | 1.15 | 0.75 | |
| Oilseed | Sesame | 0.35 | 1.15 | 0.35 | |
| Fodder | Berseem | 0.40 | 0.90 | 0.85 | |
| Fruits | Banana | 1.00 | 1.20 | 1.10 | |
| Citrus | 0.75 | 0.70 | 0.75 | ||
| Dates | 0.90 | 0.95 | 0.95 | ||
| Mango | 0.60 | 0.80 | 0.60 | ||
| Guava | 0.80 | 1.00 | 0.80 | ||
Table A2.
Harvest area of the baseline year 2016 and the 37 cropping scenarios.
| Harvested Area (Million Hectares yr−1) | |||||||||||||
|---|---|---|---|---|---|---|---|---|---|---|---|---|---|
| SET | Scenarios | Kharif Season Crops | Annual Crops | Rabi Season Crops | |||||||||
| Sugarcane | Cotton | Rice | Maize | Fodder | Vegetables | Miscellaneous | Fruits | Wheat | Fodder | Vegetables | Miscellaneous | ||
| Baseline | 1.09 | 2.43 | 2.92 | 0.62 | 1.02 | 0.12 | 0.71 | 0.46 | 7.41 | 1.10 | 0.27 | 0.20 | |
| SET1 | sc1 | 0 | 3.52 | 2.92 | 0.62 | 1.02 | 0.12 | 0.71 | 0.46 | 7.41 | 1.10 | 0.27 | 0.20 |
| sc2 | 0 | 2.43 | 4.01 | 0.62 | 1.02 | 0.12 | 0.71 | 0.46 | 7.41 | 1.10 | 0.27 | 0.20 | |
| sc3 | 0 | 2.43 | 2.92 | 1.71 | 1.02 | 0.12 | 0.71 | 0.46 | 7.41 | 1.10 | 0.27 | 0.20 | |
| sc4 | 0 | 2.43 | 2.92 | 0.62 | 2.12 | 0.12 | 0.71 | 0.46 | 7.41 | 1.10 | 0.27 | 0.20 | |
| sc5 | 0 | 2.43 | 2.92 | 0.62 | 1.02 | 1.22 | 0.71 | 0.46 | 7.41 | 1.10 | 0.27 | 0.20 | |
| sc6 | 0 | 2.43 | 2.92 | 0.62 | 1.02 | 0.12 | 0.71 | 1.55 | 7.41 | 1.10 | 0.27 | 0.20 | |
| SET2 | sc7 | 3.52 | 0 | 2.92 | 0.62 | 1.02 | 0.12 | 0.71 | 0.46 | 7.41 | 1.10 | 0.27 | 0.20 |
| sc8 | 1.09 | 0 | 5.34 | 0.62 | 1.02 | 0.12 | 0.71 | 0.46 | 7.41 | 1.10 | 0.27 | 0.20 | |
| sc9 | 1.09 | 0 | 2.92 | 3.04 | 1.02 | 0.12 | 0.71 | 0.46 | 7.41 | 1.10 | 0.27 | 0.20 | |
| sc10 | 1.09 | 0 | 2.92 | 0.62 | 3.45 | 0.12 | 0.71 | 0.46 | 7.41 | 1.10 | 0.27 | 0.20 | |
| sc11 | 1.09 | 0 | 2.92 | 0.62 | 1.02 | 2.55 | 0.71 | 0.46 | 7.41 | 1.10 | 0.27 | 0.20 | |
| sc12 | 1.09 | 0 | 2.92 | 0.62 | 1.02 | 0.12 | 0.71 | 2.88 | 7.41 | 1.10 | 0.27 | 0.20 | |
| SET3 | sc13 | 4.01 | 2.43 | 0 | 0.62 | 1.02 | 0.12 | 0.71 | 0.46 | 7.41 | 1.10 | 0.27 | 0.20 |
| sc14 | 1.09 | 5.34 | 0 | 0.62 | 1.02 | 0.12 | 0.71 | 0.46 | 7.41 | 1.10 | 0.27 | 0.20 | |
| sc15 | 1.09 | 2.43 | 0 | 3.53 | 1.02 | 0.12 | 0.71 | 0.46 | 7.41 | 1.10 | 0.27 | 0.20 | |
| sc16 | 1.09 | 2.43 | 0 | 0.62 | 3.94 | 0.12 | 0.71 | 0.46 | 7.41 | 1.10 | 0.27 | 0.20 | |
| sc17 | 1.09 | 2.43 | 0 | 0.62 | 1.02 | 3.04 | 0.71 | 0.46 | 7.41 | 1.10 | 0.27 | 0.20 | |
| sc18 | 1.09 | 2.43 | 0 | 0.62 | 1.02 | 0.12 | 0.71 | 3.37 | 7.41 | 1.10 | 0.27 | 0.20 | |
| SET4 | sc19 | 0 | 0 | 6.43 | 0.62 | 1.02 | 0.12 | 0.71 | 0.46 | 7.41 | 1.10 | 0.27 | 0.20 |
| sc20 | 0 | 0 | 2.92 | 4.13 | 1.02 | 0.12 | 0.71 | 0.46 | 7.41 | 1.10 | 0.27 | 0.20 | |
| sc21 | 0 | 0 | 2.92 | 0.62 | 4.54 | 0.12 | 0.71 | 0.46 | 7.41 | 1.10 | 0.27 | 0.20 | |
| sc22 | 0 | 0 | 2.92 | 0.62 | 1.02 | 3.64 | 0.71 | 0.46 | 7.41 | 1.10 | 0.27 | 0.20 | |
| sc23 | 0 | 0 | 2.92 | 0.62 | 1.02 | 0.12 | 0.71 | 3.98 | 7.41 | 1.10 | 0.27 | 0.20 | |
| SET5 | sc24 | 0 | 6.43 | 0 | 0.62 | 1.02 | 0.12 | 0.71 | 0.46 | 7.41 | 1.10 | 0.27 | 0.20 |
| sc25 | 0 | 2.43 | 0 | 4.63 | 1.02 | 0.12 | 0.71 | 0.46 | 7.41 | 1.10 | 0.27 | 0.20 | |
| sc26 | 0 | 2.43 | 0 | 0.62 | 5.03 | 0.12 | 0.71 | 0.46 | 7.41 | 1.10 | 0.27 | 0.20 | |
| sc27 | 0 | 2.43 | 0 | 0.62 | 1.02 | 4.13 | 0.71 | 0.46 | 7.41 | 1.10 | 0.27 | 0.20 | |
| sc28 | 0 | 2.43 | 0 | 0.62 | 1.02 | 0.12 | 0.71 | 4.47 | 7.41 | 1.10 | 0.27 | 0.20 | |
| SET6 | sc29 | 6.43 | 0 | 0 | 0.62 | 1.02 | 0.12 | 0.71 | 0.46 | 7.41 | 1.10 | 0.27 | 0.20 |
| sc30 | 1.09 | 0 | 0 | 5.96 | 1.02 | 0.12 | 0.71 | 0.46 | 7.41 | 1.10 | 0.27 | 0.20 | |
| sc31 | 1.09 | 0 | 0 | 0.62 | 6.37 | 0.12 | 0.71 | 0.46 | 7.41 | 1.10 | 0.27 | 0.20 | |
| sc32 | 1.09 | 0 | 0 | 0.62 | 1.02 | 5.47 | 0.71 | 0.46 | 7.41 | 1.10 | 0.27 | 0.20 | |
| sc33 | 1.09 | 0 | 0 | 0.62 | 1.02 | 0.12 | 0.71 | 5.80 | 7.41 | 1.10 | 0.27 | 0.20 | |
| SET7 | sc34 | 0 | 0 | 0 | 7.05 | 1.02 | 0.12 | 0.71 | 0.46 | 7.41 | 1.10 | 0.27 | 0.20 |
| sc35 | 0 | 0 | 0 | 0.62 | 7.46 | 0.12 | 0.71 | 0.46 | 7.41 | 1.10 | 0.27 | 0.20 | |
| sc36 | 0 | 0 | 0 | 0.62 | 1.02 | 6.56 | 0.71 | 0.46 | 7.41 | 1.10 | 0.27 | 0.20 | |
| sc37 | 0 | 0 | 0 | 0.62 | 1.02 | 0.12 | 0.71 | 6.89 | 7.41 | 1.10 | 0.27 | 0.20 | |
References
- Yang, Y.C. Ethan; Ringler Claudia; Brown Casey; Mondal Md. Alam Hossain Modeling the Agricultural Water–Energy–Food Nexus in the Indus River Basin, Pakistan. J. Water Resour. Plann. Manag. 2016, 142, 04016062. [Google Scholar] [CrossRef]
- Ringler, C.; Anwar, A. Water for food security: Challenges for Pakistan. Water Int. 2013, 38, 505–514. [Google Scholar] [CrossRef]
- Bandaragoda, D.J.; Rehman, S. ur. Warabandi in Pakistan’s Canal Irrigation Systems: Widening Gap between Theory and Practice; IWMI Books, Reports; International Water Management Institute: Colombo, Sri Lanka, 1995. [Google Scholar]
- Mekonnen, D.K.; Channa, H.; Ringler, C. The impact of water users’ associations on the productivity of irrigated agriculture in Pakistani Punjab. Water Int. 2015, 40, 733–747. [Google Scholar] [CrossRef] [Green Version]
- Ahmad, S. Land and Water Resources of Pakistan—A Critical Assessment. Pak. Dev. Rev. 2007, 46, 911–937. [Google Scholar] [CrossRef] [Green Version]
- Qureshi, A.S.; McCornick, P.G.; Sarwar, A.; Sharma, B.R. Challenges and Prospects of Sustainable Groundwater Management in the Indus Basin, Pakistan. Water Resour. Manag. 2010, 24, 1551–1569. [Google Scholar] [CrossRef] [Green Version]
- Cheema, M.J.M.; Immerzeel, W.W.; Bastiaanssen, W.G.M. Spatial Quantification of Groundwater Abstraction in the Irrigated Indus Basin. Groundwater 2014, 52, 25–36. [Google Scholar] [CrossRef] [PubMed] [Green Version]
- Sarwar, A.; Eggers, H. Development of a conjunctive use model to evaluate alternative management options for surface and groundwater resources. Hydrogeol. J. 2006, 14, 1676–1687. [Google Scholar] [CrossRef]
- Qureshi, A.S.; McCornick, P.G.; Qadir, M.; Aslam, Z. Managing salinity and waterlogging in the Indus Basin of Pakistan. Agric. Water Manag. 2008, 95, 1–10. [Google Scholar] [CrossRef]
- World Bank. Pakistan—Punjab Private Sector Groundwater Development Project (English); World Bank: Washington, DC, USA, 2002. [Google Scholar]
- Qureshi, A.S. Water Management in the Indus Basin in Pakistan: Challenges and Opportunities. MRED 2011, 31, 252–260. [Google Scholar] [CrossRef]
- Bhutta, N.; Smedema, K. One hundred years of waterlogging and salinity control in the Indus valley, Pakistan: A historical review. Irrig. Drain. 2007, 56, S81–S90. [Google Scholar] [CrossRef]
- Falkenmark, M. The Massive Water Scarcity Now Threatening Africa: Why Isn’t It Being Addressed? Ambio 1989, 18, 112–118. [Google Scholar]
- Briscoe, J.; Qamar, U. Pakistan’s Water Economy: Running Dry; The World Bank: Washington, DC, USA, 2005; pp. 1–155. [Google Scholar]
- Kirby, M.; Ahmad, M.-D.; Mainuddin, M.; Khaliq, T.; Cheema, M.J.M. Agricultural production, water use and food availability in Pakistan: Historical trends, and projections to 2050. Agric. Water Manag. 2017, C, 34–46. [Google Scholar] [CrossRef]
- Ministry of Water Resources. Pakistan-National Water Policy; Government of Pakistan: Islamabad, Pakistan, 2018. Available online: https://ffc.gov.pk/wp-content/uploads/2018/12/National-Water-Policy-April-2018-FINAL_3.pdf (accessed on 22 January 2020).
- Galindo, A.; Collado-González, J.; Griñán, I.; Corell, M.; Centeno, A.; Martín-Palomo, M.J.; Girón, I.F.; Rodríguez, P.; Cruz, Z.N.; Memmi, H.; et al. Deficit irrigation and emerging fruit crops as a strategy to save water in Mediterranean semiarid agrosystems. Agric. Water Manag. 2018, 202, 311–324. [Google Scholar] [CrossRef]
- Evans, R.G.; Sadler, E.J. Methods and technologies to improve efficiency of water use. Water Resour. Res. 2008, 44. [Google Scholar] [CrossRef]
- Hu, H.; Xiong, L. Genetic engineering and breeding of drought-resistant crops. Ann. Rev. Plant Biol. 2014, 65, 715–741. [Google Scholar] [CrossRef]
- Davis, K.F.; Seveso, A.; Rulli, M.C.; D’Odorico, P. Water Savings of Crop Redistribution in the United States. Water 2017, 9, 83. [Google Scholar] [CrossRef] [Green Version]
- Kader, M.A.; Singha, A.; Begum, M.A.; Jewel, A.; Khan, F.H.; Khan, N.I. Mulching as water-saving technique in dryland agriculture: Review article. Bull. Natl. Res. Cent. 2019, 43, 147. [Google Scholar] [CrossRef] [Green Version]
- Ali, A.B.; Elshaikh, N.A.; Hong, L.; Adam, A.B.; Haofang, Y. Conservation tillage as an approach to enhance crops water use efficiency. Acta Agric. Scand. Sect. B Soil Plant Sci. 2017, 67, 252–262. [Google Scholar] [CrossRef]
- Hoekstra, A.Y.; Chapagain, A.; Martinez-Aldaya, M.; Mekonnen, M. The Water Footprint Assessment Manual, Setting the Global Standard; Earthscan: London, UK, 2011; ISBN 978-1-84971-279-8. [Google Scholar]
- Mali, S.S.; Singh, D.K.; Sarangi, A.; Parihar, S.S. Crop water footprints with special focus on response formulation: The case of Gomti river basin (India). Environ. Earth Sci. 2017, 76, 786. [Google Scholar] [CrossRef]
- García Morillo, J.; Rodríguez Díaz, J.A.; Camacho, E.; Montesinos, P. Linking water footprint accounting with irrigation management in high value crops. J. Clean. Prod. 2015, 87, 594–602. [Google Scholar] [CrossRef]
- Lathuillière, M.J.; Cao, M.T.; Castanho, A.; Graesser, J.; Johnson, M. K Evaluating Water Use for Agricultural Intensification in Southern Amazonia Using the Water Footprint Sustainability Assessment. Water 2018, 10, 349. [Google Scholar] [CrossRef] [Green Version]
- Nouri, H.; Stokvis, B.; Galindo, A.; Blatchford, M.; Hoekstra, A.Y. Water scarcity alleviation through water footprint reduction in agriculture: The effect of soil mulching and drip irrigation. Sci. Environ. 2019, 653, 241–252. [Google Scholar] [CrossRef] [PubMed]
- Cao, X.; Wu, P.; Wang, Y.; Zhao, X. Water Footprint of Grain Product in Irrigated Farmland of China. Water Resour. Manag. 2014, 28, 2213–2227. [Google Scholar] [CrossRef]
- Multsch, S.; Alquwaizany, A.S.; Alharbi, O.A.; Pahlow, M.; Frede, H.-G.; Breuer, L. Water-saving strategies for irrigation agriculture in Saudi Arabia. Int. J. Water Resour. Dev. 2017, 33, 292–309. [Google Scholar] [CrossRef]
- Tsakmakis, I.D.; Zoidou, M.; Gikas, G.D.; Sylaios, G.K. Impact of Irrigation Technologies and Strategies on Cotton Water Footprint Using AquaCrop and CROPWAT Models. Environ. Process. 2018, 5, 181–199. [Google Scholar] [CrossRef]
- Multsch, S.; Al-Rumaikhani, Y.A.; Frede, H.-G.; Breuer, L. A Site-sPecific Agricultural water Requirement and footprint Estimator (SPARE:WATER 1.0). Geosci. Model Dev. 2013, 6, 1043–1059. [Google Scholar] [CrossRef]
- Allen, R.G.; Pereira, L.S.; Raes, D.; Smith, M. Crop Evapotranspiration—Guidelines for Computing Crop Water Requirements—FAO Irrigation and Drainage Paper 56; FAO: Rome, Italy, 1998. [Google Scholar]
- Multsch, S.; Pahlow, M.; Ellensohn, J.; Michalik, T.; Frede, H.-G.; Breuer, L. A hotspot analysis of water footprints and groundwater decline in the High Plains aquifer region, USA. Reg. Environ. Chang. 2016, 16, 2419–2428. [Google Scholar] [CrossRef]
- Multsch, S.; Elshamy, M.E.; Batarseh, S.; Seid, A.H.; Frede, H.-G.; Breuer, L. Improving irrigation efficiency will be insufficient to meet future water demand in the Nile Basin. J. Hydrol. Reg. Stud. 2017, 12, 315–330. [Google Scholar] [CrossRef]
- Multsch, S.; Krol, M.S.; Pahlow, M.; Assunção, A.L.C.; Barretto, A.G.O.P.; de Jong van Lier, Q.; Breuer, L. Assessment of potential implications of agricultural irrigation policy on surface water scarcity in Brazil. Hydrol. Earth Syst. Sci. 2020, 24, 307–324. [Google Scholar] [CrossRef] [Green Version]
- Multsch, S.; Grabowski, D.; Luedering, J.; Alquwaizany, A.S.; Lehnert, K.; Frede, H.-G.; Winker, P.; Breuer, L. A practical planning software program for desalination in agriculture-SPARE: WATER(opt). Desalination 2017, 404, 121–131. [Google Scholar] [CrossRef]
- Multsch, S.; Exbrayat, J.-F.; Kirby, M.; Viney, N.R.; Frede, H.-G.; Breuer, L. Reduction of predictive uncertainty in estimating irrigation water requirement through multi-model ensembles and ensemble averaging. Geosci. Model Dev. 2015, 8, 1233–1244. [Google Scholar] [CrossRef] [Green Version]
- Brouwer, C.; Prins, K.; Heibloem, M. Irrigation Water Management: Training Manual No. 4: Irrigation Scheduling; FAO: Rome, Italy, 1989. [Google Scholar]
- International Water Management Institute (IWMI). IWMI Irrigated Area Mapping: Asia and Africa: IWMI Data & Tools. 2018. Available online: http://www.iwmi.cgiar.org/2018/06/irrigated-area-mapping-asia-and-africa/ (accessed on 20 October 2019).
- Ullah, M.K.; Habib, Z.; Muhammad, S. Spatial Distribution of Reference and Potential Evapotranspiration across the Indus Basin Irrigation Systems; IWMI: Lahore, Pakistan, 2001; ISBN 978-92-9090-206-5. [Google Scholar]
- Ayers, R.S.; Westcot, D.W. Water Quality for Agriculture; FAO irrigation and drainage paper; Food and Agriculture Organization of the United Nations: Rome, Italy, 1985; ISBN 978-92-5-102263-4. [Google Scholar]
- Shakir, A.S.; Khan, N.M.; Qureshi, M.M. Canal water management: Case study of upper Chenab Canal in Pakistan. Irrig. Drain. 2010, 59, 76–91. [Google Scholar] [CrossRef]
- Soomro, Z.A.; Ashraf, M.; Ejaz, K.; Bhatti, A.Z. Water Requirements of Major Crops in the Central Punjab; PCRWR: Islamabad, Pakistan, 2018; p. 44.
- Ghufran, M.A.; Butt, M.A.; Farooqi, A.; Batool, A.; Irfan, M.F. Water Footprint of Major Cereals and Some Selected Minor Crops of Pakistan. J. Water Resour. Hydraul. Eng. 2015, 59, 76–91. [Google Scholar] [CrossRef]
- World Program for the Census of Agriculture 2020. Volume 1. Available online: https://unstats.un.org/unsd/classifications/Family/Detail/1002 (accessed on 9 March 2020).
- Rehman, A.; Jingdong, L.; Chandio, A.; Shabbir, M.; Hussain, I. Economic outlook of rice crops in Pakistan: A time series analysis (1970–2015). Finan. Innov. 2017, 13, 1–9. [Google Scholar] [CrossRef] [Green Version]
- Hess, T.; Knox, J.; Kay, M.; Weatherhead, K. Managing the Water Footprint of Irrigated Food Production in England and Wales. In Sustainable Water; Royal Society of Chemistry: Birmingham, UK, 2010; pp. 78–92. [Google Scholar] [CrossRef]
- Montesinos, P.; Camacho, E.; Campos, B.; Rodríguez-Díaz, J.A. Analysis of Virtual Irrigation Water. Application to Water Resources Management in a Mediterranean River Basin. Water Resour. Manag. 2011, 25, 1635–1651. [Google Scholar] [CrossRef]
- Chukalla, A.D.; Krol, M.S.; Hoekstra, A.Y. Green and blue water footprint reduction in irrigated agriculture: Effect of irrigation techniques, irrigation strategies and mulching. Hydrol. Earth Syst. Sci. 2015, 19, 4877–4891. [Google Scholar] [CrossRef] [Green Version]
- Aldaya, M.M.; Garrido, A.; Llamas, M.R.; Varela-Ortega, C.; Novo, P.; Casado, R.R. Water Footprint and Virtual Water Trade in Spain. 11. Available online: https://waterfootprint.org/media/downloads/Aldaya-el-al-2010-WaterFootprintSpain_1.pdf (accessed on 4 March 2020).
- Chapagain, A.K.; Tickner, D. Water Footprint: Help or Hindrance? Water Alter. 2012, 5, 563–581. [Google Scholar]
- Liu, J.; Orr, S. Water footprint overview in the governmental, public policy, and corporate contexts. In Proceedings of the “On the Water Front”: Selections from the 2009 World Water Week in Stockholm; Stockholm International Water Institute (SIWI), Stockholm, Sweden, 16 August 2009; pp. 73–79. [Google Scholar]
- Dong, H.; Geng, Y.; Sarkis, J.; Fujita, T.; Okadera, T.; Xue, B. Regional water footprint evaluation in China: A case of Liaoning. Sci. Environ. 2013, 442, 215–224. [Google Scholar] [CrossRef]
- Chapagain, A.K.; Hoekstra, A.Y.; Savenije, H.H.G. Water saving through international trade of agricultural products. Hydrol. Earth Syst. Sci. 2006, 10, 455–468. [Google Scholar] [CrossRef] [Green Version]
- Dumont, A.; Salmoral, G.; Llamas, M.R. The water footprint of a river basin with a special focus on groundwater: The case of Guadalquivir basin (Spain). Water Resour. Ind. 2013, 1–2, 60–76. [Google Scholar] [CrossRef] [Green Version]
- Aldaya, M.M.; Martínez-Santos, P.; Llamas, M.R. Incorporating the Water Footprint and Virtual Water into Policy: Reflections from the Mancha Occidental Region, Spain. Water Resour. Manag. 2010, 24, 941–958. [Google Scholar] [CrossRef] [Green Version]
- Water Development for Irrigated Agriculture in Pakistan: Past Trends, Returns and Future Requirements—Hafeez Akhtar Randhawa. Available online: http://www.fao.org/3/ac623e/ac623e0i.htm (accessed on 28 January 2019).
- Ghasemi, M.M.; Karamouz, M.; Shui, L.T. Distributed versus Lumped Optimization of Cropping Pattern and Water Resources Utilization. AS 2014, 5, 257–269. [Google Scholar] [CrossRef] [Green Version]
- Zeng, Z.; Liu, J.; Koeneman, P.H.; Zarate, E.; Hoekstra, A.Y. Assessing water footprint at river basin level: A case study for the Heihe River Basin in northwest China. Hydrol. Earth Syst. Sci. 2012, 16, 2771–2781. [Google Scholar] [CrossRef] [Green Version]
- Maisiri, N.; Senzanje, A.; Rockstrom, J.; Twomlow, S.J. On farm evaluation of the effect of low cost drip irrigation on water and crop productivity compared to conventional surface irrigation system. Phys. Chem. Earth Parts A/B/C 2005, 30, 783–791. [Google Scholar] [CrossRef]
- Liu, H.-J.; Kang, Y.; Yao, S.-M.; Sun, Z.-Q.; Liu, S.-P.; Wang, Q.-G. Field Evaluation on Water Productivity of Winter Wheat under Sprinkler or Surface Irrigation in the North China Plain. Irrig. Drain. 2013, 62, 37–49. [Google Scholar] [CrossRef]
- Rizwan, M.; Bakhsh, A.; Li, X.; Anjum, L.; Jamal, K.; Hamid, S. Evaluation of the Impact of Water Management Technologies on Water Savings in the Lower Chenab Canal Command Area, Indus River Basin. Water 2018, 10, 681. [Google Scholar] [CrossRef] [Green Version]
- Latif, M. Sprinkler irrigation to harness potential benefits of water scarcity areas in Pakistan. In Proceedings of the National Seminar on Water Resources Development and Management in Arid Areas, Quetta, Pakistan, 11–12 August 1990. [Google Scholar]
- Yasin, M.; Ahmad, S.; Aslam, M.; Akbar, G. Adaption of pressurized irrigation in Pakistan. In Proceedings of the International Seminar on “Management of Water Resources for Sustainable Agriculture”, Lahore, Pakistan, 29–31 October 2001. [Google Scholar]
- Alam, M.M.; Bhutta, M.N.; Azhar, A.H. Use and Limitations of Sprinkler and Drip Irrigation Systems in Pakistan. In Proceedings of the Pakistan Engineering Congress, 70th Annual session, Lahore, Pakistan, 2–4 December 2006. [Google Scholar]
- Rodrigues, G.C.; Martins, J.D.; Petry, M.T.; Carlesso, R.; Paredes, P.; Rosa, R.D.; Pereira, L.S. Economic impacts assessment of deficit irrigation and commodity prices. Application to maize in southern Brazil. In Proceedings of the International Conference on Agricultural Engineering, Valencia, Spain, 8–12 July 2012; pp. 8–12. [Google Scholar]
- PMU, PIPIP, PUNJAB. Available online: http://www.pipip.punjab.gov.pk/ (accessed on 3 December 2019).
- Qamar, M.U.; Azmat, M.; Abbas, A.; Usman, M.; Shahid, M.A.; Khan, Z.M. Water Pricing and Implementation Strategies for the Sustainability of an Irrigation System: A Case Study within the Command Area of the Rakh Branch Canal. Water 2018, 10, 509. [Google Scholar] [CrossRef] [Green Version]
- Kahlown, M.A.; Raoof, A.; Zubair, M.; Kemper, W.D. Water use efficiency and economic feasibility of growing rice and wheat with sprinkler irrigation in the Indus Basin of Pakistan. Agric. Water Manag. 2007, 87, 292–298. [Google Scholar] [CrossRef]
- Abdulai, A.; Owusu, V.; Bakang, J.-E.A. Adoption of safer irrigation technologies and cropping patterns: Evidence from Southern Ghana. Ecol. Econ. 2011, 70, 1415–1423. [Google Scholar] [CrossRef] [Green Version]
- Rehman, A.; Jingdong, L.; Shahzad, B.; Chandio, A.A.; Hussain, I.; Nabi, G.; Iqbal, M.S. Economic perspectives of major field crops of Pakistan: An empirical study. Pac. Sci. Rev. B Hum. Soc. Sci. 2015, 1, 145–158. [Google Scholar] [CrossRef] [Green Version]
- Mojtabavi, S.A.; Shokoohi, A.; Etedali, H.R.; Singh, V. Using Regional Virtual Water Trade and Water Footprint Accounting for Optimizing Crop Patterns to Mitigate Water Crises in Dry Regions. Irrig. Drain. 2018, 67, 295–305. [Google Scholar] [CrossRef]
- Rasul, G.; Mahmood, A.; Sadiq, A.; Khan, S.I. Vulnerability of the Indus Delta to Climate Change in Pakistan. Pak. J. Met. 2012, 8, 89–107. [Google Scholar]
- Awan, U.K.; Liaqat, U.W.; Choi, M.; Ismaeel, A. A SWAT modeling approach to assess the impact of climate change on consumptive water use in Lower Chenab Canal area of Indus basin. Hydrol. Res. 2016, 47, 1025–1037. [Google Scholar] [CrossRef]
Figure 1.
Map of the study area.

Figure 2.
Comparison of SPARE:WATER with literature data: (a) location of data points used in model comparison; (b–d) correlations of simulated crop evapotranspiration (ETc) with measured data; (e) correlation of simulated crop water footprints (WFcrop) with CROPWAT simulations.
Figure 2.
Comparison of SPARE:WATER with literature data: (a) location of data points used in model comparison; (b–d) correlations of simulated crop evapotranspiration (ETc) with measured data; (e) correlation of simulated crop water footprints (WFcrop) with CROPWAT simulations.

Figure 3.
Average harvested area (a) and WFarea (b) for the period 1997–2016.

Figure 4.
Sensitivity analysis of (a) electric conductivity and (b) irrigation efficiency and their effects on the grey and blue regional water footprints.
Figure 4.
Sensitivity analysis of (a) electric conductivity and (b) irrigation efficiency and their effects on the grey and blue regional water footprints.

Figure 5.
(a) Alternative cropping patterns; and (b) resulting WFarea; (c) WFarea analysis of cropping pattern changes with concurrent changes in irrigation technologies.
Figure 5.
(a) Alternative cropping patterns; and (b) resulting WFarea; (c) WFarea analysis of cropping pattern changes with concurrent changes in irrigation technologies.

Table 1.
Spatial model input data used in this study.
| Dataset | Description | Years/Resolution | Data Sources |
|---|---|---|---|
| Climate | Rainfall, wind speed, min. and max. temperature, relative humidity, sunshine hours for 19 weather stations | 1997–2016 Monthly | Pakistan Meteorological Department |
| Irrigated areas | Spatial location of areas | 2010 | International Water Management Institute (IWMI) [39] |
| Crop data | Harvested area and crop production | 1997–2016 Yearly | Pakistan Statistics Bureau Islamabad |
| Crop parameters | Sowing and harvesting date | - | National Agromet Centre of Pakistan |
| Groundwater quality | Electric conductivity dataset of 3500 wells | 2010–2014 | International Water-Logging and Salinity Research Institute (IWASRI) |
Table 2.
Average yield and water footprint (WF) for crops in both cropping seasons in the Indus basin for the period 1997–2016.
Table 2.
Average yield and water footprint (WF) for crops in both cropping seasons in the Indus basin for the period 1997–2016.
| Season | Category | Crops | Yield (t ha−1) | WF (m3 t−1) | |||
|---|---|---|---|---|---|---|---|
| Green | Blue | Grey | Total | ||||
| Kharif | Cereal | Rice | 2.1 | 1488 | 4971 | 542 | 7001 |
| Maize | 2.6 | 839 | 1706 | 424 | 2969 | ||
| Sorghum | 0.7 | 2981 | 5763 | 253 | 8997 | ||
| Millet | 0.6 | 3390 | 6558 | 292 | 10,240 | ||
| Fiber | Cotton | 0.53 | 6886 | 13,315 | 489 | 20,690 | |
| Sugar | Sugarcane | 50 | 76 | 469 | 110 | 655 | |
| Oilseed | Sesame | 0.5 | 4809 | 12,086 | 528 | 17,423 | |
| Fodder | Sorghum(Jowar) | 12.5 | 229 | 616 | 30 | 875 | |
| Vegetables | Okra | 8.3 | 109 | 1387 | 270 | 1766 | |
| Gourd | 8.7 | 104 | 1186 | 225 | 1515 | ||
| Onion | 10.9 | 73 | 550 | 239 | 862 | ||
| Tomato | 10.3 | 67 | 978 | 139 | 1184 | ||
| Rabi | Cereals | Wheat | 2.7 | 381 | 2083 | 100 | 2564 |
| Barley | 0.8 | 621 | 4432 | 167 | 5220 | ||
| Leguminous | Pulses | 0.85 | 1020 | 6320 | 964 | 8308 | |
| Oilseed | Rapeseed | 0.95 | 750 | 3151 | 192 | 4093 | |
| Spice | Pepper | 1.7 | 387 | 4451 | 1246 | 6084 | |
| Tuber | Potato | 13.8 | 56 | 733 | 180 | 969 | |
| Fodder | Berseem | 31 | 29 | 185 | 34 | 248 | |
| Vegetables | Carrot | 15.1 | 15 | 162 | 63 | 240 | |
| Spinach | 11.2 | 43 | 340 | 118 | 501 | ||
| Garlic | 7.2 | 111 | 906 | 176 | 1193 | ||
| Turnip | 17.3 | 30 | 265 | 101 | 396 | ||
| Annual | Fruits | Banana | 4.3 | 945 | 5704 | 630 | 7279 |
| Citrus | 8.7 | 416 | 2391 | 590 | 3397 | ||
| Dates | 8.7 | 381 | 1335 | 106 | 1822 | ||
| Guava | 12.2 | 299 | 1791 | 353 | 2443 | ||
| Mango | 9.6 | 335 | 2040 | 403 | 2778 | ||
© 2020 by the authors. Licensee MDPI, Basel, Switzerland. This article is an open access article distributed under the terms and conditions of the Creative Commons Attribution (CC BY) license (http://creativecommons.org/licenses/by/4.0/).
Share and Cite
MDPI and ACS Style
Muzammil, M.; Zahid, A.; Breuer, L. Water Resources Management Strategies for Irrigated Agriculture in the Indus Basin of Pakistan. Water 2020, 12, 1429. https://doi.org/10.3390/w12051429
AMA Style
Muzammil M, Zahid A, Breuer L. Water Resources Management Strategies for Irrigated Agriculture in the Indus Basin of Pakistan. Water. 2020; 12(5):1429. https://doi.org/10.3390/w12051429
Chicago/Turabian StyleMuzammil, Muhammad, Azlan Zahid, and Lutz Breuer. 2020. "Water Resources Management Strategies for Irrigated Agriculture in the Indus Basin of Pakistan" Water 12, no. 5: 1429. https://doi.org/10.3390/w12051429
Note that from the first issue of 2016, this journal uses article numbers instead of page numbers. See further details here.