1. Introduction
Water tightness and functional efficiency are fundamental requirements for a sewage system. However, due to aging, the cost of maintenance, and old construction techniques, these cannot be guaranteed during some pipes’ “neverending” service life.
In contrast, in recent years a little attention has been paid in scientific literature to the issue of leaks in sewer networks [
1,
2,
3]. One of the main purposes of these works was to provide support to institution managers on priorities such as network rehabilitation; they also address the use of degradation models of the sewer pipes [
4].
A proper approach to this problem should require the identification of mechanisms responsible for pipe deterioration. Generally, these phenomena can be grouped into three main categories, i.e., structural, operational, and hydraulic capacity failure. Structural failure is due to a defect on the pipe wall that reduces the structural integrity of the pipe segment (e.g., cracks, corrosion, deflection, and misaligned joints) [
5]. Operational failure, instead, occurs due to a physical cause external to the pipe itself and can be resolved by a maintenance procedure (e.g., obstruction, root intrusion, and sediment accumulation). Lastly, hydraulic capacity failure occurs when the flow is higher than the maximum pipe capacity, though capacity failure is often a sign of other types of structural defects such as cracks, broken pipes, leaks, and other factors [
6]. Ennaouri et al. [
7] identified fifteen degradation factors to measure the hydraulic and structural degradation of a sewer pipe and, thanks to an analytical hierarchical process permit, define the importance of each factor. This work’s validity was tested on a city in Quebec with satisfactory results. Davies et al. [
8] reported an extensive review of the factors influencing the structural deterioration of rigid sewer pipes, highlighting, for example, how in the UK—a country characterized by the oldest sewerage system—the sewer collapse trend during decay is significant but stable.
An interesting contribution is represented by the 10th report of the European Gas Pipeline Incident Data Group (EGIG) for the period 1970 to 2016 [
9], which reports and analyzes the recorded incidents for gas pipelines over a very long period. Although it has some differences, this database can represent a useful reference to understand the causes of major incidents and the relations of material failure, the size of the leak, and the age of pipelines. Observing the distribution of incidents, it can be highlighted that the major causes of leaks are external interferences (e.g., digging, groundworks, etc.) followed by corrosion, construction defects, and ground movement.
The deterioration of sewer pipes could lead, among other things, to management and environmental problems. About this latter, it is important to remark on how wastewater leakages represent a serious and sometimes dramatic problem due to their environmental consequences, since wastewater that leaks out of the pipe system may contaminate ground and surface water. Schleyer et al. [
10] estimated that approximately 300 million m
3 of wastewater percolates into German groundwater each year. Wolf et al. [
11] analyzed the results of hydrochemical analyses, which provided evidence of wastewater exfiltration into the local groundwater of a medium-sized German city. The study showed the usefulness of iodated X-ray contrast media for the detection of exfiltration from leaky sewer systems.
Moreover, sewage leakages can cause the pollution of surface waterways; Hopkins and Bain [
12] presented a method to estimate the age and deterioration of existing infrastructures from historical maps, pipe materials, and parcel-level property tax.
However, the important investment of water management authorities in terms of capital costs for reinstatement, repair, and maintenance must be added to the social costs (e.g., environmental and public health consequences, floods, and damages).
A way to reduce sewage pipe failures is to assure an optimal and programmed maintenance, considering that the cost of failures in terms of damage and reconstruction are enormous compared to those of preventive maintenance [
13]. This type of maintenance is classified as preventive and can be defined as a programmed, aggressive systematic approach to maintenance activities. This maintenance can be scheduled based on specific criteria such as critical pipelines, the age of pipelines, the time since the last maintenance was performed, etc. An aggressive preventive maintenance program ensures that sewer lines remain in proper working order and prevents many problems before they occur [
6]. Sewers maintenance and rehabilitation represent today an important investment sector for water management authorities. A correct maintenance program influences outcomes directly and has an important impact on the functionality of a sewer system and service quality. Decisions on priorities can be supported by different approaches; in this aspect, a state of the art sewer asset management system is presented by Tscheikner-Gratl et al. [
14].
A proposal for asset management based on the adoption of new technologies is suggested by Davis et al. [
15]. The existing network can be transformed into an intelligent one with the ability to monitor its infrastructures from the inside, going beyond its intrinsic limits to be hidden from view.
Although the importance of programmed maintenance is known and it is economically convenient to keep the performance of the system at an acceptable level of service to avoid ruptures, damages, and environmental consequences, several water manager authorities usually carry out maintenance or rehabilitation once a pipe has collapsed. In many countries currently, there is a general lack of good information on the condition of infrastructure assets such as sewers and water mains. Nowadays, for instance, the age-related deterioration of sewers is unclear [
16]. Unlike water distribution networks, where leakages are frequently recognizable because of pressurized pipes, sewage leakages are mostly hidden due to the gravity of sewers, and for this reason are more difficult to observe and estimate. Probably for the same reason, researchers spend little effort on this topic, with the direct consequence that there are only a few examples of case studies, technical information, and methodologies useful for sewage leakage identification and prevention.
However, this topic still remains open due to the absence of consolidated and fast direct methodologies for estimating losses. Methods for sewer pipe inspection consist of monitoring methods [
17,
18,
19]. Few procedures are based on continuous measurements of pipe pressure [
20] and flow measurements [
3]. Meanwhile, several procedures are mainly used for the inspection of sewage pressure pipes because of pipe material and the surrounding environment; these methods include pump data analysis, optical inspection, and static pressure tests. In regard to the last group, Apparerl et al. [
21] analyzed the efficacy of distributed temperature sensing for the detection and localization of leakages in underwater pressure pipes placed at the bottom of Austrian lakes. Wolf et al. [
22] created a spatial distribution of detected sewers, using CCTV (Closed Circuit Television) observations to assess the problems of the influence of the sewer system on the groundwater at the scale of a German city. Moreover, they conducted a hydrochemical analysis, using a new marker for the measurement of pharmaceutical residues to validate this method.
Exfiltration is the leakage of wastewater out of a sanitary sewer system through broken, damaged, or occluded pipes (defective pipe joints, cracks, or pipe corrosions). Exfiltrated wastewater constitutes, in addition to the loss of potentially reusable water, a means for a mix of contaminants to contaminate urban shallow groundwater. Rutsch et al. [
23] give an extended review of direct and indirect methods to detect and to estimate sewer exfiltration.
Roehrdanz et al. [
24] developed and tested a spatial model of the probability of exfiltration based on pipe attributes and groundwater elevation without prior knowledge of exfiltrating defect locations. Nevertheless, the applicability of this approach requires the groundwater levels and detailed information about sewer networks, which is generally difficult to recover.
Schulz et al. [
25] conducted a study on the city of Dresden to estimate the potential benefits of the rehabilitation of sewer pipes. The relation of the sewer system and infiltration rate was assessed by a statistical analysis of pipes inspected with CCTV. Supposing a rehabilitation of the identified critical pipes and the consequent potential reduction in infiltration, an integrated model was defined and applied to a virtual sewer system. Currently, a common but very complicated system is the indirectly monitoring of the flow rate into the treatment plant [
26,
27,
28]. For combined sewers, an alternative approach tested for identifying exfiltration [
29] was to verify trends in water levels and/or qualitative parameters monitored from groundwater.
The average age of wastewater pipelines in Europe is very high. In Italy, the urgency of investigating this aspect is pushed by the need to evaluate the generic sewage standards defined in 2017 by the Italian Regulatory Authority for Energy, Networks and Environment (ARERA). On this issue, ARERA in 2017 published a deliberation (917/2017/R/IDR) about the “Regulation of the Technical Quality of the Integrated Water Service or each of the Individual Services that compose it”. To verify the water distribution networks and sewerage pipelines’ functionality of every administration and managing authority, ARERA set a series of indices and a mechanism of incentives and penalties that acts on their tariff system.
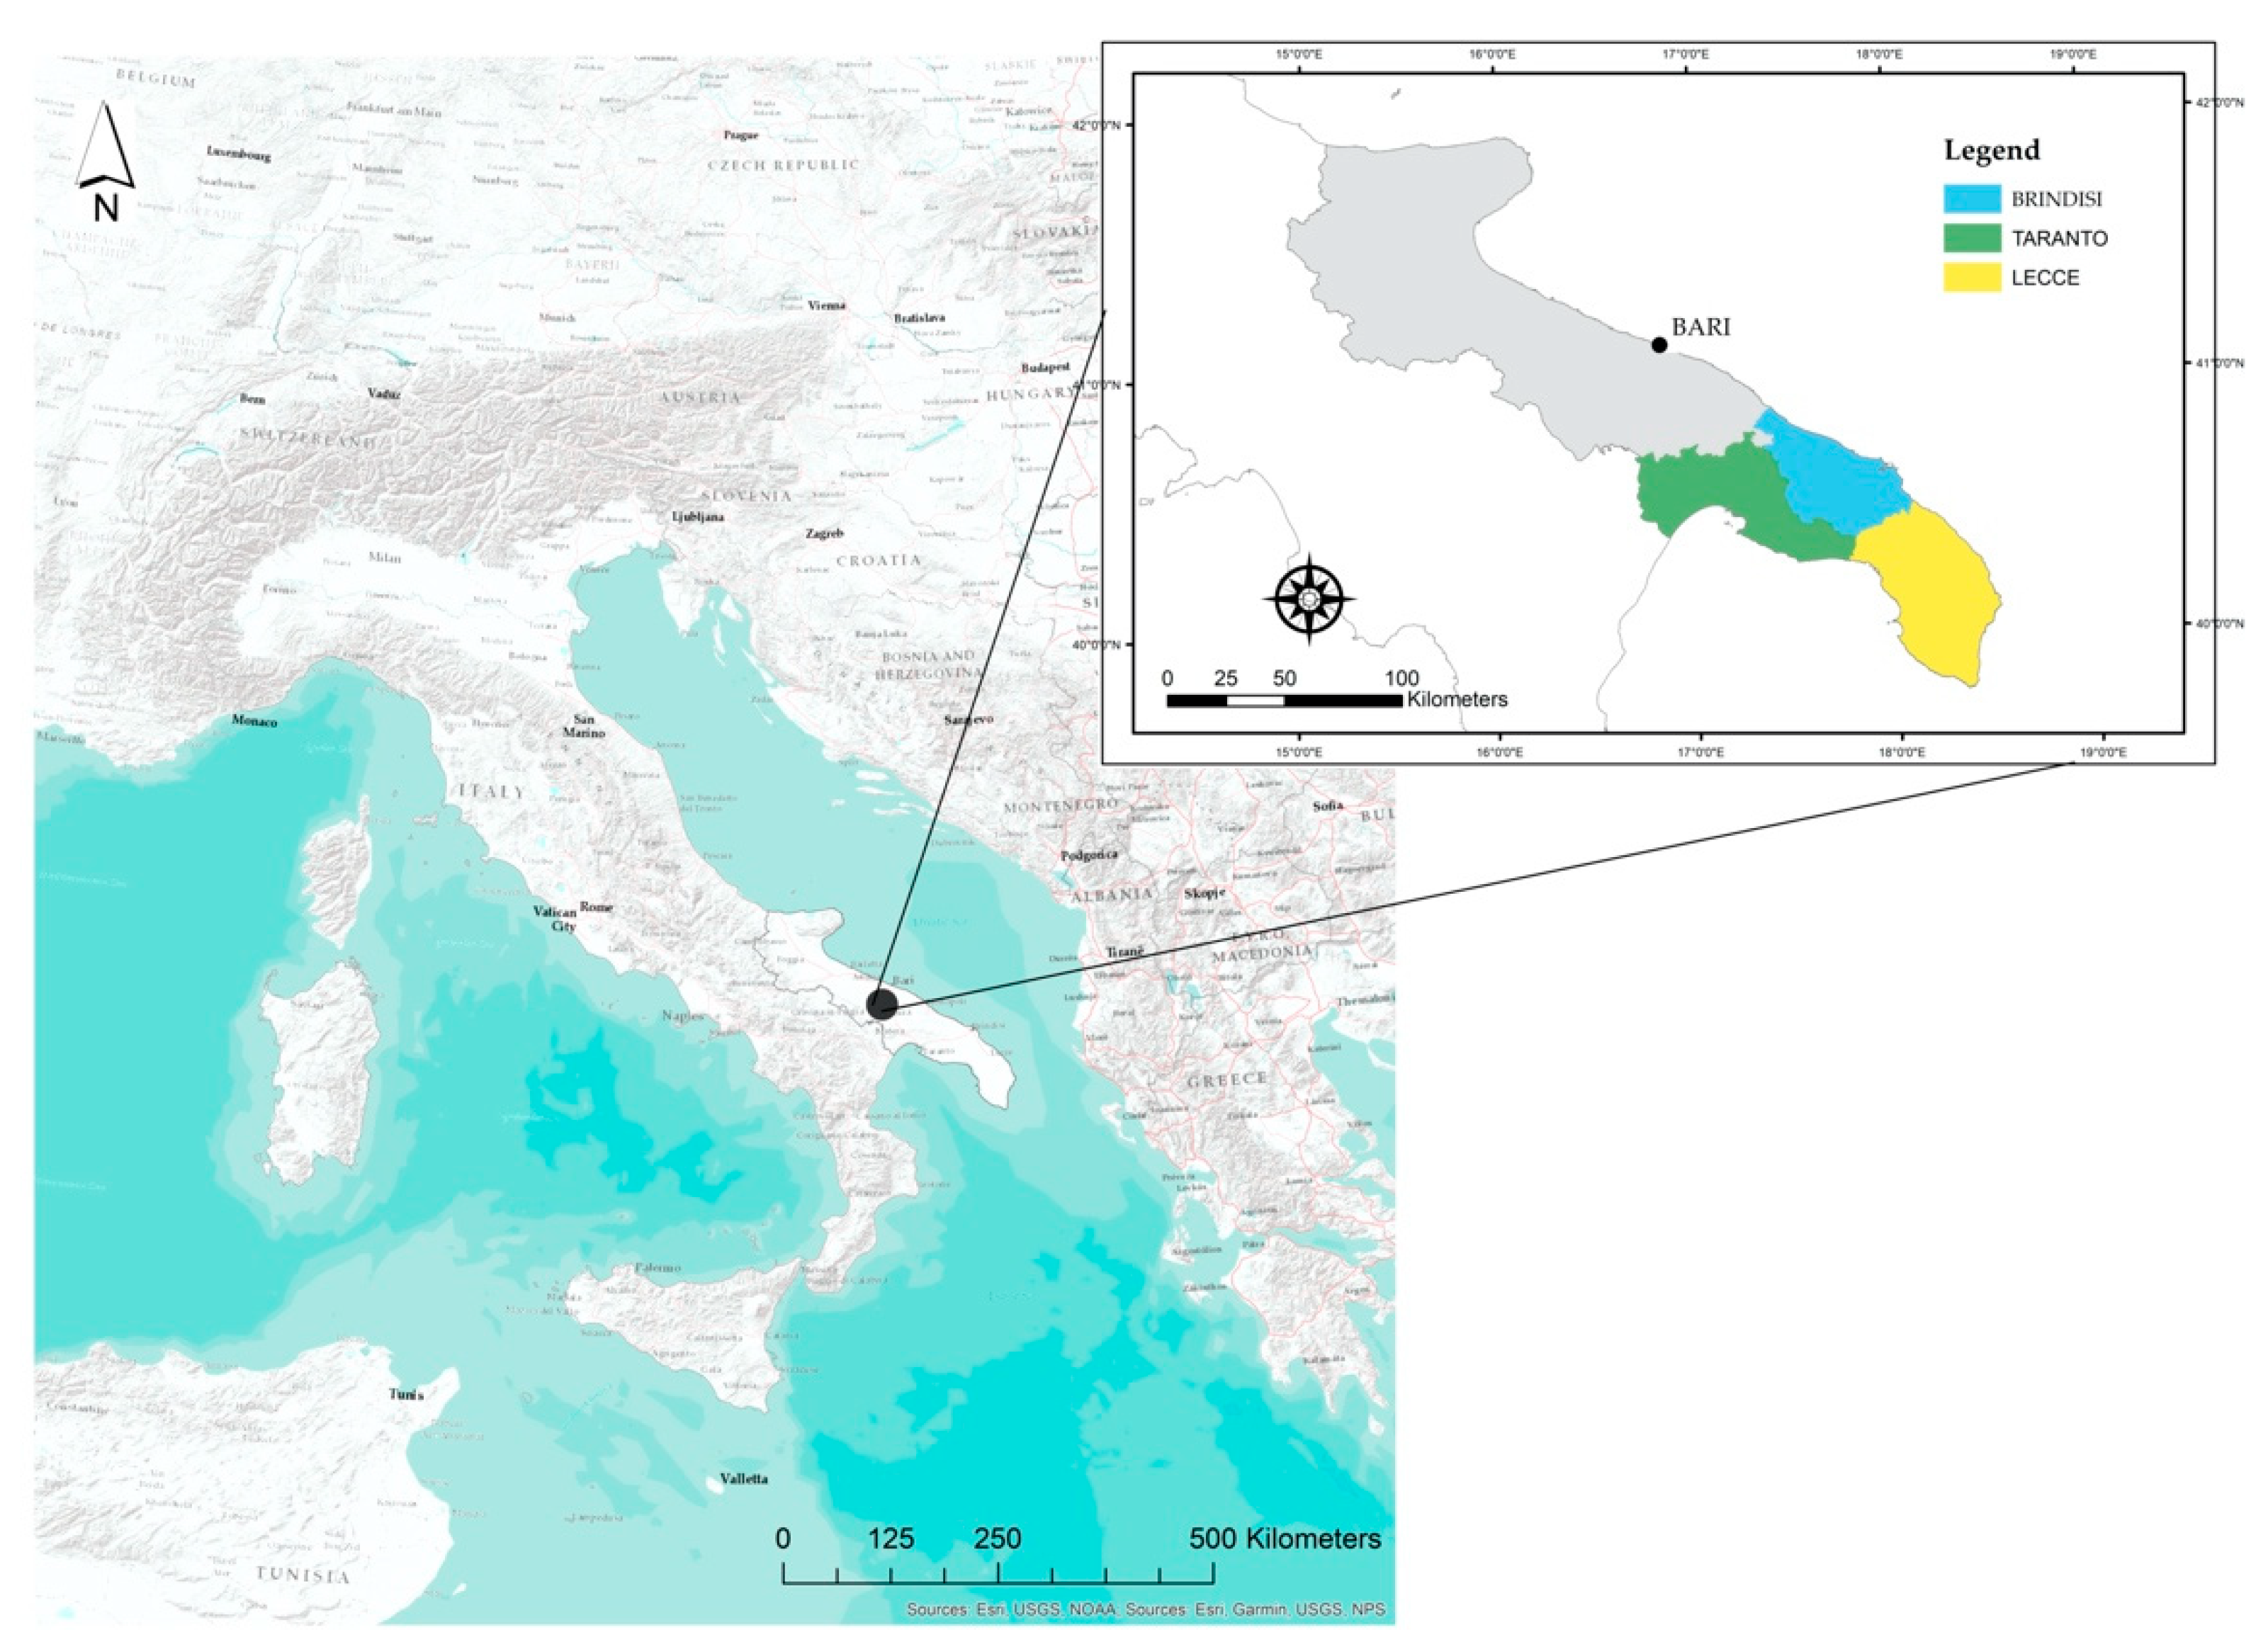
This study is focused on exploiting the information available in the maintenance journal of the sewer system of one of the largest Italian water management companies for two years of activities. The journal includes requests for intervention and authentic reports in a large area including the provinces of Brindisi, Lecce, and Taranto—three important Apulian towns in Southern Italy. It is important to state, preliminarily, that this journal was not produced or designed as a tool for the optimization of maintenance programs but is rather a collection of records resulting from users’ calls for disservice and following interventions. This is a very simple database that was traditionally drafted by Italian water management authorities and which could be available, in a similar form, in many other countries in the world. The records, in most cases, consist of a brief qualitative description of the situation, including the reasons for the call, nature of disservice, location, possible causes, and the following intervention. Based on these data, we carried out an analysis of the recorded interventions, characterized by their type and frequency concerning the sewerage networks and trying to identify which characteristics of the sewer pipelines and/or users were more related to the losses. While the reported data, in many cases, lack important technical details, the large number of records allows for an interesting exploratory analysis of the type of problem which occurs more often and allows us to relate such typology to large-scale indicators, such as the total length of the network per town, the inhabitants, and the Equivalent Inhabitants (I.E.). The results of this analysis and the methodology developed here may help water management authorities and other decision-makers to deal with large areas served with aged and long sewer networks by focusing on (i) exploiting historical information, (ii) designing a better-oriented frequent maintenance program to control and reduce the number of interventions, and (iii) increasing social awareness of the correct use of the sewer system.
3. Typology of Data and Methodology
Due to a large number of recorded requests—in many cases not well documented—we focused our attention only on calls that resulted in an effective intervention by the AQP and which in most cases led to detect leakage and substantial sewage exfiltration. Among the extracted data, only those relating to the sewer system were taken into consideration, thus excluding the interventions that involved only the service (self-purging) of disinfestation, the presence of bad smells, and a request for site inspection, and not real intervention (excavations or similar).
The selected records were cataloged in the following categories of disservice, reported as originally annotated by operators according to the Journal of Maintenance format:
Infiltration;
Road surface: exfiltration;
Pipe occlusion with exfiltration;
Manhole occlusion;
Flood;
Repair/reconstruction sewer connection.
In addition to this type-based classification, disservices were also subdivided according to their causes, which can be summed up as:
Sewage pump system blocked;
Incorrect installation: siphons in reverse slope, incorrect connection of the private connections to the sewer trunk, etc.;
Groundwater: presence of underground water in a pipeline;
Sewage treatment plant: problems with the sewage treatment plant which caused problems to the sewage network;
Failed reparation: breakages not repaired at the time of checking the fault, which caused subsequent problems;
Ordinary: all reports which are not due to external causes and which can occur normally since the sewer is easily subjected to blockages;
Rain: all situations in which rain caused problems;
Third parties: tampering and damage to sewage works by private and/or unknown persons;
Improper use: all interventions in which disservices were due to the introduction of objects into the sewage pipeline (paper, rags, construction material, etc.) or due to the presence of illegal discharges.
Table 2 summarizes the number of disservices requiring a real intervention for the two years above indicated; the data highlight that real leakages are half of the total registered calls received by AQP S.p.A.
Based on these categories and causes, the frequency of sewer disservice was analyzed and correlated with large scale indicators, as discussed in the following section. For this purpose, we evaluated for each town and agglomeration across the total length of the network, the number of inhabitants, and the Equivalent Inhabitants (I.E.), which accounts for all types of urban water consumption including real population, public institutions/facilities, economic activities, etc. To take into account the age of the pipes, we recovered information about the years of construction of the networks from other sources because this information is not reported in the journal. Analogously, we referred to general information about the type of material (concrete and brick pipes, stoneware, plastic pipes) consistently with the years of construction of the networks.
4. Data Analysis and Discussion
Table 3 and
Table 4 summarize, respectively, the intervention categories detected and the causes of intervention for each province during the two years of observation. The data highlights that the most frequent category of intervention is pipe occlusion with exfiltration. A less frequent but nevertheless evident case is manhole occlusion. Across the whole dataset, pipe occlusion has an average incidence of about 74%, which varies from 98% to 13%. This last value is relative to the Brindisi province in 2017, when an unexpected value of manhole occlusion was observed (86%). The remaining categories of registered interventions are so infrequent that they never represent 1%. On the other hand, as regards the intervention causes, the data showed that the unique factor detected for the requested maintenance belongs to the “ordinary” category, for an average value of about 97%. This is related to pipe factors or properties which generate occlusions and make the pipe easily subject to blockages. Only for the Brindisi province, abnormal data were detected in 2018; about 93% of interventions were due to improper use, and then to external objects discovered in the pipeline system. However, this one is the second cause generally detected during the maintenance operations for the remaining provinces and the year 2017.
Detailed information about the type and age of each single sewer pipe is not readily available (it is not reported in the maintenance journal), which is admissible considering the years of construction and the overall extension of the sewer network. However, a recent survey (AQP internal report) supplied information about the total length per type of material and the average year of construction of the system. The first pipes were built in the 1920s; the concrete and brick pipes can be dated between the 1920s and 1940s; stoneware, the most adopted material, can be located since the 1950s; and plastic pipes have been adopted from the 1970s until today.
Table 5 shows information about the age of pipes in these provinces. The diameter most used in the sewage system is represented by a Diameter Nominal (DN) of 200 mm.
After identifying all the causes and types of intervention, we focused on the number of breakages and the interventions that generated the obstruction of the sewer system. Every intervention was distinguished according to the type of material of the pipe affected by the single maintenance.
Table 6 and
Table 7 show, respectively, occlusions and breakages intervention per kilometer of sewage pipes, classified according to the pipe material. The recognized pipe materials and codes adopted into the following figures are summarized in
Table 5. The adopted materials for the pipes in the investigated provinces are mostly stoneware with a percentage of about 80%, followed by PVC, concrete, and reinforced concrete, with percentages of up to 10%.
Analyzing
Table 3 and
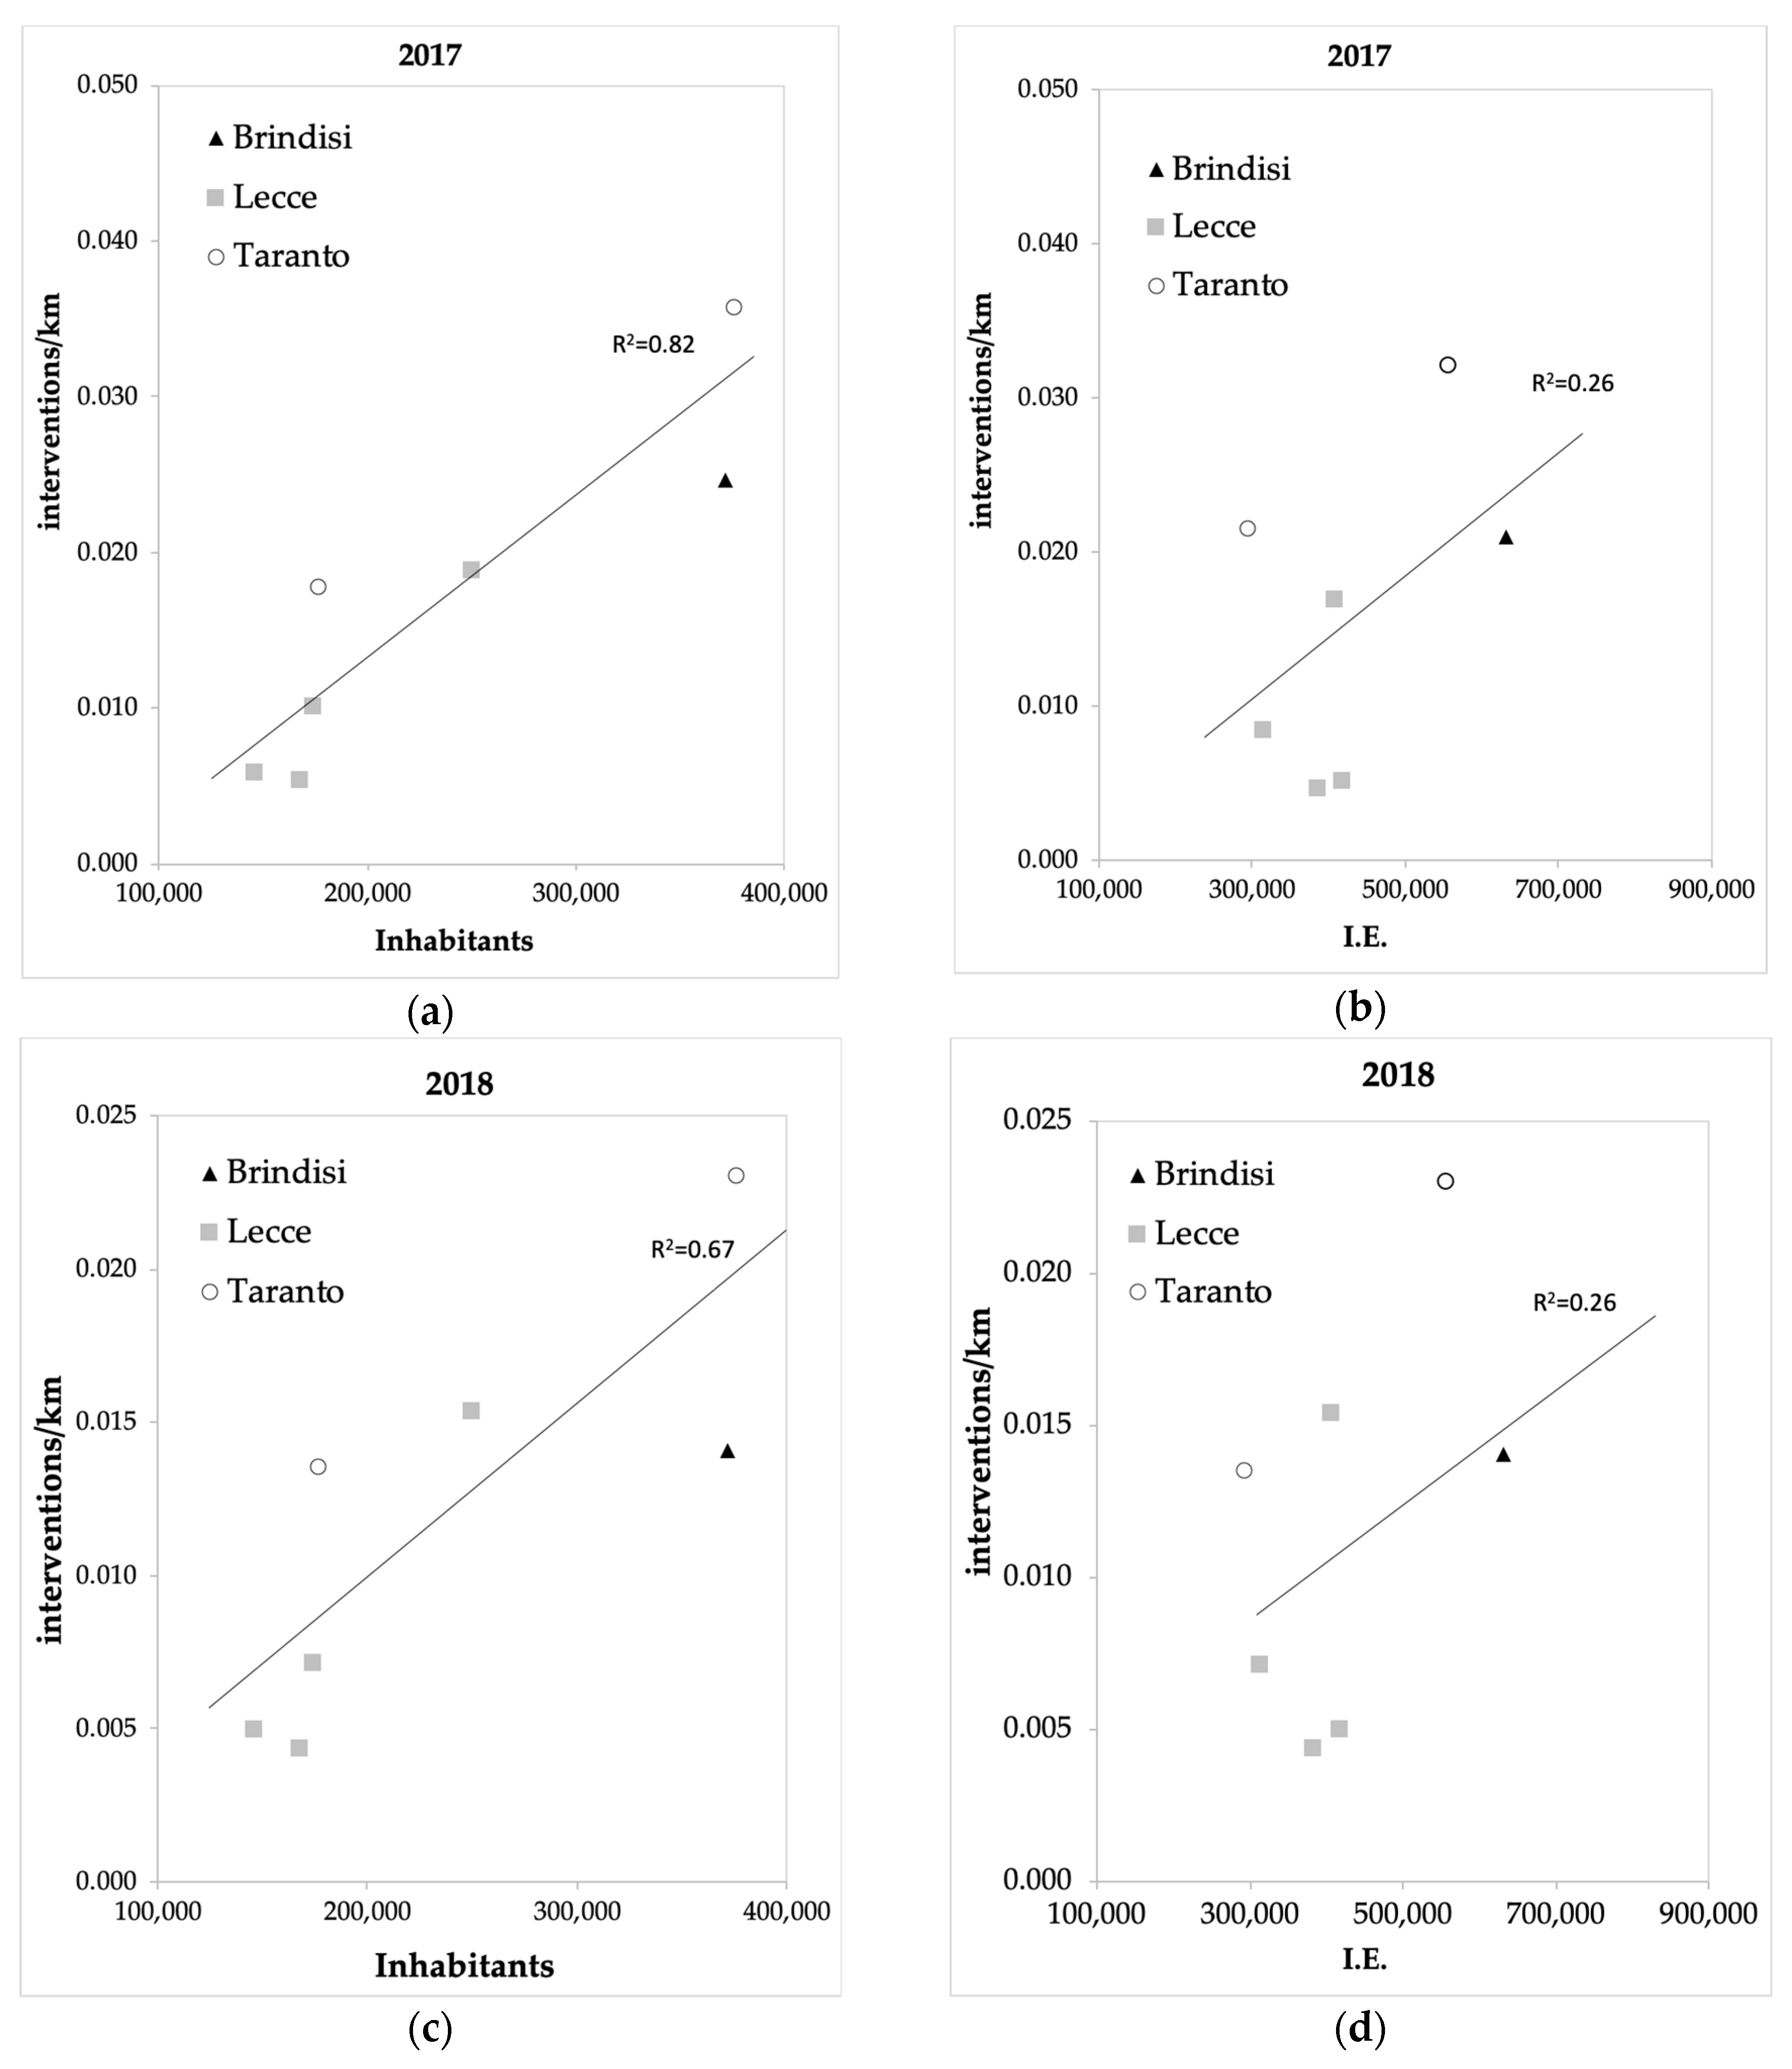
Table 4, a peak of interventions for the Lecce province can be observed, information that, if not contextualized, does not lead to any useful consideration. To this end, the main challenge was the identification of the appropriate estimation parameters to describe and better characterize the sewer leakages. This problem was addressed by relating the number of interventions for each agglomeration with large-scale indicators characterizing the sewer system. In particular, the total length of the network per town, the inhabitants, and the Equivalent Inhabitants (I.E.) provided the most interesting results. The latter two parameters can be used to investigate whether or not there was a relationship between the use density or the sewage produced in the network and the recorded leakages. An average number of 12 interventions per kilometer of the network was found across the whole dataset. The province with the lowest rate of interventions per kilometer is the Lecce province. However, it should be noted that this is the only province divided into four agglomerations, and this leads to a lower number of data for agglomeration compared to other provinces in which the population density, compared to the total area of pertinence, is greater. Accounting for this issue, the data of the interventions per kilometer of the network were represented respectively according to the resident population and the equivalent inhabitants (
Figure 3) for both the two years of observation to evaluate the possible influence of the size of the network and the stress condition to which it is subjected in the pipeline system.
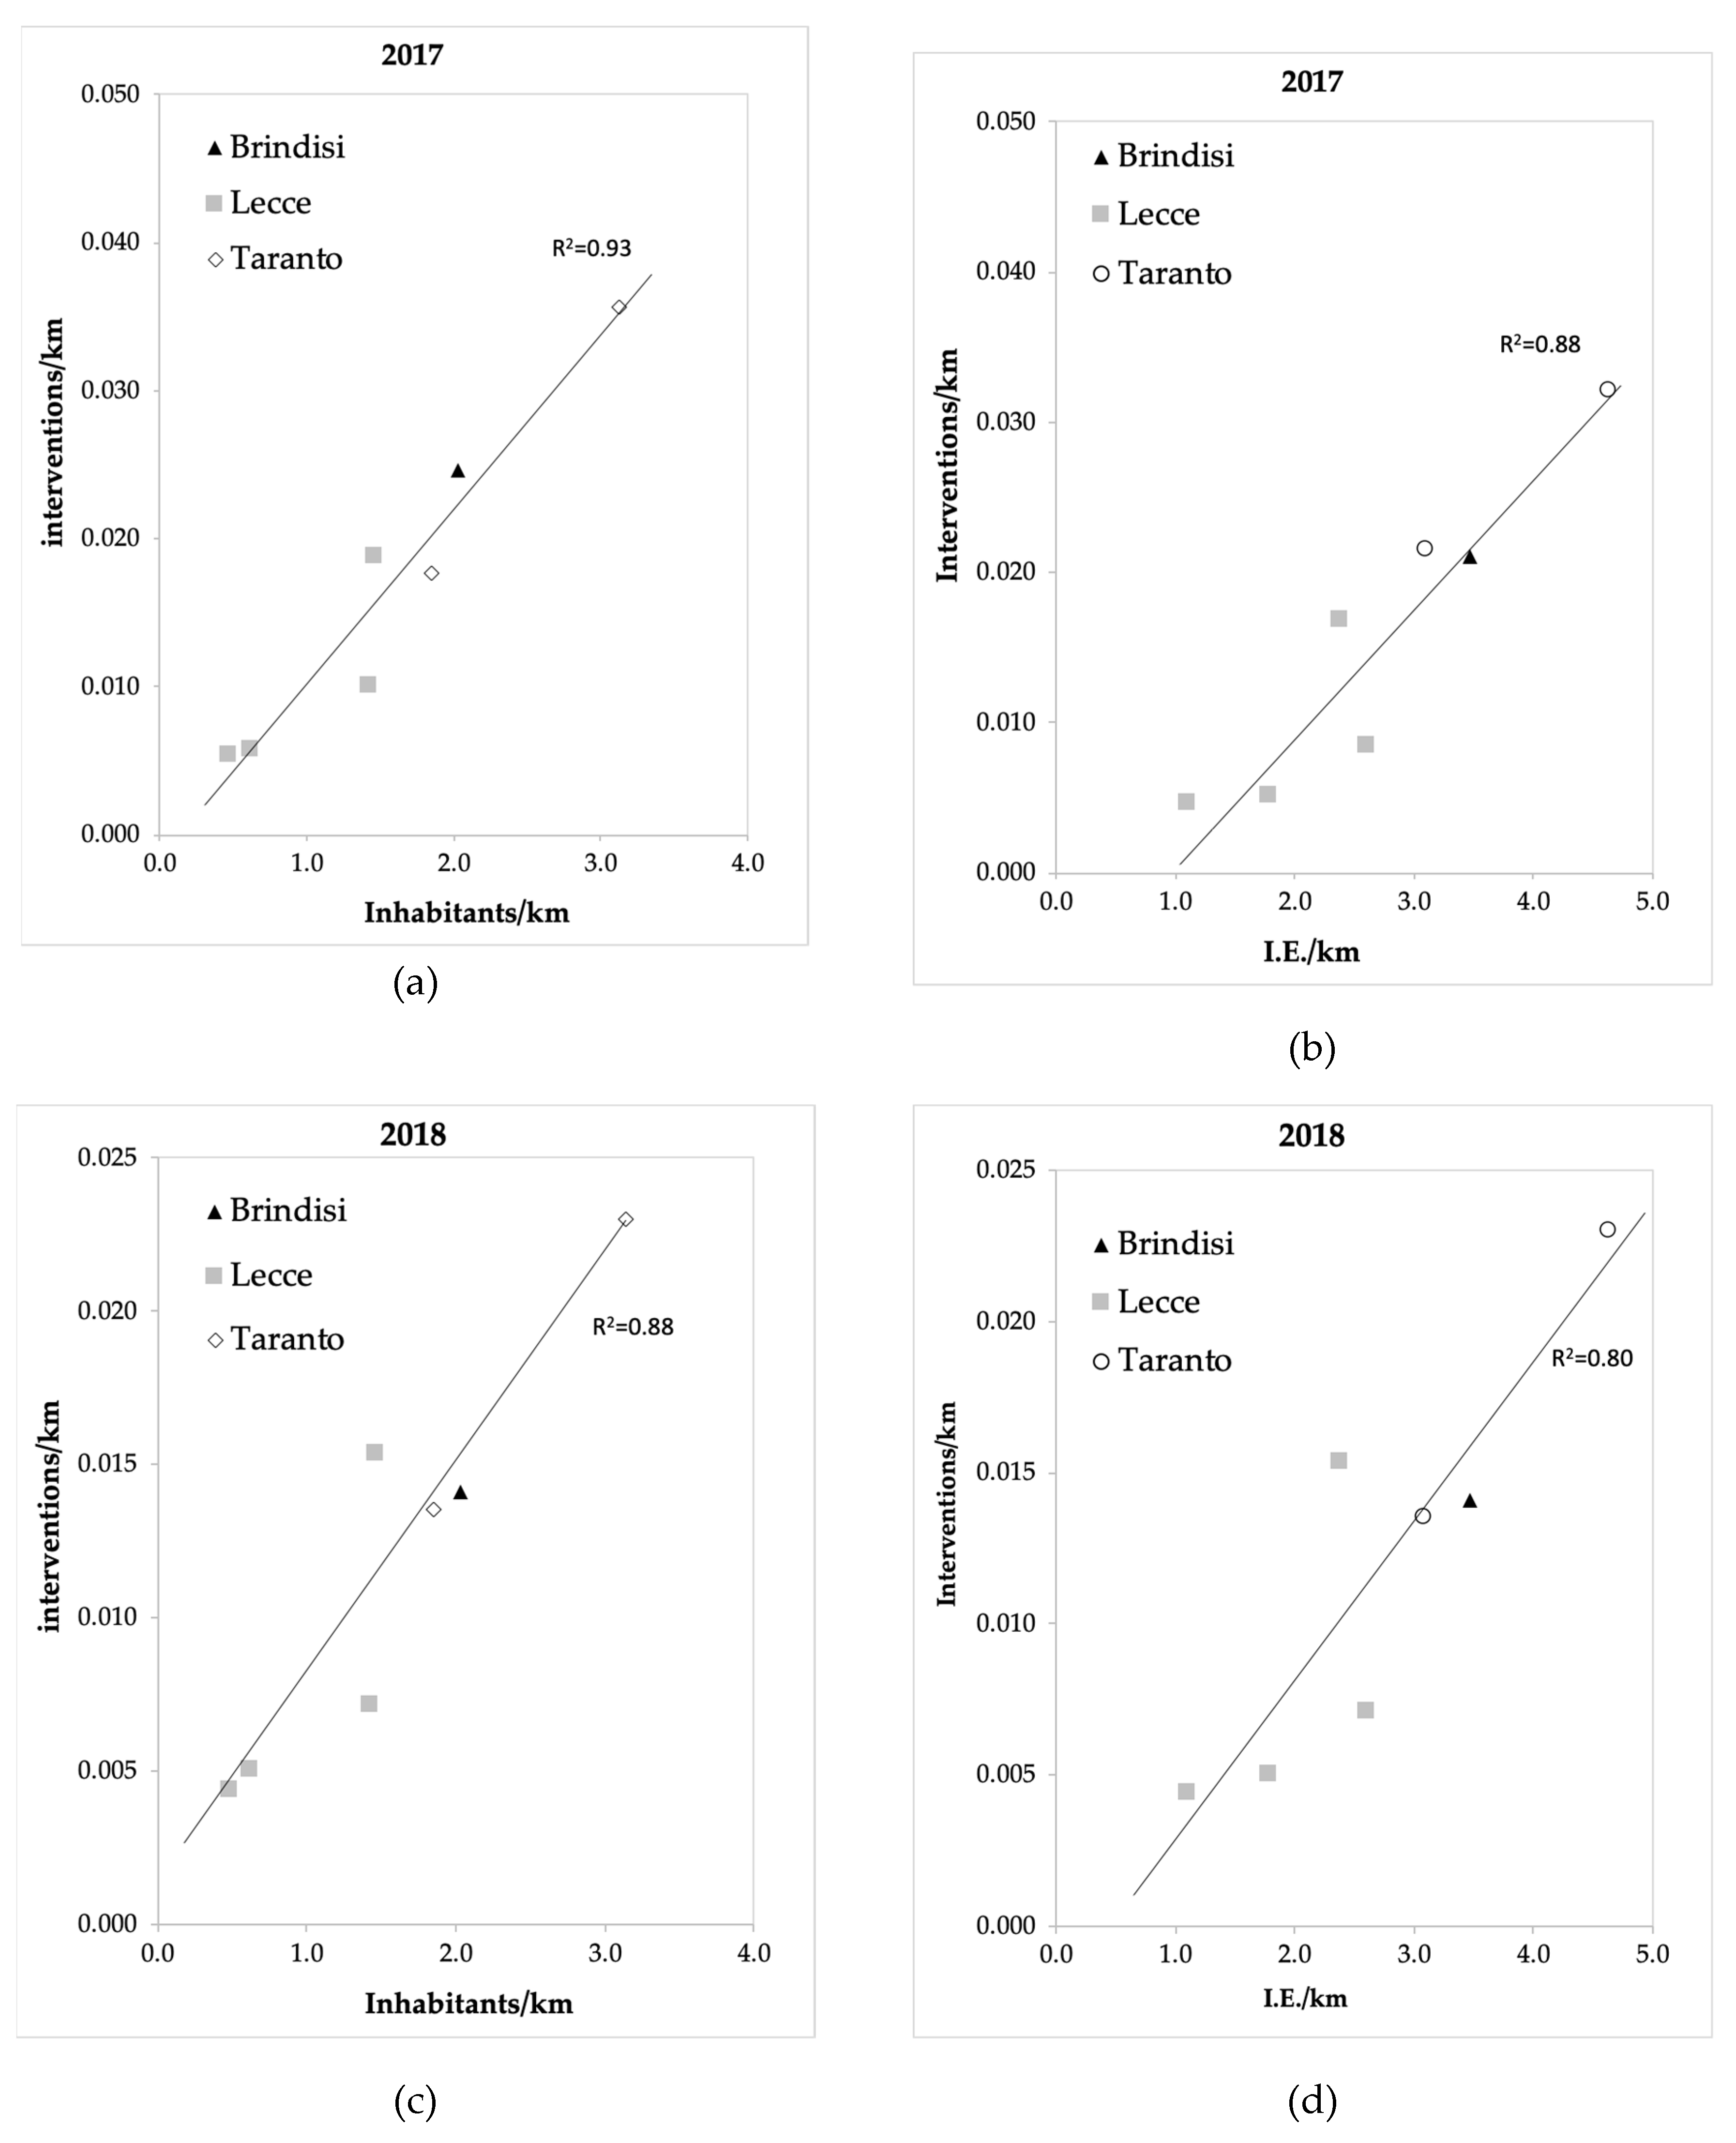
In both cases, although there is dispersion, especially in the analysis with I.E., a general increase in interventions with the number of inhabitants can be seen. A further normalization of the data was carried out, evaluating both the inhabitants and the I.E. per kilometer of the wastewater system (
Figure 4). The results obtained from the comparison of the interventions per kilometer with the inhabitants per kilometer and I.E. per kilometer provided a better linear trend. The R-squared measure, in this case, was much higher and also very similar for both the considered parameters for the two years.
It was found that, as had already emerged in the analysis of the interventions per kilometer, the highest number of data referred to one of the two agglomerations of the province of Taranto; it is worth noting that this is the territorial area with the highest number of I.E. per kilometer of sewer pipelines.
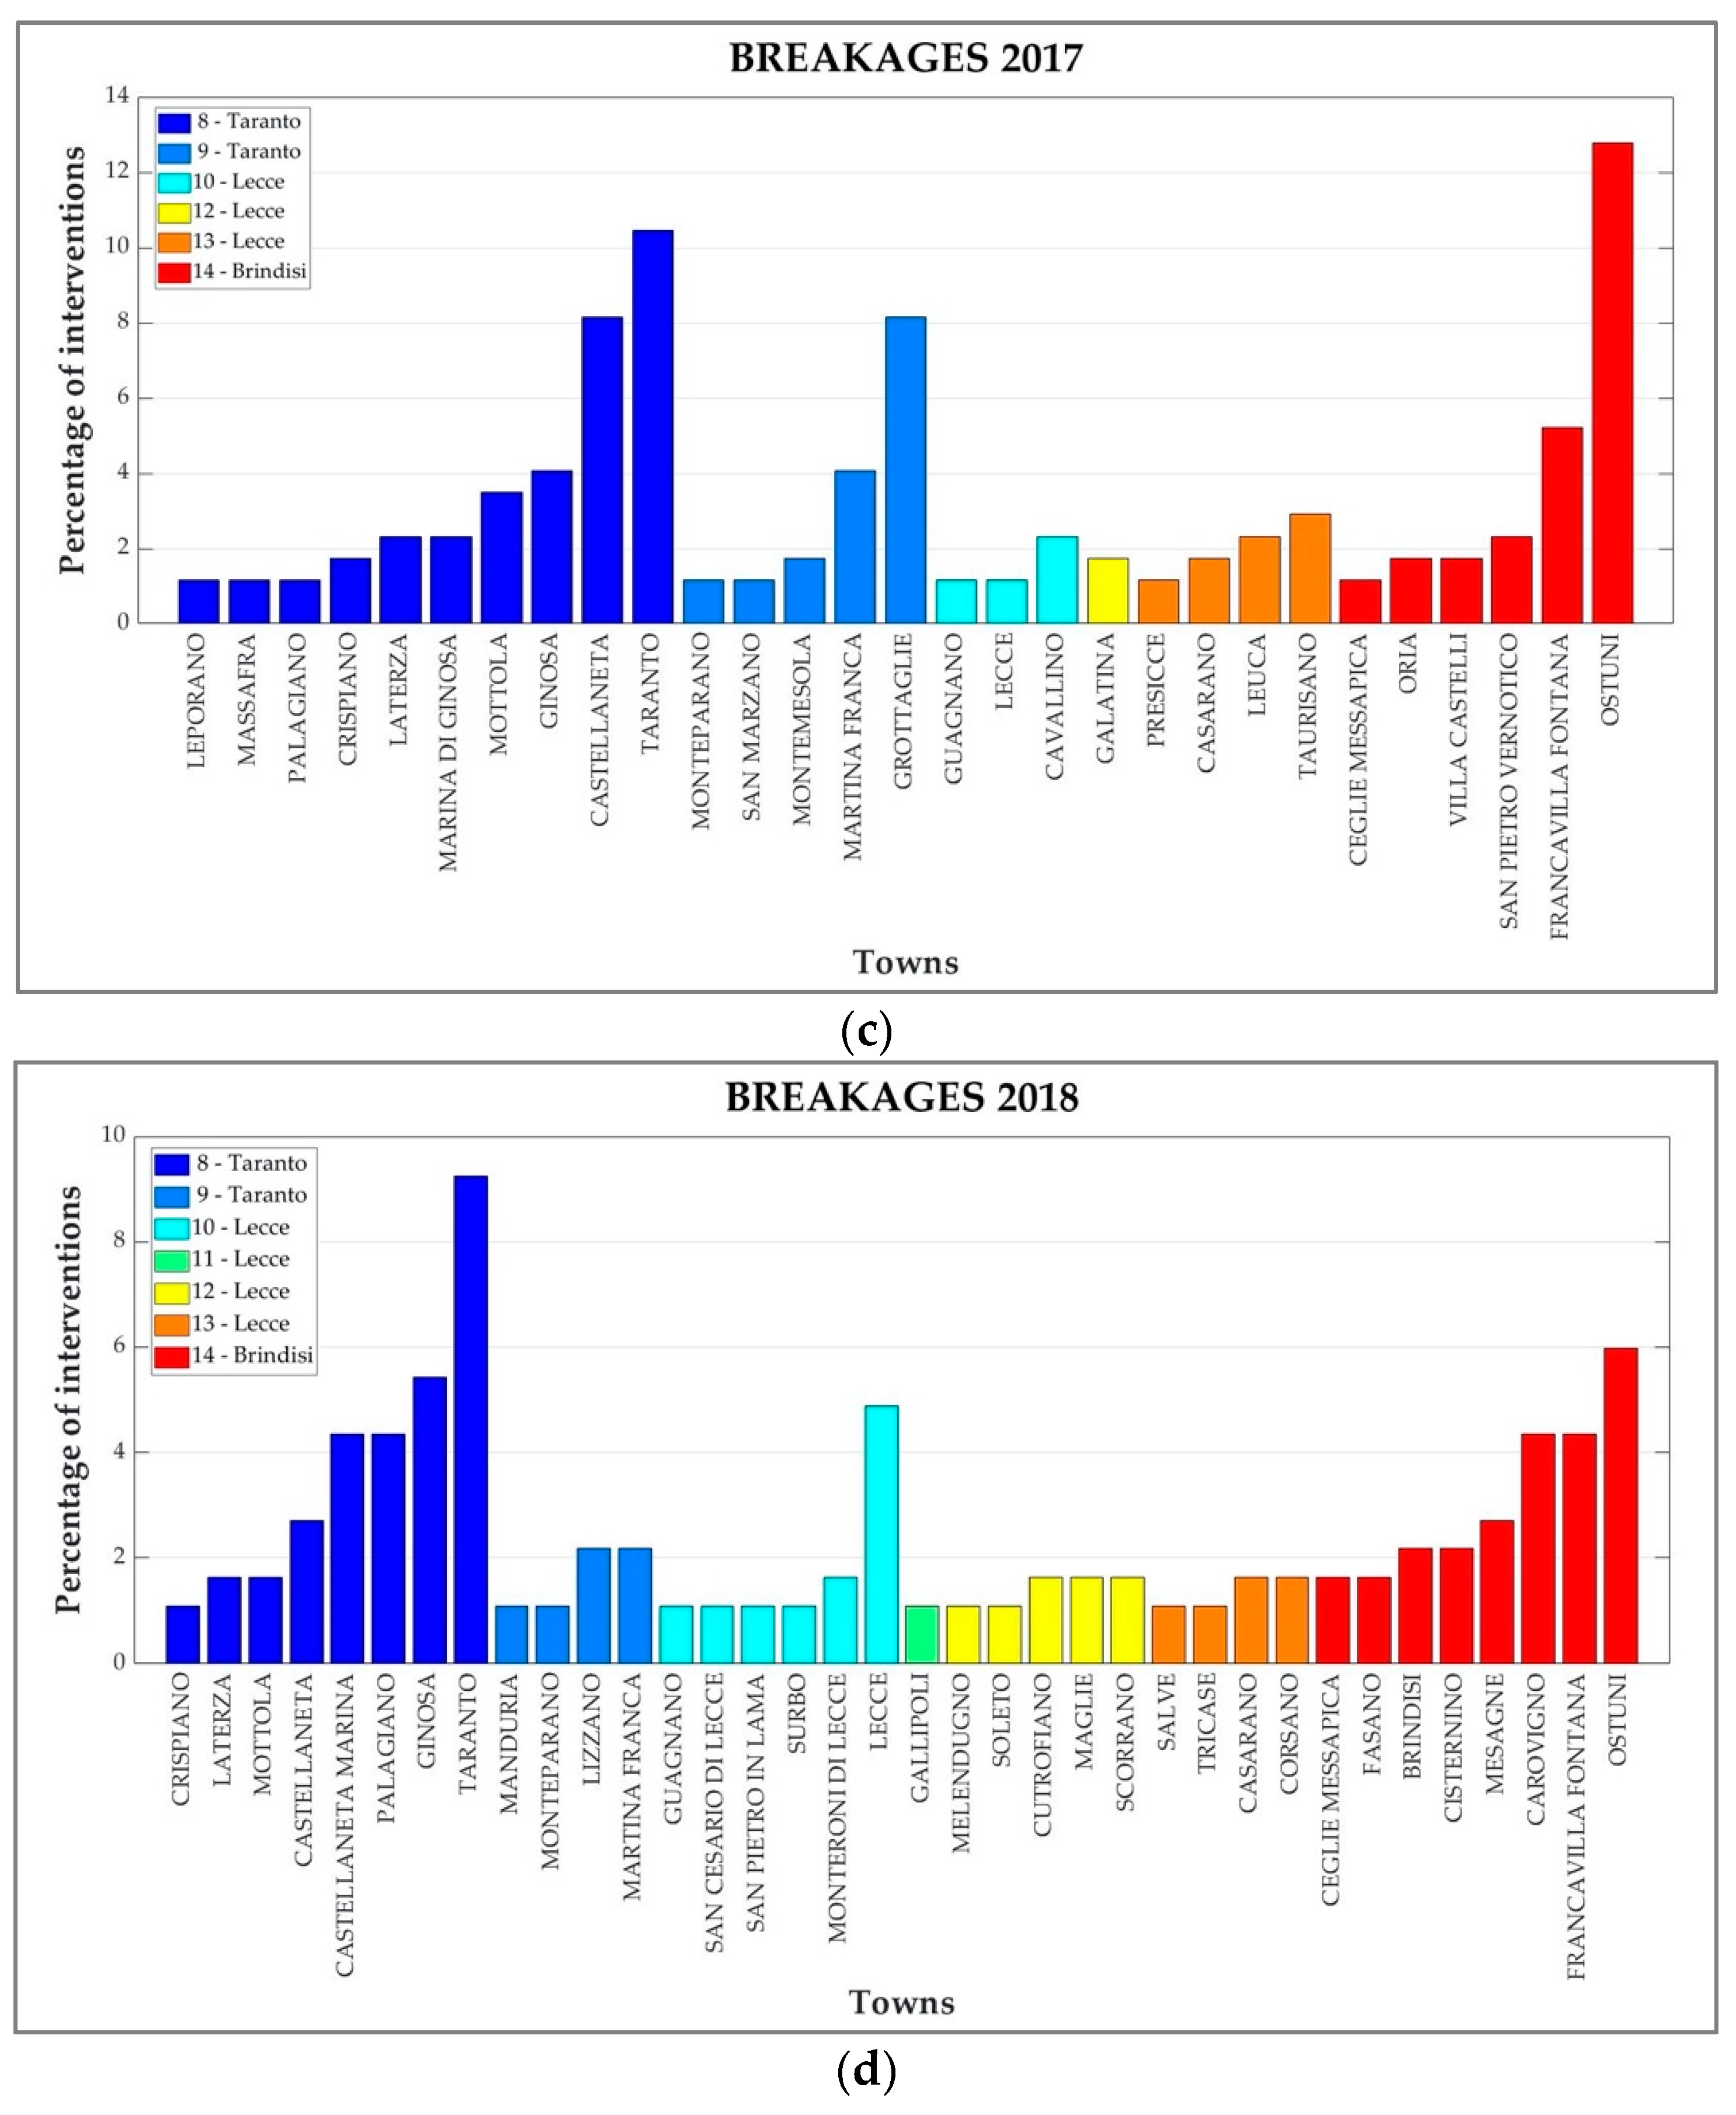
We also focused on the towns characterized by a major number of interventions. For this purpose, the yearly percentage of interventions in each town was calculated.
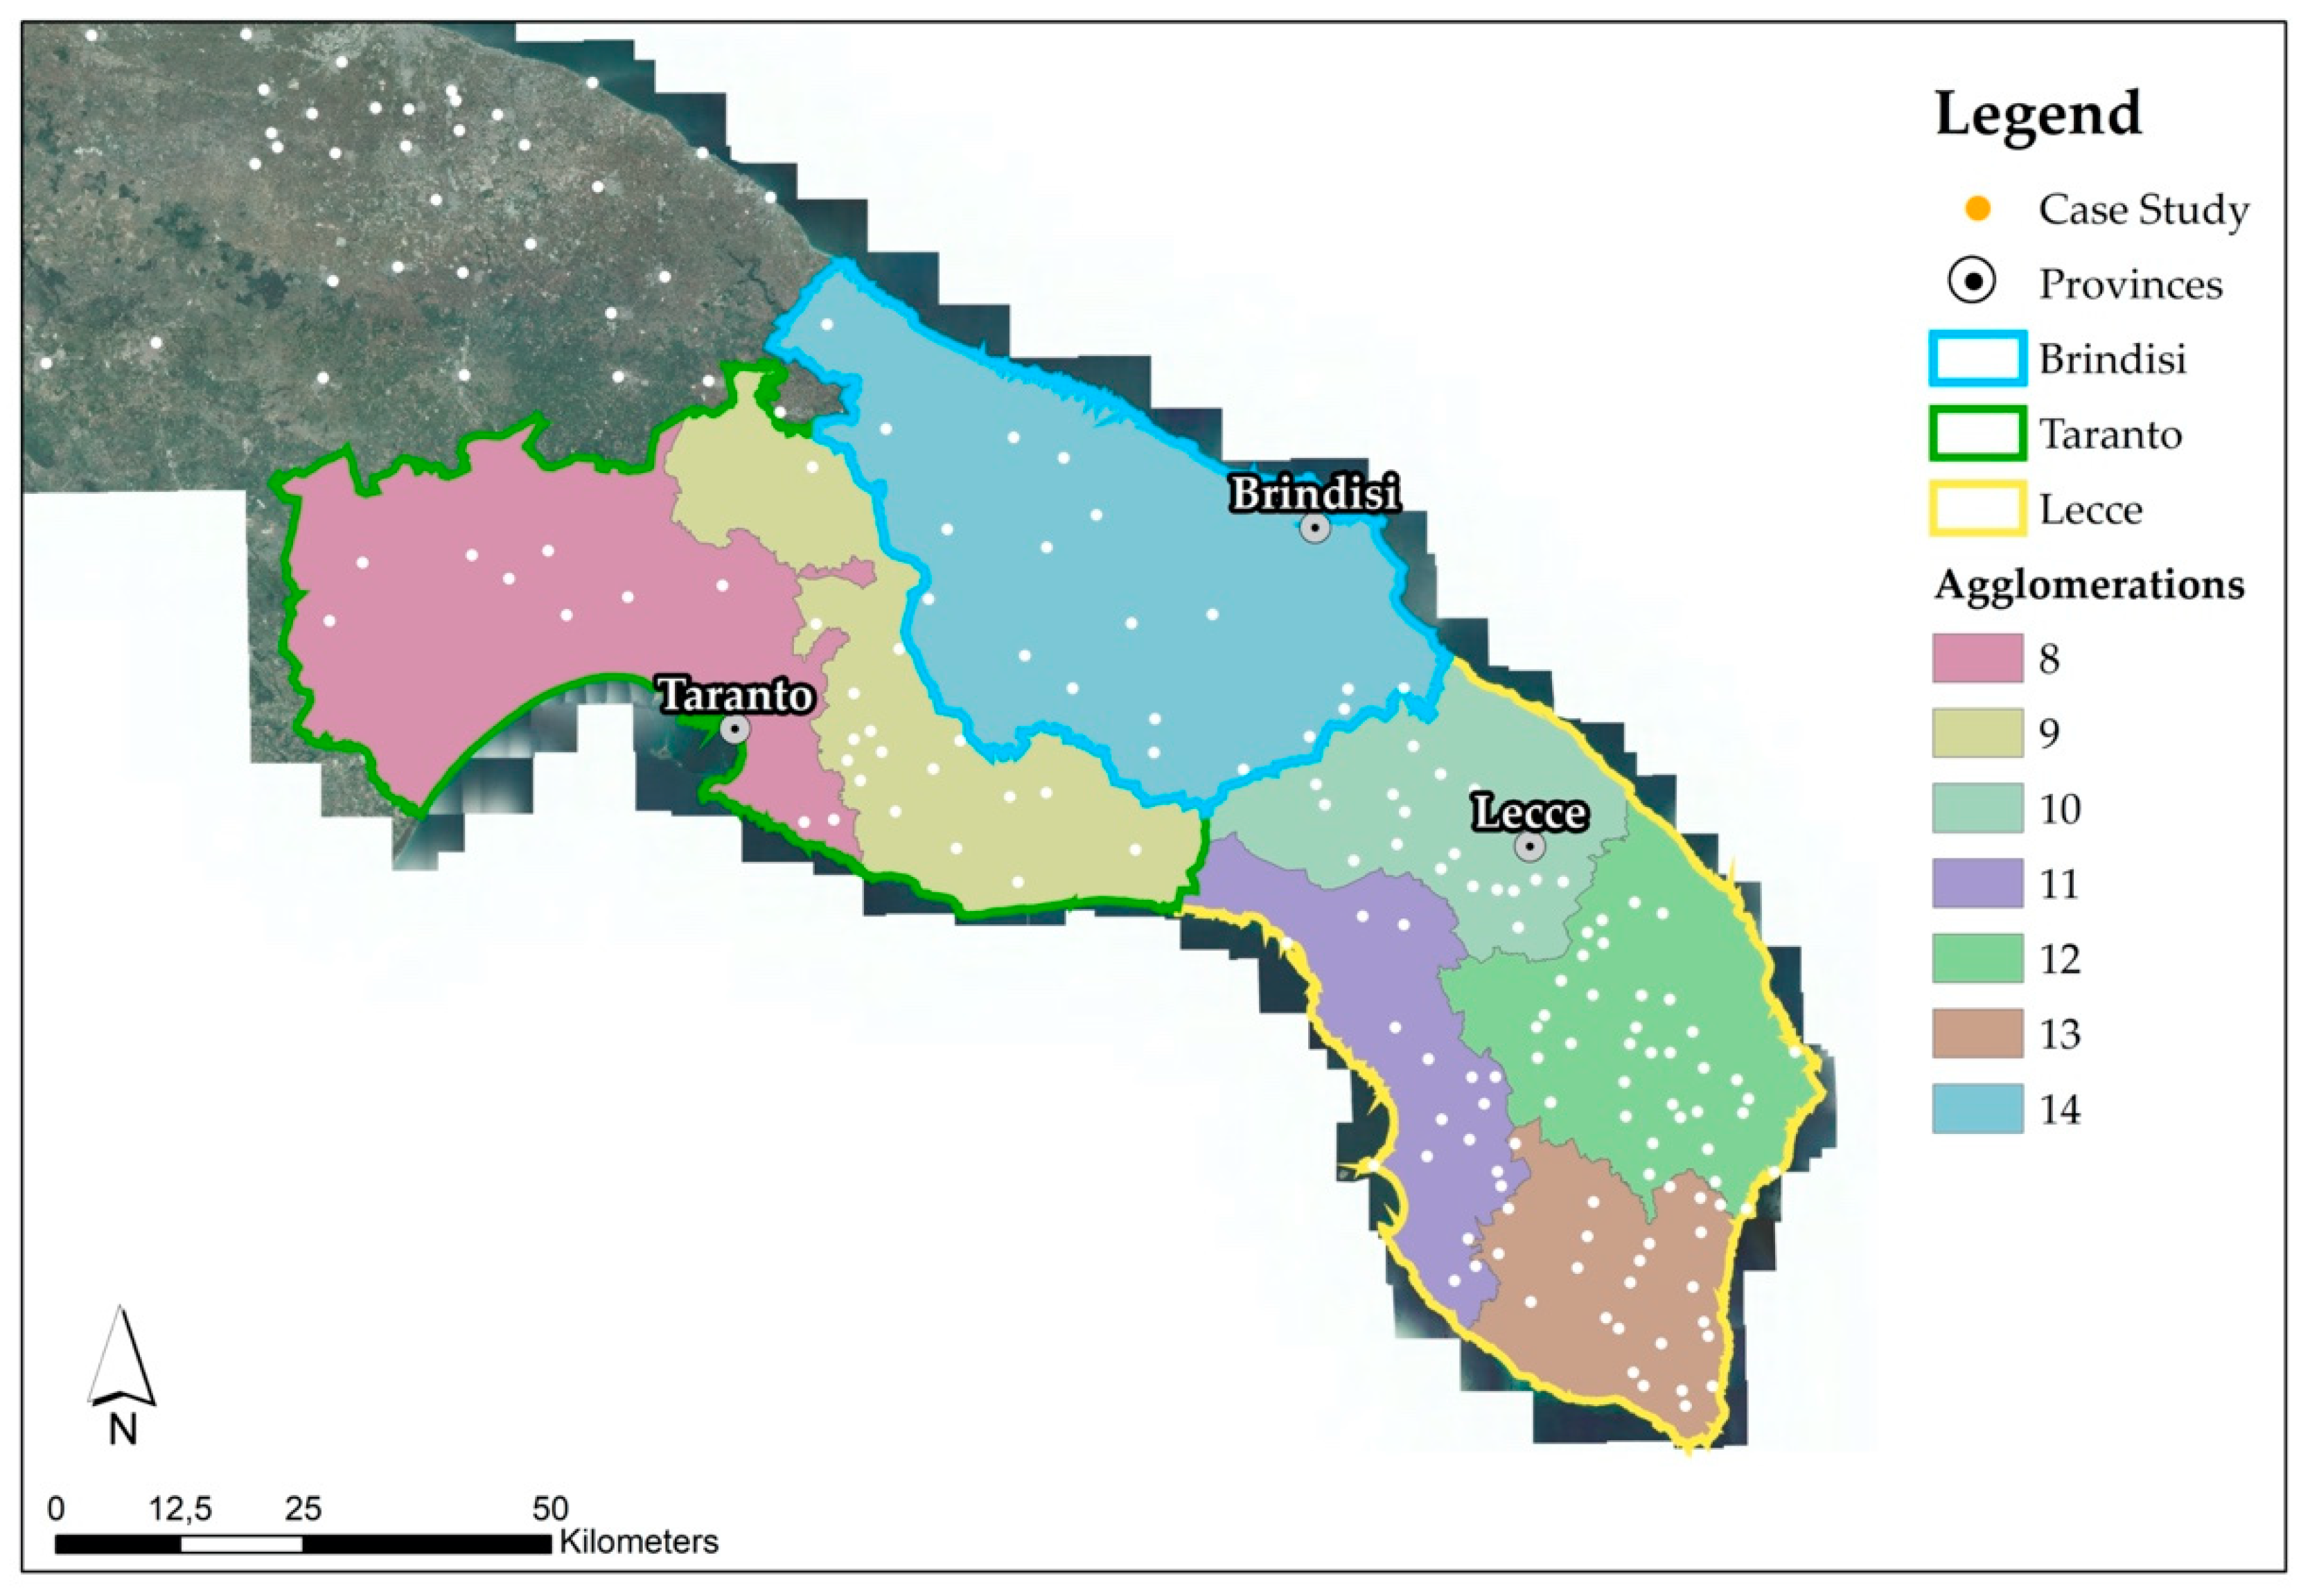
Figure 5 shows only towns characterized by a yearly percentage of interventions equal to or greater than 1%; the towns are subdivided according to agglomerations, and obstructions and breakages are considered separately. The different colors refer to the number of each agglomeration indicated in
Table 1 and showed in
Figure 2; they are aggregated in the legend by province.
The data highlight how Taranto, Lecce, and Brindisi present a major number of interventions; this result is obvious, due to their higher numbers of inhabitants (respectively, about 20,000, 100,000, and 90,000 inhabitants) and very long pipe networks.
A different situation is represented by cases like Crispiano, Laterza, Massafra, and Palagiano for the Brindisi province; Carovigno and Francavilla Fontana for Taranto; and, finally, Casarano, Cutrofiano, Guagnano, Maglie, Surbo, and Tricase for Lecce. These are towns characterized by inhabitants from 6000 to 36,000. Such a high percentage of interventions does not find any justification if one considers that all these sewer networks have been built in the same period. These towns are not even characterized by touristic flux, which could produce a great stress for the network even if for limited periods of the year. For this reason and in the absence of other information, the available data lead us to exclude the possibility that pipe material is a strong factor in possible breakage or occlusion. This is because most of the pipes are stoneware and equally old, and stoneware is known for its low roughness and resistance to chemical agents, conditions that prevent occlusions, assuming that stoneware can preserve these properties after so many years.
A Local Focus: The Town of Carovigno
Data registered during the above-mentioned two years revealed that quite often several interventions recorded occurred in the same pipes, thus highlighting the existence of criticalities in some sewage pipes.
This section presents a town dataset analyzed in more detail—the sewer network of Carovigno, one of the towns that has shown a higher percentage of interventions during the two years of observation. The aim was to observe how the sewer leakages were distributed along the sewer system and the probable causes that could explain them.
The town of Carovigno has approximately 17,000 inhabitants and is situated 30 km north-west of Brindisi (
Figure 2), 7 km from the Adriatic Sea and 8 km from Ostuni, the well-known Apulian White Town. Carovigno has a smooth hilly landscape with medium slopes of 3%.
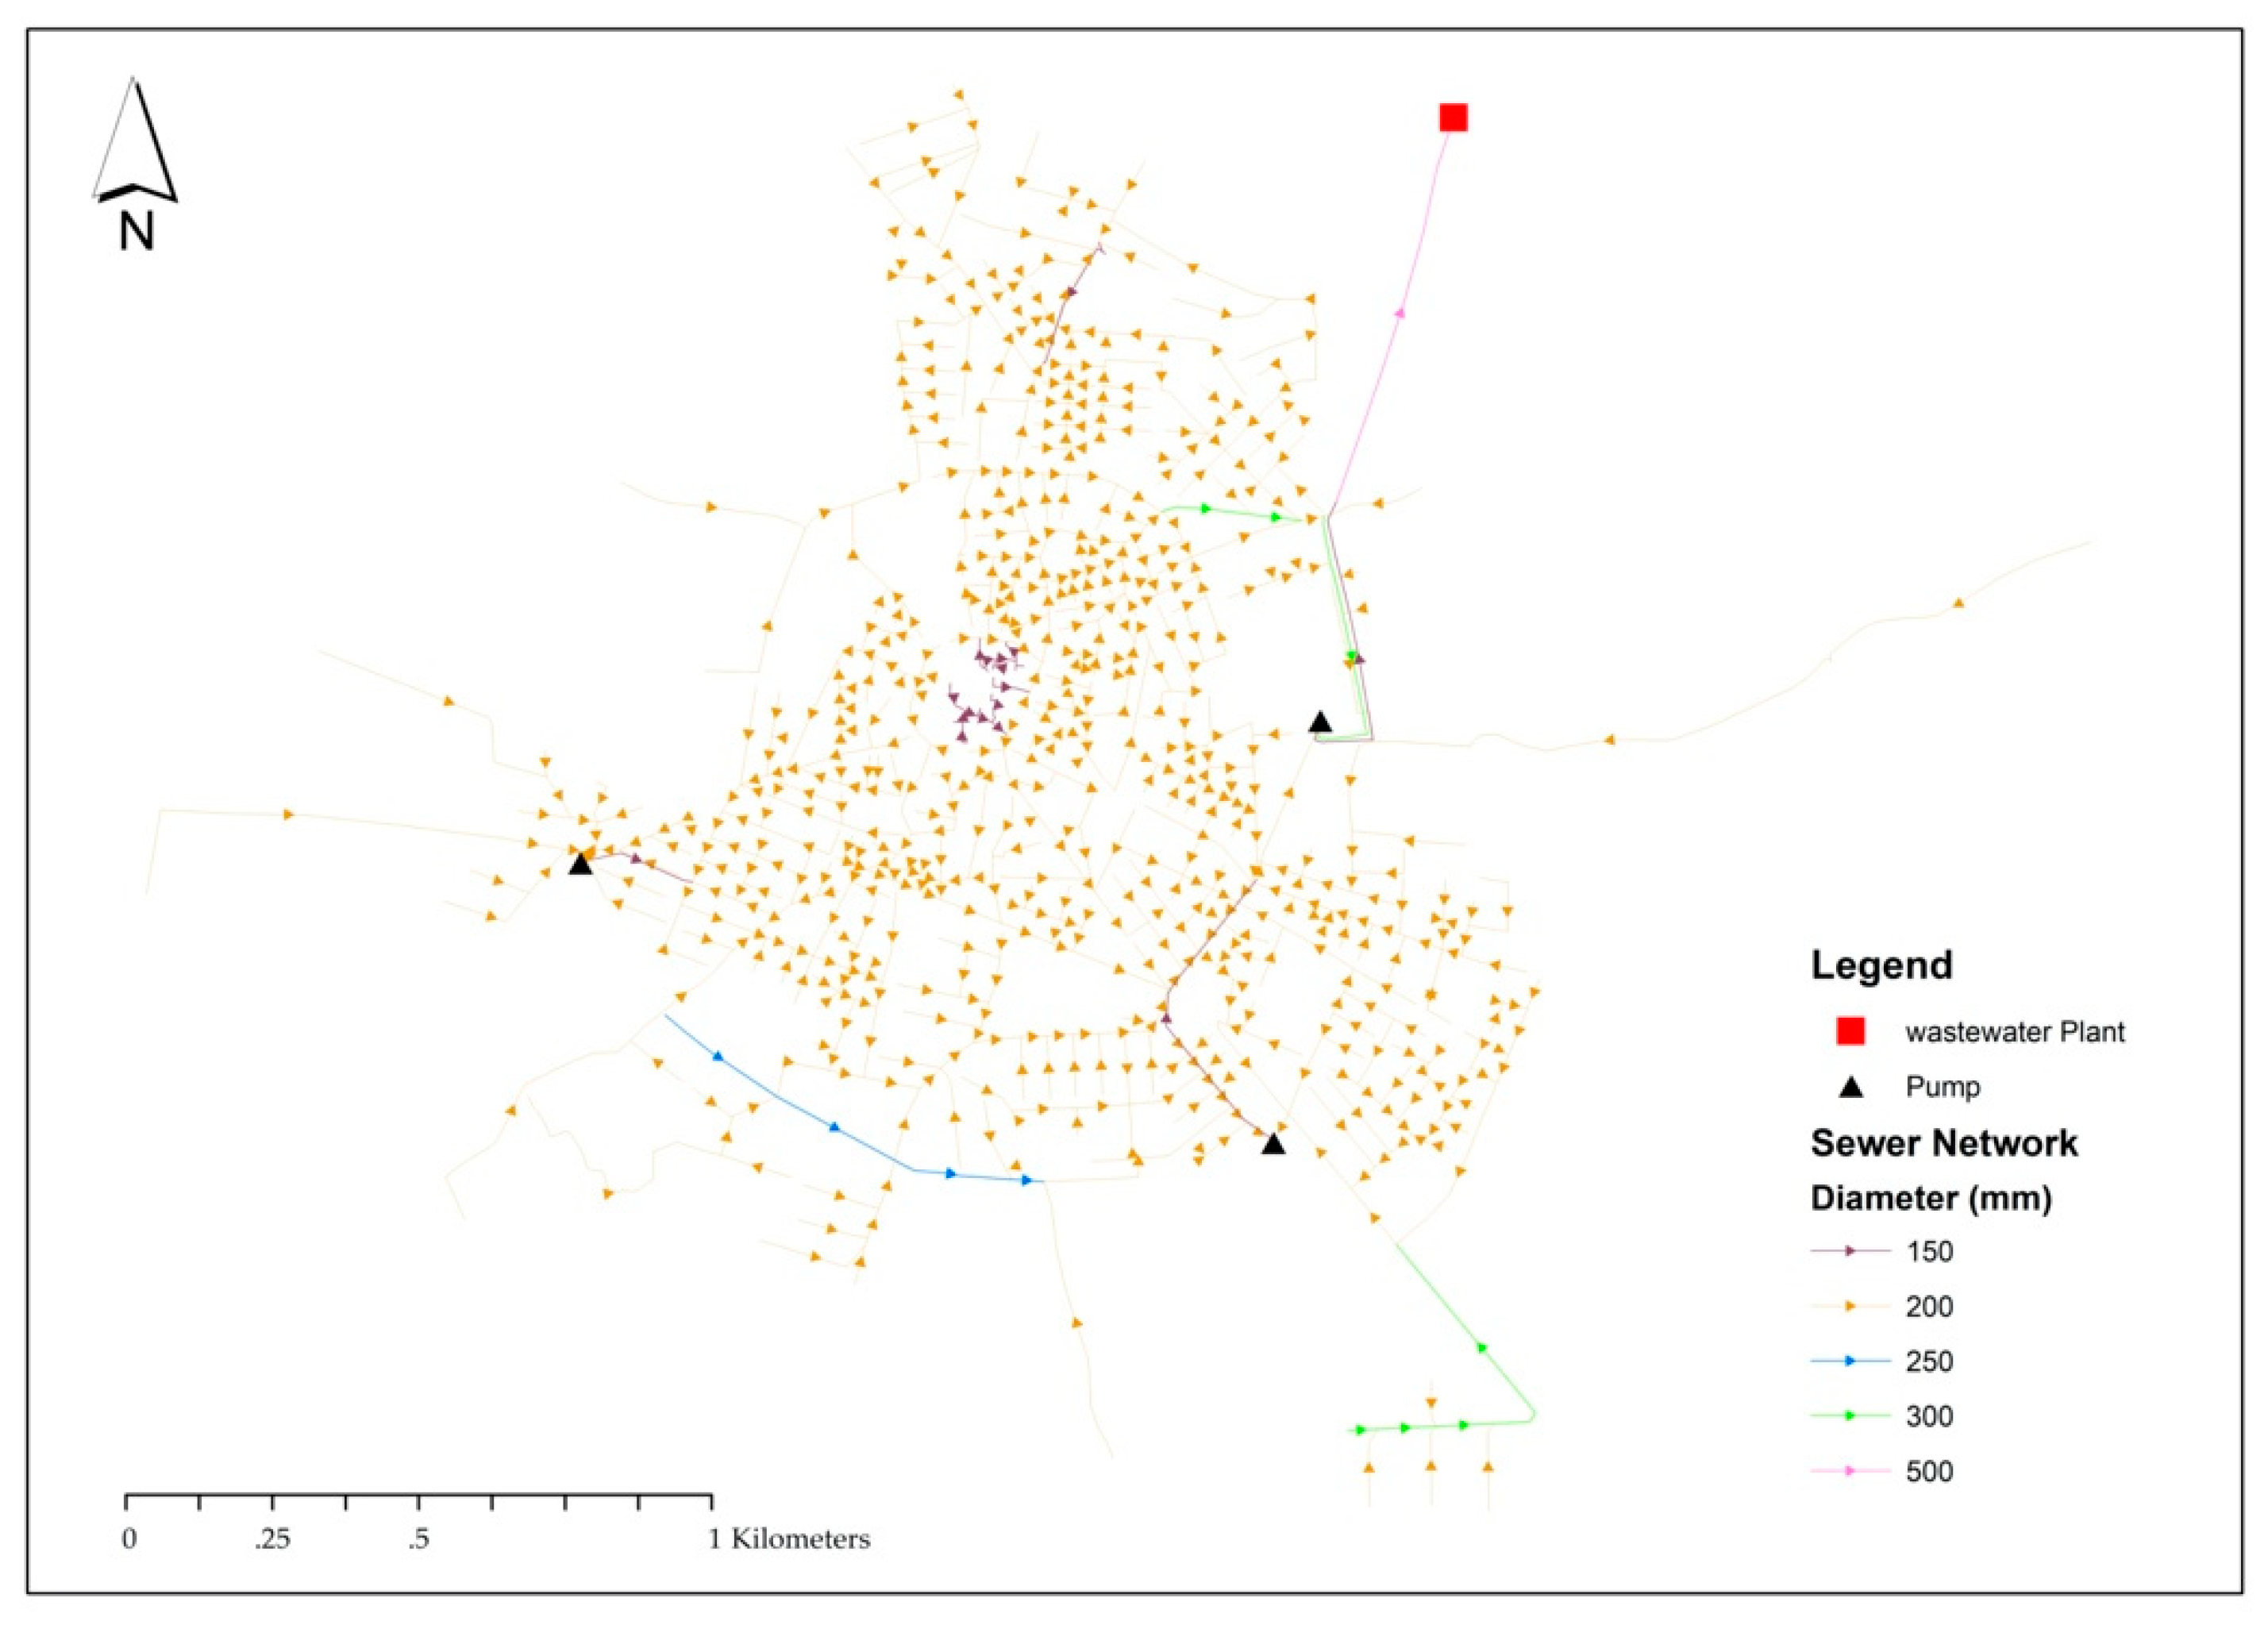
A sketch of the separate sewer network of Carovigno is represented in
Figure 6. The network, whose description comes from a dataset other than the maintenance journal, has a total length of about 30 kilometers. The main diameter is 200 mm and the material is stoneware.
The network presents three pumping stations. Two of them are placed in and serve some depressed areas of the urban center and a third one is placed at the network outlet and pumps water to the wastewater treatment plant. Except for these singular points, the sewer system is characterized by gravity flow. The intervention positions in
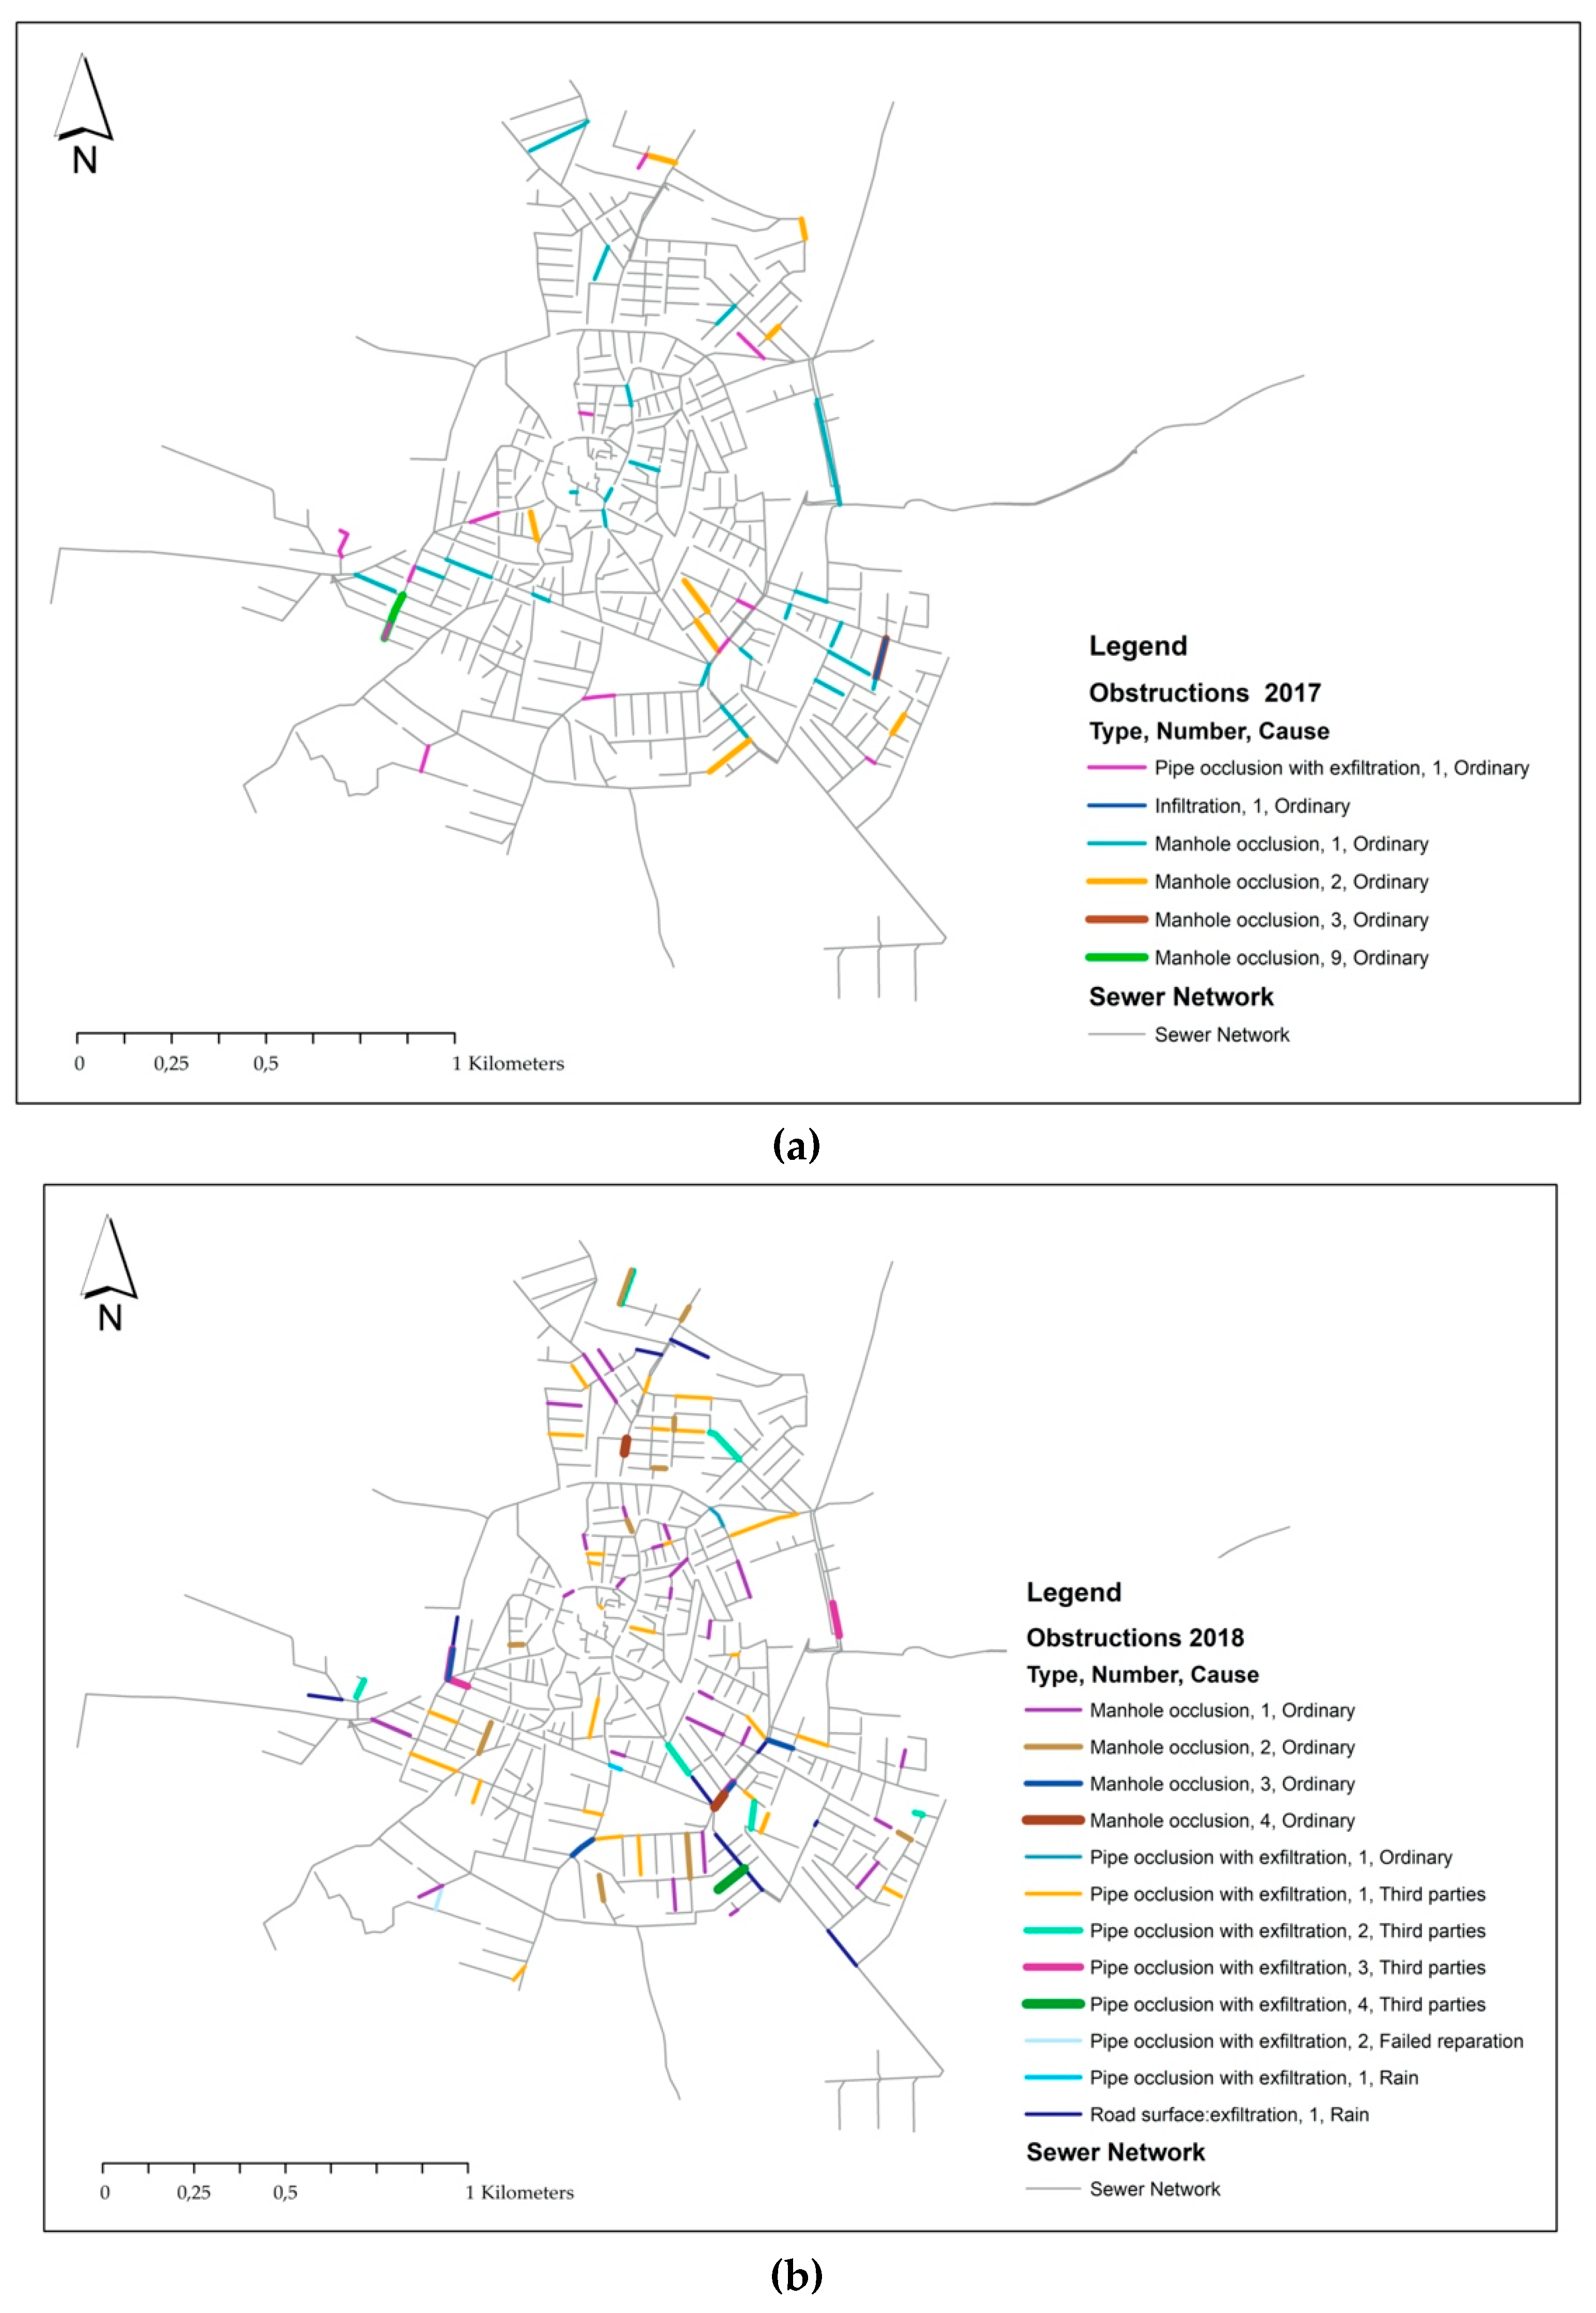
Figure 7 and
Figure 8 were deducted manually from the Journal of Maintenance thanks to the address information recorded by the operators. Starting from the total number of interventions requested, only the disservices indicated in
Section 2 have been mapped in the analysis for a total number of 73 interventions for 2017 and 130 for 2018.
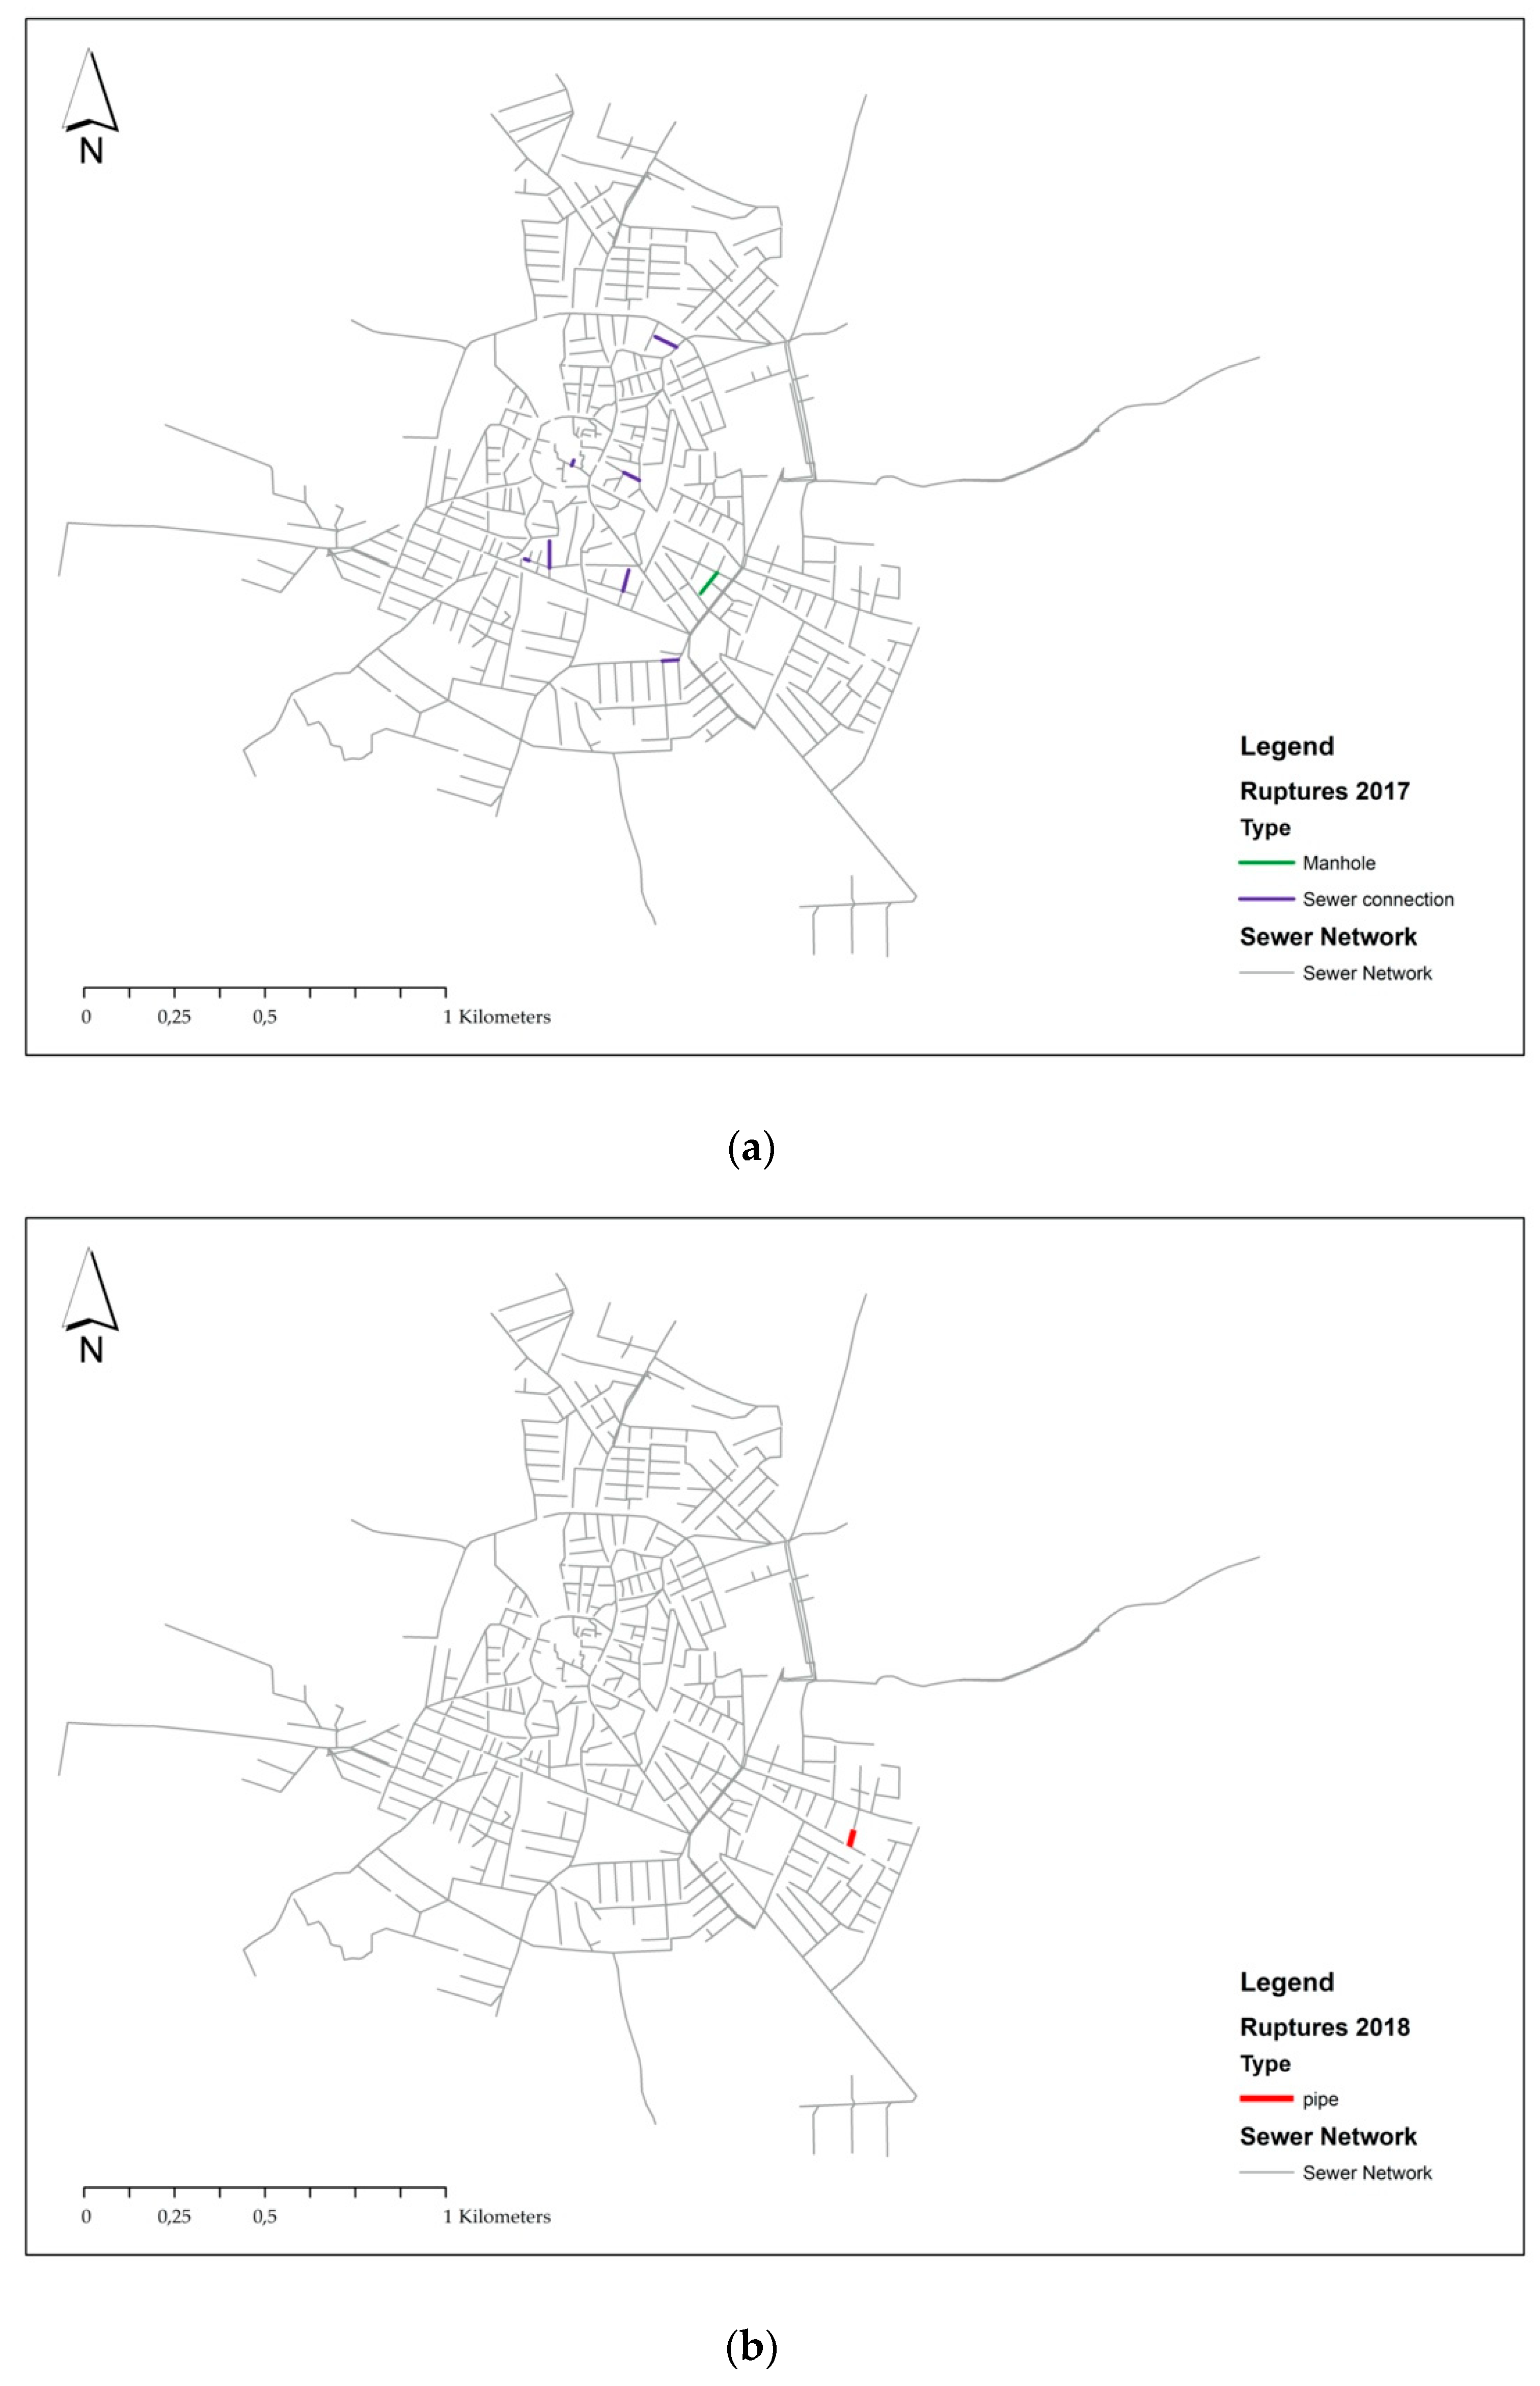
Figure 7 and
Figure 8 highlight how the exfiltration is mainly due to obstructions, except for a negligible number of ruptures.
Figure 7 shows a large number of manhole and pipe occlusions that occurred from more than one to nine times. The diameters affected by the losses are almost all 200 mm.
An important aspect is related to the type of sewer pipes involved, which are frequently lateral and sub-main sewers.
The number of breaks (pipes or manholes) at this scale of analysis is very small for providing indications without further local information.
5. Conclusions
The issue of sewage leakage appears to be quite real and of considerable interest in the scientific field. In particular, its environmental and management repercussions make it a central topic in technical literature. The absence of extended data and contextual in-depth studies on the topic does not allow us to know with certainty the variables that directly contribute to influencing the number of losses that are recorded in a sewer system.
This paper exploits the availability of the data from the maintenance journal of the AQP in the period 2017–2018 for the provinces of Taranto, Lecce, and Brindisi. Despite the available data covering only a short period, the extension of the sewer network, approximately 6700 km, provides a useful reference to highlight aspects of its critical issues.
In particular, interesting observations on the capacity of a few large-scale indicators, accounting for the extension of the sewage system and its usage stress, were provided.
The absence of detailed information on the age of any single pipe subjected to effective intervention does not permit us to completely exclude aging as a factor in causing the high frequency of exfiltration due to both obstructions and rupture. Nevertheless, we observed that most of the interventions were related to the same towns for both of the two years of maintenance data. While no specific information about the age of singular pipes is available, accounting for local intervention, AQP reported that all of these sewage systems were originally built in the same historical period. Therefore, a greater frequency of intervention could be due to factors related to possible bad hydraulic function and incorrect user habits. The comparable number of obstructions and breakages in different towns reinforces these conclusions, in addition to the repetition of many interventions in the same pipes in the two years of investigation and also the high frequency of interventions in the pipes of small or medium towns that were not different in terms of the year of construction.
The technical literature [
13,
30] suggests preventive and programmed maintenance scheduled based on specific criteria, such as known problems or frequent intervention requests. Our analysis demonstrated that the sewage systems of AQP could be improved with actions helping the hydraulic functionality and reducing faults and inconvenience to the users (e.g., sewage cleaning).
It is relevant that the most frequent causes of interventions were “ordinary” causes and improper use, which are factors not related to the age or material of the pipes. These could be rather addressed to the installation modality (e.g., very small slope or siphon trunk) or related to social habits that entail an incorrect use of the sewage system (the introduction of solid objects into the pipe, like kitchen remains, nappies, pads, rags).
We observed that one of the most important parts of a preventive maintenance program is the systematic and frequent cleaning of sewers. Starting from this consideration and collecting intervention data on any specific case (such as that shown for Carovigno), the water management company can define a list of critical pipes that need more frequent cleaning operations. A similar approach can be adopted when it is impossible to conduct an inspection survey of the sewer network, and may help to define how often a part of the sewer system should be cleaned. Whereas manhole inspection is quite easy, the same cannot be said for pipes, where television inspection permits us to identify obstructions, roots, or other causes. In this way, the costs for CCTV can be reduced and limited to situations where the cause of the obstruction needs to be cleared. The costs of sewer cleaning could be optimized by providing a more frequent hydraulic cleaning of critical pipes and a less frequent one for lateral and sub-main pipes. Nevertheless, if a normal maintenance program requires a cleaning operation every 18–24 months, it will be necessary to increase the frequency of the hydraulic washing of critical pipes to once every 2–3 (maximum 6) months, depending on the obstruction frequency.
Moreover, information about the improper use of the sewerage system suggest the need for social education aimed at improving users’ knowledge about the environmental and sewage works consequences of some habits.
This exploratory analysis of the Journal of Maintainance of AQP reveals that interesting observations can be made when looking at a regional-scale investigation. On the other hand, the subject is worthy of future and more in-depth studies to define a closer correlation between the variables related to the characteristics of the sewer networks at a local scale.

 ,
, 


