Detection and Attribution of Runoff Reduction of Weihe River over Different Periods during 1961–2016
by
 ,
,
Shuai Yang
1,2, 
Tingting Kang
1,2,
Jingyi Bu
1,2,
Jiahao Chen
1,2,
Zhipeng Wang
2 and 
Yanchun Gao
1,* 1
Key Laboratory of Water Cycle and Related Land Surface Processes, Institute of Geographical Sciences and Natural Resources Research, Chinese Academy of Sciences, Beijing 100101, China
2
College of Resources and Environment, University of the Chinese Academy of Sciences, Beijing 100049, China
*
Author to whom correspondence should be addressed.
Water 2020, 12(5), 1416; https://doi.org/10.3390/w12051416
Submission received: 8 April 2020
/
Revised: 11 May 2020
/
Accepted: 12 May 2020
/
Published: 16 May 2020
(This article belongs to the Section Hydrology)
Abstract
:An obvious decline in runoff of the Weihe River has been detected during the last half-century. Climate change and human activity acted as two major factors inducing the reduction. However, little knowledge is acquired on how and to what extent the decadal climate change and human activity induced runoff variations, which is essential for regional water resources planning and management. In this study, the observed data of 3 hydrological stations and 31 meteorological stations were used to analyze the runoff variability, and Variable Infiltration Capacity (VIC) model (Xu Liang, Seattle, WA, United States of America) coupled with scenario simulation was employed to attribute runoff variation of each period. The results showed that runoff decreased significantly at a rate of −1.01 × 10⁸ m3·year−1 with obvious stage characteristic during 1961–2016. The water yield was highest in the 1960s and varying degrees of decline were detected in the following periods, resulting in a decrease of available freshwater by 20.54%–58.24%. Human activity had a dominant contribution to induce an increasing runoff decline from 2.068 to 5.776 km3, while the effect of climate was relatively small and lead to runoff reduction, except in the 1970s. This study gave a comprehensive understanding of time-varying runoff variability and highlighted the importance of appropriate human intervention with respect to climate change to ensure water resources security.
1. Introduction
Runoff, as a major component of the water cycle, is one of the most important water sources and plays an important role in ecology, society, and economics to support both the natural ecosystem and human society, especially in inland arid areas [1,2]. An obvious downward trend was detected in many major rivers in China in recent decades, especially in the arid Loess Plateau [3,4,5,6]. Zhang [3] investigated the runoff time series data of 11 catchments in the Loess Plateau and found that all the 11 rivers had a significant negative trend in annual streamflow of 0.13 to 1.58 mm·year−1. Feng [7] applied a transient analysis to discover the time-varying runoff trend and impact factors; the results showed that the average runoff in the Loess Plateau decreased continuously during the period 1961–2009 at an average rate of −0.9 mm·year−1 and three stages of obvious decrease trend in runoff were detected with transitions in 1970, 1981, and 1996. Besides, runoff reduction of 32 hydrological catchments directly resulted in a decline of water yield from 8% during the period of 1980 to 1999 to 5% from 2000–2010 [8]. Many studies focused on Weihe River have also confirmed a sharp decrease of runoff because of extreme climate variations and high-intensive human activities [9,10,11,12]. Ji and Duan [12] aimed at detecting the main driving forces acting on the hydrological cycle of this area among climate changes, land use and land cover change (LUCC), and direct human activities based on SWAT model (Jeff Arnold, Temple, TX, USA) and found that direct human activities were the main cause of streamflow reduction, while precipitation apparently had the major impact on evapotranspiration and soil moisture, and the influence of LUCC on the hydrological variables was the least. Li [11] concluded that the runoff reduction was dominant by climatic variations and direct human activities in different sub-catchments over different periods, which indicated the complexity of runoff variability in this region.
Undoubtedly, climate change and human activities are two main factors inducing the variation of runoff. Climate variability affects runoff mainly through influencing precipitation, temperature, and potential evapotranspiration [13,14]. Precipitation is the fundamental source of runoff and intensity of precipitation will directly determine the quantity of runoff. In contrast, the impact of temperature and potential evapotranspiration on runoff are relatively small and mostly negative [15]. Compared with climate change, the impact of human activity on runoff is more intense and abrupt, including land use/cover change, operation of dams and reservoirs, soil and water conservation projects, and direct water extraction from the river [16,17]. Soil and water conservation projects and land use/cover change influence runoff by changing the character of the land surface, which has a great impact on the generation of surface runoff [18], while the operation of dams and reservoirs mainly regulates the amount and inter-annual distribution of runoff [19]. Over the past five decades, intensive human activity, primarily aimed at alleviating severe top-soil erosion, has shaped the runoff and ecosystem services provided in the Loess Plateau [20]. Numerous studies found that a reduction in river runoff occurred as an outcome of soil conservation, which was not expected [5,21,22,23]. Feng [7] investigated the complexity of human activity in shaping river runoff in the Loess Plateau under a changing climate from 1961–2009 and identified different kinds of human factors (including terrace construction, tree plantation, terrace, and check-dam construction) to induce runoff decline in different periods.
For a long time, how to distinguish and quantify the influence of various factors on runoff variation has always been an important and difficult problem in hydrology research, which is of great significance for regional water resources planning and management [24,25,26]. Many studies have tried various methods including paired catchment approach, empirical statistical methods, physically-based hydrological models, elasticity or sensitivity-based method, and decomposition method [27]. With the time–trend analysis method and sensitivity-based approach, Gao [6] found that, on average, 70% of the streamflow reduction in the Loess Plateau between the 1950s and 2010 resulted from land use changes. Based on the linear regression analysis and Budyko’s curve equation, Zhao [5] concluded that human activities accounted for the majority of the streamflow changes in most of the tributaries in the middle reaches of the Yellow River basin between the 1950s and 2010. To ensure the security of regional water resources, it is necessary to understand the combined impacts of climate change and human activity on runoff, and also to distinguish the roles that these two main influencing factors play in the runoff variations in different periods [26,28]. However, many studies have investigated the impact of climate change on runoff by comparing the runoff of the study period and the control period (also called the baseline period), which may only explain the impact of climate change and human activity on inducing the difference of runoff between two periods, rather than the impact on runoff variation for each period [4,12,29,30]. It is necessary to assess the impact of human activity on runoff in the context of climate change because climate change may cause runoff to increase or decrease, which could act as an intensifying or mitigating role to the human-induced runoff reduction. A hydrological model coupled with scenario simulation and a de-trended method can be used to explore the impact of climate trends on runoff variation. Ji and Duan [12] and Xie [31] employed this method in the Weihe River basin and the Three-North region. However, two studies considered the study period as a whole and failed to investigate variability of the sub-period. Generally, the climate change trend for a long period is relatively small and insignificant but may be dramatic at some stage; a study on the whole period is likely to submerge the sub-period variability and result in a partial conclusion. Only when we clearly quantify the absolute impact and relative contribution of climate change and human activity to runoff variation in each period can we figure out the real reason for runoff reduction and then correctly evaluate past human water management and serve for the rational development and utilization of water resources in the future. This is precisely what is insufficient in this field of research. Therefore, we conducted a detailed analysis on the runoff variability and effects of climate variability and human activity on decadal runoff variation in the Weihe River basin, which is quite essential.
In this study, we employed the variable infiltration capacity (VIC) model with the scenario simulation analysis method, as well as some other statistical analysis methods to investigate the reduction in runoff of Weihe River. The specific objectives of this study are to (1) clarify the spatio-temporal variability climate and land use/cover; (2) detect the variation and trend of runoff over time; (3) identify the driving effects of the meteorological variables on runoff; (4) quantify the relative contribution of human activity and climate change to runoff variation for each period during 1961 to 2016. This study gives a more clear and comprehensive understanding of the reduction of runoff, and the impact of climate change and human activity in the Weihe River basin and three sub-regions over time, which is expected to provide a further basis for the management strategy design of water and land use/cover with respect to climate change, to ensure the security of water resources.
2. Study Area and Datasets
2.1. Study Area
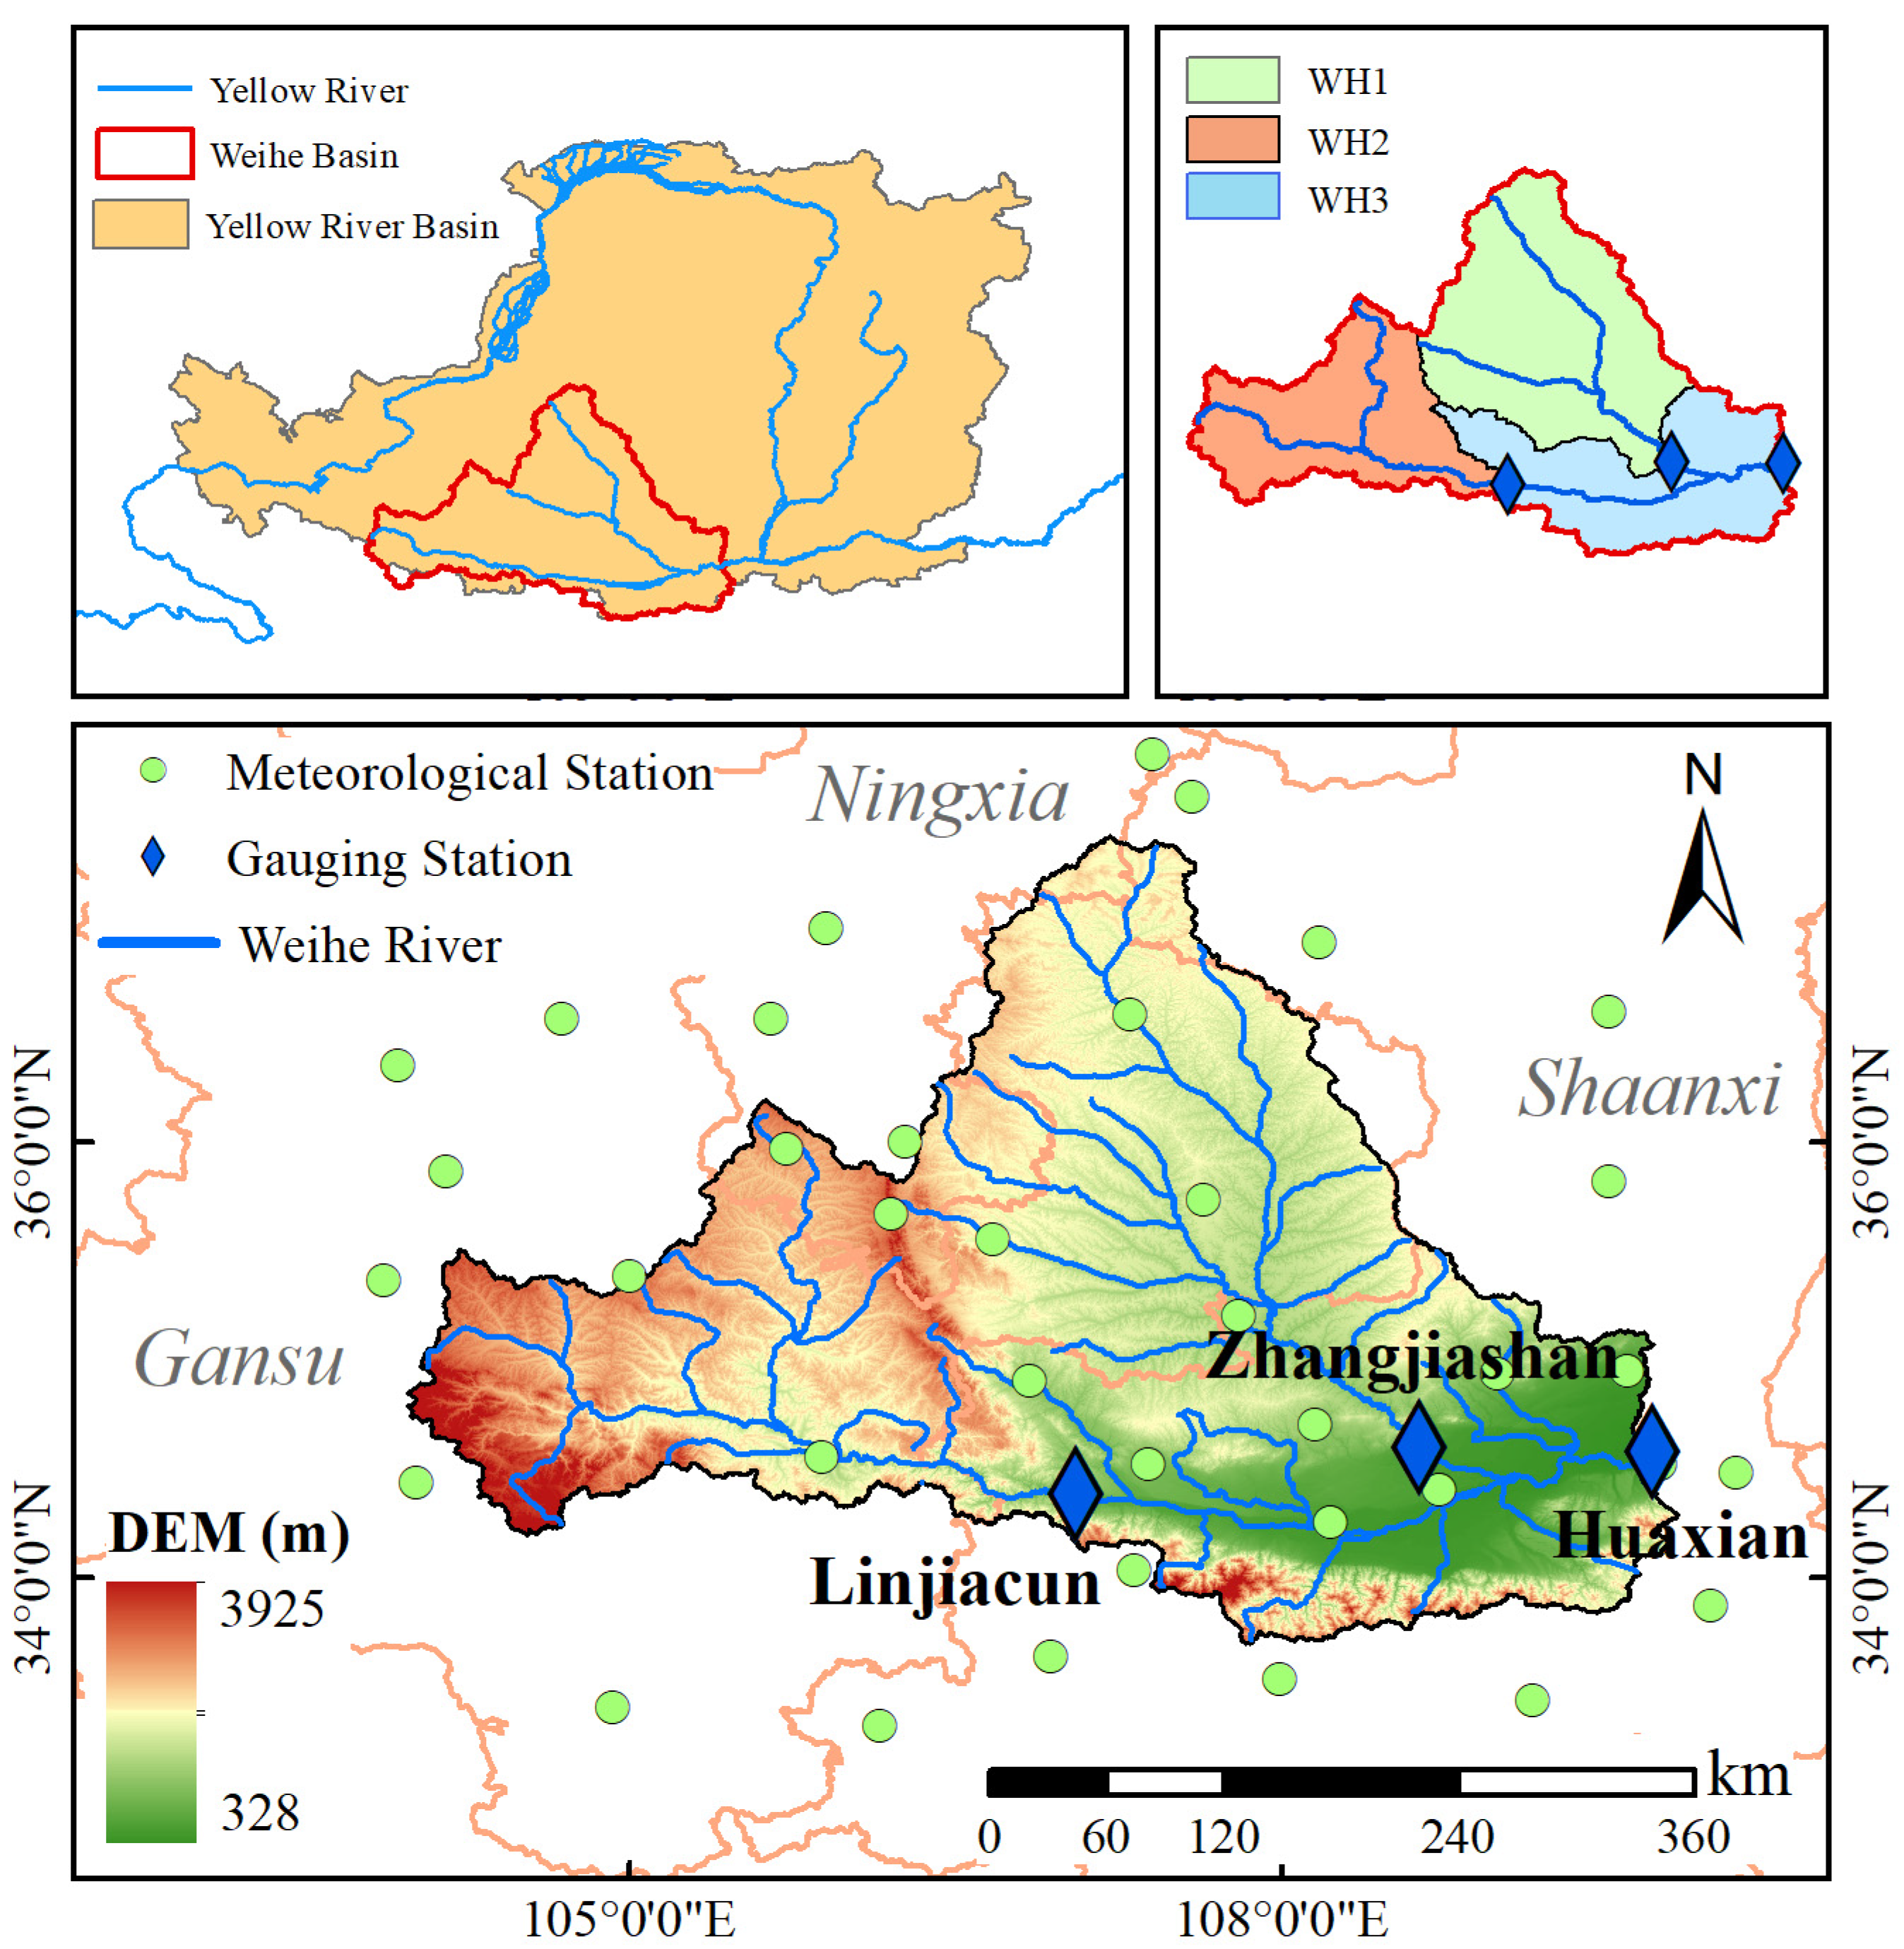
Weihe River (WHR), located in the south of the Loess Plateau, is the largest tributary of the Yellow River. It rises in the Niaoshu hill, flows through 26 counties and cities of Gansu, Ningxia, and Shaanxi provinces, and joins the Yellow River at Tongguan. The Huaxian station is an important hydrological station, which monitors the flow from 106,498 km2 of the catchment (WH), about 81% of the total Weihe River basin. In this study, this region is selected as the study area and divided into three sub-basins by three gauging stations, i.e., WH1 (Zhangjiashan), WH2 (Linjiacun), and WH3 (Huaxian) (Figure 1, Table 1), which covers about 43,216, 30,661, 32,621 km2, respectively. Mean annual runoff is approximately 6.35 ± 3.28 billion m3 with a mean annual precipitation of 536.00 ± 88.02 mm and a mean annual temperature of 9.29 ± 0.62 °C. The Weihe River basin, a key economic development zone and an important agricultural production area, has been subjected to significant human interference and is more sensitive to global warming, due to the coexistence of semiarid and semi-humid climatic conditions and has experienced a significant decrease of runoff in the past 50 years [9,10,11,12].
2.2. Datasets
2.2.1. Meteorological Data and Runoff
Daily meteorological data of 31 stations within or around WH, obtained from China Meteorological Administration (CMA), which consisted of seven variables: precipitation, maximum and minimum temperature, wind speed, relative humidity, evapotranspiration and sunshine duration for the period 1960–2016, were used to run the VIC model and calculate the potential evapotranspiration in this study. These data were interpolated into a gridded database with a resolution of 0.125° used the method mentioned in Yang [32], which was widely proved to be reliable and used to generate meteorological forcing database for the VIC model [15,33]. In addition, a trend-removed meteorological forcing data was generated based on the interpolated dataset, following the method mentioned in previous studies [31,34]. It should be noted that the detrended method was not implemented for the whole study period of 1961–2016, but for each period of one decade, i.e., the 1960s, 1970s, 1980s, 1990s, 2000s, and 2010s, which aimed to quantify the impact of each period. The observed runoff data of Zhangjiashan, Linjiacun, and Huaxian hydrological stations from 1961 to 2016 were obtained from the Water Resources Committee of the Yellow River Conservancy Commission.
2.2.2. Land Surface Characteristics
Several datasets were employed as characterization of the land surface. The soil parameters were derived from the China Soil Map Based Harmonized World Soil Database (v1.1), provided by the Cold and Arid Regions Sciences Data Center at Lanzhou. The dominant soil type was used for each grid cell and the soil parameters that were not available from the soil dataset were calculated according to the methods by Saxton and Rawls [35].
Vegetation parameters were derived from the University of Maryland land cover data developed from Advanced Very High Resolution Radiometer (AVHRR). The land cover data have 14 different land cover classes, and 11 classes of them are vegetation. The proportion of various vegetation types in each grid were calculated separately. If the proportion was found to be less than 1%, this kind of vegetation was ignored.
The 15-day Normalized Difference Vegetation Index (NDVI) and Leaf Area Index (LAI) with a 1/12° latitude-longitude resolution, which was generated by Global Inventory Modeling and Mapping Studies (GIMMS), were employed to describe varied plant structure and growth conditions during 1982–2015 [36,37]. Besides, five land use/cover maps for the 1970s, 1980s, 1990s, 2000s, and 2010s, obtained from the Data Center for Resources and Environmental Sciences, Chinese Academy of Sciences (RESDC), were employed to analyze the land use/cover changes between every two adjacent decades in the past 50 years.
The SRTM90m (Shuttle Radar Topography Mission) DEM (Digital Elevation Model) dataset was used to extract each catchment and delineate river networks, which were necessary for runoff routing. After being resampled to a resolution of 0.125°, the DEM was also used for adjusting the temperature interpolation and calculating the elevation of each grid as input data of the VIC model.
3. Methodology
3.1. Variable Infiltration Capacity (VIC) Model
In this study, the VIC model [38,39,40] was employed to simulate the hydrologic processes of WHR. The VIC model is a physically-based macroscale hydrologic model, which has been applied in many basins all over the world [31,41,42]. As a semi-distributed hydrological model, it can resolve the complete water and energy balance of multiple land cover classes within each computational grid cell using a mosaic-type vegetation scheme. In this study, the study area (WH) was divided into 677 grid cells with a spatial resolution of 0.125° × 0.125°. The representation is relatively detailed, including multiple evaporations and transpiration pathways, snow accumulation and melt, and soil freeze/thaw in three soil layers, and 10 thermal nodes, with a thermal damping depth of 4 m, with the finite difference solution technique. ET and runoff are simulated for each type of land cover separately, and a weighted average, using the fractions of vegetation types, is calculated, to obtain grid–cell average ET and runoff. A separate routing model (RVIC) was coupled with the VIC model to simulate streamflow, where the runoff generated in each grid cell is routed to selected points through the channel network [43].
There were six parameters of the VIC model that were difficult to determine and thus require calibration, namely the variable infiltration curve parameter (), the maximum velocity of base flow (), the fraction of where non-linear base flow begins (), the fraction of maximum soil moisture where non-linear baseflow occurs (), and the thickness of two soil moisture layers (, ). The VIC model was calibrated by adjusting the six parameters individually to optimize the objective function, which compared the simulated and observed streamflow. We set 1960 to 1961 as the warm-up period, 1962 to 1969 as the calibration period, and 1970 to 1976 as the validation period for each catchment. The Nash–Sutcliffe coefficient () and relative bias (Bias) were employed as the optimal functions for the model calibration and validation:
where and are the simulated and observed streamflow series (m3/s), and and are the respective mean values.
3.2. Runoff Variability Detection Analysis
3.2.1. The Partial Correlation Method
The partial correlation method was used to isolate the impact of two climatic changes (i.e., precipitation (PRE) and potential evapotranspiration (PET)). The need to diagnose the correlation between two signals while eliminating the influence of other signals in a complex system has led to the partial correlation method being used in fields containing a large number of interactions, such as ecology and climatology [44,45,46]. The partial correlation coefficient was calculated as:
where , and are correlation coefficients between two variables, and was the partial correlation coefficient between variable and , with the effect of variable removed. When exploring the responses of annual runoff variations, partial correlation analysis of runoff and two meteorological variables provided the correlation between fluctuations in runoff and that in each of the variables influencing runoff, while controlling other factors.
3.2.2. Time-Varying Analysis with Moving Time Window Method
Aside from a general analysis of the entire study period, a time-varying analysis was conducted with a moving time window of nine years in the analysis of trend and partial correlation to detect the time-varying variability and relationship. A nine-year moving window was selected to ensure the detection of the change of runoff caused by the climate change and to avoid the few degrees of freedom caused by data overlapping in neighboring time windows [7].
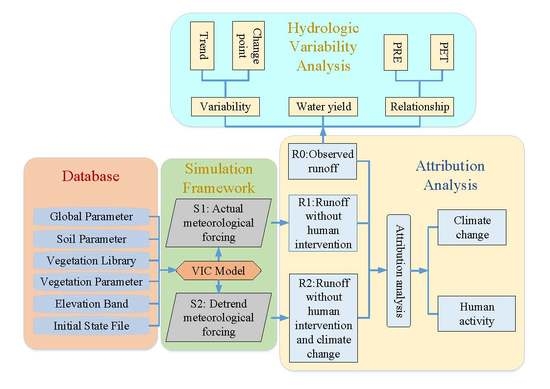
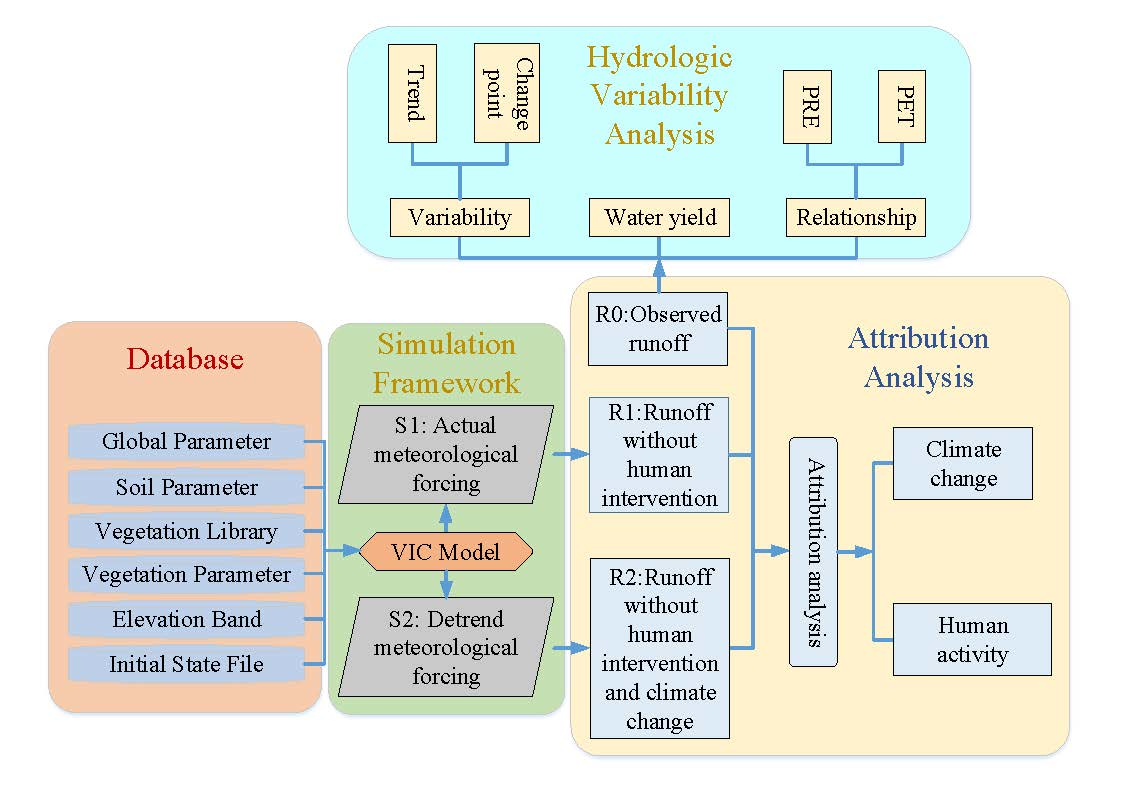
3.3. Runoff Variation Attribution Method
By building a suitable hydrological simulation framework, this study can reproduce historical hydrological processes without land use/cover change and climate change, and further analyze the impacts of climate change and human activity on decadal runoff. Scenario simulation and analysis was employed to attribute the variation of runoff to climate change and human activity. Three scenarios of runoff series were acquired, as shown in Table 2. The first was the observed runoff, which was the actual runoff influenced by climate change and human activity. The second was the simulated runoff forced by actual meteorological conditions, which was regarded as the runoff with the single impact of climate change, i.e., natural runoff. The third was the simulated runoff forced by detrended meteorological forcing, which was the runoff without the impact of climate change and human activity.
The method used to quantify the contributions of climate change and human activity on the runoff [15,19] is described below:
(1) Calculating the variation of runoff induced by climate change and human activity over different periods:
(2) Quantification of the relative contribution of climate change and human activity on the runoff variation over different periods:
where , , and are the mean value of runoff under scenarios S0, S1, and S2 for the period (i.e., the 1970s, 1980s, 1990s, 2000s, 2010s), respectively. , and are the variations of runoff induced by climate change, human activity, and the co-effect for the period . A positive value represents an increase of runoff, while a negative value represents a decline. And and were the relative contribution of climate change and human activity on the runoff variation for the period .
4. Results
4.1. Performance of the VIC Model
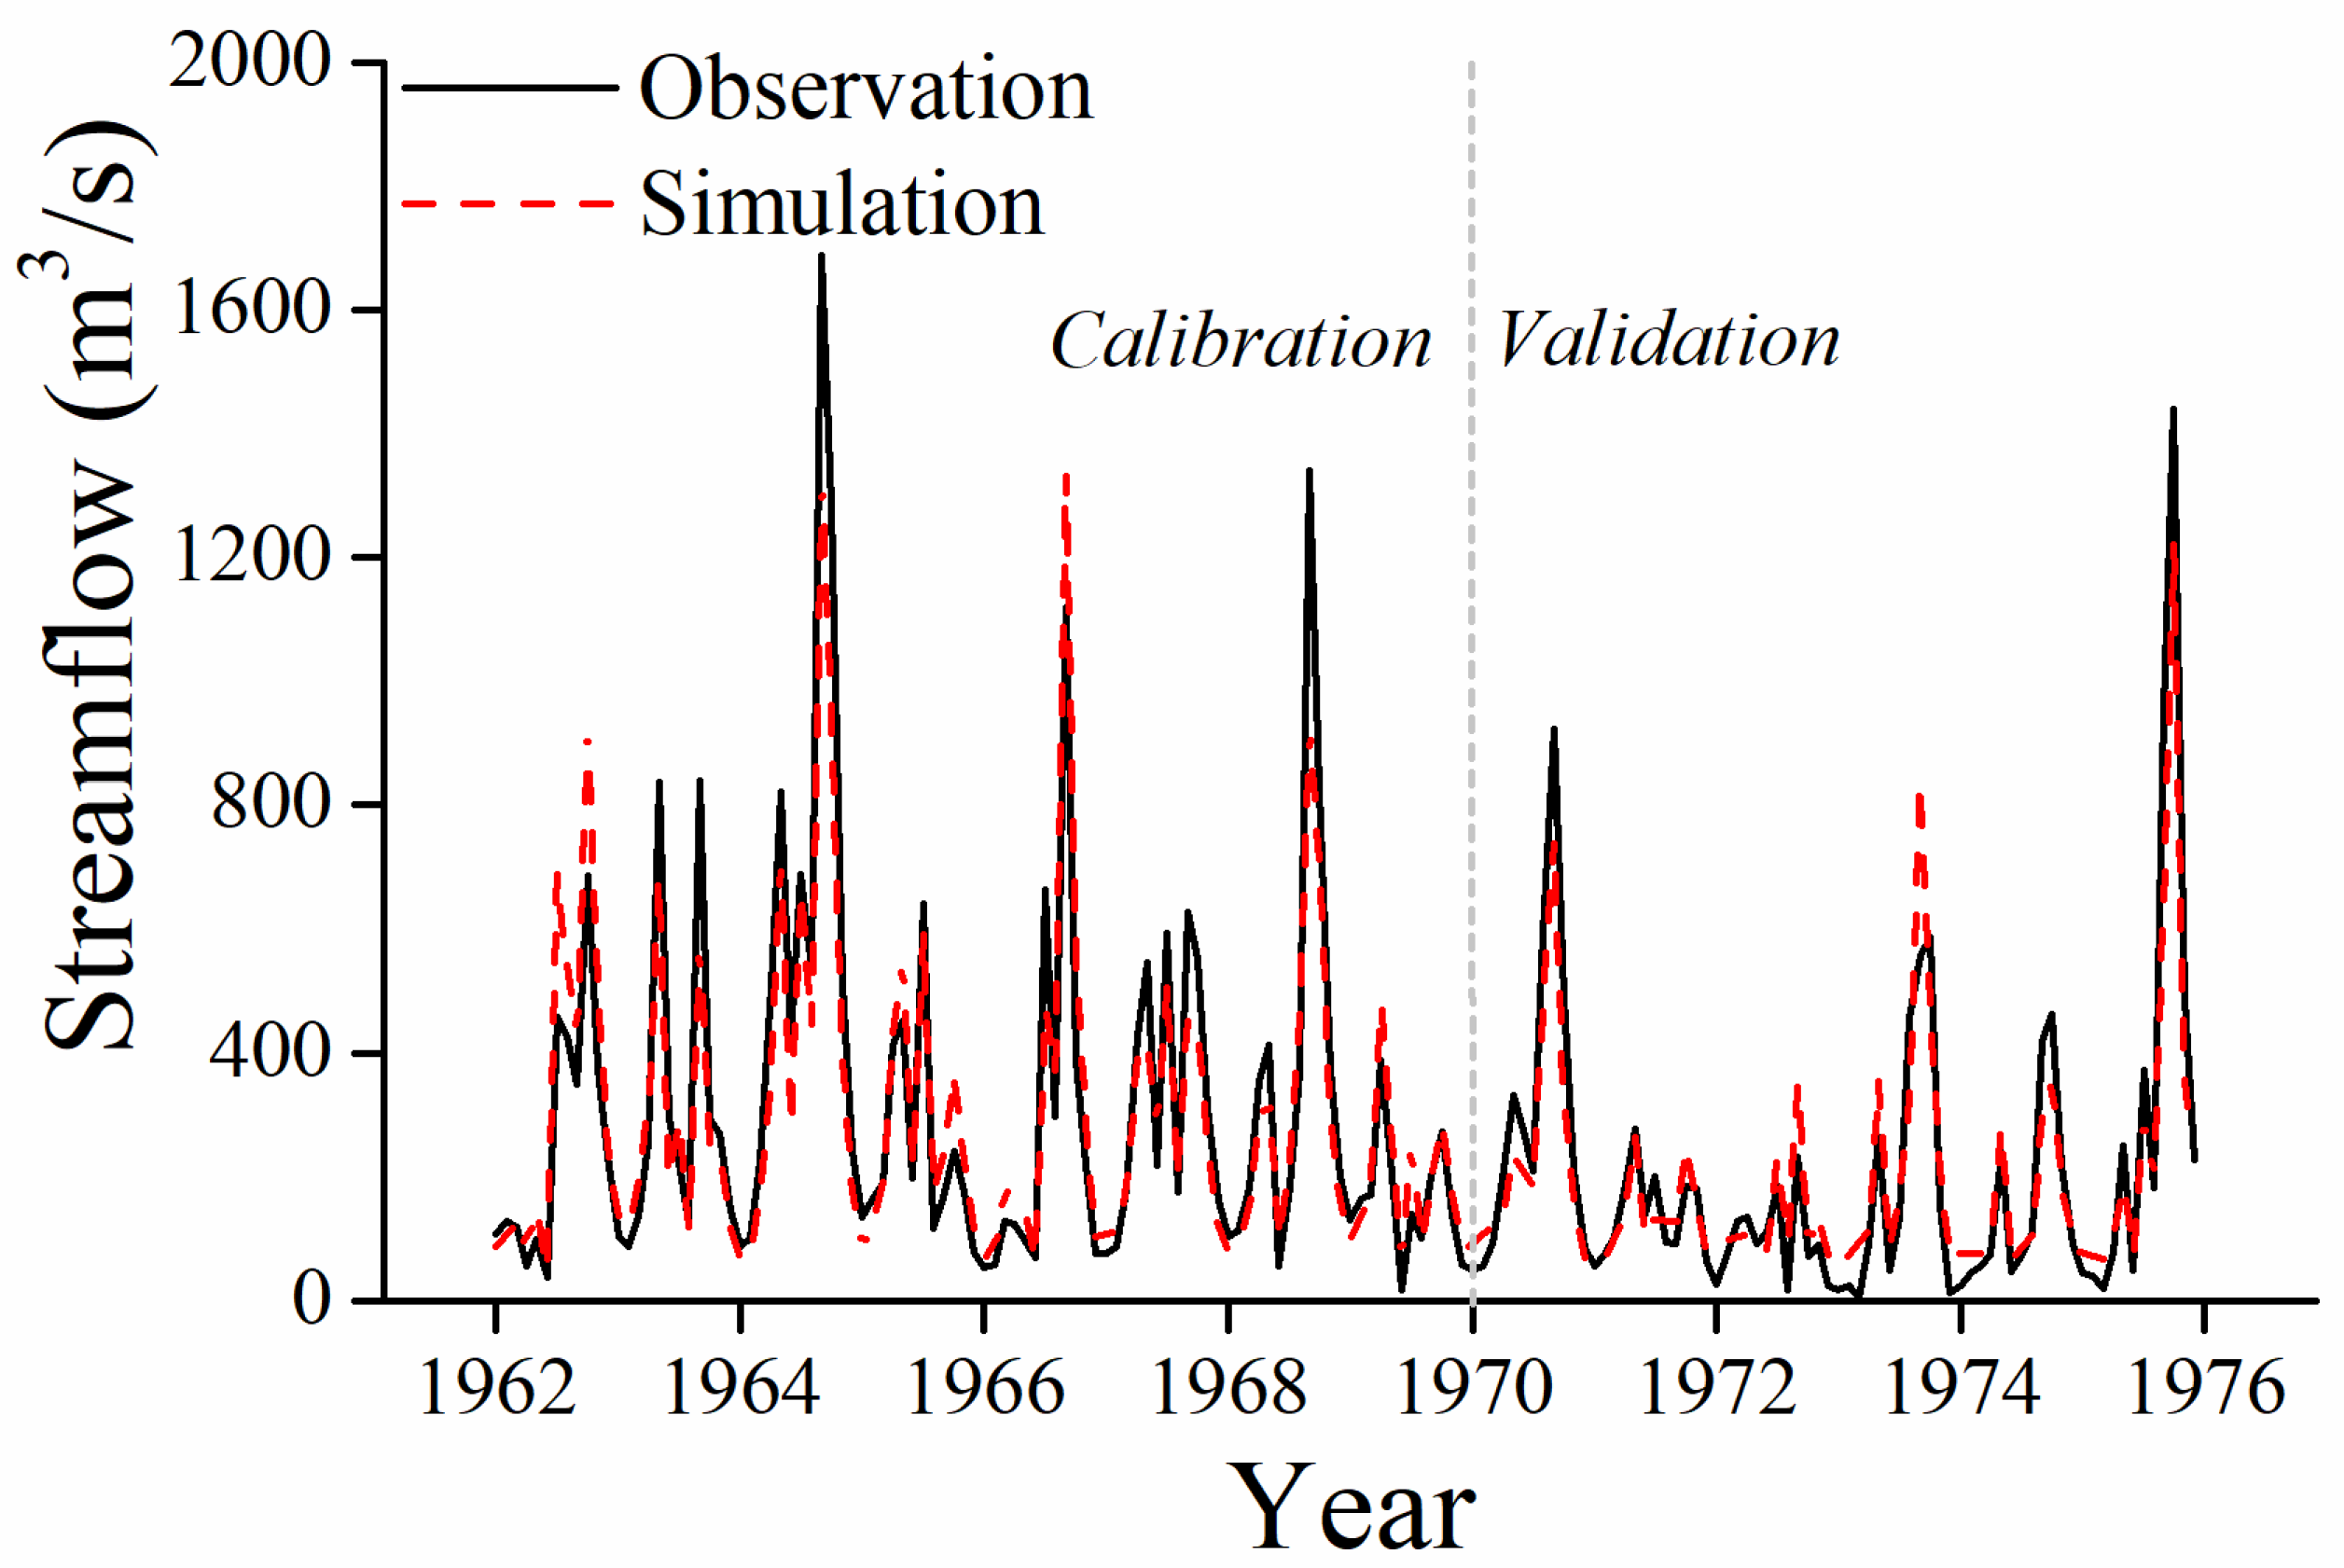
The VIC model was calibrated with the monthly observed streamflow series of Huaxian during 1962–1970, when it was considered to be less disturbed by human activity based on the Pettitt test and partial correlation analysis with meteorological variables. The calibration was conducted using the runoff data of three gauging stations separately. It is important to note that the calibrated parameters of WH1 and WH2 (i.e., the two hydrographic stations upstream, Zhangjiashan and Linjiacun) were used in calibration at Huanxian station to calibrate the parameters of WH3. The result showed that the NSE value and Bias value for calibration of WH1 and WH2 WH3 were 0.79, 0.85, and 6.47%, 11.25% respectively. The NSE value and Bias value was 0.87, 0.82, and −8.69%, 10.95% for the calibration and validation periods of WH, indicating that the calibrated model had a good performance and can effectively reproduce the dynamic variation of runoff (Figure 2). The variation trends in the simulated and observed streamflow values were overall consistent, though the simulated date was higher than that observed in low streamflow months, especially after 1970, which may be caused by direct human activity. In general, the calibrated model was applicable and reliable for the WHR.
4.2. Climate Change over the Weihe River Basin
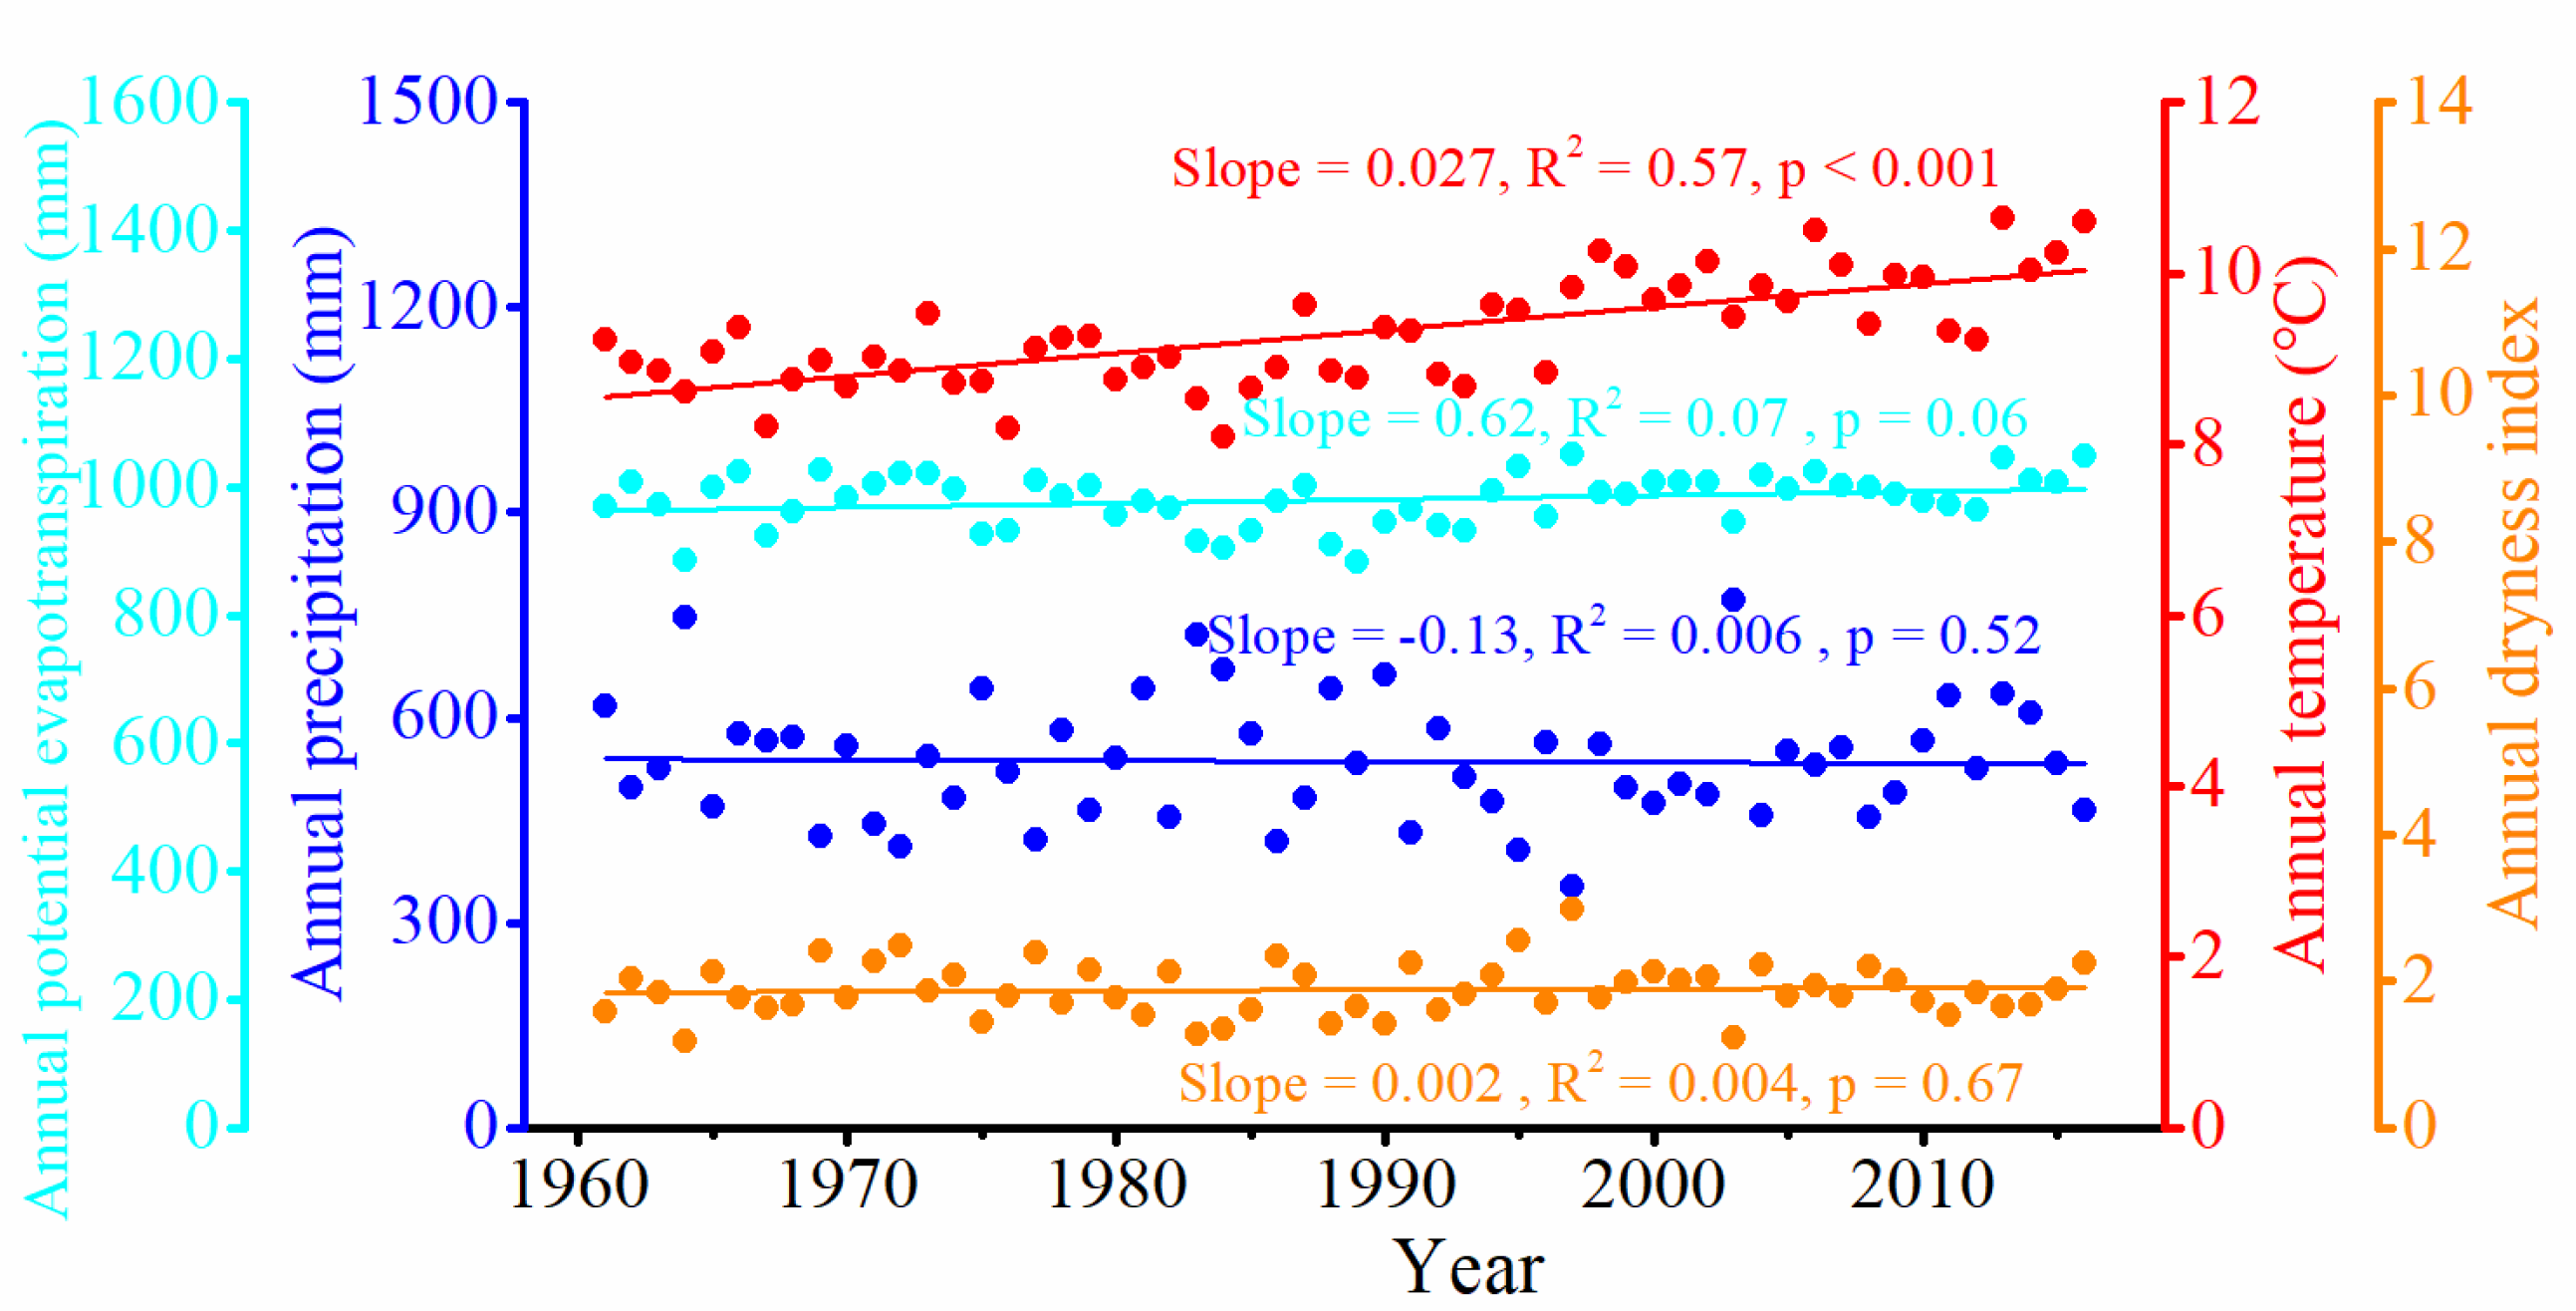
Four meteorological variables (i.e., precipitation (PRE), temperature (TEM), potential evapotranspiration (PET), and dryness index (DRY)) were investigated in this study. The regional mean of the meteorological variable was calculated at the inter-annual scale (Figure 3). During the period of 1961–2016, annual mean temperature of WH increased significantly at a rate of 0.027 °C·year−1 () and the potential evapotranspiration increased at a rate of 0.62 mm·year−1 (), while the precipitation showed a slight decrease trend (−0.13 mm·year−1, ). The dryness index (PET/PRE) ranged from 1.19–2.95 with a slight increase trend (0.002 year−1, ). The variability of meteorological variables varied over the different periods (both in trend and variation) and there were also obvious differences among the three sub-regions. As shown in Table S1, precipitation of WH showed a decreasing trend at a rate of −5.28, −9.73, −2.91, and −14.89 mm·year−1 during the 1980s–2010s, while an increasing trend (1.8 mm year−1) was seen in the 1970s. The temperature was detected with varying degrees of increasing trend during all periods, especially the 1990s (0.11 °C·year−1, 0.5 °C) and 2010s (0.17 °C·year−1, 0.52 °C). The precipitation and temperature of the three sub-regions showed similar trends with WH, but with varying degrees, except precipitation of WH3, which exhibited a decline (−28.36 mm) in the 1970s and an increase (35.11 mm) in the 2000s.
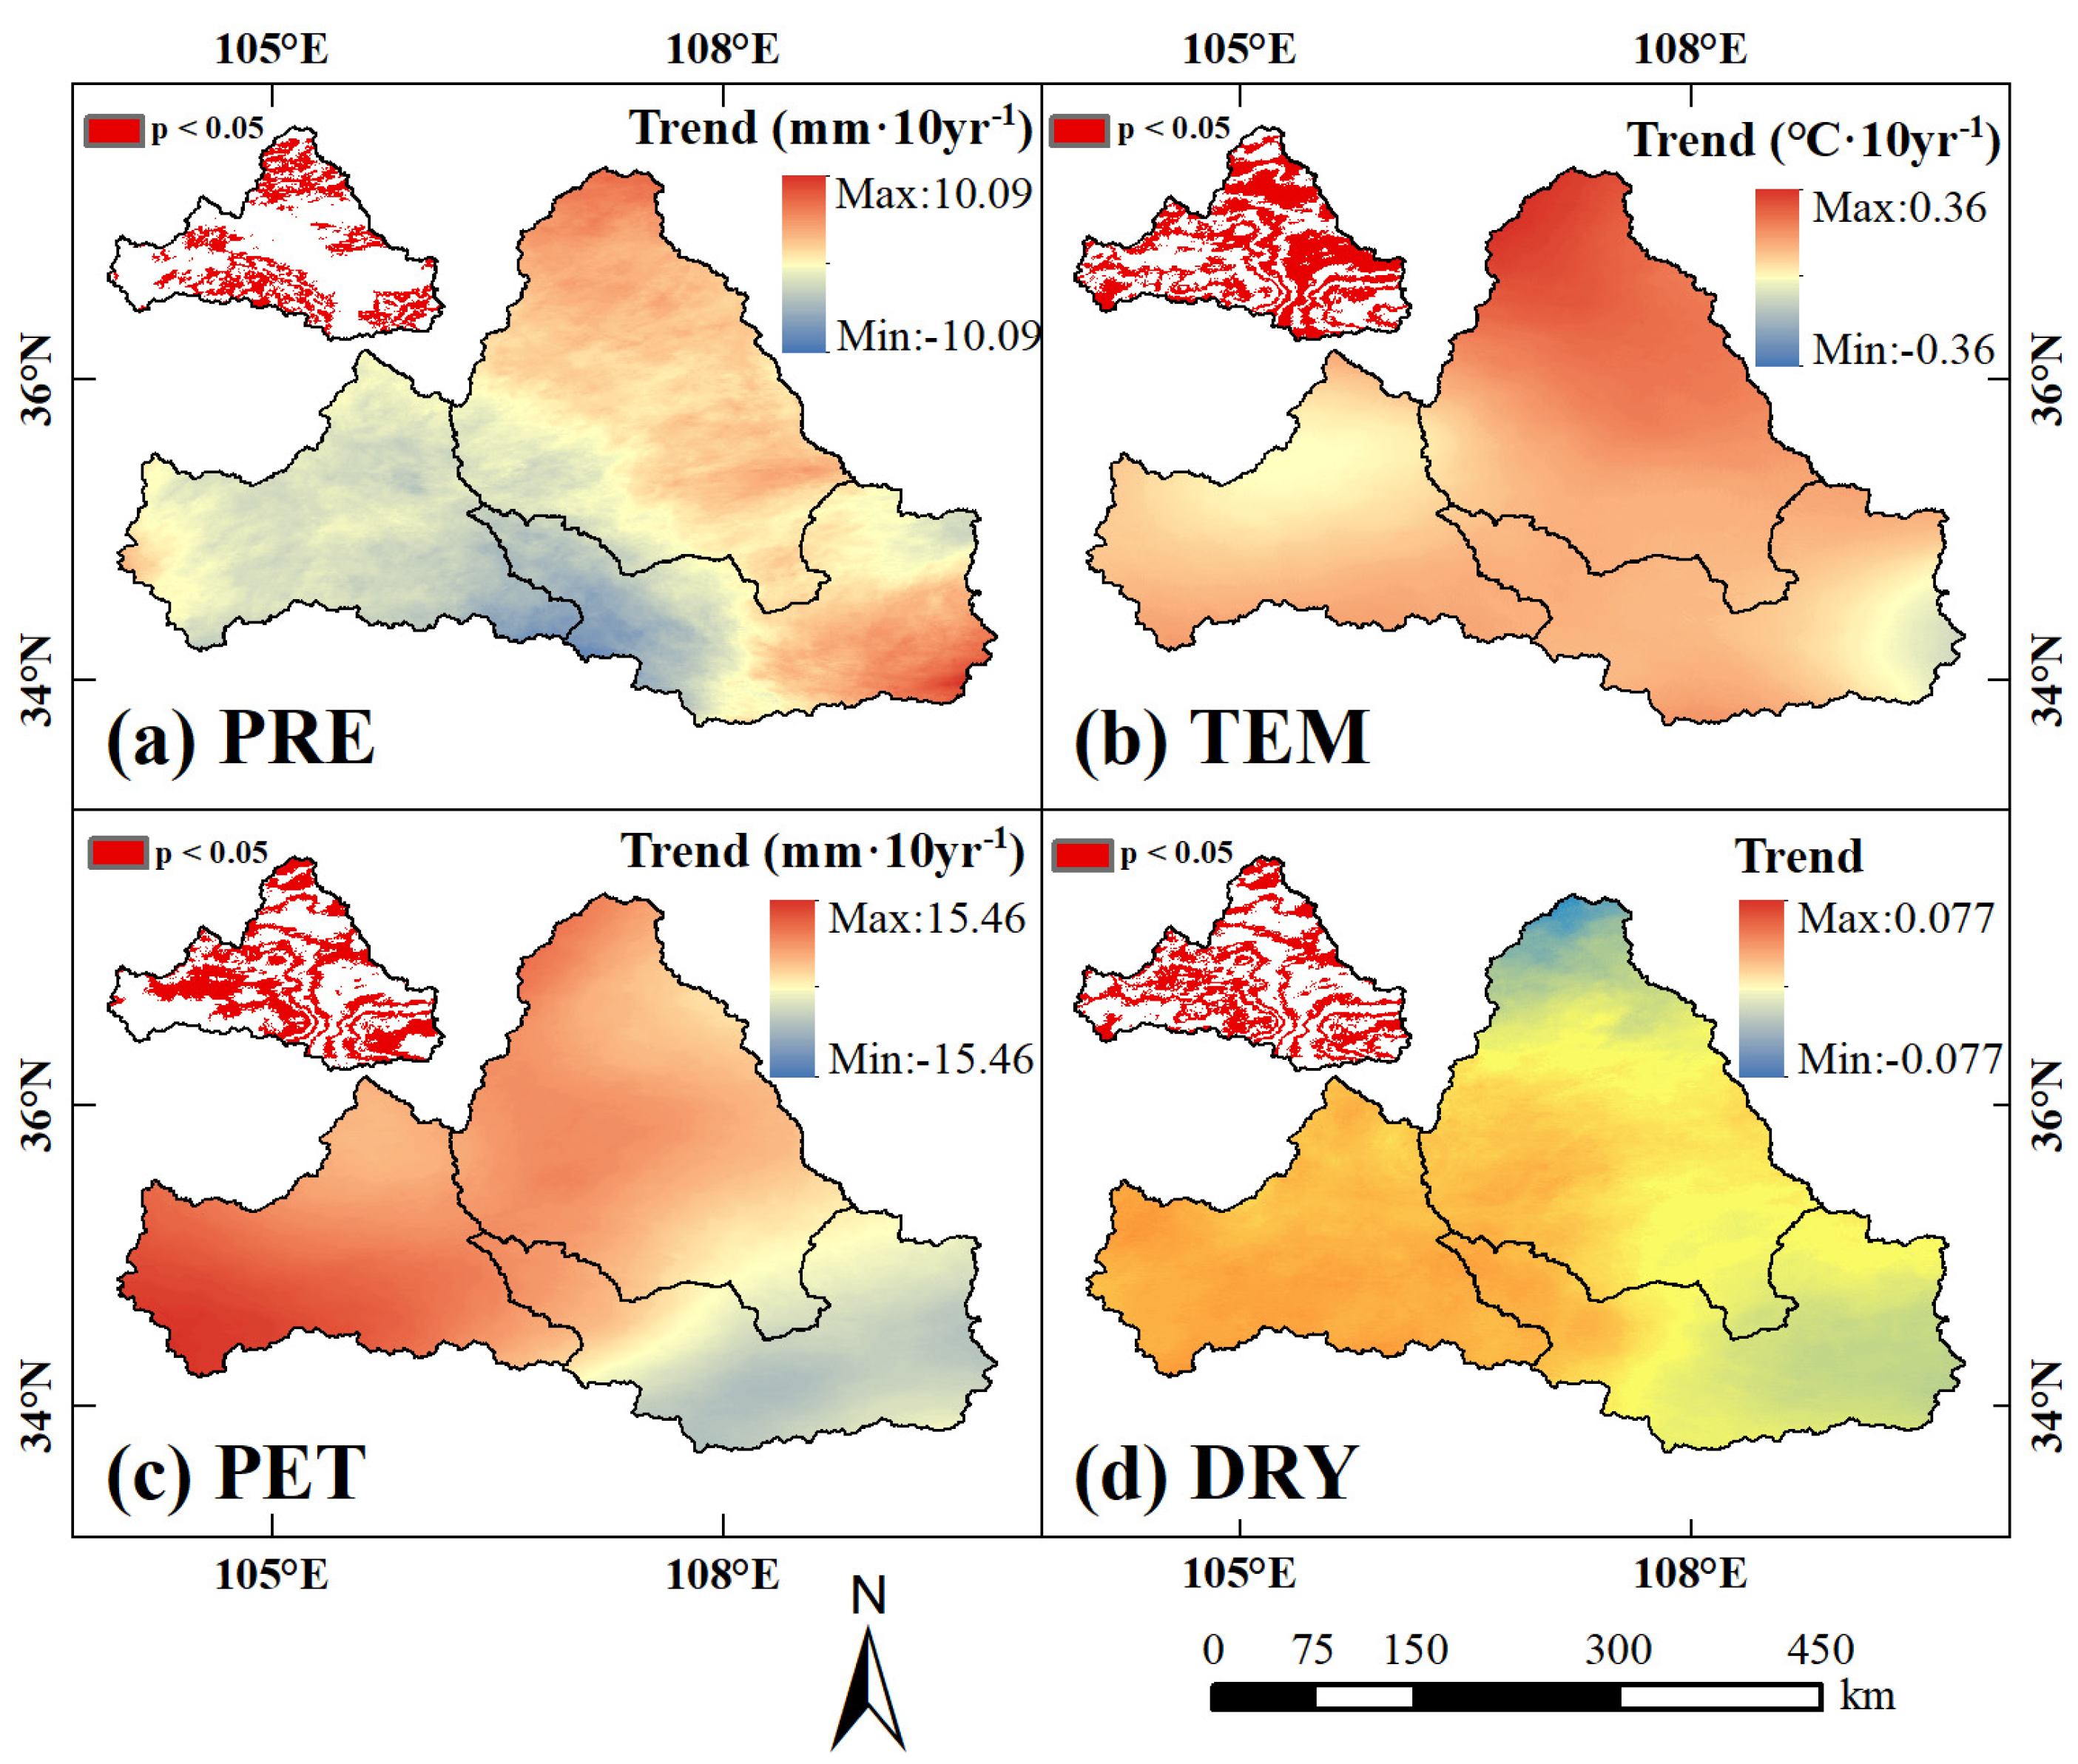
The spatial distribution of the multi-year average value and trend were shown in Figure S1 and Figure 4. Precipitation and temperature decreased from southeast to northwest, and the precipitation showed an increasing trend in southeast and north of WH, but a decreasing trend in the southern region, while a significant increasing trend was detected in most of the WH, especially the northern region. Except for the southeast region with a slight downward trend, most of the other regions showed an obvious increasing trend in potential evapotranspiration. The dryness index showed a relatively stable trend and only a small part of the north and southeast was founded to decrease.
4.3. Vegetation Change over the Weihe River Basin
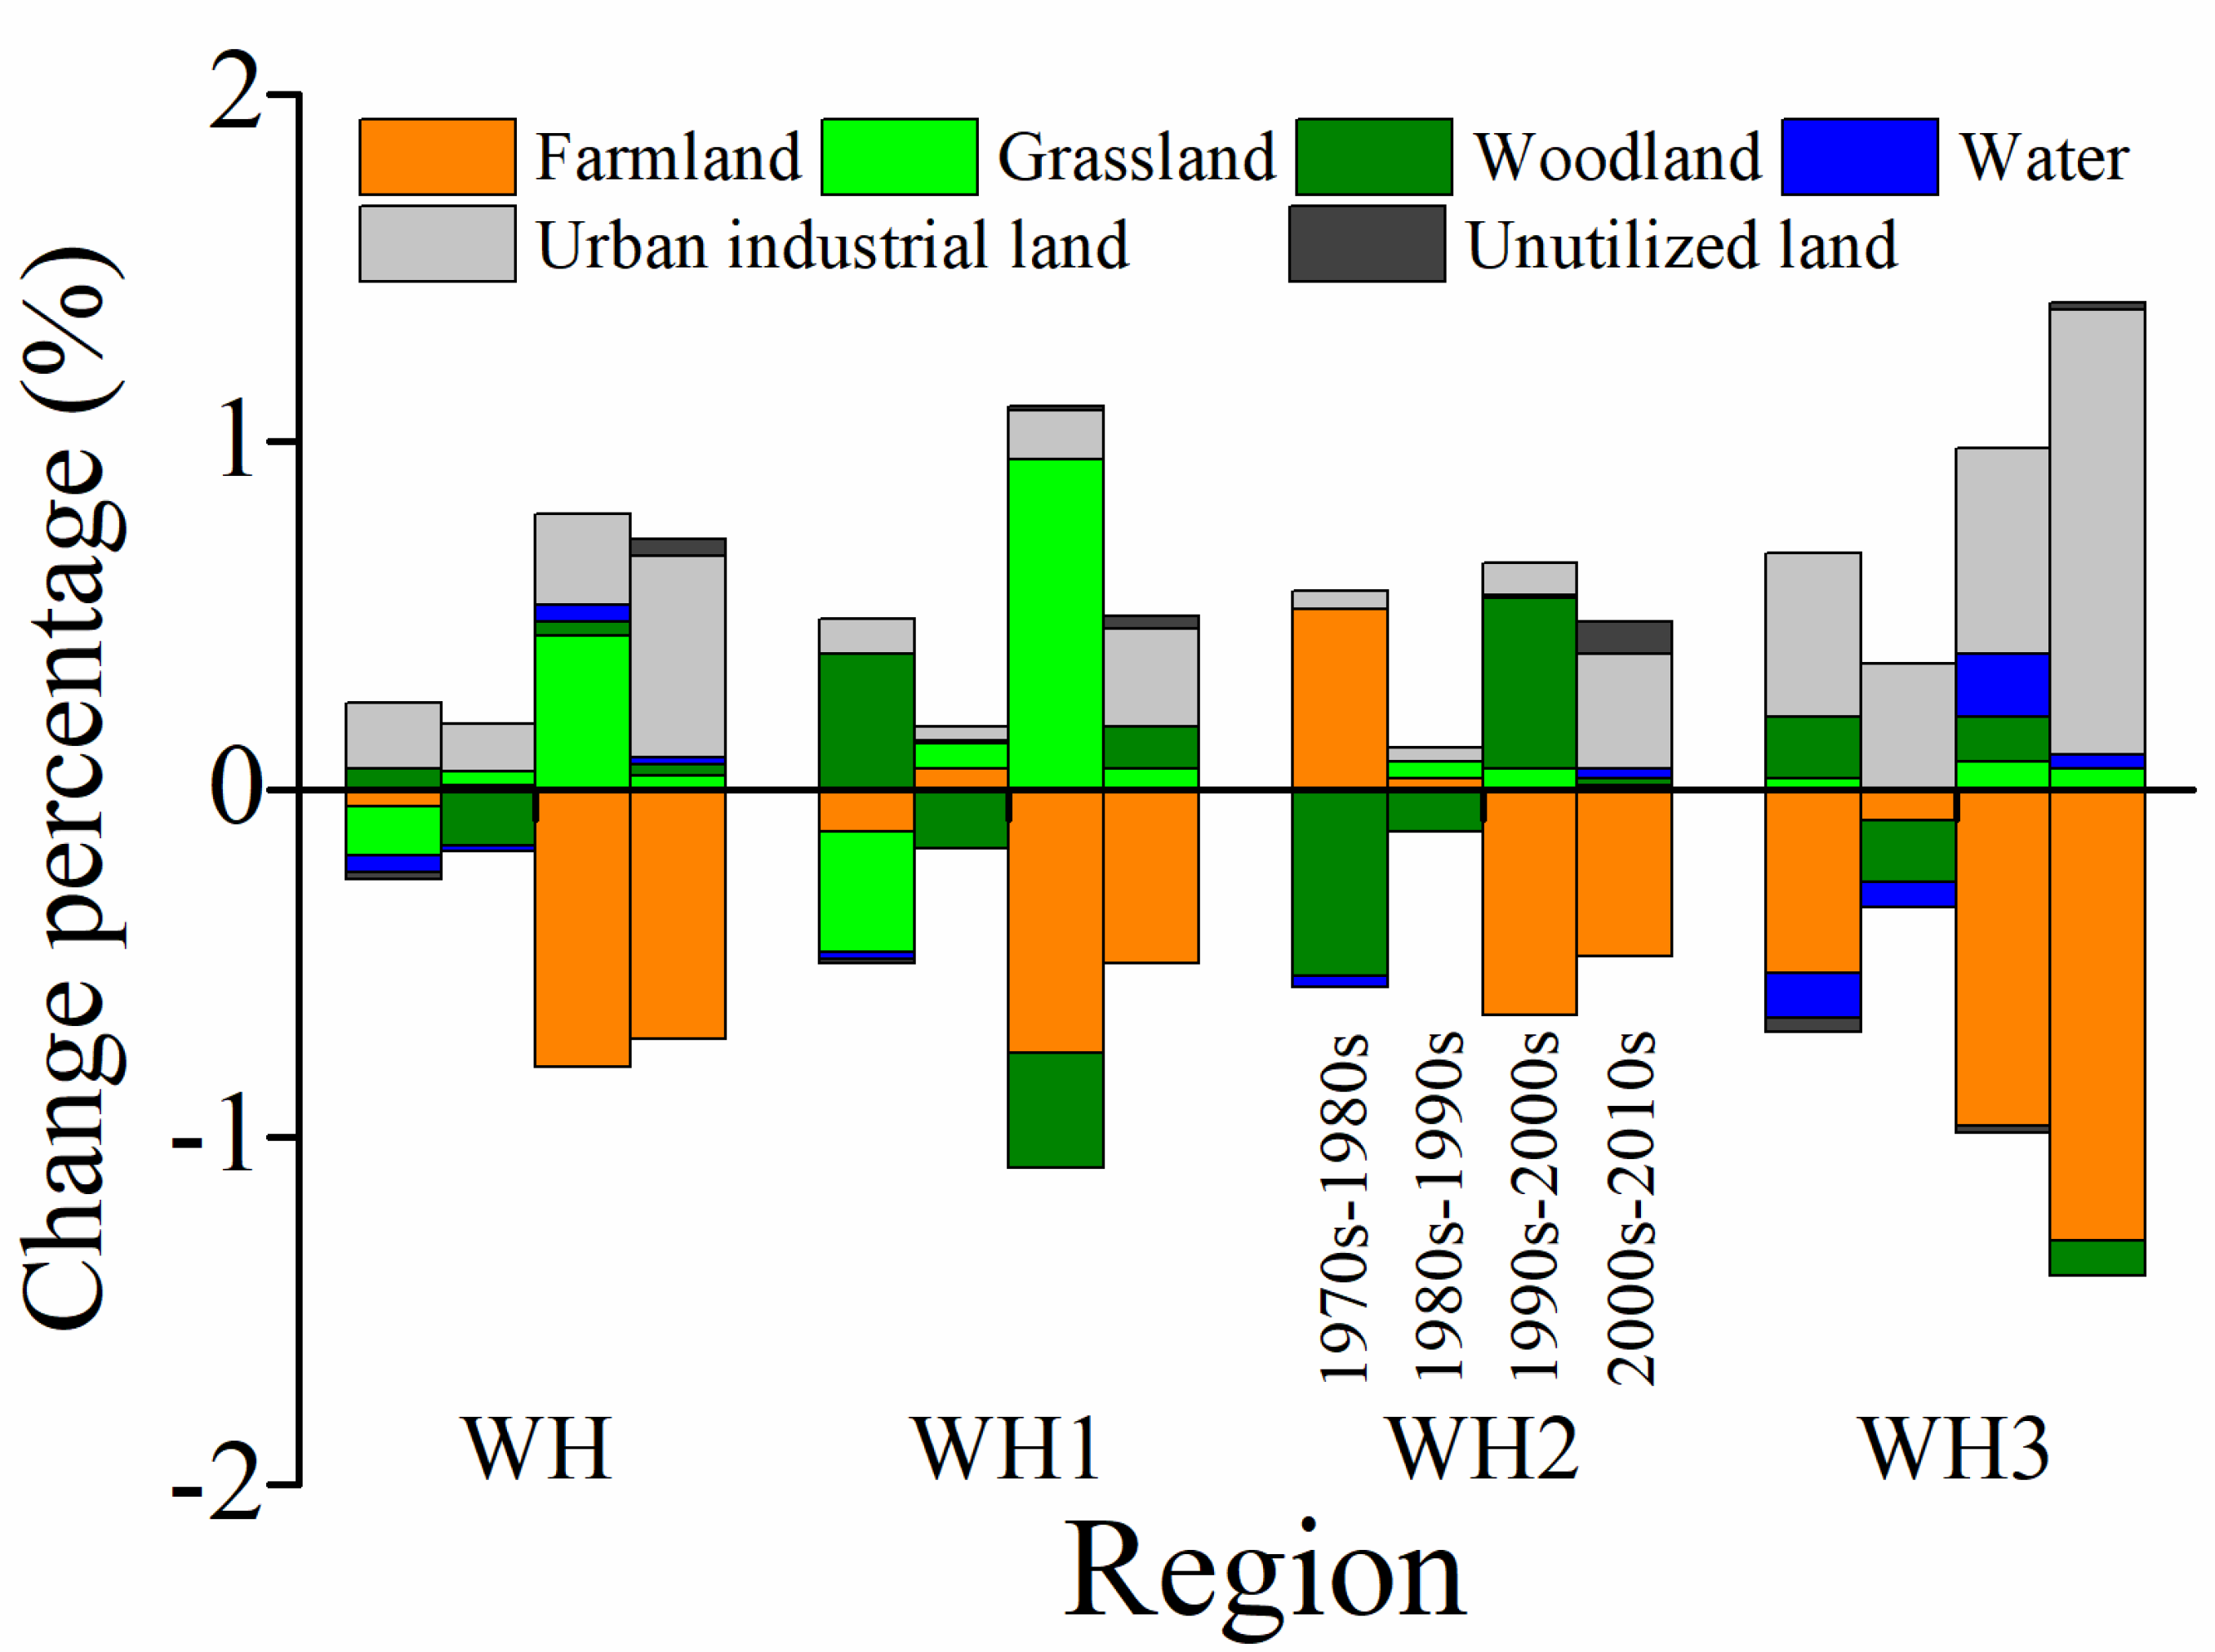
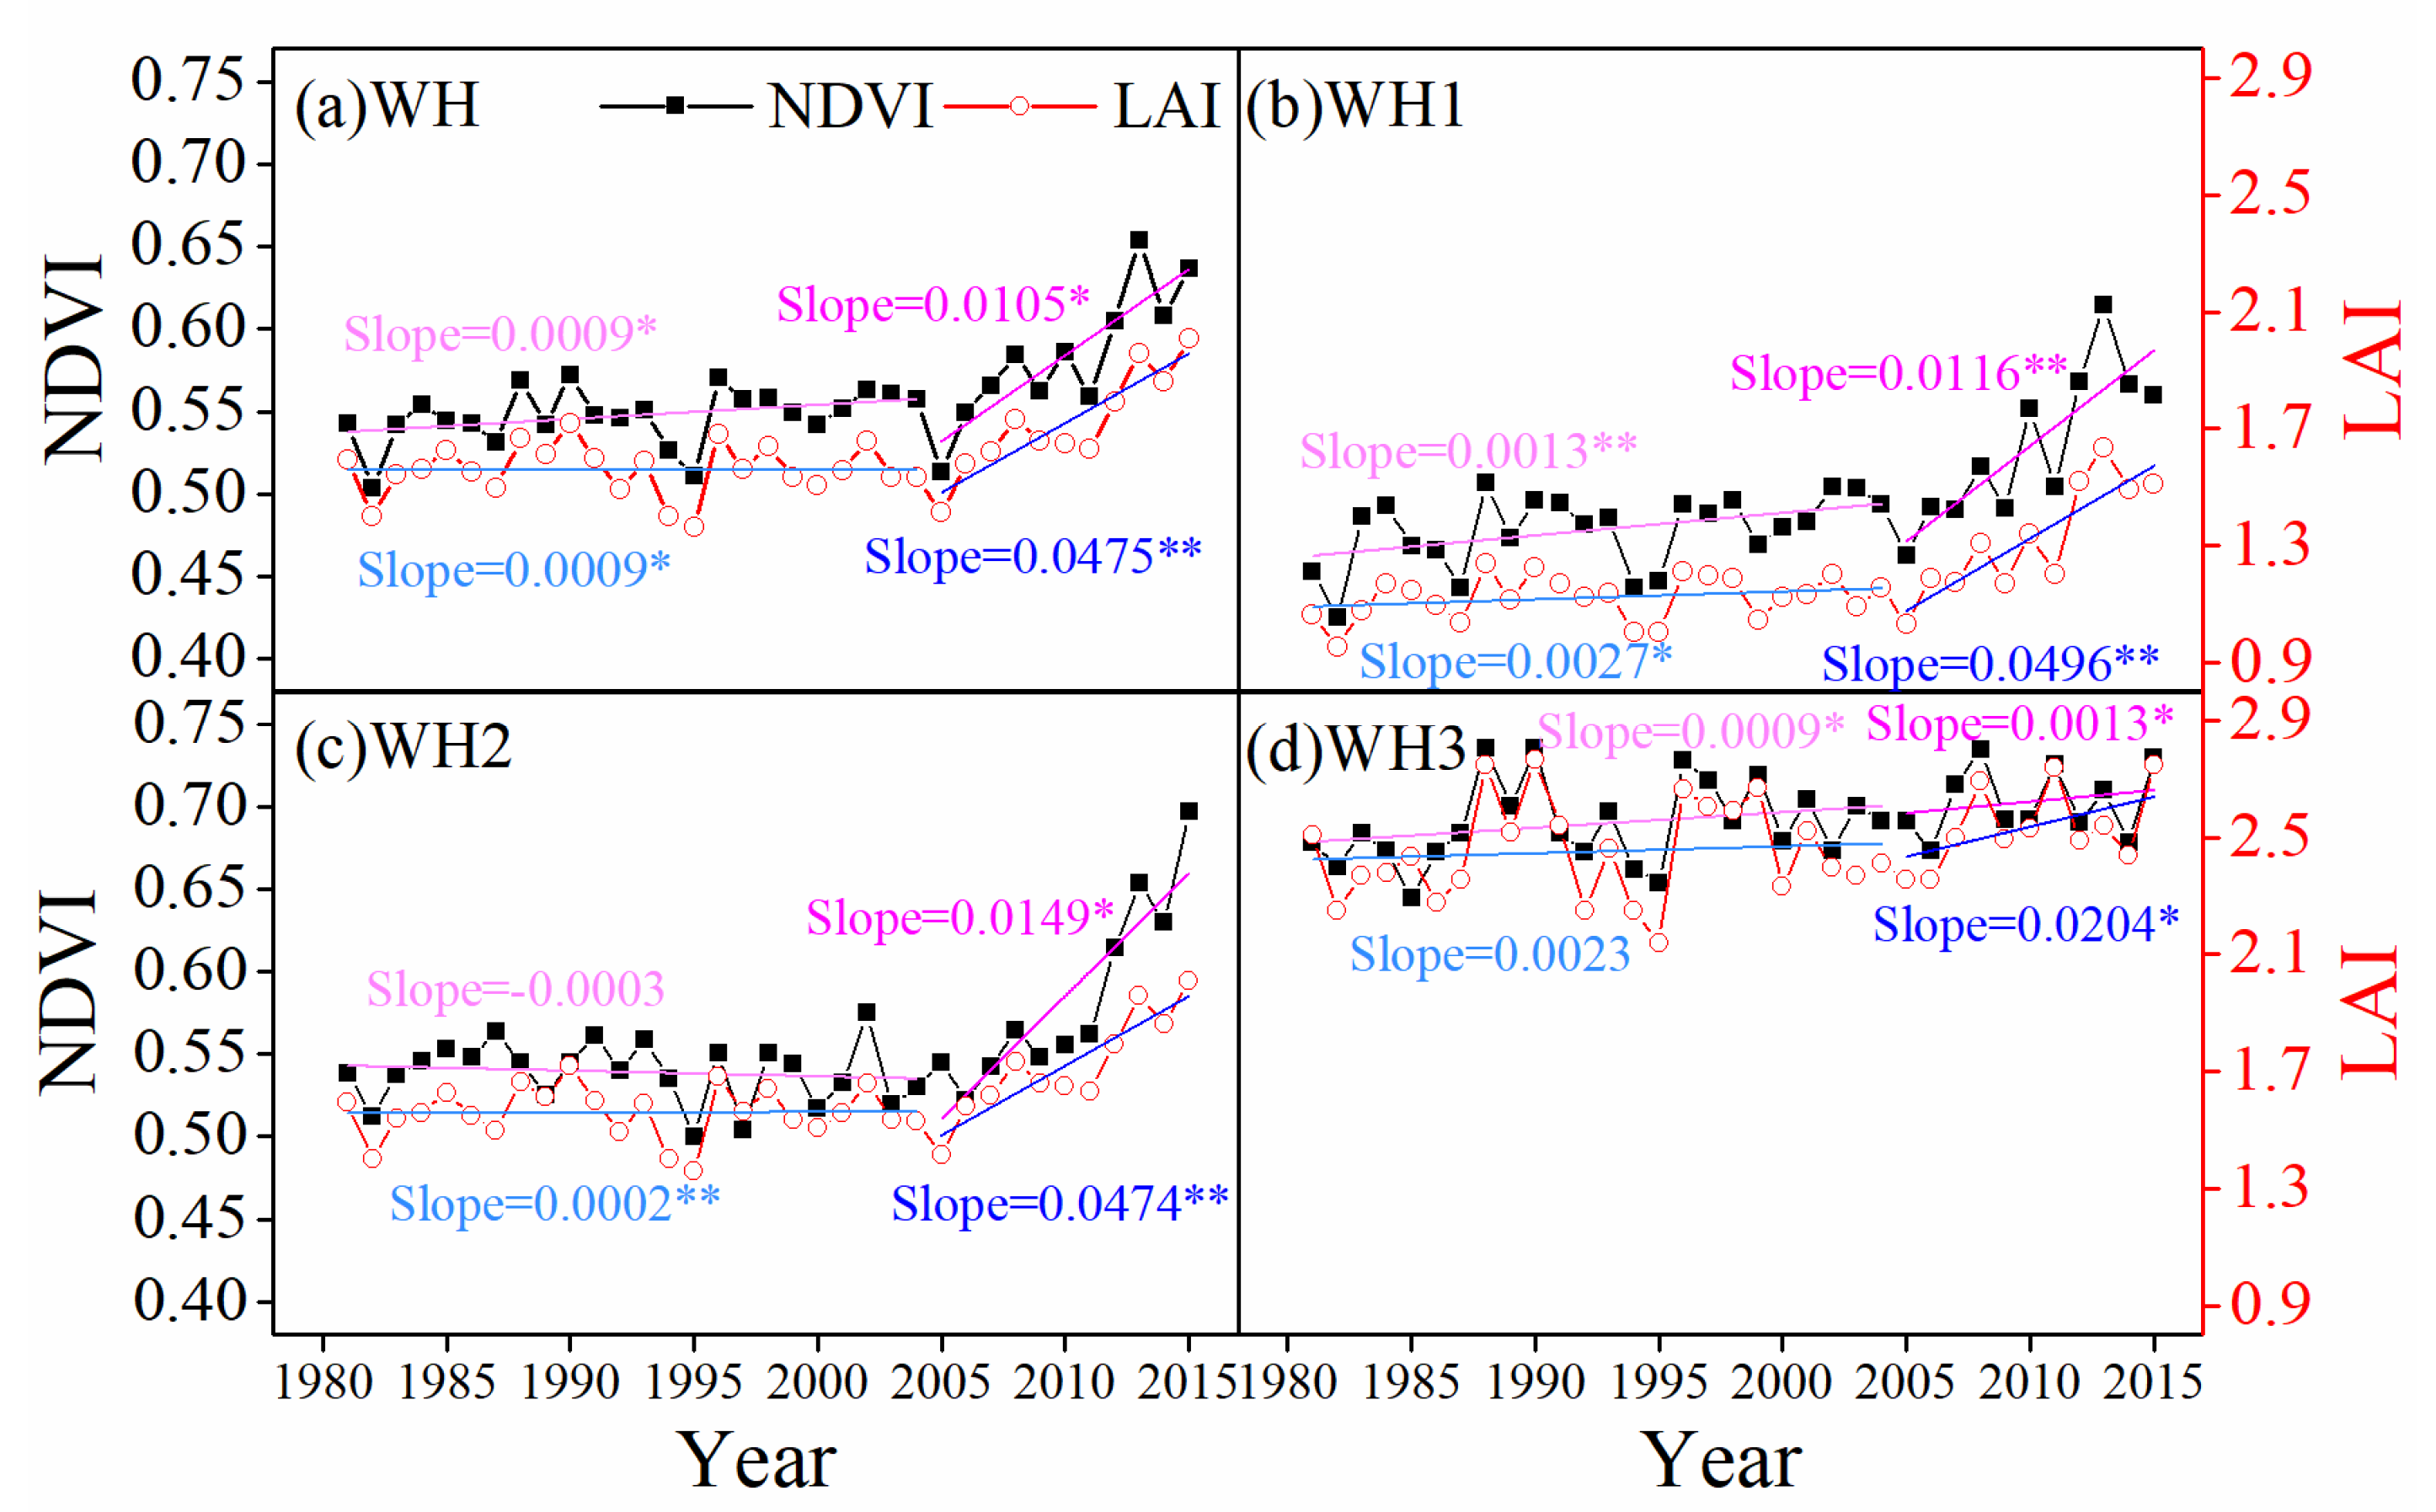
Based on five land use/cover maps for different periods, we found out the mode and intensity of land use/cover change in the WH for each decade in the last 50 years. As shown in Figure 5, the land use/cover change was relatively small before the 1990s, but greater during 1990s–2010s with a decrease of farmland (−0.8% and −0.72%) and an increase in grassland (0.44%) and urban industrial land (0.58%), respectively. Except WH2 during the 1970s–1980s, all the three sub-regions exhibited an obvious decrease of farmland, especially in the last two decades. The woodland of WH2 experienced a process from decrease (−0.53%) to increase (0.49%) during the 1970s–2000s, while a continuous increase of urban industrial land was detected at the cost of reduction in farmland, especially since the 2000s. Besides, the NDVI and LAI were employed to investigate the variability in growth and structure of vegetation (Figure 6). NDVI and LAI of WH were relatively stable with no obvious trend (0.0009 year−1, ; 0.0002 year−1, ) during 1982–2004, while a trend of significant increase (0.0105 year−1, ; 0.0475 year−1, ) was detected since 2005. The WH1 and WH2 exhibited similar dynamic changes in NDVI and LAI with WH, especially for WH2 with a more dramatic increase (0.0149 year−1, ) in NDVI. However, NDVI and LAI of WH3 stayed stable for both value and trend during the whole study period, especially during 1996–2015. This indicated that the obvious improvement of vegetation conditions of WH was mainly caused by WH1 and WH2, which was likely to benefit from the Grain for Green project.
4.4. Variability of Runoff during 1961–2016
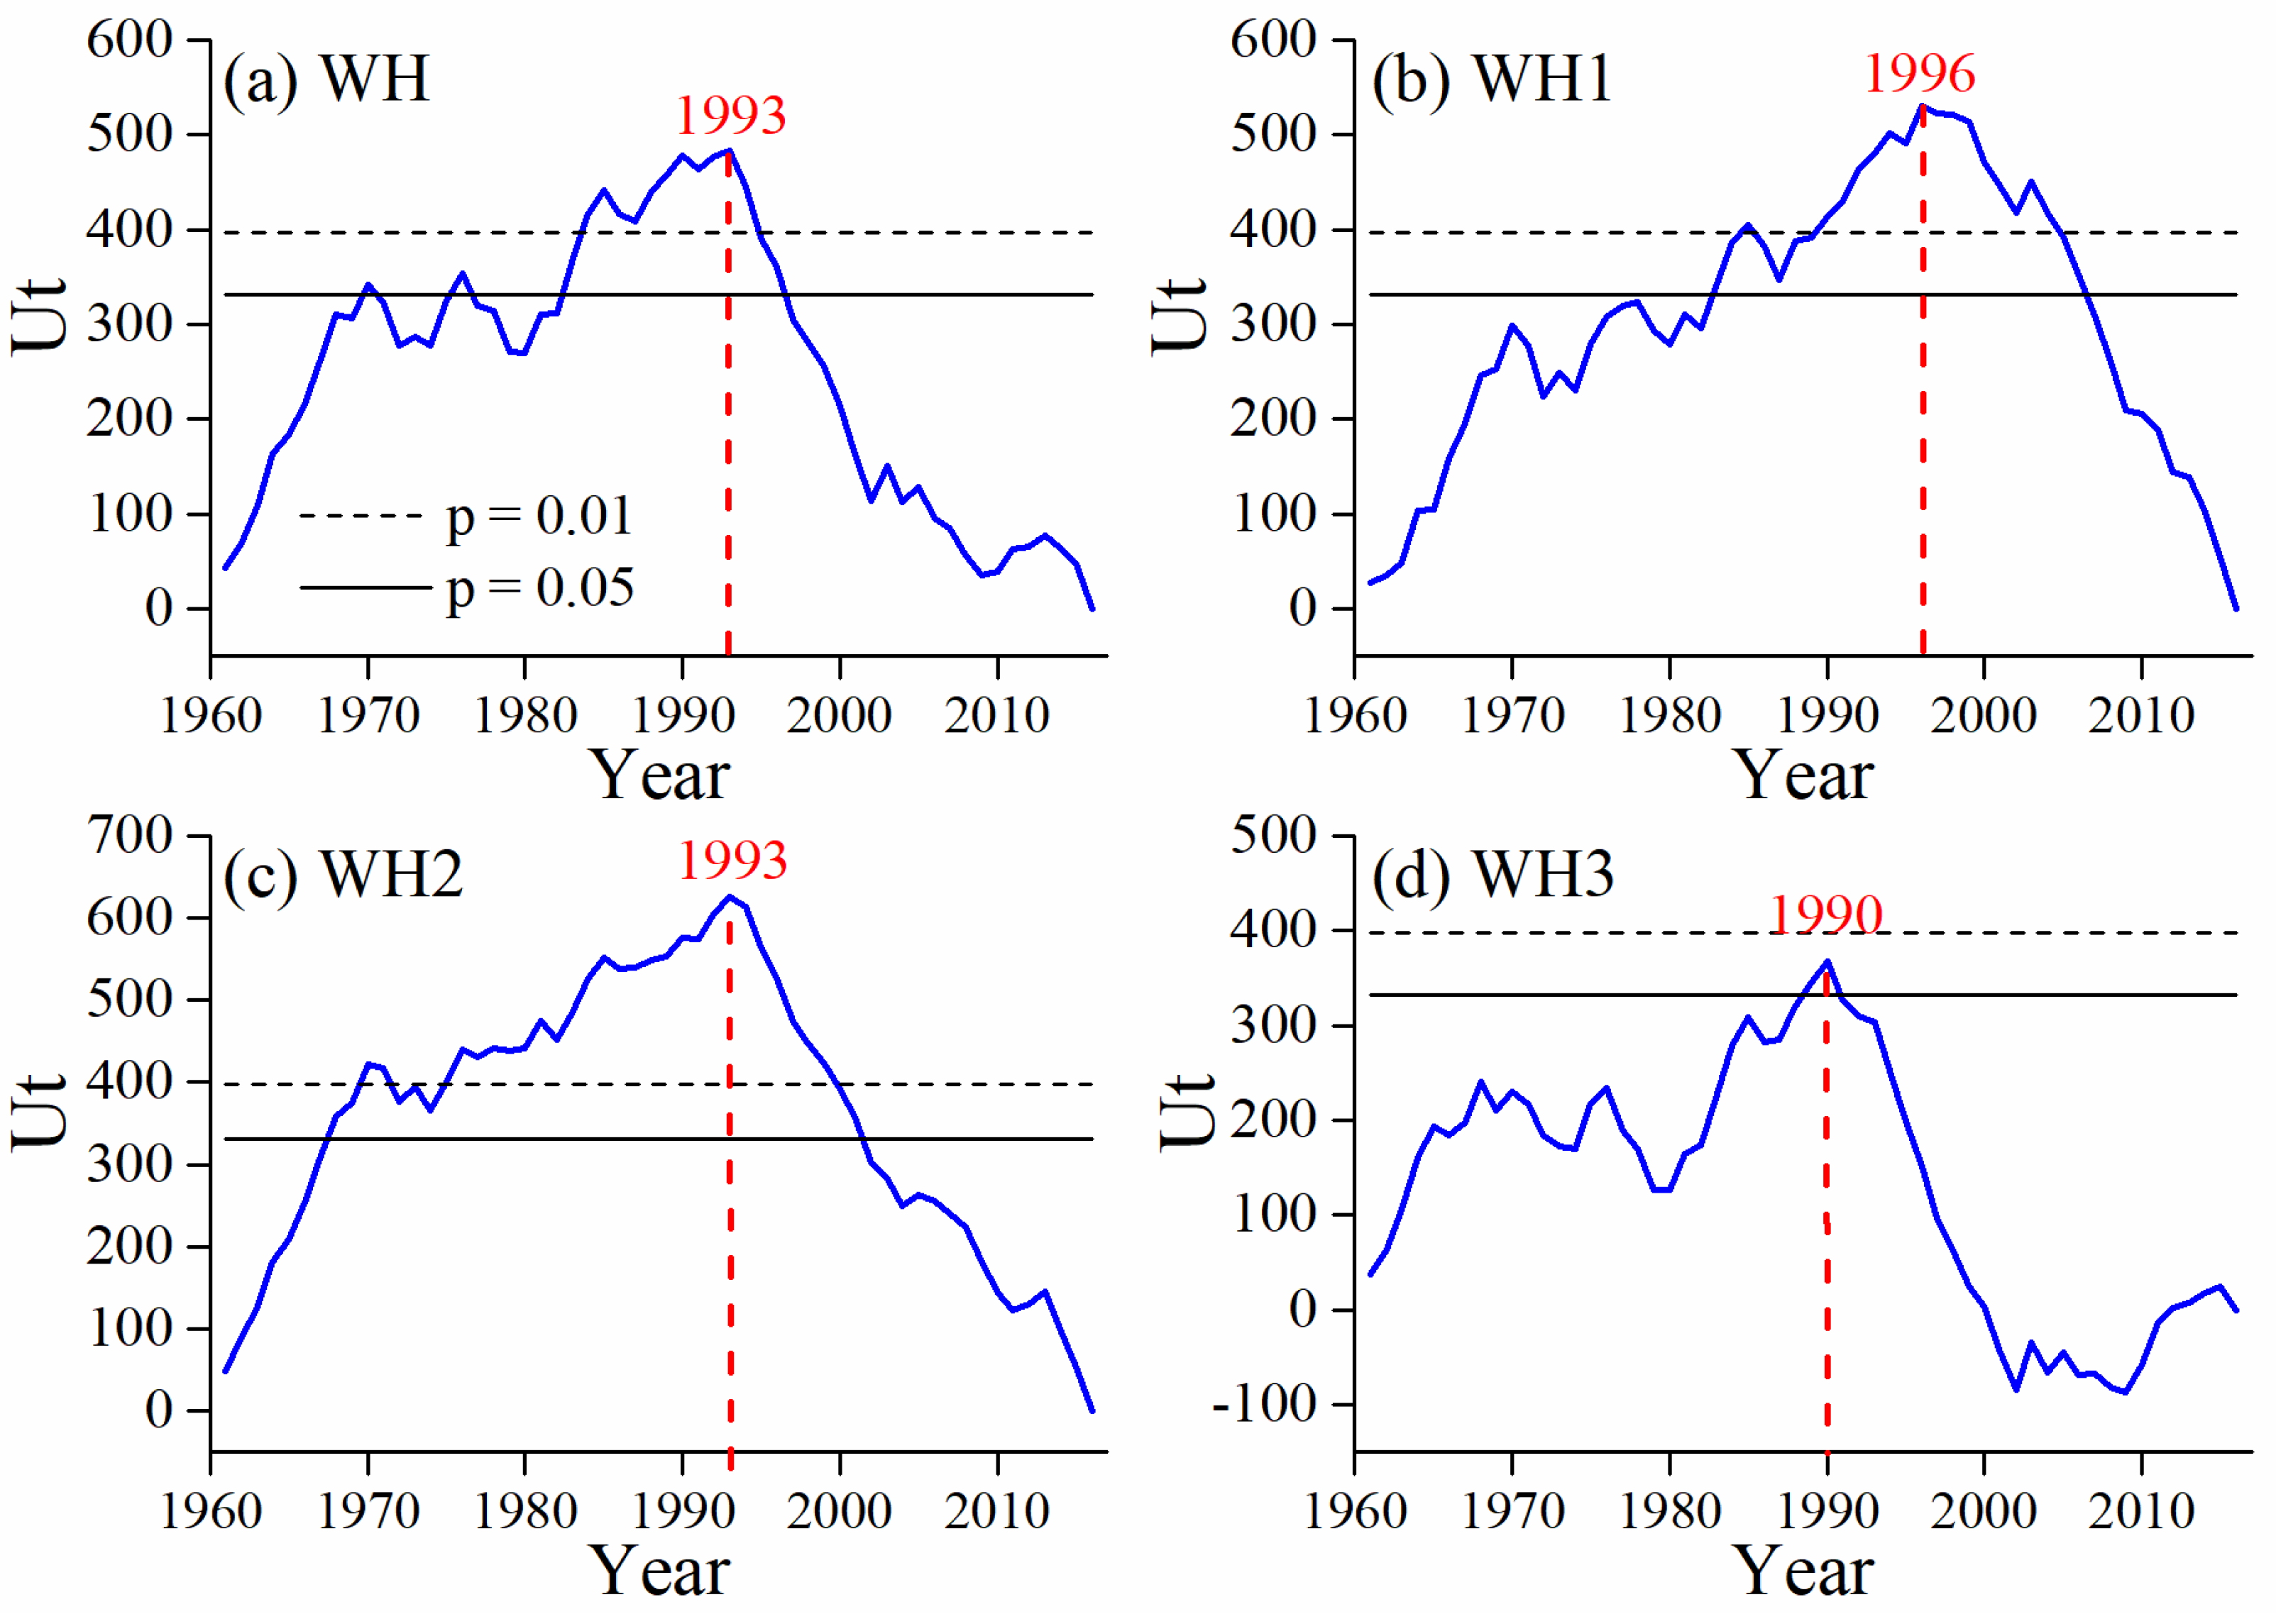
Among the three sub-regions, the WH3, covering 30.82% of the WH contributed the most runoff with an average percentage about 54.48% of the total runoff during 1961–2016, followed by WH2 (25.15%) and WH1 (20.37%) (Figure S2), and this percentage showed an increasing trend especially since 1997. The results of the Pettitt test (Figure 7) showed that 1993 was the most probable change point of the observed runoff over the WH (), which could be speculated to be induced by human activity because no significant change-point in this period was detected in both precipitation and potential evapotranspiration. The runoff of the three sub-regions was also found to have significant change-points in the 1990s, i.e., WH1 (1996, ), WH2 (1993, ), and WH3 (1990, ). There was a significant difference in runoff before and after the change-point (Table 3). The multi-year average runoff of WH decreased −32.68 × 10⁸ m3 with a rate of −42.15%. Among the three sub-regions, WH2 showed the biggest drop rate (−58.04%), followed by WH1 (−48.34%) and WH3 (−34.84%), while WH3 showed the maximum reduction (−14.67 × 10⁸ m3). No significant downward trend of runoff at a rate of −0.9882 × 10⁸ m3·year−1 was detected before change-point, but a significant increasing trend (0.8175 × 10⁸ m3·year−1, ) thereafter. Runoff of WH3 showed a similar increasing trend after the change-point and a slight downward trend before, while that of WH1 and WH2 exhibited varying degrees of decline during the two periods.
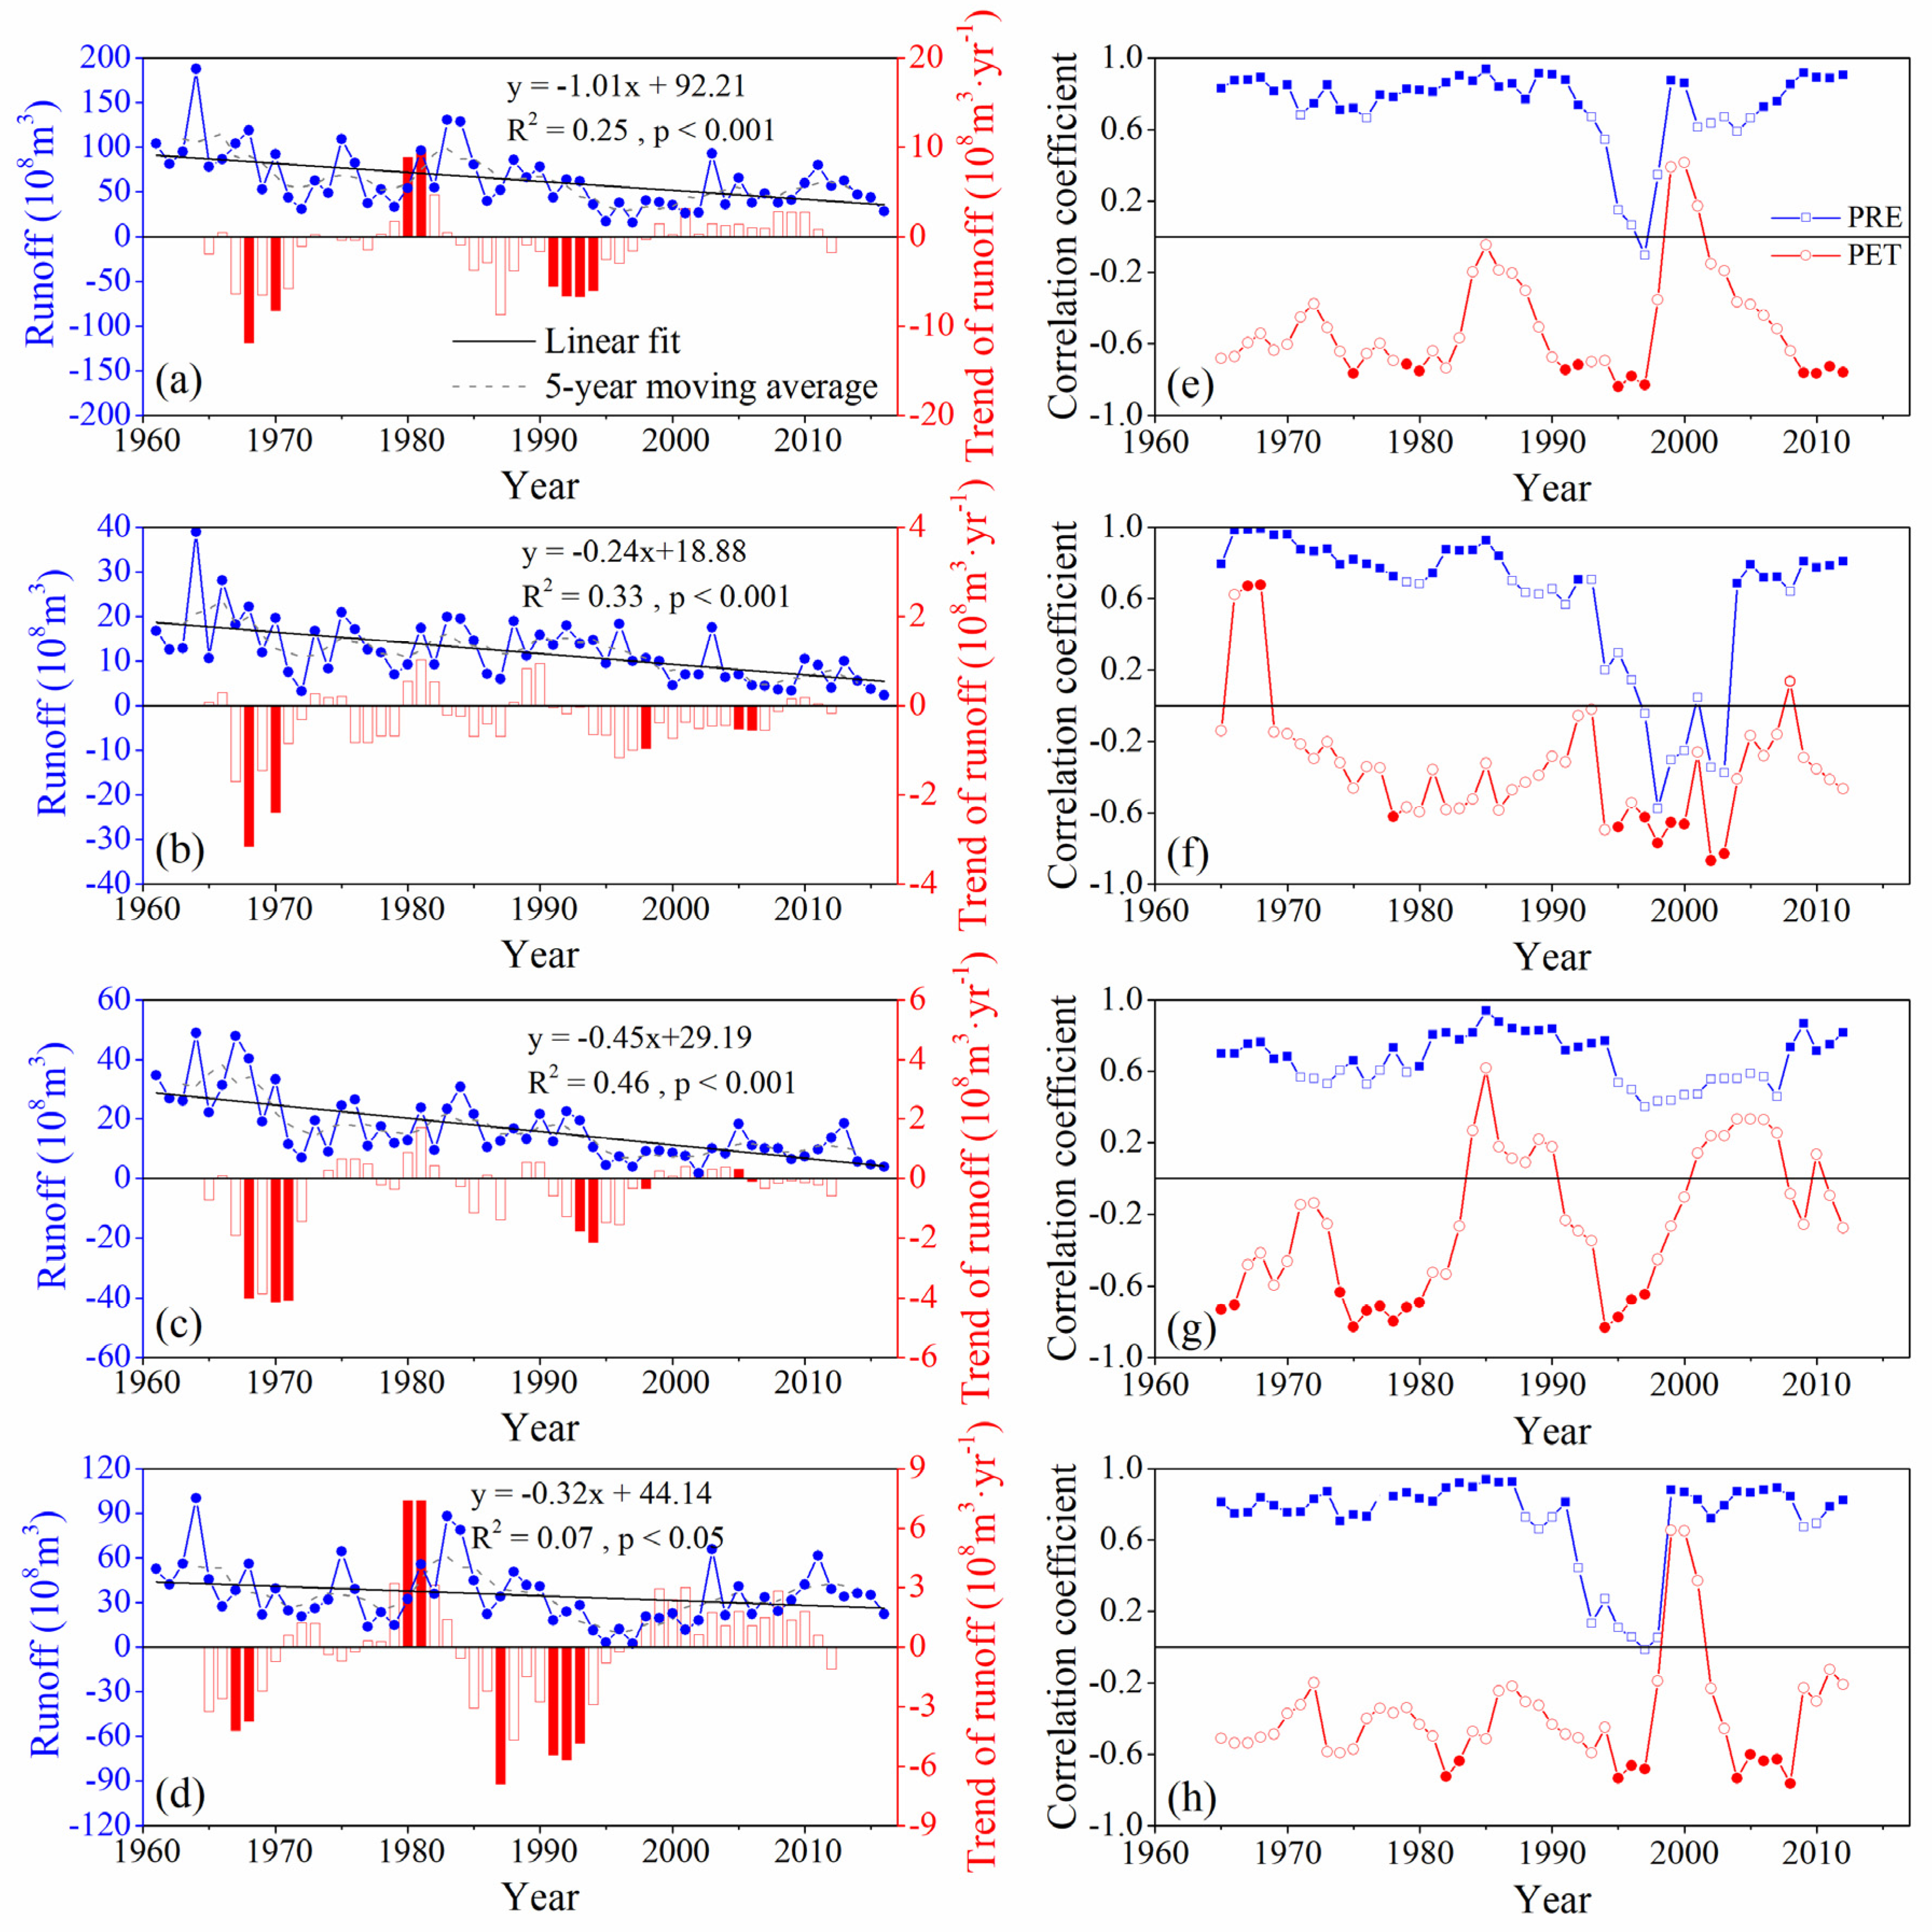
As shown in Figure 8, runoff of WH decreased significantly in a non-linear fashion at an average rate of −1.01 × 10⁸ m3·year−1 () during 1961–2016, as well the WH1 (−0.24 × 10⁸ m3·year−1, ), WH2 (−0.45 × 10⁸ m3·year−1, ), and WH3 (−0.32 × 10⁸ m3·year−1, ). The moving time window of trend analysis detected that the runoff variation of WH can be divided into four stages for the whole study period with an obvious and continuous increasing trend during 1965–1977 and 1984–1998, and decreasing trend during 1978–1983 and 1999–2012. The temporal dynamics in the runoff of the three sub-regions was similar to WH, especially for WH3, which indicated a greater contribution to the total runoff of WH. Runoff significantly reduced during 1961–1972 and a clear transition from increasing trend to decreasing trend during the late 1980s to 1990s, except for WH1. The variation trend of runoff of WH3 was greater than that of WH1 and WH2 for most years.
Partial correlation analysis with a nine-year moving window was conducted to detect a temporally varying correlation between runoff and precipitation, potential evapotranspiration during 1961–2016 (Figure 8e–h). The results showed that there was a positive correlation between runoff and precipitation and a negative correlation between runoff and potential evapotranspiration in general. The correlation coefficient between runoff and precipitation was higher and more stable than that between runoff and potential evapotranspiration, suggesting a dominant driving effect of precipitation. There was a very good correlation between runoff and precipitation with for most years, indicating a relatively weaker effect of human intervention on runoff change, while poor and insignificant correlation was found for the late 1990s and early 2000s. According to the results of the Pettitt test for runoff and meteorological variables, there is likely to be strong human interference on runoff during this period. In addition, an increasing correlation coefficient since 1997 may be a result of a re-stabilized hydrological response of runoff to variations in precipitation. The correlation in the three sub-regions showed a similar pattern as that of WH, while there were small differences in the poor correlation period associated with the year of change-points, which indicated different start time and duration intensity of human intervention for each sub-region.
4.5. Changes in Precipitation-Runoff Relationship
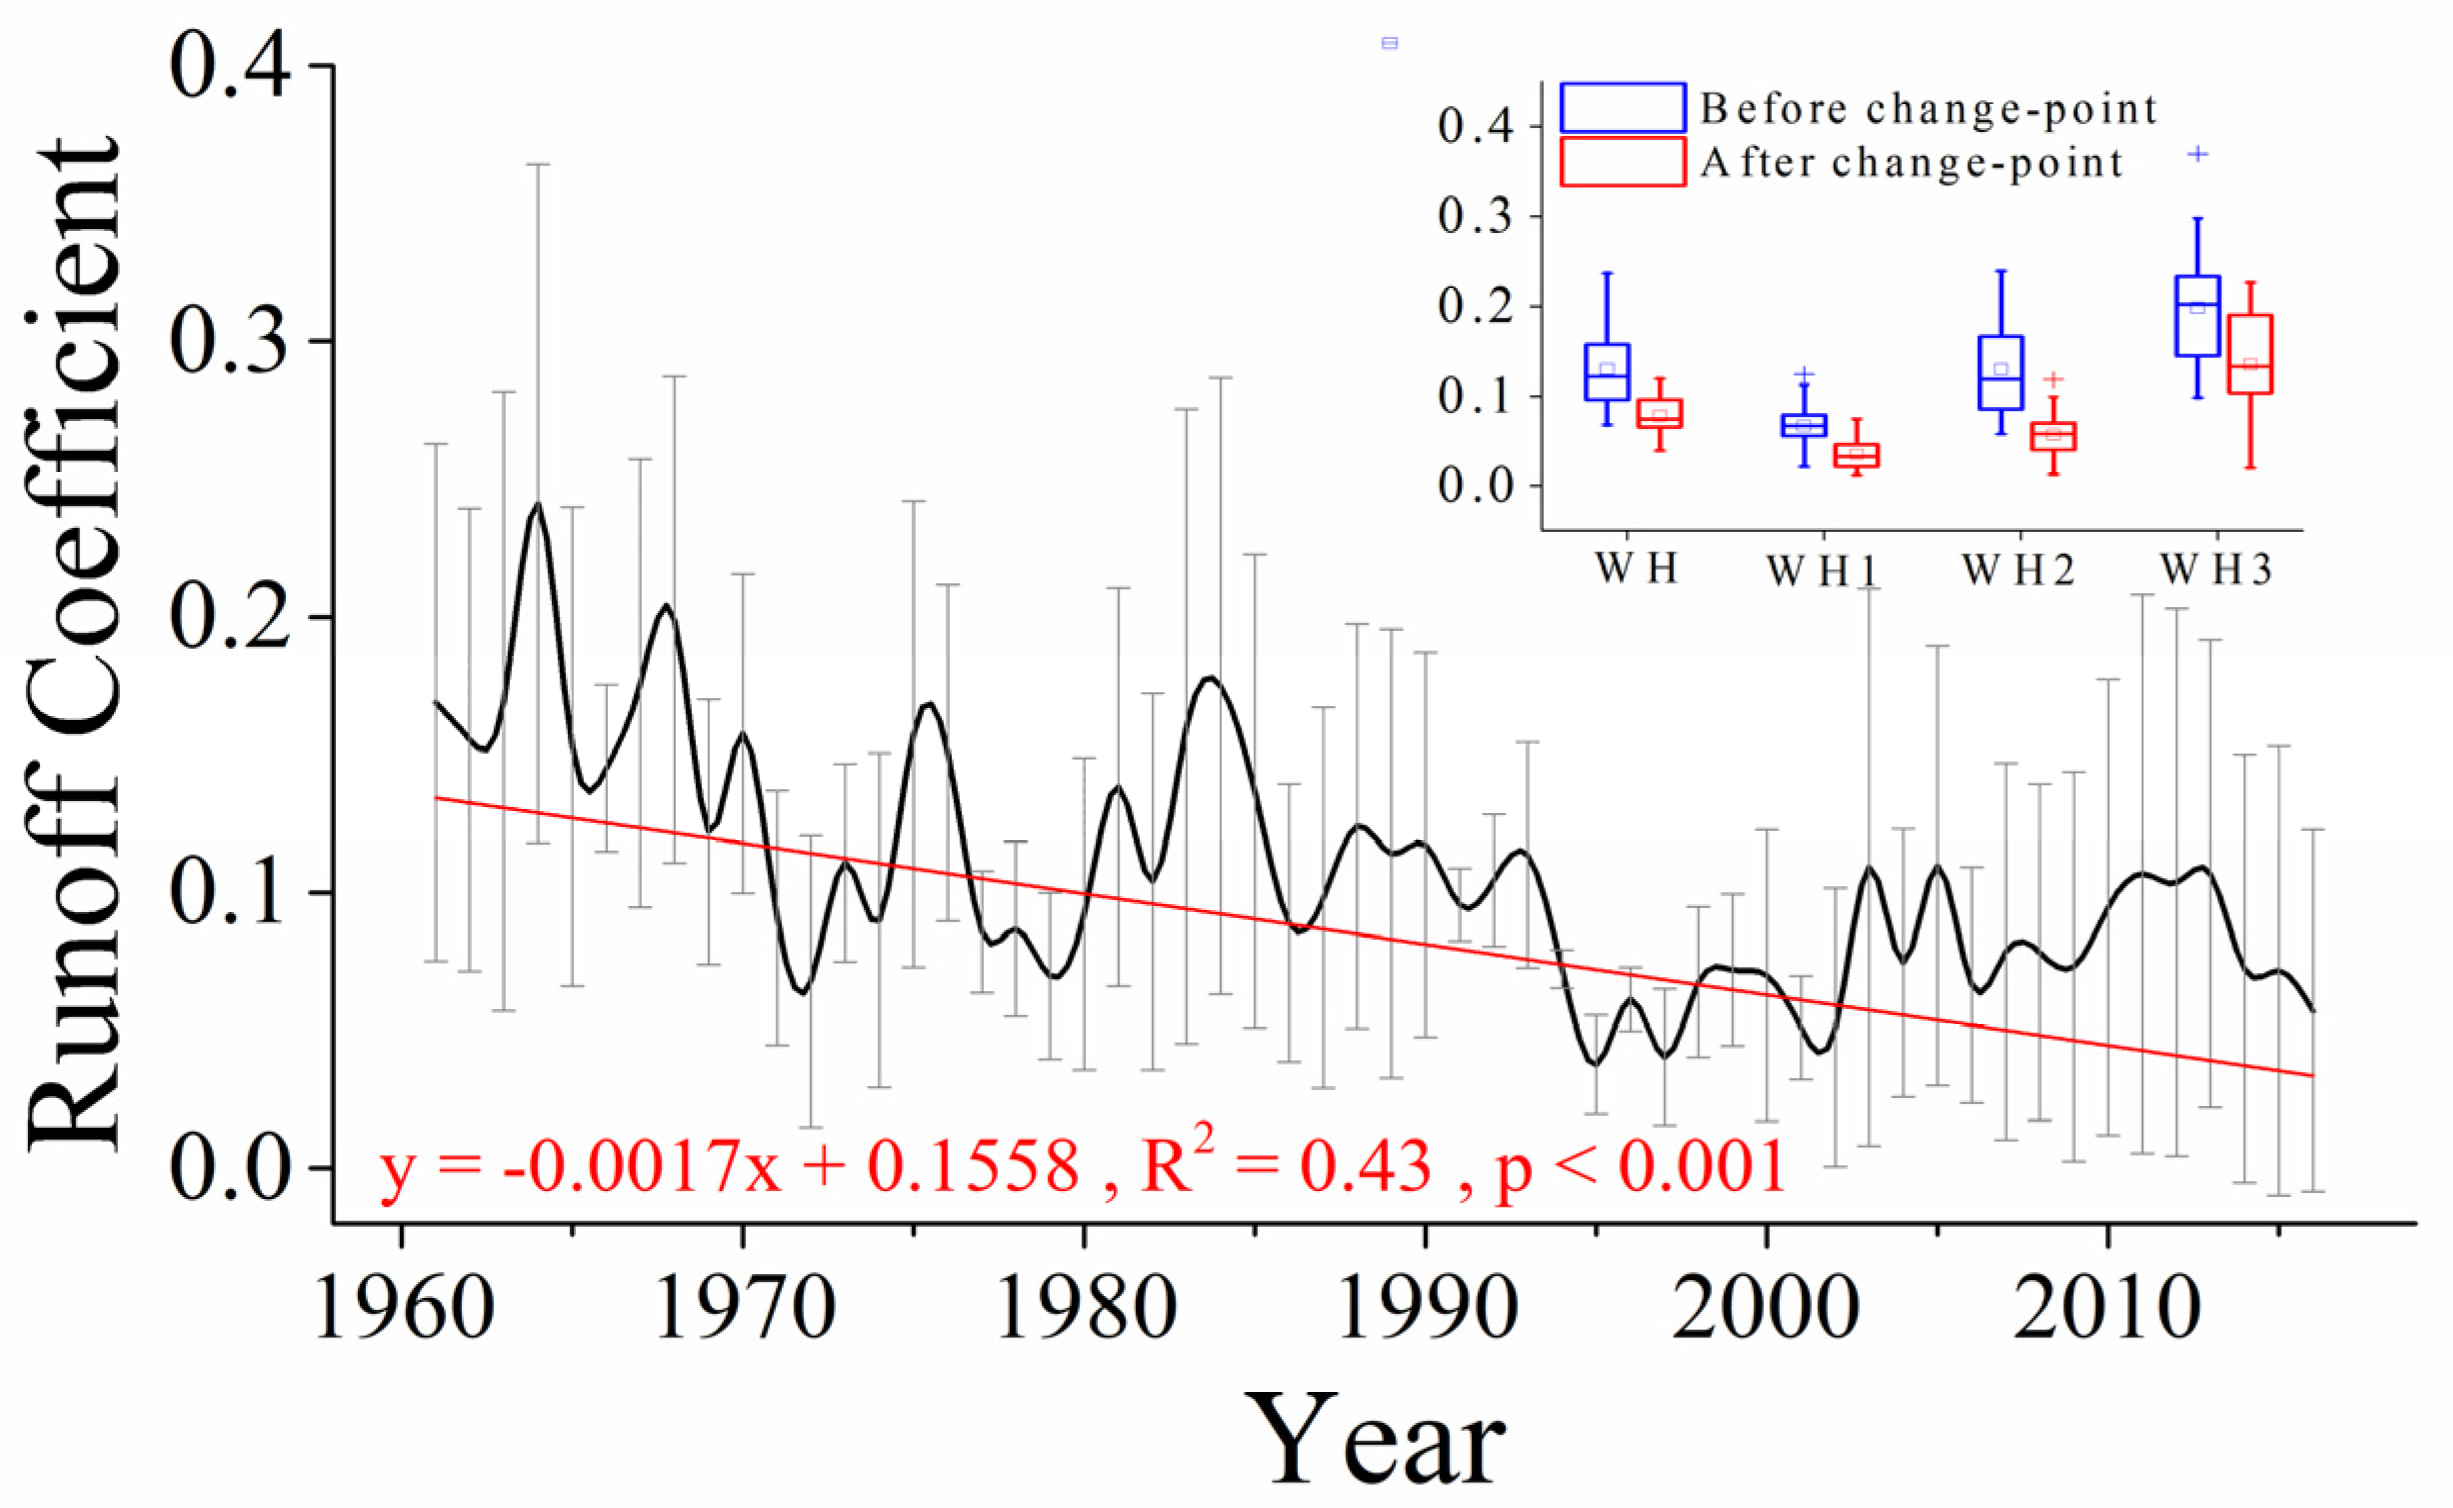
As shown in Figure 9, the mean runoff coefficient of the three sub-regions, ranging from 0.0376 (1995) to 0.2411 (1964), showed a significant downward trend at a rate of −0.0017 year−1 () during 1961–2016. It reached the lowest value in the late 1990s and showed a significant increasing trend (0.0016, ) since 1995. Among the three sub-regions, the runoff coefficient of WH3 with a mean value of 0.1676 is the largest, followed by WH2 (0.0984) and WH1 (0.0549). Compared with rivers of other part of China, the runoff coefficients were relatively lower, especially WH2 and WH1, which was probably because of the low and unevenly distributed precipitation, and a continuously increasing water withdrawal to meet the demand of domestic, industrial, and agricultural water. The runoff coefficient of both WH and the three sub-regions showed an obvious decline after change-point, especially WH2 (−0.072) and WH3 (−0.064).
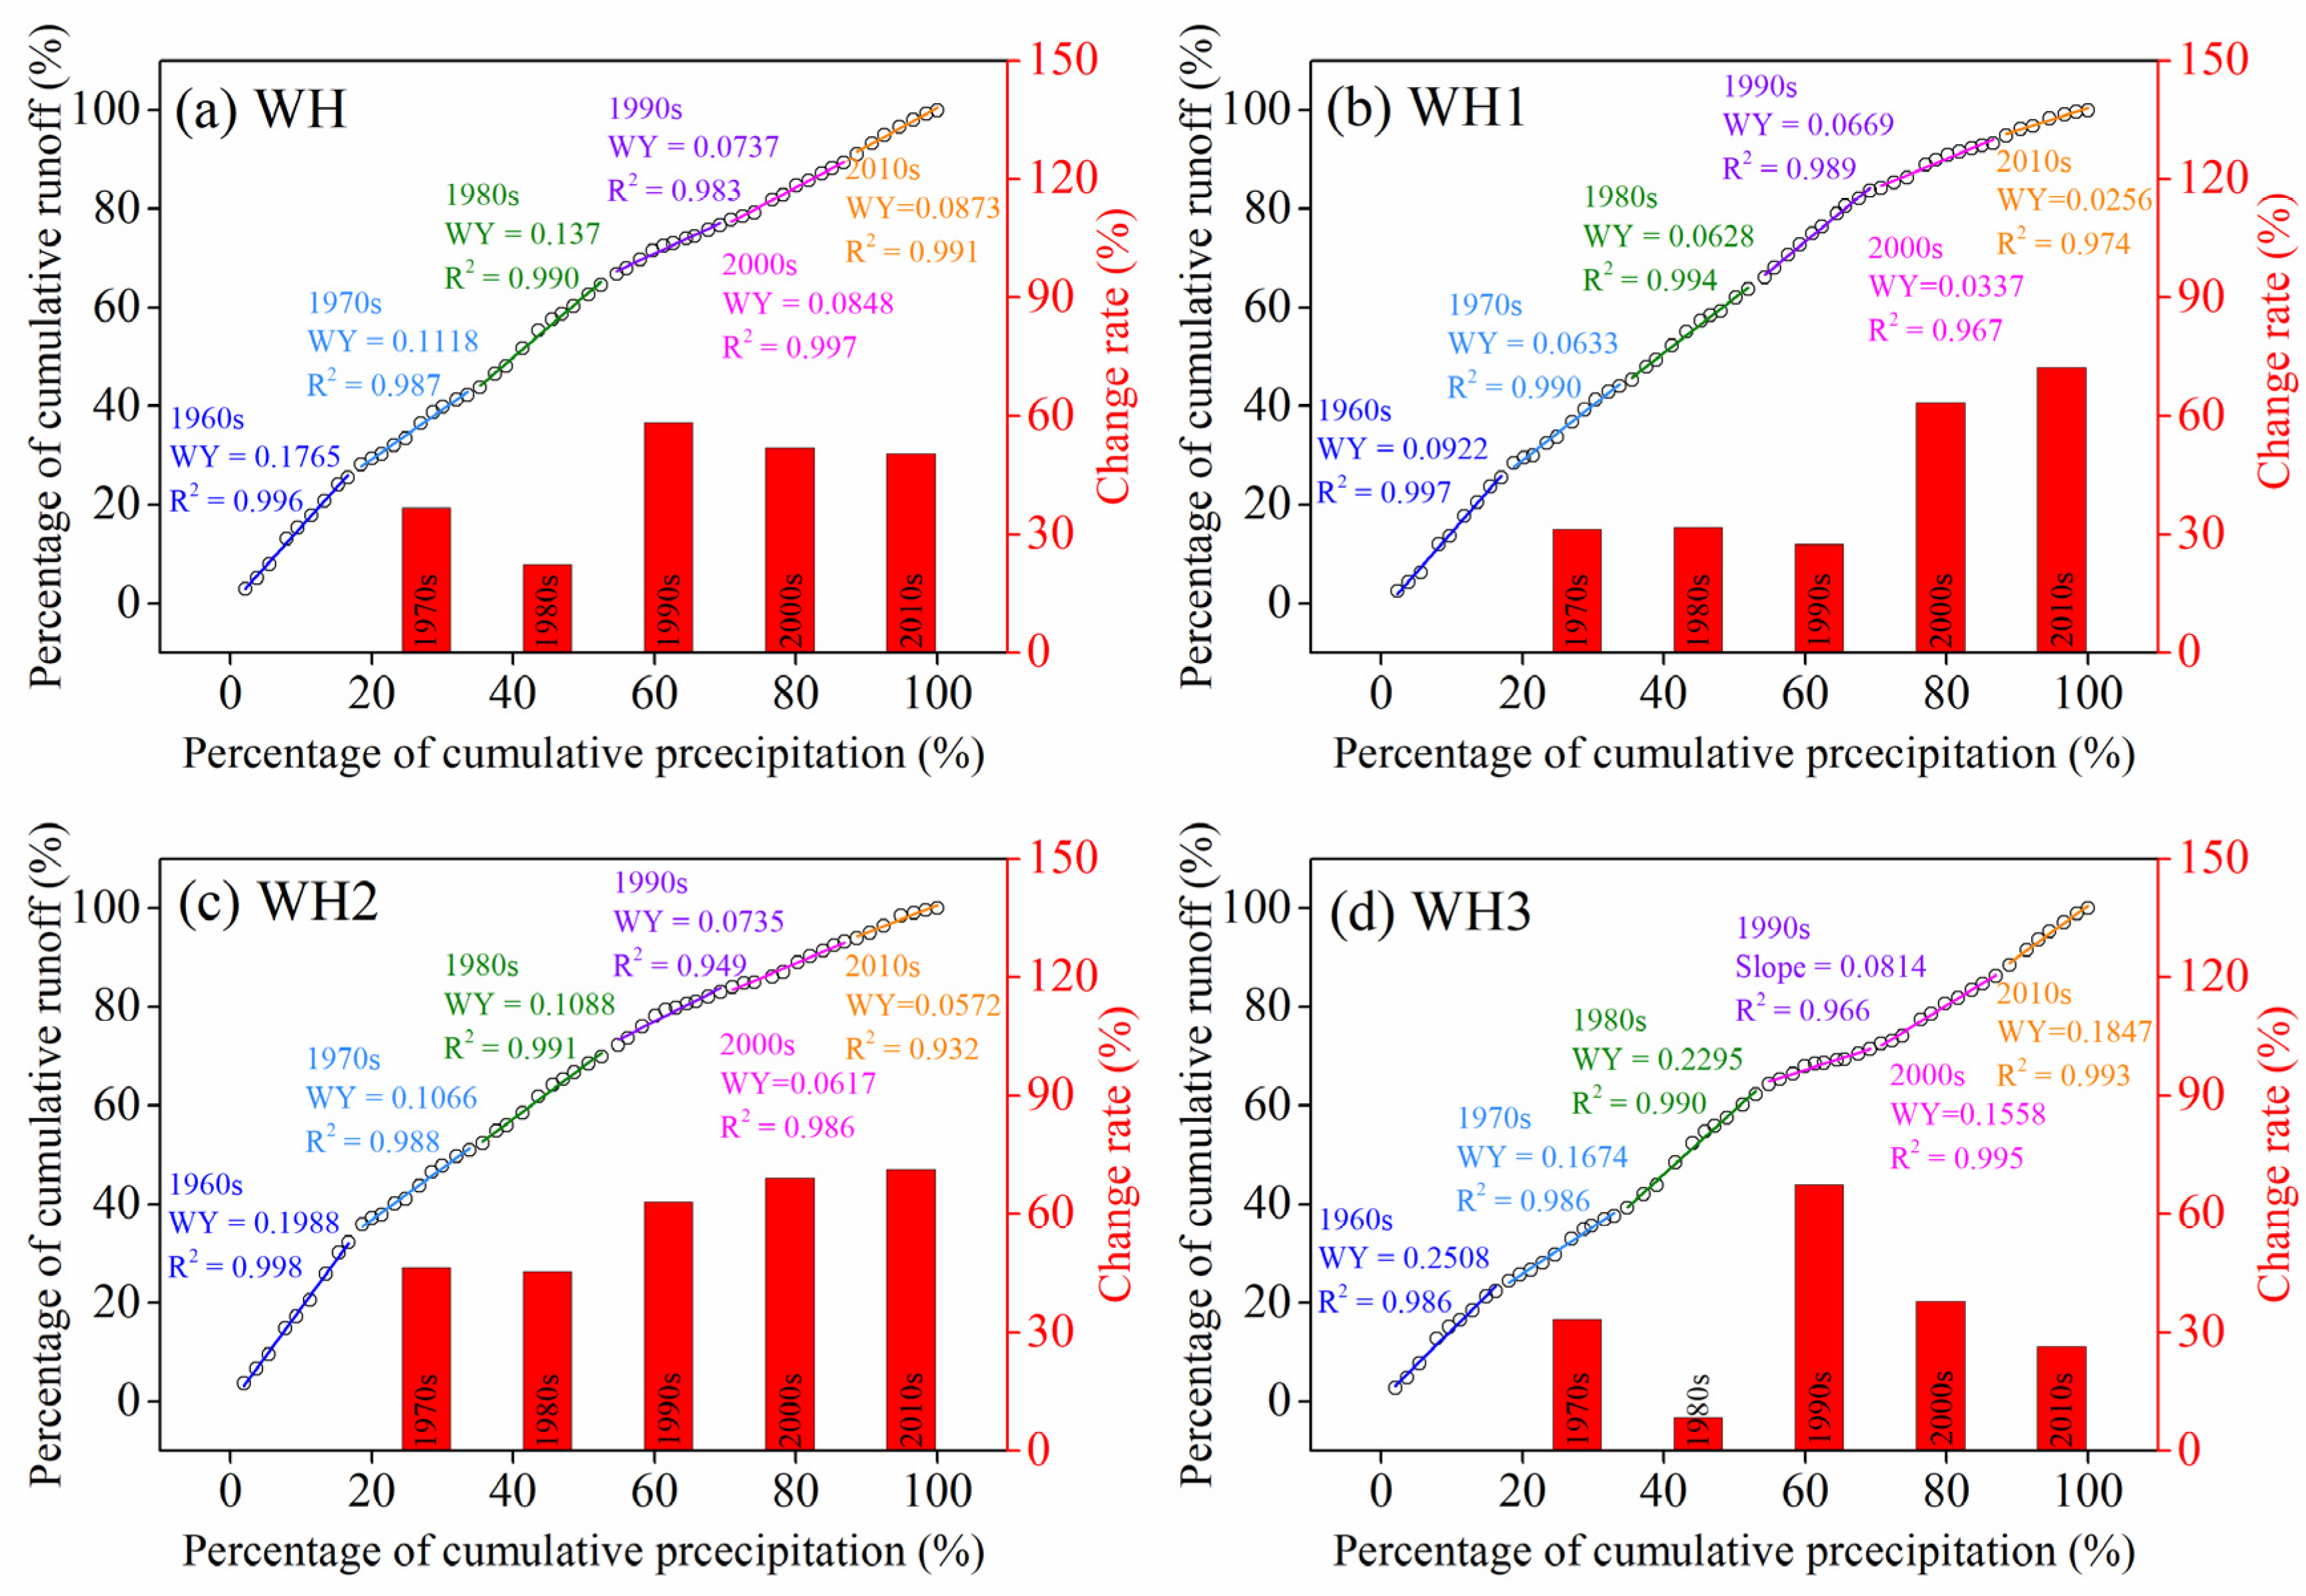
Water yield (WY) is an important indicator to represent the ecosystem service of water provision. A double mass curve of cumulative precipitation versus cumulative runoff was used to detect changes in WY of each decade since 1961 (Figure 10). The water yield of WH was the largest in the 1960s (0.1765) with less human interference and was the closest to the natural state, indicating that 17.65% of precipitation on average was converted to runoff, while this proportion dropped to 11.18%, 13.70%, 7.37%, 8.48%, and 8.73% in the following five decades, respectively. Actually, the reduction in water yield meant a decrease in the amount of freshwater available for recharging runoff. Compared with the 1960s, the amount of freshwater available in runoff declined by 36.66%, 22.38%, 58.24%, 51.95%, and 20.54% for each decade since 1970, respectively. Due to differences in the type and intensity of precipitation, and the conditions of topography and geomorphology, the water yield of the three sub-regions were obviously different with the max in WH3 (25.08%), followed by WH2 (19.88%) and WH1(9.22%) in the 1960s. However, the similarity was that varying degrees of decline in water yield were detected in all the three sub-regions in the following period. The decrease of available freshwater in runoff over WH1 and WH2 were greater and both exhibited an increasing trend, especially in the 2000s and 2010s with a decrease rate more than 60%, while in comparison, that of WH3 was relatively small with a huge difference ranging from 8.49% (1980s) to 67.54% (1990s). As the runoff of the WH3 accounted for the largest proportion of the total runoff on average, the reduction of water yield over WH3 contributed the most to that of WH.
4.6. Contributions of Climate Change and Human Activity on Runoff Variation
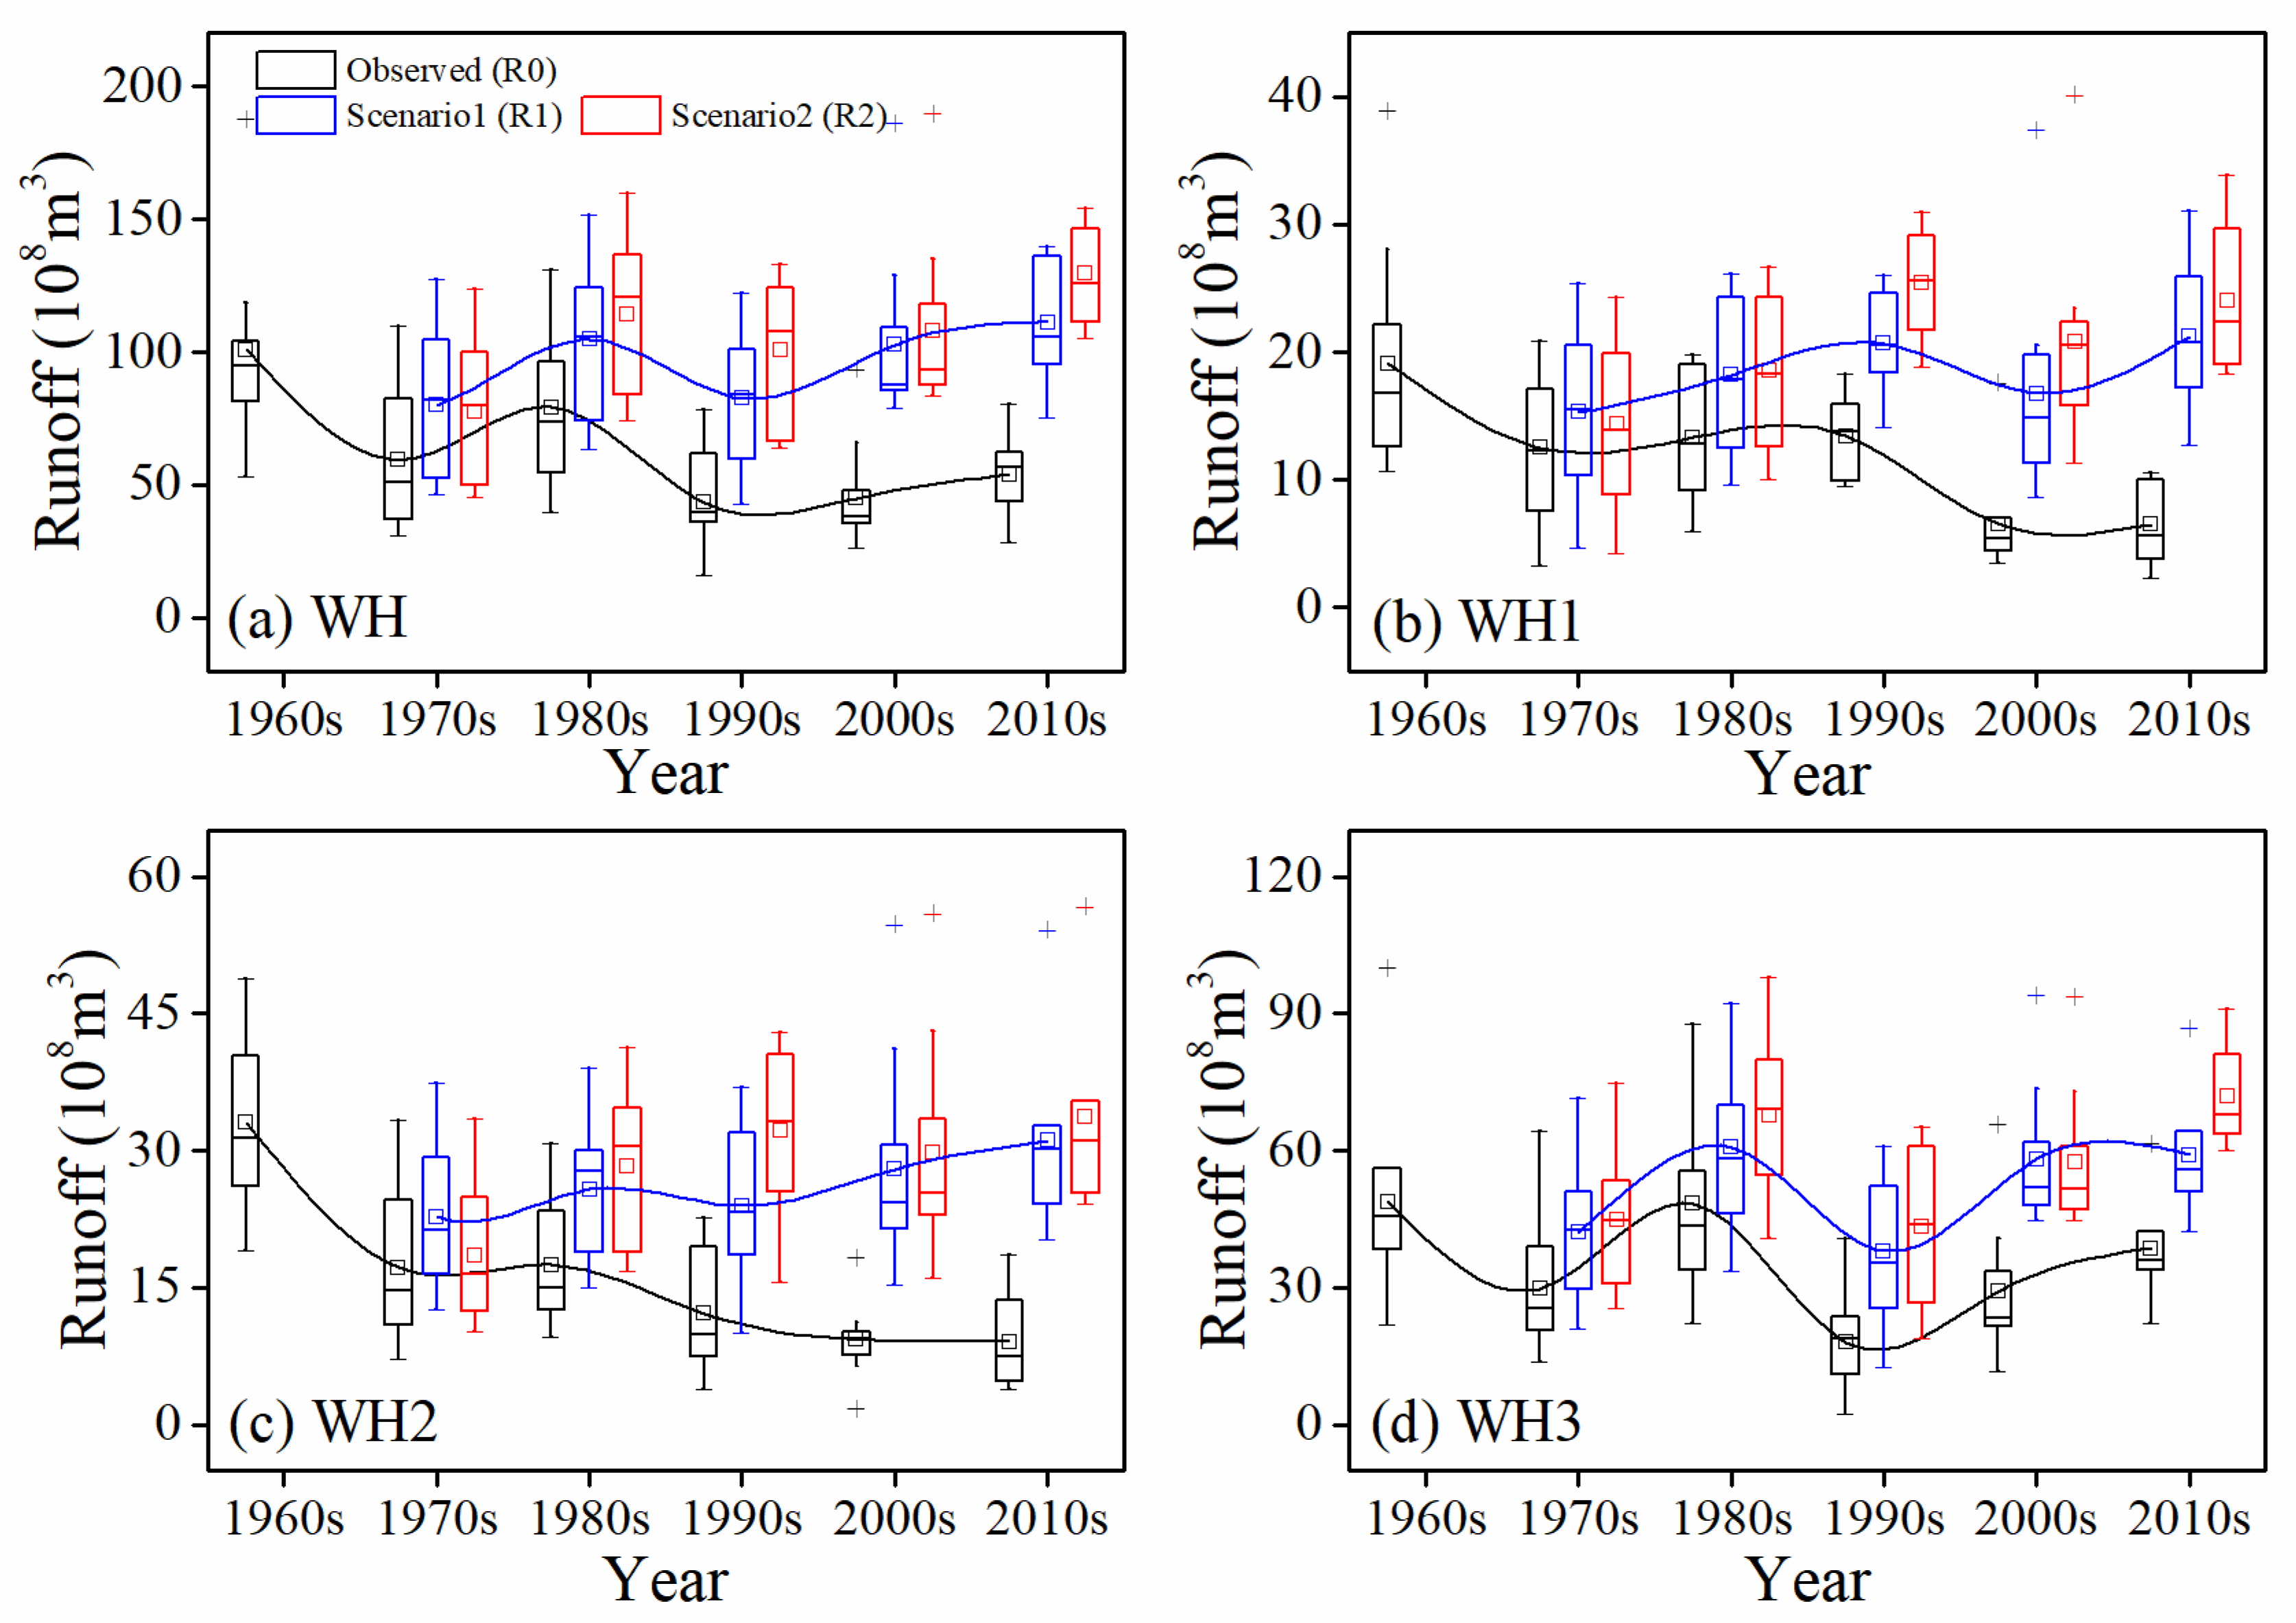
As shown in Figure 11, the decadal runoff of WH experienced a process of decline-increase-decline-increase, which was highest in the 1960s and lowest in the 1990s, and the three sub-regions showed a similar trend with WH. The mean value of natural runoff per decade of WH ranged from 80.09 × 10⁸ m3 (1970s) to 104.66 × 10⁸ m3 (1980s) with a slight fluctuation, which indicated that the natural runoff affected by meteorological factor alone, without human activity, was relatively stable in decades and had good consistency with precipitation variation. Human activity has always been identified to induce runoff decline over the past five decades for both WH and sub-regions, and this effect was found to be getting stronger to induce an increasing runoff decline from 20.68 × 10⁸ m3 (1970s) to 57.76 × 10⁸ m3 (2000s). There were obvious differences in the intensity of human influence of each period among the three sub-basins. The variation of runoff reduction of WH3 ranged from 12.29 × 10⁸ m3 (1970s) to 28.91 × 10⁸ m3 (2000s). The runoff of WH1 and WH2 decreased gradually, especially after 2000 with a fairly low value, which were about 34.00% and 27.74% of the runoff in 1960s, and the runoff reduction induced by human activity was getting greater, which increased by about 5.18 and 3.97 times from 2.83 × 10⁸ m3 and 5.55 × 10⁸ m3 (1970s) to 14.71 × 10⁸ m3 and 22.04 × 10⁸ m3 (2010s). The human-induced runoff reduction of the three sub-regions showed an obvious increase trend, while that of WH3 accounted for the most and the sum of WH1 and WH2 was comparable to that of WH3 in the 2000s and 2010s. Runoff variations induced by climate change were obviously different over periods and sub-regions but related to the variability of precipitation to a large extent.
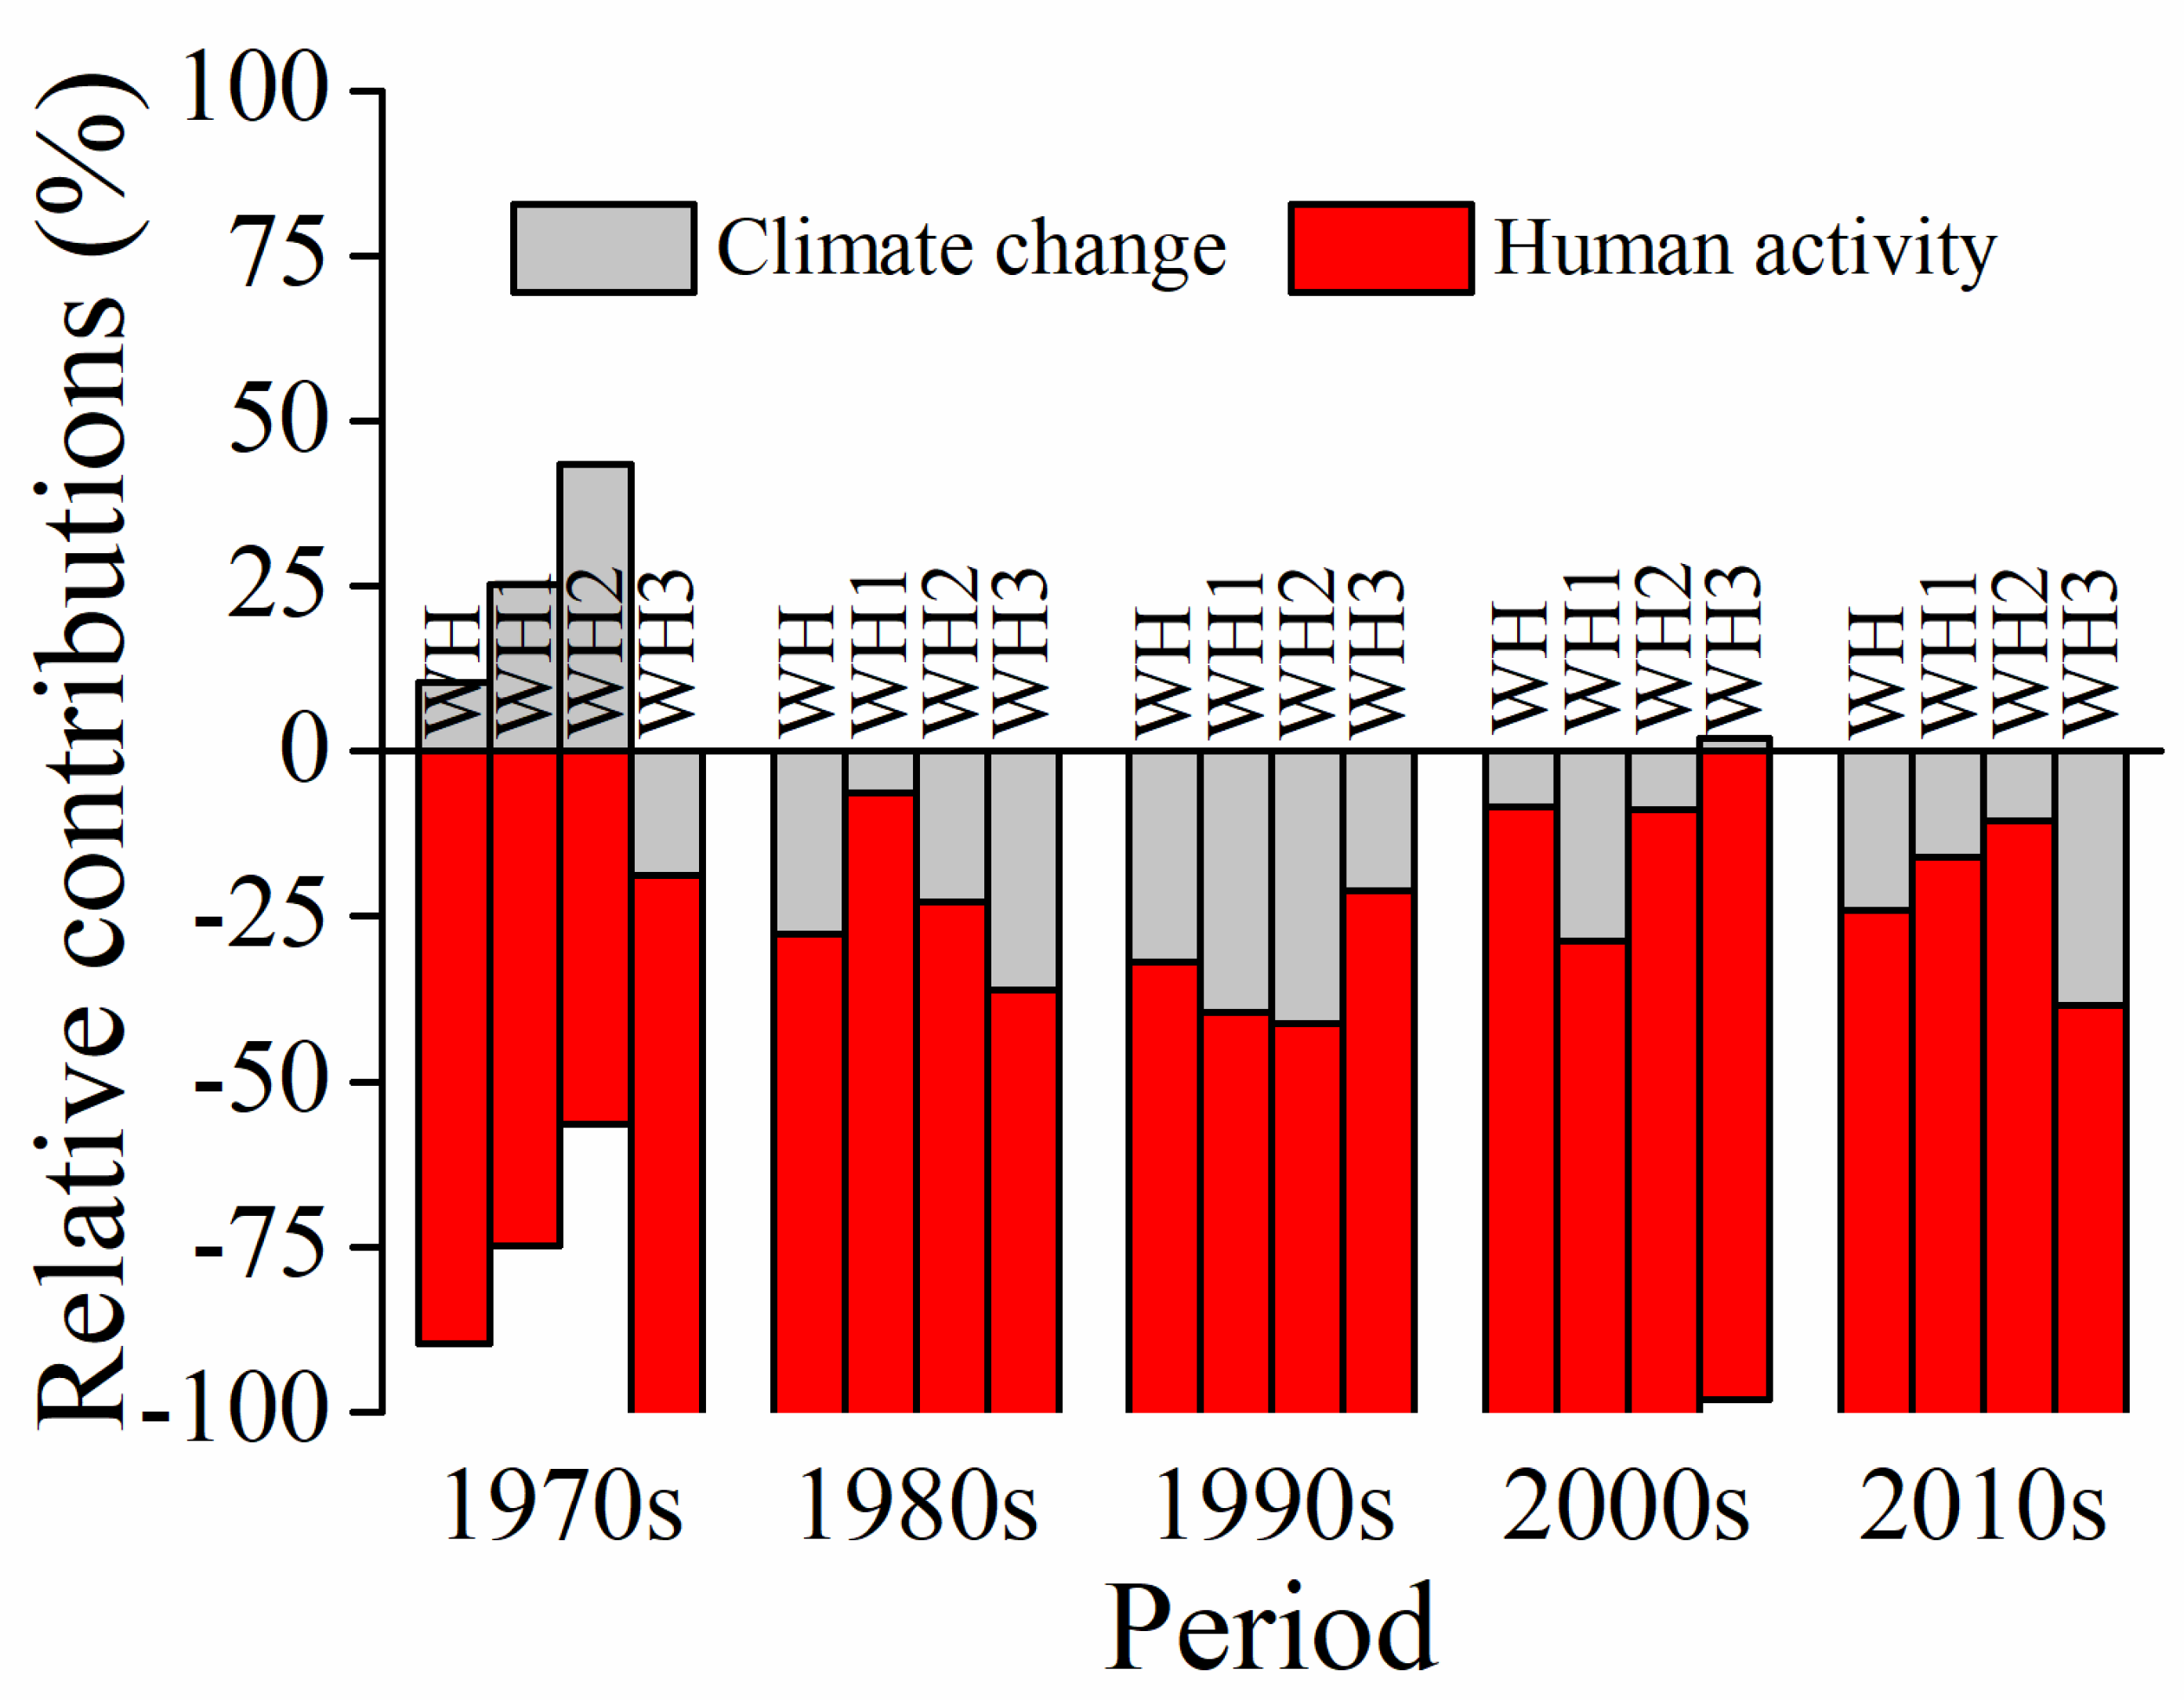
Based on the observed runoff and simulated runoff in two scenarios, the relative contribution of climate change and human activity to runoff variation for each period were quantified (Figure 12). The effect of climate change on runoff was positive to increase runoff in the 1970s, except WH3, while it was going to be negative in the following period, except WH3 with a fairly small increase (0.57 × 10⁸ m3, 1.92%) in the 2000s. To some extent, a positive effect of climate change on runoff can effectively alleviate the decrease of runoff caused by human activity, while a negative effect will exacerbate runoff reduction combined with human water consumption. Human activity was detected to be the dominant factor with the relative contribution well above −50%, ranging from −67.99% (1990s) to −91.56% (2010s), which indicated a greater effect to accounted for runoff decline than climate change in WH. The relative contribution of climate change in the 1990s was the greatest and that of all the three sub-regions exceeded −21%, especially WH2 (−41.15%) and WH1 (−39.60%), which could be an important reason to result in the lowest runoff during the five periods. The climate-induced runoff reduction of WH was comparable in the 1990s and 2010s, but the relative contribution in the 2010s was lower with a drop of 7.9% due to the increased human-induced runoff reduction. Varying intensity of climate change and human activity accounted for the obvious differences in relative contribution to runoff variation of the sub-regions and periods.
5. Discussion
5.1. Impact of Climate Change
Studies have confirmed that global climate change intensifies the hydrological cycle, precipitation is a dominant factor governing the change of runoff that will directly determine the amount of runoff, and temperature could affect runoff indirectly by increasing or decreasing the evapotranspiration [11,13,47,48]. Among all the meteorological variables, precipitation was the main driving factor of runoff variation, while temperature and potential evapotranspiration showed negative correlations with runoff. In general, the climate of the WH exhibited an obvious warming and drying trend with a decrease in precipitation and an increase in temperature and potential evapotranspiration. However, climate changes during each period were different, which resulted in the effects of different intensities on runoff. Many other studies investigated the impact of climate change on runoff by comparing the runoff of the study period and control period. This may only explain the impact of climate change and human activity on inducing the difference of runoff between two periods, rather than the impact on runoff variation for each period. In this study, we divided the study period by 10 years and quantified the impact of climate change over time; the climate-induced runoff variation was 0.24, −0.98, −1.84, −0.53, and −1.82 km3 during the five periods. The relative contribution, ranging from −32.01% to 10.38%, was smaller than human activity but likely to aggravate or relieve the human-induced runoff variation. This was expected to clarify how and to what extent the climate change influences the runoff for each period, rather than the variation between the study period and control period.
5.2. Impact of Human Activity
The impact of human activity on runoff mainly comes from two aspects. The first one is changes in land surface characteristics induced by ecological restoration projects; soil and water conservation measures, including afforestation, pasture reestablishment, terraces, and check dams have been implemented since the 1950s to reduce soil erosion and improve the eco-environment [3,27,49]. A large reforestation campaign, called the Grain for Green (GFG) project, was launched in 1999, which involved returning steep croplands to forest and pasture lands [22,50]. Both of these have resulted in extensive changes in vegetation, soil, and terrain. The effects of vegetation on runoff are influenced by the structure and function of vegetation [51,52]. Changes in diversity levels, vertical structures, and pattern distributions of vegetation have a great influence on the generation of runoff [18]. Besides, the role of dams in reducing runoff is not only reflected in the change of vegetation but also that dams can effectively intercept precipitation and convert more precipitation into soil infiltration [7]. Many studies have confirmed that the change of vegetation on the Loess Plateau, especially since the implementation of GFG, resulted in a significant decrease in runoff [5,8,53,54]. Our study found that the land use/cover change of WH varies over time but mainly presented the transformation from farmland to woodland and grassland for most periods. Moreover, a significant increasing trend of NDVI and LAI was detected in WH, WH1, and WH2, which reflects the improvement of the vegetation conditions, both in quantity and structure. This can effectively reduce the generation of surface runoff by increasing the canopy interception, soil regulation effect, and soil moisture capacity, especially in the Loess Plateau, which has heavy rainfall and most of the precipitation is concentrated [4].
The second one is direct human intervention (i.e., water transfer projects, irrigation, and reservoir storage). Regional population and economic development depend heavily to a large extent on the supply of river water resources, especially for arid areas. With the increase in population, industry, and farmland area, an increasing number of irrigation schemes and hydraulic structures have been built, and these water projects have resulted in spatial and temporal changes in the quantity and quality of water in rivers, especially in some overpopulated areas [55]. Since 1949, there have been approximately 130 reservoirs built in the Weihe River basin with total storage capacity of 1.67 billion m3 [19]. The amount of surface water withdrawal has been increasing rapidly. According to statistics from the Yellow River Conservancy Commission (YRCC), the withdrawal water of region between Toudaoguai and Longmen station from the Yellow River increased from 1.04 billion m3 in 2000 to 1.92 billion m3 in 2012, having nearly doubled in 10 years [56]. Since 1978, China’s land reform has motivated farmers to increase agricultural production, while increased agricultural activity directly leads to an obvious increase in agricultural water use. The hyper-irrigation area using water taken from the Weihe River was approximately 9500 km2 in 2008 [19], which directly reduced the regional discharge due to water consumption by irrigation fields. Both the population (POP) and gross domestic product (GDP) (obtained from RESDC) in WH showed significant increases in the past 20 years (Figure S3), which meant greater consumption of water resources for human society. The Baojixia Canal, Jinghui Canal, and Weihui Canal are the three main diversion canals in the WH, and the mean annual water withdrawal from these three diversion canals during the recent decades were 0.51, 0.41, and 0.45 km3, with no obvious trend, accounting for a large proportion of the runoff of WHR, which could be an important reason for the decline of runoff. However, the reason for the continuous downward trend of runoff called for more comprehensive and in-depth studies. Several studies concluded that runoff has been decreasing since the 1970s due to human activity in the Weihe River [9,10,11,12,19]. In this study, human activity was detected to be a negative effect on runoff for all the study area and periods, inducing runoff of WH decreased by 2.07, 2.55, 3.91, 5.78, and 5.72 km3 during the five periods. The impact of human activity on runoff was gradually strengthening, indicating more water consumption of runoff by humans. The increasing trends of human-induced runoff reduction in WH1 and WH2 were much higher than that of WH3, which may be because there was less precipitation with uneven spatial distribution in WH1 and WH2 and the runoff was the main water resource for industry and agriculture for many areas with increasing human water withdrawal over time.
5.3. Limitations and Further Scope
With climate change and human activity, China has faced an increasingly severe problem of water resources, especially in water-limited regions. Compared to the other studies on the Weihe River, this study gave a comprehensive understanding of the time-varying variability of runoff, relationships between runoff and meteorological variables, and how climate change and human activity induced runoff variations during each period.
The uncertainties of this study mainly come from two factors, i.e., meteorological forcing data and parameters. Though we selected as many stations as possible to ensure the accuracy of meteorological data, uncertainties were inevitably introduced in the interpolation from point to face, especially for wind speed, which has great and unpredictable variability in both time and space [31,57]. Limited by model and methods, this study can only distinguish the impact of climate change and human activity on runoff, but cannot further distinguish different kinds of human disturbance, such as vegetation restoration projects, water conservancy projects, and water withdrawal for humans, which could be a great pity. It is especially quite difficult to distinguish and quantify the impact of soil and water conservation engineering measures and vegetation changes on runoff at the regional scale. Besides, scenario simulation methods were widely used to investigate the effect of climate change and human activity on hydrological processes by changing one factor while keeping another fixed, which was based on the assumption that they are independent. However, climate conditions and land cover were always closely connected, including feedback and response [27,31]. Yang [32] found that the sum of variations in the hydrological variable induced by climate change and land cover change was not equal to that induced by the co-effect, which further proved that this was not a simple addition relationship between the effects of these two factors. Therefore, the scenario simulations unavoidably split this link and interaction, and inevitably introduce a certain bias in quantifying the variation in runoff induced by climate change and human activity. Improvement of the VIC model by coupling dynamic vegetation processes in a changing climate background would be favorable to remedy these issues.
6. Conclusions
In this study, we investigated the reduction of runoff in the Weihe River basin and quantified the relative contribution of climate change and human activity, based on long-term runoff observations and simulated runoff by employing the VIC model coupled with scenarios. In a warming and drying climate with a changing rate of 0.027 °C·year−1 and −0.13 mm·year−1 of temperature and precipitation, runoff of the WH showed a significant decrease trend at an average rate of −1.01 × 10⁸ m3·year−1 (), but with obvious stage characteristics during 1961–2016. The runoff declines in the three sub-regions were varying in the order of WH2 (−0.45 × 10⁸ m3·year−1) > WH3 (−0.32 × 10⁸ m3·year−1) > WH1 (−0.24 × 10⁸ m3·year−1). Runoff had a good correlation with precipitation, except in the late 1990s to early 2000s, but a relatively poor correlation with potential evapotranspiration. The mean annual runoff coefficient, ranging from 0.0376 (1995) to 0.2411 (1964), showed a significant downward trend at a rate of −0.0017 year−1 () and an obvious decline after the change-point, especially WH2 (−0.072) and WH3 (−0.064). The water yield of WH was highest in the 1960s (0.1765) and exhibited different degrees of decline in the following decades, which resulted in a decrease of available freshwater resources in the runoff by 36.66%, 22.38%, 58.24%, 51.95%, and 20.54%, respectively. Human activity had a dominant contribution to increasing runoff decline from 20.68 × 10⁸ m3 (1970s) to 57.76 × 10⁸ m3 (2000s), while the effect of climate change varied with time, which decreased runoff for most of the study period except in the 1970s with a fairly small positive effect to increase runoff. Different intensities of climate change and human activity accounted for the obvious differences in relative contribution to runoff variation of the sub-regions and periods, which highlighted the importance of appropriate human intervention with respect to climate change and reminded that not only the relative contribution should be taken into consideration, but also the degree of absolute effect on runoff variation. The results are meaningful as a further reference for watershed management of WHR in the context of climate change to ensure the security of water resources.
Supplementary Materials
The following are available online at https://www.mdpi.com/2073-4441/12/5/1416/s1. Figure S1. Spatial distribution of multi-year average (a) precipitation, (b) temperature, (c) potential evapotranspiration, (d) dryness, during 1961–2016. Figure S2. Percentage of the runoff over the three sub-regions to total runoff over the Weihe basin. Figure S3. Population (POP) and Gross Domestic Product (GDP) of the Weihe River basin and the three sub-regions since 1990. Table S1. Variability of four meteorological variables over the Weihe River basin for different periods.
Author Contributions
Conceptualization, S.Y. and Y.G.; Methodology, S.Y., Z.W., and J.B.; Software, S.Y., Z.W., J.B., and T.K.; Validation, Y.G.; Formal Analysis, S.Y.; Investigation, S.Y., J.C., and Y.G.; Resources, S.Y., Z.W., and Y.G.; Data Curation, Y.G.; Writing—Original Draft Preparation, S.Y.; Writing—Review and Editing, S.Y., T.K., J.B., J.C., and Y.G.; Visualization, S.Y. and J.B.; Supervision, Y.G.; Project Administration, Y.G.; Funding Acquisition, Y.G. All authors have read and agreed to the published version of the manuscript.
Funding
This research was financially supported by the National Key Project for Research and Development of China (No. 2016YFC0501605).
Acknowledgments
We would like to express our heartfelt gratitude to the academic editor and three anonymous reviewers for the efficient and meticulous work, and precious suggestions which made great contribution to substantially improve this paper.
Conflicts of Interest
The authors declare no conflict of interest.
References
- Farley, K.A.; Jobbágy, E.G.; Jackson, R.B. Effects of afforestation on water yield: A global synthesis with implications for policy. Glob. Chang. Boil. 2005, 11, 1565–1576. [Google Scholar] [CrossRef]
- Wu, Y.; Liu, S.; Sohl, T.L.; Young, C.J. Projecting the land cover change and its environmental impacts in the Cedar River Basin in the Midwestern United States. Environ. Res. Lett. 2013, 8, 024025. [Google Scholar] [CrossRef]
- Zhang, X.; Zhang, L.; Zhao, J.; Rustomji, P.; Hairsine, P. Responses of streamflow to changes in climate and land use/cover in the Loess Plateau, China. Water Resour. Res. 2008, 44. [Google Scholar] [CrossRef]
- Wang, J.; Hong, Y.; Gourley, J.J.; Adhikari, P.; Li, L.; Su, F. Quantitative assessment of climate change and human impacts on long-term hydrologic response: A case study in a sub-basin of the Yellow River, China. Int. J. Clim. 2009, 30, 2130–2137. [Google Scholar] [CrossRef]
- Zhao, G.; Tian, P.; Mu, X.; Jiao, J.; Wang, F.; Gao, P. Quantifying the impact of climate variability and human activities on streamflow in the middle reaches of the Yellow River basin, China. J. Hydrol. 2014, 519, 387–398. [Google Scholar] [CrossRef]
- Gao, P.; Jiang, G.; Wei, Y.; Mu, X.; Wang, F.; Zhao, G.; Sun, W. Streamflow regimes of the Yanhe River under climate and land use change, Loess Plateau, China. Hydrol. Process. 2014, 29, 2402–2413. [Google Scholar] [CrossRef]
- Feng, X.; Cheng, W.; Fu, B.; Lü, Y. The role of climatic and anthropogenic stresses on long-term runoff reduction from the Loess Plateau, China. Sci. Total. Environ. 2016, 571, 688–698. [Google Scholar] [CrossRef]
- Feng, X.; Fu, B.; Piao, S.; Wang, S.; Ciais, P.; Zeng, Z.; Lü, Y.; Zeng, Y.; Li, Y.; Jiang, X.; et al. Revegetation in China’s Loess Plateau is approaching sustainable water resource limits. Nat. Clim. Chang. 2016, 6, 1019–1022. [Google Scholar] [CrossRef]
- Du, J.; Shi, C.-X. Effects of climatic factors and human activities on runoff of the Weihe River in recent decades. Quat. Int. 2012, 282, 58–65. [Google Scholar] [CrossRef]
- Chang, J.; Li, Y.; Wei, J.; Wang, Y.; Guo, A. Dynamic changes of sediment load and water discharge in the Weihe River, China. Environ. Earth Sci. 2016, 75. [Google Scholar] [CrossRef]
- Li, Y.; Chang, J.; Wang, Y.; Jin, W.; Guo, A. Spatiotemporal Impacts of Climate, Land Cover Change and Direct Human Activities on Runoff Variations in the Wei River Basin, China. Water 2016, 8, 220. [Google Scholar] [CrossRef] [Green Version]
- Ji, L.; Duan, K. What is the main driving force of hydrological cycle variations in the semiarid and semi-humid Weihe River Basin, China? Sci. Total. Environ. 2019, 684, 254–264. [Google Scholar] [CrossRef] [PubMed]
- Chien, H.; Yeh, P.J.-F.; Knouft, J.H. Modeling the potential impacts of climate change on streamflow in agricultural watersheds of the Midwestern United States. J. Hydrol. 2013, 491, 73–88. [Google Scholar] [CrossRef]
- Zhao, Y.; Zou, X.; Gao, J.; Xu, X.; Wang, C.; Tang, D.; Wang, T.; Wu, X. Quantifying the anthropogenic and climatic contributions to changes in water discharge and sediment load into the sea: A case study of the Yangtze River, China. Sci. Total. Environ. 2015, 536, 803–812. [Google Scholar] [CrossRef]
- Zhai, R.; Tao, F. Contributions of climate change and human activities to runoff change in seven typical catchments across China. Sci. Total. Environ. 2017, 605, 219–229. [Google Scholar] [CrossRef]
- Wang, D.; Hejazi, M. Quantifying the relative contribution of the climate and direct human impacts on mean annual streamflow in the contiguous United States. Water Resour. Res. 2011, 47, 47. [Google Scholar] [CrossRef] [Green Version]
- Xu, X.; Yang, D.; Yang, H.; Lei, H. Attribution analysis based on the Budyko hypothesis for detecting the dominant cause of runoff decline in Haihe basin. J. Hydrol. 2014, 510, 530–540. [Google Scholar] [CrossRef]
- Liu, J.; Gao, G.; Wang, S.; Jiao, L.; Wu, X.; Fu, B. The effects of vegetation on runoff and soil loss: Multidimensional structure analysis and scale characteristics. J. Geogr. Sci. 2017, 28, 59–78. [Google Scholar] [CrossRef] [Green Version]
- Chang, J.; Wang, Y.; Istanbulluoglu, E.; Bai, T.; Huang, Q.; Yang, D.; Huang, S. Impact of climate change and human activities on runoff in the Weihe River Basin, China. Quat. Int. 2015, 380, 169–179. [Google Scholar] [CrossRef]
- Mu, X.; Zhang, L.; McVicar, T.R.; Chille, B.; Gau, P. Analysis of the impact of conservation measures on stream flow regime in catchments of the Loess Plateau, China. Hydrol. Process. 2007, 21, 2124–2134. [Google Scholar] [CrossRef]
- Li, Z.; Liu, W.; Zhang, X.J.; Zheng, F.-L. Impacts of land use change and climate variability on hydrology in an agricultural catchment on the Loess Plateau of China. J. Hydrol. 2009, 377, 35–42. [Google Scholar] [CrossRef]
- Feng, X.M.; Sun, G.; Fu, B.J.; Su, C.H.; Liu, Y.; Lamparski, H. Regional effects of vegetation restoration on water yield across the Loess Plateau, China. Hydrol. Earth Syst. Sci. 2012, 16, 2617–2628. [Google Scholar] [CrossRef] [Green Version]
- Gao, Z.; Zhang, L.; Zhang, X.; Cheng, L.; Potter, N.; Cowan, T.; Cai, W. Long-term streamflow trends in the middle reaches of the Yellow River Basin: Detecting drivers of change. Hydrol. Process. 2015, 30, 1315–1329. [Google Scholar] [CrossRef]
- Fu, G.; Charles, S.P.; Chiew, F.H.S. A two-parameter climate elasticity of streamflow index to assess climate change effects on annual streamflow. Water Resour. Res. 2007, 43. [Google Scholar] [CrossRef]
- McVicar, T.R.; Li, L.T.; Van Niel, T.G.; Zhang, L.; Li, R.; Yang, Q.K.; Zhang, X.P.; Mu, X.M.; Wen, Z.M.; Liu, W.Z.; et al. Developing a decision support tool for China’s re-vegetation program: Simulating regional impacts of afforestation on average annual streamflow in the Loess Plateau. For. Ecol. Manag. 2007, 251, 65–81. [Google Scholar] [CrossRef]
- Wang, S.; Zhang, Z.; McVicar, T.R.; Guo, J.; Tang, Y.; Yao, A. Isolating the impacts of climate change and land use change on decadal streamflow variation: Assessing three complementary approaches. J. Hydrol. 2013, 507, 63–74. [Google Scholar] [CrossRef]
- Gao, G.; Fu, B.; Wang, S.; Liang, W.; Jiang, X. Determining the hydrological responses to climate variability and land use/cover change in the Loess Plateau with the Budyko framework. Sci. Total. Environ. 2016, 557, 331–342. [Google Scholar] [CrossRef]
- Renner, M.; Bernhofer, C. Applying simple water-energy balance frameworks to predict the climate sensitivity of streamflow over the continental United States. Hydrol. Earth Syst. Sci. 2012, 16, 2531–2546. [Google Scholar] [CrossRef] [Green Version]
- Wang, X. Advances in separating effects of climate variability and human activity on stream discharge: An overview. Adv. Water Resour. 2014, 71, 209–218. [Google Scholar] [CrossRef]
- Wang, G.; Zhang, J.; Yang, Q. Attribution of Runoff Change for the Xinshui River Catchment on the Loess Plateau of China in a Changing Environment. Water 2016, 8, 267. [Google Scholar] [CrossRef] [Green Version]
- Xie, X.; Liang, S.; Yao, Y.; Jia, K.; Meng, S.; Li, J. Detection and attribution of changes in hydrological cycle over the Three-North region of China: Climate change versus afforestation effect. Agric. For. Meteorol. 2015, 203, 74–87. [Google Scholar] [CrossRef]
- Yang, S.; Kang, T.; Bu, J.; Chen, J.; Gao, Y. Evaluating the Impacts of Climate Change and Vegetation Restoration on the Hydrological Cycle over the Loess Plateau, China. Water 2019, 11, 2241. [Google Scholar] [CrossRef] [Green Version]
- Xie, Z.; Yuan, F.; Duan, Q.; Zheng, J.; Liang, M.; Chen, F. Regional Parameter Estimation of the VIC Land Surface Model: Methodology and Application to River Basins in China. J. Hydrometeorol. 2007, 8, 447–468. [Google Scholar] [CrossRef] [Green Version]
- Tang, Q.; Oki, T.; Kanae, S.; Hu, H. Hydrological Cycles Change in the Yellow River Basin during the Last Half of the Twentieth Century. J. Clim. 2008, 21, 1790–1806. [Google Scholar] [CrossRef] [Green Version]
- Saxton, K.E.; Rawls, W.J. Soil Water Characteristic Estimates by Texture and Organic Matter for Hydrologic Solutions. Soil Sci. Soc. Am. J. 2006, 70, 1569–1578. [Google Scholar] [CrossRef] [Green Version]
- Tian, Y.; Zhang, Y.; Knyazikhin, Y.; Myneni, R.; Glassy, J.M.; Dedieu, G.; Running, S.W. Prototyping of MODIS LAI and FPAR algorithm with LASUR and LANDSAT data. IEEE Trans. Geosci. Remote Sens. 2000, 38, 2387–2401. [Google Scholar] [CrossRef] [Green Version]
- Zhu, Z.; Bi, J.; Pan, Y.; Ganguly, S.; Anav, A.; Xu, L.; Samanta, A.; Piao, S.L.; Nemani, R.; Myneni, R. Global Data Sets of Vegetation Leaf Area Index (LAI)3g and Fraction of Photosynthetically Active Radiation (FPAR)3g Derived from Global Inventory Modeling and Mapping Studies (GIMMS) Normalized Difference Vegetation Index (NDVI3g) for the Period 1981 to 2011. Remote Sens. 2013, 5, 927–948. [Google Scholar] [CrossRef] [Green Version]
- Liang, X.; Lettenmaier, D.P.; Wood, E.F.; Burges, S.J. A simple hydrologically based model of land surface water and energy fluxes for general circulation models. J. Geophys. Res. Space Phys. 1994, 99, 14415. [Google Scholar] [CrossRef]
- Liang, X.; Wood, E.F.; Lettenmaier, D.P. Surface soil moisture parameterization of the VIC-2L model: Evaluation and modification. Glob. Planet. Chang. 1996, 13, 195–206. [Google Scholar] [CrossRef]
- Liang, X.; Xie, Z. A new surface runoff parameterization with subgrid-scale soil heterogeneity for land surface models. Adv. Water Resour. 2001, 24, 1173–1193. [Google Scholar] [CrossRef]
- Nijssen, B.; Schnur, R.; Lettenmaier, D.P. Global Retrospective Estimation of Soil Moisture Using the Variable Infiltration Capacity Land Surface Model, 1980–1993. J. Clim. 2001, 14, 1790–1808. [Google Scholar] [CrossRef]
- Xie, Z.H.; Liu, Q.; Su, F.G. An Application of the VIC-3L Land Surface Model with the New Surface Runoff Model in Simulating Streamflow for the Yellow River Basin. In GIS and Remote Sensing in Hydrology, Water Resources and Environment; Chen, Y.B., Ed.; International Assn of Hydrological Sciences: Wallingford, UK, 2004; pp. 241–248. [Google Scholar]
- Lohmann, D.; NolteHolube, R.; Raschke, E. A large-scale horizontal routing model to be coupled to land surface parametrization schemes. Tellus Ser. a-Dyn. Meteorol. Oceanogr. 1996, 48, 708–721. [Google Scholar] [CrossRef]
- Piao, S.; Nan, H.; Huntingford, C.; Ciais, P.; Friedlingstein, P.; Sitch, S.; Peng, S.; Ahlström, A.; Canadell, J.G.; Cong, N.; et al. Evidence for a weakening relationship between interannual temperature variability and northern vegetation activity. Nat. Commun. 2014, 5, 5018. [Google Scholar] [CrossRef] [PubMed] [Green Version]
- Sun, W.; Song, X.; Mu, X.; Gao, P.; Wang, F.; Zhao, G. Spatiotemporal vegetation cover variations associated with climate change and ecological restoration in the Loess Plateau. Agric. For. Meteorol. 2015, 209, 87–99. [Google Scholar] [CrossRef]
- Jin, Z.; Liang, W.; Yang, Y.; Zhang, W.; Yan, J.; Chen, X.; Li, S.; Mo, X. Separating Vegetation Greening and Climate Change Controls on Evapotranspiration trend over the Loess Plateau. Sci. Rep. 2017, 7, 8191. [Google Scholar] [CrossRef]
- Huntington, T. Evidence for intensification of the global water cycle: Review and synthesis. J. Hydrol. 2006, 319, 83–95. [Google Scholar] [CrossRef]
- Milliman, J.D.; Farnsworth, K.; Jones, P.; Xu, K.; Smith, L. Climatic and anthropogenic factors affecting river discharge to the global ocean, 1951–2000. Glob. Planet. Chang. 2008, 62, 187–194. [Google Scholar] [CrossRef]
- Wang, F.; Mu, X.; Li, R.; Fleskens, L.; Stringer, L.C.; Ritsema, C.J. Co-evolution of soil and water conservation policy and human–environment linkages in the Yellow River Basin since 1949. Sci. Total. Environ. 2015, 508, 166–177. [Google Scholar] [CrossRef] [Green Version]
- Fu, B.; Wang, S.; Liu, Y.; Liu, J.; Liang, W.; Miao, C. Hydrogeomorphic Ecosystem Responses to Natural and Anthropogenic Changes in the Loess Plateau of China. Annu. Rev. Earth Planet. Sci. 2017, 45, 223–243. [Google Scholar] [CrossRef]
- Bautista, S.; Mayor, A.G.; Bourakhouadar, J.; Bellot, J. Plant Spatial Pattern Predicts Hillslope Runoff and Erosion in a Semiarid Mediterranean Landscape. Ecosystems 2007, 10, 987–998. [Google Scholar] [CrossRef] [Green Version]
- Zhu, H.; Fu, B.; Wang, S.; Zhu, L.; Zhang, L.; Jiao, L.; Wang, C. Reducing soil erosion by improving community functional diversity in semi-arid grasslands. J. Appl. Ecol. 2015, 52, 1063–1072. [Google Scholar] [CrossRef]
- Huang, S.; Huang, Q.; Chen, Y. Quantitative estimation on contributions of climate changes and human activities to decreasing runoff in Weihe River Basin, China. Chin. Geogr. Sci. 2015, 25, 569–581. [Google Scholar] [CrossRef]
- Zuo, D.; Xu, Z.; Yao, W.; Jin, S.; Xiao, P.; Ran, D. Assessing the effects of changes in land use and climate on runoff and sediment yields from a watershed in the Loess Plateau of China. Sci. Total. Environ. 2016, 544, 238–250. [Google Scholar] [CrossRef] [PubMed]
- Bu, J.; Lu, C.X.; Niu, J.; Gao, Y. Attribution of Runoff Reduction in the Juma River Basin to Climate Variation, Direct Human Intervention, and Land Use Change. Water 2018, 10, 1775. [Google Scholar] [CrossRef] [Green Version]
- Li, S.; Liang, W.; Fu, B.J.; Lu, Y.H.; Fu, S.Y.; Wang, S.; Su, H.M. Vegetation changes in recent large-scale ecological restoration projects and subsequent impact on water resources in China’s Loess Plateau. Sci. Total Environ. 2016, 569, 1032–1039. [Google Scholar] [CrossRef]
- Zhang, X.-J.; Tang, Q.; Pan, M.; Tang, Y. A Long-Term Land Surface Hydrologic Fluxes and States Dataset for China. J. Hydrometeorol. 2014, 15, 2067–2084. [Google Scholar] [CrossRef]
Figure 1.
The Weihe River basin.

Figure 2.
Monthly simulated streamflow against observed streamflow of Huaxian station for the calibration period (1962–1969) and validation period (1970–1976).
Figure 2.
Monthly simulated streamflow against observed streamflow of Huaxian station for the calibration period (1962–1969) and validation period (1970–1976).

Figure 3.
Temporal variations of annual precipitation, temperature, potential evapotranspiration, and the dryness index over the Weihe River basin during 1961–2016.
Figure 3.
Temporal variations of annual precipitation, temperature, potential evapotranspiration, and the dryness index over the Weihe River basin during 1961–2016.

Figure 4.
Spatial distribution of trends of four meteorological variables, (a) precipitation, (b) temperature, (c) potential evapotranspiration, (d) dryness, during 1961–2016.
Figure 4.
Spatial distribution of trends of four meteorological variables, (a) precipitation, (b) temperature, (c) potential evapotranspiration, (d) dryness, during 1961–2016.

Figure 5.
Change percentage of six land use/cover types over the Weihe River basin and the three sub-regions for each decade during the last 50 years.
Figure 5.
Change percentage of six land use/cover types over the Weihe River basin and the three sub-regions for each decade during the last 50 years.

Figure 6.
Annual mean satellite-estimated normalized difference vegetation index (NDVI) and leaf area index (LAI) over (a) the Weihe River basin (WH) and the three sub-regions, i.e., (b) WH1, (c) WH2, and (d) WH3, from 1982 to 2015. (* and ** represent and , respectively.)
Figure 6.
Annual mean satellite-estimated normalized difference vegetation index (NDVI) and leaf area index (LAI) over (a) the Weihe River basin (WH) and the three sub-regions, i.e., (b) WH1, (c) WH2, and (d) WH3, from 1982 to 2015. (* and ** represent and , respectively.)

Figure 7.
Ut statistic of Pettitt test used for detecting a change-point for annual runoff of (a) the Weihe River basin (WH) and the three sub-regions, i.e., (b) WH1, (c) WH2, and (d) WH3.
Figure 7.
Ut statistic of Pettitt test used for detecting a change-point for annual runoff of (a) the Weihe River basin (WH) and the three sub-regions, i.e., (b) WH1, (c) WH2, and (d) WH3.

Figure 8.
(a–d) Temporal variation of runoff and (e–h) partial correlation coefficient between runoff and precipitation, potential evapotranspiration during 1961–2016 over the WH, WH1, WH2, and WH3, respectively. In a-d, the blue line with dots shows the runoff series, the gray dashed line is the five-year moving average of runoff, the black line and red bar are the trend of runoff over the whole study period and a moving time window of nine years, respectively, where the solid means the runoff trend at the significance level p < 0.05 and the hollow indicates the runoff trend is not significant. The positive values of the runoff trend refer to an increase in runoff during the moving time window, while the negative values refer to a decline. In e-h, the blue line with squares and the red line with circles showed the partial correlation coefficient between runoff and precipitation, potential evapotranspiration, respectively, where the solid indicates a significant correlation and the hollow indicates no significant correlation exists.

Figure 9.
The time series of the runoff coefficient (runoff/precipitation) of Weihe River.

Figure 10.
Change of the runoff ratio of (a) the Weihe River basin (WH) and the three sub-regions, i.e. (b) WH1, (c) WH2, and (d) WH3, in each decade during 1961–2016 (with the fitted line shown in different colors); the red bars are the decline ratio of freshwater in runoff of each decade compared with that of the 1960s. Precipitation and runoff are accumulated as percentages of the total values during the study period.

Figure 11.
Annual runoff of (a) the Weihe River basin (WH) and the three sub-regions, i.e., (b) WH1, (c) WH2, and (d) WH3, in the three scenarios for each decade since the 1960s.
Figure 11.
Annual runoff of (a) the Weihe River basin (WH) and the three sub-regions, i.e., (b) WH1, (c) WH2, and (d) WH3, in the three scenarios for each decade since the 1960s.

Figure 12.
Relative contributions of climate change and human activity on runoff variation of the Weihe River basin and the three sub-regions in each decade since the 1970s.
Figure 12.
Relative contributions of climate change and human activity on runoff variation of the Weihe River basin and the three sub-regions in each decade since the 1970s.


Table 1.
Information on the three sub-regions investigated in this study.
| Catchment | River | Gauge Station | Longitude | Latitude | Area(km2) |
|---|---|---|---|---|---|
| WH1 | Jinghe | Zhangjiashan | 108°36′ | 34°38′ | 43,216 |
| WH2 | Upper reach | Linjiacun | 107°03′ | 34°23′ | 30,661 |
| WH3 | Middle and lower reaches | Huaxian | 109°46′ | 34°35′ | 32,621 |
Table 2.
Experiment design and simulation scenarios used to detect the impact of climate change and human activity.
Table 2.
Experiment design and simulation scenarios used to detect the impact of climate change and human activity.
| Scenario | Vegetation Parameter | Forcing Data | Impacts |
|---|---|---|---|
| S0: Observed runoff (R0) | / | / | Climate change and human activity |
| S1: Simulated runoff (R1) | Maryland Land Cover 1 km | actual | Climate change |
| S2: Simulated runoff (R2) | Maryland Land Cover 1 km | detrended | None |
Table 3.
Variabilities of runoff before and after change-point.
| Basin | Mean (108 m3) | Trend (108 m3·year−1) | Variation (108 m3) | Rate (%) | ||
|---|---|---|---|---|---|---|
| Before | After | Before | After | |||
| WH | 77.52 | 44.85 | −0.9882 | 0.8175 * | −32.68 | −42.15 |
| WH1 | 14.72 | 7.61 | −0.1250 | −0.3619 ** | −7.12 | −48.34 |
| WH2 | 21.89 | 9.19 | −0.5015 ** | −0.0386 | −12. 71 | −58.04 |
| WH3 | 42.09 | 27.42 | −0.1919 | 0.9414 ** | −14.67 | −34.84 |
* and ** represent and , respectively.
© 2020 by the authors. Licensee MDPI, Basel, Switzerland. This article is an open access article distributed under the terms and conditions of the Creative Commons Attribution (CC BY) license (http://creativecommons.org/licenses/by/4.0/).
Share and Cite
MDPI and ACS Style
Yang, S.; Kang, T.; Bu, J.; Chen, J.; Wang, Z.; Gao, Y. Detection and Attribution of Runoff Reduction of Weihe River over Different Periods during 1961–2016. Water 2020, 12, 1416. https://doi.org/10.3390/w12051416
AMA Style
Yang S, Kang T, Bu J, Chen J, Wang Z, Gao Y. Detection and Attribution of Runoff Reduction of Weihe River over Different Periods during 1961–2016. Water. 2020; 12(5):1416. https://doi.org/10.3390/w12051416
Chicago/Turabian StyleYang, Shuai, Tingting Kang, Jingyi Bu, Jiahao Chen, Zhipeng Wang, and Yanchun Gao. 2020. "Detection and Attribution of Runoff Reduction of Weihe River over Different Periods during 1961–2016" Water 12, no. 5: 1416. https://doi.org/10.3390/w12051416
Note that from the first issue of 2016, this journal uses article numbers instead of page numbers. See further details here.