Modelling the Temporal Dynamics of Groundwater Pollution Risks at the African Scale


1
Ecole Supérieur d’Ingénieurs de Fada (ESI-Fada), Université de Fada N’Gourma, Fada N’Gourma BP 54, Burkina Faso
2
Earth and Life Institute, Université catholique de Louvain, Croix du Sud 2, Box 2, 1348 Louvain-la-Neuve, Belgium
3
Agrosphere (IBG-3), Institute of Bio- and Geosciences, Forschungszentrum Jülich GmbH, 52428 Jülich, Germany
*
Author to whom correspondence should be addressed.
Water 2020, 12(5), 1406; https://doi.org/10.3390/w12051406
Submission received: 17 April 2020
/
Revised: 7 May 2020
/
Accepted: 12 May 2020
/
Published: 15 May 2020
(This article belongs to the Section Water Quality and Contamination)
Abstract
:Groundwater pollution risk modelling is an important asset to improve groundwater management and protection. In this study, we assess the temporal dynamics of groundwater pollution risk at the continental scale, using the DRASTIC model. The approach was developed using continental-scale data on soil properties, topography, land use, geology, hydrogeology, and climate with a resolution of 15 × 15 km2. We compared continental-scale groundwater pollution risk for the years 1990, 2000, and 2010. The results showed significant inter-annual variations of the spatial distribution of pollution risk. Changes were mainly concentrated in the area of the Nile Delta, around the Lake Victoria, in North Africa, and in coastal West Africa (predominately in Nigeria). We found that the increase in pollution risk was mainly related to the increase in the population density in these regions. The proposed methodology for modelling the temporal dynamics of groundwater pollution risk could support the monitoring of the Sustainable Development Goal 6, which focus in particular on the preservation of the freshwater resources against future threats.
1. Introduction
While groundwater represents 15% of total renewable water resources in Africa, an estimated of 75% of the population relies on it as their main source of drinking water [1]. However, degradation of groundwater by overexploitation and contamination is a serious water resources problem in Africa [2,3]. Many unprotected groundwater resources are vulnerable to non-point source (NPS) contamination [4]. In such a context, a set of pollution risk assessment methods have been developed to estimate the potential for NPS groundwater pollution and to identify primary factors influencing the contamination level. According to Quevauviller [5], a key step in assessing pollution risks is based on the analysis of the groundwater vulnerability (i.e., ease with which groundwater may be contaminated). It provides a method for evaluating the sensitivity of groundwater to contamination and for providing scientifically defensible information for decision-makers. More than a hundred methods for assessing the vulnerability of groundwater pollution have been developed around the world [6]. Classically, these methodologies rely on a “static” hypothesis that groundwater pollution risk does not change significantly over time [7]. One of the traditional groundwater vulnerability models is the DRASTIC model [8,9]. The DRASTIC model has proven to be particularly useful for large-scale (regional to continental) assessments and has been applied all across the world to delineate vulnerability [10]. However, Honnungar [10] addressed the limitations that arise due to spatial and temporal variability of input (data and resolution), data processing methods (sampling and interpolation methods), subjectivity in assigning weights and ratings by decision-makers, non-integration of intrinsic and specific vulnerability, and non-linear relationships between the hydrogeological parameters. In addition to these limitations, groundwater vulnerability assessments inevitably lead to uncertainties [11]. Loague and Corwin [12] observed that assessments of groundwater vulnerability at the regional scale classically rely on soil, climate, and chemical data that are extremely sparse and uncertain. Murat et al. [13] also highlighted the complexity and subjectivity of the monitoring of uncertainty. However, to overcome some limitations of the DRASTIC method, the Analytic Hierarchy Process (AHP), a flexible and convenient multicriteria decision method proposed by Saaty [14], could be used to derive ratings and weights of the DRASTIC model parameters. Despite the limits of the DRASTIC model, Ouedraogo et al. [15] successfully applied it to map the pan-African groundwater pollution vulnerability.
Groundwater vulnerability and pollution risk are strongly dependent on climate [16]. As stated by Li and Merchant [17], a warming climate, for example, could alter the vulnerability of shallow aquifers by affecting depth of the water table and recharge [18,19,20]. Ducci [21] showed that patterns of regional groundwater pollution vulnerability vary between drought, average, and wet periods. In this regard, it is important to introduce the time component in the assessment of groundwater vulnerability and pollution risk.
In recent years, some studies have attempted to integrate the temporal dimension to investigate groundwater vulnerability evolution under varying environmental conditions and climate change [6,22,23,24,25,26,27,28]. For instance, Dennis and Dennis [23] introduced temporal dynamics in the DART (Depth to water-level change, Aquifer type (storativity), Recharge and Transmissivity) vulnerability method to investigate climate change impact on groundwater vulnerability for South-African aquifers. Stevenazzi et al. [26] focussed in their pollution risk assessment on the relation between temporal changes in groundwater contamination and land use. Others compared vulnerability maps elaborated for different years, which highlights the key factors in the aquifer vulnerability variation [6,29].
In this study, we assess the temporal dynamics of groundwater pollution risk at the scale of the African continent. In particular, we seek to develop a modelling approach to improve our understanding of the link between groundwater pollution risk and time-dependent drivers of this pollution risk such as land use. Accounting for the temporal dimension of groundwater pollution risk will facilitate the transfer of knowledge and information to decision-makers and is considered essential for the monitoring of groundwater systems, as for instance suggested in the Sustainable Development Goal (SDG) 6 monitoring strategy.
2. Material and Methods
2.1. Groundwater Vulnerability Modelling Framework
Regional-scale groundwater vulnerability assessment models based on multi-criteria decision-making (MCDM) approaches have been widely used to define intrinsic aquifer vulnerability [10]. A well-known MCDM approach for aquifer vulnerability delineation is the DRASTIC approach [9] put forth by the United States Environmental Protection Agency (USEPA). The Composite DRASTIC (CD) index, proposed by Secunda et al. [30], is an adaptation of the DRASTIC vulnerability index with the addition of a new parameter to define the risk associated with land use (L). In this study, we used a multiplicative approach to combine land use with DRASTIC and to assess pollution risk as in [31]. According to Baghapour et al. [32], this method allows achieving greater accuracy in the estimation of the nitrate pollution risk. The method uses the following equations to assess pollution risk:
where VI is the dimensionless DRASTIC Vulnerability Index; D (Depth to groundwater), R (Recharge), A (Aquifer type), S (Soil media), T (Topography), I (Impact of vadose zone) and C (hydraulic Conductivity) are the acronyms of the seven parameters contributing to groundwater vulnerability. Furthermore, subscripts r and w are the corresponding ratings and weights. In Equation (2), DVI is the Dynamic Vulnerability Index, which is dimensionless, and LU refers to the potential risk associated with land use. The higher the DVI, the greater the groundwater pollution risk. Each DRASTIC index parameter of Equation (1) was assigned ratings and a numerical weighting to reflect its relative importance in estimating groundwater pollution potential. According to Baghapour et al. [32], a relative numerical weight from 1 to 5 is given to each parameter, with numbers 1 and 5 representing the least and the most effective, respectively. Table 1 shows typical weights assigned to each parameter, following guidelines as given in the DRASTIC documentation [8]. We considered constant the weights for assessing the temporal dynamic pollution risk as mentioned by Ehteshami et al. [33]. Table 2 shows for each DVI parameter the designated rating and the corresponding factor ranges. They vary from 1 to 10, with higher values describing greater pollution.
VI = DwDr + RwRr + AwAr + SwSr+ TwTr + IwIr + CwCr
DVI = VI × LU
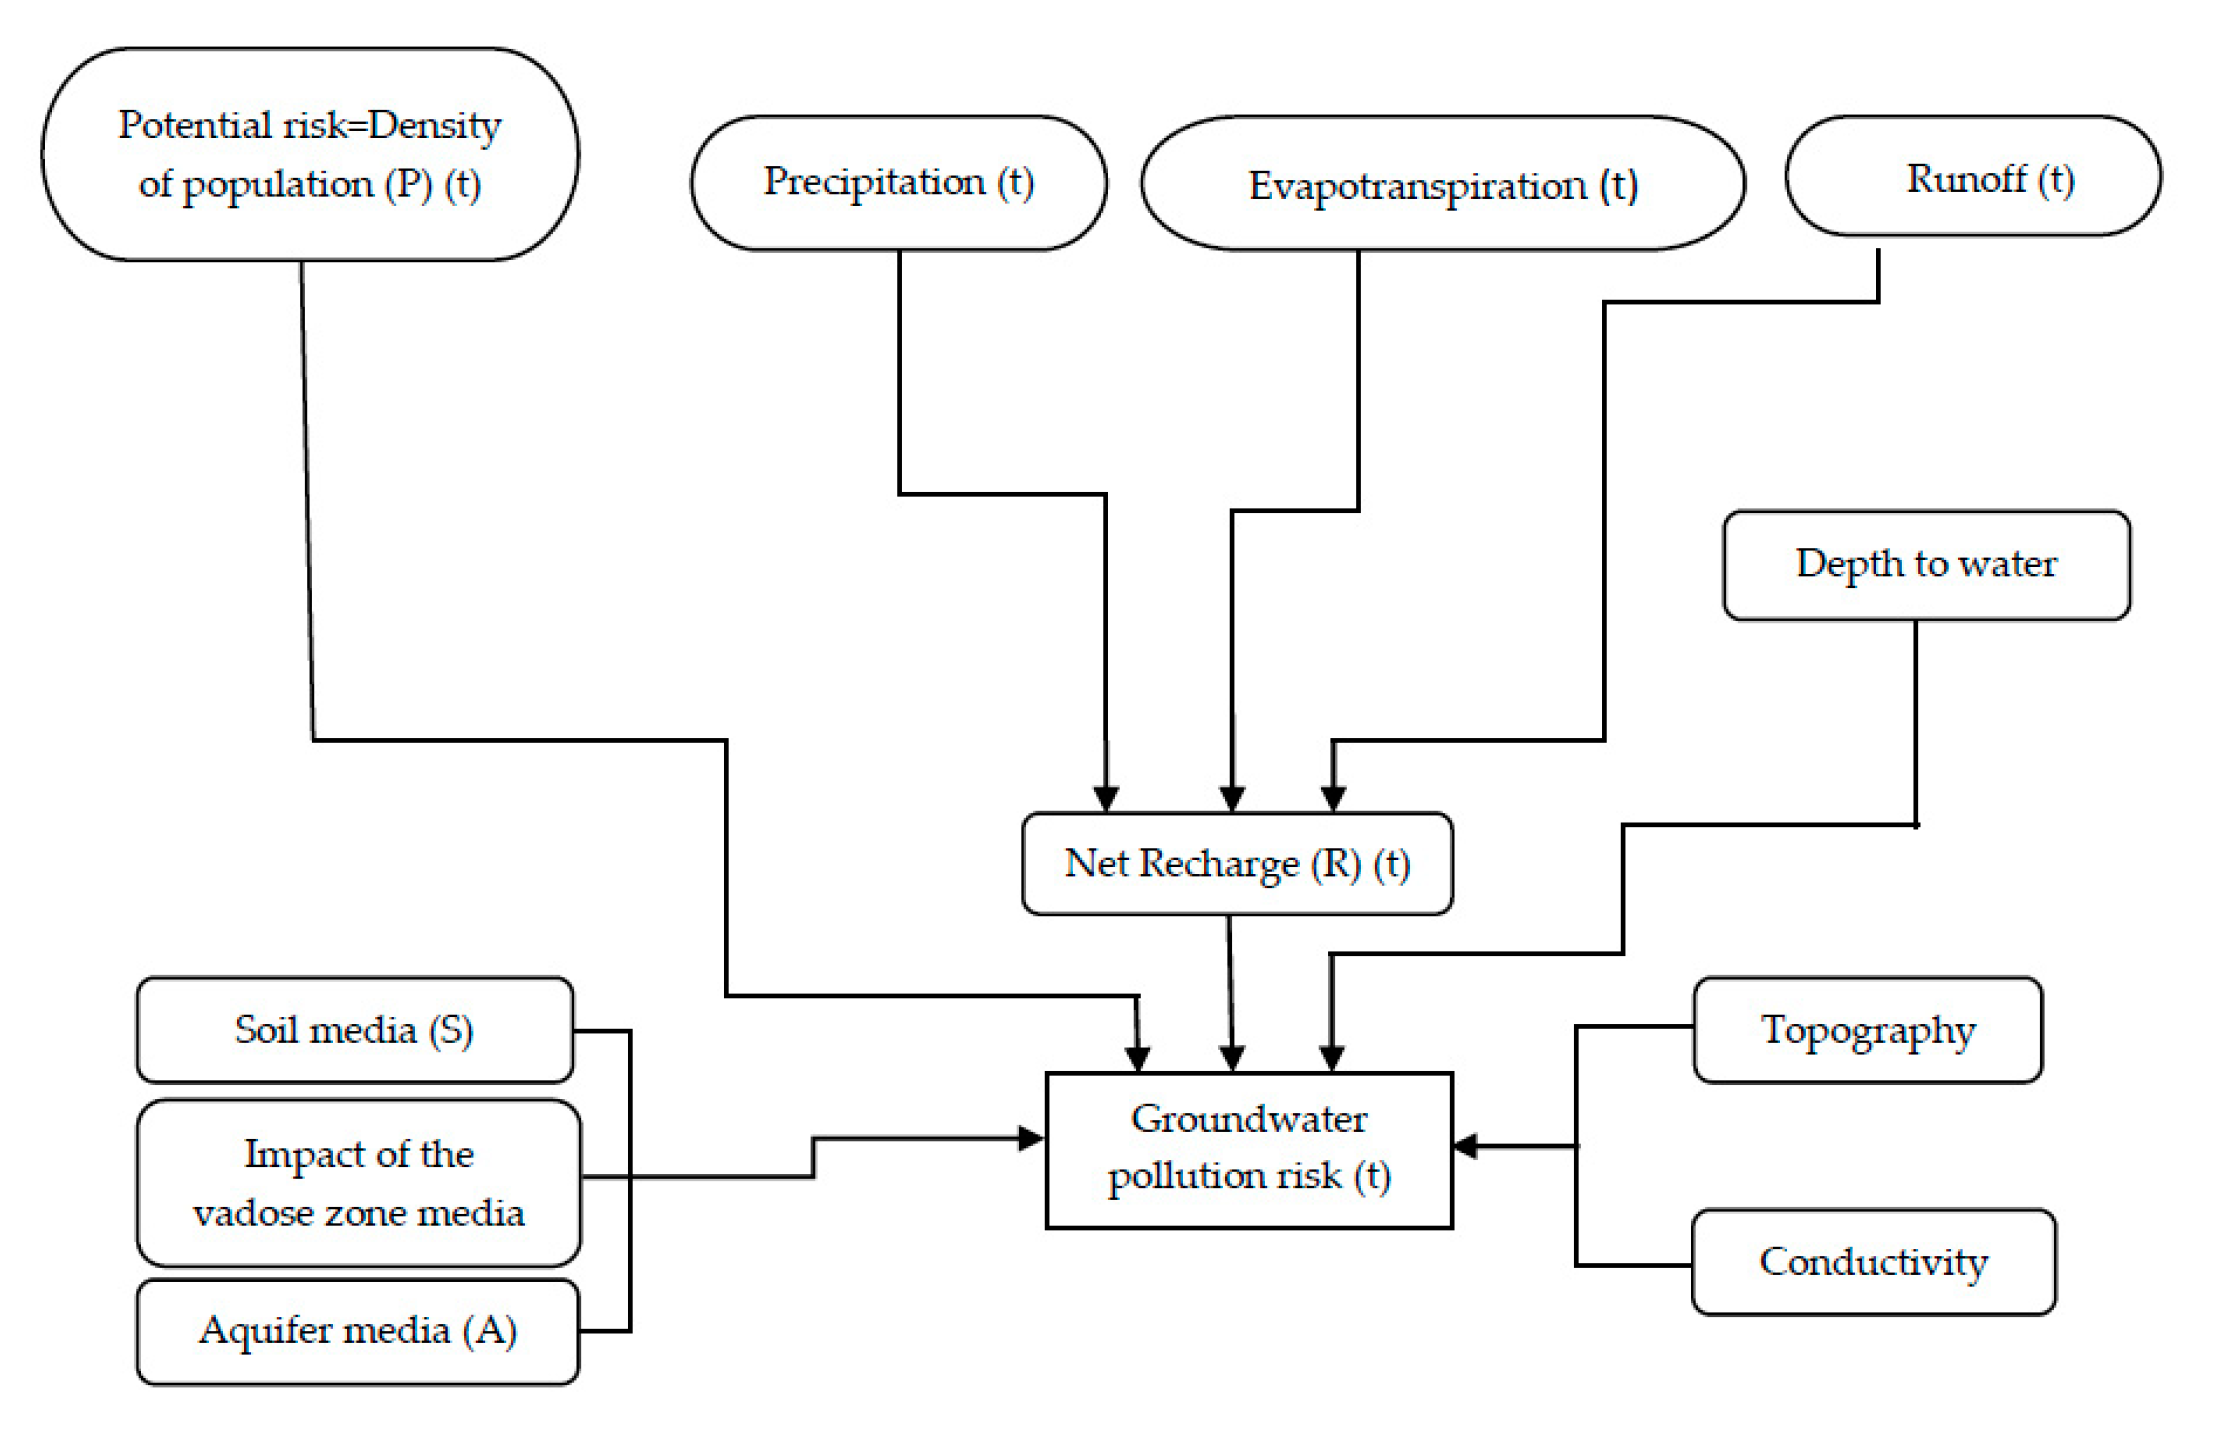
Hence, we deployed the general modelling framework as illustrated in Figure 1, which is an adaptation from Huang et al. [34]. It shows the combined interactions of climate and land use change on groundwater vulnerability and pollution risk.
In general, land use and land cover are major attributes determining specific vulnerability and pollution risk. In this regard, due to the difficulty to build dynamic land use and land cover data sets, we used the normalised density of Population (P) as a proxy for land use. This is consistent with our previous study showing that population density is one of the most relevant factors that explain the nitrate contamination at the African scale [35].
2.2. Data Sources
To estimate the dynamic aspect of groundwater pollution risk at the continental scale of Africa, we used several data (such as soil type, topography, land use/land cover, geology, depth to groundwater, recharge) with various spatial resolutions and grouped them into two categories, i.e., static and dynamic parameters. All data were converted to a reference spatial resolution of 15 × 15 km2. We obtained the dynamic groundwater risk map, after classifying and assigning relative ratings and weights, and then overlaying the individual maps in a geographical information system (ArcGIS Desktop 10.4TM, ESRI Inc., Redlands, CA, USA).
2.2.1. Dynamic Parameters Mapping
This section summarizes the changing of groundwater net recharge and density of population, which is considered here as land use proxy. For both dynamic parameters, maps were realized using data from Girard [36] for three specific years, i.e., 1990, 2000, and 2010.
Net Recharge (R) Affected by Climate Change
Net Recharge, R, is the amount of water of surface water that infiltrates to the ground and reaches the groundwater level. It acts as a principle vehicle for transporting pollutants to the water table through the leaching process.
Climate change will alter the hydrological cycle, including spatial and temporal changes in precipitation and evaporation [34]. A number of investigations such as in [37,38] suggested that climate change will affect directly groundwater recharge. Due to lack of dynamic data of recharge evolution at the African scale, the simple relation shown in Equation (3) was used to infer groundwater recharge trends in response to climate change:
where R is the recharge (mm), P is the total precipitation (mm), ET is actual evapotranspiration (mm), and Q is the runoff in mm. These factors used to prepare recharge map data were extracted from Global Land Data Assimilation System Version 2 (https://earthdata.nasa.gov/). The recharge map ratings (Figure 2) were assigned values following the classification in Table 2.
R = P − ET − Q
The standard classification of the recharge map is similar for the tree years. Africa has areas with low net recharge rate (<50 mm/year), for which a rating of 1 is assigned, and areas with high recharge ranges (>225 mm/year), particularly in Central Africa and a portion of western Africa, for which a rating of 9 is assigned. We observe an average variation of the recharge between 2000 and 2010. For example, the spatial and temporal variations can be observed near the Lake Victoria and Ethiopia in East Africa and Morocco in North Africa.
Density of Population (P)
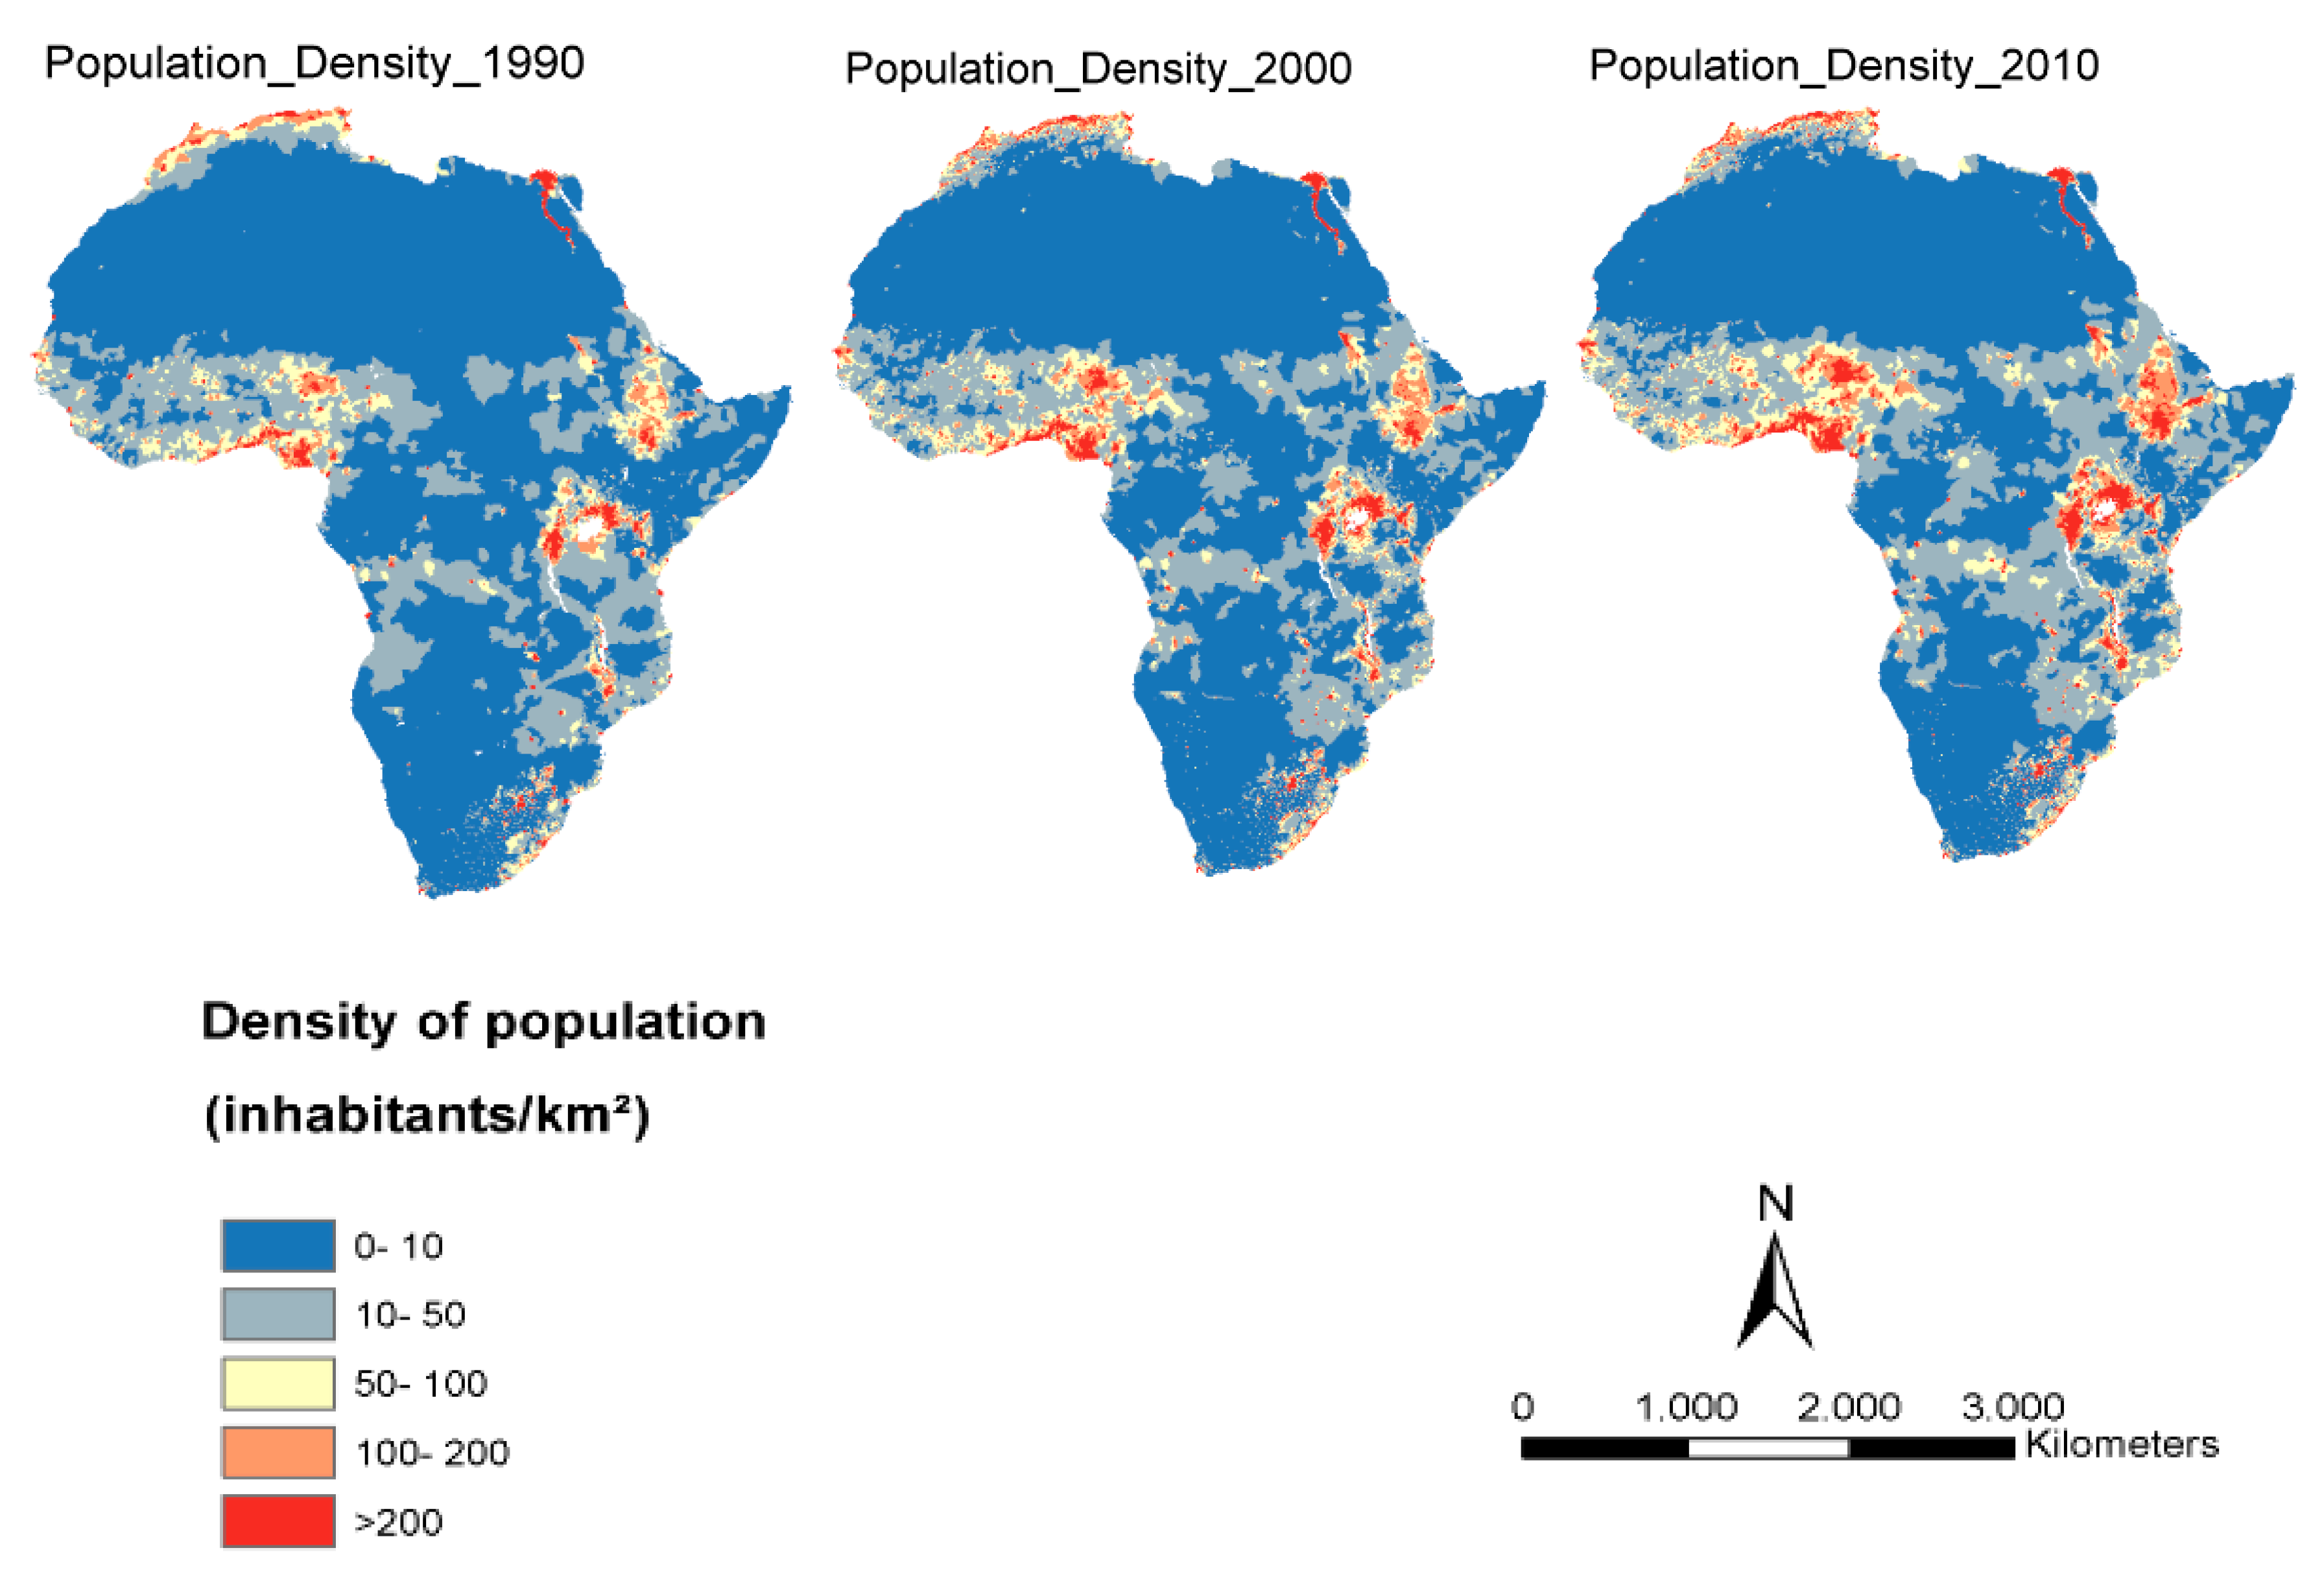
The second dynamic factor was the density of Population (P). The population density is commonly represented as the number of people per square kilometers (people/km2). According to Alemayehu et al. [39] who analysed the case of Addis Ababa, Ethiopia, the impact of the human population on surface and groundwater is increasing with the development of industry and population size. These authors affirm that the state of groundwater contamination in this city is similar to the reality of large cities in many developing countries. The level of groundwater contamination tends to rise with the increasing human population, particularly in urban areas, and the low level of economic development. Indeed, a recent study carried out by Lapworth et al. [40] showed that faecal waste is the largest source of contamination in urban (and rural) groundwater, in particular where there is high-density housing with poor and/or inadequate sanitation facilities and treatment of faecal waste. These authors observed that this situation is common in low-income areas of most major and growing urban centres in Africa. Therefore, the “P” factor represents the distribution of potentially causative agents, considering that groundwater pollution is mainly human-caused. Data on population density at the African scale for the years 1990, 2000, and 2010 were developed by Socioeconomic Data and Applications Center (SEDAC) and prepared in a raster grid by Girard [36] (Figure 3). This factor was assigned ratings from 1 to 10. Ratings were obtained from a previous study [36,41] and adapted for our study area.
2.2.2. Data of Static Parameters
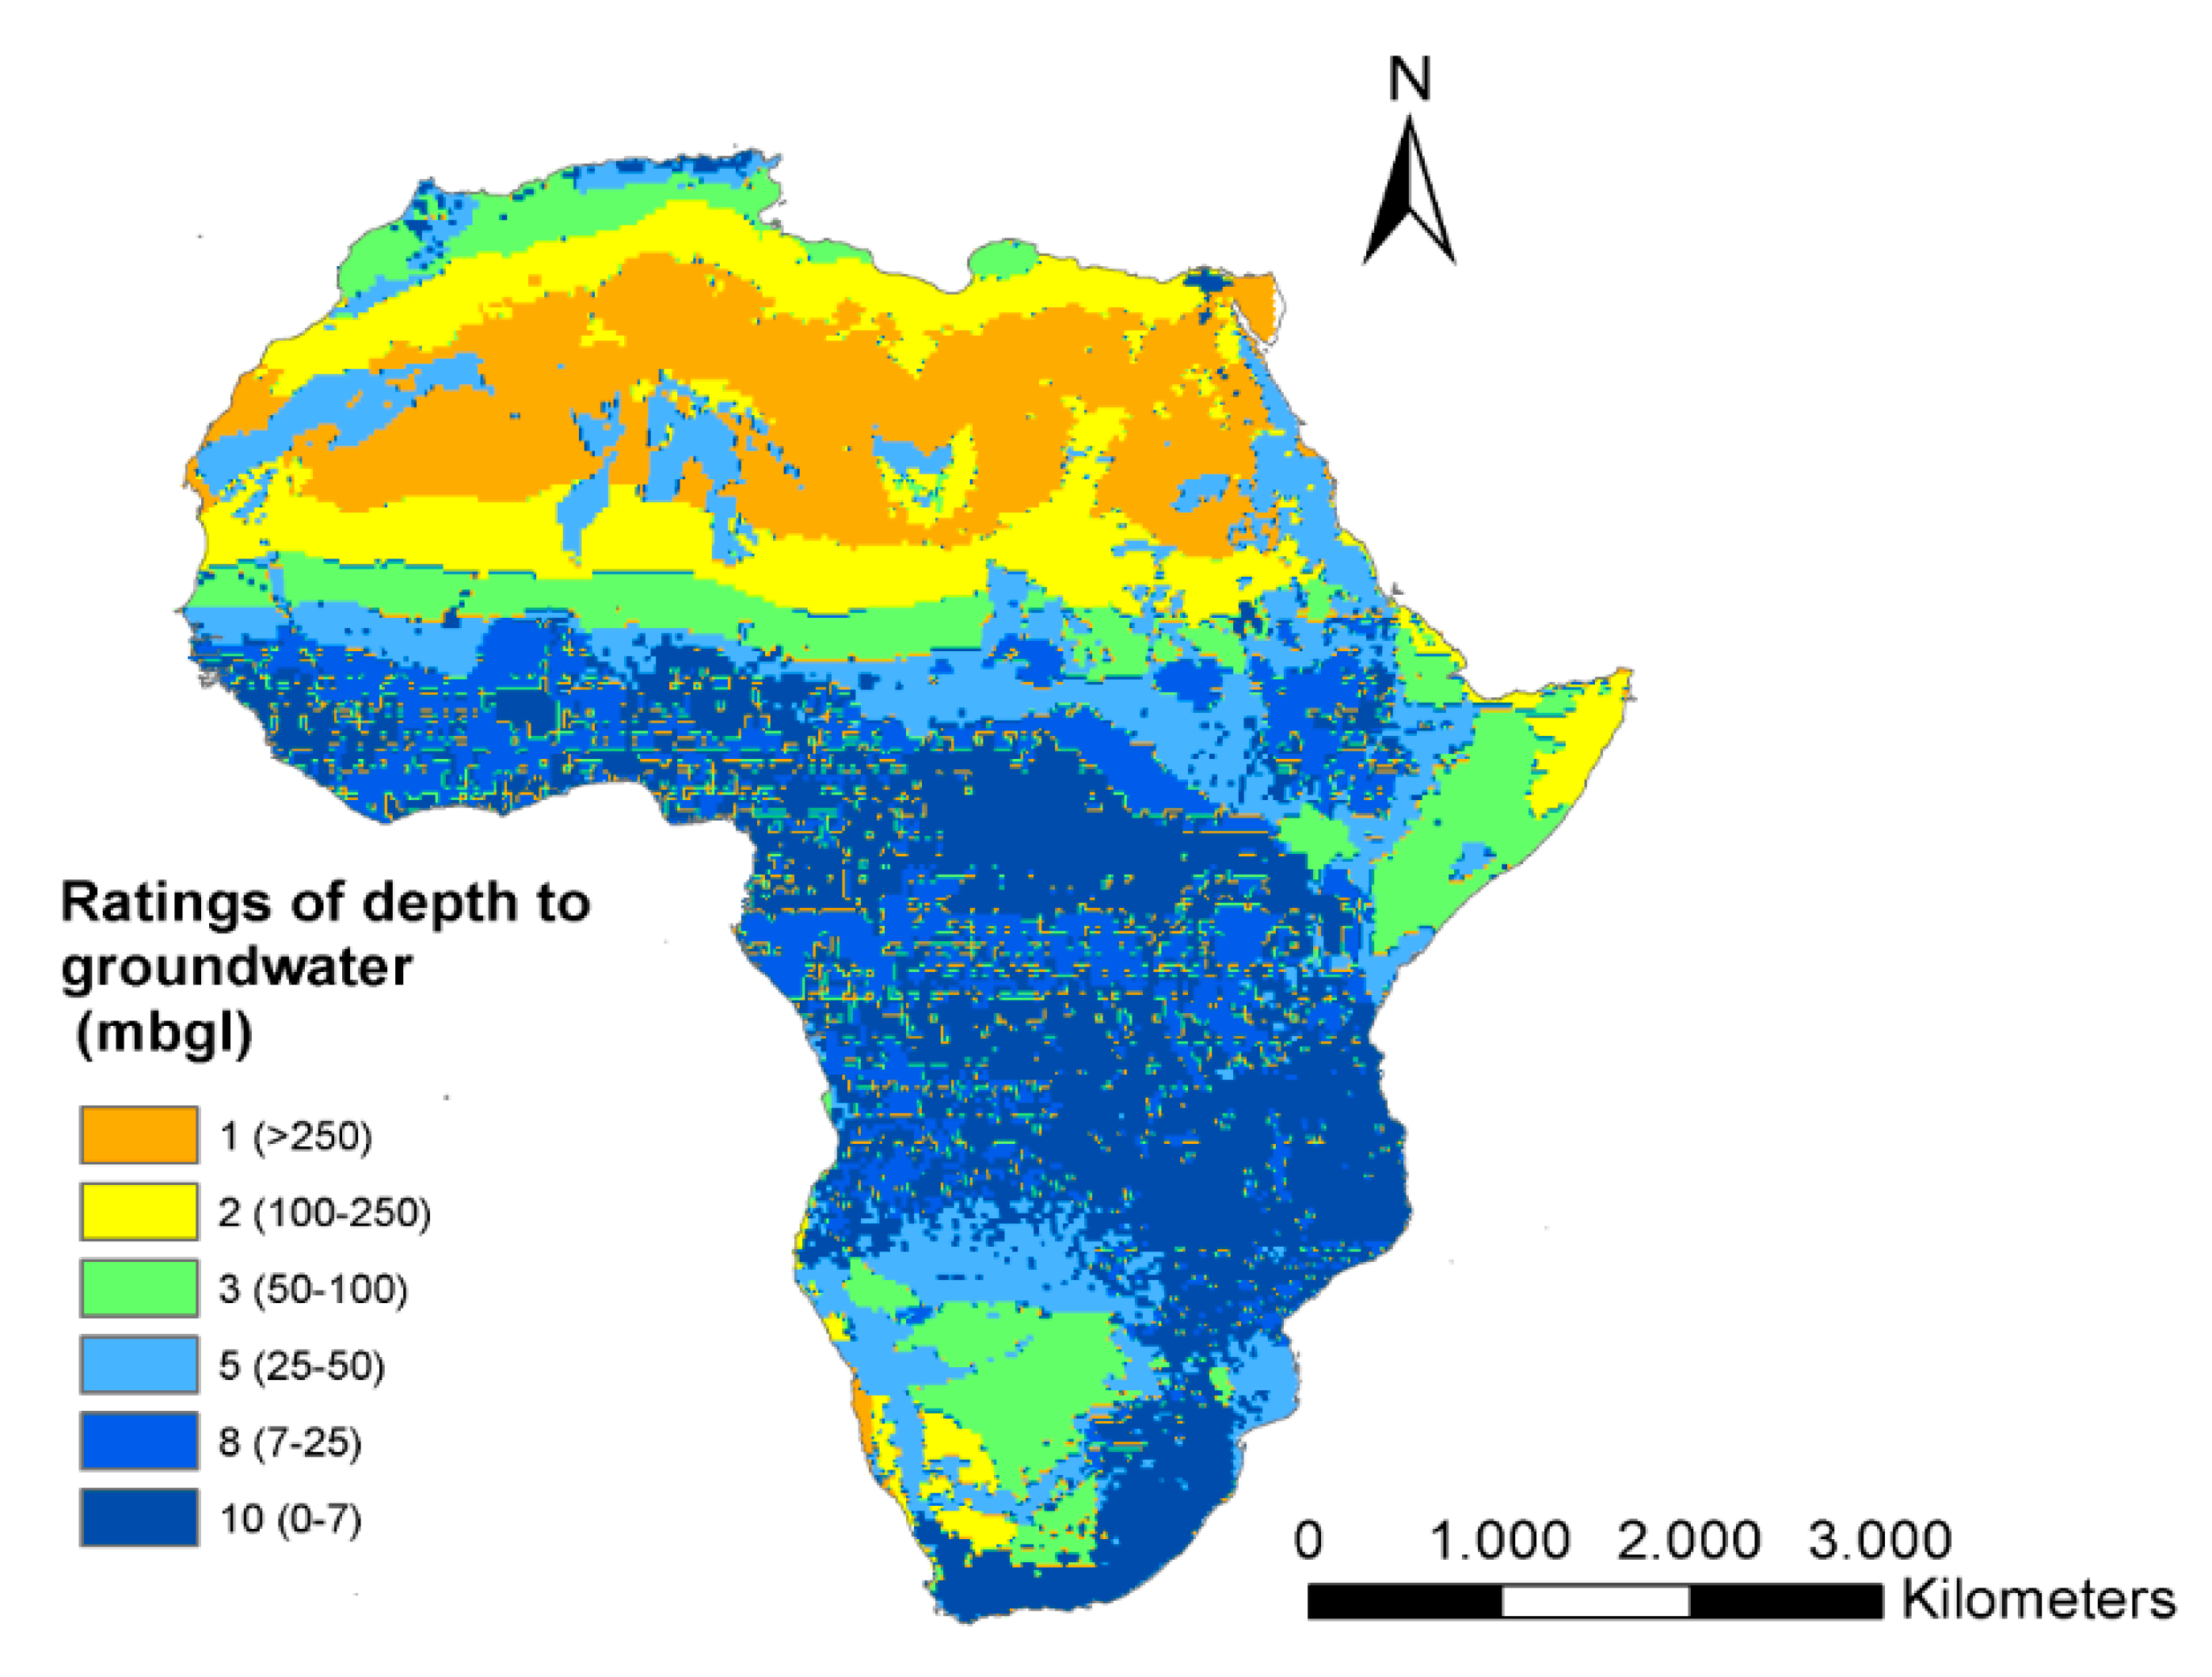
Depth-to-water-table, (D), is the depth to the aquifer from the ground surface, determines the medium depth through which pollutants travel before reaching the aquifer [42]. In general, the vulnerability for pollution decreases with D. Furthermore, with climate change over time, depth to water level in Africa is not static. However, in our case study, due to the absence of groundwater level variation between the three considered years, we assumed that the parameter D is “static”. The D map used is from Ouedraogo et al. [15]. The assigned D ratings vary between 1 and 10, according to the classification of Table 2. Due to the importance of this factor in groundwater vulnerability to pollution, we decided to show explicitly the map of this static parameter (Figure 4).
The aquifer type or aquifer media is also considered a static variable. Aquifer media, A, refers to the saturated zone material properties and controls the pollutants permeability and attenuation processes [39]. In this study, information of aquifer media used was derived from Ouedraogo et al. [15]. The ratings of the A map were set according to the classification of Table 2.
For implementing the pollution risk model, we further assessed soil characteristics, topography (slope), the characteristics of the vadose, and the hydraulic conductivity at the pan-African scale. Soils serve as the dominant sink for retention of pollution [43] and impact the leaching of pollutants to deeper horizons. For this study, the soil map of Africa was inferred from the data processed by Ouedraogo et al. [15]. Slope affects the likelihood that a contaminant deposited on the land surface will infiltrate through the soil [17]. Low slope of area tends to retain water for longer periods, which allows a greater recharge of water and a greater potential for contaminant migration. The slopes were derived from the data processed by Ouedraogo et al. [15]. Impact of the vadose zone, I, is a layer in between the aquifer and the soil zone [26]. The vadose zone properties determine the attenuation behavior of the materials that are located above the groundwater table and below the soil. The vadose zone is also where processes of biodegradation, neutralization, mechanical filtration, chemical reactions, volatilization, and dispersion may occur [9]. This study used the vadose zone parameter developed by Ouedraogo et al. [15]. Hydraulic conductivity is a property of an aquifer that describes the ability of water to move through the aquifer [32]. An aquifer with high conductivity is vulnerable to substantial contamination as a plume of contamination can move easily through the aquifer [44]. Hence, areas with high hydraulic conductivity values are more susceptible to contamination. We used the hydraulic conductivity map developed by Ouedraogo et al. [15].
All these factors were considered static in this study.
The DRASTIC index from each input layer was multiplied by the respective weight of the layer, see Equation (1). Then, the Dynamic Vulnerability Index formula, see Equation (2), was applied in ArcGIS Desktop 10.4TM (Spatial Analyst tool) to map the dynamic pollution risk for the three selected years (1990, 2000, and 2010).
3. Results and Discussion
3.1. Dynamic Maps of the Groundwater Pollution Risk
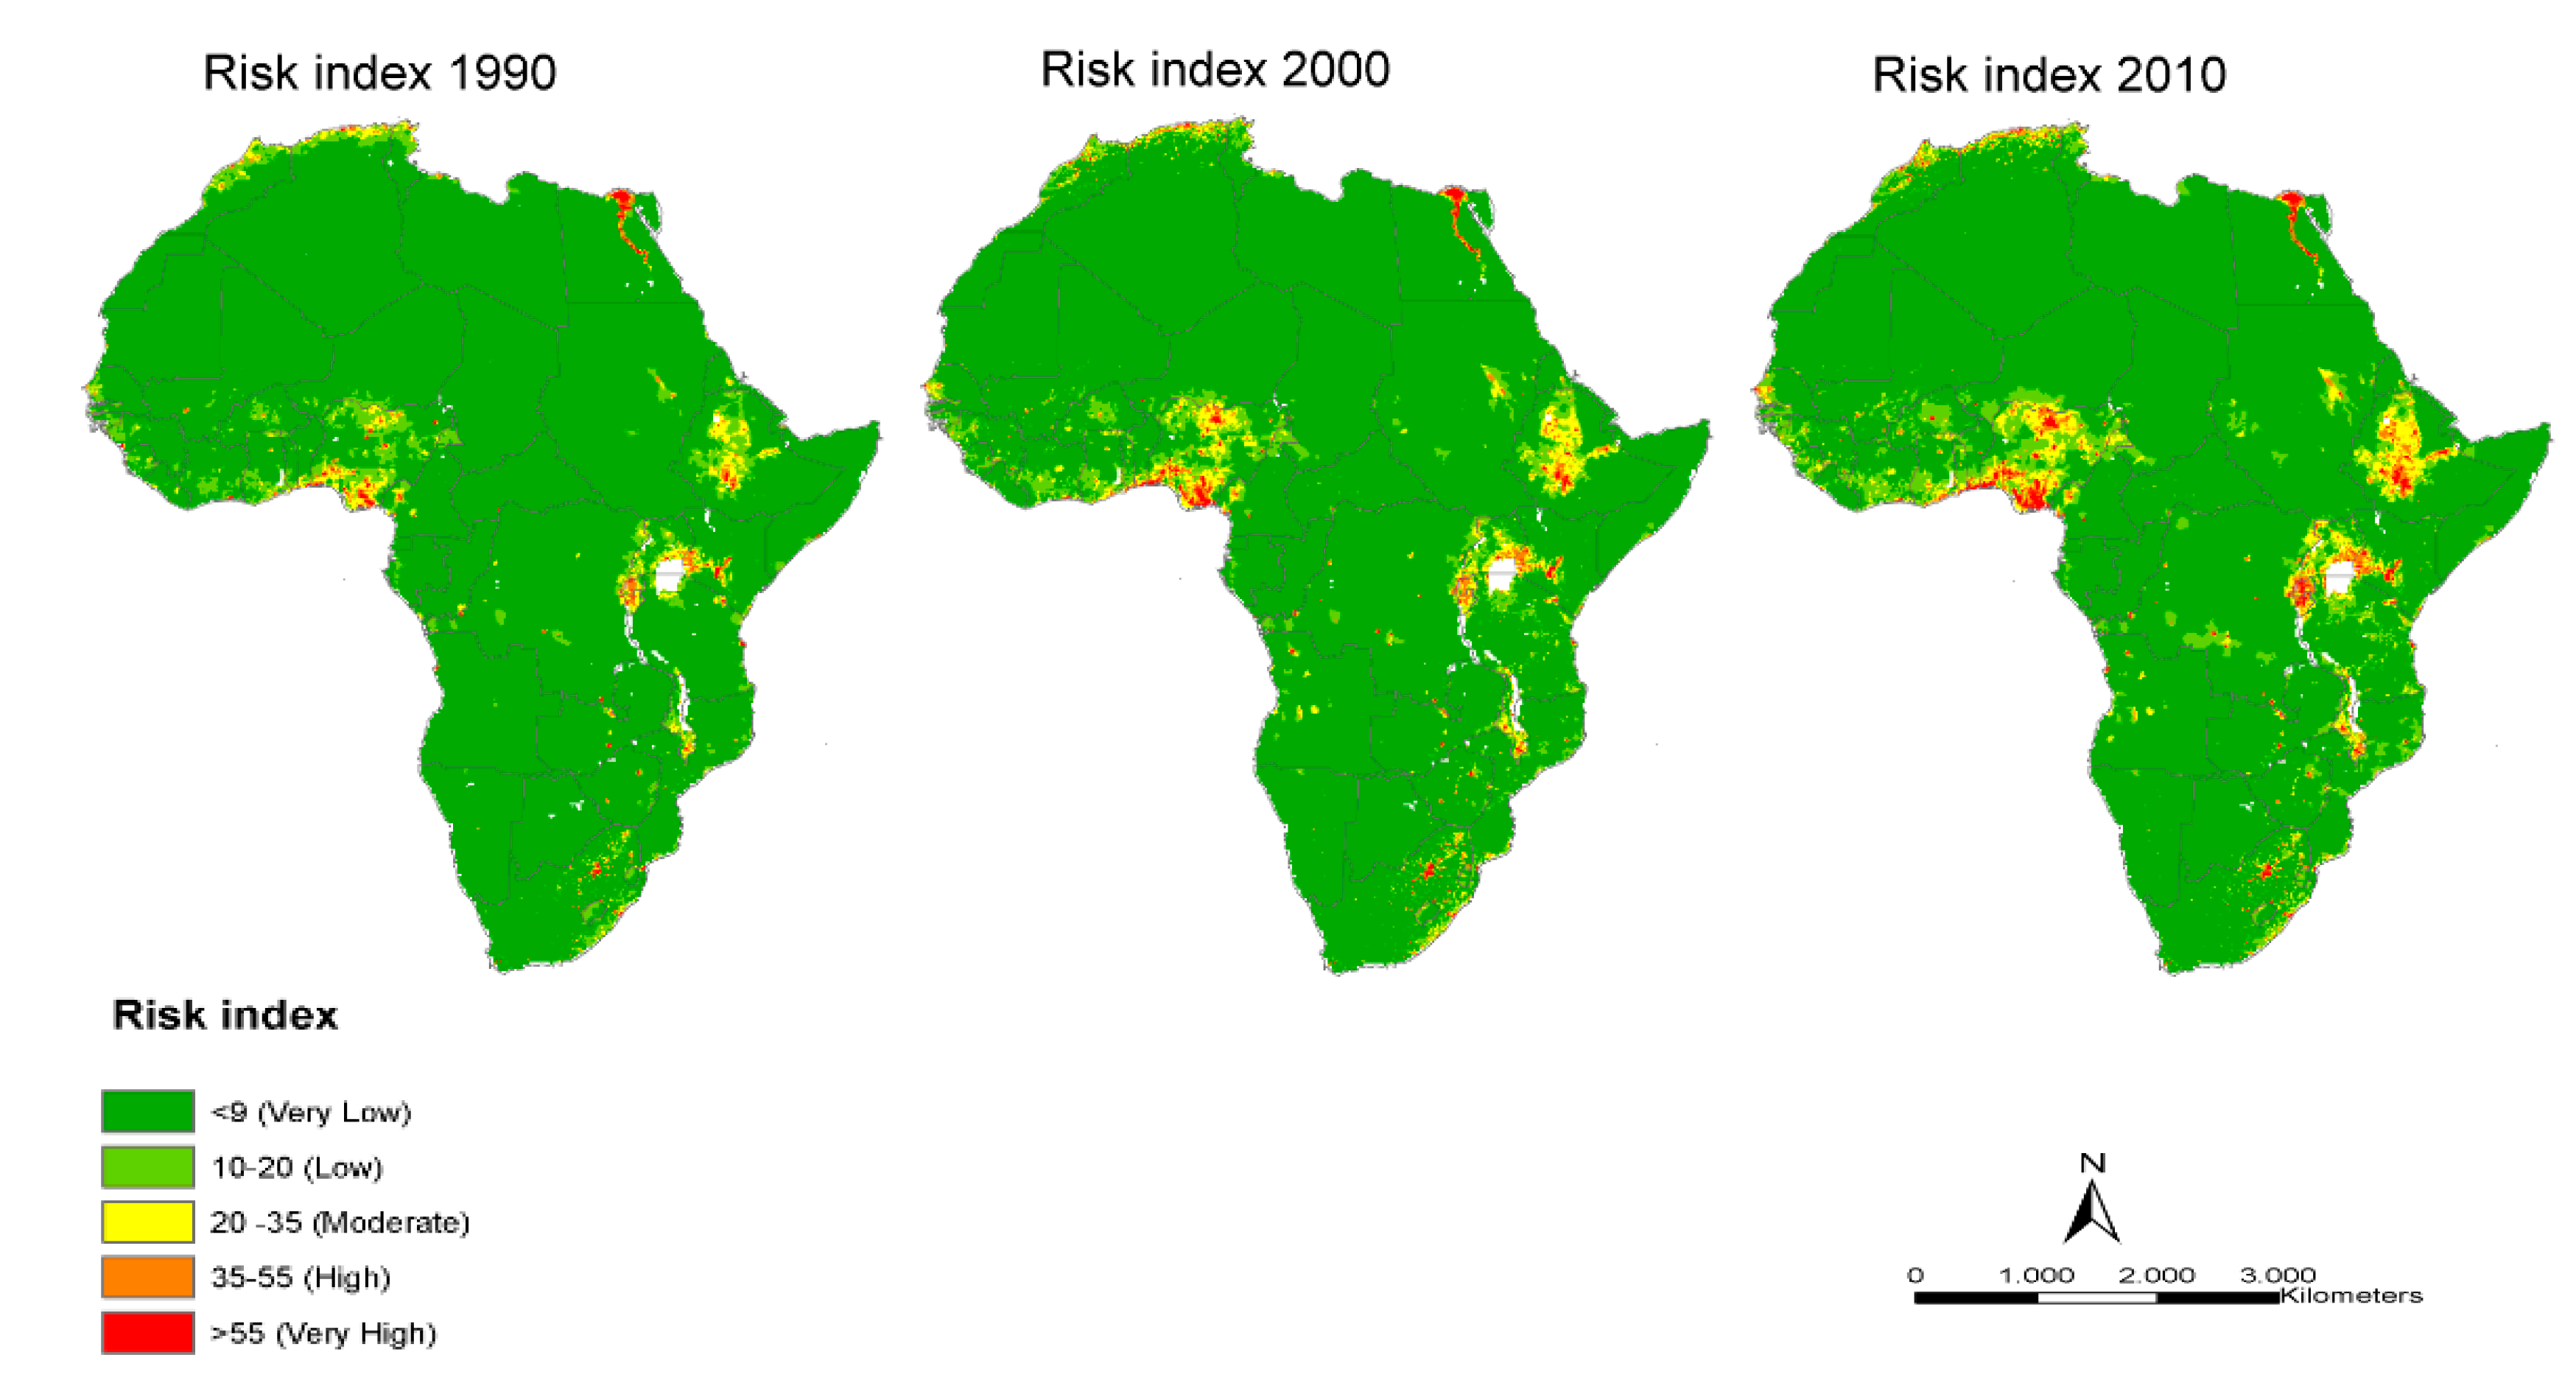
The results of the spatial pattern of the Dynamic Vulnerability Index (DVI) are presented in Figure 5. It is important to keep in mind that the DVI index is a continental index and that it should be used to identify areas that will be negatively impacted by land use change with respect to groundwater. The risk index indicates the relative level of susceptibility to groundwater pollution. The pollution risk index is divided into five equal classes ranging from very low to very high. The DVI exhibits significant space and temporal variability. Areas of high vulnerability are shown in red, while areas of low vulnerability in green. We observe that pollution risk is significant in North Africa, West Africa (mainly Nigeria), the Lake Victoria or Great Lakes Regions in East Africa, Horn of Africa (Ethiopia), and the Nile Delta in Egypt. This is consistent with the previous findings in [15]. The maps elucidate the important effect of P on pollution risk, which is consistent with previous studies [2,35,45]. The highest values are located in the Western part of Africa (Nigeria). When looking at the temporal dynamics, we observe that the pollution risk increases in the highly vulnerable areas. Lapworth et al. [40] showed that risk of groundwater pollution is directly related to population density, which increases with the population growth in urban areas. As mentioned above, Lapworth et al. [40] demonstrated that the greatest nitrate contamination was in groundwater sources in settlements with extremely high population densities (over 40,000 people per km2). Many authors affirm that informal settlements are associated with high levels of nitrate, nitrite, and organic compounds [46,47,48]. For example, in the city of Harare (Zimbabwe), rapid urbanisation and the lack of low-cost accommodation have led many people to settle (formally or otherwise) on previously land in Epworth, south-east of the city [49]. Half of the population of Epworth makes use of the groundwater resources for their domestic water supply. This number increases as high as 77% in the most recently settled area. According to Love et al. [50], the Epworth settlement thus showed major problems with high levels of nitrogen (representing nitrates) and coliform bacteria in groundwater. This is a cause for concern, since the area has a high water table and high population density, leading to an elevated risk of contamination for shallow wells supplying half the population of the settlement with water [51]. Urban growth exhibits high rates in parts of East and West Africa. Urban low-income population growth is very high [40]. However, while the evidence indicates that the lower-income households are substantially more vulnerable to anthropogenic impacts on water quality [52], few studies have specifically examined the extent to which groundwater quality trends impact the poor and their wellbeing [53]. By studying recently groundwater and poverty in sub-Saharan Africa, UPGro [52] argues in their report that: “a greater vulnerability is likely for several reasons. Firstly, the poor are less likely to have access to treated, piped water and hence more likely to rely on shallow groundwater for drinking. Secondly, the urban poor are more likely to live in densely populated areas, where sanitation and waste disposal are inadequate, and contamination risks are highest. This is evidenced by the study of Sorensen et al. [53], which notes that groundwater contamination was most extensive in areas of low cost housing. Thirdly, low-income groundwater users are more likely to have poorly constructed wells, with inadequate or absent protection measures and rudimentary lifting devices. Fourth, the poor are less likely to undertake household water treatment.” Furthermore, according to Jourda et al. [54], among the major threats to the urban aquifer in Abidjan, there is the absence of an institutional framework. With respect to the desert of Sahara, due to low population density and agricultural land use, we observed a low pollution risk.
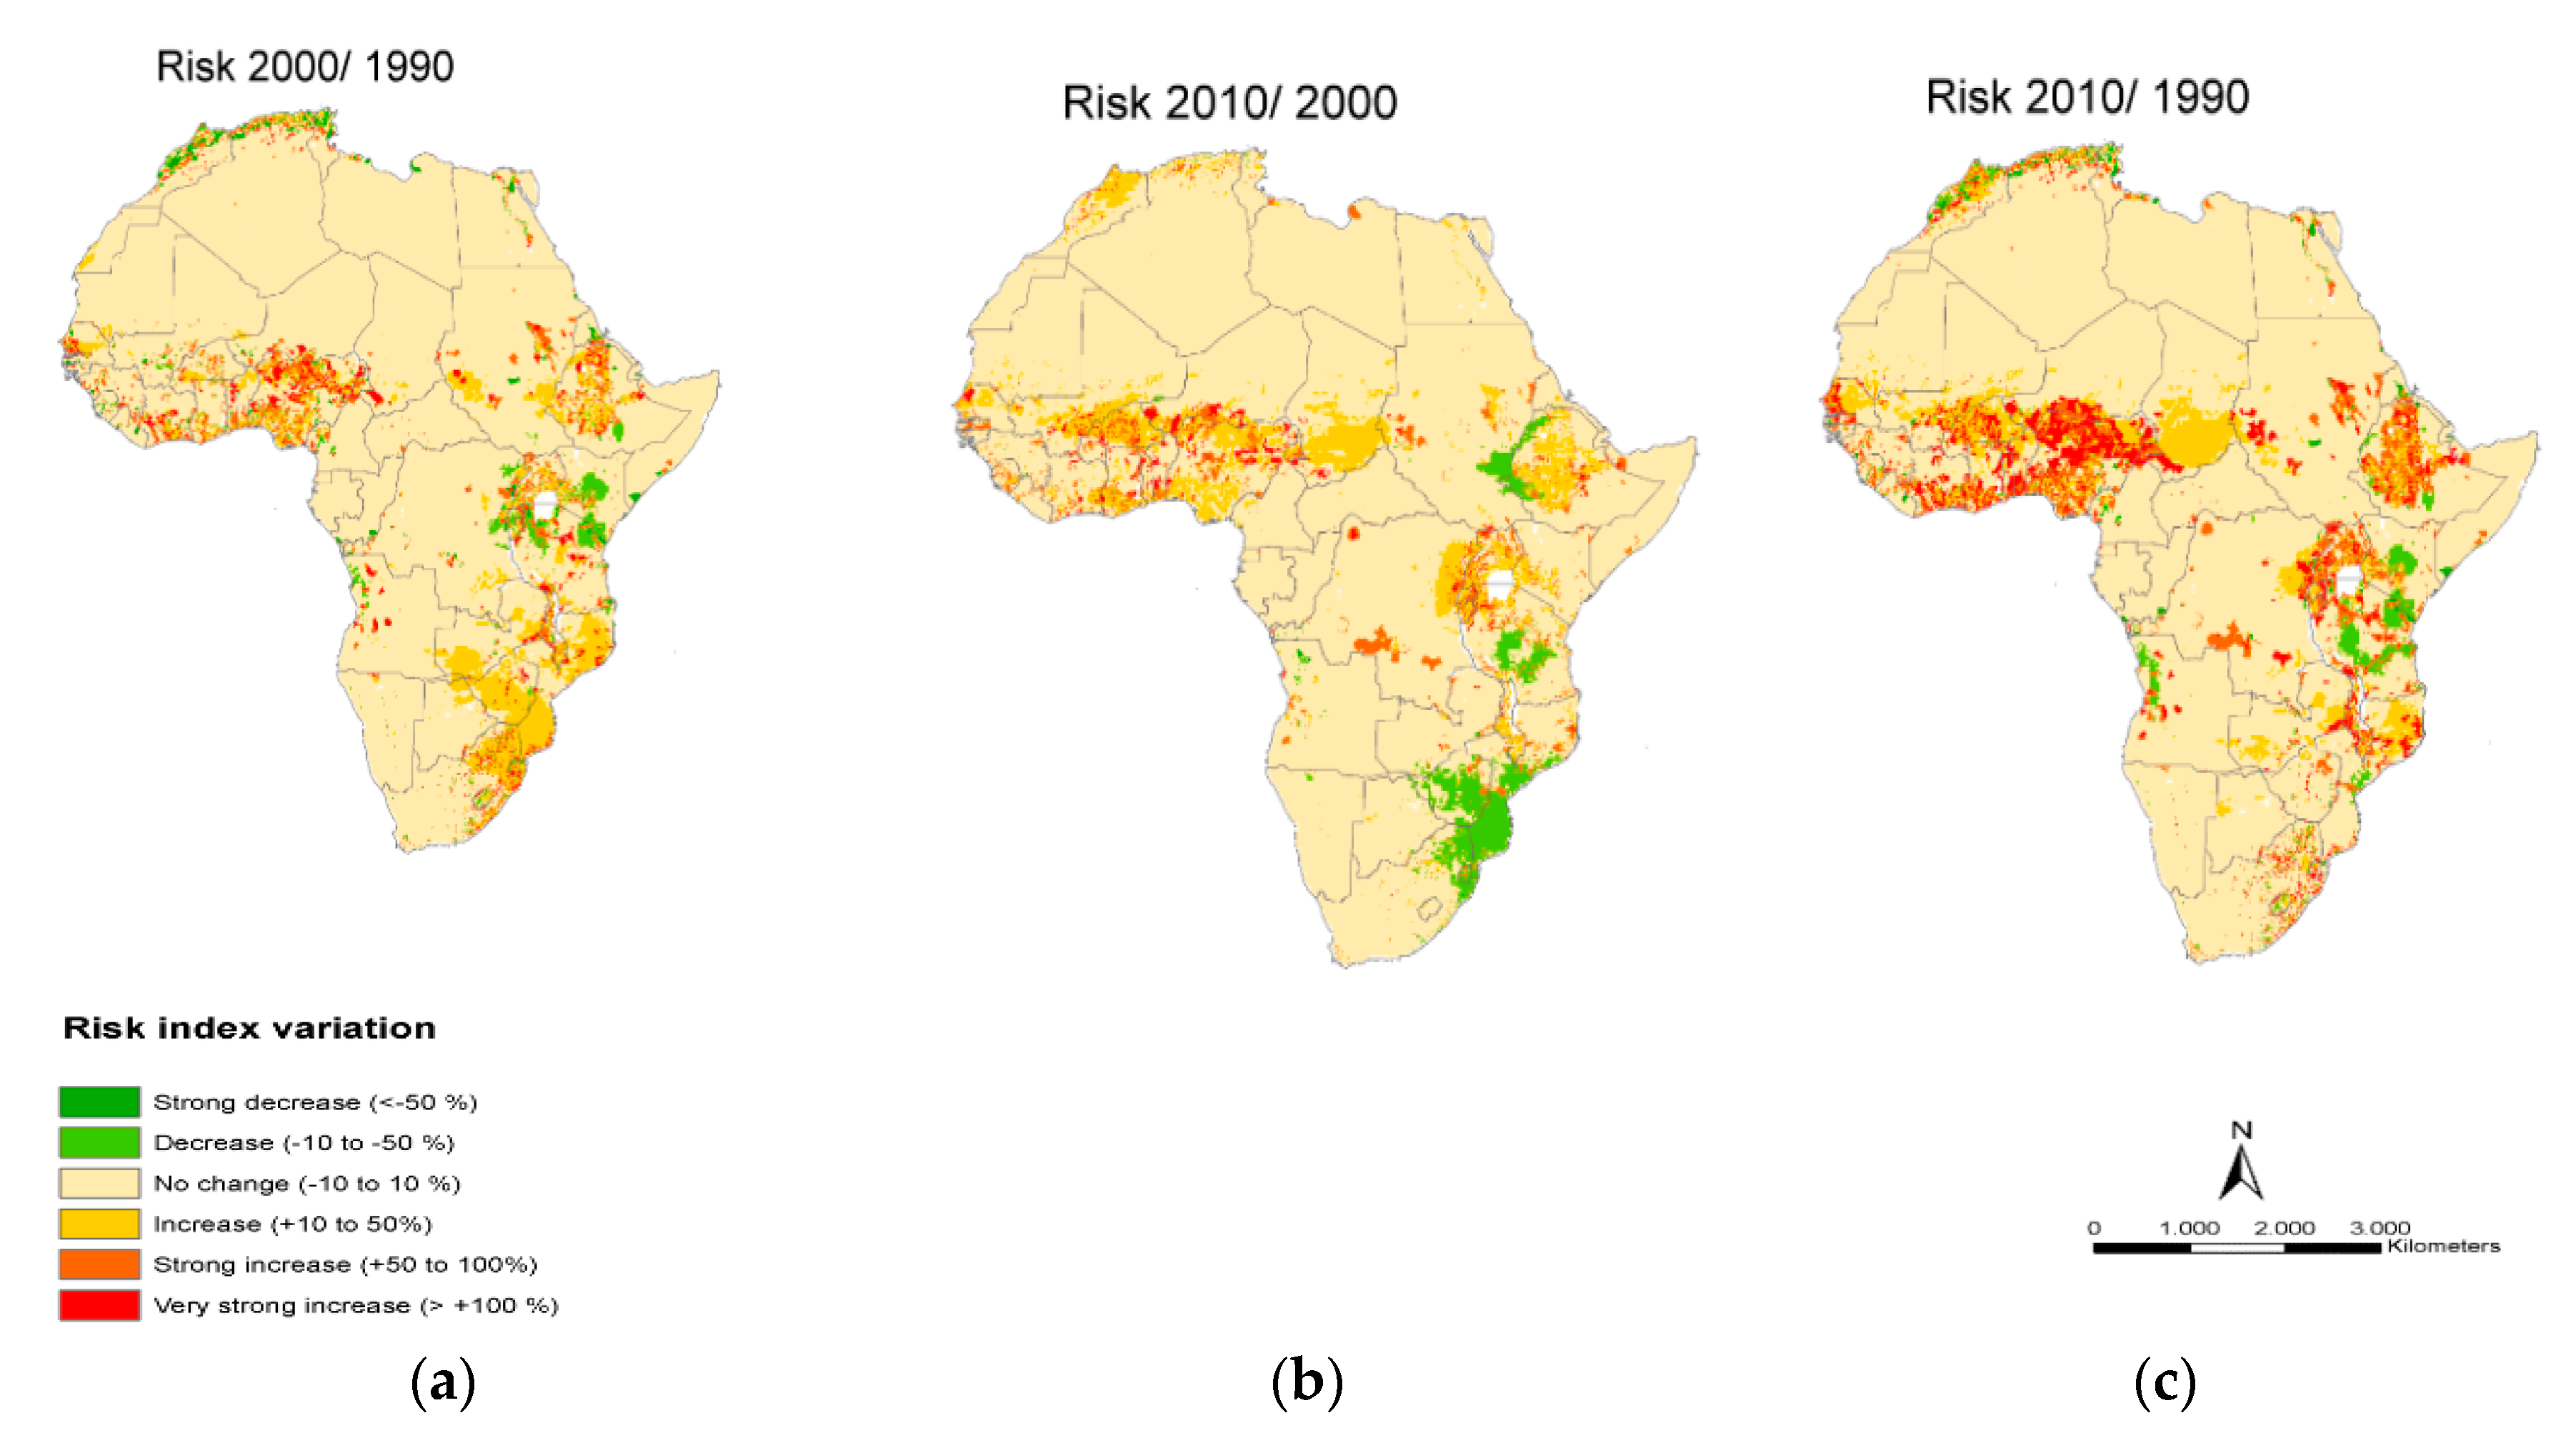
The relative risk with respect to a reference year is given in Figure 6. The figure illustrates a significant increase in pollution risk for the Sudan-Sahel belt of Africa and around the Great Lakes Region between 1990, 2000, and 2010. Furthermore, the difference of groundwater pollution risk between the three years is given in Figure 7. This figure confirms the findings in Figure 6.
Table 3 shows the percentage of area per class of pollution risk. These results indicate an increasing trend from low to very high pollution risk during the period of 20 years (i.e., 1990 to 2010). The values in this Table 3 confirm that the pollution risk for groundwater in Africa increased to some extent from 1990 to 2010. For example, the percentages of area classified as high pollution risk were 0.55%, 0.87%, and 1.26% for the years 1990, 2000, and 2010, respectively; and the percentages of area classified as very-high pollution risk were 0.29%, 0.48%, and 0.76% for the years 1990, 2000, and 2010, respectively. These data demonstrate that the surface of pollution risk follows an increasing trend.
3.2. Novelty of the Study
The novelty of our study lies in the spatial and temporal scale of application. According to our knowledge, this is the first study that assesses the temporal dimension of groundwater vulnerability at the pan-African scale. Indeed, mapping of hydrogeological attributes at the global scale was initiated by many multi-lateral (and mainly United Nations (UN) supported) projects, such as International Groundwater Resources Assessment Centre (IGRAC) initiated by the United Nations Educational, Scientific and Cultural Organization–International Hydrological Programme (UNESCO-IHP). However, no compilation of these hydrogeological attributes for vulnerability against pollution has been published so far. Many previous products in this domain have been developed but merely focused on quantitative aspects, such as the groundwater map [55,56,57], the drought vulnerability map for Africa [58], and the global map of vulnerability to floods and droughts [59]. Only recently, water quality aspects were addressed at these large scales as illustrated by Ippolito et al. [60], who have developed a global pesticide runoff vulnerability map with a generic indicator model. Concerning groundwater pollution, issues were addressed for specific pollutants such as fluoride and arsenic contamination in groundwater [61,62]. However, no general vulnerability map was already available excepted by the authors in Ouedraogo et al. [15]. With this new study, we fill the existing gap in temporal dimension for the assessment of groundwater vulnerability at the continental scale. We believe that this vulnerability map can be very useful for rural and urban development planning. Indeed, the information on vulnerability can help identify those locations that deserve particular protection in urban and rural development projects and programs in Africa.
3.3. Limitations of the Study
Introducing the temporal dimension to assess trends in groundwater vulnerability is an innovative approach to study the pollution risk. In this study, we modelled the temporal dynamics of the groundwater pollution risk at the African scale in terms of a set of explaining natural and anthropogenic factors. Both dynamic and statistic factors were integrated in a linear multi-criteria decision-making (MCDM) model to estimate groundwater vulnerability and pollution risk. However, according to Li and Merchant [17], it is recognized that the actual physical processes leading to groundwater contamination are not necessarily linear and often involve complex mechanisms such as pollutant transport, dilution and dispersion, adsorption, and chemical and biological transformation. Furthermore, Ouedraogo et al. [63] demonstrated that the best statistical model to explain groundwater nitrate contamination at the African scale is a nonlinear model. Indeed, the linear model used in this study can also over- or underestimate groundwater pollution risk as already stated by Li and Merchant [17]. According to these two studies by Li and Merchant [17] and Ouedraogo et al. [63], the linear modelling approach has a significant advantage as it simplifies complex groundwater contamination processes and can facilitate rapid regional evaluation based on well recognized key environmental and anthropogenic factors. Thus, using a linear model to estimate groundwater vulnerability to pollution presents some limits. To overcome some limitations of the DRASTIC model, the AHP method [14,64,65] could be explored as a perspective to improve this first attempt to produce a dynamic pollution risk map in Africa. As noted previously by Li and Merchant [17], the groundwater pollution risk maps developed at a regional scale cannot be used to interpret incidences of actual local groundwater contamination. Therefore, the groundwater pollution risk maps developed also for this research are intended for continental use or sub-regional use (e.g., Economic Community of West African States (ECOWAS), region) and can therefore not be used for local groundwater contamination assessment.
A low pollution risk observed on the maps does not mean that there is no risk of contamination; it simply means that the geology and hydrogeology of the area provide more natural (or intrinsic) protection to the groundwater resources in the given environment. One must look at the land use activities and potential hazards associated with such activities to predict the likelihood of contamination. However, these maps provide a preliminary assessment of the dynamic aspect of groundwater pollution risk at the African scale and may also support risk assessment when combined with specific hazards. Furthermore, the modelling results are also subject to the uncertainty from resampling of the relatively coarse resolution climate data, natural factors, and anthropogenic data as mentioned already by Li and Merchant [17]. In addition to climate change data uncertainties, other uncertainties are associated with data sources, such as for example the depth to groundwater described by Bonsor and MacDonald [66]. Moreover, Loague and Corwin [12] highlighted that the utility of relatively simple vulnerability maps produced at regional scales is undermined by significant uncertainties related to model and data errors. In this regard, Honnungar [13] investigated the limitations that arise in MCDMs due to spatial and temporal variability of input (data and resolution), due to data processing methods (sampling and interpolation methods), due to subjectivity in assigning weights and ratings by decision-makers, and due to non-linear relationships between the hydrogeological parameters. Thus, we acknowledge that our continental-scale dynamic groundwater pollution risk presents also some limits. It is important to keep in mind the data processing errors as reported in Murat et al. [13]. Errors refer to data handling and integration such as format conversion, structure of data storage (raster/vector), geometric and positioning system transformation, spatial analysis (buffering, overlaying), querying, updating, etc.
The correlation between contamination (e.g., nitrate concentration) and the DRASTIC index could be an indicator for the assessment of the method. A sensitivity analysis of the model parameters could also be performed. The recharge data used in the analyses were taken from various sources, which were conducted by different authors and, therefore, associated with different uncertainties. A relatively simple equation was used to calculate the recharge map; this equation could certainly be improved. Another limitation is the accuracy of the DRASTIC factors, such as depth to groundwater.
Finally, one limitation of DRASTIC concerns the intrusion of seawater, which constitutes a risk as large as surface contamination. It would therefore be important to consider this seawater intrusion effect in models used to evaluate the vulnerability of groundwater.
4. Conclusions
In this study, the DVI index was calculated and mapped at the African scale to identify areas that experienced possible changes in groundwater pollution risk between 1990 and 2010. This mapping approach was based on publicly available data. The results showed regions in Africa where groundwater may represent a major threat due to the anthropogenic pressure changes over the three periods considered. The level of pollution risk of African groundwater varies from very low to very high. We observed that the spatial pattern of pollution risk at the pan-African scale has changed over the period between 1990, 2000, and 2010. In other words, we found that the spatial distribution obtained with the DRASTIC index in 1990 is very different from the spatial distribution obtained for 2000 and 2010. Groundwater vulnerability to pollution greatly varies across Africa. This variation was clearly observed for example in North Africa, in the Nile Delta, and in West Africa. The zone with the highest pollution risk at the scale of the continent is the Western Africa area, which is highly urbanized and densely populated. These results suggested that with the growing population, who generates rapid urbanization and increasing water demand, the groundwater vulnerability and pollution risk would also increase. Furthermore, poverty and poor governance might increase the pollution risk of groundwater.
Several limitations to the assessment of the dynamic vulnerability of groundwater can be highlighted, such as the lack of information on the dynamics of the water depth at the continental scale. However, as these maps are based on a limited set of data, they only allow a first interpretation of the spatiotemporal evolution of groundwater in Africa, in terms of climate and land use change. Vulnerability maps and groundwater pollution risk maps are essential tools for assessing land management practices toward groundwater protection.
As more data become available over time (e.g., water level variations), these results may be reassessed and updated for characterizing the dynamic aspect of African aquifers. Future work will focus on developing and implementing an in situ data sampling strategy through Africa in order to validate the model.
Despite its limitations, the proposed modelling approach allowed us to link groundwater vulnerability with climate change and population density used here as a proxy for land-use change. The simple DVI model allowed modelling the temporal dynamics of the pollution risk at the pan-African scale using publicly available data. This can therefore provide an important tool for the sustainable management of groundwater resources in Africa. The model could be used to monitor the achievement of SDG 6 in Africa which includes a focus on preserving freshwater resources against potential future threats. This research could also support groundwater managers and decision-makers at the African scale such as the African Ministers Council on Water (AMCOW) in selecting prioritizing areas for future groundwater monitoring and protection.
Author Contributions
All authors developed the methodology; I.O. and A.G. prepared the datasets; A.G. and I.O. performed the data analysis; I.O. wrote the manuscript; M.V. and F.J. reviewed the manuscript. All authors have read and agreed to the published version of the manuscript.
Funding
This research received no external funding.
Acknowledgments
This study was funded by the Islamic Development Bank (IDB) Merit Scholarship Program (MSP) and the “Fonds Spécial de Recherche” of the Université catholique de Louvain. The authors would like to thank T. Gleeson (McGill University) and N. Moosdorf (Hamburg University Germany) for their assistance with data acquisition. The authors are also grateful to the anonymous referees for their constructive comments.
Conflicts of Interest
The authors declare no conflict of interest.
References
- UNEP (United Nations Environment Programme). Africa Water Atlas; UNEP, Division of Early Warning and Assessment (DEWA): Nairobi, Kenya, 2010; Available online: http://na.unep.net/atlas/africaWater/book.php (accessed on 15 January 2015).
- Xu, Y.; Usher, B. Groundwater Pollution in Africa; Taylor and Francis/Balkema: Leiden, The Netherlands, 2006; p. 353. ISBN 10:415-41167-X. [Google Scholar]
- MacDonald, A.M.; Taylor, R.G.; Bonsor, C.H. Groundwater in Africa—Is There Sufficient Water to Support the Intensification of Agriculture from “Land Grabs”. In Hand Book of Land and Water Grabs in Africa; MacDonald, A.M., Taylor, R.G., Bonsor, C.H., Eds.; Routledge: Abingdon, UK, 2013; pp. 376–383. [Google Scholar]
- Gurdak, J.J. Groundwater vulnerability. In Handbook of Engineering Hydrology; CRC Press: Boca Raton, FL, USA; Taylor & Francis Group: Abingdon, UK, 2014; p. 33. [Google Scholar]
- Quevauviller, P. Chapter 1: General Introduction: The Need to Protect Groundwater. European Commission, DG Environment (BU9 3/142), Rue de la Loi 200, BE-1049 Brussels, Belgium. p. 18. Available online: https://www.researchgate.net/publication/257029447 (accessed on 1 June 2017).
- Amharref, M.; Bouchnan, R.; Bernoussi, A.S. Extension of DRASTIC Approach for Dynamic Vulnerability Assessment in Fissured Area: Application to the Angad Aquifer (Morocco). In Hydrogeological and Environmental Investigations in Karst Systems; Springer: Berlin/Heidelberg, Germany, 2015. [Google Scholar] [CrossRef]
- Butscher, C.; Huggenberger, P. Modeling the temporal variability of karst groundwater vulnerability, with implications for climate change. Environ. Sci. Technol. 2009, 43, 1665–1669. [Google Scholar] [CrossRef] [PubMed] [Green Version]
- Aller, L.; Bennet, T.; Lehr, J.H.; Petty, R.J. DRASTIC: A Standardized System for Evaluating Groundwater Pollution Using Hydrological Settings; National Water Well Association for the US EPA Office of Research and Development: Ada, OK, USA, 1985; p. 163. [Google Scholar]
- Aller, L.; Bennet, T.; Leher, J.H.; Petty, R.J.; Hackett, G. DRASTIC: A Standardized System for Evaluating Ground Water Pollution Potential Using Hydrogeological Settings; U.S. Environmental Protection Agency: Ada, OK, USA, 1987; p. 662.
- Honnungar, V.C. Structural and Functional Enhancements to Regional-Scale Groundwater Vulnerability Assessment Models; Texas A&M University-Kingsville: Kingsville, TX, USA, 2009; p. 200. [Google Scholar]
- National Research Council (NRC). Groundwater Vulnerability Assessment: Contamination Potential Under Conditions of Uncertainties; National Academy Press: Washington, DC, USA, 1993; p. 185. [Google Scholar]
- Loague, K.; Corwin, D.L. Uncertainty in Regional-Scale Assessments of Non-Point Source Pollutants. In Applications of GIS to the Modeling of Non-Point Source Pollutants in the Vadose Zone; Soil Science Society of America: Fitchburg, WI, USA, 1996; pp. 131–152. [Google Scholar]
- Murat, V.; Martel, R.; Savard, M.M.; Nastev, M.; Paradis, D.; Michaud, Y.; Lefebvre, R.; Therrien, R. Comparing Vulnerability Mapping Methods in Two Canadian Hydrogeological Settings. In Proceedings of the Géo Québec 2004: 57ième Congrès canadien de géotechnique-5ième Congrès conjoint SCG/AIH-CHN/57th Canadian Geotechnical Conference-5th Joint CGS/IAH-CNC Conference, Quebec City, QC, Canada, 24–27 October 2004. [Google Scholar]
- Saaty, T.L. Decision making with the analytic hierarchy process. Int. J. Serv. Sci. 2008, 1, 83. [Google Scholar] [CrossRef] [Green Version]
- Ouedraogo, I.; Defourny, P.; Vanclooster, M. Mapping the groundwater vulnerability for pollution at the pan African scale. Sci. Total. Environ. 2016, 544, 939–953. [Google Scholar] [CrossRef]
- Li, R. Groundwater Pollution Risk Assessment under Scenarios of Climate and Land Use Change in the Northern Great Plains. Ph.D. Thesis, University of Nebraska-Lincoln, Lincoln, NE, USA, 2012; p. 45. [Google Scholar]
- Li, R.; Merchant, J.W. Modeling vulnerability of groundwater to pollution under future scenarios of climate change and biofuels-related land use change: A case study in North Dakota, USA. Sci. Total. Environ. 2013, 447, 32–45. [Google Scholar] [CrossRef] [Green Version]
- Toews, M.; Allen, D.M. Evaluating different GCMs for predicting spatial recharge in an irrigated arid region. J. Hydrol. 2009, 374, 265–281. [Google Scholar] [CrossRef]
- Scibek, J.; Allen, D.M. Modeled impacts of predicted climate change on recharge and groundwater levels. Water Resour. Res. 2006, 42, 1–18. [Google Scholar] [CrossRef]
- Pointer, C. Groundwater and Climate Change. In Proceedings of the IAH Working Group of Groundwater and Climate Change Meeting, Norwich, UK, 4–6 April 2005. [Google Scholar]
- Ducci, D. Influence of Climate Changes on Vulnerability Maps. In Proceedings of the First Conference and Workshop on “Groundwater and Climate Change”, Norwich, UK, 4–6 April 2005. [Google Scholar]
- Luers, A.L.; Lobell, D.B.; Sklar, L.S.; Addams, C.; A Matson, P. A method for quantifying vulnerability, applied to the agricultural system of the Yaqui Valley, Mexico. Glob. Environ. Chang. 2003, 13, 255–267. [Google Scholar] [CrossRef]
- Dennis, I.; Dennis, R. Climate Change Vulnerability Index for South African Aquifers. Water SA 2012, 38, 417–426. Available online: http://www.scielo.org.za/pdf/wsa/v38n3/08.pdf (accessed on 15 February 2017). [CrossRef] [Green Version]
- Albuquerque, M.; Sanz, G.; Oliveira, S.F.; Martínez-Alegría, R.; Antunes, I.M. Spatio-Temporal Groundwater Vulnerability Assessment—A Coupled Remote Sensing and GIS Approach for Historical Land Cover Reconstruction. Water Resour. Manag. 2013, 27, 4509–4526. [Google Scholar] [CrossRef]
- Pórcel, R.A.D.; Schüth, C.; De León-Gómez, H.; Hoppe, A.; Lehné, R. Land-Use Impact and Nitrate Analysis to Validate DRASTIC Vulnerability Maps Using a GIS Platform of Pablillo River Basin, Linares, N.L., Mexico. Int. J. Geosci. 2014, 5, 1468–1489. [Google Scholar] [CrossRef] [Green Version]
- Stevenazzi, S.; Masetti, M.; Nghiem, S.; Sorichetta, A. Groundwater vulnerability maps derived from a time-dependent method using satellite scatterometer data. Hydrogeol. J. 2015, 23, 631–647. [Google Scholar] [CrossRef]
- Xi, X.; Sun, C.Z.; Wu, T.; Zhng, D.F. Spatial-temporal evolution of groundwater vulnerability in the lower reaches of the Liaohe River plain. Acta Ecol. Sin. 2016, 36, 3074–3083. [Google Scholar] [CrossRef]
- Paradis, D.; Vigneault, H.; Lefebvre, R.; Savard, M.; Ballard, J.-M.; Qian, B. Groundwater nitrate concentration evolution under climate change and agricultural adaptation scenarios: Prince Edward Island, Canada. Earth Syst. Dyn. Discuss. 2015, 6, 1339–1394. [Google Scholar] [CrossRef]
- Saouini, H.E.; Amharref, M.; Bernoussi, A.S. Vulnérabilité à La Pollution des Eaux Souterraines: Statique ou Dynamique? Application à la Nappe de R’Mel (Maroc). Int. J. Innov. Appl. Stud. 2014, 6, 929–940. [Google Scholar]
- Secunda, S.; Collin, M.; Melloul, A. Groundwater vulnerability assessment using a composite model combining DRASTIC with extensive agricultural land use in Israel’s Sharon region. J. Environ. Manag. 1998, 54, 39–57. [Google Scholar] [CrossRef]
- Meunier, F. Caractérisation Hydrodynamique des Sols Pour la Cartographie de la Vulnérabilité de la Nappe des Triffa (Maroc Nord-Oriental). Master’s Thesis, Agro-Louvain, UCL, Ottignies-Louvain-la-Neuve, Belgium, 2012; p. 120. [Google Scholar]
- Baghapour, M.A.; Nobandegani, A.F.; Talebbeydokhti, N.; Bagherzadeh, S.; Nadiri, A.A.; Gharekhani, M.; Chitsazan, N. Optimization of DRASTIC method by artificial neural network, nitrate vulnerability index, and composite DRASTIC models to assess groundwater vulnerability for unconfined aquifer of Shiraz Plain, Iran. J. Environ. Health Sci. Eng. 2016, 14, 13. [Google Scholar] [CrossRef] [Green Version]
- Ehteshami, M.; Peralta, R.C.; Eisele, H.; Deer, H.; Tindall, T. Assessing Pesticide Contamination to Ground Water: A Rapid Approach. Ground Water 1991, 29, 862–868. [Google Scholar] [CrossRef] [Green Version]
- Huang, L.; Zeng, G.; Liang, J.; Hua, S.; Yuan, Y.; Li, X.; Dong, H.; Liu, J.; Nie, S.; Liu, J. Combined Impacts of Land Use and Climate Change in the Modeling of Future Groundwater Vulnerability. J. Hydrol. Eng. 2017, 22, 05017007. [Google Scholar] [CrossRef]
- Ouedraogo, I.; Vanclooster, M. A meta-analysis and statistical modelling of nitrates in groundwater at the African scale. Hydrol. Earth Syst. Sci. 2016, 20, 2353–2381. [Google Scholar] [CrossRef] [Green Version]
- Girard, A. Modélisation Spatio-Temporelle de la Pollution Diffuse des Eaux Souterraines à L’échelle Africaine. Master’s Thesis, Université Catholique de Louvain, Ottignies-Louvain-la-Neuve, Belgium, 2017; p. 104. [Google Scholar]
- Gogu, R.C.; Dassargues, A. Current and future trends in groundwater vulnerability assessment. Environ. Geol. 2000, 39, 549–559. [Google Scholar] [CrossRef]
- Raupach, M.; Haverd, V.; Briggs, P.R. Sensitivities of the Australian terrestrial water and carbon balances to climate change and variability. Agric. For. Meteorol. 2013, 182, 277–291. [Google Scholar] [CrossRef] [Green Version]
- Xu, Y.; Usher, B. Groundwater Pollution in Africa. Groundw. Pollut. Africa 2006, 353. [Google Scholar] [CrossRef]
- Lapworth, D.J.; Nkhuwa, D.C.W.; Okotto-Okotto, J.; Pedley, S.; Stuart, M.E.; Tijani, M.N.; Wright, J. Urban groundwater quality in sub-Saharan Africa: Current status and implications for water security and public health. Hydrogeol. J. 2017, 25, 1093–1116. [Google Scholar] [CrossRef] [PubMed] [Green Version]
- Vaezihir, A.; Tabarmayeh, M. Total vulnerability estimation for the Tabriz aquifer (Iran) by combining a new model with DRASTIC. Environ. Earth Sci. 2015, 74, 2949–2965. [Google Scholar] [CrossRef]
- Yang, Y.S.; Wang, L. Catchment-scale vulnerability assessment of groundwater pollution from diffuse sources using the DRASTIC method: A case study. Hydrol. Sci. J. 2010, 55, 1206–1216. [Google Scholar] [CrossRef] [Green Version]
- Barrett, J.; Burke, I.C. Nitrogen Retention in Semiarid Ecosystems Across a Soil Organic-Matter Gradient. Ecol. Appl. 2002, 12, 878–890. [Google Scholar] [CrossRef]
- Rahman, A. A GIS based DRASTIC model for assessing groundwater vulnerability in shallow aquifer in Aligarh, India. Appl. Geogr. 2008, 28, 32–53. [Google Scholar] [CrossRef]
- M’mayi, L.P. Sanitation and Groundwater Protection—A UNEP Perspective UNEP/DEWA. 2014. Available online: http://www.bgr.bund.de/EN/Themen/Wasser/Veranstaltungen/symp_sanitatgwprotect/present_mmayi_pdf.pdf?blob=publicationFile&v=2 (accessed on 13 August 2014).
- Gwebu, T.D. Environmental problems among low income urban residents: An empirical analysis of old Naledi-Gaborone, Botswana. Habitat Int. 2003, 27, 407–427. [Google Scholar] [CrossRef]
- Ren, W.; Zhong, Y.; Meligrana, J.; Anderson, B.; Watt, W.; Chen, J.; Leung, H.-L. Urbanization, land use, and water quality in Shanghai. Environ. Int. 2003, 29, 649–659. [Google Scholar] [CrossRef]
- Wright, A. Groundwater Contamination as a Result of Developing Urban Settlement: Report to the Water Research Commission; WRC Report No. 514/1/99; Council for Scientific and Industrial Research (CSIR): Pretoria, South Africa, 1999. [Google Scholar]
- Zingoni, E.; Love, D.; Magadza, C.; Moyce, W.; Musiwa, K. Effects of a semi-formal urban settlement on groundwater quality. Phys. Chem. Earth Parts A/B/C 2005, 30, 680–688. [Google Scholar] [CrossRef]
- Magadzire, F.; Love, I.; Meck, M.; Owen, R.; Musiwa, K.; Mangeya, P.; Magadza, C.; Love, D.; Tekere, M.; Ravengai, S.; et al. Characterization of diffuse pollution of shallow groundwater in the Harare urban area, Zimbabwe. In Groundwater Pollution in Africa; Informa UK Limited: London, UK, 2006; pp. 65–75. [Google Scholar]
- Yang, H.; Bain, R.; Bartram, J.; Gundry, S.; Pedley, S.; Wright, J. Water Safety and Inequality in Access to Drinking-water between Rich and Poor Households. Environ. Sci. Technol. 2013, 47, 1222–1230. [Google Scholar] [CrossRef] [PubMed]
- UPGro. Groundwater and Poverty in Sub-Saharan Africa; UPGro Working Paper; Skat Foundation: St. Gallen, Switzerland, June 2017; Available online: https://opus.lib.uts.edu.au/bitstream/10453/104407/1/groundwater-and-poverty-report_0003.pdf (accessed on 7 October 2017).
- Sorensen, J.; Lapworth, D.J.; Marchant, B.; Nkhuwa, D.; Pedley, S.; Stuart, M.; Bell, R.; Chirwa, M.; Kabika, J.; Liemisa, M.; et al. In-situ tryptophan-like fluorescence: A real-time indicator of faecal contamination in drinking water supplies. Water Res. 2015, 81, 38–46. [Google Scholar] [CrossRef] [PubMed] [Green Version]
- Saley, M.; Jourda, J.; Deh, S.; Oga, Y.; Kouam, K.; Kouadio, B.; Vermeulen, P. Contamination of the Abidjan Aquifer by sewage. In Groundwater Pollution in Africa; Informa UK Limited: London, UK, 2006; pp. 289–299. [Google Scholar] [CrossRef]
- Struckmeier, W.; Richts, A. Groundwater resources of the world 1: 25 000 000 (Hannover: World-wide Hydrogeological Mapping and Assessment Programme (WHYMAP)). 2008. Available online: https://www.un-igrac.org/sites/default/files/resources/files/GroundwaterResourcesMap_ed2008_25m_WHYMAP.pdf (accessed on 15 May 2020).
- Macdonald, A.; Bonsor, H.C.; Dochartaigh, B.É.Ó.; Taylor, R.G. Quantitative maps of groundwater resources in Africa. Environ. Res. Lett. 2012, 7, 024009. [Google Scholar] [CrossRef]
- Altchenko, Y.; Villholth, K.G. Mapping irrigation potential from renewable groundwater in Africa—A quantitative hydrological approach. Hydrol. Earth Syst. Sci. Discuss. 2014, 11, 6065–6097. [Google Scholar] [CrossRef]
- Naumann, G.; Barbosa, P.; Garrote, L.; Iglesias, A.; Vogt, J.V. Exploring drought vulnerability in Africa: An indicator based analysis to be used in early warning systems. Hydrol. Earth Syst. Sci. 2014, 18, 1591–1604. [Google Scholar] [CrossRef] [Green Version]
- Jaroslav Vrba (UNESCO-IHP); Andrea Richts (BGR). The Global Map of Groundwater Vulnerability to Floods and Droughts of 1:25,000,000. Explanatory Notes. 2015. Available online: https://www.whymap.org/whymap/EN/Maps_Data/Gwv/whymap_ed2015_explan_notes.pdf?__blob=publicationFile&v=3 (accessed on 15 May 2020).
- Ippolito, A.; Kattwinkel, M.; Rasmussen, J.J.; Schäfer, R.B.; Fornaroli, R.; Liess, M. Modeling global distribution of agricultural insecticides in surface waters. Environ. Pollut. 2015, 198, 54–60. [Google Scholar] [CrossRef]
- Amini, M.K.C.; Abbaspour, M.; Berg, L.; Winkel, S.J.; Hug, E.; Hoehn, H.C.; Johnson, C.A. Statistical modeling of global geogenic arsenic contamination in groundwater. Environ. Sci. Technol. 2008, 42, 3669–3675. [Google Scholar] [CrossRef]
- Amini, M.K.; Mueller, K.C.; Abbaspour, T.; Rosenberg, M.; Afyuni, K.N.; Møller, M.S.; Johnson, C.A. Statistical modeling of global geogenic fluoride contamination in groundwaters. Environ. Sci. Technol. 2008, 42, 3662–3668. [Google Scholar] [CrossRef] [Green Version]
- Ouedraogo, I.; Defourny, P.; Vanclooster, M. Application of random forest regression and comparison of its performance to multiple linear regression in modeling groundwater nitrate concentration at the African continent scale. Hydrogeol. J. 2018, 27, 1081–1098. [Google Scholar] [CrossRef]
- Li, F.; Phoon, K.K.; Du, X.; Zhang, M. Improved AHP Method and Its Application in Risk Identification. J. Constr. Eng. Manag. 2013, 139, 312–320. [Google Scholar] [CrossRef] [Green Version]
- Lyu, H.-M.; Sun, W.-J.; Shen, S.-L.; Zhou, A.-N. Risk Assessment Using a New Consulting Process in Fuzzy AHP. J. Constr. Eng. Manag. 2020, 146, 04019112. [Google Scholar] [CrossRef]
- Bonsor, H.C.; MacDonald, A.M. An Initial Estimate of Depth to Groundwater across Africa. Available online: http://nora.nerc.ac.uk/id/eprint/17907/ (accessed on 15 May 2020).
Figure 1.
Impact of climate change, land use change, and environmental factors on groundwater (modified from [34]).
Figure 1.
Impact of climate change, land use change, and environmental factors on groundwater (modified from [34]).

Figure 2.
Rating of recharge (R) map in Africa for 1990, 2000, and 2010.

Figure 3.
Rating of population density (P) map in Africa for 1990, 2000, and 2010.

Figure 4.
Depth to groundwater (D) rate map for Africa ([1]).
Figure 4.
Depth to groundwater (D) rate map for Africa ([1]).

Figure 5.
Groundwater pollution risk for 1990, 2000, and 2010.

Figure 6.
Relative comparison of groundwater pollution risk between (a) 2000 and 1990, (b) 2010 and 2000, and (c) 2010 and 1990 for the African continent.
Figure 6.
Relative comparison of groundwater pollution risk between (a) 2000 and 1990, (b) 2010 and 2000, and (c) 2010 and 1990 for the African continent.

Figure 7.
Difference of groundwater vulnerability between (a) 2000 and 1990, (b) 2010 and 2000, and (c) 2010 and 1990 for the African continent.
Figure 7.
Difference of groundwater vulnerability between (a) 2000 and 1990, (b) 2010 and 2000, and (c) 2010 and 1990 for the African continent.


Table 1.
Weight values for the DRASTIC parameters [11].
Table 1.
Weight values for the DRASTIC parameters [11].
| Symbol | Parameter | Weight |
|---|---|---|
| D | Depth to Water | 5 |
| R | Net Recharge | 4 |
| A | Aquifer media (type) | 3 |
| S | Soil media (type) | 2 |
| T | Topography | 1 |
| I | Impact of vadose zone (type) | 5 |
| C | Hydraulic Conductivity | 3 |
Table 2.
Weight, range and rating of the DRASTIC parameters and land-use parameter (based on [15,36]).
| Rating | Depth to Groundwater (D) (m) | Net Recharge (R) (mm/yr) | Aquifer Media (A) (Type) | Soil Media (S) (Type) | Topography (T) (%) | Impact of the Vadose Zone (I) (Type) | Hydraulic Conductivity (C) (m/day) | Land Use (D) (People/km2) |
|---|---|---|---|---|---|---|---|---|
| Weight: 5 | Weight: 4 | Weight: 3 | Weight: 2 | Weight: 1 | Weight: 5 | Weight: 3 | Weight: 1 | |
| 1 | >250 | 0–45 | - | Clay | >18 | - | <0.010 | 0–50 |
| 2 | 100–250 | - | - | - | - | - | 0.010–0.038 | 50–100 |
| 3 | 50–100 | 45–123 | Acid plutonic rocks | Clay loam | 12–18 | - | - | 100–150 |
| Intermediate plutonic rocks | ||||||||
| Basic plutonic rocks | ||||||||
| Silty clay loam | ||||||||
| Metamorphic rocks | ||||||||
| 4 | - | - | - | Sandy clay | - | Acid plutonic rocks | 0.038–0.127 | 150–200 |
| Intermediate plutonic rocks | ||||||||
| Sandy clay loam | Basic plutonic rocks | |||||||
| Metamorphic rocks | ||||||||
| 5 | 25–50 | - | - | Loam | 8–12 | - | - | 200–250 |
| 6 | - | 123–224 | Siliciclastic sediments | Sandy loam | - | Siliciclastic sediments | 0.127–0.345 | 250–300 |
| 7 | - | - | - | Loamy sand | - | Unconsolidated sediments | 300–350 | |
| 8 | 7–25 | 224–355 | Unconsolidated sediments | - | 4–8 | Water bodies | 0.345–0.569 | 350–400 |
| 9 | - | >355 | Acid volcanic rocks | Sand | 2–4 | Acid volcanic rocks | - | 400–450 |
| Intermediate volcanic rocks | ||||||||
| Intermediate volcanic rocks | Basic volcanic rocks | |||||||
| Basic volcanic rocks | ||||||||
| 10 | 0–7 | - | Mixed sedimentary rocks | - | 0–2 | Mixed sedimentary rocks | >0.569 | >450 |
| Carbonate sedimentary rocks | Carbonate sedimentary rocks | |||||||
| Evaporites | ||||||||
| Evaporites |
Table 3.
Percentage of area per class of pollution risk.
| Pollution Risk Class | |||||
|---|---|---|---|---|---|
| Year/Period | Very Low | Low | Moderate | High | Very High |
| 1990 | 91.98% | 5.5% | 1.66% | 0.55% | 0.29% |
| 2000 | 81.63% | 6.49% | 2.50% | 0.87% | 0.48% |
| 2010 | 86.79% | 7.94% | 3.22% | 1.26% | 0.76% |
© 2020 by the authors. Licensee MDPI, Basel, Switzerland. This article is an open access article distributed under the terms and conditions of the Creative Commons Attribution (CC BY) license (http://creativecommons.org/licenses/by/4.0/).
Share and Cite
MDPI and ACS Style
Ouedraogo, I.; Girard, A.; Vanclooster, M.; Jonard, F. Modelling the Temporal Dynamics of Groundwater Pollution Risks at the African Scale. Water 2020, 12, 1406. https://doi.org/10.3390/w12051406
AMA Style
Ouedraogo I, Girard A, Vanclooster M, Jonard F. Modelling the Temporal Dynamics of Groundwater Pollution Risks at the African Scale. Water. 2020; 12(5):1406. https://doi.org/10.3390/w12051406
Chicago/Turabian StyleOuedraogo, Issoufou, Arthur Girard, Marnik Vanclooster, and François Jonard. 2020. "Modelling the Temporal Dynamics of Groundwater Pollution Risks at the African Scale" Water 12, no. 5: 1406. https://doi.org/10.3390/w12051406
Note that from the first issue of 2016, this journal uses article numbers instead of page numbers. See further details here.