Pharmaceuticals Load in the Svihov Water Reservoir (Czech Republic) and Impacts on Quality of Treated Drinking Water


T.G. Masaryk Water Research Institute, 16000 Prague, Czech Republic
*
Author to whom correspondence should be addressed.
Water 2020, 12(5), 1387; https://doi.org/10.3390/w12051387
Submission received: 17 April 2020
/
Revised: 1 May 2020
/
Accepted: 6 May 2020
/
Published: 13 May 2020
(This article belongs to the Section Water Resources Management, Policy and Governance)
Abstract
:An important component of micropollutants are PPCPs (pharmaceuticals and personal care products). This paper contains the results of the monitoring of surface water, groundwater and wastewater in the surrounding area of the Svihov drinking water reservoir. Over the period 2017–2019, over 21,000 water samples were taken and analyzed for 112 pharmaceuticals, their metabolites, and other chemicals. The results are discussed in detail for two streams with the highest observed concentration of PPCPs (Hnevkovice, Dolni Kralovice) and two streams with the highest water inflow into the reservoir, representing also the highest mass flow of PPCPs into the reservoir (Miletin, Kacerov). The overall analysis of the results shows that acesulfame, azithromycin, caffeine, gabapentin, hydrochlorothiazide, ibuprofen and its metabolites, oxypurinol, paraxanthine, and saccharin (on some profiles up to tens of thousands ng/dm3) attain the highest concentration and occur most frequently. The evaluation of raw water and treated drinking water quality showed the significant positive effect of water retention in the reservoir (retention time of 413 days) and also of the treatment process, so that the treated drinking water is of high quality and contains only negligible residues of few PPCPs near the detection limit of the analytical method used.

1. Introduction
1.1. Work Scope and Objectives
As the accuracy of analytical methods develops, it is possible to detect more and more substances belonging to the group of so-called micropollutants in natural water, occurring at very low concentration (usually in ng/dm3 to μg/dm3). A very important group of these substances are PPCPs (pharmaceuticals and personal care products)—medicines, hormones, antibiotics, cosmetics, drugs and other substances, including metabolites of the primary pollutants (Ferrer, Thurman [1], Richardson [2]). In the European Union, residues of a number of medicinal preparations have been detected in surface water and groundwater, soil, and in animal tissues at concentrations that vary depending on the medicinal preparation as well as on the nature and proximity of the source. Some painkillers, antimicrobials, antidepressants, contraceptives, and anti-parasitics are commonly found. Traces of some medical preparations may also penetrate drinking water and certain foods—European Commission [3].
The above findings led to the research on the Svihov reservoir on the Zelivka River used for drinking water supply to the population of the capital city of Prague and its surroundings, in order to observe the occurrence of PPCP substances in the largest water source in the Czech Republic. There have been long-term problems with the unsatisfactory level of municipal wastewater treatment in the catchment of the reservoir, often manifested by increased residual content of basic nutrients (nitrogen, phosphorus) that contribute to eutrophic processes in the reservoir—Kvitek [4]. The objective of the research was to verify whether pharmaceuticals occur within the water flowing into the reservoir, and in the accumulated water in the Svihov reservoir, to determine the concentration and to examine how this is reflected in the quality of raw and treated drinking water. Nine surface inflows into the Svihov reservoir were selected and were sampled for PPCP substance content in the period February 2017–December 2018 at 2–4 week intervals. Samples of raw water from the reservoir and treated drinking water were also taken. All results are available in Supplementary Materials, Table S1. The paper deals with the selected four tributaries for capacity reasons. Subsequently, in 2019, additional sampling of discharged wastewater from the municipal wastewater treatment plant in Hnevkovice and analysis of groundwater from two municipal wells in Hnevkovice took place.
The research of Hrkal et al. [5] investigating the occurrence of pharmaceuticals in Karany, the second largest water source for Prague located north of the city with a capacity of up to 1 m3/s, was important for comparing with the results from the Svihov reservoir catchment area.
1.2. Current Situation
Because these substances do not yet have limits set for drinking water (in the Czech Republic or in other EU countries), their occurrence in natural raw water used for drinking water production attracts the attention of the professional and general public (Snyder [6]). From the perspective of drinking water production, the question is to what extent these substances can penetrate the entire water system (water accumulation, water treatment) up to the final product—drinking water (WHO [7,8]). The potential negative impact of PPCPs on human health at commonly observed concentrations in natural water has not yet been proved (Jones et al. [9], Stackelberg et al. [10]), therefore the term potential unquantified risk is used by Godoy et al. [11]. The World Health Organization (WHO) [7,8] states that, from the available data, medicinal preparations in drinking water at the identified low concentrations are unlikely to pose a threat to human health. However, WHO (World Health Organization) notes that the issue of residues of medicinal preparations cannot be ignored, as there may be potential effects of long-term exposure on vulnerable populations, implying the need to adopt a preventive approach, i.e., introducing a quality limit for drinking water. In addition, we do not yet sufficiently understand the potential ‘cocktail effects’ resulting from the combination of a wide range of medicinal preparations and other chemicals in the environment.
Surface and groundwater sources of drinking water receive these contaminants mainly from municipal wastewater, where they reflect the use of these chemicals by the population. Frequent occurrence of these substances is documented by many extensive studies, e.g., Bexfield et al. [12] summarizes the impact of pharmaceuticals on groundwater sources throughout the territory of the U.S.A. This study draws attention mainly to the impact on shallow water of agricultural areas, which is probably related to the decentralized disposal of wastewater containing residual concentrations of pharmaceuticals, both from human settlements and from livestock farms. These substances reach higher concentration especially in wastewater from hospitals, sanatoriums, senior homes, hospices and other places with high consumption of medicaments. Rozman et al. [13,14] report high medicaments concentration in “treated” wastewater discharged into the local stream from the Horni Berkovice Psychiatric Hospital, Czech Republic (gabapentin, hydrochlorothiazide, and carbamazepine reached the highest concentrations of up to several micrograms per liter). At the local level, sources of these substances from animal production and fish farms are important; here, various veterinary and nutritional products are commonly used [6]. However, as Battaglin et al. [15] point out, using the monitoring in Rocky Mountain National Park (U.S.A.) as an example, these substances are starting to be detected also in areas with little human activity; it is likely that these substances can be detected by today’s ultra-precise analytical methods.
Commonly used technologies of wastewater treatment (mechanical-biological treatment plants), especially in smaller municipalities, are usually not sufficiently effective and remove only part of these substances, which reach the surface recipient and partially infiltrate into groundwater. The low efficiency of municipal wastewater treatment in terms of PPCP substances is reported both by sources from the Czech Republic (Chen [16], Vymazal et al. [17,18]) and from abroad. The low efficiency of pharmaceuticals removal in conventional municipal wastewater treatment plants is reported, for example, by data from the U.S.A.—Lubliner et al. [19], from Switzerland—Tauxe-Wuersch et al. [20], or from research conducted in Germany—Kasprzyk/Hordern et al. [21]. A significant increase in micropollutant removal efficiency can be achieved by incorporating another stage of wastewater treatment, e.g., by including sorption filters with activated carbon (Rodriguez et al. [22]).
The behavior of these substances in the environment and their impact on aquatic ecosystems have been the subject of many studies (Jobling et al. [23], Kostich et al. [24], Standley et al. [25], Yamamoto [26], but there is still a lot of missing information on the transport properties, disintegration constants, sorption characteristics, accumulation in organisms, etc. (Kase [27]), because most of these substances have only recently been researched. Among them, we can name, e.g., Environmental risk limits for pharmaceuticals (RIVM) [28], who has been involved in The Netherlands in researching the risks and quality standards for four types of commonly occurring medicines in Dutch waters (carbamazepine, metformin, metoprolol, and amidotrizoic acid). The very broad spectrum of these substances, whose numbers are increasing with the rapid development of analytical procedures, is not beneficial for the early achievement of the research results needed to set quality limits. Today, tens to hundreds of individual substances are routinely analyzed in every sample.
In the Czech Republic, there are no legal limits for the content of pharmaceuticals in drinking water. In addition, the same situation applies at the European Union level, but a process to identify new potentially harmful substances exists. Article 8c of the Priority Substances Directive [29,30] requires the European Commission to propose a strategic approach to water pollution by pharmaceuticals (Marsland, Roy [31]). Under Article 8b of this Directive, the Commission is to update the list of monitored substances every two years. These substances may pose a significant risk to or via the aquatic environment and there is insufficient monitoring data on the actual risk they present. According to the current Commission Implementing Decision (EU) [32], a watch list has been set up for monitoring substances throughout the European Union in the field of water policy, updated every two years. The currently valid list contains the following PPCP substances or groups of substances: 17-alpha-ethinylestradiol (EE2), 17-beta-estradiol E2), estrone (E1), macrolide antibiotics (erythromycin, clarithromycin, azithromycin), methiocarb, neonicotinoids (imidacloprid, thiacloprid, thiamethoxam, clothianidin, acetamiprid), amoxicillin, and ciprofloxacin.
Other approaches include the International Memorandum (Wirtz [33]), which defined the so-called ‘target value for pharmaceuticals in surface water for abstraction of drinking water’, at 100 ng/dm3 for each individual chemical in the micro-pollutant group, including pharmaceuticals. It should be noted that this limit of 100 ng/dm3 already applies to drinking water in the Czech Republic [34] for the individual pesticides and their metabolites (with the exception of aldrin, dieldrin, heptachlor and heptachlorepoxide with a limit of 30 ng/dm3), as well as for individual polyaromatic hydrocarbons. Based on the concentration of pharmaceuticals detected in our monitoring, it appears that the 100 ng/dm3 limit may also be the appropriate value for assessing the quality of water used for drinking water supply, regarding the presence of pharmaceuticals and their metabolites. This limit may be the target value at least until specific limit values are established for major occurring pharmaceuticals, based on long-term research and assessments of health and environmental risks.
2. Materials and Methods
2.1. Svihov Water Reservoir
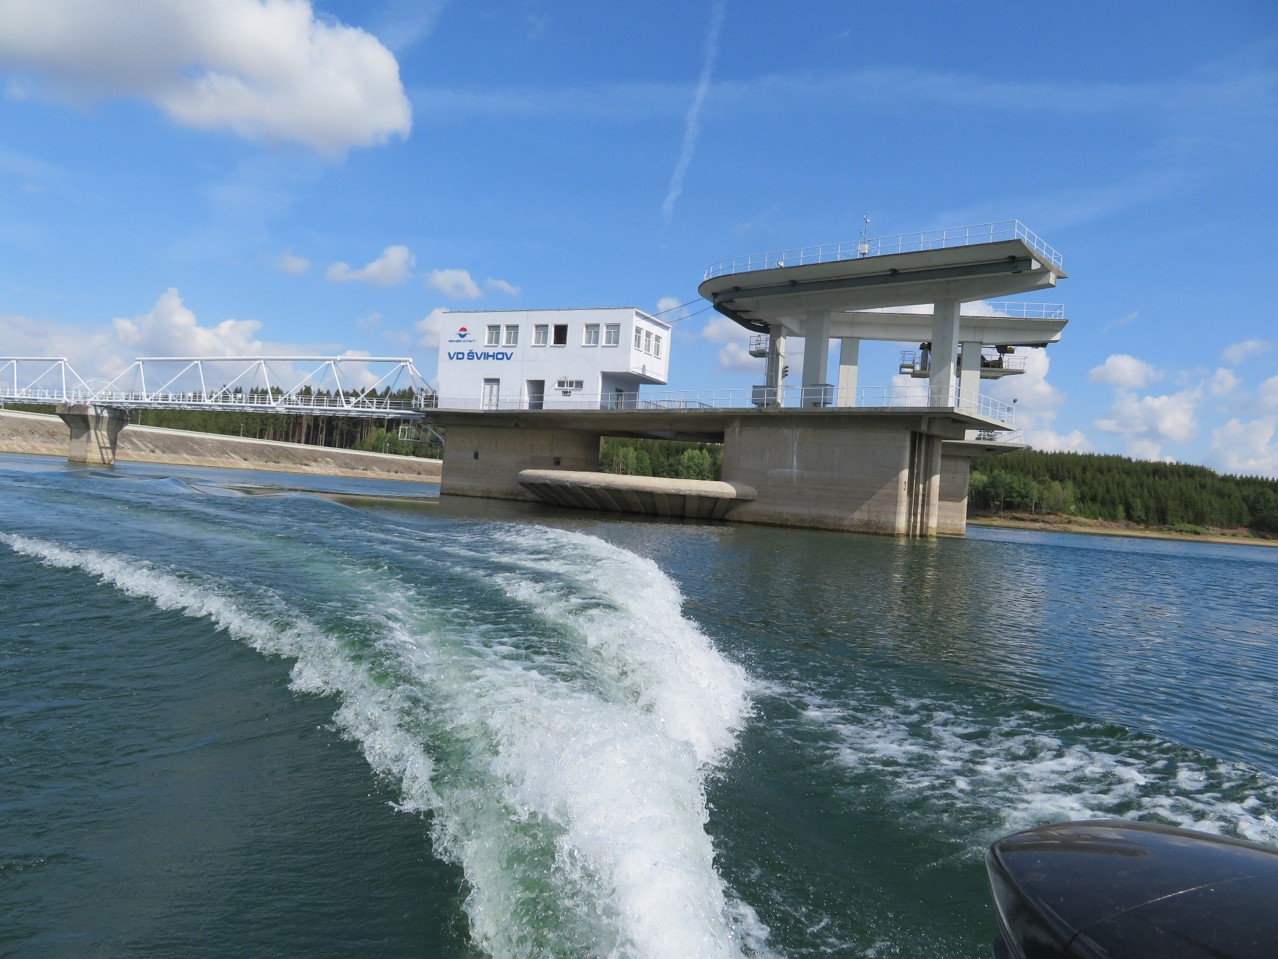
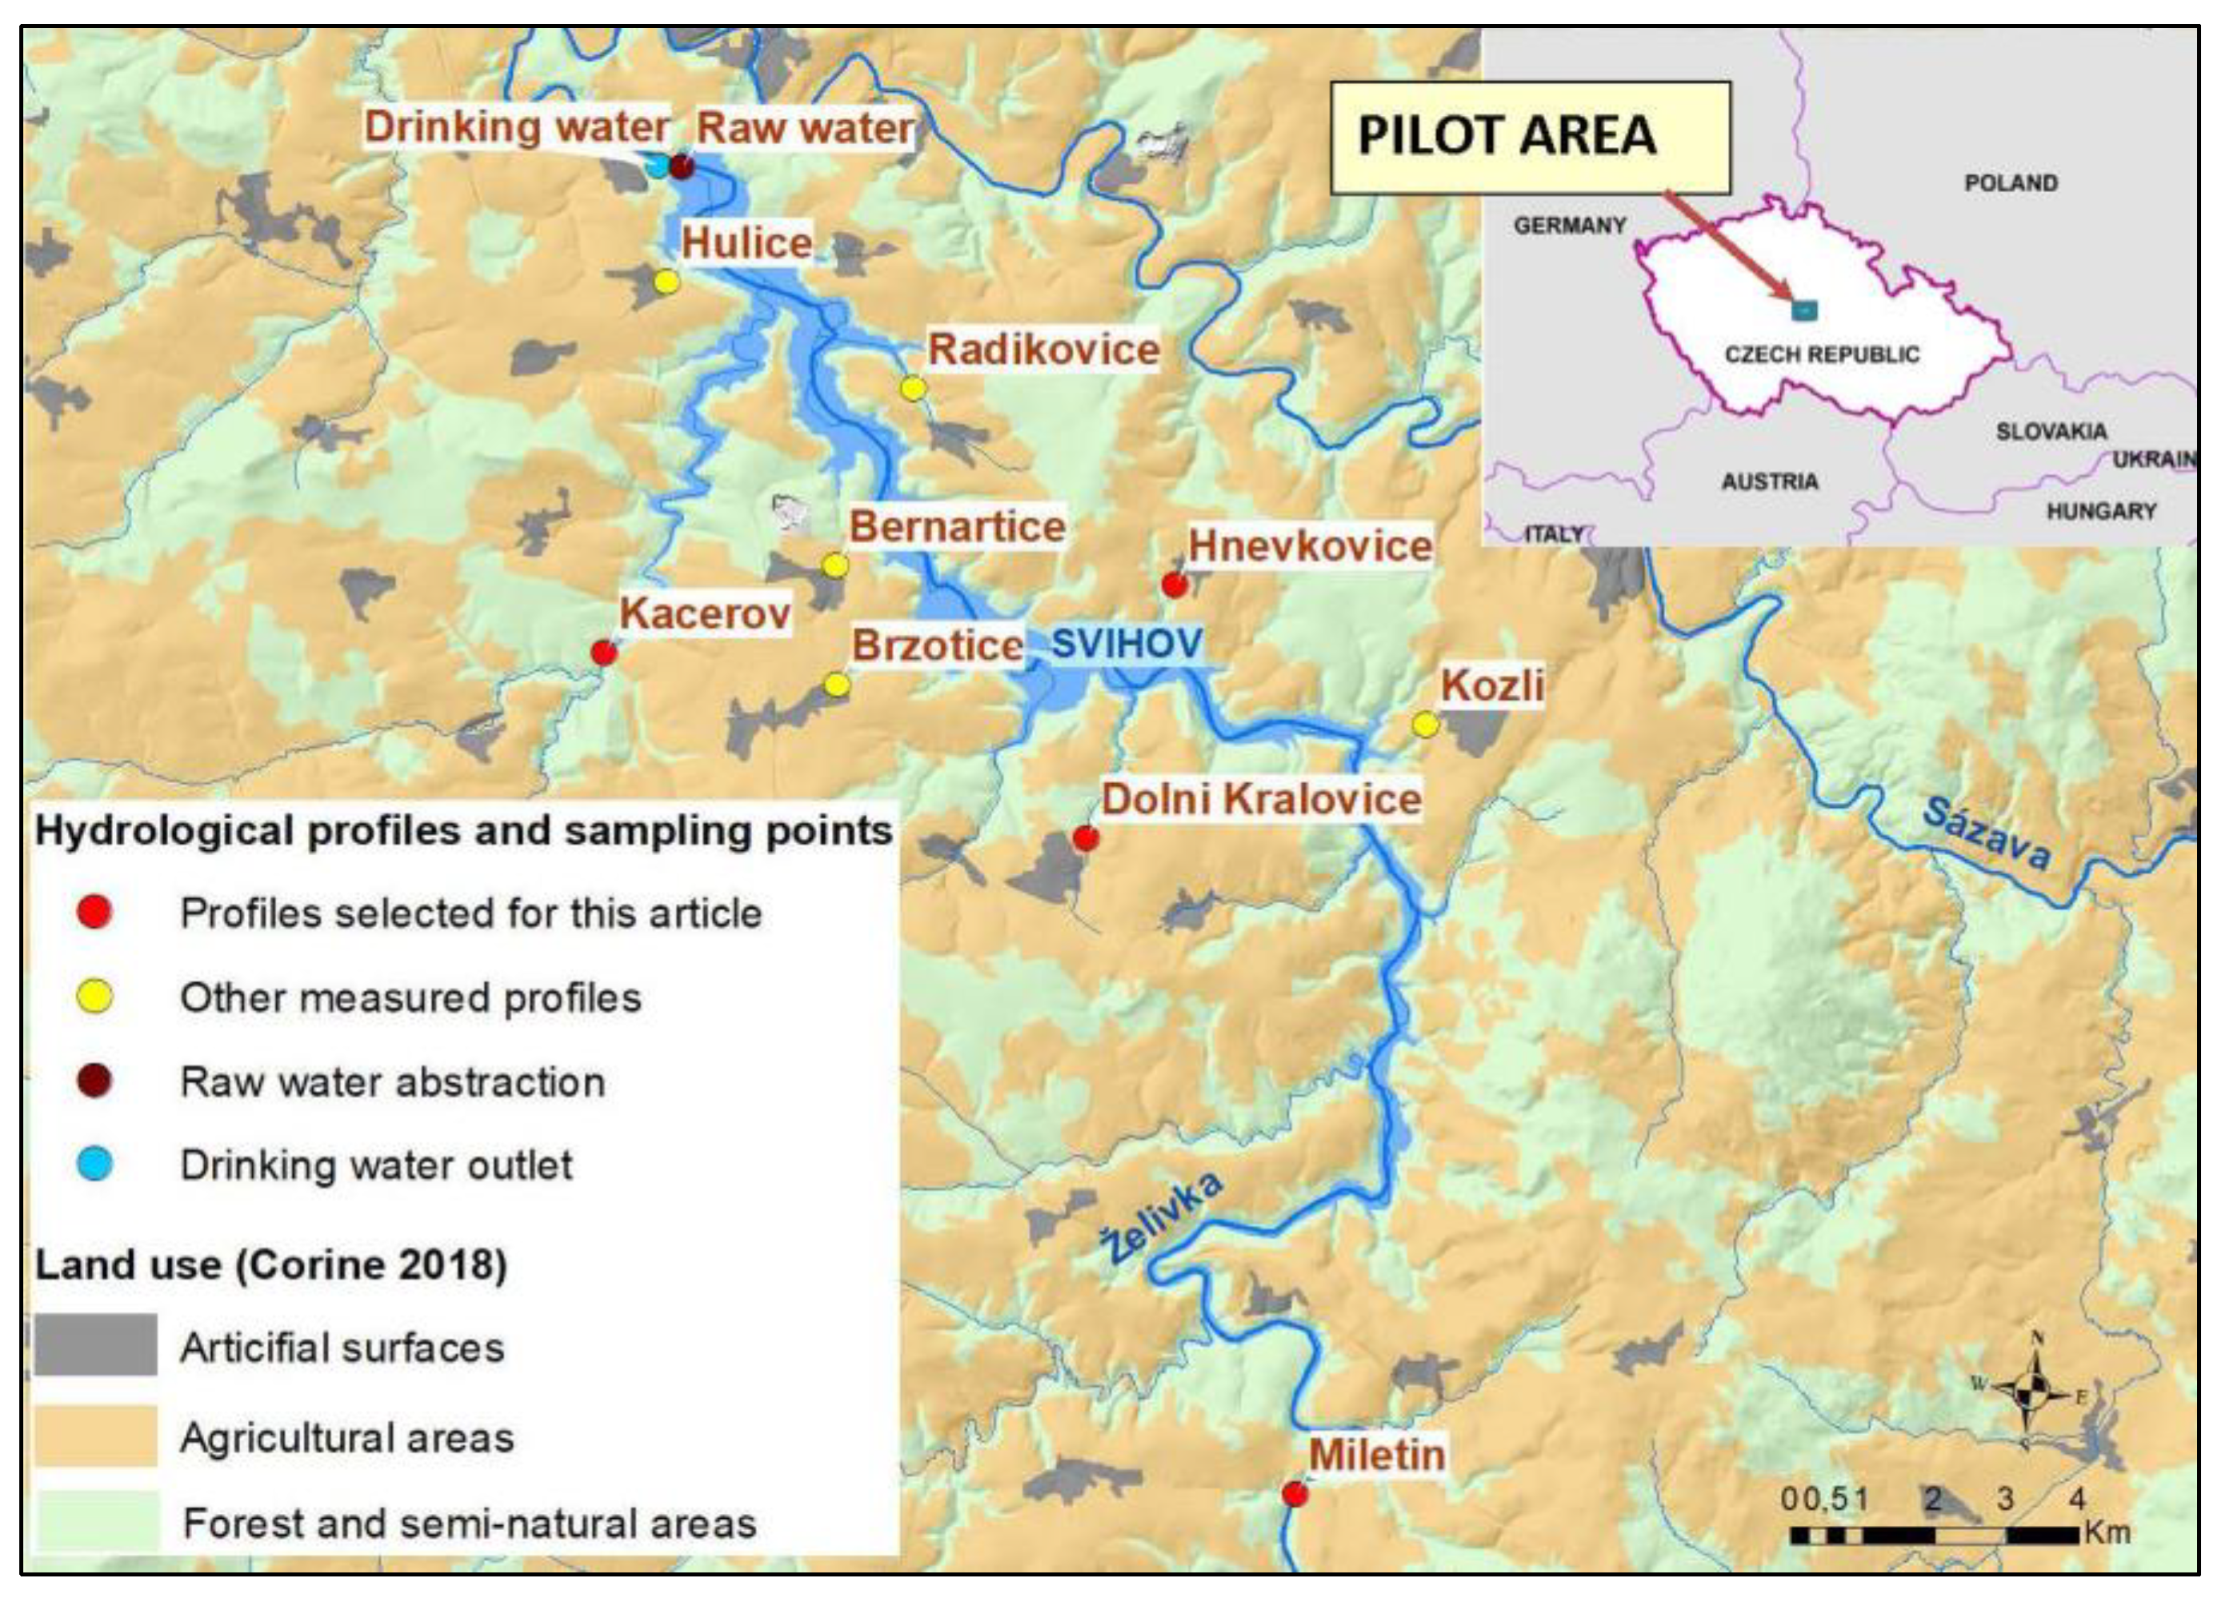
The Svihov reservoir (Figure 1) on the Zelivka River is located in the central part of the Czech Republic, about 50 km south-west from the capital city of Prague, in the Czech-Moravian Highlands at an altitude of 392 m. It is the largest reservoir in Central Europe used for drinking water supply. Completed in 1975, the backwater of the Zelivka-Svihov water reservoir reaches back 39.1 km, the total reservoir volume is 309.0 million m3, the flooded area is 1603 hectares, and the hydrological catchment area of the reservoir is 1178 km2. The water supply has a capacity of 3.1 m3/s and covers about two thirds of the drinking water needs of the inhabitants of the capital city and its surroundings. The average long-term annual flow rate at the dam profile is 6.93 m3/s, and the 100-year-old flow rate attains 316.0 m3/s (www.pvl.cz [35]).
2.2. Monitoring Methodology 2017–2018
A number of small local watercourses with a high proportion of wastewater, often poorly treated, from small municipalities around the reservoir flow into it and therefore PPCP type constituents were expected here (Morteani et al. [36], Swartz et al. [37], Kozisek et al. [38], Datel et al. [39]). The largest surface water inflows into the reservoir were identified in the project and nine main inflows with a significant proportion of wastewater from local municipalities were selected. Here, nine hydrological profiles were built (Figure 1) characterizing the source water for the Svihov reservoir. The profiles were used for flow rate measurement and water sampling. The largest inflow into the reservoir is the Zelivka River (Miletin profile).
The flow rates were measured using a Cipoletti or Thomson spillway (sharp edge trapezoidal or triangular spillway), and the overflow height was measured using the Solinst Levelogger Edge automatic probe [40] positioned at the spillway. Control measurements (always at the time of sampling) were carried out using a measuring vessel and a stopwatch. On the streams with higher flow rates (i.e., Miletin, Kacerov), CHMI (Czech Hydrometeorological Institute) [41] data were used.
The samples were taken in one-month intervals, yet in the summer period (July–August), when we expected a decrease in flow rates and thus an increase in the concentration of the monitored substances, the sampling period was shortened to a frequency of two to four times a month. The sampling points were located below the discharge point of treated wastewater from the WWTPs (wastewater treatment plants). Simultaneously with the sampling of nine selected hydrological profiles, a sample of raw water was also taken from the reservoir at the inlet of the raw water treatment plant, and a sample of the treated drinking water entering the water supply system. Sampling was carried out in accordance with the relevant technical standards of the ISO 5667 series. A volumetric sampler on a telescopic rod was used to sample surface water, immersed in the water stream. Samples of raw and drinking water were taken from standard sampling taps in the raw water treatment plant. Within 32 sampling rounds, 21,174 water samples were taken from 20 February, 2017, to 12 November, 2018. Each sampling round was performed within one day.
At the start of the project in 2017, the laboratory offered to determine 46 different pharmaceuticals; however, their number was increasing very rapidly, and by the second half of 2018, the laboratory was already able to analyze 93 different pharmaceuticals and their metabolites. In the follow-up monitoring in 2019 (see below), 20 more substances were added to 113 substances (Table 1 and Table 2). The negative aspect of this development is the varying length of monitoring series duration for the individual substances.
2.3. Additional Monitoring in 2019
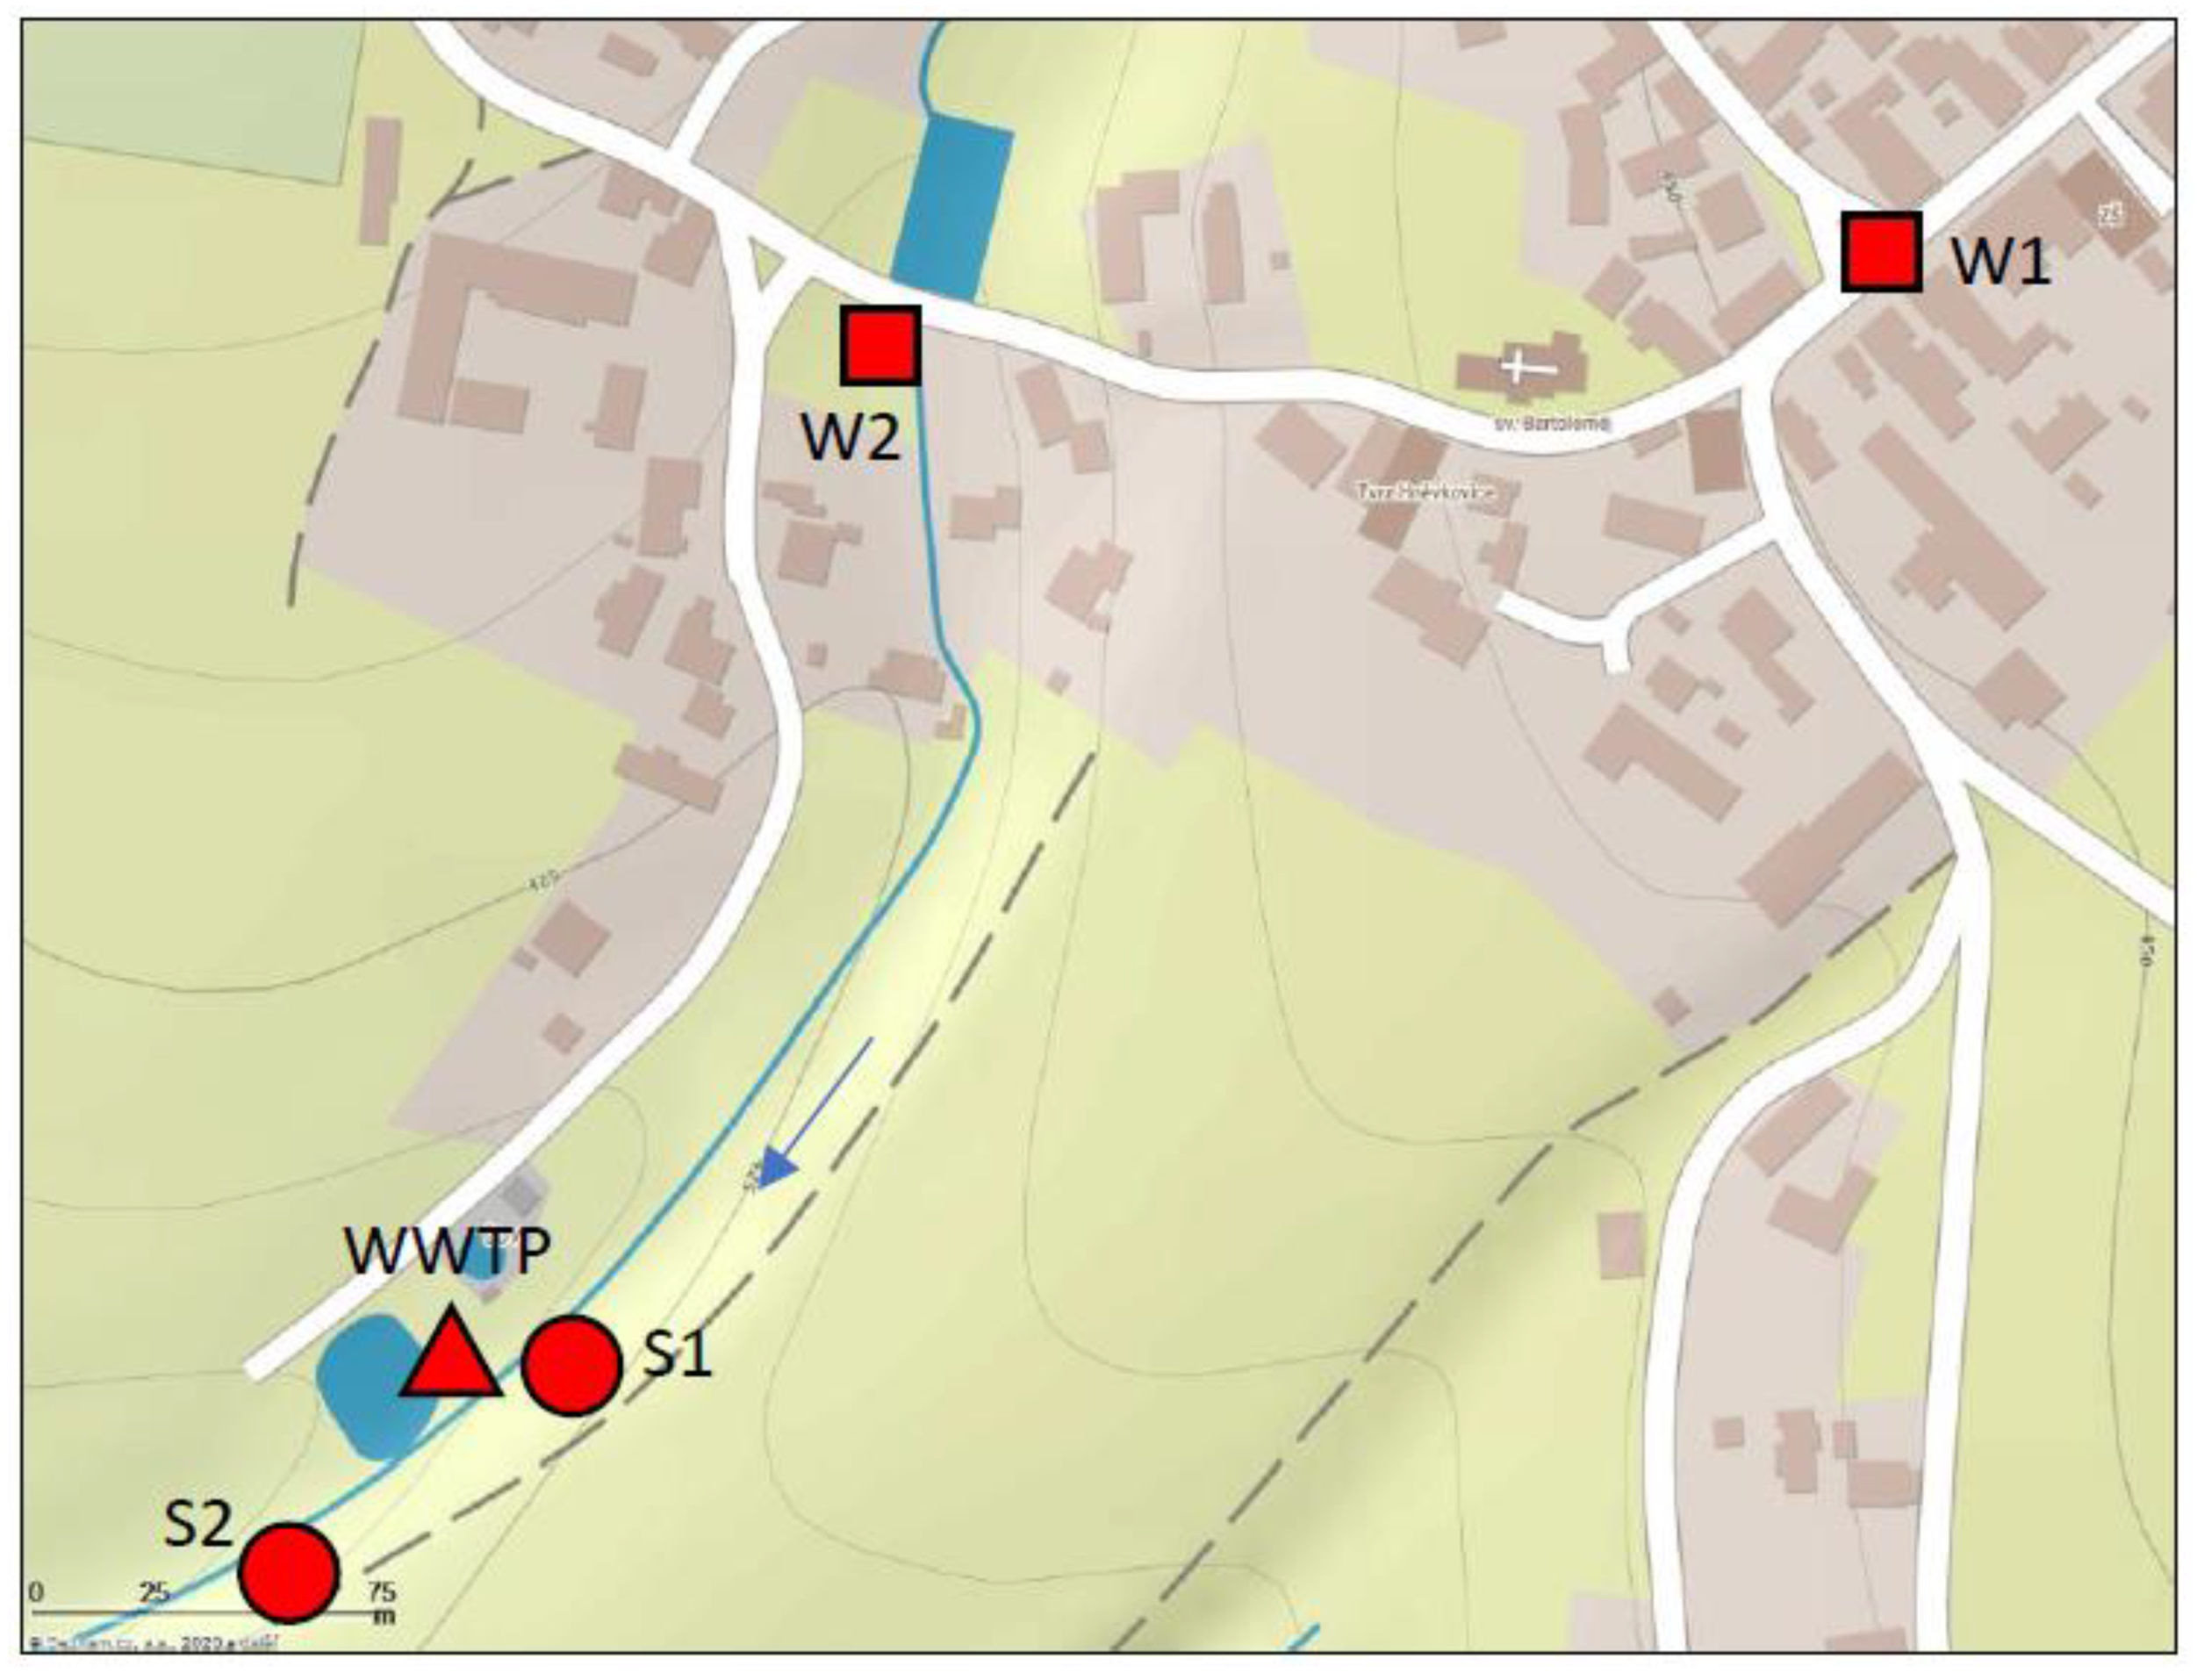
The monitoring results of 2017–2018 showed relatively high concentrations of PPCP substances in some local stream flow profiles. One of them was the Hnevkovice profile, which was selected for additional research. Samples from two wells in Hnevkovice were taken to compare the load in surface and groundwater, and in 2019 pre-treated wastewater from the municipal WWTP and water from the receiving stream (i.e., Hnevkovice Creek) were sampled (Figure 2). Point S1 was chosen at the Hnevkovice Creek 20 m above the water discharge from the WWTP, and point S2 on the Hnevkovice Creek 20 m below the water discharge from the WWTP (point S2 is identical to the Hnevkovice profile from monitoring in 2017–2018). Two accessible municipal wells W1 and W2 were used for groundwater sampling. Sampling was carried out according to relevant technical standards ISO 5667 series.
Wastewater is discharged from the WWTP at regular intervals of several minutes. The number and frequency of sampling was designed with respect to regular changes during the daily WWTP operation cycle. Two sampling cycles took place on 27–28 June and 21–22 October 2019. In one sampling cycle, one water sample was taken every three hours, i.e., eight samples per 24 h. Sampling of treated wastewater from the municipal wastewater treatment plant in the village of Hnevkovice was designed to determine the level and fluctuations of PPCP pollutant concentration in wastewater flowing to the Hnevkovice stream (and subsequently to the Svihov reservoir). One-off samples were also taken from the receiving stream (i.e., Hnevkovice Creek) above and below the discharge from the WWTP, in order to determine the impact of the discharged wastewater on water quality in the stream.
One-off sampling was carried out in accordance with the relevant technical standards of the ISO 5667 series. A volumetric zonal sampler on a rope was used to obtain the groundwater sample from the dug wells; water was sampled at about 0.5 m below the surface. A volumetric sampler on a telescopic rod was used to sample the wastewater and surface water and was immersed in the WWTP effluent or surface water flow.
2.4. Laboratory Work Methodology
The collected water samples were poured into glass sample bottles with ground neck/closure provided by the laboratory. The samples were stored in a refrigerated safety box according to the instruction of the laboratory and transported to an accredited laboratory, usually within a time between 6-10 h, where they were refrigerated, and the bottles were stored in an inclined position. The samples were analyzed by an accredited laboratory of the state-owned enterprise Povodi Vltavy (Vltava Watershed Authority) in Plzen, according to the internal standard operating procedures (SOP O-19-A) using the LC/MS (liquid chromatography/mass spectrometry) analytical method.
One multicomponent method was used for all analytes from the group of pharmaceuticals - direct injection of the water sample after centrifugation, pH adjustment (acidification) and an addition of a mixture of isotopically labeled standards. Micropollutants were measured with Agilent Technologies 1290 Infinity II UHPLC system coupled to an Agilent 6495 Triple Quadrupole MS system using a Waters Xbridge C18 column (4.6 × 100 mm, particle size 3.5 μm) supplemented with a pre-column, with an injection volume of 50 µL (manufacturer Agilent Technologies International Pte. Ltd., Yishun Ave 7, 768923 Singapore).
Within method validation, stability tests were performed to confirm the stability of all analytes in the sample for at least three weeks when refrigerated at an inclined position. The sample had to be cooled as soon as possible after collection and then frozen.
The quality of the analytical work was assured by adding isotopically labeled standards to each sample (internal standard method). The samples were evaluated on an eight-point linear calibration curve over a concentration range of 10–2000 ng/dm3. In each group of samples, two blank samples and two quality control samples of the entire procedure (independent mixture of all analytes added to water) were measured and evaluated. In addition, every fifth sample was measured in duplicate (once without addition and once with the addition of an independent mixture of all analytes) and the actual yields in the given matrix were calculated from the concentration difference and included in the final concentration calculation.
2.5. Processing of Chemical Analysis Results
The PPCP analytical data processing method encounters a problem caused by the fact that a significant part of the results lies below the detection limit. One solution could be that only results above the detection limit will be presented. This would, however, result in a significant distortion of the situation and underestimation of the results obtained.
Finally, a solution on the safe side, respecting the precautionary principle, was chosen as the basic approach to the risk analysis: samples with values below the detection limit are for the purposes of display in charts and the calculation of statistical parameters used at the detection limit concentration. Obviously, this approach has its drawbacks and presents the theoretically most unfavorable situation. However, given the importance of the research for the safety of the population, we consider this approach to be relatively the most correct one.
The evaluation of time series was based on the statistical parameter of median, and on the extreme values (MIN, MAX). The basic advantage of the median is that it is less affected by the extreme values. The time series of chemical analyses that we had display two problematic characteristics that disadvantage the use of the average: a significant proportion of samples has an unknown specific concentration value because they are below the detection limit of the analytical method, and additionally, from time to time extremely high concentrations occur, capable of greatly influencing the average value, but not the median value. The MAX values are essential for the safety of the population, as the assessment of drinking water is based on the requirement that the limits set are not exceeded.
For comparison, in the time series of concentrations in Section 3, the median, arithmetic mean, standard deviation and coefficient of variation are calculated. It can be seen that very high standard deviation values predominate, indicating a large statistical variability of the processed data sets. The coefficient of variation (i.e., the ratio of the standard deviation to the arithmetic mean) reaches a minimum value of 33%, and in 28 out of 36 evaluated time series (sets of nine substances from four profiles) it exceeds 50%; nine sets have a coefficient of variation higher than 100%—these values make using the mean as a characteristic of the series very problematic.
3. Results
All results of chemical analyses are available in Table S1 in Supplementary Materials.
3.1. Monitoring 2017–2018
The monitoring results made it possible to separate the monitored streams into two basic groups: four streams with significantly higher concentrations and more frequent occurrence of PPCP substances (Hnevkovice, Kozli, Dolni Kralovice and Bernartice), and five profiles with relatively lower concentrations and less frequent occurrence of monitored substances (Radikovice, Hulice, Kacerov, Miletin and Brzotice). It has also been shown that some of the studied substances occur more frequently and in higher concentrations than others (see Discussion).
Furthermore, for the sake of clarity, we present in the charts nine PPCP substances, selected according to the highest concentration, highest frequency of occurrence in the monitoring period 2017–2018, and also according to occurrence in raw and treated drinking water. Four profiles were selected from the nine monitored profiles on local watercourses (Figure 1): two profiles at the largest tributaries to the Svihov reservoir (Miletin and Kacerov) and two profiles with the highest concentration and the highest incidence of monitored PPCP substances (Hnevkovice and Dolni Kralovice).
3.1.1. Hnevkovice Profile
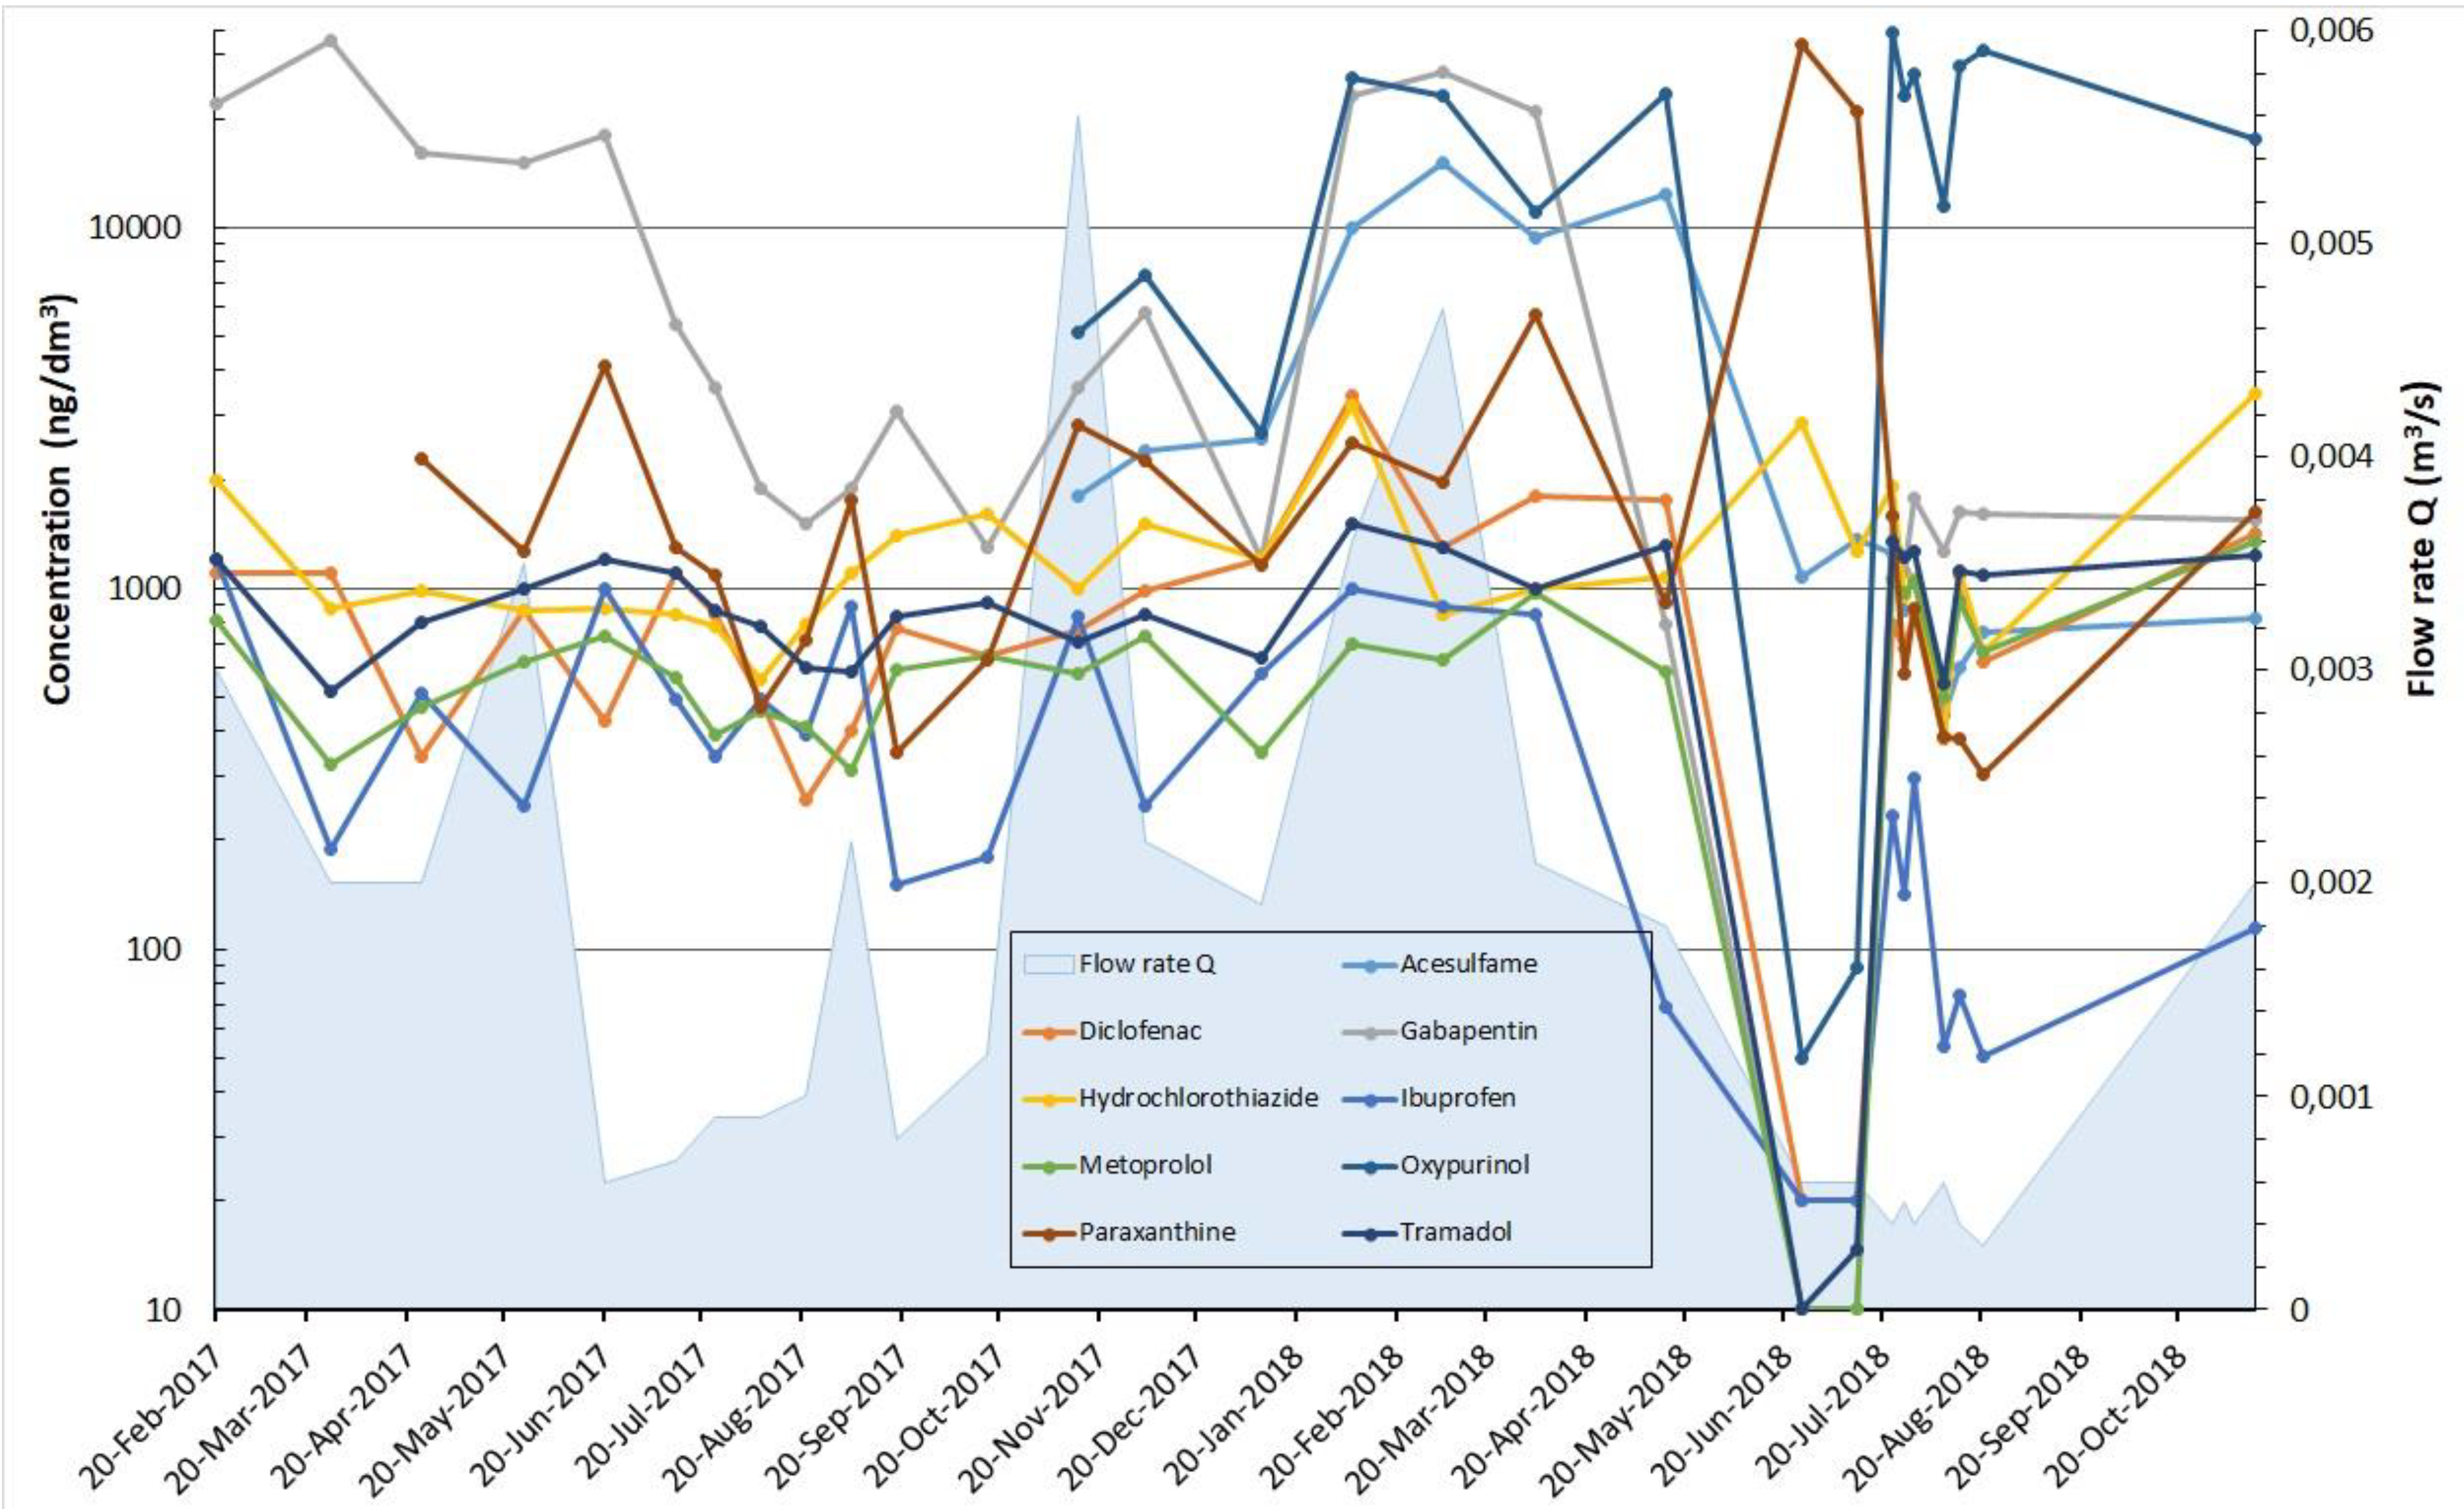
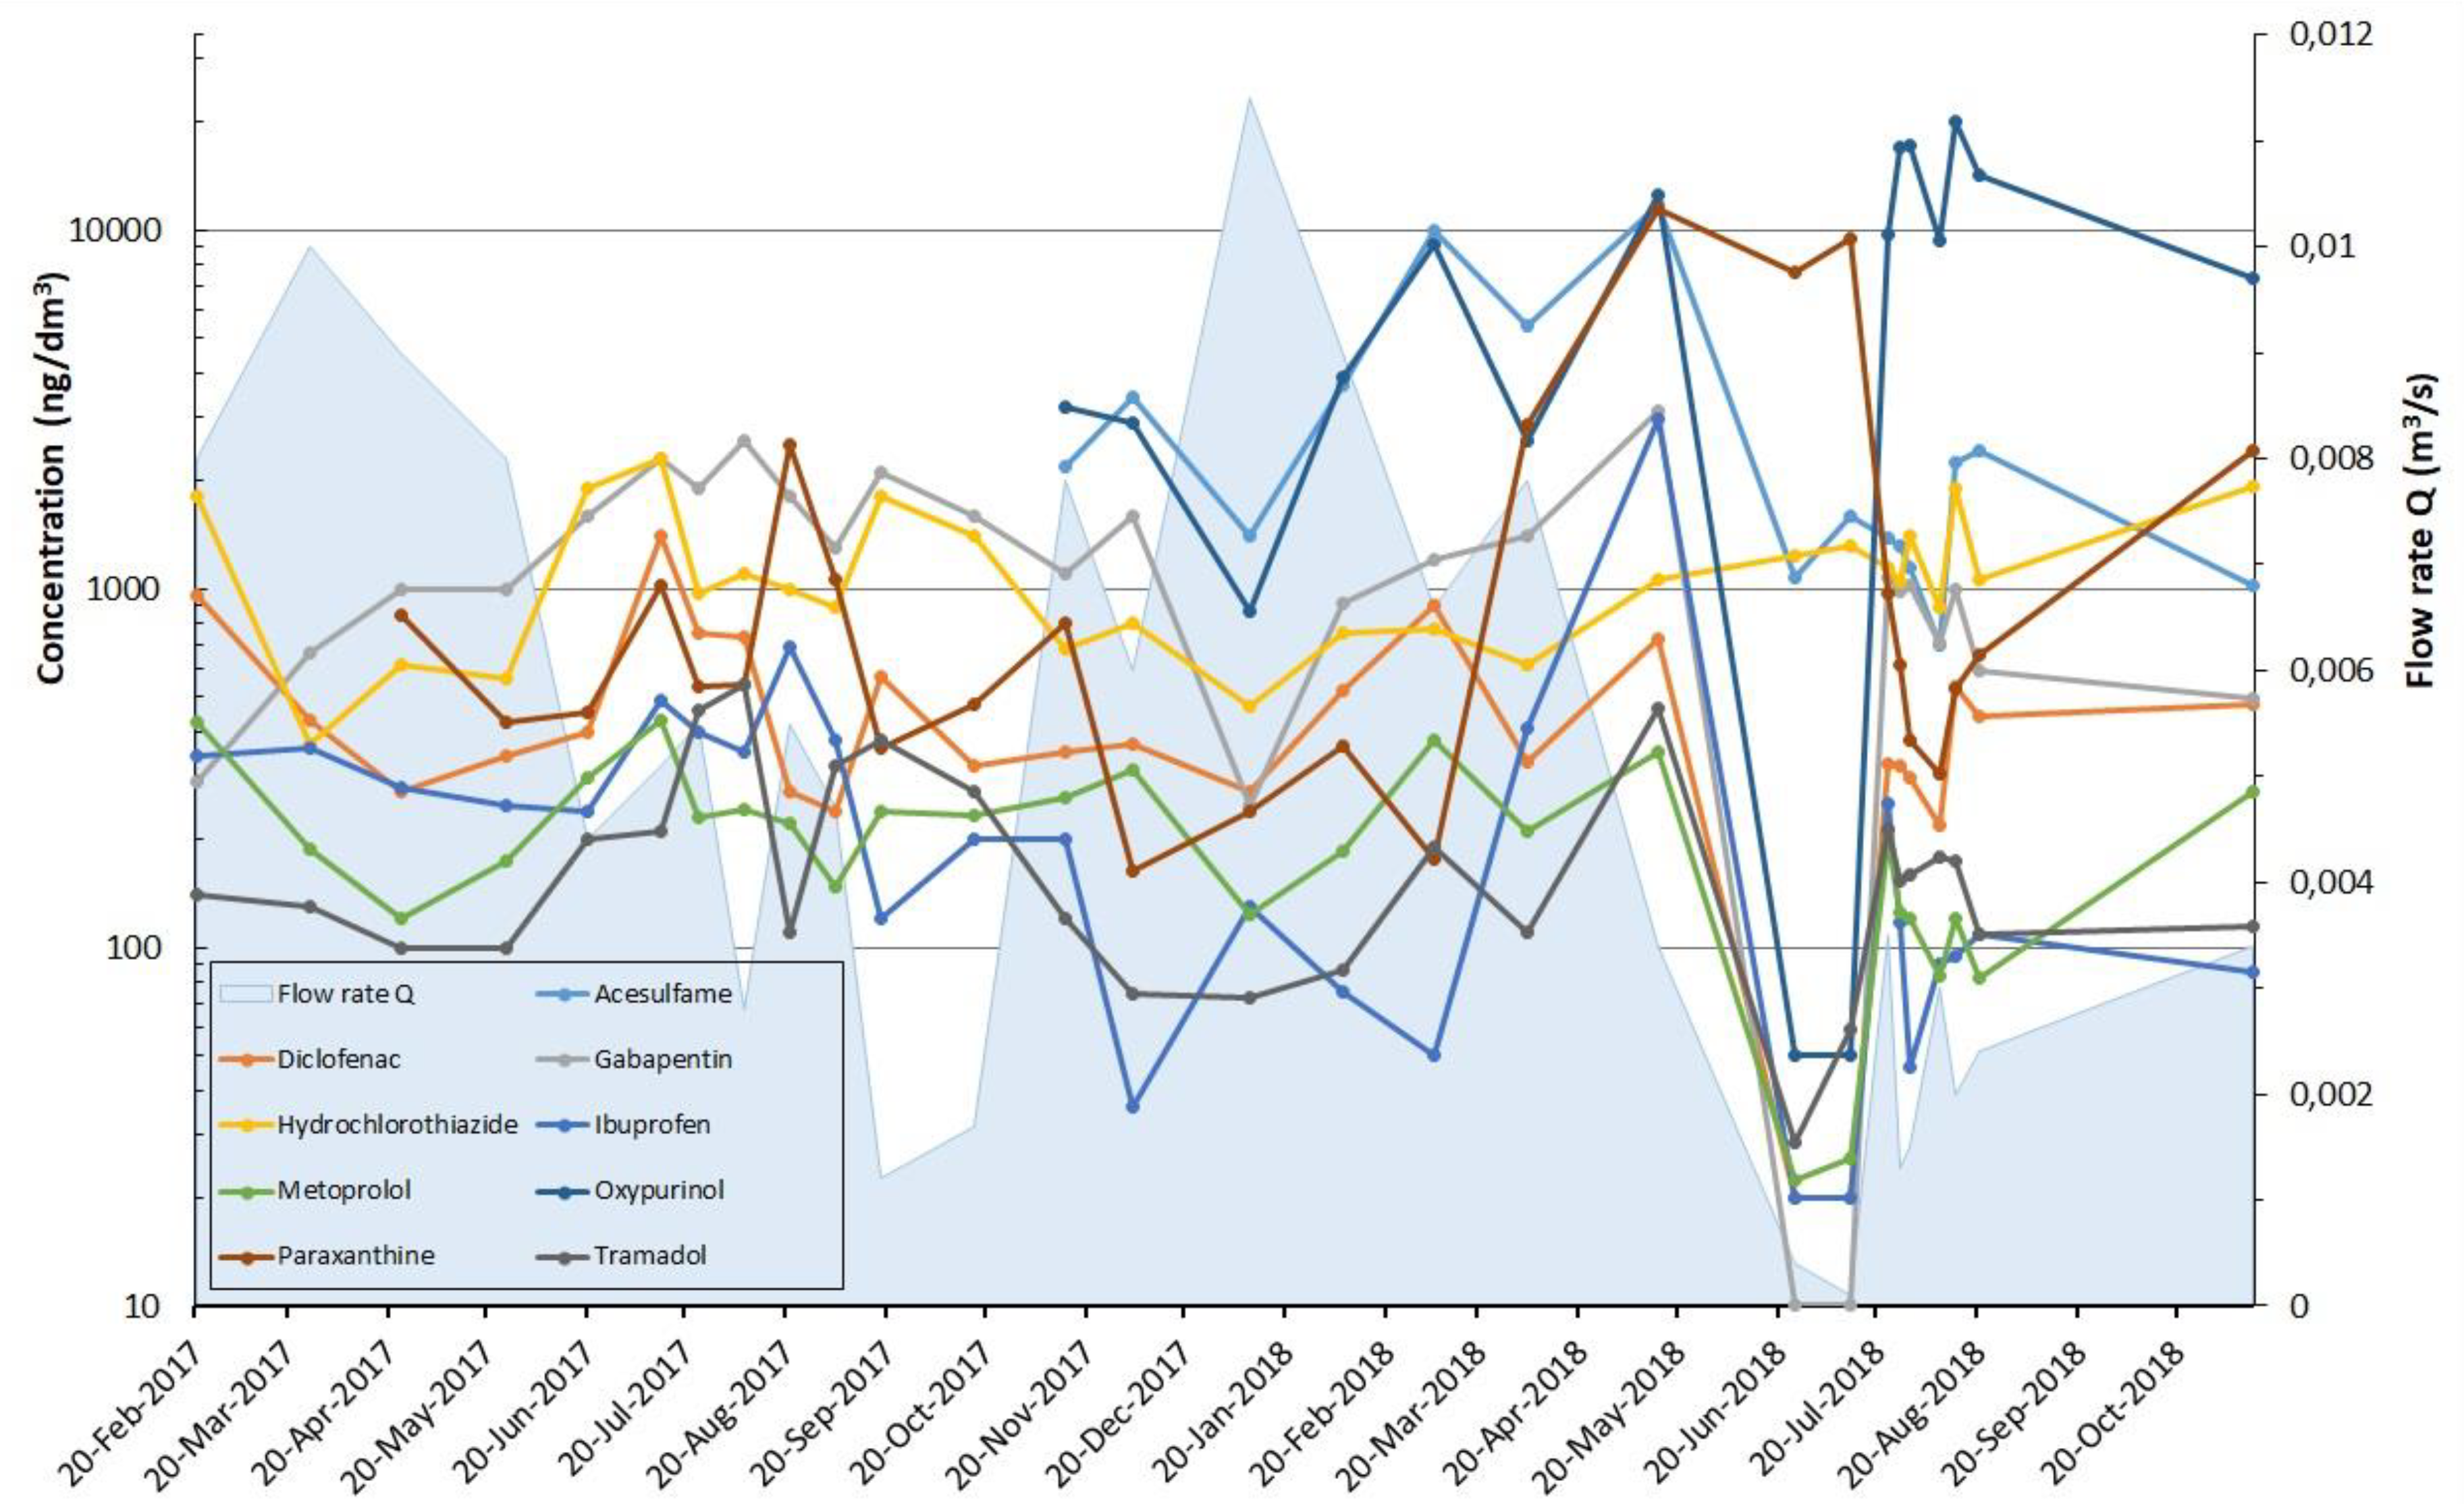
The sampling profile on the Hnevkovice Creek is located at the end of the village of Hnevkovice, below the discharge point from the sewage treatment plant (point S2 in Figure 2). Further, under the profile, the stream continues through a forest, and after approximately 600 m it flows into the Svihov reservoir. Raw water intake at the reservoir dam is located about 11 km from the estuary of the stream into the reservoir. The catchment area is 0.543 km2, rural settlement prevails (about 300 inhabitants in family houses with small farm animals), and intensively cultivated fields prevail around the village. The average rainfall is 681.8 mm, average temperature is 8.04 °C (data for the period 1961–2015), average altitude is 445.45 m above sea level, and average slope is 3.4% (TGM Water Research Institute internal database). The flow rate in the creek is strongly influenced by fluctuating effluent from the sewage water treatment plant and retention ponds, fluctuating between 0.0004–0.0056 m3/s (average 0.0016 m3/s); natural flow rate constitutes a lesser part of the total flow rate, especially under low flow conditions. The PPCP monitoring results are shown in Figure 3 and Table 3 and Table 4.
This is a profile with the unambiguously worst water quality values, with only a minimum number of values below the detection limit. All nine studied substances have maximum concentrations in thousands of ng/dm3, and four substances even in tens of thousands of ng/dm3 (acesulfame, gabapentin, oxypurinol, paraxanthine). Additionally, the median values are high, particularly with median value of 20,250 ng/dm3 found for oxypurinol. Furthermore, other substances not evaluated in this article had a maximum concentration over 1000 ng/dm3 (measured maximum concentration in brackets): azithromycin (1360 ng/dm3), celiprolol (1690 ng/dm3), clarithromycin (2600 ng/dm3), furosemide (1800 ng/dm3), ibuprofen-2-hydroxy (700 ng/dm3), ibuprofen-carboxy (2200 ng/dm3), iopromide (34,400 ng/dm3, but rare occurrence), caffeine (3900 ng/dm3), lamotrigine (1310 ng/dm3), paracetamol (1800 ng/dm3), saccharin (10,000 ng/dm3). Values of over 1000 ng/dm3 were in most samples for celiprolol (7 out of 8) and in a quarter to half of the samples of ibuprofen-2-hydroxy, caffeine and saccharin. For other substances, elevated concentrations are uncommon (1–5 out of 28). It is also worth noting that for iopromide 15 samples out of 28 were below the detection limit.
When assessing the nature of the settlement and land use, this pilot area is in no way different from the others in explaining the causes of the high concentrations of PPCP. Therefore, the Hnevkovice profile was chosen for additional monitoring in 2019 (Section 3.2).
3.1.2. Dolni Kralovice Profile
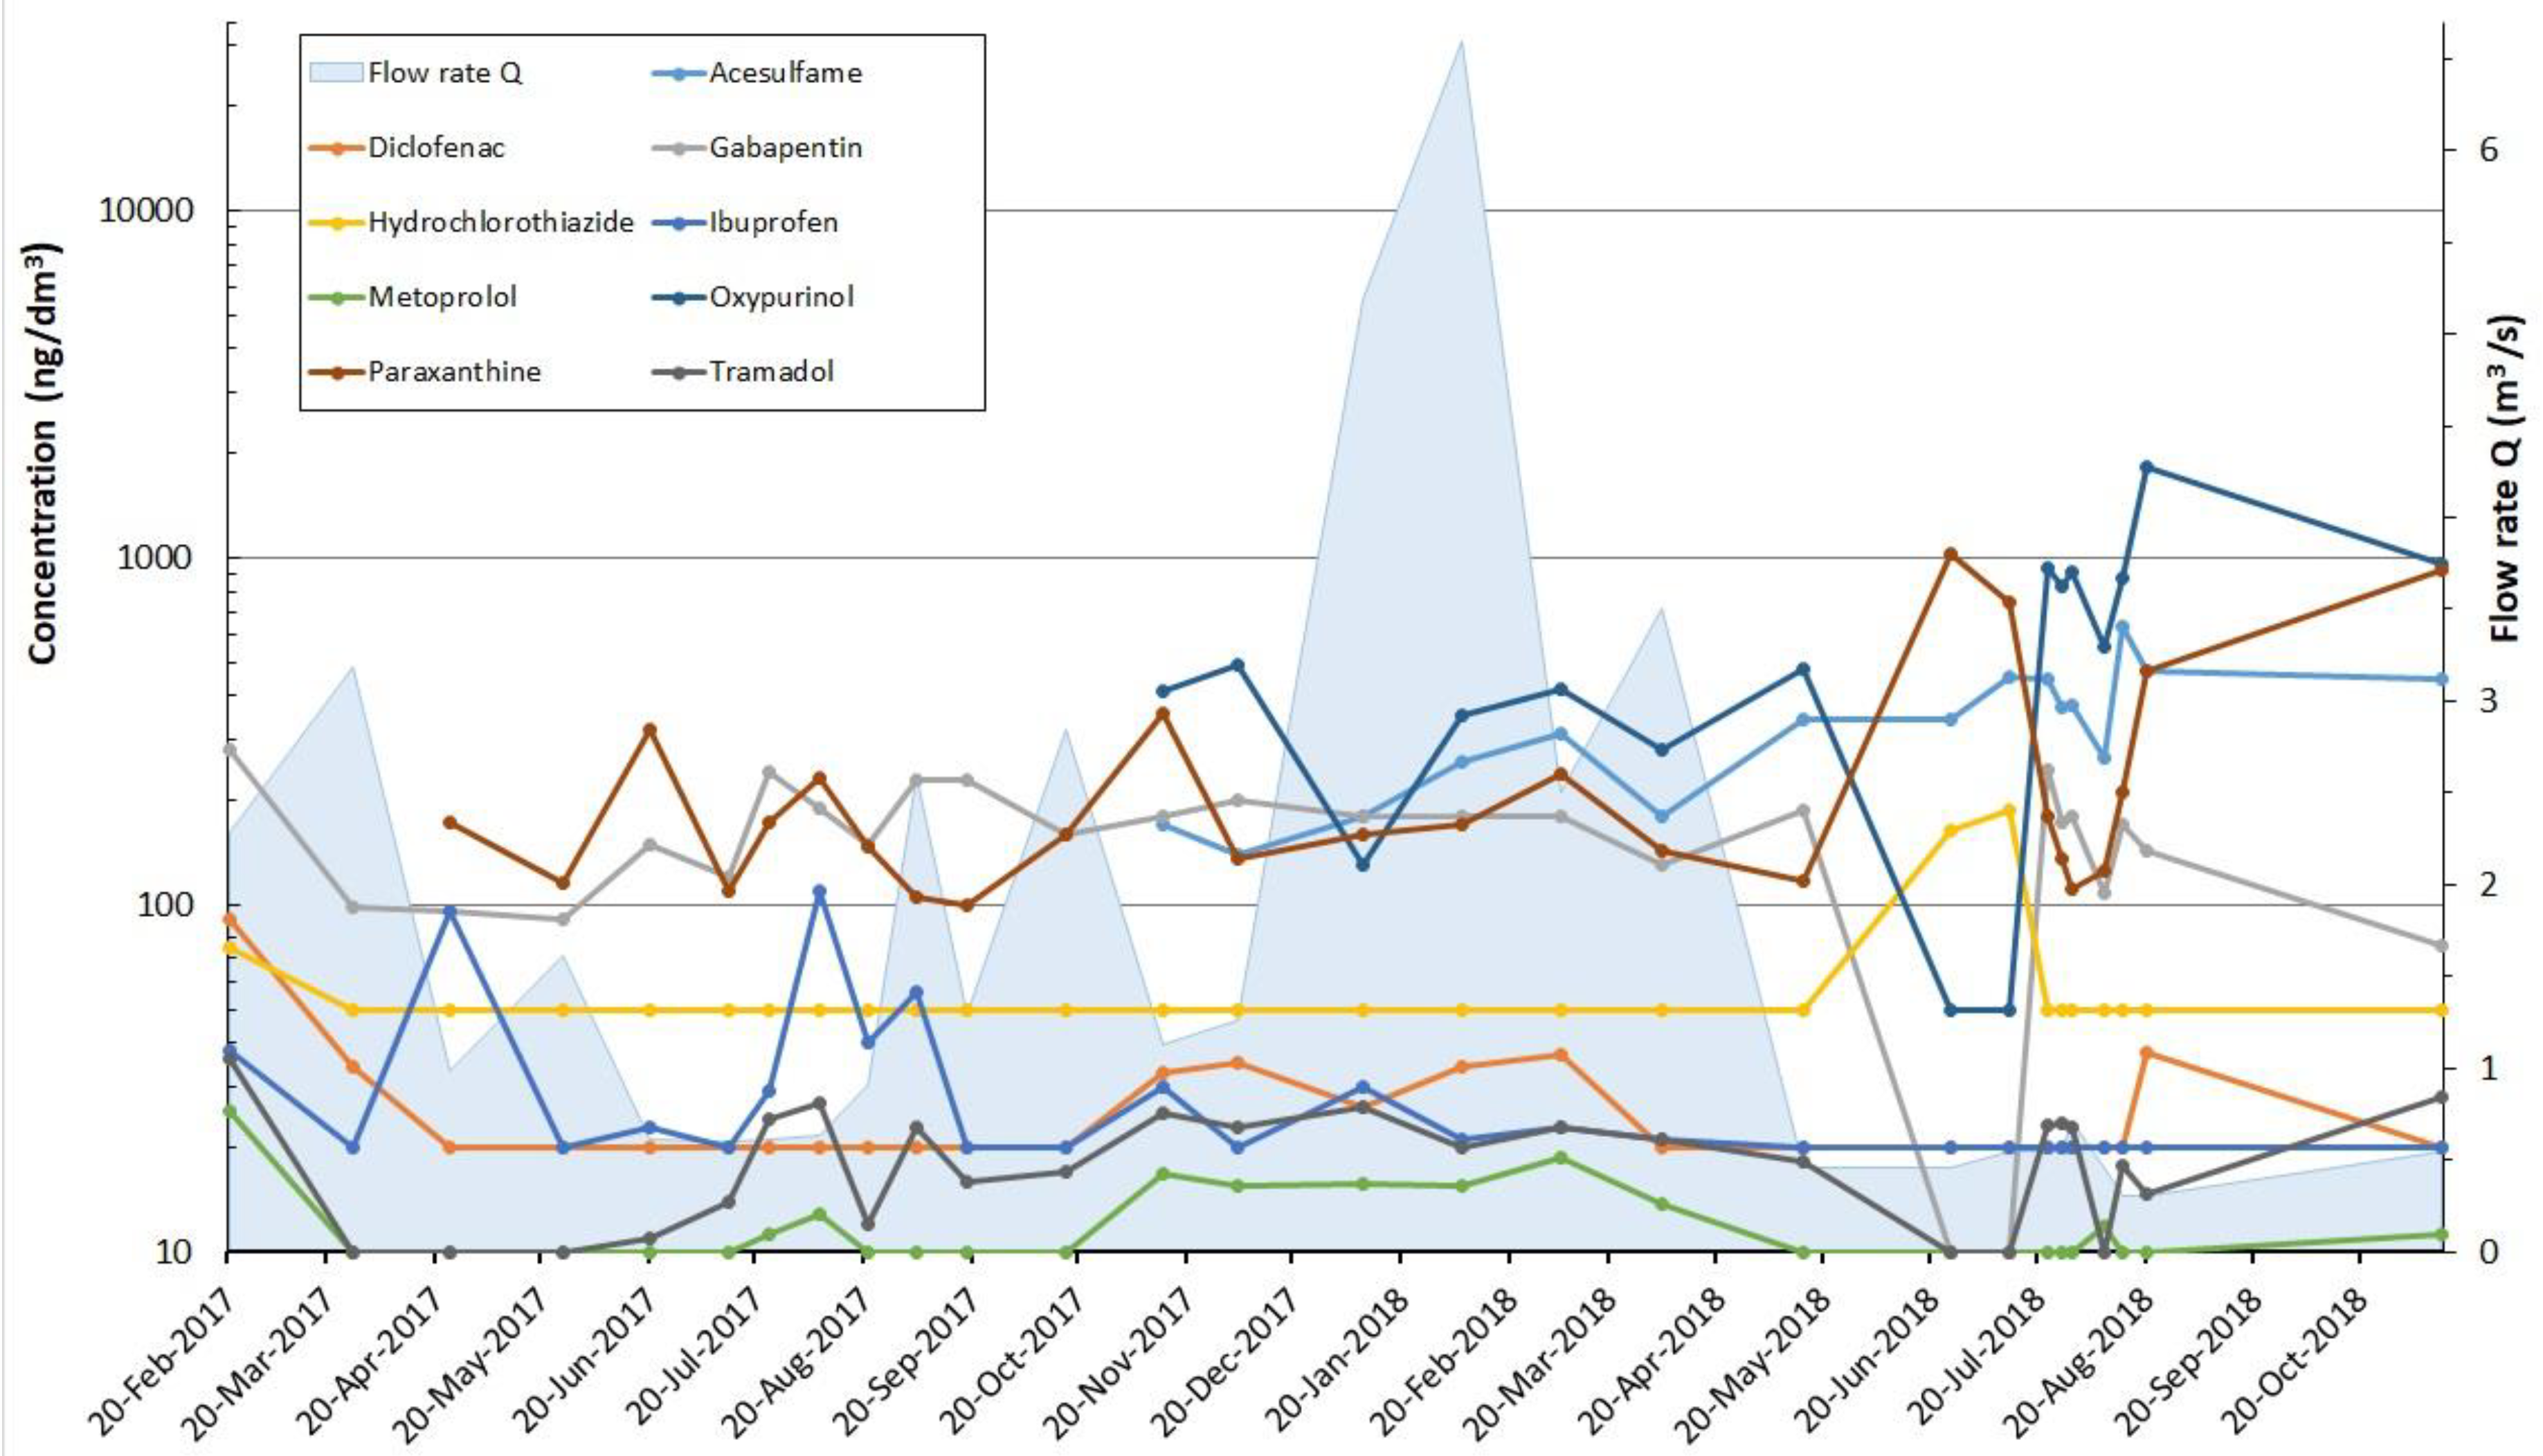
The measured profile is located at the end of the Dolni Kralovice village under the discharge from the WWTP (Figure 1). The creek flows into the Svihov reservoir after approximately 1600 m. Raw water intake from the reservoir at the dam is located about 11 km from the estuary of the stream into the reservoir. The catchment area is 1769 km2, rural settlements predominate (approximately 700 inhabitants in family houses and small apartment houses, including shops, buildings with services and medical facilities). There is a large agricultural farm in the village including livestock and food industry buildings, and the surrounding land is dominated by fields with intensive crop production. The average rainfall is 670.8 mm, average temperature is 7.9 °C (data for the period 1961–2015), average altitude is 478.6 m above sea level, and the average slope is 3.4% (TGM Water Research Institute internal database). The flow in the stream is strongly influenced by fluctuating effluent from the wastewater treatment plant and retention basin fluctuating between 0.0012–0.0114 m3/s (average flow is 0.004 m3/s), natural flow constituting a minority of the total flow rate, especially under low flow conditions. The PPCP monitoring results are shown in Figure 4 and Table 5 and Table 6.
Like Hnevkovice, the Dolni Kralovice profile belongs to those with the highest concentrations of PPCP substances. Oxypurinol, again, reaches the highest concentrations (maximum 20,000 ng/dm3, median 8205 ng/dm3), whereas all other selected substances except metoprolol and tramadol have peak values over 1000 ng/dm3; acesulfame, gabapentin, and hydrochlorothiazide even have median values above 1000 ng/dm3. Also, for some other substances (not selected for further evaluation in this article), peak concentrations of over 1000 ng/dm3 were found (measured maximum concentration in brackets): azithromycin (1600 ng/dm3), ibuprofen-2-hydroxy (12,900 ng/dm3), irbesartan (1530 ng/dm3), caffeine (4260 ng/dm3), naproxen (1050 ng/dm3), saccharin (6680 ng/dm3). Values above 1000 ng/dm3 were in the majority of samples for irbesartan (7 out of 8), but for other substances the increase in concentration is less common (1–6 out of 28).
The character of settlement and land use may explain the higher concentrations of PPCP in this catchment area. The community of Dolni Kralovice is one of the larger municipalities in the vicinity of the Svihov reservoir, and in addition the number of inhabitants is increased by employees in agricultural and food processing plants located in the catchment area. There are also service facilities, including medical facilities, where higher drug consumption is expected.
3.1.3. Miletin Profile
The measured profile is located on the Zelivka River, on which the Svihov reservoir is built, at the point of the Zelivka River inlet into the Svihov reservoir. It is the main inflow, providing about 70% of the total average inflow into the reservoir. The hydrological catchment belonging to the measured profile is extensive; the catchment area is 3020 km2. The location of raw water intake from the reservoir at the dam is located about 20 km from the estuary of the river into the reservoir. The catchment area of the upper Zelivka River has many villages and towns, with approximately 40,000 inhabitants. Land use is mixed with intensive agricultural production, commercial forests, and settlements. Larger towns include Pelhrimov (16,000 inhabitants), Pacov (5000 inhabitants) and Cervena Recice (1000 inhabitants), while other inhabitants live in several rural municipalities with less than 1000 residents. In the catchment area there are several hospitals, other medical facilities, homes for the elderly and other facilities used by services. In the catchment, the average rainfall is 671.8 mm and average temperature 8.03 °C (data for the period 1961–2015), average altitude is 433.44 m above sea level and average slope is 3.3% (TGM Water Research Institute internal database). The flow rate in the river is influenced by several reservoirs and ponds, and by the discharge of wastewater throughout the catchment. The flow rate fluctuated between 0.3–6.6 m3/s (long-term average flow rate of 2.8 m3/s according to the Czech Hydrometeorological Institute CHMI), and the share of wastewater represents a significant minority of the total flow rate (estimated at about 0.04 m3/s). The PPCP monitoring results are shown in Figure 5 and Table 7 and Table 8.
Due to the high flow rates and large river catchment area, the water flow is diluted and delayed, resulting in lower PPCP concentration. The relatively low concentrations are offset by higher flow rates. Oxypurinol again shows the highest concentration (peak 1820 ng/dm3, median 483 ng/dm3), and paraxanthine exhibits maximums over 1000 ng/dm3. When other substances are assessed, no other has a maximum concentration above 1000 ng/dm3.
Although the PPCP concentrations are lower on the Miletin profile than on the previous two profiles, due to the high flow rate this stream brings the largest amount of PPCP into the Svihov reservoir (Section 4). Higher quantities of transported pharmaceuticals can be logically explained - there are many places in the large catchment area where significant mass flows of pharmaceuticals can be expected (larger cities, hospitals and other health and veterinary facilities, homes for the elderly, service facilities, etc.).
3.1.4. Kacerov Profile
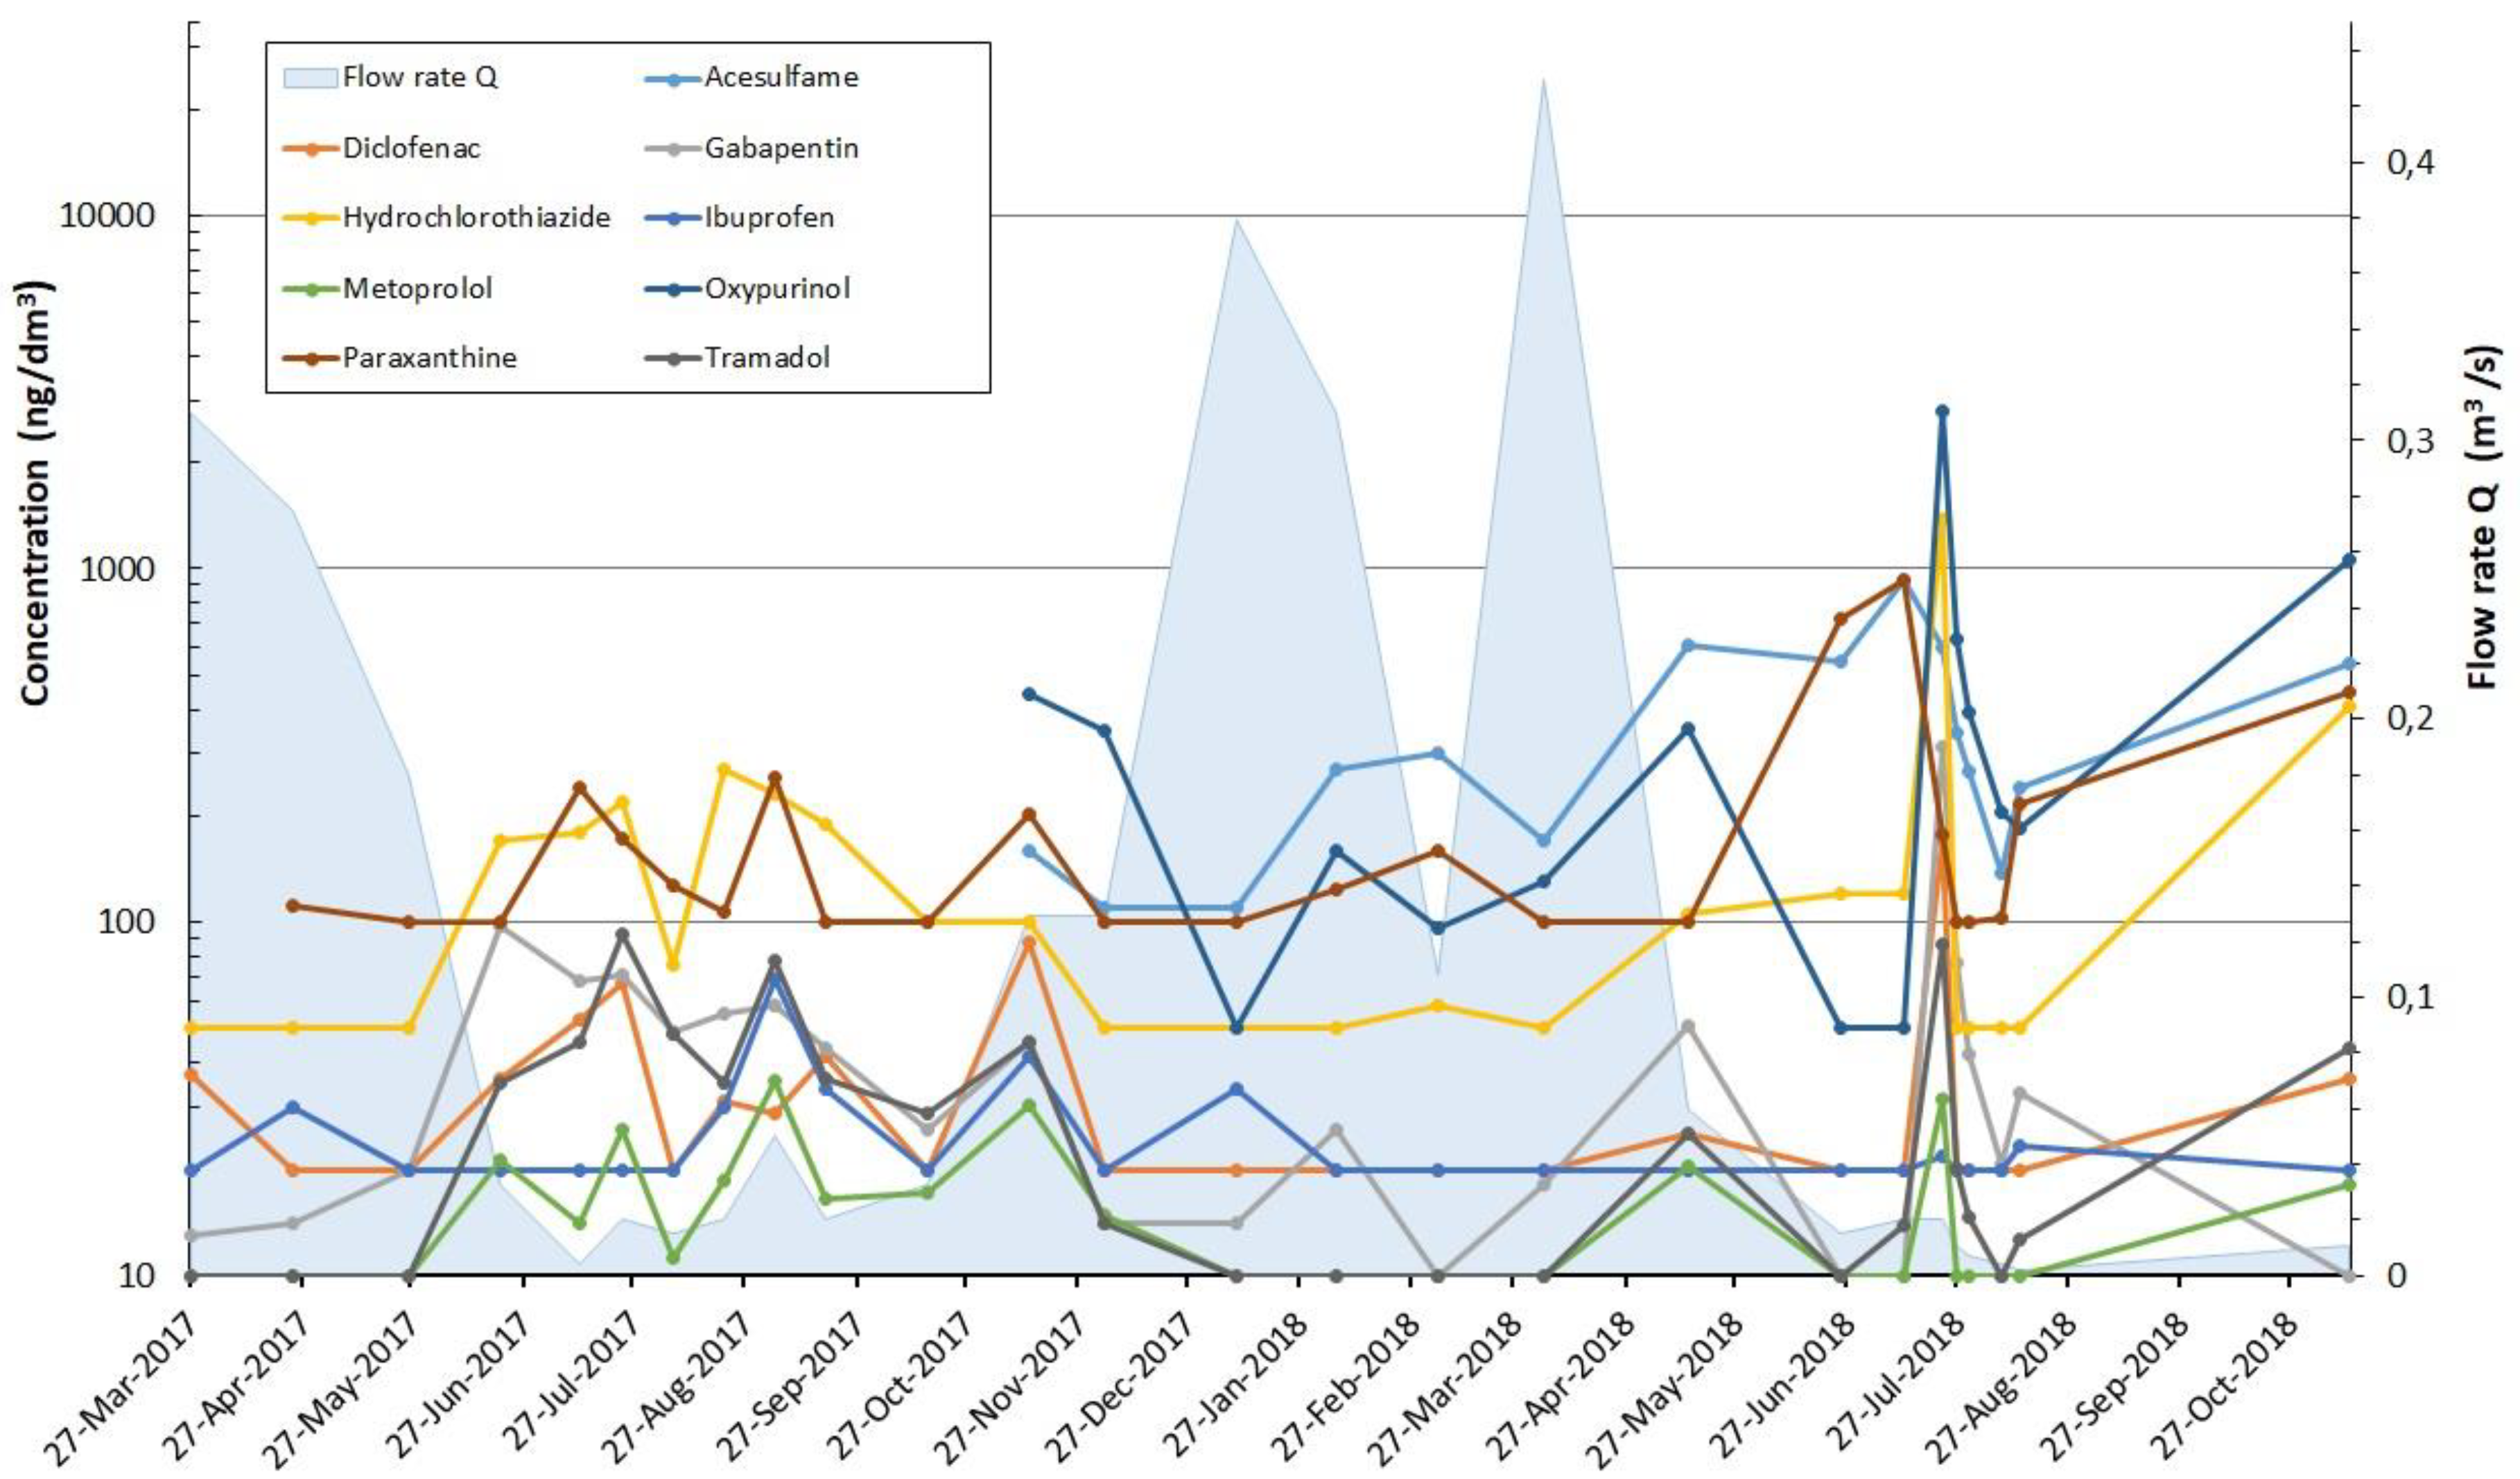
The measured profile is located on Sedlicky Creek near the village of Kacerov at the point where the stream flows into the Svihov reservoir (edge of reservoir backwater). It is the largest tributary to the Svihov reservoir. The location of raw water intake from the reservoir at the dam is located about 6 km from the estuary of the stream into the reservoir. The monitored catchment is relatively extensive; Sedlicky Creek, with many tributaries, has a catchment area of 76 km2. Within the catchment area, there are several municipalities with about 2300 inhabitants. Rural settlement prevails amid the villages; there are intensively cultivated fields and commercial forests. The main municipalities are Lhota Bubenec (village with intensive livestock farming), Krivsoudov (village), Ruzkovy Lhotice (village with a small farm), Cernici (smaller agricultural farm), Mala Paseka (village), Cechtice (larger village, two large agricultural farms, two industrial areas, medical facilities and service buildings) and Chrastovice (former village, now completely abandoned). The monitored catchment area has an average rainfall of 692.1 mm, and an average temperature of 7.87 °C (data for the period 1961–2015). The average altitude is 506.34 m above sea level, and the average slope is 3.6% (TGM Water Research Institute internal database). A number of ponds and the discharge of wastewater throughout the catchment area influence the creek flow rate. The flow rate fluctuated between 0.002–0.43 m3/s during the measurement period, and the proportion of wastewater does not constitute a major portion of the total flow rate, except in low flow conditions. The PPCP monitoring results are shown in Figure 6 and Table 9 and Table 10.
Of the selected substances, oxypurinol and hydrochlorothiazide reach the highest concentration with a maximum above 1000 ng/dm3, while acesulfame and paraxanthine peak just below 1000 ng/dm3. No other substances with concentrations above 1000 ng/dm3 were observed on the Kacerov profile; only one azithromycin analysis (931 ng/dm3) approached the 1000 ng/dm3 limit.
Although the PPCP concentrations are on average even lower on the Kacerov profile than on the Miletin profile, there is also a significant PPCP mass flow into the reservoir (Section 4). The sources of PPCP in the catchment area can be well identified - seven municipalities with agricultural and industrial sites, service facilities, medical facilities, in which the number of inhabitants is slightly increased by commuting employees).
3.1.5. Raw and Drinking Water Monitoring
The 2017–2018 water monitoring also included quality control of raw and drinking water. Raw water is taken from the intake tower building at the Svihov reservoir dam; the treated drinking water was sampled at the point where the water leaves the treatment plant to the water supply system. Detected substances above the detection limit are summarized in Table 11 (raw water) and Table 12 (drinking water). In contrast to the previous tables and graphs, all the analyzed substances were evaluated (93 items according to Table 1) because of their importance for the overall drinking water quality.
Only 20 substances out of 93 in raw water had concentration values above the detection limit at least once during the 2-year monitoring period, whereas 73 substances were permanently below the detection limit.
3.2. Additional Monitoring Hnevkovice
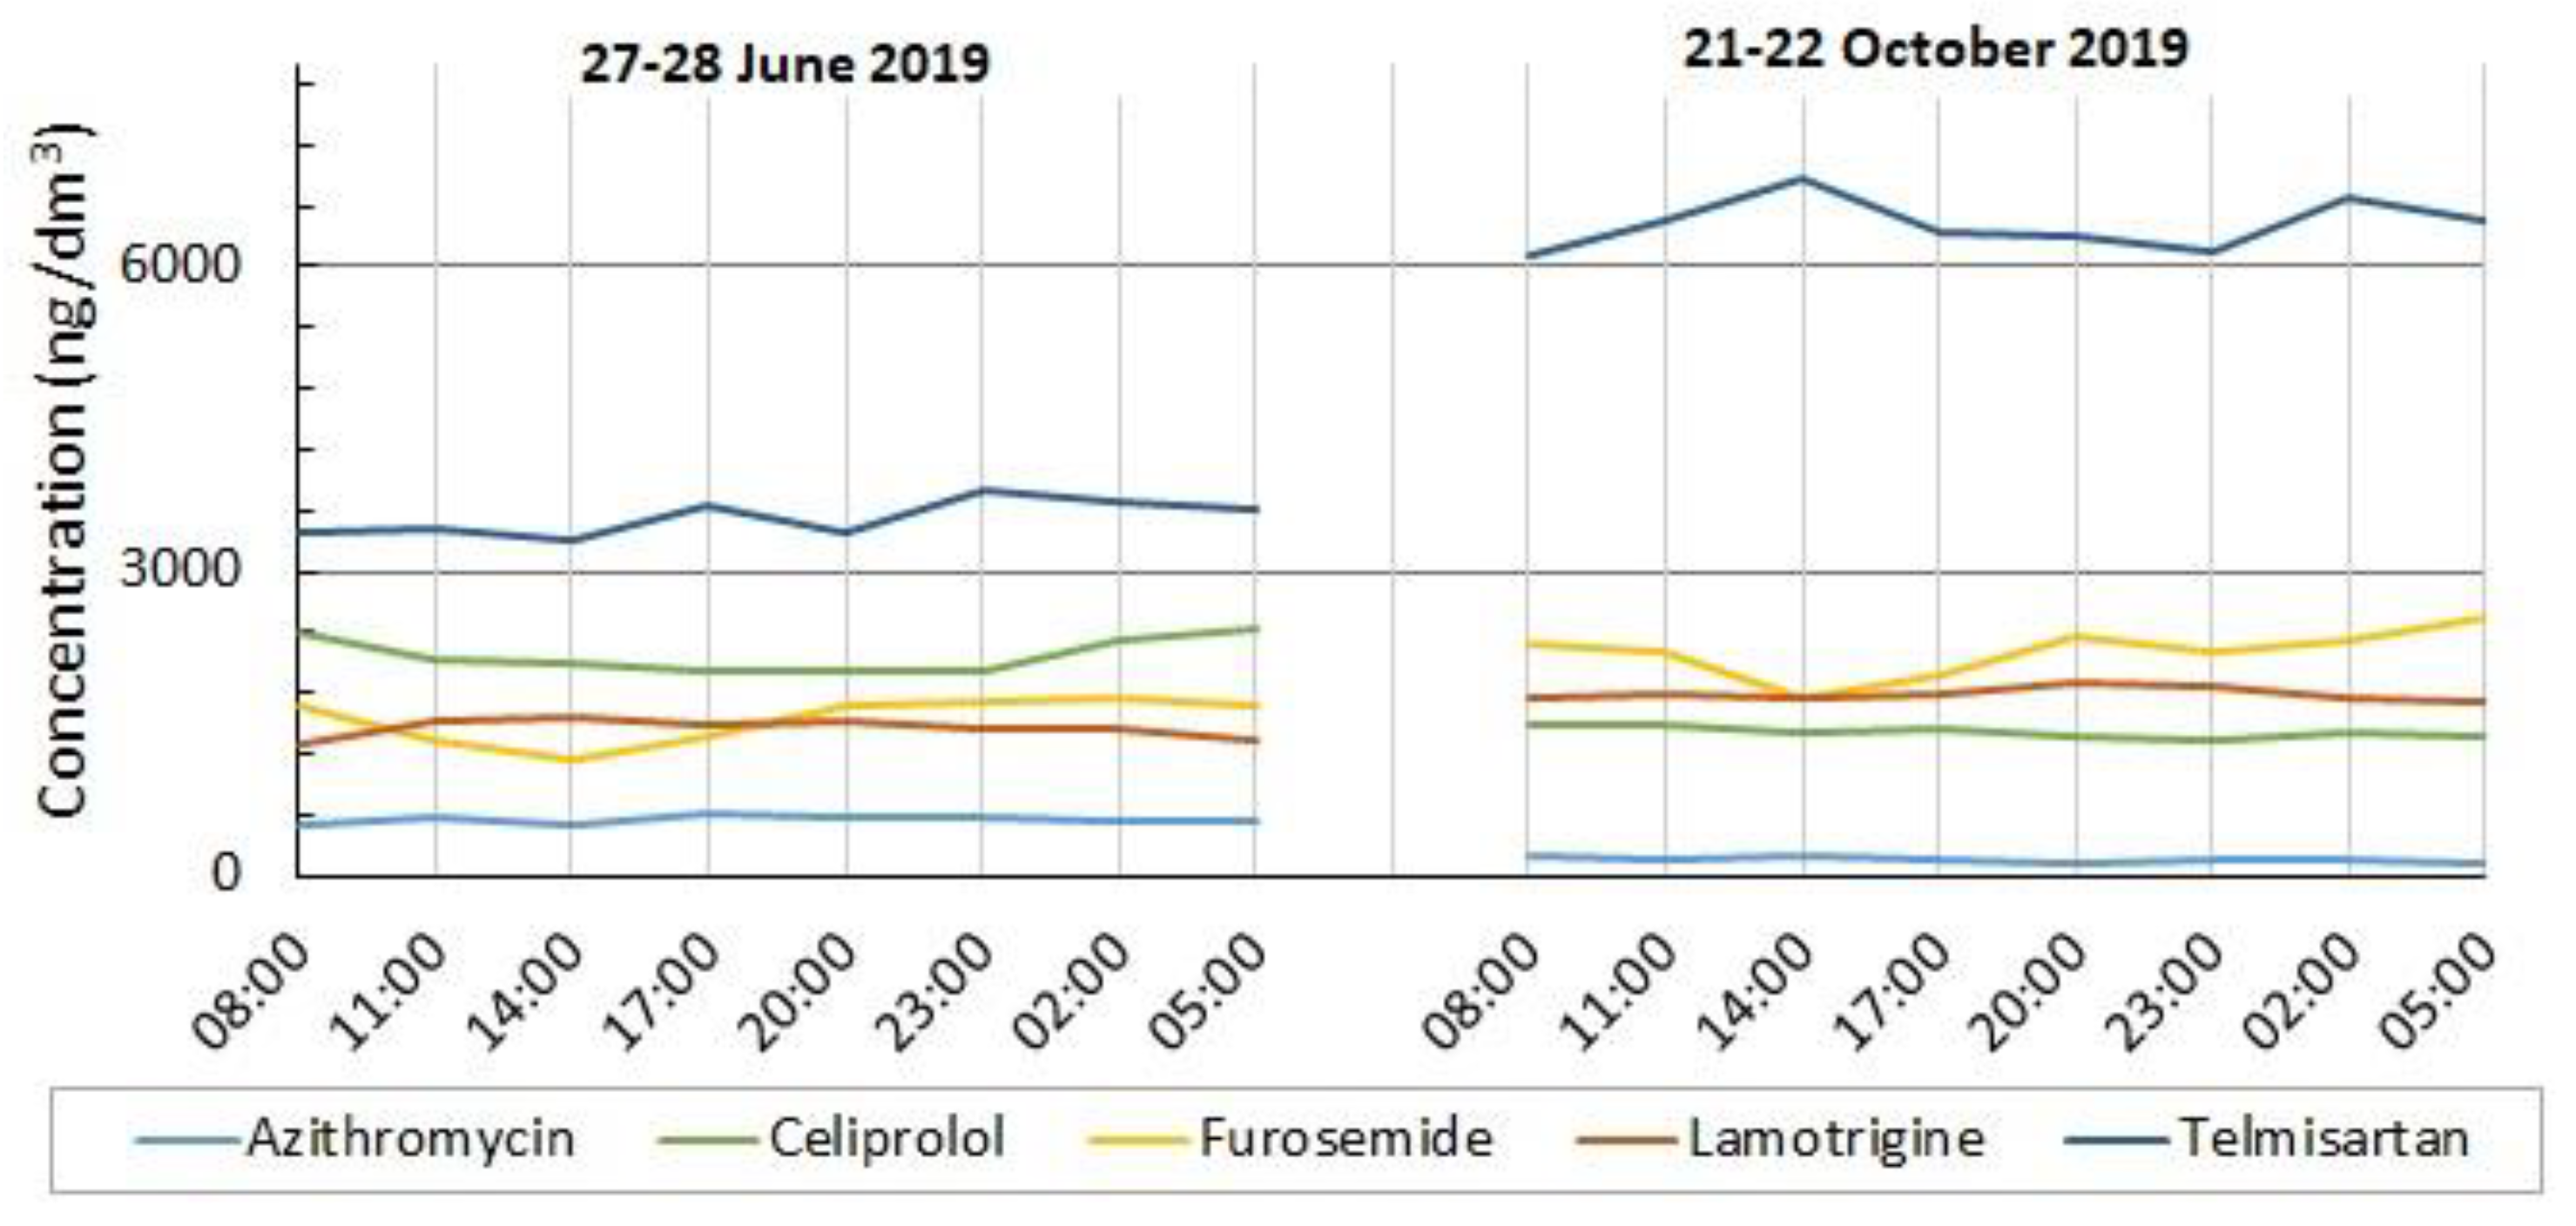
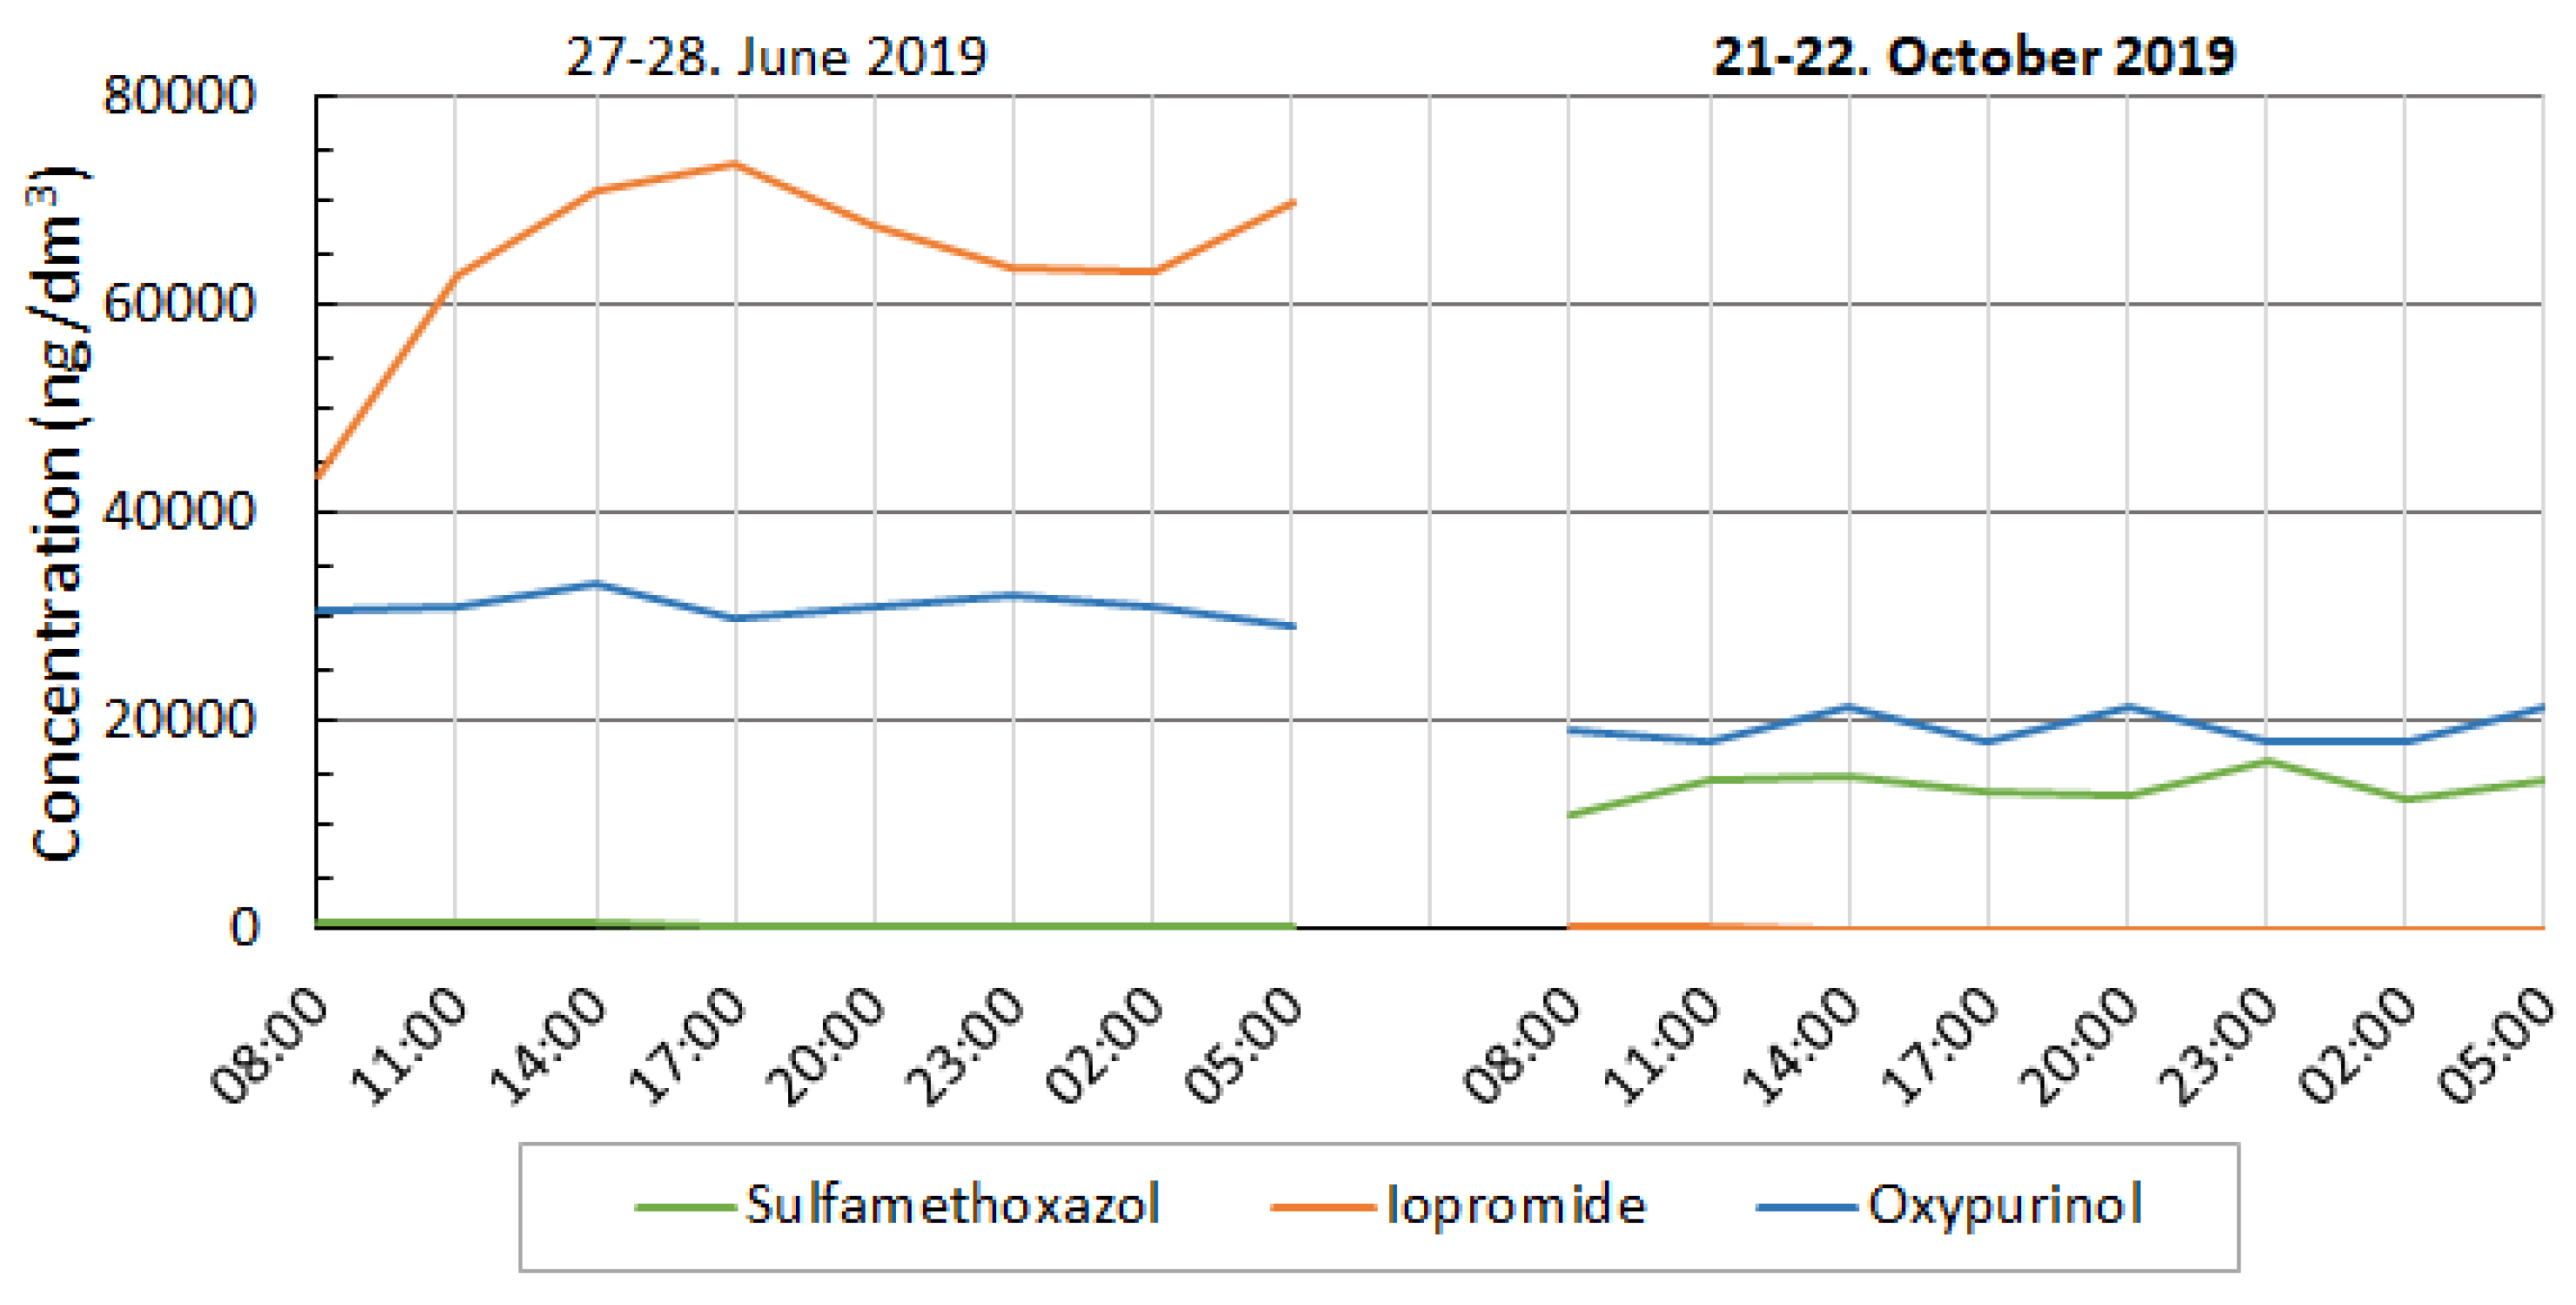
In order to investigate the local situation more precisely, additional monitoring was carried out in the community of Hnevkovice (profile with the highest detected concentration of PPCP substances in 2017–2018 monitoring), consisting of detailed sampling of wastewater at the discharge from the WWTP, stream water above and below the WWTP, and groundwater from two selected wells. Samples of water at the discharge from the WWTP were taken in three-hour intervals on 27–28 June and on 21–22 October. The results of the selected pharmaceuticals are shown in charts in Figure 7, Figure 8 and Figure 9. These are nine substances identical to the 2017–2018 monitoring, supplemented by another seven substances with high-recorded concentration. For the sake of clarity and due to a different scale of concentration, the substances are distributed into three charts.
The highest concentrations, observed in the spring period were found for iopromide (73,600 ng/dm3, spring) and oxypurinol (33,100 ng/dm3). In autumn, the concentrations were mostly lower, with oxypurinol (21,500 ng/dm3) and sulfamethoxazole (16,100 ng/dm3) being the highest. Surprisingly, the lowest concentration of monitored substances were also observed for iopromide (72 ng/dm3, autumn) and ibuprofen (below the detection limit). Iopromide is the substance with the largest, but well-explained, fluctuation in concentration. Because it is used as a contrast medium, e.g., in CT scans, its extremely high and short-term concentrations are related to the rapid excretion of this substance after the performed examination. Oxypurinol is a frequently used pharmaceutical for the treatment of increased uric acid content in blood, and the associated problems with joints and kidneys. Its high concentrations indicate the prevailing elderly population in the village.
For some other substances (over 16 mentioned above in charts) maximum concentrations were also found at over 1000 ng/dm3 (measured maximum values in brackets) detected in the effluent from the WWTP. June 2019: 4-formylamino antipyrine (1160 ng/dm3), benzotriazole (1060 ng/dm3), metformin (1730 ng/dm3), sucralose (5900 ng/dm3), valsartan acid (1060 ng/dm3). October 2019: 4 formylamino antipyrine (4800 ng/dm3), benzotriazole (1460 ng/dm3), diclofenac-4-hydroxy (2220 ng/dm3), sucralose (5200 ng/dm3), valsartan acid (1160 ng/dm3).
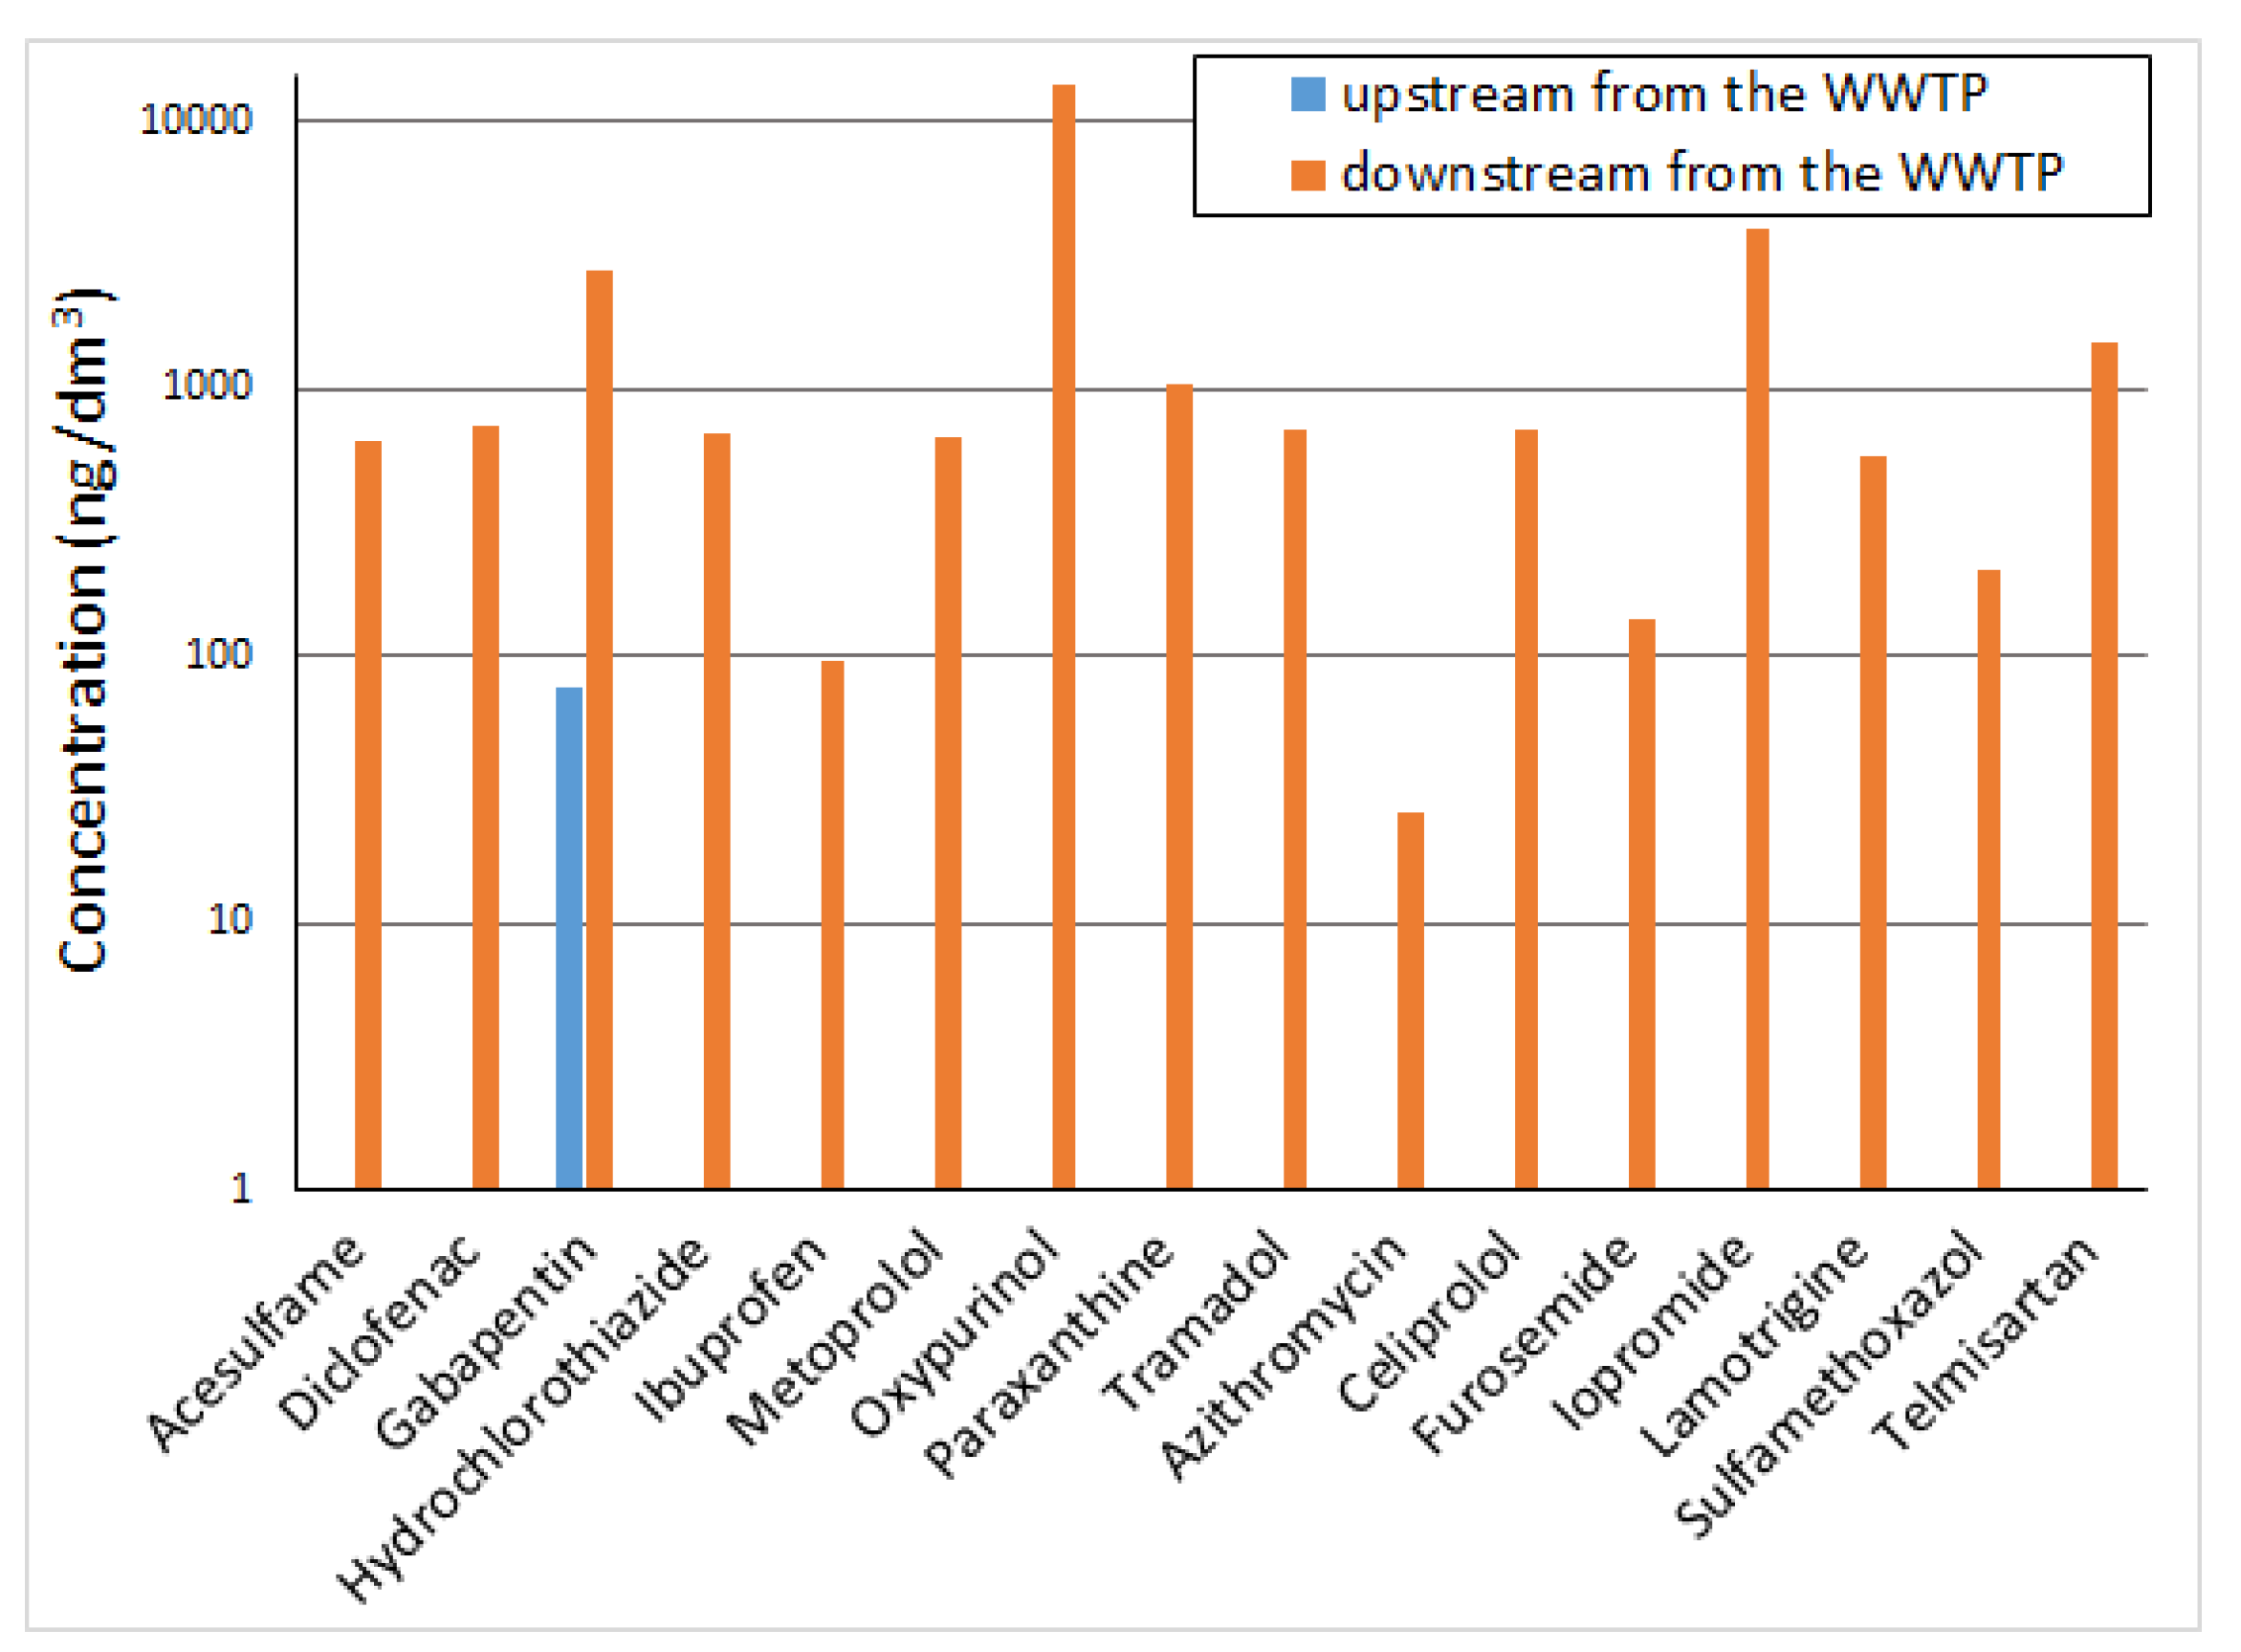
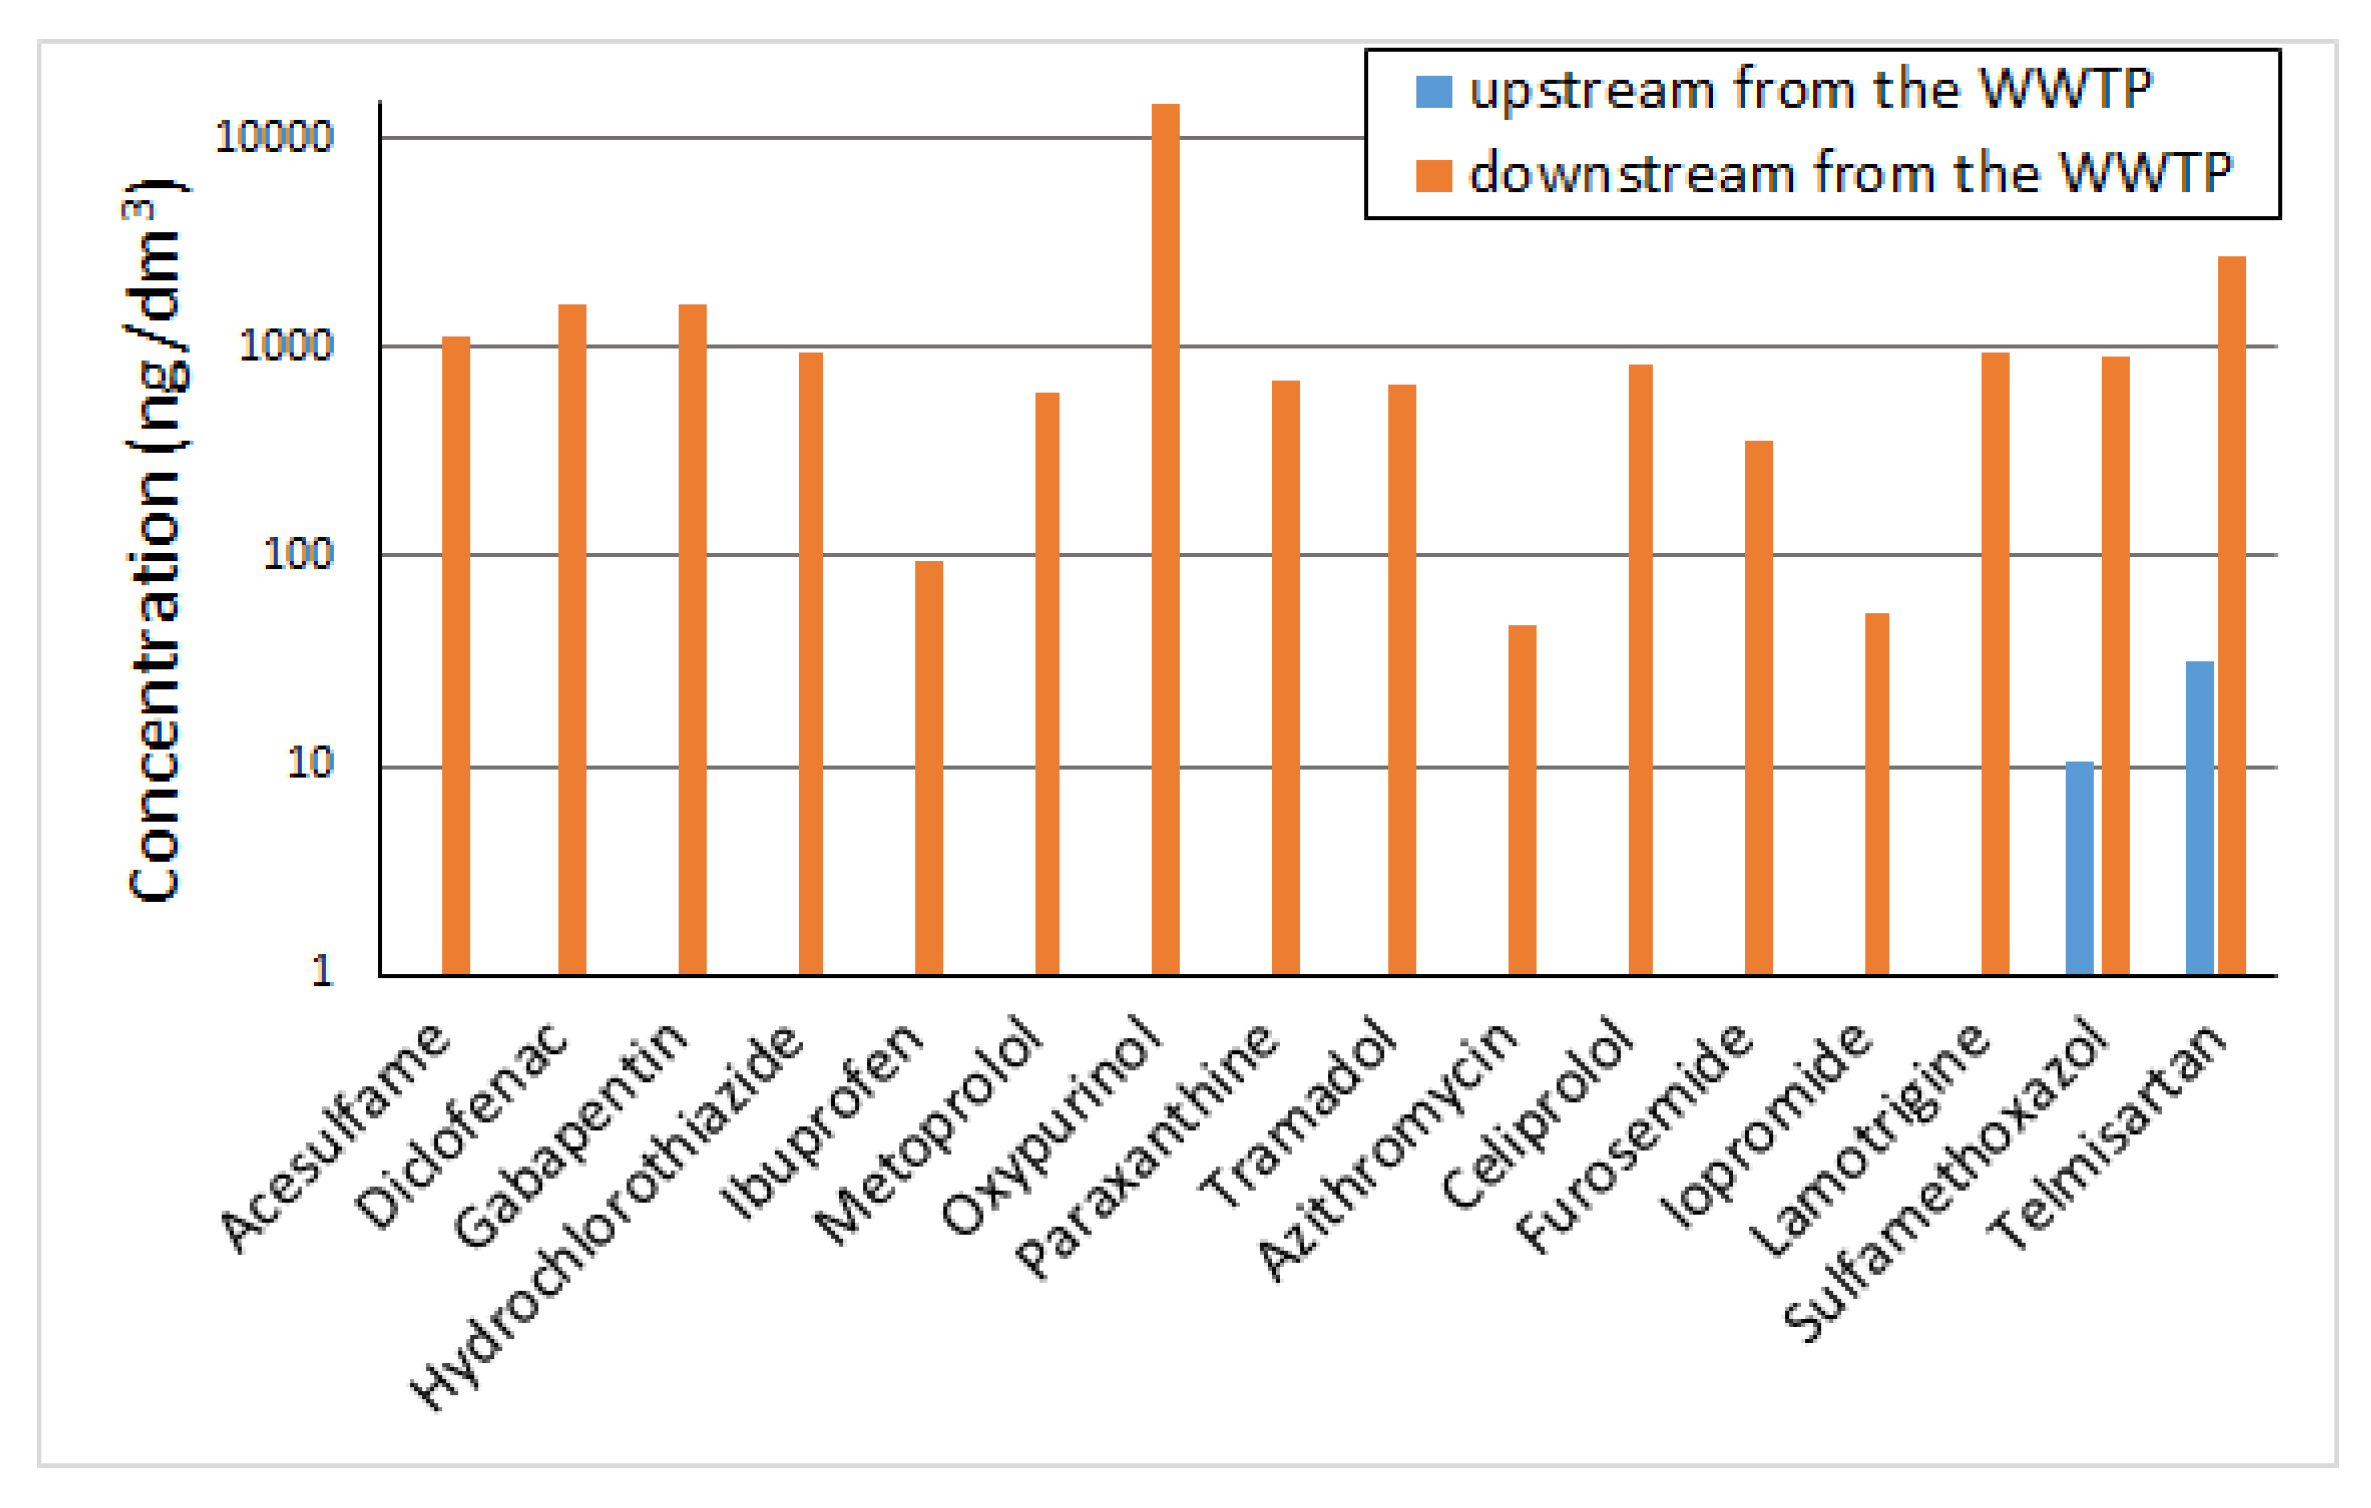
The charts in Figure 10 and Figure 11 document the change of water quality in the Hnevkovice Creek due to the discharge of treated wastewater (16 selected substances according to Figure 7, Figure 8 and Figure 9). In the stream profile above, the WWTP (S1 profile in Figure 2) were detected only slightly above the detection limit: in June 2019 gabapentin (77.1 ng/dm3), in October 2019 sulfamethoxazole (10.3 ng/dm3) and telmisartan (32.2 ng/dm3). Under the effluent discharge from the WWTP, concentrations of the monitored substances in the order of hundreds to thousands of ng/dm3 were found, the highest concentration being that for oxypurinol (13,700 ng/dm3 in spring and 14,600 ng/dm3 in autumn).
On profile S2 Hnevkovice (Figure 2) (profile identical with the monitoring of 2017–2018), other substances with maximum concentrations of more than 1000 ng/dm3 were detected that were not the subject of monitoring in 2017–2018 (measured maximum concentration provided in brackets): sucralose (2460 ng/dm3), metformin (1340 ng/dm3), 4-formylamino antipyrine (1320 ng/dm3), and benzotriazole (1060 ng/dm3).
High concentrations of some substances in surface and also in treated wastewater have raised the question of the extent to which these substances also occur in shallow groundwater, used by household wells to supply the population with drinking water. That groundwater is also drained into the Svihov reservoir and forms one—albeit small—water source for the reservoir (estimated inflow of 0.01–0.02 m3/s from the area immediately adjacent to the reservoir). Two municipal wells were selected in the center of Hnevkovice (W1, W2, Figure 2), and in October 2018 the water was analyzed for the same range of substances as surface water (93 substances, Table 1). Groundwater is significantly less contaminated, with only four substances with low concentration (Table 13).
The results indicate that the main problem of the Svihov reservoir catchment area in terms of occurrence of PPCP substances is the municipal wastewater and the level of its treatment in local WWTPs.
4. Discussion
4.1. Discussion of 2017–2018 Monitoring Results
The selected nine sampling profiles at the tributaries of the Svihov drinking water supply reservoir provided very different results. Regarding concentrations of the PPCP substances (93 analyzed substances in total), the Hnevkovice and Kozli profiles appear to be the worst, where the total sum of maximum concentrations of the analyzed substances is close to 200,000 ng/dm3. Next are the profiles Dolni Kralovice and Bernartice with a total sum of PPCP maximum concentration around 100,000 ng/dm3. The remaining five profiles have significantly lower concentrations of PPCP substances: Miletn, Kacerov and Radikovice with a sum of maximum concentrations around 8–10,000 ng/dm3, and the best quality profiles appear to be the profiles of Hulice a Brzotice with a sum of maximum concentrations of approximately 2000 ng/dm3.
The explanation is currently not entirely clear. The effect of dilution in higher flow rate streams (i.e., Miletin, Kacerov) is clear, but this does not apply to the cleanest profiles of Hulice and Brzotice, where there are also very low flow rates and comparable quantity of wastewater from other municipalities (Hnevkovice, Bernartice). Leaving aside the possibility of lower consumption of PPCP substances by the inhabitants of these municipalities (which does not seem very likely, as all municipalities are very similar in character), the only possible explanation may be the different efficiency of the municipal WWTPs in terms of PPCP removal.
Regarding the mass flow of PPCP substances into the Svihov reservoir, the situation is different; the monitored local streams usually have a flow rate fluctuating between 0.0002–0.005 m3/s (lower flow rates than long-term due to the drought since 2015). The flow rate on the Kacerov profile, however, is on the order of hundredth of m3/s (long-term average is 0.39 m3/s [35], and the average for the monitored period during the long-term drought is 0.08 m3/s). Additionally, the flow rate on the Miletin profile is in units of m3/s (long-term average 2.48 m3/s [35], average for the monitored period during the long-term drought is 1.300 m3/s). Thus, about 42% of the inflow was monitored in this project (long-term runoff average from the dam is 6.93 m3/s, inclusive of water-supply abstraction, [35]). Therefore, we consider the performed monitoring to be representative in terms of quality assessment of the inflowing water into the reservoir. The difference in flow rates is also reflected in the different mass flow of substances (Table 14). An accurate calculation is not possible due to large and frequent fluctuations in PPCP concentration and in WWTP effluent; therefore, the table contains only qualified parameter estimates and we are convinced that the estimates of the mass flow were accurate to the order of magnitude.
In total, this represents a mass flow of approximately 180 g/day from 42% of total reservoir inflow. It can be estimated that around 400–500 g of PPCP substances flow into the Svihov reservoir per day on average (in the analyzed range, as shown in Table 1 and Table 2).
Considering the frequency of occurrence of the individual PPCP substances analyzed, a group of substances that occur very often on most profiles and often at high concentration (thousands and even tens of thousands of ng/dm3) can be identified: acesulfame, azithromycin, caffeine, gabapentin, hydrochlorothiazide, ibuprofen and its metabolites, oxypurinol, paraxanthine, and saccharin. In addition to these constituents, we can identify other substances also occurring in the majority of analyses, but at a lower frequency and with lower concentrations (predominantly hundreds of ng/dm3): iopromide, metoprolol, paracetamol, and tramadol (Datel et al. [42,43]). Additionally, there is a group of 39 substances (out of the 112) that occur always, or usually, below the detection limit (see brown marked substances in Table 1 and Table 2).
Interestingly, a good correlation between the flow rate and the concentration of PPCP substances cannot be established. This could be due to the high and fluctuating proportion of wastewater effluent from the WWTPs or the fluctuating quality of the effluent discharged (different residence time in the retention tank, different quality of sewage water entering the WWTP, probably different time of water treatment in the WWTP at peak loading and outside of it, etc.).
Other uncertainties during monitoring were the non-standard results from two sampling rounds 6–7 in 2018. For some substances, there is an inexplicable decline while for others there is an increase in the observed concentration without a clear link to the change in flow rates. If this is not an analysis error (which the laboratory has excluded), it would be possible to consider a change in the population composition in the area, e.g., due to summer holidays, which could also be reflected in the change in the way the various PPCP substances are used. It should be noted that the concentration of various pharmaceuticals measured might be related to only a few people who take these medicaments. Moreover, if these people leave temporarily and if other people taking completely different medicaments arrive for the summer holidays, this may have an impact on the changed wastewater quality. Verifying this hypothesis would, however, assume a socio-demographic study in the area.
4.2. Discussion of Addittional 2019 Wastewater Moitoring—Hnevkovice
Additional monitoring of the WWTP Hnevkovice wastewater effluent in the year 2019 confirmed the most frequently occurring substances from the previous monitoring, and in addition other substances were found in high concentration in the WWTP effluent (thousands ng/dm3): celiprolol, diclofenac and diclofenac-4-hydroxy, furosemide, lamotrigine, metoprolol, sulfamethoxazole, and telmisartan. In addition, wastewater analyses have also shown frequent and high concentrations of 4-formylaminoantipyrine, benzotriazole, and sucralose, which were not analyzed during the monitoring of 2017–2018.
The results show the insufficient functionality of WWTPs in terms of removal of PPCP (even in comparison with similar neighboring municipalities with comparable conditions (Bernartice, Brzotice, Hulice). Municipalities with poor quality of treated wastewater may have WWTPs with overloaded capacity. The low efficiency of local municipal wastewater treatment can be also related to the obsolete technology at some WWTPs; small municipalities often do not have professional staff for the correct operation of WWTPs, and in some cases they have insufficient capacity, especially at peak wastewater inflows to WWTPs.
Wastewater in Hnevkovice (and other municipalities around the Svihov water reservoir) is drained separately from storm water, so that only sewage water from the households and operations flows to the municipal wastewater treatment plants. Rainwater from streets and roofs is drained by the rainwater sewer to the nearest watercourse. The quantity of wastewater is the result of household water consumption, which is currently in small municipalities around 0.07–0.08 m3 per person per day [35]. In the Czech Republic, wastewater treatment plants are mostly two-stage mechanical-biological. The mechanical part separates larger objects and particles on the screens and separates the coarse sediment, fats and oils. Finally, the fine sediment is allowed to settle in a sedimentation tank. The biological part of the WWTP consists of activation tanks, where the wastewater is aerated, and aerobic biological treatment takes place in which bacteria and other organisms consume organic substances, nitrogen and phosphorus. Activated sludge from the bodies of microorganisms is separated in the consecutive settling tanks and the water flows for natural final treatment to the retention tank under the WWTP or directly into the stream. Most small municipal WWTPs operate in an automatic mode, but the optimum treatment efficiency depends on good maintenance and correct setup of the plant. The facility in Hnevkovice is under new construction and the community is experiencing population growth, and therefore the original capacity of the WWTP is probably also overloaded, thus reducing its efficiency [38,39].
It is not possible to directly compare the water samples at the effluent from the WWTP with the water samples in the stream below the WWTP. PPCP concentrations in wastewater are variable over time, the quantity of wastewater also changes over time, and the water flow rate in the stream is not constant, and further there is a retention tank between the WWTP and the stream. The retention tank retains water for several days for sedimentation and post-treatment processes before the water is released into the watercourse. The explanation for this phenomenon may be the considerable variation in the concentration of the analyzed substances in wastewater (depending on the intensity of use of various pharmaceuticals), including daily, weekly and seasonal cycles. The monitoring did not record these maximum concentrations (samples taken 1–2 times per month, on average). Substances can then accumulate in the retention tank and be gradually released, even in higher concentrations than represented by actual water quality coming directly from the WWTP.
4.3. Raw Water
Analysis of monitoring data from 2017–2018 shows that there is a significant difference in poorer water quality of tributaries to the reservoir and significantly better quality of water abstracted at the dam for treatment into drinking water. Therefore, there are favorable processes in the reservoir space that have a positive impact on the improvement of water quality, not only in PPCP parameters. According to the data of the water authority, the theoretical residence time of the water in the reservoir is 430 days, and the total long-term average inflow into the reservoir is 6.93 m3/s. The reservoir has a length of 39.1 km, and the volume of water in the reservoir is 309 million m3 [35].
The identification of the processes in the reservoir that have an impact on PPCP concentrations was not the subject of this project. However, it may be noted that the decrease in concentrations of some of the monitored substances may certainly be related to their degradation properties, whether on the basis of biochemical or physical and chemical phenomena. The identified varying resistance to degradation is undoubtedly related to different resistance of the chemical molecules of the monitored organic substances to these processes. However, all of this is a matter of development in time, which is very rapid both in the development of knowledge about the behavior of these substances and in the development of analytical methods.
The subject of deposition of PPCP substances in sediments is also discussed in various archive sources. However, this accumulation does not seem to play a major role in the migration properties of most of the monitored substances. In addition, in this research several samples of sediments were taken for PPCP analysis in the Hnevkovice Creek estuary into the reservoir, but mostly with negative results (very small concentrations of PPCP in a solid phase).
A significant decrease in concentrations due to the retention in the reservoir occurred for the following substances: azithromycin, diclofenac, hydrochlorothiazide, ibuprofen-2-hydroxy, lamotrigine, metoprolol, telmisartan, and tramadol. On the other hand, there is a group of substances that have not displayed a significant decrease due to retention in the water reservoir: estrone, chloramphenicol, oxypurinol, progesterone, and sulfamerazine. A relatively minor effect of reservoir water retention is also shown for acesulfame, gabapentin, ibuprofen, carbamazepine, carbamazepine E, paraxanthine, ranitidine, and trimethoprim.
It can be concluded that a water reservoir with a sufficient retention time is much better for achieving a more favorable water quality, regarding the content of specific PPCP-type organic substances (and probably also pesticides, PAHs (polyaromatic hydrocarbons) and other organic degradable substances) than direct abstraction from the stream, but this influence differs for different substances.
4.4. Treated Drinking Water
For some PPCP substances, we have noticed a significant decrease during the water treatment process. The Zelivka Raw Water Treatment Plant is the largest water treatment plant for the capital city of Prague. The normal operating capacity of the treatment plant is 3 m3/s of drinking water, and at peak times it can produce up to 7 m3/s, making it one of the largest water treatment plants in Europe (www.pvl.cz [35], www.zelivska.cz [44]). The basic technology of raw water treatment is coagulation filtration with lowering of pH and dosage of aluminum sulphate. Water with precipitated impurities then undergoes one-stage filtration in open rapid sand filters (water passes through a layer of sand of the fraction 1.1-1.6 mm with a thickness of 1.6 m for about 1 h). Drinking water is finally treated with ozone and chlorine [45]. The basis of the currently developed treatment plant modernization is a new additional stage of treatment with granulated activated carbon filters to capture pesticides and other substances (e.g., medicines, hormones) in the future (Lepka [45]).
Analysis of monitoring data from 2017–2018 shows that the following substances respond well to the treatment process, mostly below the detection limit: acesulfame, hydrochlorothiazide, ibuprofen-2-hydroxy, carbamazepine, carbamazepine E, lamotrigine, oxypurinol, progesterone, telmisartan, and tramadol. It should be noted, however, that raw water already had mostly relatively low concentration (mostly in tens of ng/dm3; only acesulfame and oxypurinol often had input concentration about hundreds of ng/dm3), which the treatment plant handled well. On the contrary, there is a group of substances for which there was no significant decrease in water processing at the treatment plant, despite the fact that the input concentration was often very low (tens of ng/dm3): estrone, chloramphenicol, ibuprofen, paraxanthine, and sulfamerazine. There was also a relatively small decrease for azithromycin, gabapentin, ranitidine, and trimethoprim. Furthermore, it is alarming that the same substances tend to pass through the water reservoir (see above) over the water retention time (estrone, gabapentin, chloramphenicol, paraxanthine, ranitidine, sulfamerazine, and trimethoprim). The effect of the treatment plant cannot be commented on with regard to substances with concentrations in raw water already below the detection limit (from those discussed in the paper, e.g., diclofenac or metoprolol).
The overall quality of the produced drinking water regarding PPCP content can be assessed as high; if we do not consider substances with exceedance only in one analysis (out of 28 analyses), which is not conclusive, it can be stated that the following constituents occur with low frequency and in low concentration in the produced drinking water: ibuprofen (3 analyses out of 28, maximum 52 ng/dm3, detection limit 20 ng/dm3), estrone (3 analyses of 6, maximum 5 ng/dm3, detection limit 1 ng/dm3), acesulfame (2 analyses of 28, maximum 61 ng/dm3, detection limit of 50 ng/dm3) and azithromycin (2 analyses of 28, maximum 28 ng/dm3, detection limit 10 ng/dm3). There are no scientific sources that would challenge the safety of drinking water with such very low, and only occasional, concentration of PPCP substances (WHO [7,8], Godoy et al. [11], Bexfiled et al. [12], Chen et al. [16], RIVM [28], Kozisek et al. [38]). The existing standard raw water treatment is therefore fully sufficient for the residual concentrations observed. However, it should be pointed out that if the substances that readily pass through the treatment process in higher concentration appear in raw water, there could be a problem with the quality of the drinking water, and the inclusion of an additional water treatment stage consisting of activated carbon filters may prove to be necessary.
5. Conclusions
The research has brought several valuable findings. In terms of frequency of occurrence of the individual PPCP substances analyzed, a group of substances occurring very frequently, on most profiles and often at high concentration (thousands and even tens of thousands of ng/dm3 on some profiles) can be identified: acesulfame, azithromycin, caffeine, gabapentin, hydrochlorothiazide, ibuprofen and its metabolites, oxypurinol, paraxanthine, and saccharin. Besides these, we can name other substances also occurring in the majority of analyses, but at a lower frequency and with lower concentrations (predominantly hundreds of ng/dm3): iopromide, metoprolol, paracetamol, and tramadol. Furthermore, there is a group of 39 substances (out of the 112) that are always or almost always (in 95–100% of cases) below the detection limit of the analytical method used.
According to the detected maximum concentration of PPCP substances, highly polluted local streams can be identified (Hnevkovice, Kozli, Dolni Kralovice, and Bernartice) with an average concentration of the sum of PPCP substances in thousands of ng/dm3 (and maximums for some substances up to tens of thousands ng/dm3—gabapentin, oxypurinol, paraxanthine). Of these, profiles Hnevkovice and Dolni Kralovice are discussed in detail in this paper. Moderately polluted are Miletin, Kacerov and Radikovice profiles with estimated average values around 1000 ng/dm3. The first two of these profiles are also discussed in detail in this paper. However, these are the profiles with the highest flow rates, so even though the concentration of PPCP substances does not reach the highest values, the PPCP mass flow from these profiles into the Svihov reservoir is the highest. Hulice and Brzotice profiles have the relatively lowest concentration of PPCP substances near the limit of detection in tens or exceptionally the first hundreds of ng/dm3.
The additional detailed monitoring of wastewater effluent from Hnevkovice WWTP on the one hand confirmed the results of the previous monitoring and also found high concentrations of some other substances present in the stream at much lower concentration (probably due to rapid disintegration), and on the other hand, provided indication of very high and rapid fluctuations in the quality of ‘treated’ wastewater (e.g., iopromide 73,600 ng/dm3 in spring and 72 only ng/dm3 in autumn, or sulfamethoxazole 505 ng/dm3 in spring and 16,100 ng/dm3 in autumn).
In the future, it is strongly recommended to ensure the optimal and not overloaded operation of all local WWTPs; in some cases, it may be necessary to consider their modernization or to supplement an additional treatment stage. Further research is needed on the migration parameters and degradation processes of PPCP substances, especially those that tend to remain in the natural aquatic environment for a long time and penetrate into the raw water, and in some rare cases, into drinking water (e.g., ibuprofen, estrone, acesulfame, azithromycin).
Supplementary Materials
The following are available online at https://www.mdpi.com/2073-4441/12/5/1387/s1, Table S1: Chemical analyses.
Author Contributions
Conceptualization, J.V.D. and A.H.; Data processing, J.V.D. and A.H.; Formal analysis, J.V.D.; Funding acquisition, A.H.; Investigation, J.V.D. and A.H.; Methodology, J.V.D. and A.H.; Project administration, A.H.; Resources, A.H.; Supervision, A.H.; Visualization, J.V.D. and A.H.; Writing—original draft, J.V.D. and A.H.; Writing—review & editing, J.V.D. All authors have read and agreed to the published version of the manuscript.
Funding
This article has been prepared within the research project “Water for Prague” No. CZ.07.1.02/0.0/0.0/16_023/0000118 and “Analysis of adaptation measures to mitigate the impacts of climate change and urbanization on the water regime in the area of external Prague“, No. CZ.07.1.02/0.0/0.0/16_040/0000380, which have been financed from public funds—the EU Operational Programme Prague—Growth Pole of the Czech Republic. The funders had no role in the design of the study; in the collection, analyses, or interpretation of data; in the writing of the manuscript, or in the decision to publish the results.
Acknowledgments
We would like to thank our colleagues Pavel Balvin, Milos Klapka, Jan Hlom and Adam Vizina for their help with field data collection and data processing, the laboratory Povodi Vltavy in Plzen for chemical analyses, and also Linda Rose Staponites for final editing.
Conflicts of Interest
The authors declare no conflict of interest.
References
- Ferrer, I.; Thurman, E.M. Analysis of 100 pharmaceuticals and their degradates in water samples by liquid chromatography/quadrupole time-of-flight mass spectrometry. J. Chromatogr. A 2012, 1259, 148–157. [Google Scholar] [CrossRef]
- Richardson, S.D. Environmental mass spectrometry: Emerging contaminants and current issues. In Analytical Chemistry; American Chemical Society: Washington, DC, USA, 2006; Volume 78, pp. 4021–4045. [Google Scholar] [CrossRef]
- European Commission. Communication from the Comission to the European Parliament, the Council and the European Economic and Social Committee. European Union Strategic Approach to Pharmaceuticals in the Environment. 2019. Available online: https://eur-lex.europa.eu/legal-content/EN/TXT/?qid=1582731822045&uri=CELEX:52019DC0128 (accessed on 25 February 2020).
- Kvítek, T. Retence a jakost vody v povodí vodárenské nádrže Švihov na Želivce: Význam retence vody na zemědělském půdním fondu pro jakost vody a současně i průvodce vodním režimem krystalinika. Water retention and water quality in the catchment area of the Svihov water reservoir on the Zelivka river: Importance of Water Retention on Agricultural Land for Water Quality and at the Same Time a Guide to Water Regime of Crystalline Complex. Povodí Vltavy. 2017. Available online: https://books.google.cz/books/about/Retence_a_jakost_vody_v_povodí_vodáren.html?id=K-CStQEACAAJ&redir_esc=y (accessed on 25 February 2020). (In Czech).
- Hrkal, Z.; Eckhardt, P.; Hrabánková, A.; Novotná, E.; Rozman, D. PPCP Monitoring in Drinking Water Supply Systems: The Example of Káraný Waterworks in Central Bohemia. Water 2018, 10, 1852. [Google Scholar] [CrossRef] [Green Version]
- Snyder, S.A. Occurrence of Pharmaceuticals in U.S. Drinking Water. ACS Symp. Ser. 2010, 1048, 69–80. [Google Scholar] [CrossRef]
- World Health Organization. WHO/HSE/WSH/11.05, Pharmaceuticals in Drinking Water. 2011. Available online: http://www.who.int/water_sanitation_health/publications/2011/pharmaceuticals/en (accessed on 25 February 2020).
- World Health Organization. Pharmaceuticals in Drinking-Water; World Health Organization: Geneva, Switzerland, 2012; Available online: https://www.who.int/water_sanitation_health/publications/2012/pharmaceuticals/en/ (accessed on 24 February 2020).
- Jones, O.A.; Lester, J.N.; Voulvoulis, N.; Voulvoulis, N. Pharmaceuticals: A threat to drinking water? Trends Biotechnol. 2005, 23, 163–167. [Google Scholar] [CrossRef]
- Stackelberg, P.E.; Gibs, J.; Furlong, E.T.; Meyer, M.T.; Zaugg, S.D.; Lippincott, R.L. Efficiency of conventional drinking-water-treatment processes in removal of pharmaceuticals and other organic compounds. Sci. Total Environ. 2007, 377, 255–272. [Google Scholar] [CrossRef] [PubMed]
- Godoy, A.A.; Kummrow, F.; Pamplin, P.A.Z. Occurrence, ecotoxicological effects and risk assessment of antihypertensive pharmaceutical residues in the aquatic environment—A review. Chemosphere 2015, 138, 281–291. [Google Scholar] [CrossRef] [PubMed]
- Bexfield, L.M.; Toccalino, P.L.; Belitz, K.; Foreman, W.T.; Furlong, E.T. Hormones and Pharmaceuticals in Groundwater Used As a Source of Drinking Water Across the United States. Environ. Sci. Technol. 2019, 53, 2950–2960. [Google Scholar] [CrossRef] [PubMed] [Green Version]
- Rozman, D.; Hrkal, Z.; Eckhardt, P.; Novotná, E.; Boukalova, Z. Pharmaceuticals in groundwaters: A case study of the psychiatric hospital at Horní Beřkovice, Czech Republic. Environ. Earth Sci. 2014, 73, 3775–3784. [Google Scholar] [CrossRef]
- Rozman, D.; Hrkal, Z.; Váňa, M.; Vymazal, J.; Boukalová, Z. Occurrence of Pharmaceuticals in Wastewater and Their Interaction with Shallow Aquifers: A Case Study of Horní Beřkovice, Czech Republic. Water 2017, 9, 218. [Google Scholar] [CrossRef]
- Battaglin, W.A.; Bradley, P.M.; Iwanowicz, L.R.; Journey, C.A.; Walsh, H.L.; Blazer, V.S. Pharmaceuticals, hormones, pesticides, and other bioactive contaminants in water, sediment, and tissue from Rocky Mountain National Park, 2012–2013. Sci. Total Environ. 2018, 643, 651–673. [Google Scholar] [CrossRef]
- Chen, Y.; Vymazal, J.; Březinová, T.; Koželuh, M.; Kule, L.; Huang, J.; Chen, Z. Occurrence, removal and environmental risk assessment of pharmaceuticals and personal care products in rural wastewater treatment wetlands. Sci. Total Environ. 2016, 566, 1660–1669. [Google Scholar] [CrossRef] [PubMed]
- Vymazal, J.; Březinová, T.D. Removal of saccharin from municipal sewage: The first results from constructed wetlands. Chem. Eng. J. 2016, 306, 1067–1070. [Google Scholar] [CrossRef]
- Vymazal, J.; Březinová, T.D.; Koželuh, M.; Kule, L. Occurrence and removal of pharmaceuticals in four full-scale constructed wetlands in the Czech Republic—The first year of monitoring. Ecol. Eng. 2017, 98, 354–364. [Google Scholar] [CrossRef]
- Lubliner, B.; Redding, M.; Ragsdale, D. Pharmaceuticals and Personal Care Products in Municipal Wastewater and Their Removal by Nutrient Treatment Technologies. Washington State Department of Ecology, Olympia, WA, USA Publication Number 10-03-004. Available online: https://fortress.wa.gov/ecy/publications/documents/1003004.pdf (accessed on 25 February 2020).
- Tauxe-Wuersch, A.; De Alencastro, L.; Grandjean, D.; Tarradellas, J. Occurrence of several acidic drugs in sewage treatment plants in Switzerland and risk assessment. Water Res. 2005, 39, 1761–1772. [Google Scholar] [CrossRef] [PubMed]
- Kasprzyk-Hordern, B.; Dinsdale, R.; Guwy, A.J. The removal of pharmaceuticals, personal care products, endocrine disruptors and illicit drugs during wastewater treatment and its impact on the quality of receiving waters. Water Res. 2009, 43, 363–380. [Google Scholar] [CrossRef]
- Rodriguez, E.; Campinas, M.; Acero, J.L.; Rosa, M.J. Investigating PPCP Removal from Wastewater by Powdered Activated Carbon/Ultrafiltration. Water Air Soil Pollut. 2016, 227, 1–14. [Google Scholar] [CrossRef]
- Jobling, S.; Williams, R.; Johnson, A.; Taylor, A.; Gross-Sorokin, M.; Nolan, M.; Tyler, C.R.; Van Aerle, R.; Santos, E.M.; Brighty, G. Predicted Exposures to Steroid Estrogens in U.K. Rivers Correlate with Widespread Sexual Disruption in Wild Fish Populations. Environ. Health Perspect. 2005, 114, 32–39. [Google Scholar] [CrossRef] [Green Version]
- Kostich, M.S.; Lazorchak, J. Risks to aquatic organisms posed by human pharmaceutical use. Sci. Total Environ. 2008, 389, 329–339. [Google Scholar] [CrossRef]
- Standley, L.J.; Rudel, R.A.; Swartz, C.H.; Attfield, K.R.; Christian, J.; Erickson, M.; Brody, J.G. Wastewater-contaminated groundwater as a source of endogenous hormones and pharmaceuticals to surface water ecosystems. Environ. Toxicol. Chem. 2008, 27, 2457–2468. [Google Scholar] [CrossRef] [Green Version]
- Yamamoto, H.; Nakamura, Y.; Moriguchi, S.; Nakamura, Y.; Honda, Y.; Tamura, I.; Hirata, Y.; Hayashi, A.; Sekizawa, J. Persistence and partitioning of eight selected pharmaceuticals in the aquatic environment: Laboratory photolysis, biodegradation, and sorption experiments. Water Res. 2009, 43, 351–362. [Google Scholar] [CrossRef]
- Kase, R. Stoffdatenblattentwurf für Carbamazepin (Stand 15/02/2010; update 30/04/2010). Erhältlich bei: Oekotoxzentrum, Zentrum für angewandte Ökotoxikologie, EAWAG (2013). Vorschläge für akute und chronische Qualitätskriterien für ausgewählte schweizrelevante Substanzen. Available online: http://www.oekotoxzentrum.ch/expertenservice/qualitaetskriterien/vorschlaege (accessed on 25 February 2020).
- RIVM. Environmental Risk Limits for Pharmaceuticals: Derivation of WFD Water Quality Standards for Carbamazepine, Metoprolol, Metformin and Amidotrizoic Acid; RIVM Letter Report 270006002/2014; RIVM: Bilthoven, The Netherlands, 2014. [Google Scholar]
- Directive 2008/105/ec of the European Parliament and of the Council of 16 December 2008 on Environmental Quality Standards in the Field of Water Policy, Amending and Subsequently Repealing Council Directives 82/176/eec, 83/513/eec, 84/156/eec, 84/491/eec, 86/280/eec and Amending Directive 2000/60/ec of the European Parliament and of the Council. Available online: https://eur-lex.europa.eu/legal-content/en/TXT/?uri=CELEX:32008L0105 (accessed on 25 February 2020).
- Directive 2013/39/EU of the European Parliament and of the Council of 12 August 2013 Amending Directives 2000/60/EC and 2008/105/EC as Regards Priority Substances in the Field of Water Policy. Available online: https://eur-lex.europa.eu/LexUriServ/LexUriServ.do?uri=OJ:L:2013:226:0001:0017:EN:PDF (accessed on 25 February 2020).
- Marsland, T.; Roy, S. “Groundwater Watch List: Pharmaceuticals Pilot Study. Monitoring Data Collection and Initial Analysis. For European Commission—And CIS Groundwater Working Group (WGGW)”, Amec Foster Wheeler Associate, Shrewsbury. Available online: http://www.vlakwa.be/fileadmin/user_upload/20160629-File3-1600204_Pharm_Pilot_Study_GRW.doc (accessed on 25 February 2020).
- Commission Implementing Decision (EU) 2018/840 of 5 June 2018 Establishing a Watch List of Substances for Union-Wide Monitoring in the Field of Water Policy Pursuant to Directive 2008/105/EC of the European Parliament and of the Council and repealing Commission Implementing Decision (EU) 2015/495 (notified under document C(2018) 3362). Available online: https://eur-lex.europa.eu/legal-content/EN/TXT/?uri=CELEX%3A32018D0840 (accessed on 25 February 2020).
- Wirtz, F. Danube, Meuse and Rhine MEMORANDUM 2008. Environ. Sci. Pollut. Res. 2009, 16, 112–115. [Google Scholar] [CrossRef] [PubMed] [Green Version]
- Vyhláška, Č. 252/2004 Sb., kterou se stanoví hygienické požadavky na pitnou a teplou vodu a četnost a rozsah kontroly pitné vody. Decree No. 252/2004 Coll. about hygiene requirements for drinking and hot water and frequency and scope of drinking water control. In Zákony pro lidi.cz. Available online: https://www.zakonyprolidi.cz/cs/2004-25 (accessed on 25 February 2020). (In Czech).
- Povodí Vltavy. State Enterprise Online. Available online: www.pvl.cz (accessed on 25 February 2020).
- Morteani, G.; Möller, P.; Fuganti, A.; Paces, T. Input and fate of anthropogenic estrogens and gadolinium in surface water and sewage plants in the hydrological basin of Prague (Czech Republic). Environ. Geochem. Health 2006, 28, 257–264. [Google Scholar] [CrossRef] [PubMed]
- Swartz, C.H.; Reddy, S.; Benotti, M.J.; Yin, H.; Barber, L.B.; Brownawell, B.J.; Rudel, R.A. Steroid Estrogens, Nonylphenol Ethoxylate Metabolites, and Other Wastewater Contaminants in Groundwater Affected by a Residential Septic System on Cape Cod, MA. Environ. Sci. Technol. 2006, 40, 4894–4902. [Google Scholar] [CrossRef] [PubMed] [Green Version]
- Kozisek, F.; Pomykacova, I.; Jeligova, H.; Cadek, V.; Svobodova, V. Survey of human pharmaceuticals in drinking water in the Czech Republic. J. Water Health 2013, 11, 84–97. [Google Scholar] [CrossRef] [PubMed]
- Datel, J.; Hartlová, L.; Hrabánková, A.; Pistora, Z.; Kucera, J.; Novotná, J.; Pastuszek, F. Methodology for Comprehensive Management of Small Water Resources to Ensure Optimal Quality of Drinking Water in Normal and Emergency Situations. Available online: http://mistni-zdroje.vuv.cz (accessed on 25 February 2020). (In Czech).
- Solinst Canada Ltd. Available online: www.solinst.com (accessed on 25 February 2020).
- Czech Hydrometeorological Institute Online. Available online: www.chmi.cz (accessed on 25 February 2020).
- Datel, J.V.; Hrabánková, A.; Hrkal, Z. Pharmaceuticals in the Drinking Water Reservoir Svihov, Czech Republic, Abstract Proceedings 15th Specialized Conference Small Water & Wastewater Systems; Technion- Israel Institute of Technology: Haifa, Izrael, 2018; ISBN 050-5288969. pp. 124–125. Available online: https://swws2018.net.technion.ac.il (accessed on 15 April 2019).
- Datel, J.V.; Hrabánková, A.; Hrkal, Z. Occurrence of Pharmaceuticals in the Drinking Water Resources for Prague, Czech Republic, Abstract Proceedings 15th Hydrogeológia—Vzdelávanie, Veda a Prax, Slovenská Asociácia Hydrogeológov; Kúpele Nimnica: kúpele, Slovakia, 2018; ISBN 978-80-972651-1-3. pp. 60–61. Available online: http://www.sah-podzemnavoda.sk/cms/page.php?7 (accessed on 25 February 2020). (In Czech)
- Úpravna vody Želivka (Želivka Drinking Water Treatment Plant). Zelivska provozni, a.s. Available online: www.zelivska.cz (accessed on 10 April 2020).
- LEPKA, J. K padesátému výročí zahájení výstavby souboru staveb vodního díla Želivka, On the occasion of the fiftieth anniversary of the commencement of the construction of the Želivka waterworks, 08/15, Journal Stavebnictví, Expodata Brno. Časopis Stavebnictví, Expodata Brno. Available online: https://www.casopisstavebnictvi.cz/k-padesatemu-vyroci-zahajeni-vystavby-souboru-staveb-vodniho-dila-zelivka_N5474 (accessed on 25 February 2020). (In Czech).
Figure 1.
Svihov reservoir, location of hydrological profiles and sampling points. Topographical base map: geoportal.cuzk.cz.
Figure 1.
Svihov reservoir, location of hydrological profiles and sampling points. Topographical base map: geoportal.cuzk.cz.

Figure 2.
Hnevkovice—sampled wells (W1, W2), effluent from WWTP (wastewater treatment plant) and Hnevkovice stream upstream and downstream from the WWTP (S1, S2).
Figure 2.
Hnevkovice—sampled wells (W1, W2), effluent from WWTP (wastewater treatment plant) and Hnevkovice stream upstream and downstream from the WWTP (S1, S2).

Figure 3.
Monitoring results on Hnevkovice profile.

Figure 4.
Monitoring results on Dolni Kralovice profile.

Figure 5.
Monitoring results on Miletin profile (flow rates data [41]).
Figure 5.
Monitoring results on Miletin profile (flow rates data [41]).

Figure 6.
Monitoring results on Kacerov profile (flow rates data [41]).
Figure 6.
Monitoring results on Kacerov profile (flow rates data [41]).

Figure 7.
Water quality of the Hnevkovice WWTP (wastewater treatment plant) effluent: diclofenac, acesulfame, gabapentin, hydrochlorothiazide, ibuprofen, metoprolol, paraxanthine, tramadol.
Figure 7.
Water quality of the Hnevkovice WWTP (wastewater treatment plant) effluent: diclofenac, acesulfame, gabapentin, hydrochlorothiazide, ibuprofen, metoprolol, paraxanthine, tramadol.

Figure 8.
Water quality of the Hnevkovice WWTP effluent: azithromycin, furosemide, lamotrigine, telmisartan, celiprolol.
Figure 8.
Water quality of the Hnevkovice WWTP effluent: azithromycin, furosemide, lamotrigine, telmisartan, celiprolol.

Figure 9.
Water quality of the Hnevkovice WWTP effluent: iopromide, oxypurinol, and sulfamethoxazole.
Figure 9.
Water quality of the Hnevkovice WWTP effluent: iopromide, oxypurinol, and sulfamethoxazole.

Figure 10.
Concentration of 16 selected pharmaceuticals in the profiles upstream and downstream from the Hnevkovice WWTP on 28 June 2019 (only substances detected above the detection limit).
Figure 10.
Concentration of 16 selected pharmaceuticals in the profiles upstream and downstream from the Hnevkovice WWTP on 28 June 2019 (only substances detected above the detection limit).

Figure 11.
Concentration of 16 selected pharmaceuticals in profiles above and below Hnevkovice WWTP on 21 October 2019 (only substances detected above the detection limit).
Figure 11.
Concentration of 16 selected pharmaceuticals in profiles above and below Hnevkovice WWTP on 21 October 2019 (only substances detected above the detection limit).


Table 1.
List of analyzed pharmaceuticals and personal care products (PPCP) constituents monitored in 2017–2018. Marked in blue are the nine substances selected for water monitoring evaluation between 2017 and 2018, and in green the seven other substances deliberated additionally in the 2019 part of wastewater monitoring. Substances with concentration mostly below the detection limit (95–100% of samples) are marked in brown.
| Analyzed Constituent | Detection Limit (ng/dm3) | Analysis Uncertainty (%) | Use |
|---|---|---|---|
| 17a-ethynilestradiol | 2 | 35 | hormone |
| 17-alpha-estradiol | 1 | 35 | hormone |
| 17-beta-estradiol | 1 | 35 | hormone |
| Acebutolol | 10 | 35 | beta blocker |
| Acesulfame | 50 | 35 | sweetener |
| Alfuzosin | 10 | 35 | beta blocker |
| Atenolol | 10 | 30 | beta blocker |
| Azithromycin | 10 | 35 | antibiotic |
| Bezafibrate | 10 | 35 | fibrate |
| Bisoprolol | 10 | 35 | beta blocker |
| Bisphenol A | 50 | 35 | plastics production |
| Bisphenol B | 50 | 35 | plastics production |
| Bisphenol S | 50 | 35 | plastics production |
| Caffeine | 100 | 45 | stimulant |
| Carbamazepine | 10 | 30 | antiepileptic |
| Carbamazepine-2-hydr. | 10 | 35 | carbamazepine metabolite |
| Carbamazepine-DH | 10 | 40 | carbamazepine metabolite |
| Carbamazepine-DHH | 10 | 40 | carbamazepine metabolite |
| Carbamazepine-E | 10 | 40 | carbamazepine metabolite |
| Celiprolol | 10 | 35 | beta blocker |
| Chloramphenicol | 20 | 35 | antibiotic |
| Ciprofloxacin | 20 | 35 | antibiotic |
| Citalopram | 20 | 35 | antidepressant |
| Clarithromycin | 10 | 35 | antibiotic |
| Clindamycin | 10 | 35 | antibiotic |
| Clofibric acid | 10 | 35 | clofibrate metabolite |
| Cotinine | 20 | 35 | stimulant |
| Cyclophosphamide | 10 | 35 | cancer chemotherapy |
| Diatrizoate | 50 | 35 | contrast medium |
| Diclofenac | 20 | 30 | NSAID (non-steroidal anti-inflammatory) |
| Diclofenac-4-hydroxy | 20 | 40 | diclofenac metabolite |
| Diltiazem | 10 | 35 | vasodilator |
| Doxycycline | 50 | 35 | antibiotic |
| Enrofloxacin | 20 | 35 | antibiotic |
| Erythromycin | 10 | 30 | antibiotic |
| Estriol | 10 | 35 | hormone |
| Estrone | 1 | 35 | hormone |
| Fexofenadine | 10 | 35 | antihistaminic |
| Fluconazole | 10 | 35 | fungicide |
| Fluoxetine | 10 | 35 | antidepressant |
| Furosemide | 50 | 35 | diuretic |
| Gabapentin | 10 | 35 | sedative |
| Gemfibrozil | 10 | 35 | fibrate |
| Hydrochlorothiazide | 50 | 35 | diuretic |
| Ibuprofen | 20 | 35 | NSAID |
| Ibuprofen-2-hydroxy | 30 | 40 | ibuprofen metabolite |
| Ibuprofen-carboxy | 20 | 40 | ibuprofen metabolite |
| Iohexol | 50 | 35 | contrast medium |
| Iomeprol | 50 | 35 | contrast medium |
| Iopamidol | 50 | 35 | contrast medium |
| Iopromide | 50 | 30 | contrast medium |
| Irbesartan | 10 | 35 | treatment of hypertension |
| Ivermectin | 50 | 35 | antiparasitic |
| Ketoprofen | 10 | 35 | NSAID |
| Lamotrigine | 10 | 35 | anticonvulsant drug |
| Lovastatin | 10 | 35 | statin drug |
| Memantine | 20 | 35 | Alzheimer’s disease medication |
| Metoprolol | 10 | 30 | beta blocker |
| Mirtazapine | 10 | 35 | antidepressant |
| Naproxen | 50 | 30 | NSAID |
| Naproxen-O-desmeth. | 20 | 40 | naproxen metabolite |
| Norfloxacin | 20 | 35 | antibiotic |
| Ofloxacin | 20 | 35 | antibiotic |
| Oxcarbazepine | 10 | 40 | anticonvulsant drug |
| Oxypurinol | 50 | 35 | treatment of hyperuricemia |
| Paracetamol | 10 | 35 | painkiller |
| Paraxanthine | 100 | 35 | psychoactive stimulator |
| Penicillin G | 10 | 30 | antibiotic |
| Phenazone | 10 | 35 | NSAID |
| Primidone | 10 | 35 | anticonvulsant drug |
| Progesterone | 0.5 | 35 | hormone |
| Propranolol | 10 | 35 | beta blocker |
| Propyphenazone | 10 | 35 | NSAID |
| Ranitidine | 10 | 35 | gastric acidity treatment |
| Roxithromycin | 10 | 35 | antibiotic |
| Saccharin | 50 | 35 | sweetener |
| Sertraline | 10 | 35 | antidepressant |
| Simvastatin | 10 | 35 | statin drug |
| Sotalol | 10 | 35 | beta blocker |
| Sulfamerazine | 10 | 35 | antibiotic |
| Sulfamethazine | 10 | 35 | antibiotic |
| Sulfamethoxazole | 10 | 30 | antibiotic |
| Sulfanilamide | 50 | 35 | antibiotic |
| Sulfapyridine | 10 | 35 | antibiotic |
| Telmisartan | 20 | 35 | treatment of hypertension |
| Testosterone | 0.5 | 35 | hormone |
| Tiamulin | 10 | 35 | antibiotic |
| Tramadol | 10 | 35 | painkiller |
| Triclocarban | 10 | 35 | antimicrobial drug |
| Triclosan | 20 | 30 | antimicrobial drug |
| Trimethoprim | 10 | 30 | antibiotic |
| Valsartan | 10 | 35 | treatment of hypertension |
| Venlafaxine | 10 | 35 | antidepressant |
| Warfarin | 10 | 30 | blood anticoagulant |
Table 2.
List of analyzed PPCP constituents analyzed in 2019 in addition to 2017–2018 monitoring. Substances with concentration mostly below the detection limit (95–100% of samples) are marked in brown.
Table 2.
List of analyzed PPCP constituents analyzed in 2019 in addition to 2017–2018 monitoring. Substances with concentration mostly below the detection limit (95–100% of samples) are marked in brown.
| Analyzed Constituent | Detection Limit (ng/dm3) | Analysis Uncertainty (%) | Use |
|---|---|---|---|
| 4-formylaminoantipyrine | 10 | 35 | antibiotic |
| Atorvastatin | 10 | 35 | statin drug |
| Benzotriazole | 20 | 35 | anticorrosive and deicing products |
| Benzotriazole methyl | 20 | 35 | anticorrosive and deicing products |
| Bisoprolol | 10 | 35 | beta blocker |
| Butylparaben | 10 | 35 | antimicrobial drug |
| Climbazole | 10 | 35 | fungicide |
| Cyclamate | 100 | 35 | sweetener |
| DEET (diethyltoluamide) | 10 | 30 | insect repellent |
| Ethylparaben | 10 | 35 | antimicrobial drug |
| Metformin | 20 | 40 | diabetes medicine |
| Methylparaben | 30 | 35 | fungicide |
| Norverapamil | 10 | 35 | verapamil metabolite |
| OMC (ethylhexyl methoxycinnamate) | 1000 | 35 | cosmetics (hair spray, sunscreen) |
| Propylparaben | 20 | 35 | antimicrobial drug |
| Salbutamol | 10 | 35 | asthma treatment |
| Sucralose | 1000 | 35 | sweetener |
| Valsartan acid | 10 | 35 | valsartan metabolite |
| Verapamil | 10 | 35 | treatment of hypertension |
Table 3.
Hnevkovice Profile—number of samples.
| Substance | Number of Samples | Detection Limit (ng/dm3) | Number of Samples below Detection Limit |
|---|---|---|---|
| Acesulfame | 16 | 50 | 0 |
| Diclofenac | 28 | 20 | 2 |
| Gabapentin | 28 | 10 | 2 |
| Hydrochlorothiazide | 28 | 50 | 0 |
| Ibuprofen | 28 | 20 | 2 |
| Metoprolol | 28 | 10 | 2 |
| Oxypurinol | 16 | 50 | 1 |
| Paraxanthine | 26 | 100 | 0 |
| Tramadol | 28 | 10 | 1 |
Table 4.
Hnevkovice Profile—basic statistical parameters.
| Substance | Min (ng/dm3) | Max (ng/dm3) | Median (ng/dm3) | Average (ng/dm3) | Standard Deviation (ng/dm3) | Coefficient of Variation (%) |
|---|---|---|---|---|---|---|
| Acesulfame | 443 | 15,000 | 1250 | 3846 | 4691 | 122 |
| Diclofenac | ˂20 | 3400 | 816 | 908 | 651 | 72 |
| Gabapentin | ˂10 | 33,000 | 1900 | 7701 | 9532 | 124 |
| Hydrochlorothiazide | 388 | 3440 | 1030 | 1291 | 744 | 58 |
| Ibuprofen | ˂20 | 1200 | 274 | 413 | 350 | 85 |
| Metoprolol | ˂10 | 1350 | 610 | 623 | 298 | 48 |
| Oxypurinol | ˂50 | 34,700 | 20,250 | 16,946 | 11,167 | 66 |
| Paraxanthine | 306 | 32,000 | 1285 | 3464 | 6930 | 200 |
| Tramadol | ˂10 | 1500 | 955 | 912 | 365 | 40 |
Table 5.
Dolni Kralovice Profile—number of samples
| Substance | Number of Samples | Detection Limit (ng/dm3) | Number of Samples below Detection Limit |
|---|---|---|---|
| Acesulfame | 16 | 50 | 0 |
| Diclofenac | 28 | 20 | 2 |
| Gabapentin | 28 | 10 | 2 |
| Hydrochlorothiazide | 28 | 50 | 0 |
| Ibuprofen | 28 | 20 | 2 |
| Metoprolol | 28 | 10 | 0 |
| Oxypurinol | 16 | 50 | 2 |
| Paraxanthine | 26 | 100 | 0 |
| Tramadol | 28 | 10 | 0 |
Table 6.
Dolni Kralovice Profile—basic statistical parameters
| Substance | Min (ng/dm3) | Max (ng/dm3) | Median (ng/dm3) | Average (ng/dm3) | Standard Deviation (ng/dm3) | Coefficient of Variation (%) |
|---|---|---|---|---|---|---|
| Acesulfame | 695 | 11,800 | 1900 | 3177 | 3164 | 100 |
| Diclofenac | ˂20 | 1400 | 360 | 457 | 288 | 63 |
| Gabapentin | ˂10 | 3120 | 1045 | 1200 | 740 | 62 |
| Hydrochlorothiazide | 370 | 2300 | 1055 | 1135 | 498 | 44 |
| Ibuprofen | ˂20 | 2990 | 200 | 315 | 540 | 171 |
| Metoprolol | 22 | 429 | 205 | 208 | 106 | 51 |
| Oxypurinol | ˂50 | 20,000 | 8205 | 8142 | 6378 | 78 |
| Paraxanthine | 163 | 11,400 | 577 | 1816 | 2907 | 160 |
| Tramadol | 29 | 540 | 147 | 188 | 129 | 69 |
Table 7.
Miletin Profile—number of samples.
| Substance | Number of Samples | Detection Limit (ng/dm3) | Number of Samples below Detection Limit |
|---|---|---|---|
| Acesulfame | 16 | 50 | 0 |
| Diclofenac | 28 | 20 | 20 |
| Gabapentin | 28 | 10 | 2 |
| Hydrochlorothiazide | 28 | 50 | 25 |
| Ibuprofen | 28 | 20 | 16 |
| Metoprolol | 28 | 10 | 17 |
| Oxypurinol | 16 | 50 | 2 |
| Paraxanthine | 26 | 100 | 1 |
| Tramadol | 28 | 10 | 5 |
Table 8.
Miletin Profile—basic statistical parameters
| Substance | Min (ng/dm3) | Max (ng/dm3) | Median (ng/dm3) | Average (ng/dm3) | Standard Deviation (ng/dm3) | Coefficient of Variation (%) |
|---|---|---|---|---|---|---|
| Acesulfame | 140 | 631 | 343 | 337 | 131 | 39 |
| Diclofenac | ˂20 | 91 | ˂20 | 26 | 14 | 54 |
| Gabapentin | ˂10 | 280 | 171 | 157 | 64 | 41 |
| Hydrochlorothiazide | ˂50 | 188 | ˂50 | 60 | 33 | 55 |
| Ibuprofen | ˂20 | 110 | ˂20 | 30 | 22 | 73 |
| Metoprolol | ˂10 | 26 | ˂10 | 12 | 4 | 33 |
| Oxypurinol | ˂50 | 1820 | 483 | 597 | 436 | 73 |
| Paraxanthine | ˂100 | 1020 | 165 | 264 | 246 | 93 |
| Tramadol | ˂10 | 36 | 20 | 19 | 7 | 37 |
Table 9.
Kacerov Profile—number of samples
| Substance | Number of Samples | Detection Limit (ng/dm3) | Number of Samples below Detection Limit |
|---|---|---|---|
| Acesulfame | 15 | 50 | 0 |
| Diclofenac | 26 | 20 | 15 |
| Gabapentin | 26 | 10 | 4 |
| Hydrochlorothiazide | 26 | 50 | 11 |
| Ibuprofen | 26 | 20 | 18 |
| Metoprolol | 26 | 10 | 13 |
| Oxypurinol | 15 | 50 | 3 |
| Paraxanthine | 25 | 100 | 10 |
| Tramadol | 26 | 10 | 9 |
Table 10.
Kacerov Profile—basic statistical parameters
| Substance | Min (ng/dm3) | Max (ng/dm3) | Median (ng/dm3) | Average (ng/dm3) | Standard Deviation (ng/dm3) | Coefficient of Variation (%) |
|---|---|---|---|---|---|---|
| Acesulfame | 110 | 931 | 270 | 356 | 231 | 50 |
| Diclofenac | ˂20 | 170 | ˂20 | 35 | 32 | 91 |
| Gabapentin | ˂10 | 315 | 29 | 47 | 59 | 125 |
| Hydrochlorothiazide | ˂50 | 1380 | 88 | 165 | 258 | 156 |
| Ibuprofen | ˂20 | 69 | ˂20 | 25 | 11 | 44 |
| Metoprolol | ˂10 | 36 | 11 | 16 | 8 | 50 |
| Oxypurinol | ˂50 | 2800 | 205 | 464 | 677 | 146 |
| Paraxanthine | ˂100 | 933 | 112 | 204 | 202 | 99 |
| Tramadol | ˂10 | 92 | 17 | 29 | 24 | 83 |
Table 11.
Quality of raw water from the Svihov reservoir—all substances detected above the detection limit.
Table 11.
Quality of raw water from the Svihov reservoir—all substances detected above the detection limit.
| Substance | Number of Analyses Total | Number of Analyses above Detection Limit | Detection Limit (ng/dm3) | Maximum Concentration (ng/dm3) |
|---|---|---|---|---|
| Acesulfame | 16 | 8 | 100 | 318 |
| Azithromycin | 28 | 2 | 10 | 274 |
| Diclofenac | 28 | 1 | 20 | 58 |
| Estrone | 6 | 2 | 1 | 5 |
| Gabapentin | 28 | 25 | 10 | 157 |
| Hydrochlorothiazide | 28 | 2 | 50 | 99 |
| Chloramphenicol | 28 | 1 | 20 | 48 |
| Ibuprofen | 28 | 3 | 20 | 56 |
| Ibuprofen-2-hydroxy | 28 | 2 | 30 | 91 |
| Carbamazepine | 28 | 7 | 10 | 13 |
| Carbamazepine-E | 28 | 2 | 10 | 12 |
| Lamotrigine | 8 | 5 | 10 | 15 |
| Oxypurinol | 16 | 7 | 50 | 868 |
| Paraxanthine | 26 | 13 | 100 | 424 |
| Progesterone | 6 | 2 | 0.5 | 2 |
| Ranitidine | 28 | 2 | 10 | 75 |
| Sulfamerazine | 28 | 2 | 10 | 22 |
| Telmisartan | 8 | 7 | 20 | 55 |
| Tramadol | 28 | 5 | 10 | 13 |
| Trimethoprim | 28 | 1 | 10 | 16 |
Table 12.
Quality of drinking water produced—all substances detected above the detection limit.
| Substance | Number of analyses Total | Number of Analyses above Detection Limit | Detection Limit (ng/dm3) | Maximum Concentration (ng/dm3) |
|---|---|---|---|---|
| Acesulfame | 28 | 2 | 50 | 61 |
| Azithromycin | 28 | 2 | 10 | 28 |
| Estrone | 6 | 3 | 1 | 5 |
| Gabapentin | 28 | 1 | 10 | 18 |
| Ibuprofen | 28 | 3 | 20 | 52 |
| Paraxanthine | 28 | 1 | 100 | 187 |
| Ranitidine | 28 | 1 | 10 | 39 |
| Sulfamerazine | 28 | 1 | 10 | 24 |
| Tramadol | 28 | 1 | 10 | 85 |
Table 13.
Substances detected above the detection limit of two groundwater sources—Hnevkovice village wells (Figure 2).
Table 13.
Substances detected above the detection limit of two groundwater sources—Hnevkovice village wells (Figure 2).
| Substance | Unit | Detection Limit | W1 | W2 |
|---|---|---|---|---|
| Acesulfame | ng/dm3 | 50 | 212 | |
| Bisphenol A | ng/dm3 | 50 | 247 | |
| Estrone | ng/dm3 | 1 | 3.6 | 2.5 |
| Gabapentin | ng/dm3 | 10 | 23.7 |
Table 14.
Estimates of mass flow of PPCP substances into reservoir Svihov by concentration and flow rate.
Table 14.
Estimates of mass flow of PPCP substances into reservoir Svihov by concentration and flow rate.
| Profile | Long-Term Average Flow Rate (L/s) | Estimate of Average PPCP Substance Concentration (ng/dm3) | Mass Flow General Value (g/day) |
|---|---|---|---|
| Bernatice | 0.2 | 11,000 | 1.0 |
| Brzotice | 0.8 | 400 | 0.02 |
| Dolni Kralovice | 5.0 | 18,000 | 7.8 |
| Hnevkovice | 1.7 | 36,000 | 5.3 |
| Hulice | 0.5 | 400 | 0.02 |
| Kacerov | 80 | 900 | 6.2 |
| Kozli | 1.1 | 16,000 | 1.5 |
| Miletin | 1300 | 1400 | 157.3 |
| Radikovice | 1.3 | 800 | 0.9 |
© 2020 by the authors. Licensee MDPI, Basel, Switzerland. This article is an open access article distributed under the terms and conditions of the Creative Commons Attribution (CC BY) license (http://creativecommons.org/licenses/by/4.0/).
Share and Cite
MDPI and ACS Style
Datel, J.V.; Hrabankova, A. Pharmaceuticals Load in the Svihov Water Reservoir (Czech Republic) and Impacts on Quality of Treated Drinking Water. Water 2020, 12, 1387. https://doi.org/10.3390/w12051387
AMA Style
Datel JV, Hrabankova A. Pharmaceuticals Load in the Svihov Water Reservoir (Czech Republic) and Impacts on Quality of Treated Drinking Water. Water. 2020; 12(5):1387. https://doi.org/10.3390/w12051387
Chicago/Turabian StyleDatel, Josef V., and Anna Hrabankova. 2020. "Pharmaceuticals Load in the Svihov Water Reservoir (Czech Republic) and Impacts on Quality of Treated Drinking Water" Water 12, no. 5: 1387. https://doi.org/10.3390/w12051387
Note that from the first issue of 2016, this journal uses article numbers instead of page numbers. See further details here.