Removal of Phosphate Ions from Aqueous Solutions by Adsorption onto Leftover Coal


1
School of Chemical Engineering, Jimma Institute of Technology, Jimma University, P.O. Box 378 Jimma, Ethiopia
2
Faculty of Agricultural and Environmental Science, University of Rostock, Justus Von-Liebig Weg 6, 18059 Rostock, Germany
3
Faculty of Civil and Environmental Engineering, Jimma Institute of Technology, Jimma University, P.O. Box 378 Jimma, Ethiopia
4
Africa Center of Excellence for Water Management, Addis Ababa University, P.O. Box 1176 Addis Ababa, Ethiopia
*
Authors to whom correspondence should be addressed.
Water 2020, 12(5), 1381; https://doi.org/10.3390/w12051381
Submission received: 1 April 2020
/
Revised: 9 May 2020
/
Accepted: 10 May 2020
/
Published: 13 May 2020
(This article belongs to the Section Wastewater Treatment and Reuse)
Abstract
:High loadings of wastewater with phosphors (P) require purification measures, which can be challenging to realize in regions where the technical and financial frame does not allow sophisticated applications. Simple percolation devices employing various kinds of adsorbents might be an alternative. Here, we investigated the application of leftover coal, which was collected from Ethiopian coal mining areas, as an adsorbent for the removal of phosphate from aqueous solutions in a classical slurry batch set-up. The combined effects of operational parameters such as contact time, initial concentration, and solution pH on P retention efficiency was studied employing the Response Surface Methodology (RSM). The maximum phosphate adsorption (79% removal and 198 mg kg−1 leftover coal) was obtained at a contact time of 200 min, an initial phosphate concentration of 5 mg/L, and a solution pH of 2.3. The Freundlich isotherm was fitted to the experimental data. The pseudo second-order equation describes the experimental data well, with a correlation value of R2 = 0.99. The effect of temperature on the adsorption reveals that the process is exothermic. The results demonstrate that leftover coal material could potentially be applied for the removal of phosphate from aqueous media, but additional testing in a flow-through set-up using real wastewater is required to draw definite conclusions.
1. Introduction
Phosphorus, generally occurring as phosphate (PO43−) in aqueous solutions [1], is an essential amendment and nutrient for many industrial and agricultural applications and often present in water and wastewater at various concentrations [2]. For example, phosphate is highly required for the manufacturing of glass products (like glass fiber, military-grade lasers), toothpaste, pesticides and detergent among others [3]. However, the increase of phosphate in water bodies promotes the growth of algae, which results in eutrophication and eventually consumes dissolved oxygen thereby adversely affects water quality [2,4,5].
Municipal and industrial wastewaters are the main point sources for phosphate while run-off from agriculture is the dominant non-point source. Studies indicate that 4 to 15 mg/L phosphate may be contained in municipal wastewater, whereas effluent from chemical industries such as detergent manufacturing and metal coating processes may contain 14 to 25 mg/L phosphate [3,6]. According to Yadav et al. [7] the tolerable phosphate level in waters should not exceed 0.05 mg/L to maintain an ecologically sustainable status. In such a case, to lower the phosphate loading in wastewater and runoff especially if local circumstances do not allow for advanced techniques such as membrane filtration became a challenge to local scientists and engineers.
The most widespread wastewater treatment technology for phosphate removal is based on precipitation processes, in which massive amounts of chemicals such as iron and aluminum salts are utilized [8]. However, many of the techniques are suffering from either large amounts of sludge for disposal, or high operational and maintenance costs with recurring expenses, which are not suitable for many developing countries such as Ethiopia. Therefore, searching cost-effective and environmentally sound phosphate removal alternatives for low-income countries is essential.
A variety of physical, chemical, and biological methods have been developed in recent years for the removal of phosphate from wastewater. Advanced biological methods can remove up to 97% of phosphate and generate low amounts of sludge but the method has limited practical applicability [8]. Similarly, physical processes (sedimentation, membrane filtration, etc.) techniques are too expensive and accompanied by a high sludge production and often inefficient in the removal of phosphate from wastewater effluent [9,10].
Studies on P-laden wastewater treatments have revealed adsorption to be a highly effective and easy method among the physicochemical treatment processes if materials are carefully chosen [11,12]. Some of these adsorbents are calcite [2], nanoscale zerovalent iron (NZVI) [3], rice husk and fruit juice [7], acid-activated red mud [13], granulated coal ash [14], aleppo pine [15], zirconium(IV) loaded fibrous [16], still slag produced [17], bone charcoal [18], Lanthanum hydroxide materials [19], aluminum sludge [20], modified multi-walled carbon nanotube with chitosan [21], manganese-laden bio-char [22], marble waste [23], chitosan composited beads derived from crude oil refinery waste [24], iron-coated diatomite [25], halloysite nanotubes [26], and industrial solid waste bio-char [27]. Adsorption emerges as a robust process that could solve the aforementioned problems and render the treatment system more economically viable, especially if low-cost adsorbents are involved. Recently, considerable attention has been directed towards naturally occurring and abundantly available carbon-related adsorbents due to the high cost of widely used activated carbon.
Coals, as well as leftover coal, are carbon-rich materials, which could prove suitable for the removal of phosphate from aqueous solutions. Leftover coal is basically a material that was left as waste after mining underground deposited coal. In many parts of the world (including Ethiopia) this leftover coal is abundantly available. Open-pit coal mining is widespread in Ethiopia where there are more than 430 million tons of coal deposits found in the country of which Yayu coal mining being the largest site [28]. About 200 million tons of coal deposits to be mined in the area, from which more than 0.1% is leftover coal.
The potential of coal to remove phosphate has been reported [14,29,30]. Moreover, a variety of carbon-related materials such as coal gangue loaded with zirconium oxide [1], coal bottom ash [31], magnetic coal [32], coal slag [33], and coal fly ash [34] are used as adsorbents for phosphate removal from aqueous solutions. However, very limited information is available so far on the phosphate adsorption on raw leftover coal. Therefore, the objectives of the present study were to (i) investigate the possible use of raw leftover coal as an adsorbent for the removal of phosphate from aqueous solution by considering various contact times, pH values, initial phosphate concentrations, particle size, adsorbent dose and temperature; (ii) evaluate and optimize the interactive effects of operating parameters using the Central Composite Design (CCD), a common approach of the response surface methodology (RSM); (iii) elucidate adsorption mechanisms using energy dispersive x-ray spectrometer with the scanning electron microscope (EDX-SEM), as well as kinetics and isotherm models.
2. Materials and Methods
2.1. Adsorbent Preparation and Characterization
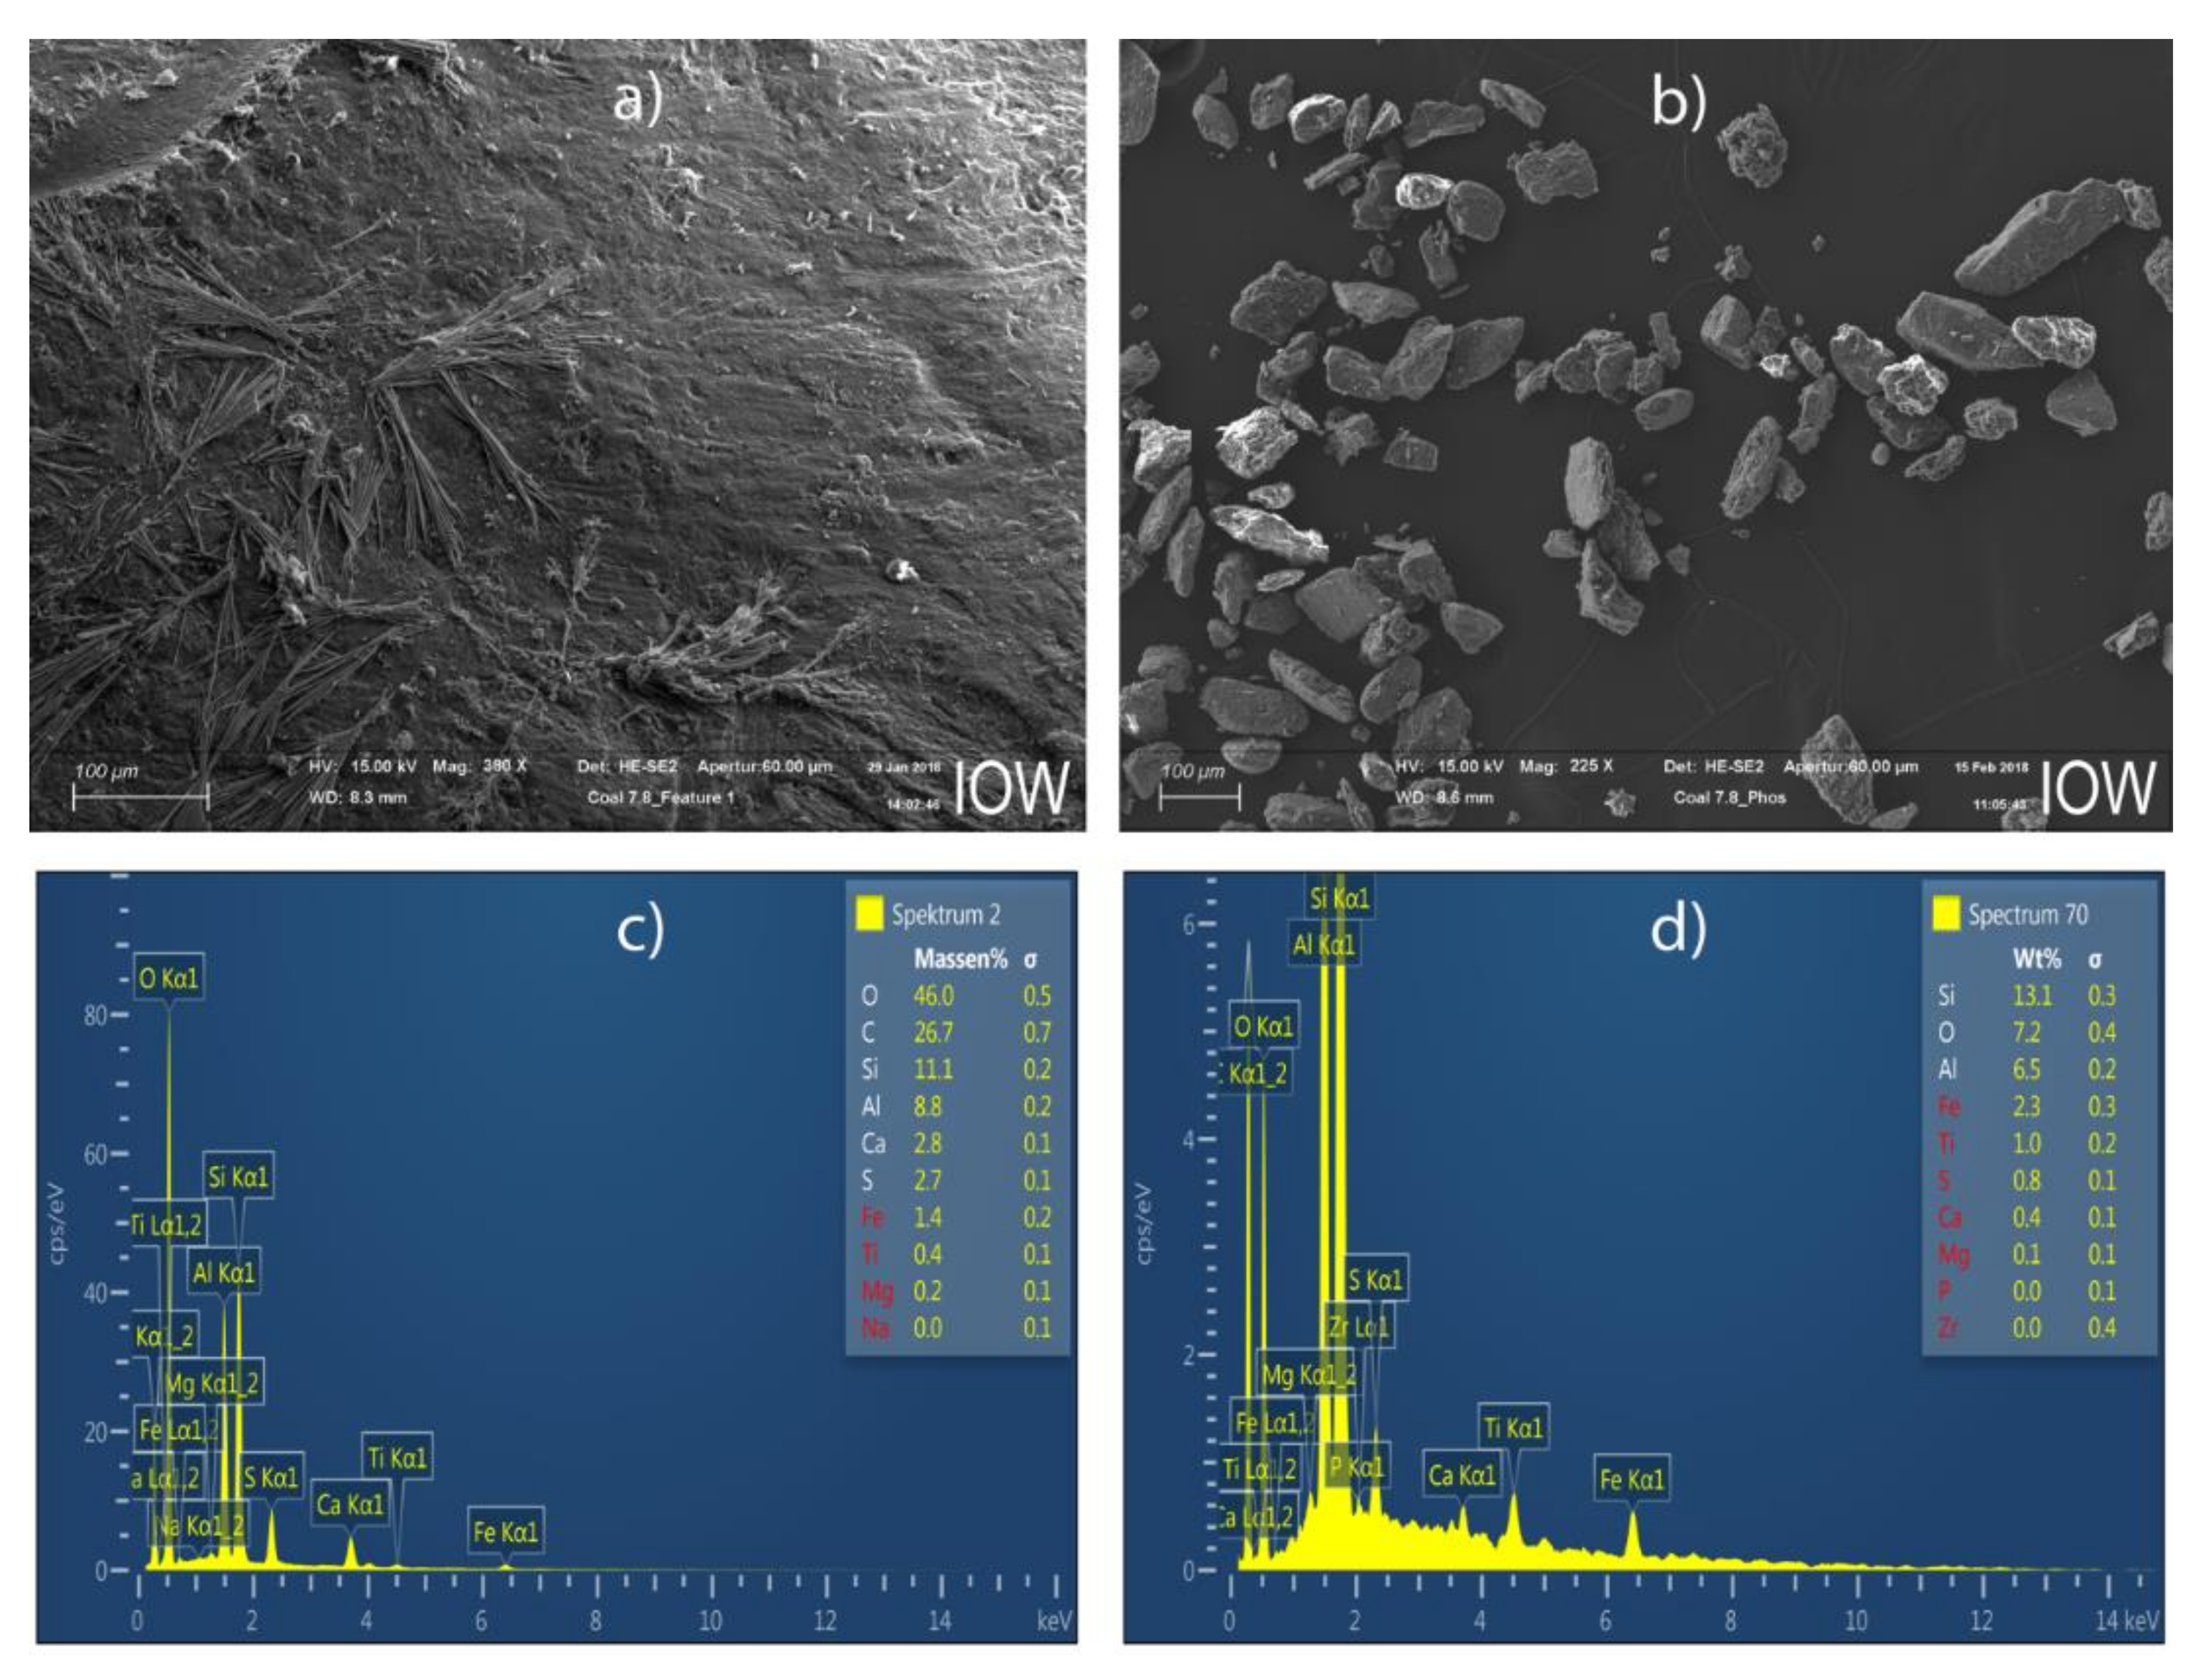
The sample (leftover coal) was obtained from Yayu coal mining, Ethiopia (Figure S1 in Supplementary Data). The chemical composition of the leftover coal shows that the material has a high potential for phosphate adsorption due to significant amounts of oxides (54.56% SiO2, 34.17% Al2O3, 6.85% Fe2O3, 1.42% CaO, 0.9% SO3, 0.71% MgO) [30].
Images and elemental spectra of the leftover coal, before and after adsorption, were obtained from EDX-SEM (energy dispersive X-ray spectrometer with a scanning electron microscope). Physico–chemical properties such as organic matter, moisture content, electrical conductivity and pH zero point of charges (pHzpc) were also measured according to Penn and Bowen [35]. Organic matter, moisture content, electrical conductivity and pHzpc of the coal material were determined to be 28.5%, 0.93%, 0.69 mS cm−1 and 4.6, respectively.
Prior to adsorption experiments, the collected raw material was washed thoroughly and repeatedly with de-ionized water to remove dust and small particles adhered to it [20]. Then, the wet material was transferred to an oven for drying at a temperature of 105 °C for 1440 min to obtain constant mass [36]. Subsequently, the sample was grounded to small granules and passed through an appropriate mesh size (75–425 µm). Finally, the well-sieved sample was stored in a desiccator to prevent moisture uptake until the onset of the experiments.
2.2. Reagents Used and Adsorbate Prepartaion
Hydrochloric acid (0.1 M HCl), sulfuric acid (50% H2SO4), sodium hydroxide (0.1 M NaOH), ammonium molybdate ((NH4)6Mo7O24·4H2O), potassium antimony tartrate ((SbO)K(C4H4)6)·1/2H2O) and ascorbic acid (C6H8O6) were used for the photometric quantification of phosphate. All chemicals and reagents used in this experiment were of analytical grade from Merck Germany unless stated otherwise.
A stock solution of potassium dihydrogen phosphate, KH2PO4 with a concentration of 1000 mg/L PO43− and 99.9% purity, was diluted to a working solution with concentrations of 0.5 mg/L PO43− to 25 mg/L PO43− in 1000 mL of de-ionized water then labeled as ‘phosphate solution or working solution’ and stored in a tightly closed plastic bottle in a cool place (4 °C) until the experiments were commenced.
2.3. Experimental Set-Up
All the experiments were conducted in batch mode by adding 25 mL of phosphate solution to 1 g of leftover coal (initial solution concentration ranging from 0.5 mg/L to 25 mg/L, the temperature at 20 °C and pH = 3.5) in 100 mL Erlenmeyer flasks. The flasks were shaken using a horizontal shaker (Edmund Buhler 7400 Tubingen, SM 25, Germany) operating at 200 rpm for 1440 min. After the shaking of the slurries, the suspensions were centrifuged using a centrifuge apparatus (HERAEUS MULTIFUGE 3RS+ Centrifuge, Kendro GmbH, Hanau, Germany) operating at 3000 rpm for 10 min and immediately filtered by means of a vacuum filtration pump employing 0.45 µm filter (Whatman, Carl Roth GmbH, Karsruhe, Germany) to obtain a clear supernatant aliquot. The supernatant solution obtained from filtration was then treated with ammonium molybdate and ascorbic acid solution prior to the phosphate analysis (molybdenum-blue ascorbic acid method) [37]. Finally, the phosphate concentration of the solution was analyzed using a spectrophotometer (UV-SPECTROD 40, Analytik Jena AG, Jena, Germany). The adsorbed and % removal of phosphate was computed using Equations (1) and (2) as indicated below:
where qt is the amount of phosphate adsorbed per unit mass of adsorbent (mg/g) at time t; Co, Ct are the initial and final concentration of phosphate at time t (mg/L) respectively, V is the volume of the solution contacted with the adsorbent (L), M is mass of the adsorbent (g) and (%) is percent removal at time t. For data accuracy and error minimization, all experiments were conducted in duplicate and the average values were used for data interpretation and analysis.
2.4. Effects of Particle Size
The effect of particle size on the adsorption of P was studied as follows: 200 mL of a 10 mg/L phosphate solution was mixed with g of adsorbent (adsorbent to solution ratio = 1:25) size in a series of 250 Erlenmeyer flasks. Well-caped flasks were then placed in a horizontal shaker operating at 200 rpm for 240 min. The samples were withdrawn at different time intervals and phosphate concentrations were measured as usual.
2.5. Effects of Temperature
The effect of temperature on the adsorption of P was measure in a separate experiment. We added 1 g of adsorbent to the series of 100 mL flasks containing 25 mL phosphate solution with a concentration of 10 mg/L and stirred with a magnetic stirring plate at predetermined temperatures (20, 40 and 60 °C) for 2 h. Then, the suspension solution filtered and phosphate detection analysis has been commenced as used for adsorption study.
2.6. Adsorption Kinetics
In order to investigate the adsorption kinetics, pseudo-first order and pseudo-second-order linear kinetic models were applied for the estimation of rate constants [38]. Pseudo-first-order expression was employed as in Equation (3):
where K1 is the first-order rate constant of adsorption (min−1); qe (mg/g) and, qt (mg/g) are the amount of phosphate adsorbed at equilibrium and at time t respectively. The values of K1 and qe can be obtained from the slope and the intercept of a linear straight-line plot of log (qe − qt) versus t.
The pseudo second-order equation can be written as shown in Equation (4): [26]
And integrating provided the linear pseudo-second order expression as:
where qe (mg/g) and qt (mg/g) are the amount of phosphate adsorbed at equilibrium and time t respectively; x = K2qe2 and K2 is the rate constant of the pseudo second-order model (g/mg-min). The value of x and qe can be obtained from the linear t/qt vs. t plot.
2.7. Adsorption Isotherm
Various models can be employed to characterize the adsorption behavior of a given compound analyzing experimental data. Adsorption isotherms relate the adsorbed amount of phosphate to the equilibrium solution concentration at a constant temperature. These relations are also named ‘quantity-intensity-relations’. Freundlich and Langmuir isotherms are the most frequently used models to analyze experimental observations [6]. These two non- linear isotherm models (Equations (5) and (6)) were applied to obtain the adsorption isotherm constants.
Langmuir equation:
Freundlich equation:
where qe (mg/g) is the specific amount of adsorbate (phosphate), and Ce (mg/L) is the adsorbate concentration in the liquid phase at equilibrium. The constants KL (L/mg) and qmax (mg/g) of the Langmuir isotherm are indicative of adsorption energy and adsorption density respectively. KF and n (dimensionless) are Freundlich constants and indicate the total adsorption capacity and intensity of adsorption respectively.
The Langmuir equation is also used to obtain RL, the separation factor, from the following expression: in which Co (mg/L) is the initial concentration of phosphate in the solution. If 0 < RL < 1 then a favorable adsorption situation can be assumed, while RL > 1 indicates an unfavorable adsorption, and RL = 1 and RL = 0 indicate a linear and irreversible adsorption isotherm respectively [11]. The model equations were fitted to the experimental data using the Microsoft Excel solver function.
2.8. Statistical Analysis—Central Composite Design (CCD)
The effect of experimental conditions on the adsorption process can be evaluated by either analyzing one factor at a time (varying only one parameter and holding the other parameters constant) or by a multiple factor optimization (parallel processing of two and more parameters). The first method is tedious and often inappropriate whereas the latter one is simple, efficient and precise for testing the effect of various parameters simultaneously [39]. Here we used a multivariate mathematical model approach the so-called Response Surface Method (RSM). The Central Composite Design (CCD) is one of the major of RSM and it was used to evaluate the relation and the combined effect of the selected independent parameters such as contact time (A), initial concentration (B) and solution pH (C) on the response parameters such as % removal (Y1) and adsorption capacity—q (Y2). The experimental results were analyzed using the CCD method, which is a widely used statistical approach in a multi-parameter operation for optimization experiments [39,40]. For three factors, as in this case, the number of required experiments is assessed as follows: N = 2k + 2k + z = 23 + 2 × 3 + 6 = 20; where N is the number of necessary experiments, k the number of factors and z is the number of replicate values at the central point. Accordingly, 20 experiments with six replicates were conducted (Table S6 in Supplementary Data) for the specific method. After conducting the experiments, the coefficients of the polynomial of the mathematical model were calculated using the following quadratic equation Equation (7) [41].
where Y is predicted responses (% removal of phosphate or/and removal capacity, q), XiXj are the coded values of independent variables (contact time-A, initial concentration-B and solution pH-C), is constant coefficient, and are the linear, quadratic and interaction coefficients respectively. The statistical significance of the obtained model was tested and analyzed by an analysis of variance (ANOVA) which was performed by the Design Expert software (Version 11.0, StatEase, Minneapolis, MN, USA).
3. Results and Discussion
3.1. Raw Material Characterization
The energy dispersive X-ray (EDX) and the scanning electron microscope (SEM) images and elemental spectra of the adsorbent were described both before and after adsorption respectively (Figure 1). The SEM images of the adsorbent revealed that the leftover coal has a spherical shape and heterogeneous cross-sectional surfaces (Figure 1a,b). The EDX analysis showed the elemental composition and spectral peaks of the adsorbent. Figure 1c,d revealed that the peak with contents of carbon(C), silica (Si), aluminum (Al), sulfur (S), calcium (Ca) and iron (Fe) all at K-alpha signals. As expected, the leftover coal contains high amounts of SiO2, Al2O3 and organic materials. The p was observed after adsorption at the peak position of 1.98 keV as K-alpha signal (Figure 1d), from which we conclude that leftover coal material is suitable for phosphate removal.
3.2. Effect of Contact Time and Adsorption Kinetics
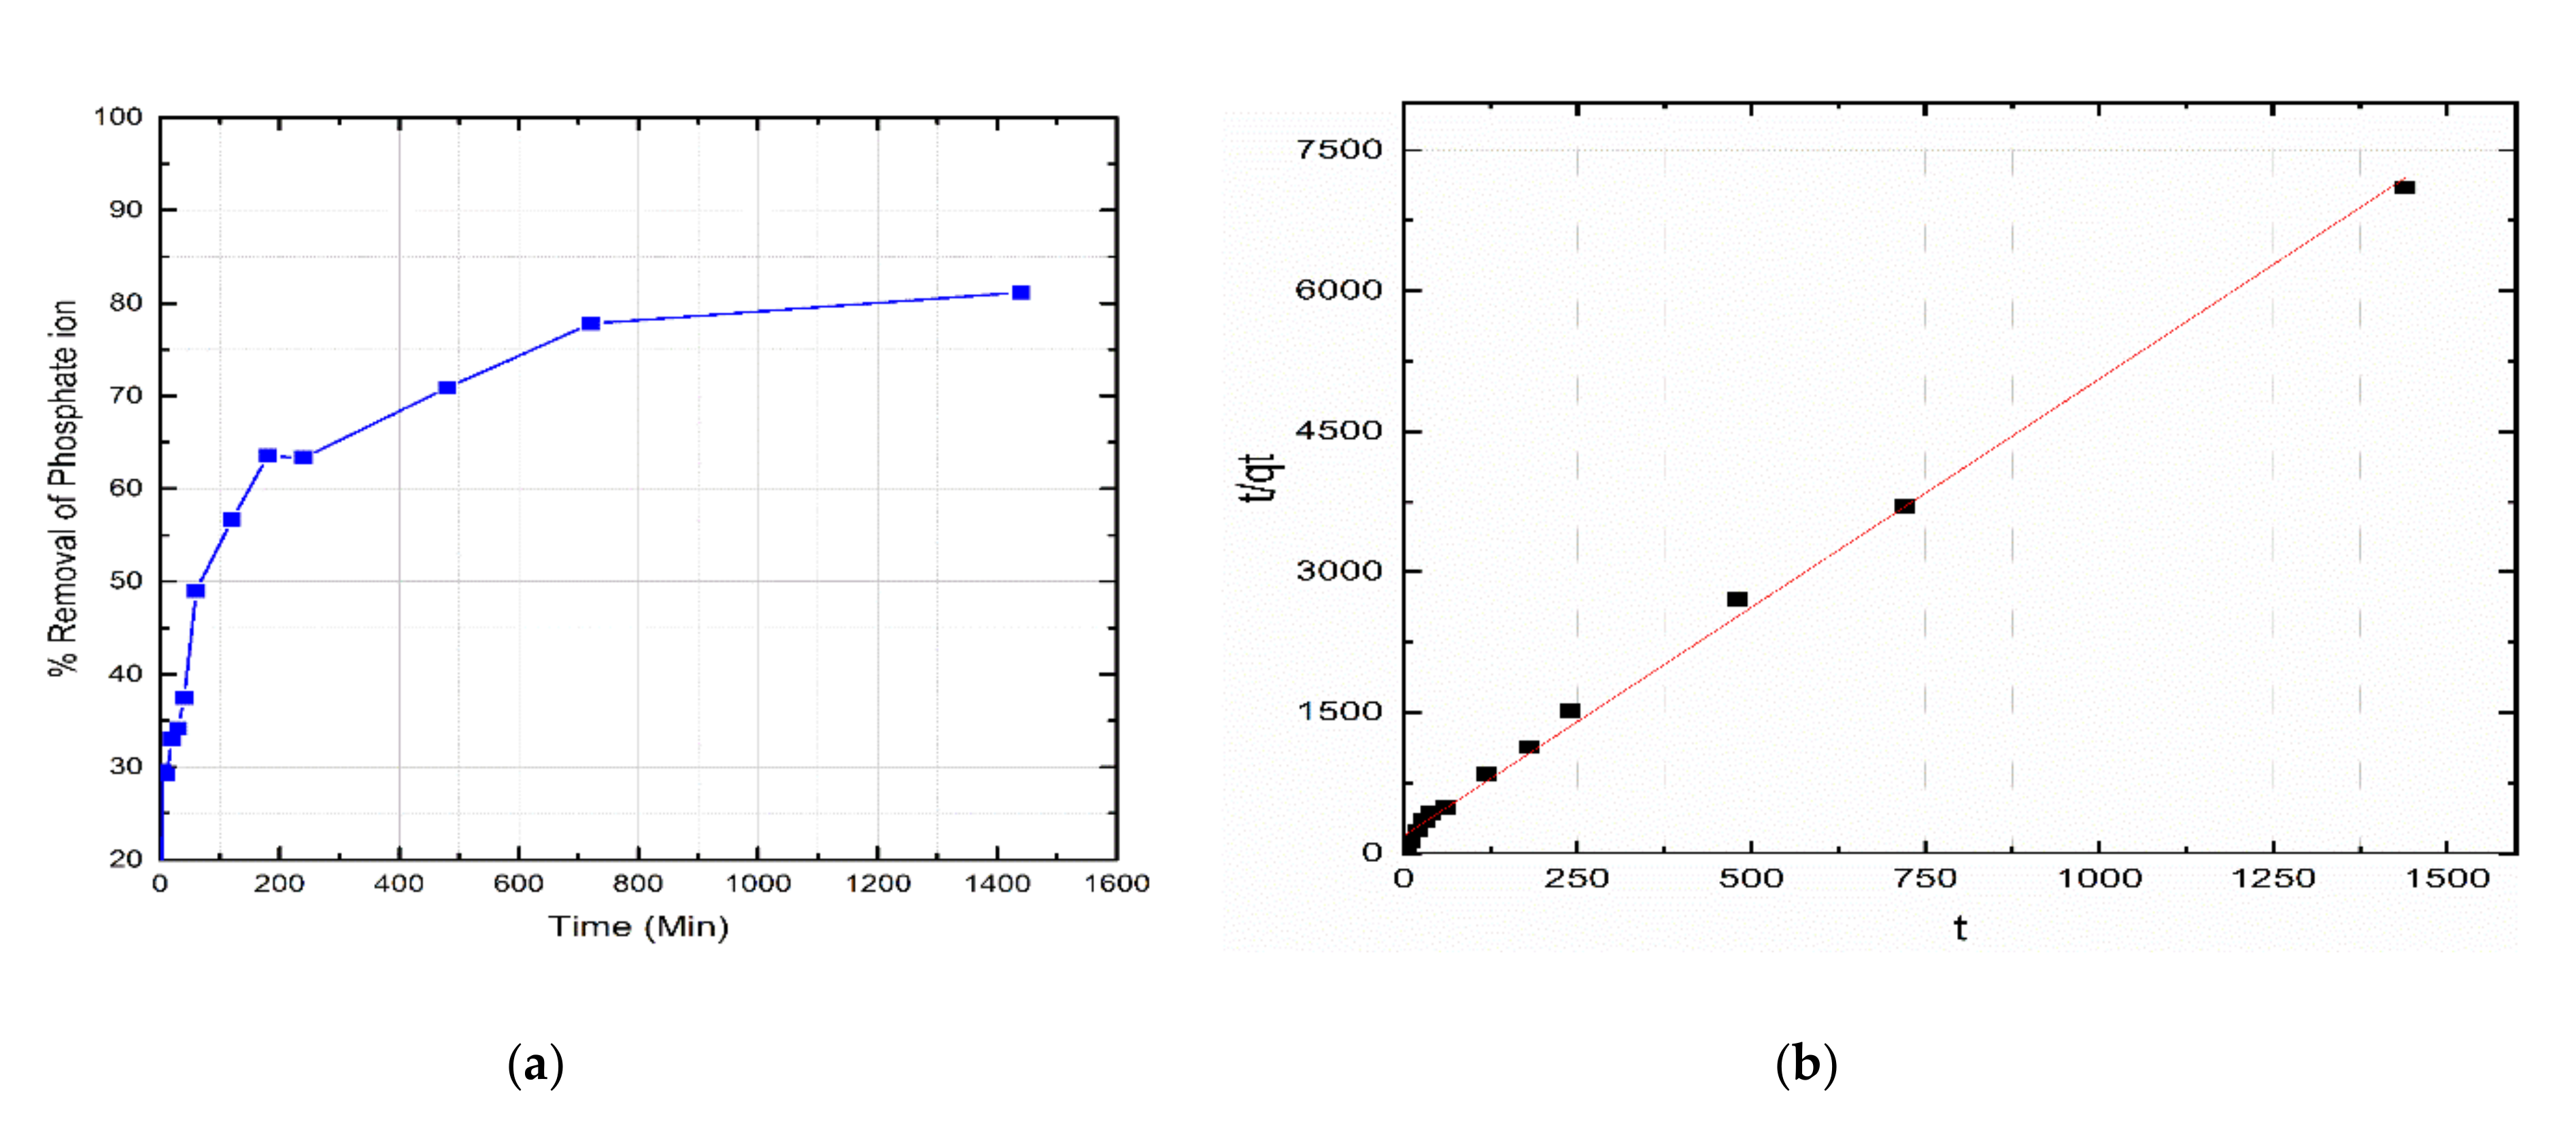
The effect of contact time on phosphate removal by leftover coal is presented in Figure 2a. The phosphate capture on the surface of adsorbent was very rapid in the first 200 min, and equilibrium was attained after 720 min contact time. Increasing the contact time increased the uptake of phosphate, indicating the high affinity of phosphate to bare surfaces and a fast filling of active sites due to boundary layer diffusion [11,20]. It can be observed from Figure 2a that the adsorption process had a rapid and a slow component. The rapid adsorption (up to 200 min) was based on the availability of active sites and a high phosphate concentration in the solution at the early stages of the experiment. The following slow adsorption is due to intra-particle diffusion and an according phosphate mass transfer onto leftover coal particle. A similar finding has been reported in the literature [42].
Commonly used two kinetic models, pseudo-first and pseudo-second-order models, were employed to fit the experimental data. Optimized model parameter values are presented in Table 1. The equilibrium capacity as obtained from the fitting procedure employing the pseudo second-order model (qe) very well represented the measured value. The pseudo second-order model best represents the experimental data (R2 = 0.99; Figure 2b), which can be taken as an indicator that chemisorption was the dominant process [43,44].
3.3. Effect of Initial pH
A pH zero point of charge (pHzpc) for leftover coal material was measured to be 4.6. It is known that adsorption of anions (i.e., phosphate-PO43−) on the leftover coal at a pH lower than the pHzpc is elevated because of the high density of positive charges on the surface. On the other hand, adsorption at a pH higher than the pHzpc can be expected to be lower because of the repulsion of similar ions. It was reported in literature that pH is a critical factor that affects the adsorption of phosphate [7,45]. The effect of pH on phosphate adsorption onto leftover coal for this study is presented in Figure S2 in Supplementary Data. The percentage of phosphate removed from the aqueous solution decreased (from 86% to 68%) as the pH of the solution increased from 2 to 12 indicating that the adsorption of phosphate is likely to be based on physical interactions between the surfaces of the adsorbents and adsorbate [15]. At the lower pH range adsorption increases at sites with a variable charge (e.g., –COOH, –NH3) because of increasing protonation. At high pH values, the competition with OH ions increases, and phosphate adsorption decreases [20,46]. The results obtained here (Figure S2), however, revealed that the leftover coal material could adsorb phosphate over a wide pH range of 2–10. The maximum percent removal of phosphate (86%) was obtained at a lower pH = 2 and up to 80% removal can be maintained even up to a pH of 10. Adsorption at high pH values may be caused by bridging of cations, which are present at the surface of the adsorbent [1]. For pH greater than 10, the adsorption capacity decreases sharply because of the more negative charges on the surface of the adsorbent. Similar reports confirm that phosphate removal is less efficient under alkaline conditions [47,48].
3.4. Effect of Adsorbent Dose
The adsorbent dose is the ratio of the mass of adsorbent to solution volume and is one of the important factors in the removal process. The effect of adsorbent dose on the phosphate removal onto leftover coal was investigated in the range of 0.5–5 g and the result was presented in Figure S3. The percent of phosphate removal increased (from 58% to 96%) with the increase of the dose of leftover coal (from 0.5 g to 5 g). On the other side, the mass uptake per unit adsorbent (q, mg/g) was decreasing (from 2.9 mg/g to 0.5 mg/g) with increasing the dose of leftover coal from 0.5 g to 5 g, which can be related to the higher abundance of sorption sites. Similar observations have been reported by other investigators [49,50,51].
3.5. Effect of Particle Size
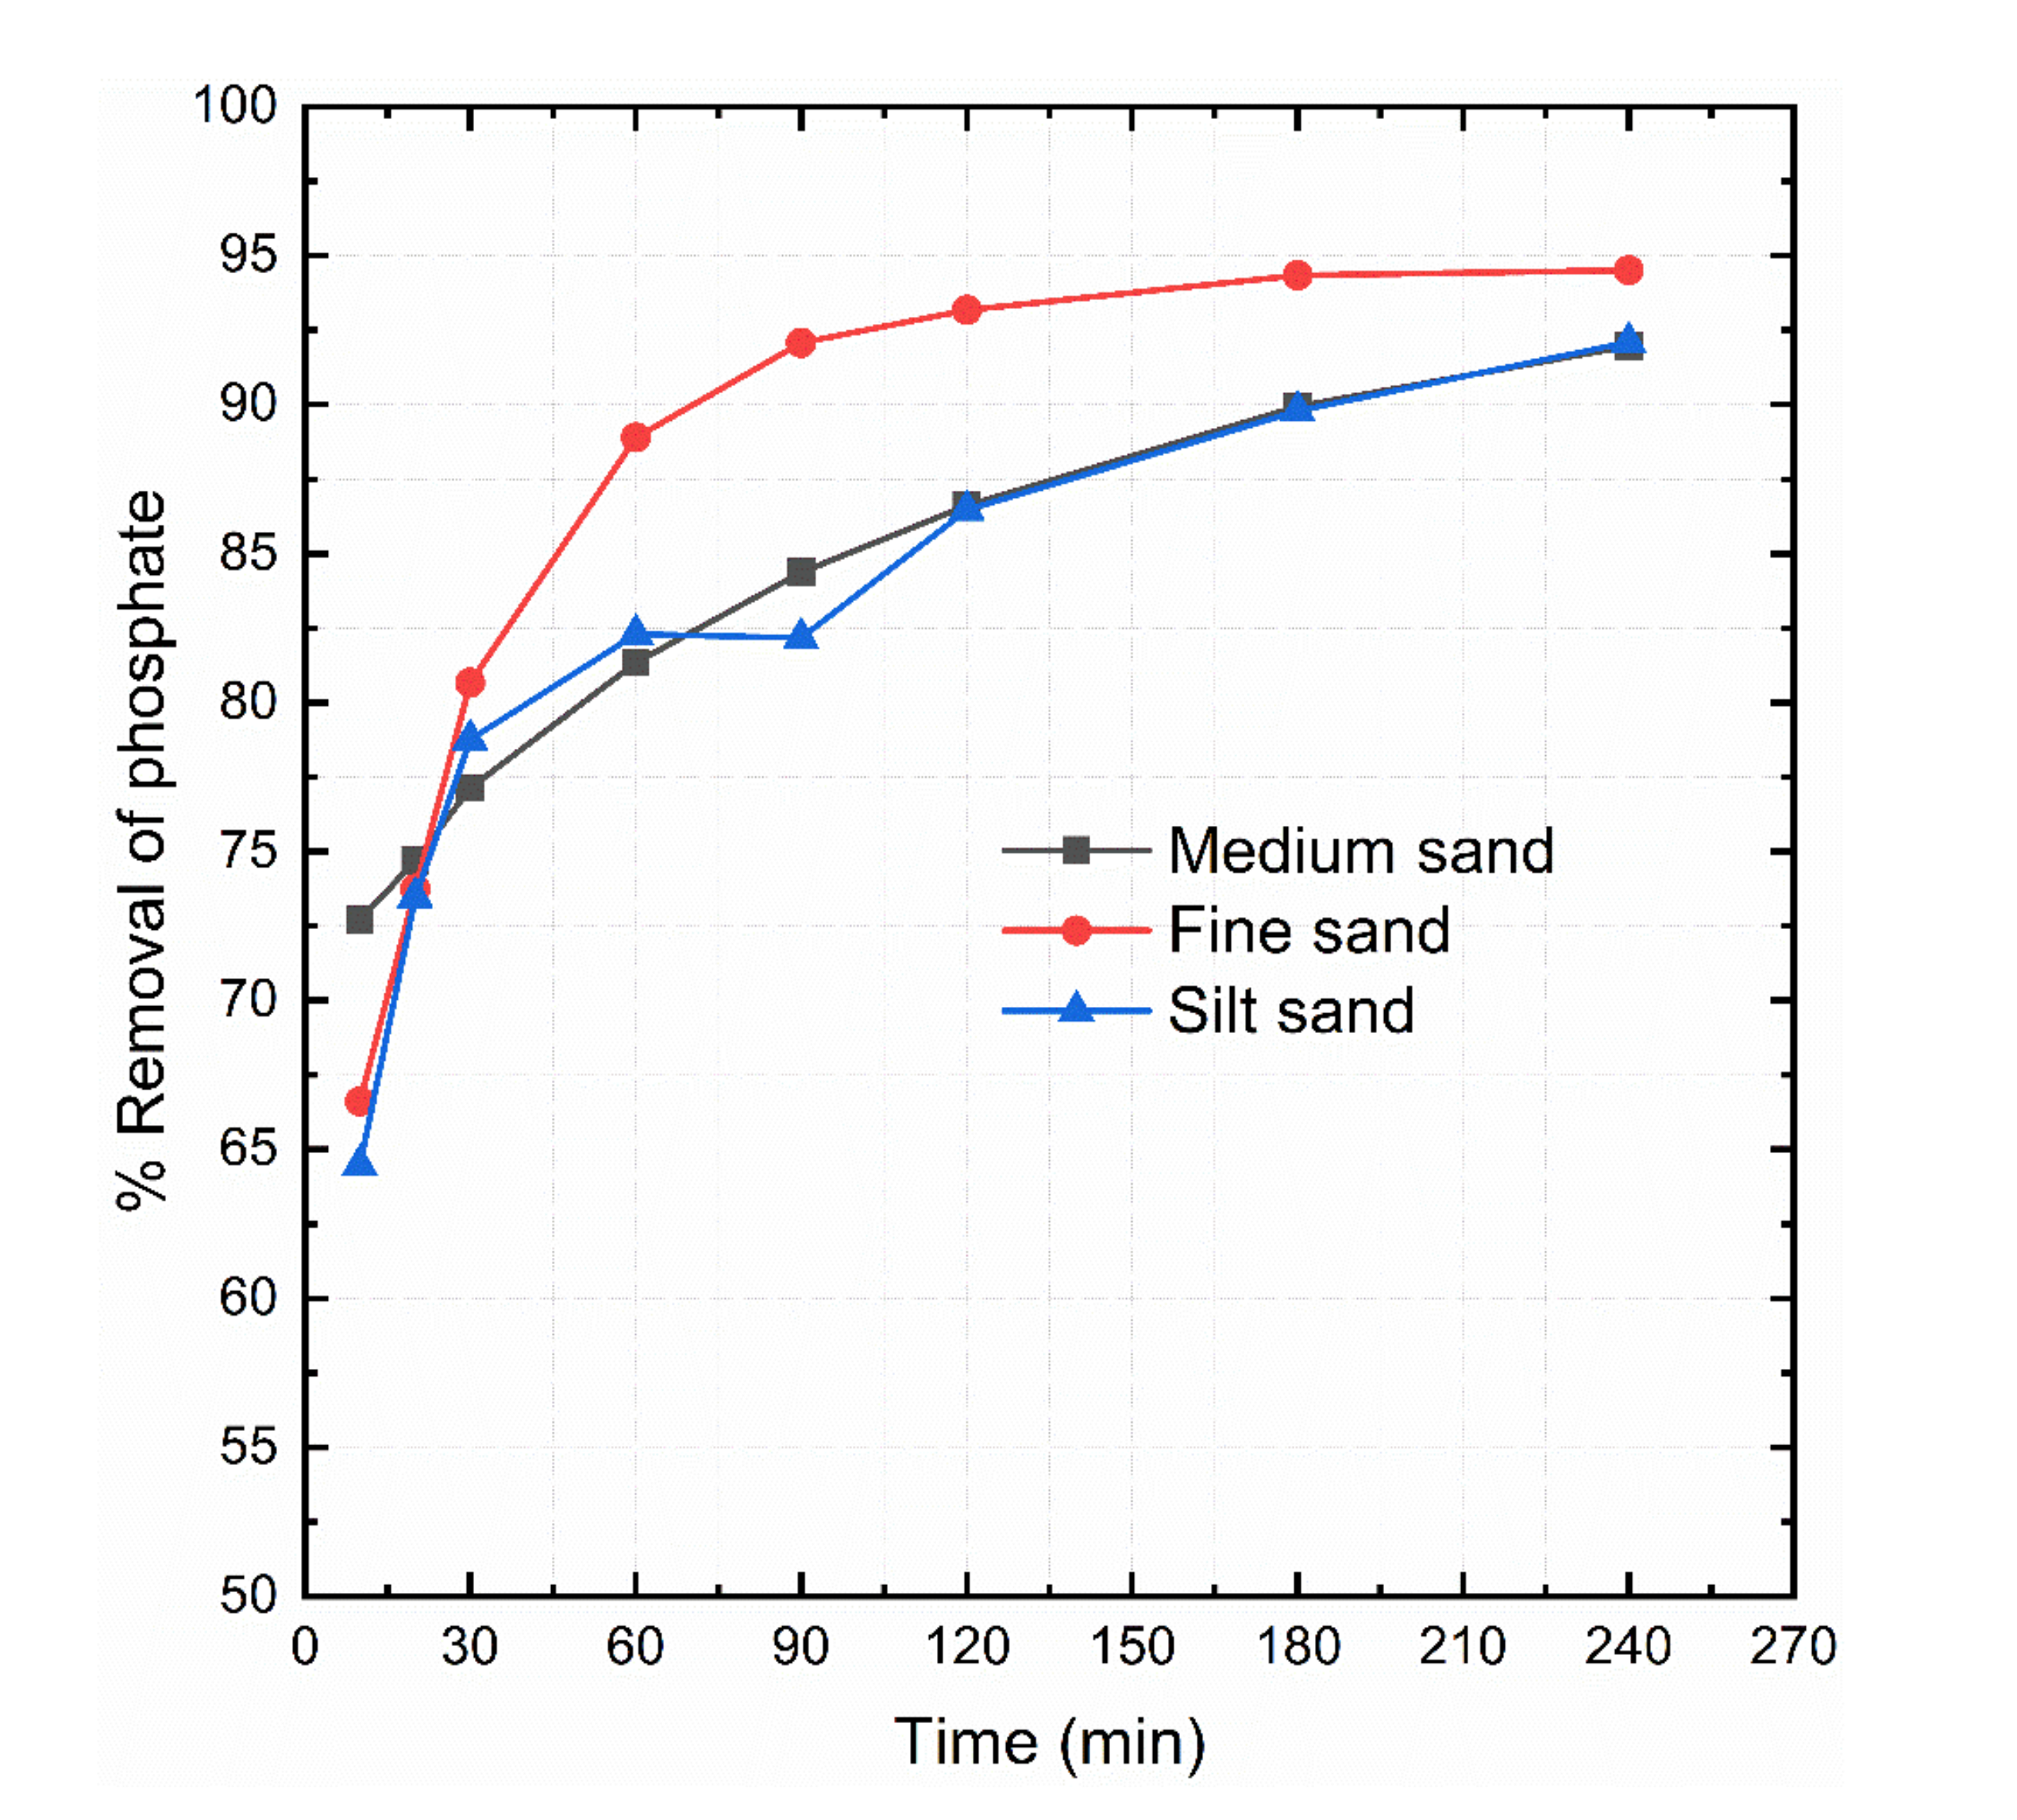
The effect of particle size on the adsorption of phosphate was investigated with three different particle sizes. The particle sizes of the material were categorized as silt sand (less than 0.075 mm), fine sand (0.075 mm to 0.425 mm) and medium sand (0.425–2 mm). As can be seen from Figure 3, the percent of phosphate removed by the fine sand fraction was higher (94.5%) than that of the silt and medium sand of the adsorbent (91.8% and 92.1%) after 240 min reaction time. At an earlier stage of the experiment (after 90 min) differences were slightly more pronounced. The results showed that the particle size as investigated here has only minor effects on the adsorption capacity, which is only partially in agreement with earlier studies [11]. Based on the results from the particle size tests, all subsequent experiments were conducted with adsorbent material of the fine sand fraction (0.075 mm to 0.425 mm.
3.6. Effect of Initial Concentration
The percent removal of phosphate gradually decreased (from 93.4% to 55%) with increasing the initial concentration of phosphate (from 0.5 mg/L to 25 mg/L). It is likely that active adsorption sites become saturated at higher initial concentrations [7]. It has to be emphasized that the percent removal as presented here is based on concentrations (Equation (2)). If total amounts are considered, it can be observed that with increasing initial concentration the adsorbed amount (q, mg/g) is likewise increasing (0.011 mg/g to 0.344 mg/g; Figure S4). At higher concentrations, driving forces (diffusive gradient) are also higher and barriers of mass transfer between aqueous solution and solid interfaces are overcome [52]. Although, the increased amount of phosphate removed on the surface of the adsorbent with increasing initial concentration is an indicator for the removal of highly contaminated water, the effects of other pollutants have to be considered otherwise the performance of the adsorbent material will be limited in real wastewater treatment and the surface of the leftover coal has to be modified for the better removal. Furthermore, credible pieces of evidence from scientific literature substantiate both beneficial and detrimental effects of coexisting anions in aqueous solution [41,53,54].
3.7. Adsorption Isotherm and Thermodynamics
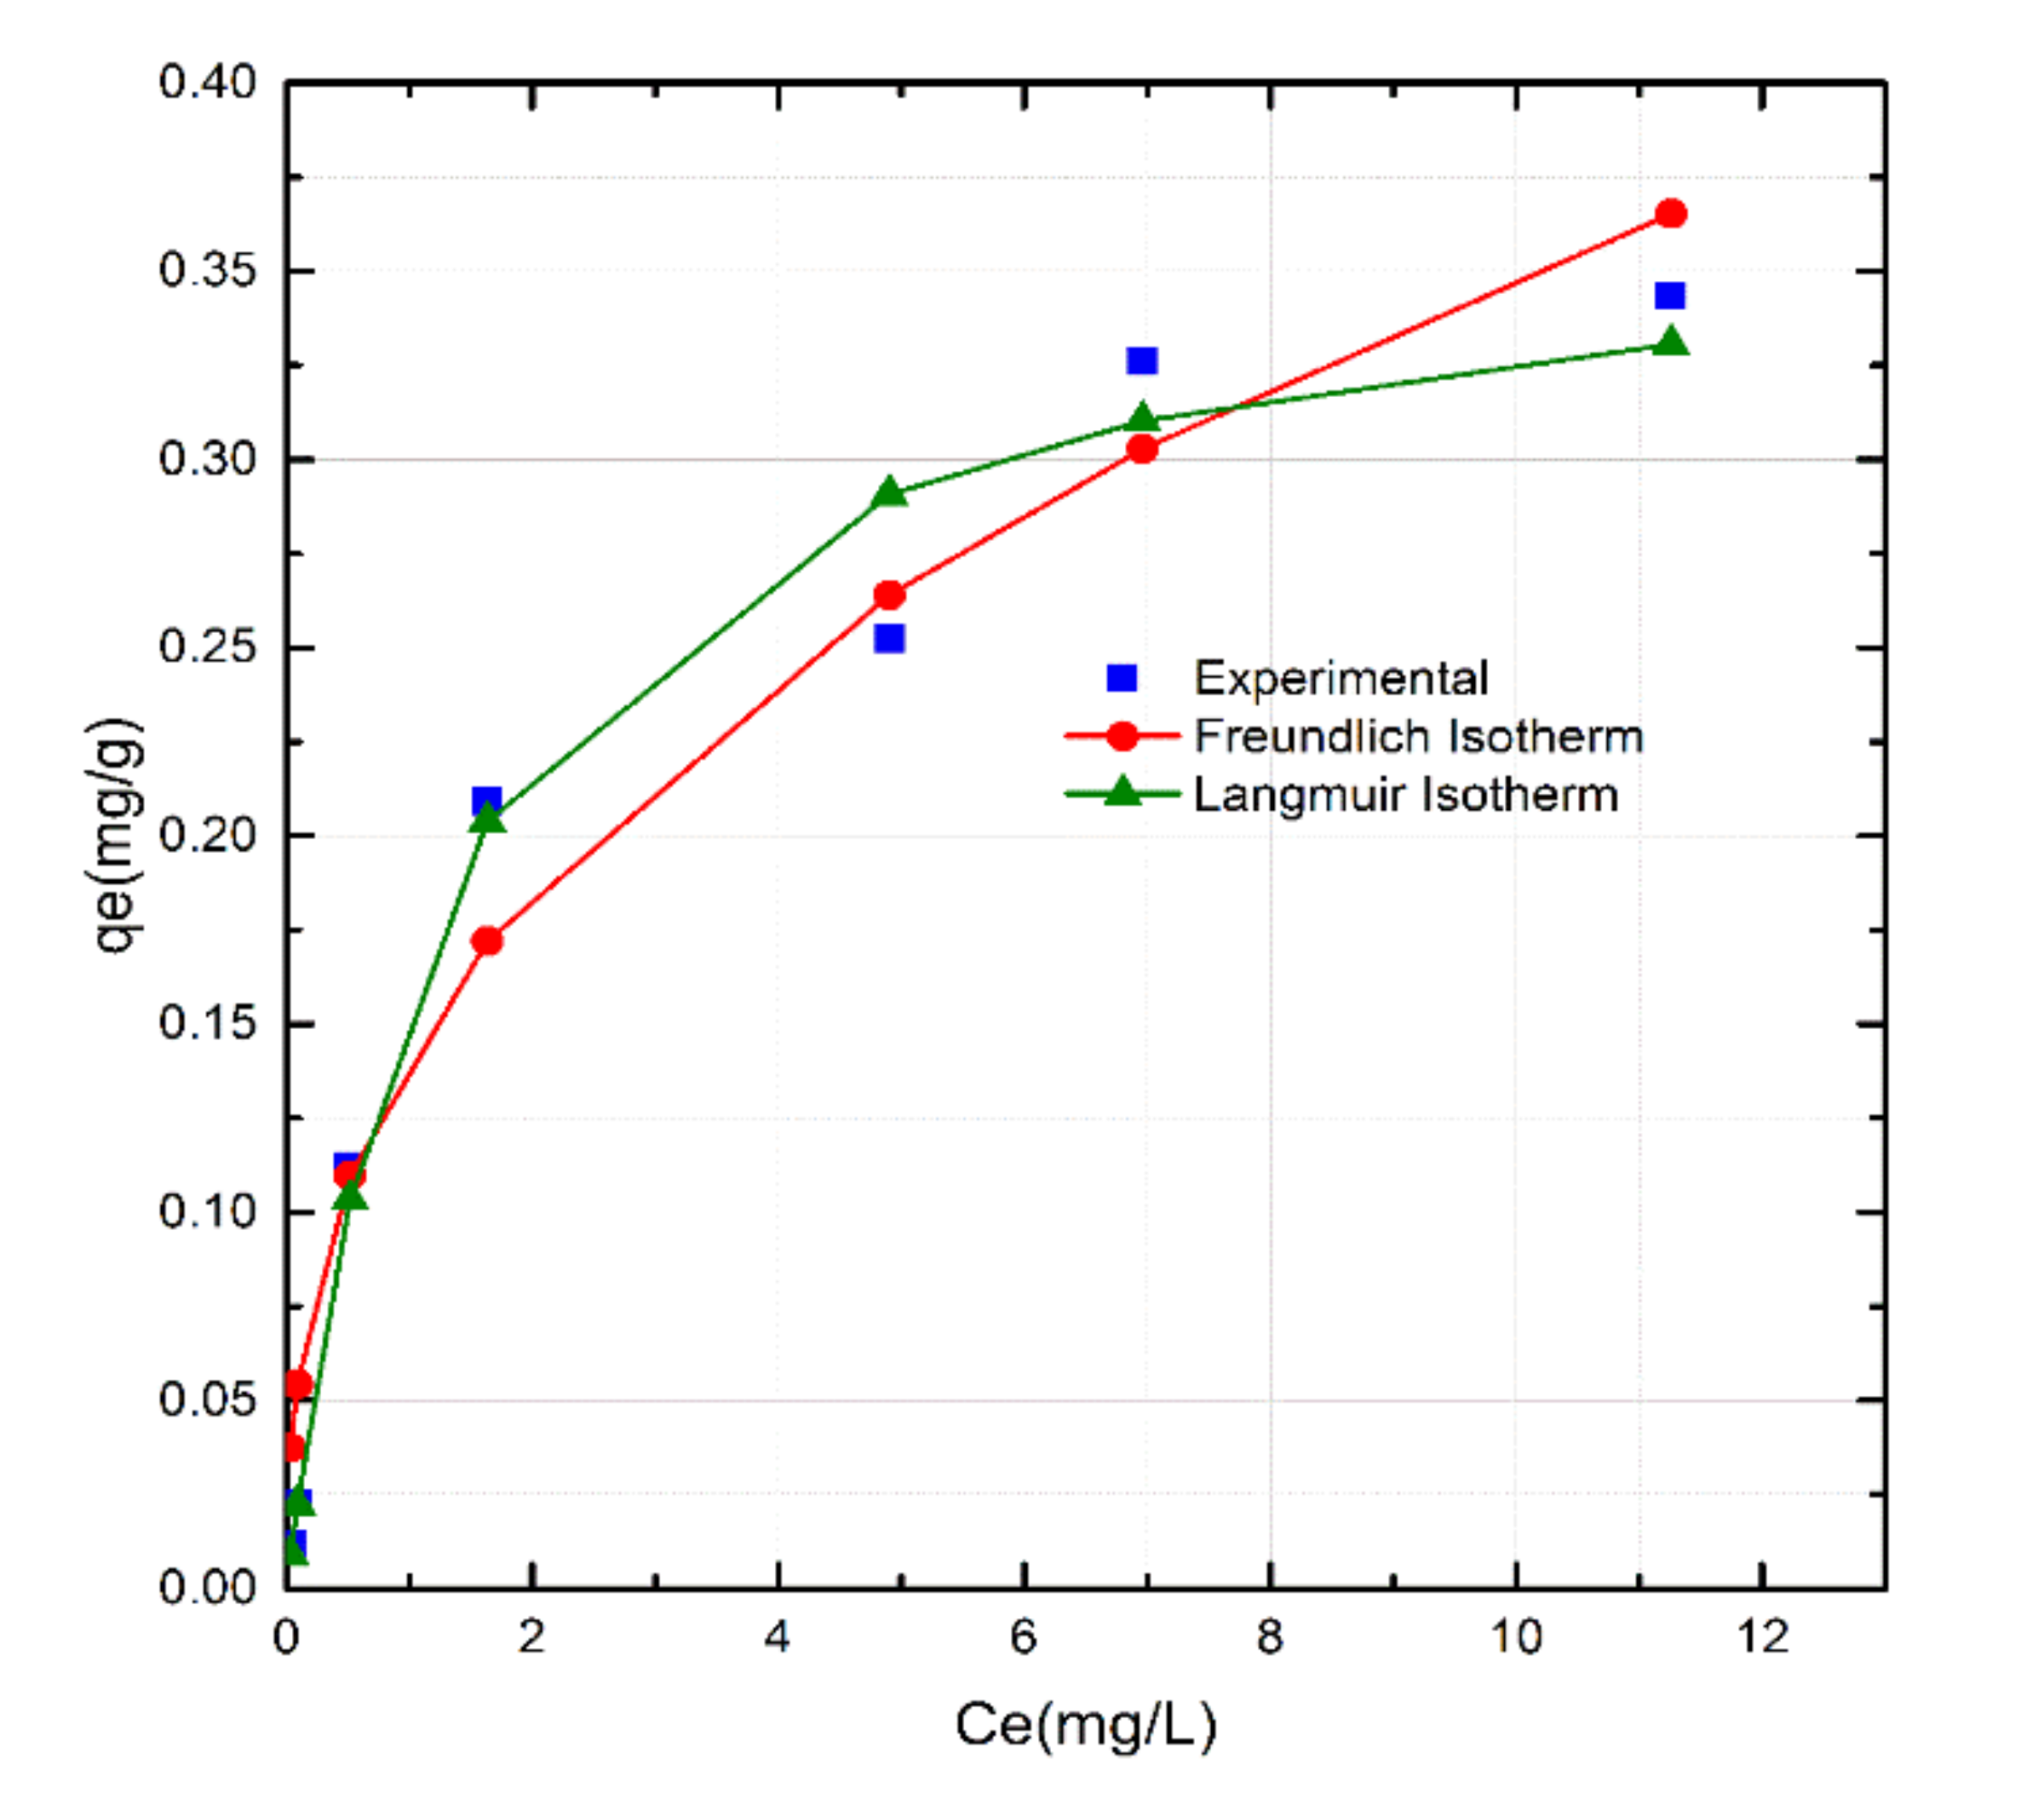
Adsorption of phosphate onto leftover coal was described by both Freundlich and Langmuir isotherm models. Figure 4 and Table 2 summarizes the results. The Freundlich model assumes that adsorption occurs on a heterogeneous surface through multilayer adsorption, and the adsorbed amount increases with increasing equilibrium concentrations. In opposite, the Langmuir model assumes an asymptotic approach to monolayer surface coverage. From the obtained optimization procedure it became evident that the Freundlich isotherm equation (R2 = 0.99) described the system better than the Langmuir isotherm equation (R2 = 0.76). The n-value of the Freundlich isotherm lies between 1 and 10, which is a good indicator for favorable adsorption [55]. Furthermore, the value of 1/n, which was obtained from the slope of the linear plot of lnqe vs. lnCe of the Freundlich isotherm, was below unity implying that chemisorption is the governing process [56]. The separation factor, RL as obtained from the Langmuir isotherm model was lower than unity, which likewise indicating to a favorable adsorption process [31].
The temperature has a considerable effect on the efficiency of the adsorption process. Here, we tested the influence of the temperature by conducting batch experiments at 20 °C, 30 °C and 40 °C. It was found that, the percent removal of phosphate decreases with the increase of temperature from 20 °C to 40 °C, confirming the exothermic nature of the process (data not shown). An increase in temperature raises the thermal energy of the system which increases the mobility of phosphate ions fostering enhanced desorption. As a result, the overall adsorption is decreasing. Similar findings have been reported in previous research works [7,50,57].
3.8. Central Composite Design (CCD)
A three-factor and a three-level CCD method were employed in the present study to optimize and analyze the combined effects of parameters on responses such as % removal and removal capacity, q. The design summaries for both dependent and independent parameters with their corresponding constants were generated. Each of the independent variables were coded and set in the range of midpoint according to Asaithambi et al. [39]. The mean point for contact time, initial concentration, and solution pH was set by the software as 180 min, 15 mg/L, and 6 respectively; the coded low, coded high, minimum and maximum values for each parameter are summarized in Table S1 in the Supplementary Materials.
The three parameters contact time (A), initial concentration (B) and solution pH (C) were selected for the optimization of two responses (percent removal -Y1 and adsorption capacity, q-Y2). Consequently, A, B, and C are selected by the software as independent variables whereas Y1 and Y2 are dependent variables as expressed in the second-order polynomial equations (Equations (8) and (9)). The equation in terms of coded factors can be used to make predictions about the responses for given levels of each factor (see Equation (7)).
Equations (8) and (9) revealed how the combined variables affect the removal of phosphate from solution onto leftover coal material. The positive values in the equations indicated that the removal of phosphate rises by increasing the effect. The quadratic equation was found as the optimum model to interpret phosphate adsorption onto leftover coal because of the high determination coefficient (R2 = 0.9987 for % removal and R2 = 0.9986 for removal capacity) and low probability value (p-value < 0.0001 both for % removal and removal capacity). A cubic model has higher values of R2 and adjusted R2 but was considered by the software as aliased and can, thus, not be used to interpret the experimental data because of an inadequate number of batch experiments [41]. Adequacy of the model tested and model summary of both % removal and removal capacity are summarized in Tables S2 and S3.
The capability and significance of the quadratic model and factors were analyzed by using analysis of variance (ANOVA). A combination of the Fisher test value (F-value) and probability value (p-value) can verify the signature of the model and the parameters used. F-values of greater than 4 and p-values of less than 0.05 indicate that the model is significant and can be used for accurate prediction of phosphate removal [58]. In this case, A, B, C, AB, AC, A2, B2, C2 are significant model terms. The F-value and p-value of BC (combined effect of initial concentration and solution pH) for % removal were 2.07 and 0.1804 respectively indicating that the model is not significant. The corresponding individual and combined results of each parameter for % removal and removal capacity, q are given in Tables S4 and S5 in the Supplementary Materials.
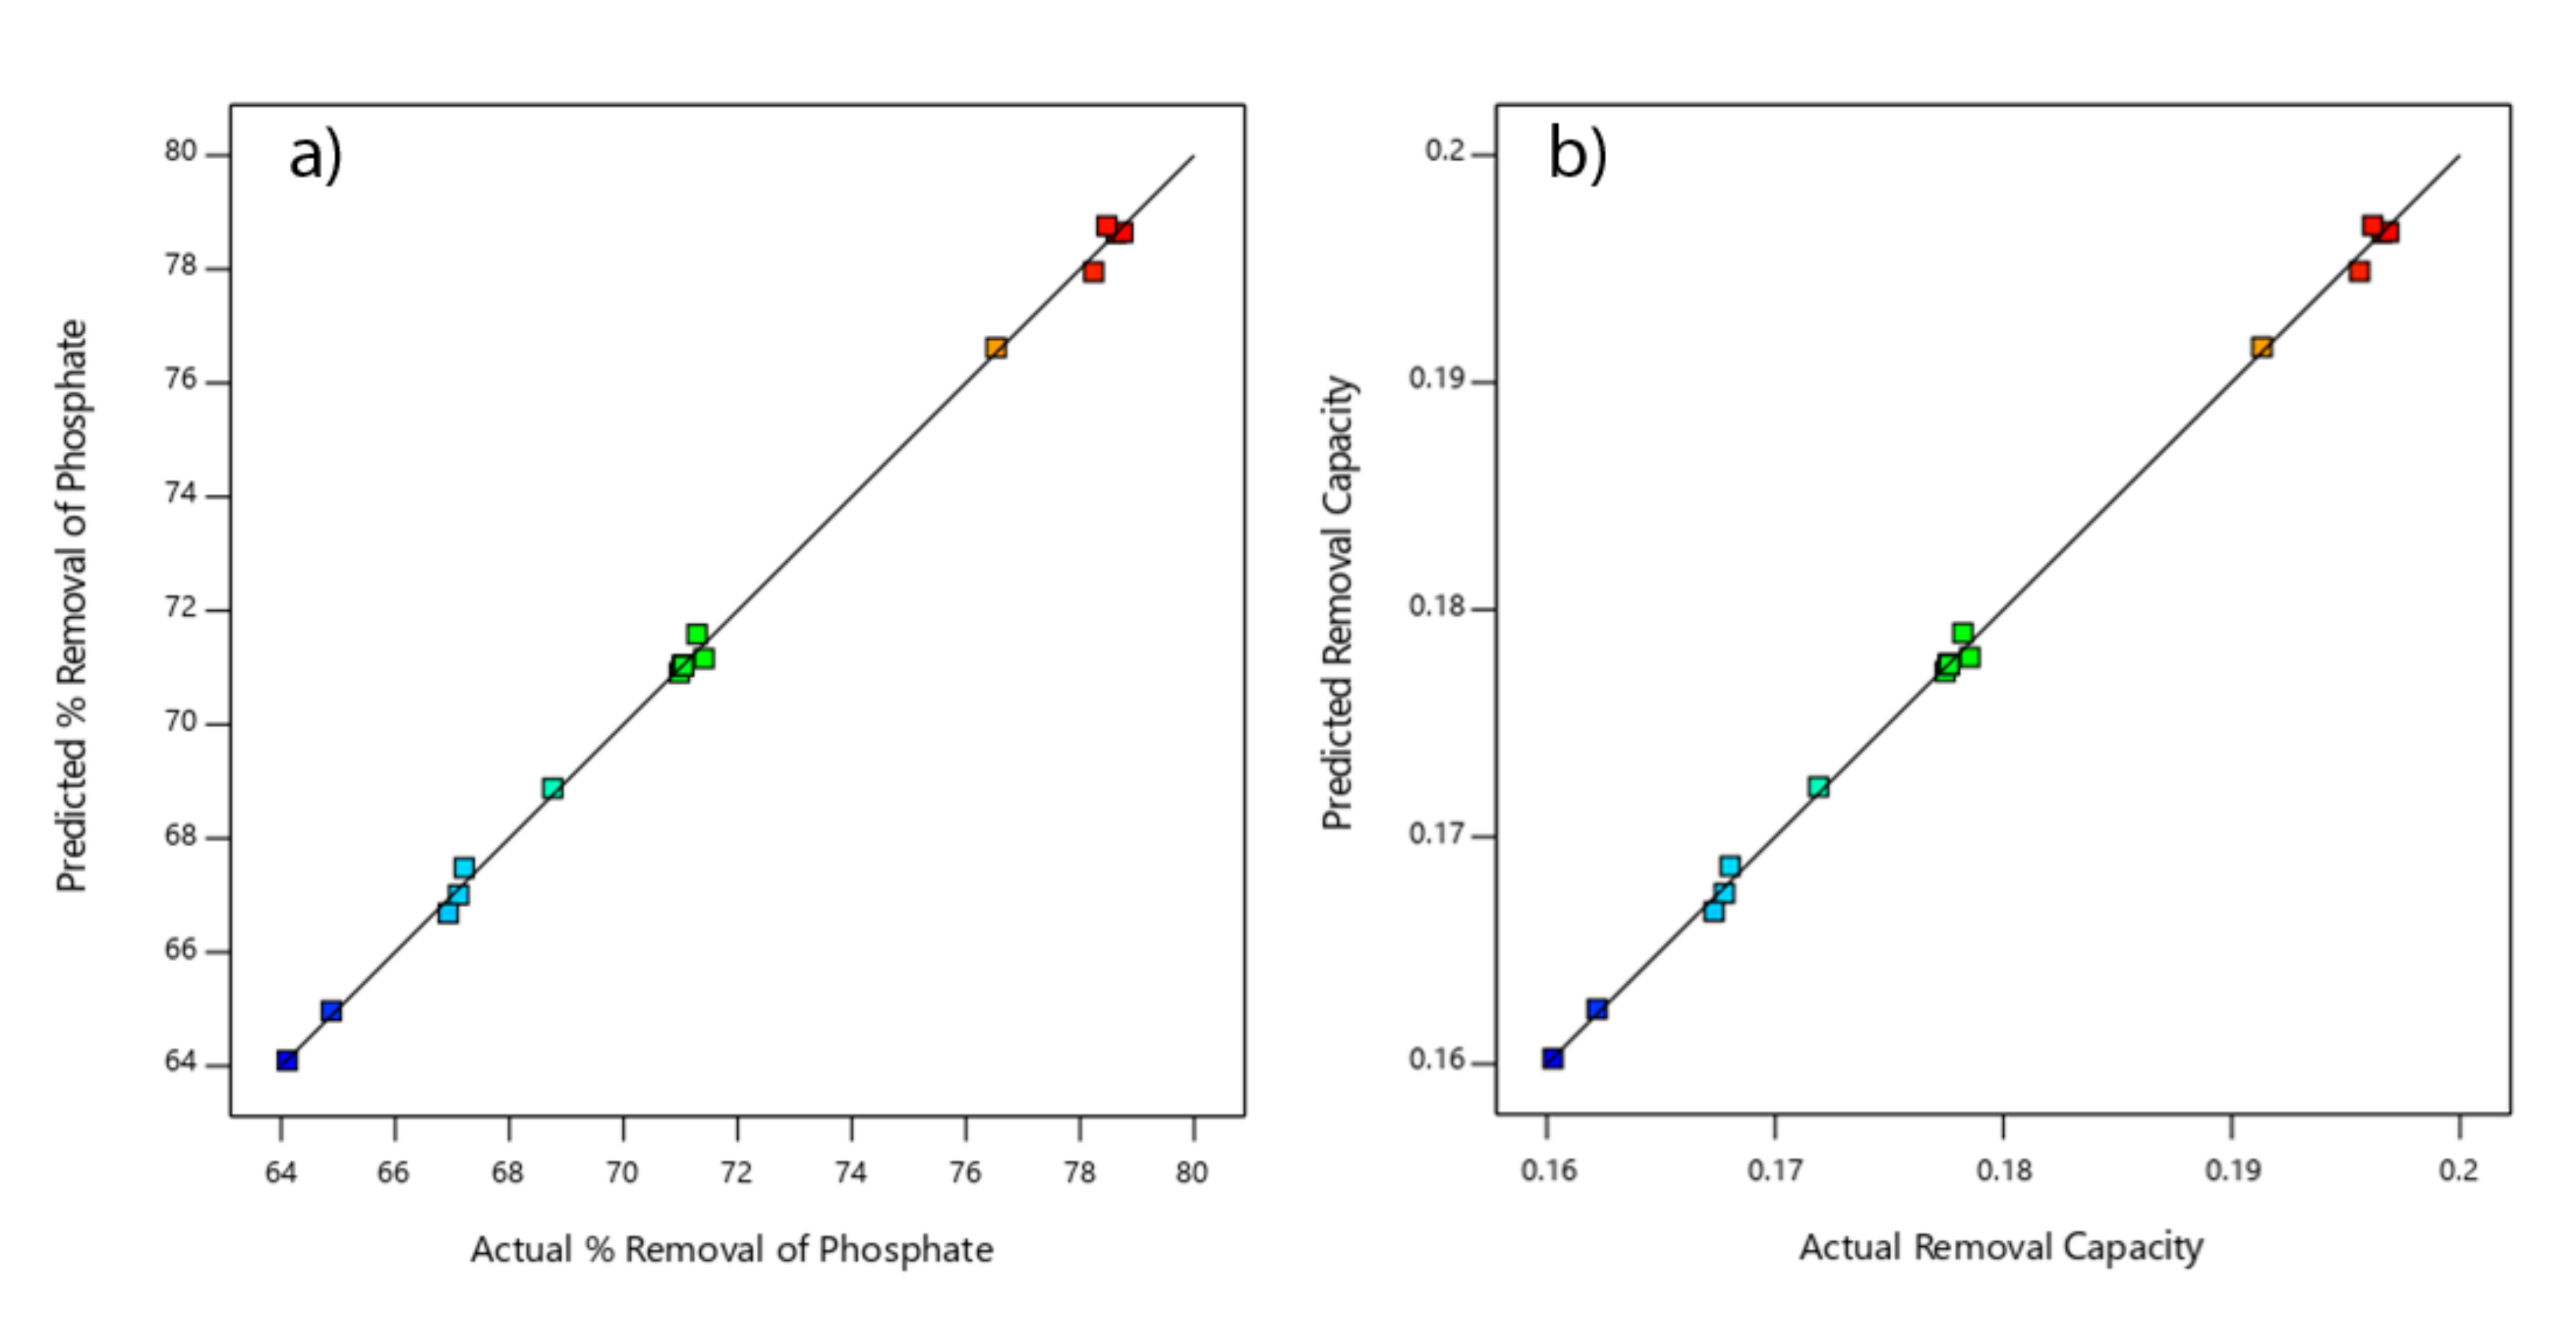
The comparisons between experimental and predicted values are presented numerically in Table S6, graphically in Figure 5a,b. The plots of Figure 5 confirm the very good agreement between experimental values and model calculations.
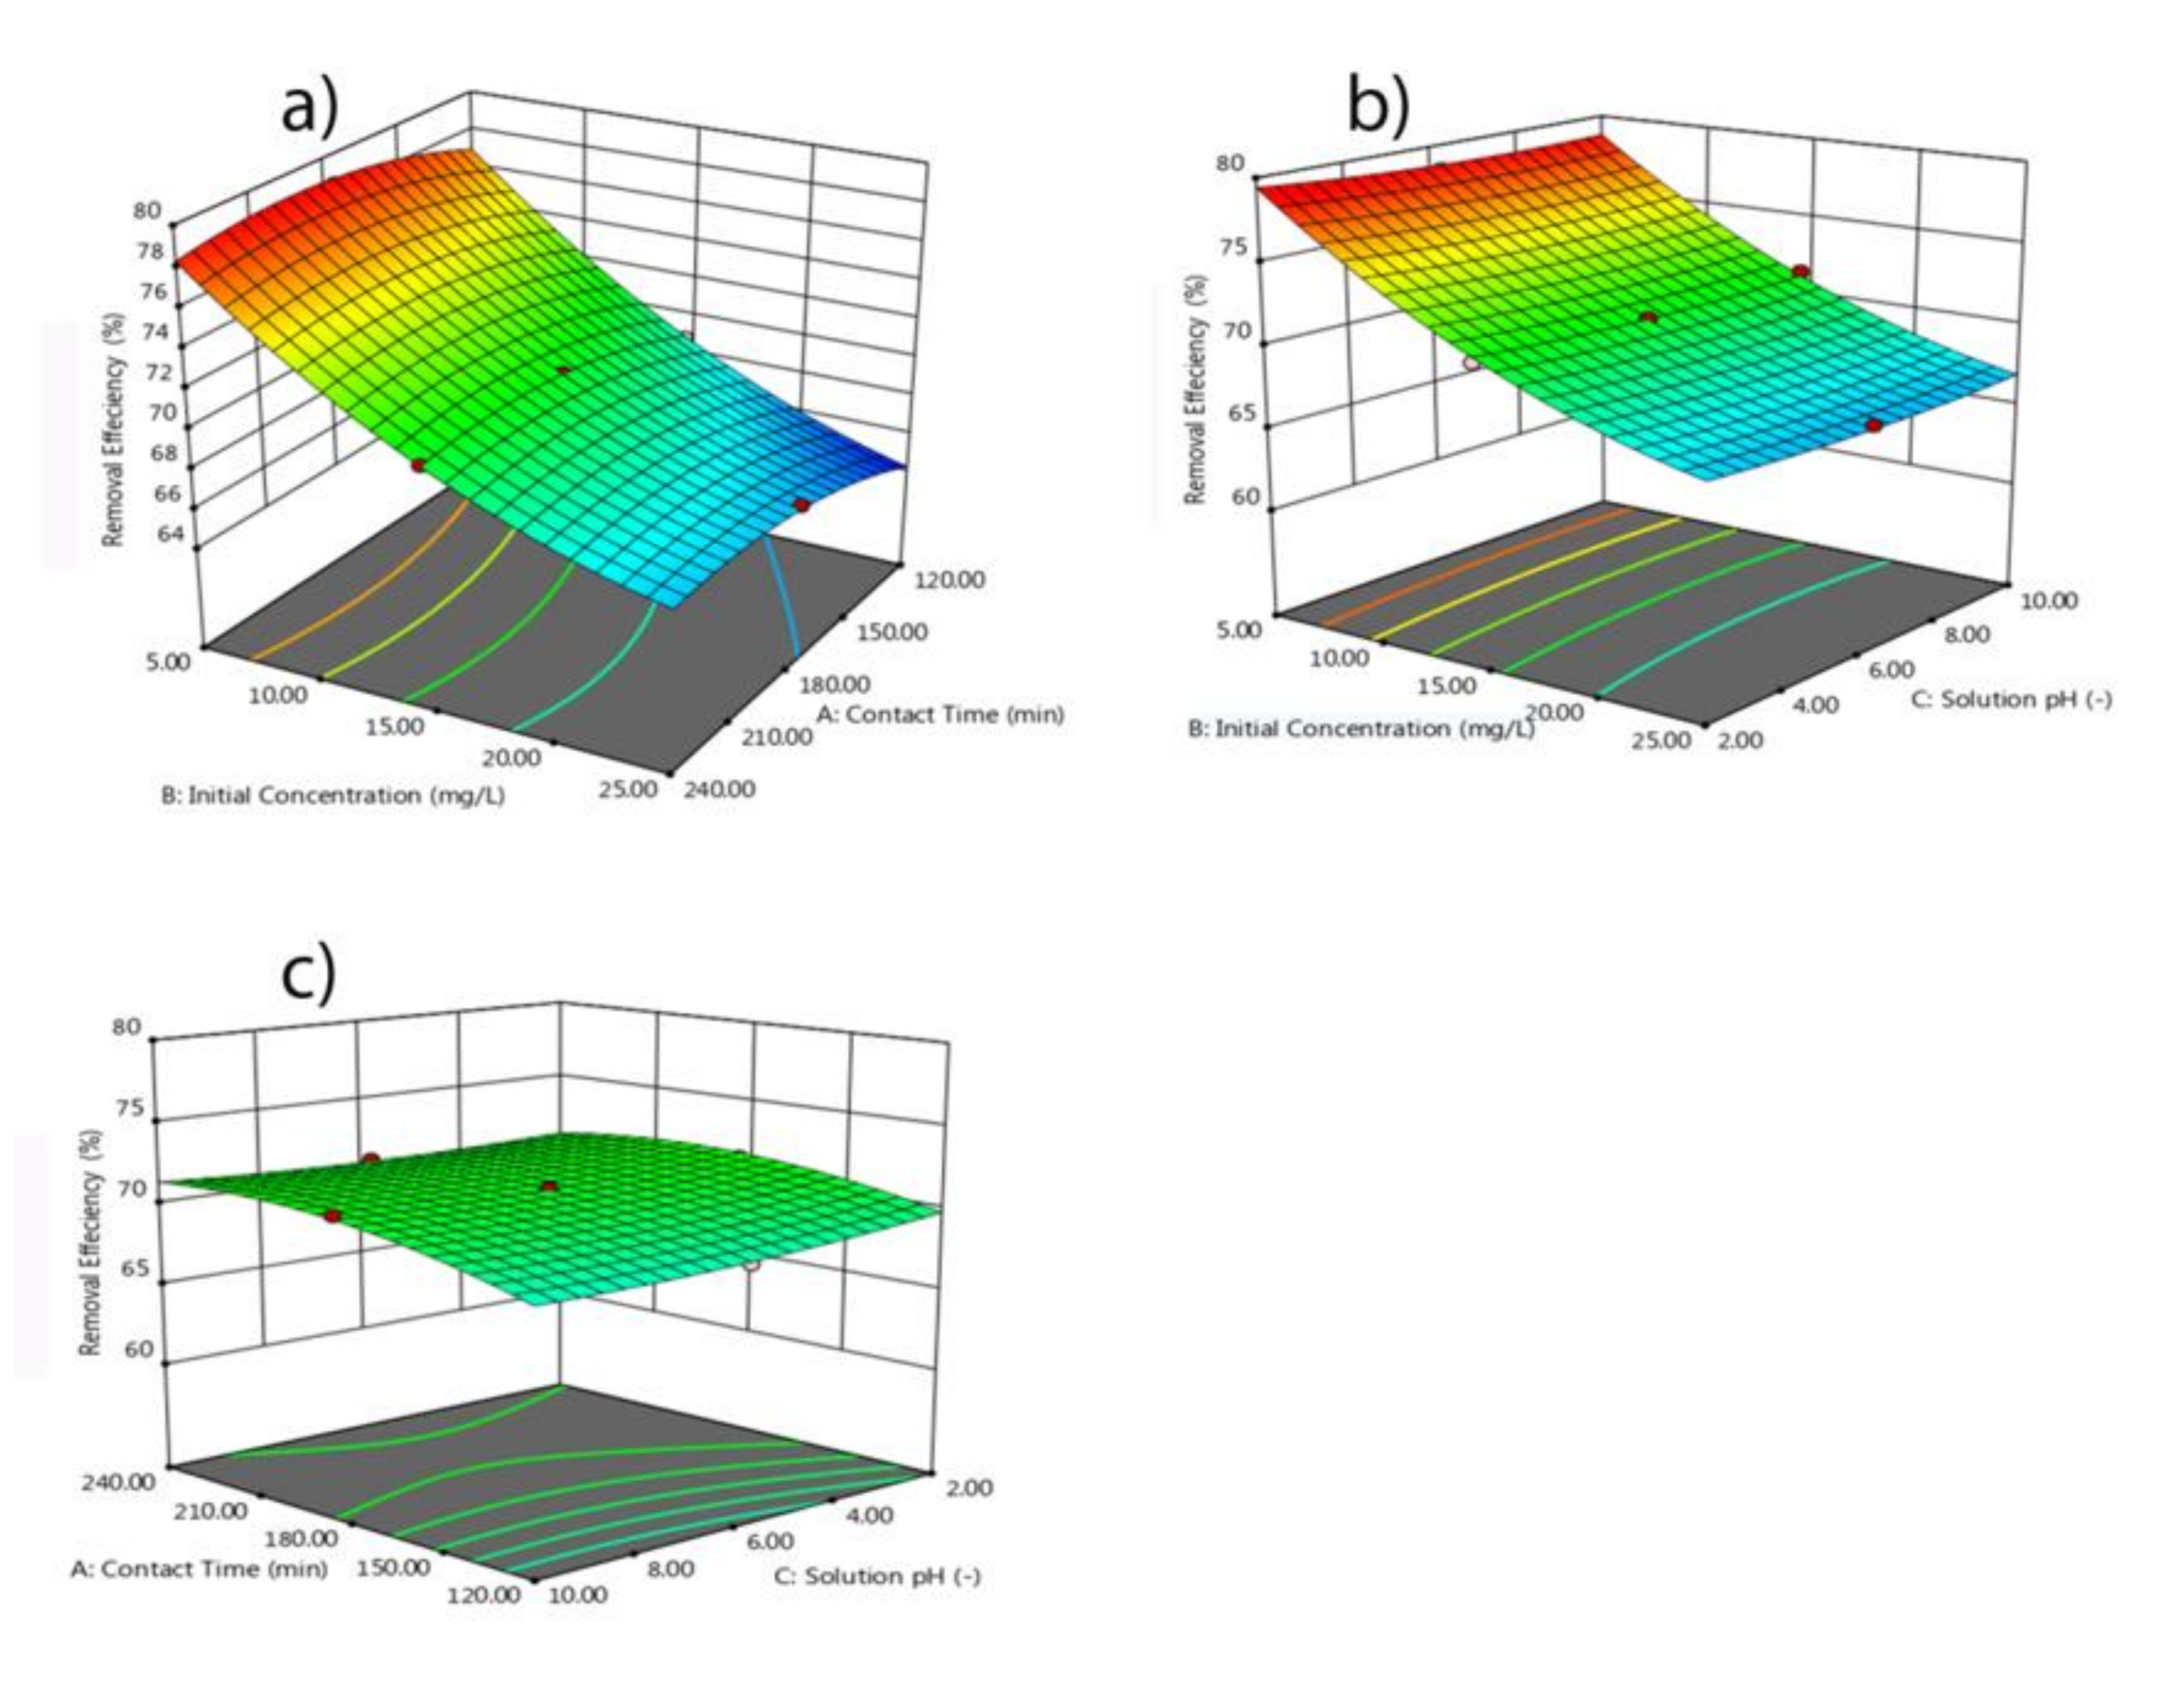
Figure 6 elucidates the surface response of the combined effect of the tested experimental conditions on phosphate removal. It can be seen from Figure 6a that the percent removal of phosphate increases with increasing contact time from 120 min to 240 min at a minimum initial concentration of 5 mg/L. Similarly, Figure 6b,c shows the impact of initial concentration with solution pH and contact time with solution pH respectively. From Figure 6c, however, the impact of the combined effect of contact time and solution pH was not significant on the removal of the phosphate as compared to the impact of contact time and initial concentration.
4. Conclusions
Credible evidence from scientific literature substantiate both beneficial and detrimental effects of coexisting anions in aqueous solution. However, this study focused on the effect of major design parameters on the adsorption of phosphate onto leftover coal without coexisting (competitive) anions. Accordingly, the following major conclusions can be drawn:
- When leftover coal is used for phosphate removal from aqueous solutions, design parameters such as initial phosphate concentration, initial solution pH, adsorbent dose, temperature, and contact time must be optimally selected to obtain the highest possible removal. Apparently, the adsorption of phosphate onto leftover coal increased markedly at pH value of 2, which is the actual pH value of most industrial effluents.
- The adsorption kinetics for phosphate removal could be well described by the pseudo-second-order equation with a correlation value of R2 = 0.99 which revealed that, chemisorption was the dominant process.
- Observed temperature effects on phosphate adsorption reveal that the process is exothermic.
- The central composite design (CCD) was found to be an appropriate approach to optimize the variable affecting phosphate adsorption. The obtained quadratic regression model well depicted observed values of percent phosphate removal and phosphate removal capacity.
It is concluded that leftover coal could be employed as a low-cost adsorbent for the removal of phosphate ions from aqueous solutions. Future investigations shall be directed to phosphate removal from real wastewater that will give better insight into the effect of coexisting anions. The material should be tested in a flow-through set-up to drive practical solutions for local industries.
Supplementary Materials
The following are available online at https://www.mdpi.com/2073-4441/12/5/1381/s1, Figure S1: Yayu coal mining- Oromia, Ethiopia [Latitude =(X, Y) = (8.479572, 8.069128); Longitude= (X, Y) = (35.637697, 36.098927)], Figure S2: Effect of initial pH on phosphate removal by leftover coal (Temperature: 20oC; Co: 10mg/L; dose 40g/L; adsorbent size 0.075mm-0.425mm, contact time 1440min), Figure S3: Effect of adsorbent dose on the removal of phosphate (Temperature: 20oC; Co: 10mg/L; contact time 1440mn; adsorbent size 0.075mm-0.425mm), Figure S4: The plot of effect of initial concentration (Co) of phosphate on the removal and uptake capacity, q (Temperature: 20oC; contact time 1440mn; dose 40g/L; adsorbent size 0.075mm-0.425mm), Table S1: Design Summary for independent and dependent variables/responses, Table S2: Adequacy of the model tested and model summary statistics for % Removal, Table S3: Adequacy of the model tested and model summay statistics for removal capacity-q, Table S4: ANOVA, test of significance for % removal of Phosphate onto leftover coal material, Table S5: ANOVA test of significance for quadratic model of removal capacity-q, Table S6: Experimental design matrix and response based on actual and predicted values of % removal and removal capacity-q.
Author Contributions
D.T.M. conducted the research including literature review, data collection, experimental works, calculations, interpretation of data and original draft preparation; E.A. supervised during the study, updated and revised the manuscript; B.L. supervised the study, reviewed and edited the manuscript. All authors have read and agreed to the published version of the manuscript.
Funding
This research received no external funding.
Acknowledgments
German Academic Exchange Service (DAAD) is acknowledged for providing a scholarship to the first author during the study.
Conflicts of Interest
The authors declare no conflict of interest.
References
- Xiong, J.; Zang, L.; Zha, J.; Mahmood, Q.; He, Z. Phosphate Removal from Secondary Effluents Using Coal Gangue Loaded with Zirconium Oxide. Sustainability 2019, 11, 2453. [Google Scholar] [CrossRef] [Green Version]
- Karageorgiou, K.; Paschalis, M.; Anastassakis, G.N. Removal of Phosphate Species from Solution by Adsorption onto Calcite Used as Natural Adsorbent. J. Hazard. Mater. 2007, A139, 447–452. [Google Scholar] [CrossRef] [PubMed]
- Arshadi, M.; Eskandarloo, H.; Azizi, M.; Abbaspourrad, A.; Abdolmaleki, M.K.; Eskandarloo, H.; Azizi, M.; Abbaspourrad, A. Synthesis of Highly Monodispersed, Stable, and Spherical NZVI of 20−30 Nm on Filter Paper for the Removal of Phosphate from Wastewater: Batch and Column Study. ACS Sustain. Chem. Eng. 2018, 6, 11662–11676. [Google Scholar] [CrossRef]
- Ding, W.; Bai, S.; Mu, H.; Naren, G. Investigation of Phosphate Removal from Aqueous Solution by Both Coal Gangues. Water Sci. Technol. 2017, 76, 785–792. [Google Scholar] [CrossRef]
- Kumar, I.A.; Viswanathan, N. Development and Reuse of Amine-Grafted Chitosan Hybrid Beads in the Retention of Nitrate and Phosphate. J. Chem. Eng. Data 2018, 63, 147–158. [Google Scholar] [CrossRef]
- Peleka, E.N.; Deliyanni, E.A. Adsorptive Removal of Phosphates from Aqueous Solutions. Desalination 2009, 245, 357–371. [Google Scholar] [CrossRef]
- Yadav, D.; Kapur, M.; Kumar, P.; Mondal, M.K. Adsorptive Removal of Phosphate from Aqueous Solution Using Rice Husk and Fruit Juice Residue. Process Saf. Environ. Prot. 2015, 94, 402–409. [Google Scholar] [CrossRef]
- Nagoya, S.; Nakamichi, S.; Kawase, Y. Mechanisms of Phosphate Removal from Aqueous Solution by Zero-Valent Iron: A Novel Kinetic Model for Electrostatic Adsorption, Surface Complexation and Precipitation of Phosphate under Oxic Conditions. Sep. Purif. Technol. 2019, 218, 120–129. [Google Scholar] [CrossRef]
- Khan, S.; Ishaq, M.; Ahmad, I. Evaluation of Coal as Adsorbent for Phosphate Removal. Arab. J. Geosci. 2013, 6, 1113–1117. [Google Scholar] [CrossRef]
- Venkatesan, A.K.; Hamdan, A.-H.M.; Chavez, V.M.; Brown, J.D.; Halden, R.U. Mass Balance Model for Sustainable Phosphorus Recovery in a US Wastewater Treatment Plant. J. Environ. Qual. 2016, 45, 84. [Google Scholar] [CrossRef]
- Alemayehu, E.; Lennartz, B. Virgin Volcanic Rocks: Kinetics and Equilibrium Studies for the Adsorption of Cadmium from Water. J. Hazard. Mater. 2009, 169, 395–401. [Google Scholar] [CrossRef] [PubMed]
- Mehrabi, N.; Soleimani, M.; Sharififard, H.; Yeganeh, M.M. Optimization of Phosphate Removal from Drinking Water with Activated Carbon Using Response Surface Methodology (RSM). Desalination Water Treat. 2016, 57, 15613–15618. [Google Scholar] [CrossRef]
- Tor, A.; Cengeloglu, Y. Removal of Congo Red from Aqueous Solution by Adsorption onto Acid Activated Red Mud. J. Hazard. Mater. 2006, 138, 409–415. [Google Scholar] [CrossRef] [PubMed]
- Asaoka, S.; Yamamoto, T. Characteristics of Phosphate Adsorption onto Granulated Coal Ash in Seawater. Mar. Pollut. Bull. 2010, 60, 1188–1192. [Google Scholar] [CrossRef] [Green Version]
- Benyoucef, S.; Amrani, M. Adsorption of Phosphate Ions onto Low Cost Aleppo Pine Adsorbent. Desalination 2011, 275, 231–236. [Google Scholar] [CrossRef]
- Awual, R.; Jyo, A.; Ihara, T.; Seko, N. Enhanced Trace Phosphate Removal from Water by Zirconium (IV) Loaded Fibrous Adsorbent. Water Res. 2011, 45, 4592–4600. [Google Scholar] [CrossRef] [PubMed]
- Barca, C.; Gérente, C.; Meyer, D.; Chazarenc, F.; Andrés, Y. Phosphate Removal from Synthetic and Real Wastewater Using Steel Slags Produced in Europe. Water Res. 2012, 46, 2376–2384. [Google Scholar] [CrossRef]
- Ghaneian, M.T.; Ghanizadeh, G.; Alizadeh, M.T.H.; Ehrampoush, M.H.; Said, F.M. Equilibrium and Kinetics of Phosphorous Adsorption onto Bone Charcoal from Aqueous Solution. Environ. Technol. 2014, 35, 882–890. [Google Scholar] [CrossRef]
- Xie, J.; Wang, Z.; Lu, S.; Wu, D.; Zhang, Z.; Kong, H. Removal and Recovery of Phosphate from Water by Lanthanum Hydroxide Materials. Chem. Eng. J. 2014, 254, 163–170. [Google Scholar] [CrossRef]
- Nawar, N.; Ahmad, M.E.; El Said, W.M.; Moalla, S.M.N. Adsorptive Removal of Phosphorous from Wastewater Using Drinking Water Treatment-Alum Sludge ( DWT-AS ) as Low Cost Adsorbent. Am. J. Chem. Appl. 2015, 2, 79–85. [Google Scholar]
- Huang, Y.; Lee, X.; Grattieri, M.; Macazo, F.C.; Cai, R.; Minteer, S.D. A Sustainable Adsorbent for Phosphate Removal: Modifying Multi-Walled Carbon Nanotubes with Chitosan. J. Mater. Sci. 2018, 53, 12641–12649. [Google Scholar] [CrossRef]
- Jiang, D.; Chu, B.; Amano, Y.; Machida, M. Removal and Recovery of Phosphate from Water by Mg-Laden Biochar: Batch and Column Studies. Colloids Surf. A Physicochem. Eng. Asp. 2018, 558, 429–437. [Google Scholar] [CrossRef]
- Bouamra, F.; Drouiche, N.; Abdi, N.; Grib, H.; Mameri, N.; Lounici, H. Removal of Phosphate from Wastewater by Adsorption on Marble Waste: Effect of Process Parameters and Kinetic Modeling. Int. J. Environ. Res. 2018, 12, 13–27. [Google Scholar] [CrossRef]
- Cui, X.; Li, H.; Yao, Z.; Shen, Y.; He, Z.; Yang, X.; Ng, H.Y.; Wang, C.H. Removal of Nitrate and Phosphate by Chitosan Composited Beads Derived from Crude Oil Refinery Waste: Sorption and Cost-Benefit Analysis. J. Clean. Prod. 2019, 207, 846–856. [Google Scholar] [CrossRef]
- Lyngsie, G.; Katika, K.; Fabricius, I.L.; Hansen, H.C.B.; Borggaard, O.K. Phosphate Removal by Iron Oxide-Coated Diatomite: Laboratory Test of a New Method for Cleaning Drainage Water. Chemosphere 2019, 222, 884–890. [Google Scholar] [CrossRef]
- Saki, H.; Alemayehu, E.; Schomburg, J.; Lennartz, B. Halloysite Nanotubes as Adsorptive Material for Phosphate Removal from Aqueous Solution. Water 2019, 11, 203. [Google Scholar] [CrossRef] [Green Version]
- Qiu, B.; Duan, F. Synthesis of Industrial Solid Wastes/Biochar Composites and Their Use for Adsorption of Phosphate: From Surface Properties to Sorption Mechanism. Colloids Surf. A Physicochem. Eng. Asp. 2019, 571, 86–93. [Google Scholar] [CrossRef]
- Fantaw, D. The Resource Potential of Coal in Ethiopia–Report; Addis Ababa Institute of Technology: Addis Ababa, Ethiopia, 2019. [Google Scholar] [CrossRef]
- Zhang, F.J.; Zhang, H.Y.; Zhang, L.Y. The Removal of Phosphate by Coal Gangue from Wastewater. Appl. Mech. Mater. 2012, 209, 2005–2008. [Google Scholar] [CrossRef]
- Regassa, M.; Melak, F.; Birke, W.; Alemayehu, E. Defluoridation of Water Using Natural and Activated Coal. Int. Adv. Res. J. Sci. Eng. Technol. 2016, 3, 1–7. [Google Scholar] [CrossRef]
- Zhou, H.; Bhattarai, R.; Li, Y.; Li, S.; Fan, Y. Utilization of Coal Fly and Bottom Ash Pellet for Phosphorus Adsorption: Sustainable Management and Evaluation. Resour. Conserv. Recycl. 2019, 149, 372–380. [Google Scholar] [CrossRef]
- William, G.; Eren, Y.; Ayd, S.; Emik, S.; Tuba, A.; Osra, F.; Wasswa, J. A Facile Polymerisation of Magnetic Coal to Enhanced Phosphate Removal from Solution. J. Environ. Manag. 2019, 247, 356–362. [Google Scholar] [CrossRef]
- Lam, N.H.; Ma, H.T.; Bashir, M.J.K.; Eppe, G.; Nguyen, T.T. Removal of Phosphate from Wastewater Using Coal Slag. Int. J. Environ. Anal. Chem. 2020, 1–11. [Google Scholar] [CrossRef]
- Matsubara, M.E. Evaluation of the Use of Fly Ash as a Low Cost Technology for Phosphorus Removal in Wastewater Treatment. An Interdiscip. J. Appl. Sci. 2018, 13. [Google Scholar] [CrossRef]
- Penn, C.J.; Bowen, J.M. Design and Construction of Phosphorus Removal Structures for Improving Water Quality; Springer: Cham, Switzerland, 2018; ISBN 978-3-319-58658-8. [Google Scholar]
- Fiol, N.; Villaescusa, I. Determination of Sorbent Point Zero Charge: Usefulness in Sorption Studies. Environ. Chem. Lett. 2009, 7, 79–84. [Google Scholar] [CrossRef]
- Krishna, D.; Kannan, P.; Nesakumar, T.; Immanuel, J.; Senthilkumar, A. Biochar from Green Waste for Phosphate Removal with Subsequent Disposal. Waste Manag. 2017, 68, 752–759. [Google Scholar] [CrossRef]
- Ajmal, M.; Ali, R.; Rao, K.; Ahmad, R.; Khan, M.A. Adsorption Studies on Parthenium Hysterophorous Weed: Removal and Recovery of Cd (II) from Wastewater. J. Hazard. Mater. 2006, B135, 242–248. [Google Scholar] [CrossRef]
- Asaithambi, P.; Beyene, D.; Aziz, A.R.A.; Alemayehu, E. Removal of Pollutants with Determination of Power Consumption from Landfill Leachate Wastewater Using an Electrocoagulation Process: Optimization Using Response Surface Methodology (RSM). Appl. Water Sci. 2018, 69, 1–12. [Google Scholar] [CrossRef] [Green Version]
- Sadhukhan, B.; Mondal, N.K.; Chattoraj, S. Optimisation Using Central Composite Design (CCD) and the Desirability Function for Sorption of Methylene Blue from Aqueous Solution onto Lemna Major. Karbala Int. J. Mod. Sci. 2016, 2, 145–155. [Google Scholar] [CrossRef] [Green Version]
- Saadat, S.; Raei, E.; Talebbeydokhti, N. Enhanced Removal of Phosphate from Aqueous Solutions Using a Modi Fi Ed Sludge Derived Biochar: Comparative Study of Various Modifying Cations and RSM Based Optimization of Pyrolysis Parameters. J. Environ. Manag. 2018, 225, 75–83. [Google Scholar] [CrossRef]
- Du, X.; Han, Q.; Li, J.; Li, H. The Behavior of Phosphate Adsorption and Its Reactions on the Surfaces of Fe–Mn Oxide Adsorbent. J. Taiwan Inst. Chem. Eng. 2017, 76, 167–175. [Google Scholar] [CrossRef]
- Witek-krowiak, A.; Szafran, R.G.; Modelski, S. Biosorption of Heavy Metals from Aqueous Solutions onto Peanut Shell as a Low-Cost Biosorbent. Desalination 2011, 265, 126–134. [Google Scholar] [CrossRef]
- Pan, J.; Gao, B.; Song, W.; Xu, X.; Yue, Q. Modified Biogas Residues as an Eco-Friendly and Easily-Recoverable Biosorbent for Nitrate and Phosphate Removals from Surface Water. J. Hazard. Mater. 2019, 382. [Google Scholar] [CrossRef] [PubMed]
- Wu, B.; Fang, L.; Fortner, J.D.; Guan, X.; Lo, I.M.C. Highly Efficient and Selective Phosphate Removal from Wastewater by Magnetically Recoverable La(OH)3/Fe3O4 Nanocomposites. Water Res. 2017, 126, 179–188. [Google Scholar] [CrossRef] [PubMed]
- Bui, T.H.; Hong, S.P.; Yoon, J. Development of Nanoscale Zirconium Molybdate Embedded Anion Exchange Resin for Selective Removal of Phosphate. Water Res. 2018, 134, 22–31. [Google Scholar] [CrossRef] [PubMed]
- Huang, W.Y.; Li, D.; Liu, Z.Q.; Tao, Q.; Zhu, Y.; Yang, J.; Zhang, Y.M. Kinetics, Isotherm, Thermodynamic, and Adsorption Mechanism Studies of La(OH)3-Modified Exfoliated Vermiculites as Highly Efficient Phosphate Adsorbents. Chem. Eng. J. 2014, 236, 191–201. [Google Scholar] [CrossRef] [Green Version]
- Mallet, M.; Barthélémy, K.; Ruby, C.; Renard, A.; Naille, S. Investigation of Phosphate Adsorption onto Ferrihydrite by X-Ray Photoelectron Spectroscopy. J. Colloid Interface Sci. 2013, 407, 95–101. [Google Scholar] [CrossRef]
- Park, J.H.; Jung, D.I. Removal of Total Phosphorus (TP) from Municipal Wastewater Using Loess. Desalination 2011, 269, 104–110. [Google Scholar] [CrossRef]
- Baral, S.S.; Das, S.N.; Rath, P. Hexavalent Chromium Removal from Aqueous Solution by Adsorption on Treated Sawdust. Biochem. Eng. J. 2006, 31, 216–222. [Google Scholar] [CrossRef]
- Rashidi Nodeh, H.; Sereshti, H.; Zamiri Afsharian, E.; Nouri, N. Enhanced Removal of Phosphate and Nitrate Ions from Aqueous Media Using Nanosized Lanthanum Hydrous Doped on Magnetic Graphene Nanocomposite. J. Environ. Manag. 2017, 197, 265–274. [Google Scholar] [CrossRef]
- Lee, C.; Jung, J.; Pawar, R.R.; Kim, M.; Lee, S.M. Arsenate and Phosphate Removal from Water Using Fe-Sericite Composite Beads in Batch and Fixed-Bed Systems. J. Ind. Eng. Chem. 2017, 47, 375–383. [Google Scholar] [CrossRef]
- Rashid, M.; Price, N.T.; Angel, M.; Pinilla, G.; Shea, K.E.O. Effective Removal of Phosphate from Aqueous Solution Using Humic Acid Coated Magnetite Nanoparticles. Water Res. 2017, 123, 353–360. [Google Scholar] [CrossRef] [PubMed]
- Kim, S.H.D.; Lee, S. Effect of PH and Coexisting Anions on Removai of Phospiiate from Aqueous Soiutions by Inorganic-Based Mesostructures. Water Environ. Res. 2012, 84. [Google Scholar] [CrossRef]
- Pengthamkeerati, P.; Satapanajaru, T.; Chularuengoaksorn, P. Chemical Modification of Coal Fly Ash for the Removal of Phosphate from Aqueous Solution. Fuel 2008, 87, 2469–2476. [Google Scholar] [CrossRef]
- Foo, K.Y.; Hameed, B.H. Insights into the Modeling of Adsorption Isotherm Systems. Chem. Eng. J. 2010, 156, 2–10. [Google Scholar] [CrossRef]
- Kapur, M.; Mondal, M.K. Mass Transfer and Related Phenomena for Cr ( VI ) Adsorption from Aqueous Solutions onto Mangifera Indica Sawdust. Chem. Eng. J. 2013, 218, 138–146. [Google Scholar] [CrossRef]
- Wang, J.P.; Chen, Y.Z.; Ge, X.W.; Yu, H.Q. Optimization of Coagulation-Flocculation Process for a Paper-Recycling Wastewater Treatment Using Response Surface Methodology. Colloids Surf. A Physicochem. Eng. Asp. 2007, 302, 204–210. [Google Scholar] [CrossRef]
Figure 1.
Scanning electron microscope (SEM) images (a) before adsorption, (b) after adsorption; energy dispersive X-ray (EDX) elemental spectra (c) before adsorption and (d) after adsorption.
Figure 1.
Scanning electron microscope (SEM) images (a) before adsorption, (b) after adsorption; energy dispersive X-ray (EDX) elemental spectra (c) before adsorption and (d) after adsorption.

Figure 2.
Kinetic of phosphate adsorption process: (a) Effect of contact time on phosphate removal and (b) linear regression of t/q vs. time (pseudo second-order).
Figure 2.
Kinetic of phosphate adsorption process: (a) Effect of contact time on phosphate removal and (b) linear regression of t/q vs. time (pseudo second-order).

Figure 3.
Effect of particle size on removal of phosphate (temperature: 20 °C; Co: 10 mg/L; dose 40 g/L; contact time 240 min).
Figure 3.
Effect of particle size on removal of phosphate (temperature: 20 °C; Co: 10 mg/L; dose 40 g/L; contact time 240 min).

Figure 4.
The plot of Langmuir and Freundlich adsorption isotherm (Temperature: 20 °C; contact time 1440 min; dose 40 g/L; adsorbent size 0.075–0.425 mm).
Figure 4.
The plot of Langmuir and Freundlich adsorption isotherm (Temperature: 20 °C; contact time 1440 min; dose 40 g/L; adsorbent size 0.075–0.425 mm).

Figure 5.
The plot of predicted versus measured values for: (a) % removal and (b) removal capacity, q.
Figure 5.
The plot of predicted versus measured values for: (a) % removal and (b) removal capacity, q.

Figure 6.
The combined effect of (a) contact time and initial concentration, (b) contact time and pH, and (c) initial concentration and solution pH on % removal of phosphate.
Figure 6.
The combined effect of (a) contact time and initial concentration, (b) contact time and pH, and (c) initial concentration and solution pH on % removal of phosphate.


Table 1.
Adsorption kinetics constants.
| Initial Concentration (mg/L) | Pseudo First Order | Pseudo Second Order | ||||||
|---|---|---|---|---|---|---|---|---|
| qe, exp (mg/g) | qe, cal (mg/g) | K1 (min−1) | R2 | qe, exp (mg/g) | qe, cal (mg/g) | K2 (g/mg min) | R2 | |
| 10 | 0.20283 | 0.11676 | 0.195 | 0.96 | 0.20283 | 0.20511 | 7.67 | 0.99 |
Table 2.
Freundlich and Langmuir isotherm constants.
| Adsorbent | Freundlich Constants | Langmuir Constants | |||||
|---|---|---|---|---|---|---|---|
| KF (L/mg) | nF | R2 | KL (L/mg) | qmax (mg/kg) | R2 | RL | |
| Coal leftover | 0.112 | 1.67 | 0.901 | 1.315 | 38.01 | 0.7604 | 0.03–0.60 |
© 2020 by the authors. Licensee MDPI, Basel, Switzerland. This article is an open access article distributed under the terms and conditions of the Creative Commons Attribution (CC BY) license (http://creativecommons.org/licenses/by/4.0/).
Share and Cite
MDPI and ACS Style
Mekonnen, D.T.; Alemayehu, E.; Lennartz, B. Removal of Phosphate Ions from Aqueous Solutions by Adsorption onto Leftover Coal. Water 2020, 12, 1381. https://doi.org/10.3390/w12051381
AMA Style
Mekonnen DT, Alemayehu E, Lennartz B. Removal of Phosphate Ions from Aqueous Solutions by Adsorption onto Leftover Coal. Water. 2020; 12(5):1381. https://doi.org/10.3390/w12051381
Chicago/Turabian StyleMekonnen, Dereje Tadesse, Esayas Alemayehu, and Bernd Lennartz. 2020. "Removal of Phosphate Ions from Aqueous Solutions by Adsorption onto Leftover Coal" Water 12, no. 5: 1381. https://doi.org/10.3390/w12051381
Note that from the first issue of 2016, this journal uses article numbers instead of page numbers. See further details here.