Characterization of Aquifer Hydrochemistry from the Operation of a Shallow Geothermal System


1
Groundwater Research Center, Korea Institute of Geoscience and Mineral Resources, Daejeon 34132, Korea
2
School of Earth and Environmental Sciences, Seoul National University, Seoul 08826, Korea
*
Author to whom correspondence should be addressed.
Water 2020, 12(5), 1377; https://doi.org/10.3390/w12051377
Submission received: 30 March 2020
/
Revised: 4 May 2020
/
Accepted: 5 May 2020
/
Published: 13 May 2020
(This article belongs to the Special Issue Injection-Induced Fluid Flows and Solute/Heat Transport Behavior in a Subsurface Environment)
Abstract
:The use of shallow geothermal energy systems utilizing groundwater temperature for the air-conditioning of buildings is increasing worldwide. The impact of these systems on groundwater quality has become crucial for environmental regulations and system design. For the long-term operation of geothermal systems, it is important to evaluate their influence on the geochemical properties of groundwater, including precipitation and dissolution of secondary minerals. This research was conducted in a real-scale geothermal system, consisting of a groundwater heat pump (GWHP). Hydrochemical data were obtained from samples collected from an aquifer before heating, during heating, and before cooling operations of the GWHP. The Langelier Saturation Index and Ryznar Stability Index were calculated, and the saturation index was simulated with the PHREEQC program. Evidence from water table variation, temperature change, and Sr/Sr isotope distribution showed that groundwater flows from a well located on the northwest side of the geothermal well. The saturation index values showed that the pristine groundwater favors carbonate dissolution, however, manganese oxides are more sensitive to temperature than carbonate minerals. In addition, mineral precipitation and dissolution were found to vary with depth and temperature.
1. Introduction
In the last few decades, extensive CO gas emissions have been linked to several aspects of global changes and the scarcity of energy resources by many researchers [1,2,3]. Environmental problems are becoming evident at local and global scales. As a response, international agreements such as the Kyoto Protocol and the Paris Agreement call for the reduction of fossil fuel consumption as well as enforce developments in renewable energy [4,5,6]. Alongside solar, wind, and hydro-energy, shallow geothermal energy is an alternative to fossil fuel that is used for space heating and cooling worldwide [7,8]. With the advantages of flexible system design for various capacity ranges, site availability, long sustainability, environmental friendliness, and simple simplicity of installation, the geothermal heat pump market has experienced dramatic growth since the 1990s [9,10,11,12]. The majority of installations occur in North America, Europe, and China. Recent surveys have shown that the global installation capacity is approximately 50,258 MWt [13,14,15,16,17]. Geothermal heat pumps have been installed mostly in North America, Europe, and China, and many other countries have the potential for considerable uptake [18,19,20,21,22,23].
A geothermal heat pump, or shallow geothermal system, can be roughly grouped as a ground- source heat pump (GSHP) of the closed-loop type, or a groundwater heat pump (GWHP) of the open-loop type [24,25]. The key factors that determine heat pump performance are the thermophysical properties of the ground. The type of heat exchanger should be determined by the preference of thermal resources to be extracted from the ground or groundwater. In the closed-loop type, a circulation fluid moves inside the system without direct contact with, or dispersion in, the aquifer, and heat transfer between the circulation fluid in the tube and the surrounding ground is utilized. In the open-loop type, groundwater is pumped into the system and extracted water is re-injected into the same or a different aquifer after heat exchange. In a typical aquifer thermal energy storage (ATES), or GSHP system, the circulated groundwater temperature ranges from 5 and 30 C, and the ambient aquifer temperature is changed by less than ±10 C [24,26,27,28,29]. Recently, high-temperature ATES, or seasonal thermal energy storage systems, have been designed for reservoirs with subsurface temperature of up to 100 C [30,31]; however, such systems have not gained popularity thus far. Regulations for the maximum allowed temperature of re-injected groundwater have been set only in a few countries [32]. Even in low-temperature GSHP systems, heating and cooling operations lead to temperature differences between the heat sink and source, and change the temperature of the ambient aquifer. Although the thermal plume of a heat pump site is limited to a specific area, temperature changes may adversely affect groundwater quality in many ways [14,33,34,35,36,37,38,39].
Re-injected groundwater at a different temperature from that of the aquifer may induce changes in dissolved O and CO concentrations, mineral solubility, reaction kinetics, redox processes, and sorption-desorption of dissolved components [40]. The influence of ATES operation on groundwater chemistry has been studied using various approaches [34,41,42,43,44,45]. Hydrochemical reactive transport model simulations could explain the effects of shallow geothermal energy harvesting on groundwater quality within specific temperature ranges of injected water [46]. Scaling problems such as CaCO deposition have frequently been reported in heat pumps and heat exchangers. Rafferty [47] classified groundwater quality by developing evaluation tables of indicators associated with calcium hardness, M-alkalinity, total dissolved solids (TDS), pH, and temperature. Indices of water hardness such as the Langelier Saturation Index (LSI) and Ryznar Stability Index (RSI) are generally used to predict the scaling potential within several ranges of water hardness or temperature [36,48,49]. Abesser et al. [50] developed a web-based map as a screening tool for open-system installation: this map provides site-specific hydrogeological information and groundwater quality data with the LSI, RSI, and Larson–Skold Corrosive Index. Park et al. [51] conducted oxygen and hydrogen isotope analyses of groundwater used in open-loop systems for one year, and provided LSI and RSI values. Strontium isotope analysis of bedrock minerals and surface waters provides information on the history of groundwater movement related to hydrological processes [52,53,54,55].
A feasibility study of a GWHP site, therefore, calls for integrated approaches [56,57], and the characterization of the potential groundwater change at a shallow geothermal system requires comprehensive surveys based on groundwater quality and local hydrogeology. Re-injected groundwater mediates reactions of mineral dissolution–precipitation; the latter are sensitive to fluctuations in temperature, pressure, and the concentration of dissolved inorganic carbon. Moreover, the hydrochemical condition of groundwater and the precipitation of minerals affect the lifespan of GWHPs. Considering these issues, this study investigates the effect of GWHP operation on groundwater using hydrochemical monitoring data for one season of heating and cooling operation at a GWHP site. The main objectives of this study are: (1) to understand changes in hydrochemistry before and after system operation; (2) to gain perspective on groundwater movement in the local watershed boundary with isotopic analysis; and, (3) to evaluate the long-term sustainability of the GWHP system with increasing temperature.
2. Site Description
The studied GWHP system is located inside the Korea Institute of Geoscience and Mineral Resources (KIGAM) in the Yuseong area, Daejeon city, Republic of Korea (Figure 1A). The mean annual temperature and precipitation of the research area for the past ten years are 13.2 C and 1282 mm, respectively (Korea Meteorological Administration, www.kma.go.kr). Both temperature and precipitation increase sharply in March and April, reaching their maxima in August. The geology of the study site mainly consists of Mesozoic quartz gabbro and Mesozoic two-mica granite (biotite and muscovite) rocks, which are intruded by dykes of granophyre, and quartz porphyry (Figure 1B). The original structure of metamorphic rocks at this site are affected by granite intrusion and the bedrock is unconformably overlain by Quaternary alluvia [58]. The covering sediment layer with 5 m thickness consists of reclaimed soil, and the below comprises thin weathered part and fractured biotite granite bedrock. Figure 1C shows the well locations at the study site. There is a stream flowing from the northwest to the southeast of the study area. The hybrid borehole heat exchanger (BHE) system, namely GWHP, is installed in the SP well (Figure 1), which is at approximately 30 m from the stream.
The groundwater level and altitude of each sampling site were measured during the monitoring campaign, and the results show in Appendix A Table A1. Based on the data in January (before the heating operation period), the groundwater levels of KD and KH wells located north of the study area were higher than those of the wells of BS, JJ and SP. It confirms that the trend of groundwater level decreased from the northeastern hill to the southwestern stream, and the flow direction of the groundwater is likely to be similar. There is stream water as a permanent stream, thus groundwater is constantly discharging. The groundwater level of SP well was the lowest among the other wells in January and June 2019, and was lower than the stream water level. It is considered to be the influence of the pumping operation of the open-loop type GWHP.
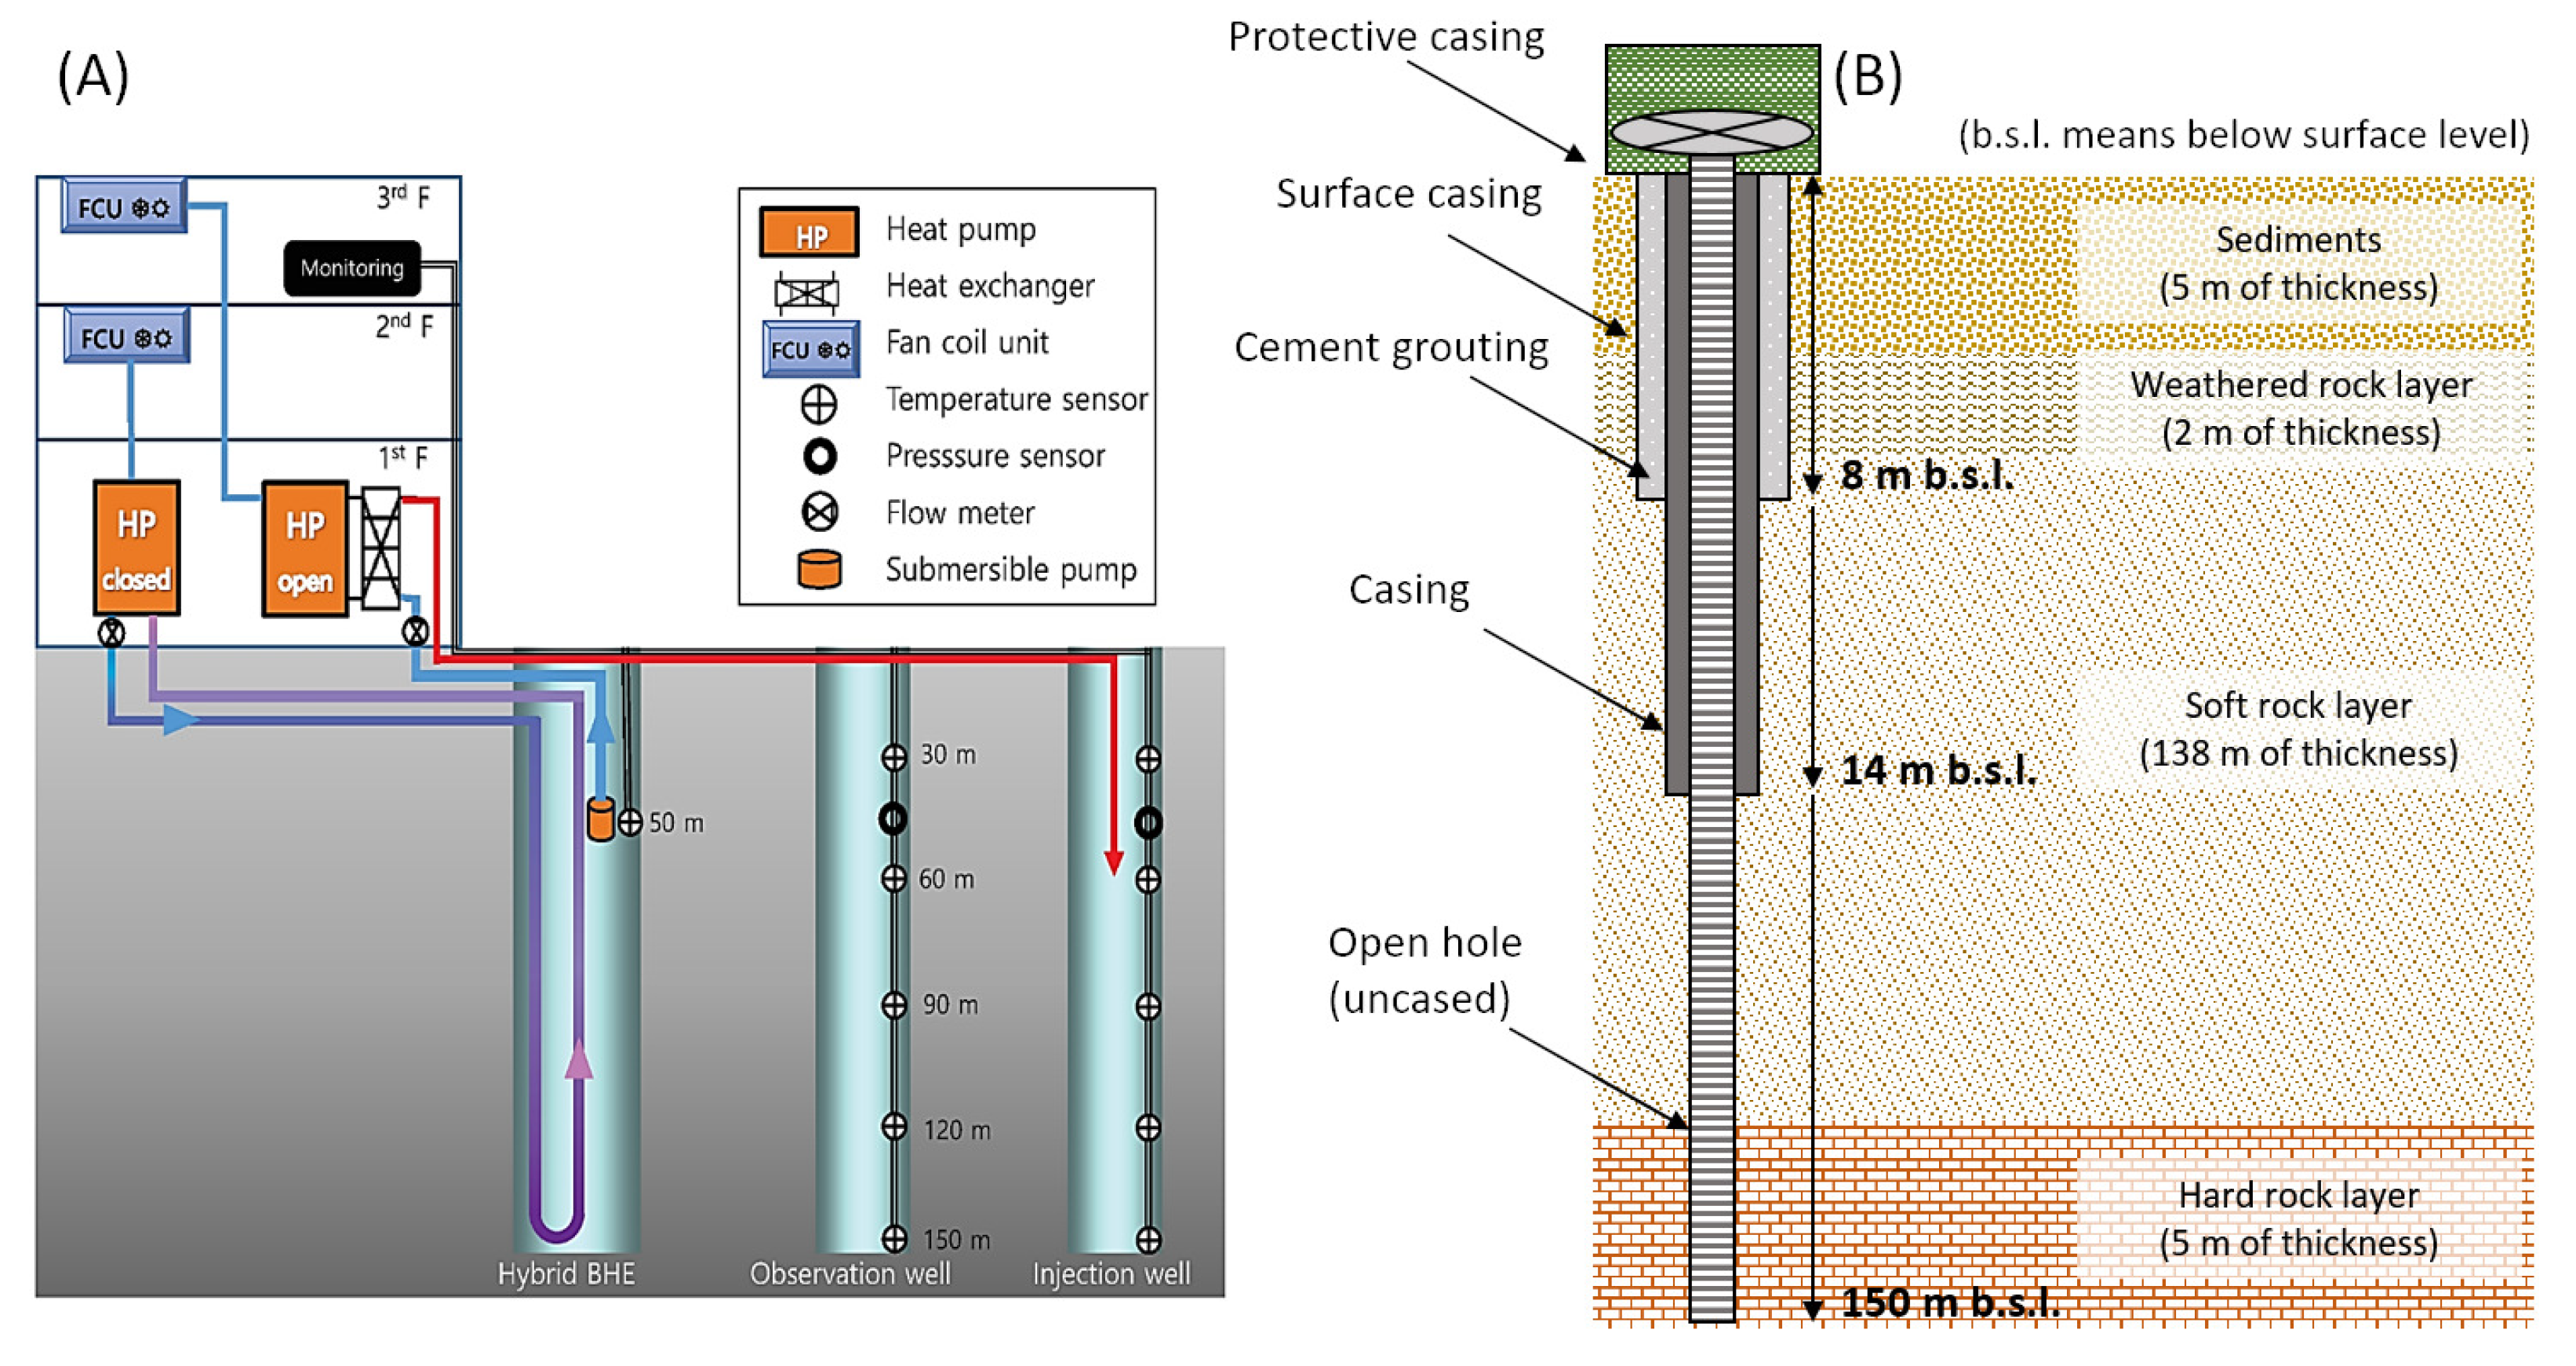
The system comprises one hybrid BHE, one injection well, and one monitoring well, as shown in Figure 2A. The hybrid BHE has the functions of both open- and closed-loop types. The distance between the geothermal well (200 mm diameter) and the injection well (150 mm diameter) is 10 m, and the observation well (150 mm diameter) is located mid-distance between the latter. The geothermal well consists of an open-loop system with a submersible pump, installed at a depth of approximately 50 m, with a closed-loop U-tube pipe. These wells are filled with groundwater, and the installed casing depths range from 10–14 m. Surface water intrusion into the borehole is prevented by cement grouting around the outer casing down to a depth of 8 m (Figure 2B). In the study area, two other vertical closed-loop type systems have been in operation in different research buildings since 2006 and 2014. The annual air-conditioning load is estimated to be approximately 42,120 kWh. By assuming the load as energy demand, we estimate a saving of 3370 kg of CO [7].
3. Materials and Methods
3.1. Sampling and Analysis
Sampling was carried out in January (before heating operation), February (during heating operation), and June (before cooling operation) in 2019. Thirty-two water samples were collected from five wells and one stream. In situ measurements of temperature, pH, electrical conductivity (EC), oxidation-reduction potential (Eh), and dissolved oxygen (DO) were taken using a multi-parameter portable meter (WTW Multi 3620 IDS, Fisher Scientific, Sweden). Laboratory analyses were conducted to determine silica (SiO), ions (Ca, K, Mg, Na, Fe, Mn, Sr, F, Cl, Br, HCO, NO, and SO), and isotopes (O, H and Sr/Sr) values. Alkalinity titration was carried out using 0.02 N hydrochloric acid and Rondolino DL50 Titroprocessor (Mettler Toledo, Australia). All water samples were filtered through a 0.22 µm pore size membrane (Advantec, cellulose acetate), stored in polypropylene bottles, and refrigerated at 4 °C for chemical analyses.
Cation samples were acidified with concentrated nitric acid to pH < 2. Cations and anions were analyzed using Inductively Coupled Plasma Optical Emission Spectrometer (ICP-OES, OPTIMA 7300DV, Perkin Elmer, USA) and Ion Chromatography (IC, Dionex Aquion, Thermo Scientific, USA), respectively. The measured ion concentration had a charge balance error of ±10%. Oxygen (O) and hydrogen (H) isotopes of the water samples were analyzed using a cavity ring-down spectrometer (L2140-i of isotopic HO, Picarro, USA), and isotope ratio results were compared to the standardized Standard Mean Ocean Water (V-SMOW). Samples for analysis of strontium isotope ratios (Sr/Sr) were dried in Teflon vessels, dissolved with 8 N HNO, and analyzed using Thermal Ionization Mass Spectroscopy (TIMS, TRITON Plus TIMS, Thermo scientific, USA). The strontium isotope ratios were normalized to Sr/Sr = 8.375209, and the mean Sr/Sr ratio of the NBS987 standard for analysis was 0.710269 ± 0.000005.
3.2. Hydrothermal Variation Monitoring
As shown in Figure 2A, the submersible pump is located at 50 m depth in the hybrid BHE, and the pumped groundwater circulates through a plate heat exchanger with a 28,800 kcal/h capacity. The heat-exchanged groundwater discharges at 30 m depth in the injection well. The performance monitoring system collects temperature data from the observation and injection wells using Pt100 temperature sensors at depths of 30, 60, 90, 120, and 150 m. The geothermal heat pump operates automatically according to heating or cooling demands, and the temperature of pumped groundwater changes according to the air-conditioning load.
4. Results and Discussions
4.1. Temperature Variation of the Aquifer
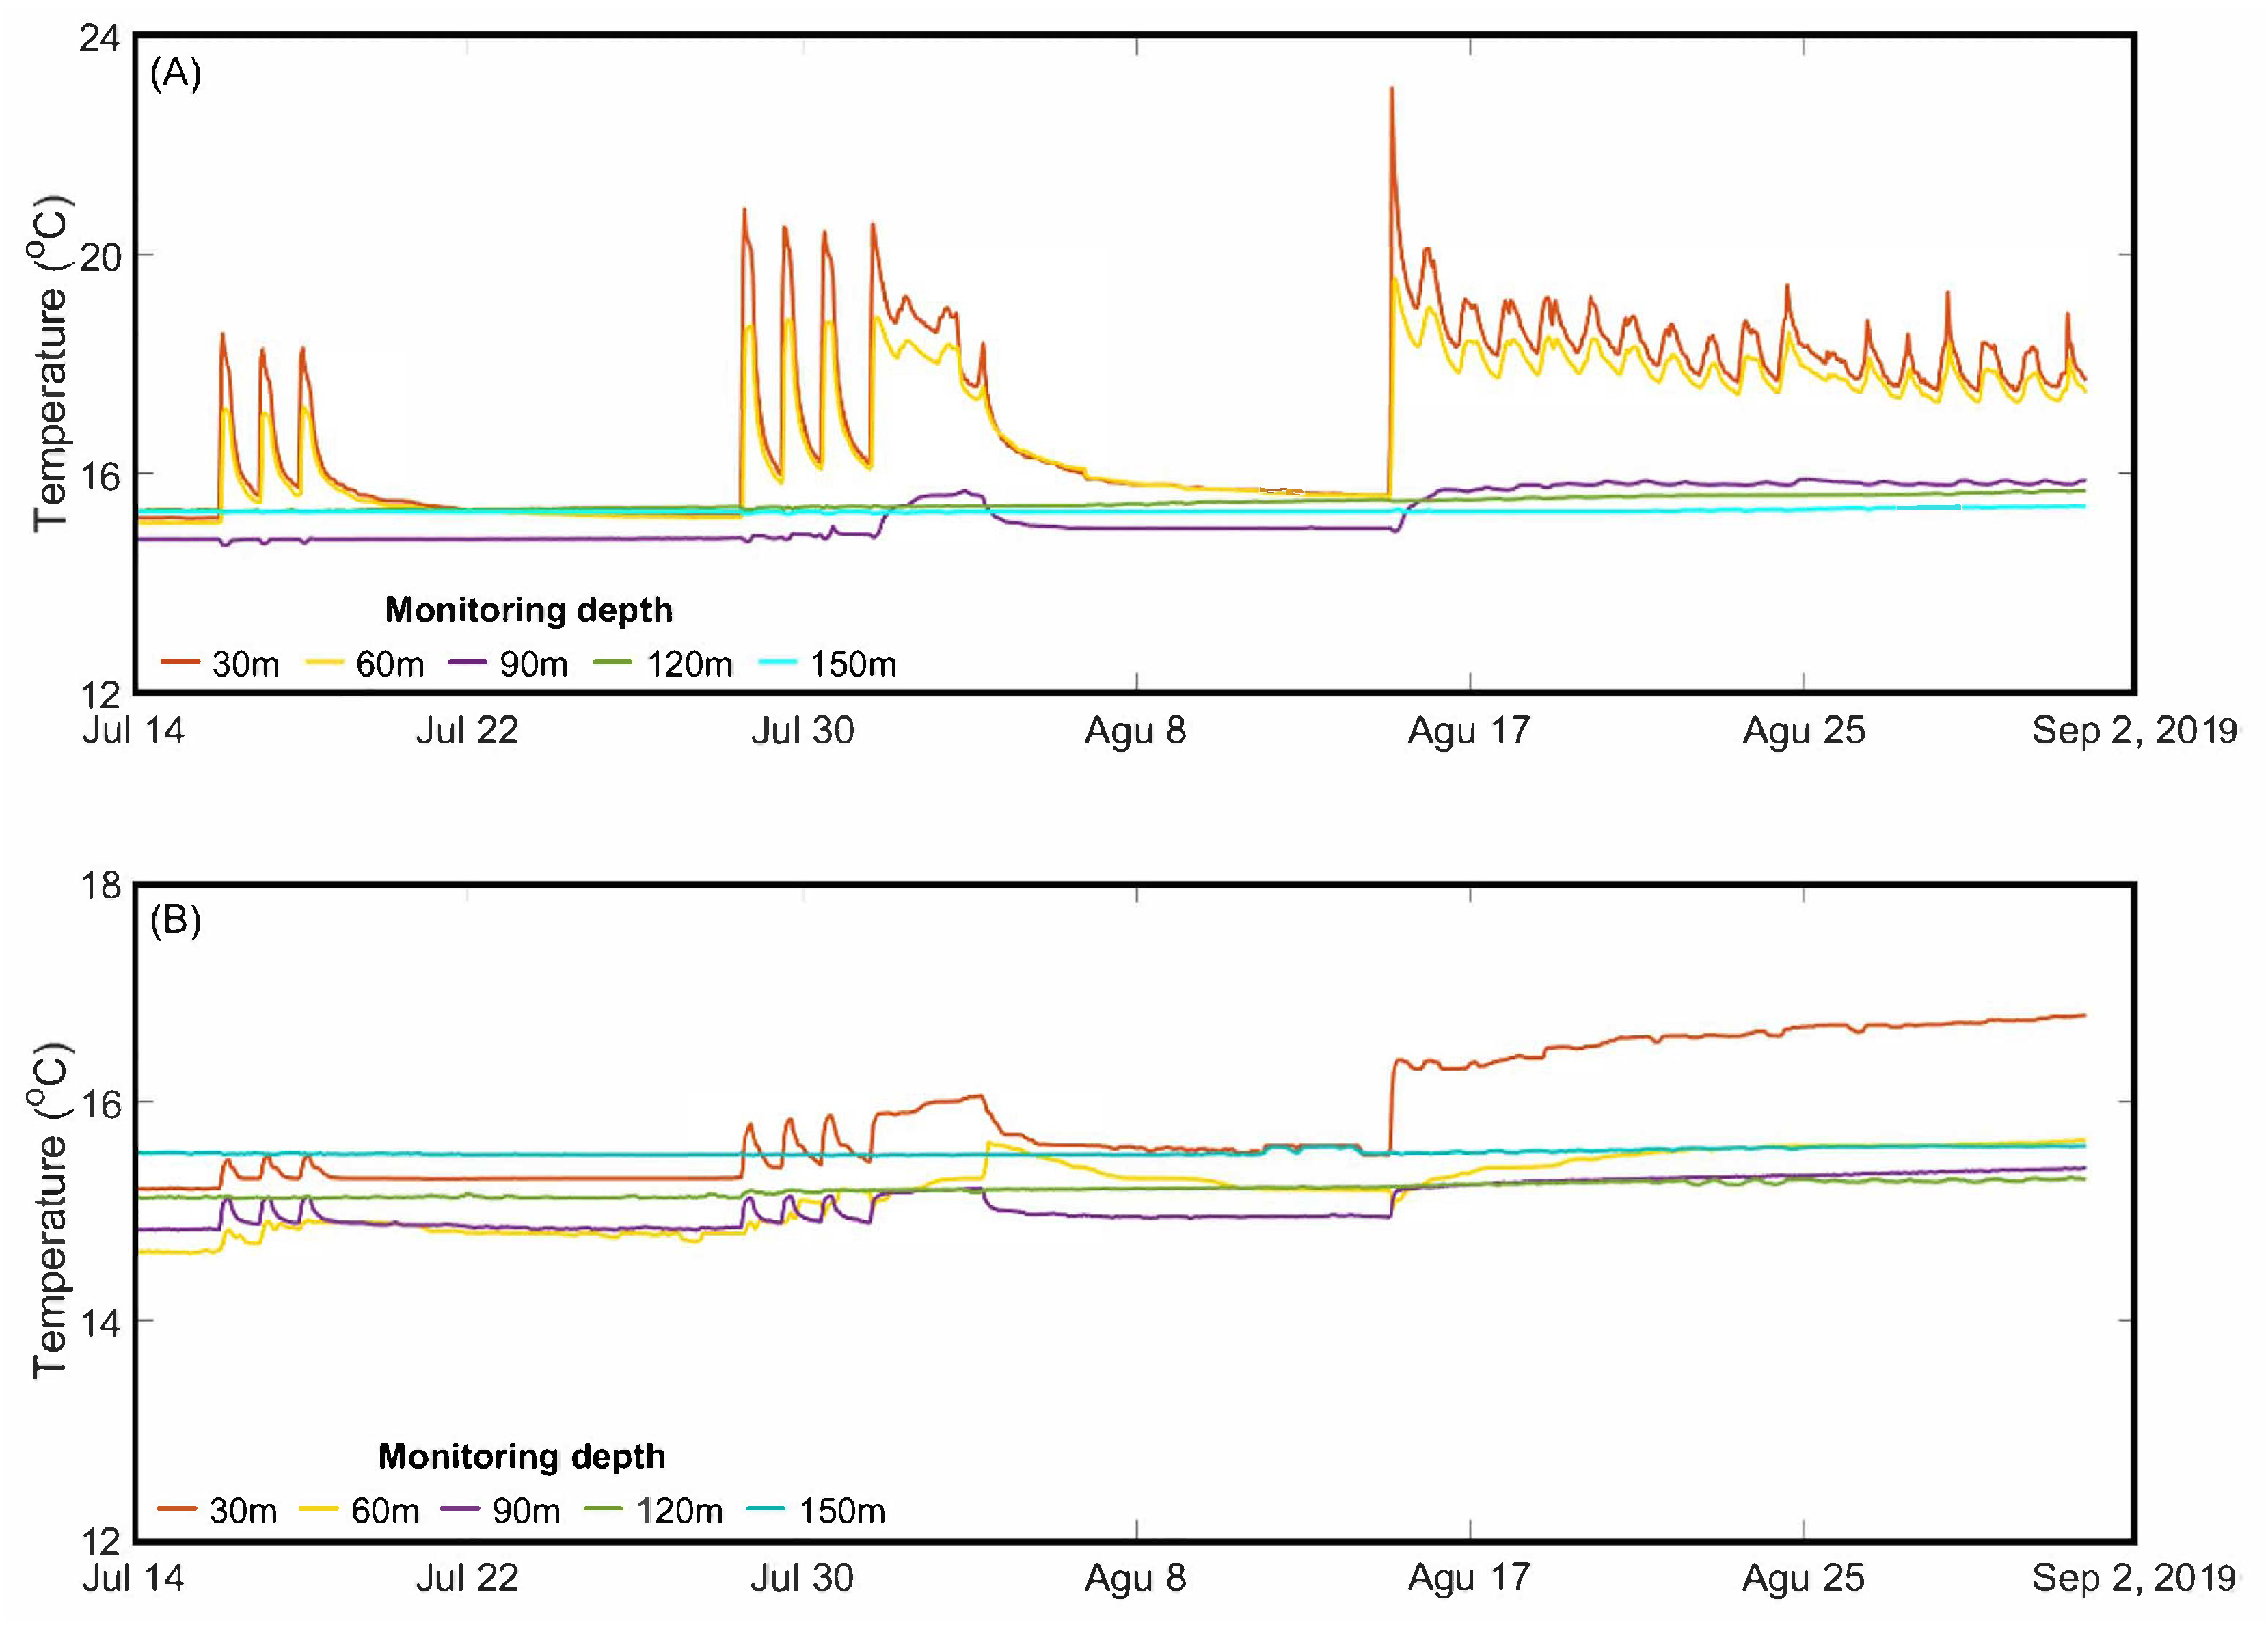
The subsurface temperature was monitored during one heating and cooling cycle of the GWHP. The temperature of re-injected water ranged from 13.9–15.9 C in the monitored heating season (21 January to 11 March 2019), and 14.7–23.0 C in the cooling season (14 July to 4 September 2019). The temperature ranges and peaks are related to the air-conditioning load, system performance, aquifer hydrology, etc. In the winter season, the heat exchange rate during peak heating load was between 8.8 and 2.0 kW, and the injection temperature variation was lower than that of the cooling period. Figure 3 shows the temperature variation at the injection and observation wells during the summer season. The main temperature variation peaks were shown at 30, 60, and 90 m depth, however the temperature variation trend in the observation well differs from that in the injection well. It is assumed that the re-injected groundwater moves through a hetorogeneous fractured aquifer with local direction. If the thermal injection and extraction rates are balanced during seasonal operations, the ground temperature would change within a narrow range even during long-term operation of the GWHP.
4.2. Field Measurements and Hydrochemical Composition
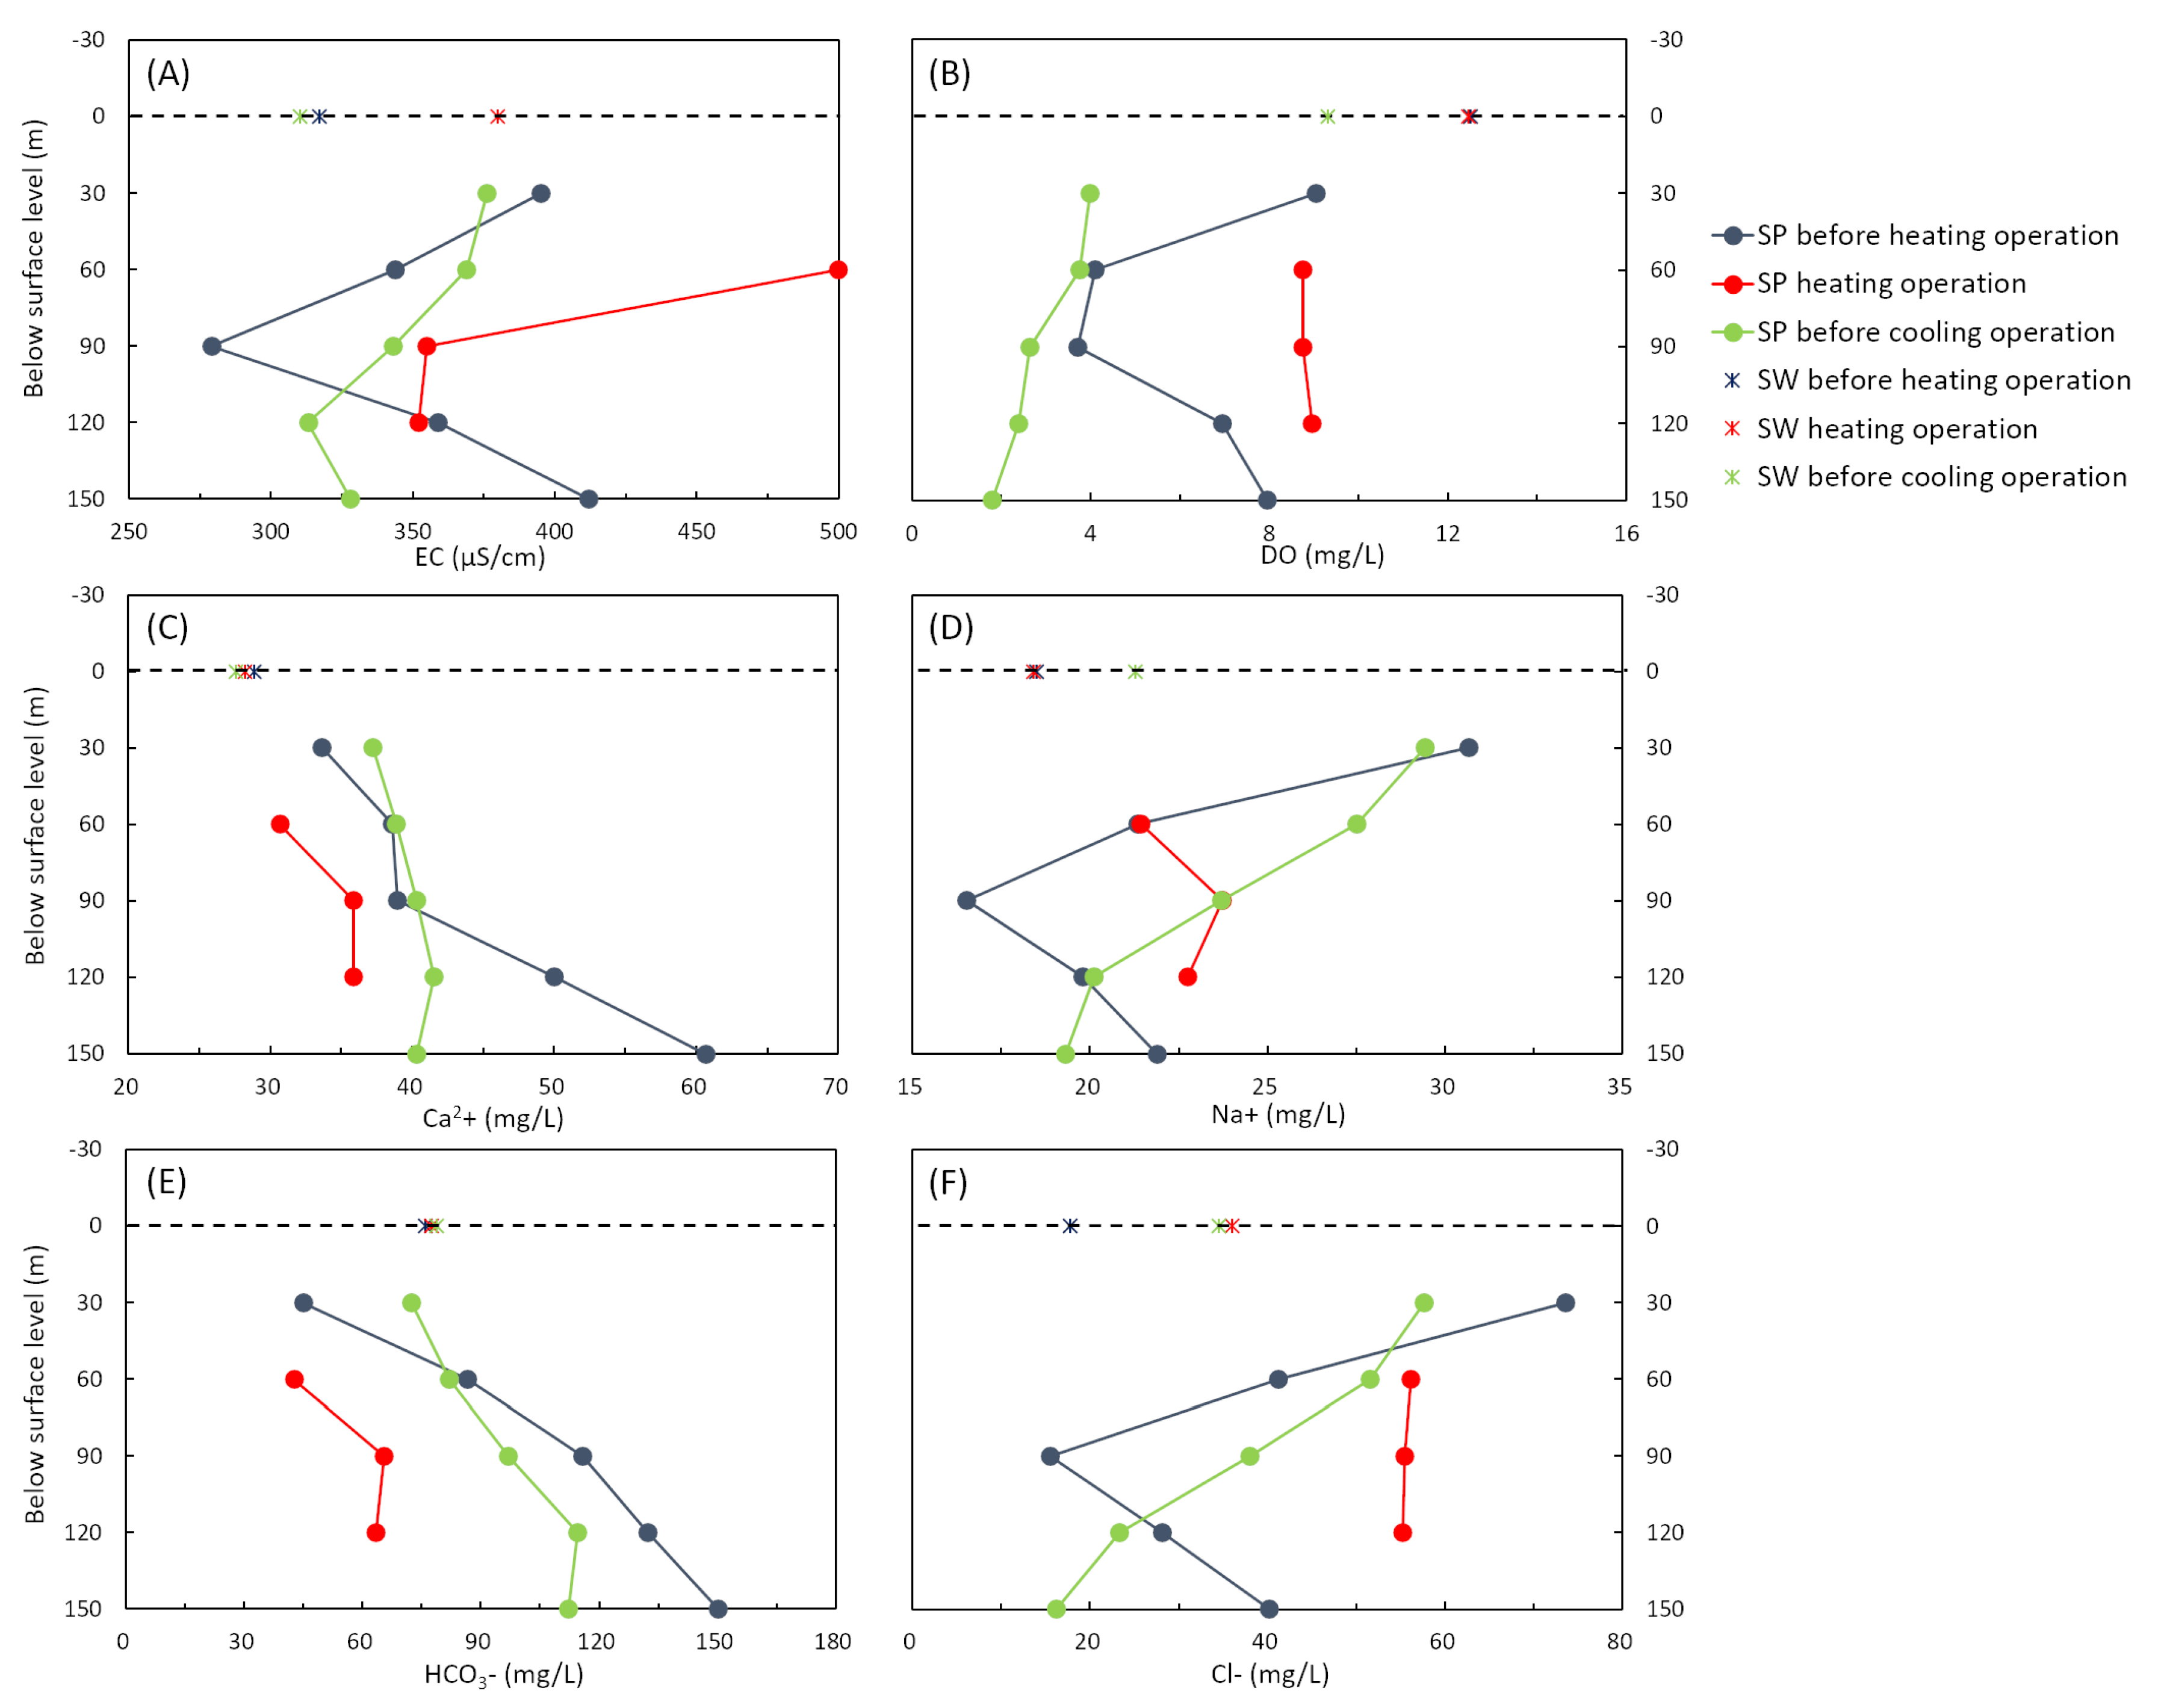
The results from field measurements and laboratory analyses of water samples during the monitoring period are presented in Table 1. These analyses achieved < 5% charge balance error. pH values of the surface water were higher than those of the SP samples, and BS samples showed the highest pH and lowest EC values. Prior to the heating operation period, the trends of EC, DO, Na, and Cl values changed from decreasing to increasing at a depth of 90 m, while Ca and HCO values increased with depth (Figure 4). A low-permeability layer is inferred to have occurred at a 90 m depth, causing the DO value to decrease. The relatively low DO values, and the vertical splitting of EC, Na, and Cl values, can be attributed to the long residence time of groundwater.
During the heating operation in February, the hydrochemical properties of groundwater from the SP well were markedly different from those of surface water. Concentrations of DO, Ca, Na, and Cl were almost constant regardless of depth, whereas EC values decreased drastically, with fluctuations from 60 m to 90 m. The EC trend at a 60 m depth was the opposite to that of other dissolved components and calculated TDS values (Table 1); however, this is attributed to errors in field measurements. Moreover, we infer active vertical mixing of groundwater, although horizontal mixing seldom occurs. The Na and Cl concentrations were much higher in shallow groundwater than in surface water, suggesting that the shallower groundwater is influenced by anthropogenic inputs, whereas the deeper groundwater is affected by water-rock interactions (i.e., mineral dissolution). The hydrochemical characteristics of dissolved components (such as elevated EC, Na, and Cl concentrations) could be attributed to the effects of salt (NaCl) associated with the maintenance of tennis and basketball courts at the study site: a large amount of salt is scattered on the soil surface to prevent soil dust and weed growth. Thus, horizontal interactions between groundwater and surface water did not occur at shallow depth, and the anthropogenic influence extended deeper than 90 m. Consequently, the dissolved components of groundwater appear to be consistent regardless of depth.
After a break of three months (before cooling operation), Na and Cl concentrations decreased with depth, however, the EC, Ca, and HCO concentrations changed at a depth of 120 m, which was likely due to the hydrochemical properties of deeper groundwater (green line in Figure 4). Since the DO decreased with depth, the groundwater condition during this period is believed to have been stable. The reversal of the trend for all factors except DO at a 120 m depth indicates that the permeability of this layer was higher than that at a depth of 90 m. Thus, the hydrochemical values of samples deeper than 120 m may be representative of the regional groundwater flow.
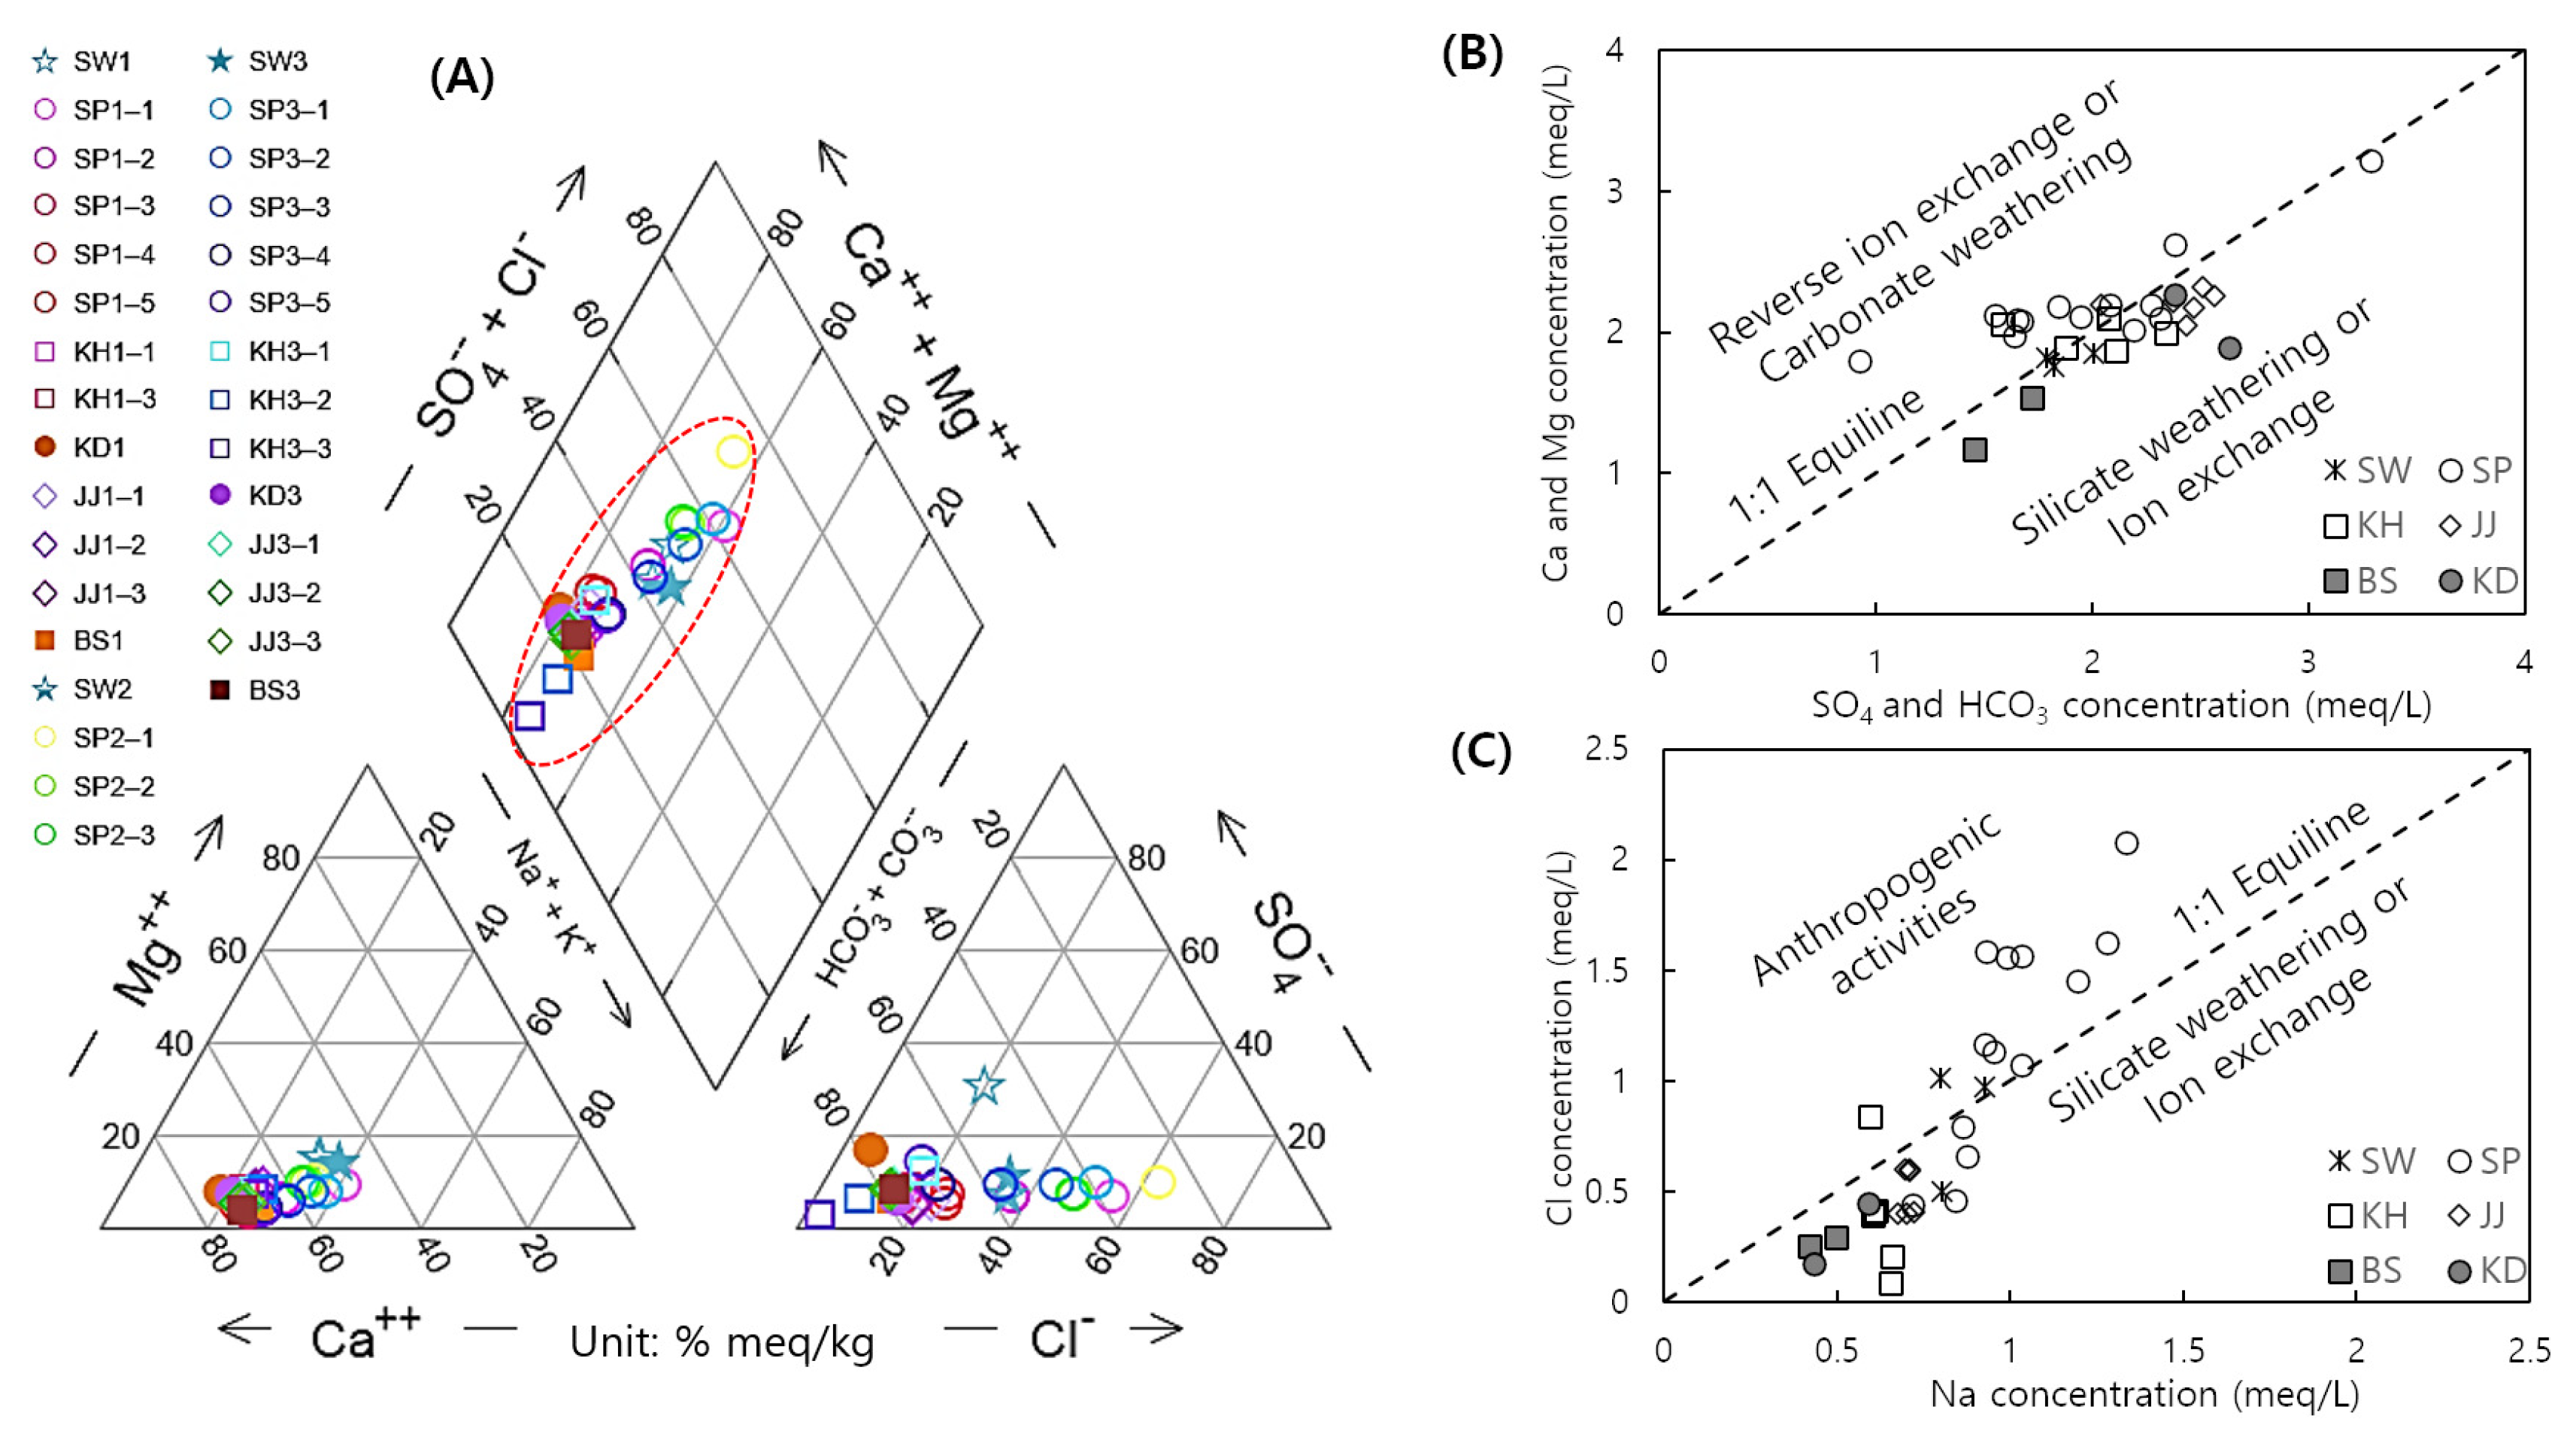
A change in the anion ratio, as shown in the Piper diagram (Figure 5A), reflects operational variations: In particular, the Cl ratio among the anion species is the main determinant of the water type at this site. The cation ratio, however, was almost constant (Figure 5A). The groundwater samples were plotted continuously along the Cl axis, and the Cl ratio of the SP well increased at shallow depths, between 90 m and 60 m. The KH samples were plotted on the lower left side of the groundwater facies diagram, identifying the end-member component among the samples at this site.
Using a Ca+Mg vs. SO+HCO diagram, the majority of the samples are on or over the 1:1 equiline, towards the carbonate weathering or reverse ion exchange field (In Figure 5B). This surplus Ca and Mg may be leached from clay minerals, which is exchanged from the dissolved Na ions. The related equation can be expressed as follows [59,60,61]:
This indicates that the reverse ion exchange occurred in the aquifer especially related with the SP and KH wells. On the other hand, the Ca+Mg vs. SO+HCO compositions of KD, BS, and JJ wells are plotted below the 1:1 equiline, in which samples reflect the water-rock interaction of bedrock minerals. As mentioned above, the GWHP testbed is surrounded by tennis and basketball courts, in which large quantities of salt are frequently sprinkled on the soil surface for management purposes. The exercise area has been covered with artificial grass since the construction of the GWHP. For this reason, the majority of the SP samples showed higher NaCl concentrations than the surface water samples, including the Cl enrichment shown in Figure 5C. The other samples are distributed below the 1:1 Na-Cl line. Since Cl has a conservative property in water, this distribution likely represents Na released from the weathering of silicate minerals, in reactions such as Equation (2) [62]:
4.3. Source of the Solute and Mixing
The groundwater samples from the study site exhibited continuous hydrochemical properties in terms of ion concentration (Piper diagram in Figure 5A) and field-measurements (temperature and water-level fluctuation). These values indicate the main flow path direction in the study area. The strontium isotope ratio (Sr/Sr) was therefore applied as a natural tracer, to interpret the source of solute and mixing interactions. The strontium isotope ratios of minerals in igneous and metamorphic rocks have identical values at the moment of genesis [55]; the strontium isotope ratio of groundwater is controlled by water-rock interaction or mixing of water bodies [63]. The bedrock of the study site is mostly composed of granitic rocks that retain strontium-bearing minerals with records of geochemical evolution [55].
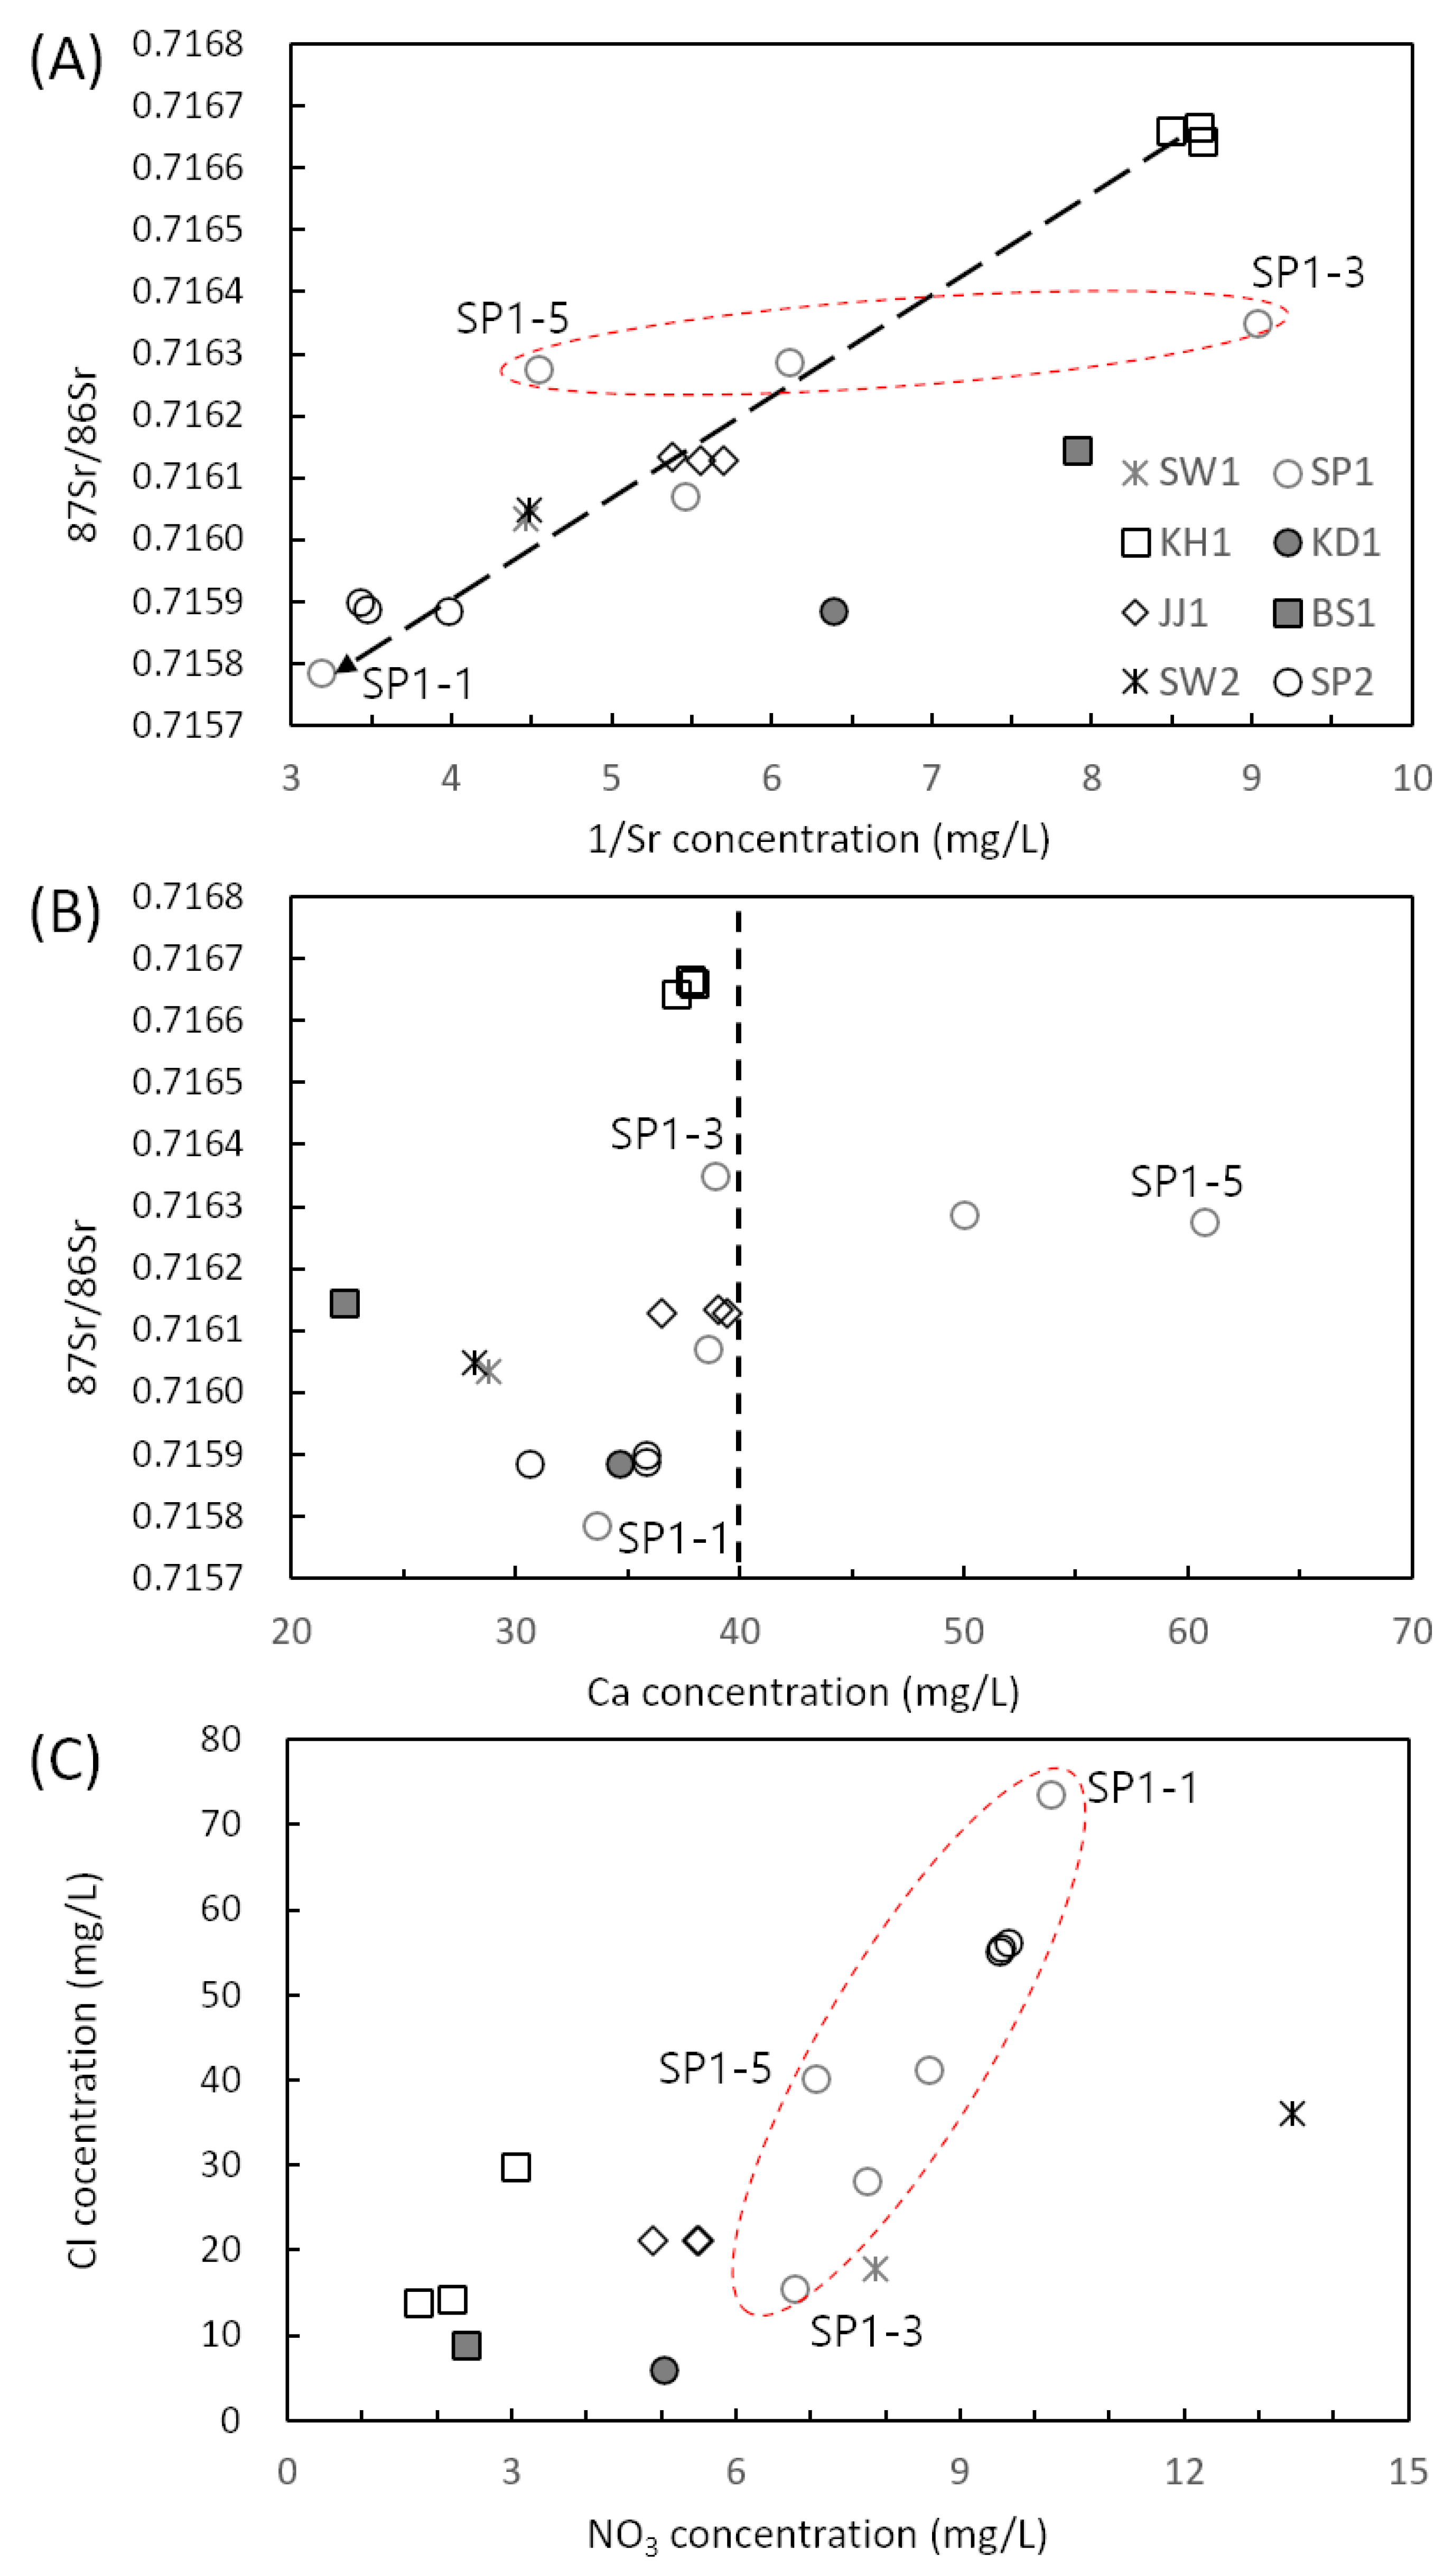
In Figure 6A, Sr/Sr vs. 1/Sr plots from SP1-1 to 1-3 indicates exposure to anthropogenic pollution. In the case of SP1-3 to 1-5, the Sr/Sr ratio maintained almost constant values, implying mineral effects related to the flow path. The plots on the top right side showing KH samples appear to correspond to an end-member of the groundwater as also shown in the Piper diagram, because all plots exhibit a similar trend, with a direction from the KH well to the SP well. Moreover, the water level of the KH well fluctuated with the operation of the GWHP. SP1-3 to SP1-5 have a heavier Sr/Sr ratio than that of surface water, however their Sr/Sr value decreased after GWHP operation due to mixing with shallower groundwater. Cumulative precipitation between the pre-heating and heating periods was reported to be 1.6 mm, indicating that surface water discharged at a steady rate (www.kma.go.kr). KD and BS showed only small water level changes with the operation of the GWHP due to their low connectivity with the aquifer. The Sr/Sr vs. 1/Sr plots show hydrochemical properties that appear to have been influenced by the hill (recharge area) located between KD and BS. For these reasons, groundwater appears to flow from KH to SP with a correlation coefficient of R = 0.98 (except for the KD and BS plots), as shown in Figure 6A.
Cheong et al. [64] reported that the granite in Daejeon region is composed of Daebo garnitoid rocks which are located in central Korea. The whole rock composition of Cheongju granitoid rocks which are the part of Daebo garnitoid rocks, range from 0.712255 to 0.713151 of Sr/Sr. Based on this report, the Sr/Sr of surface water and groundwater in this study site have higher ratio than the whole rock granite, which is presumed to be due to the influence of other rocks such as unknown-age granite or metamorphic rocks such as gneiss.
The Ca concentrations in the groundwater samples from SP1-1 to SP1-3 were distributed within a narrow range from 33–39 mg/L, however, the Sr/Sr values of these samples varied (Figure 6B). The Sr/Sr value of samples SP1-1 to SP1-3 was lower than that of SP1-4, and 1-5; therefore, the Sr/Sr values of SP1-1 to 1-4 do not appear to be affected by the strontium-bearing minerals [65]. Bullen et al. [66] reported a correlation between precipitation and the Sr/Sr value, manifested through the increase of Sr values with increasing depth. In central Korea, Jeon and Nakano [67] reported Sr/Sr values of 0.760 for rainwater and 0.715 for stream water flowing over granitic bedrock. In contrast, SP1-3, 1-4, and 1-5 appeared to have similar Sr/Sr values (0.716277–0.716350) as the stream water, which are considered to represent the pristine geochemical conditions of water-rock interaction [68,69].
In Figure 6C, the NO concentration shows the highest values in SW2 samples (13.4 mg/L), followed by SP1-1 and SP2 samples. The remaining samples represented NO concentrations < 6 mg/L (Table 1). Samples of the SP2 group (SP2-1, 2-2, and 2-3) showed almost the same NO concentration, which is believed to be due to the influence of vertical mixing being stronger than that of denitrification. The Cl concentration usually remains constant or increases only slightly during water-rock interaction, but NO concentration changes due to anthropogenic contamination [70]. Samples from pre-heating and heating periods showed the same decreasing trend of NO and Cl concentration, as shown in Figure 6C. In particular, NO contamination was influenced by anthropogenic inputs from either surface contaminants, such as animal feces, or shallow groundwater contamination due to mixing with surface water. Nevertheless, nitrogen isotope analysis should be performed to accurately identify the NO source.
4.4. Mixing Ratio (Cl, Na, and Sr)
To interpret mixing processes in geothermal fluids, conservative ion (Cl) and strontium isotope ratios (Sr/Sr) were used to calculate mixing ratios. It is important to identify the actual groundwater distribution at the field site depending on hybrid GWHP. For the Cl tracer, the general mass-balance equations were used to calculate the mixing ratios for each sample:
where C and C are the concentrations of the first and second end-members, respectively, and C is the concentration in the target groundwater well. For five scenarios, SP1-1 and KH1-2, and SP1-1 and KH1-3 were used as end-members before heating operations, SP2-1 and SP 2-3 were used as end-members during heating operations, and SP3-1 and KH3-2, and SP3-1 and KH3-3 were used as end-members before cooling operations. The mixing ratio was determined using the temperature change data and the Piper diagram. The KH well was selected as one end-member because the heating operation changed its hydrochemical conditions with respect to the SP well. Based on the previous discussion, the SP well seems to be influenced by shallower (to 90 m depth) groundwater and deeper groundwater (to 150 m depth) and the submerged pump of hybrid GWHP located at about 50 m depth. For this reason, this mixing calculation was carried out at 60 m and 120 m depths to suggest mixed two types of groundwater condition.
The results of the calculated mixing ratios for each groundwater well are shown in Table 2, in which the mixing ratios of SP1-2, SP1-4, SP3-2 and SP3-4 samples reflected the mixing between KH and SP wells because the temperature co-fluctuated in the KH and SP wells. At 120 m, SP1-4 (target site) had a larger portion of KH1-3 than SP1-1 before heating operation. In addition, before cooling operation, SP3-4 (target site) also had a high portion of KH3-3 at 120 m similar to the results before heating operation. These two seasons showed the influence of mixing from the deep groundwater system. Compared to these results, there was little difference between the Cl values in groundwater wells during heating operation, indicating dominant vertical mixing which is attributed to the depth of groundwater pumping during heating operation. The mixing ratios are not considered in the results from during heating operation due to the minimal difference between the values.
To interpret the mixing processes using Cl, strontium isotope ratio data was also included because the Sr/Sr is changed by the half-life [55,63] and can infer a pristine hydrochemical condition without anthropogenic influence following binary mixing model as follows:
where (Sr/Sr) is the Sr/Sr ratio in target groundwater well, [Sr] is the strontium concentration in target groundwater well, (Sr/Sr) and (Sr/Sr) represent the Sr/Sr ratios of the first and second end-members, respectively, and [Sr] and [Sr] are the strontium concentrations of the first and second end-members. The symbol f represents the fraction of the first end-member. Because the strontium isotope data of the samples were obtained before and during heating operations, these samples were adapted for the calculations: SP1-1 and KH1-2, and SP1-1 and KH1-3 were used as end-members before heating operation, and SP2-1 and SP2-3 were used as end-members during heating operation. The small difference between the SP wells, compared to the values before heating operation, also indicated active vertical mixing in the SP well during heating operations. Moreover, before heating operations, the mixing ratios of SP1-1 and SP1-4 exhibited active mixing with the KH well at 120 m, in accordance with the results from Cl data. Although the Cl and strontium isotope ratios show different range of mixing ratios, the strontium isotope ratios could be a useful support indicator because of the advantage for mixing processes interpretation from deep source.
4.5. Variation of Saturation Index with Increasing Temperature
In the case of a vertical closed-loop system installed at another research building and in operation since 2006, temperatures in the groundwater and the circulating fluid appear to be increased by approximately 2 C in ten years. Depending on the hydrochemical conditions, GWHP operation might promote scaling or corrosion because calcium carbonate scales are common in low-temperature environments, and their solubility line changes with variations in pH and temperature [71,72,73]. Accumulation of scale fragments causes clogging of GWHP systems which may reduce the energy efficiency and life span of the facility. The Langelier Saturation Index (LSI) and the Ryznar Stability Index (RSI) are commonly used to evaluate the dissolution or precipitation of carbonate scales. The LSI is frequently used to predict whether carbonate scales are precipitated or dissolved within a pH range of 6.5–9.5 [47,73]. It is calculated as the difference between actual pH and theoretical pH, as follows [47]:
where pH is actual pH, and pHs is the theoretical pH under CaCO equilibrium conditions. A positive LSI value indicates calcite precipitation in conditions of oversaturation, and a negative value indicates dissolution of calcite in conditions of undersaturation. An LSI value of zero represents the carbonate equilibrium condition in groundwater. The RSI is used in a similar manner, and can be calculated as follows [73]:
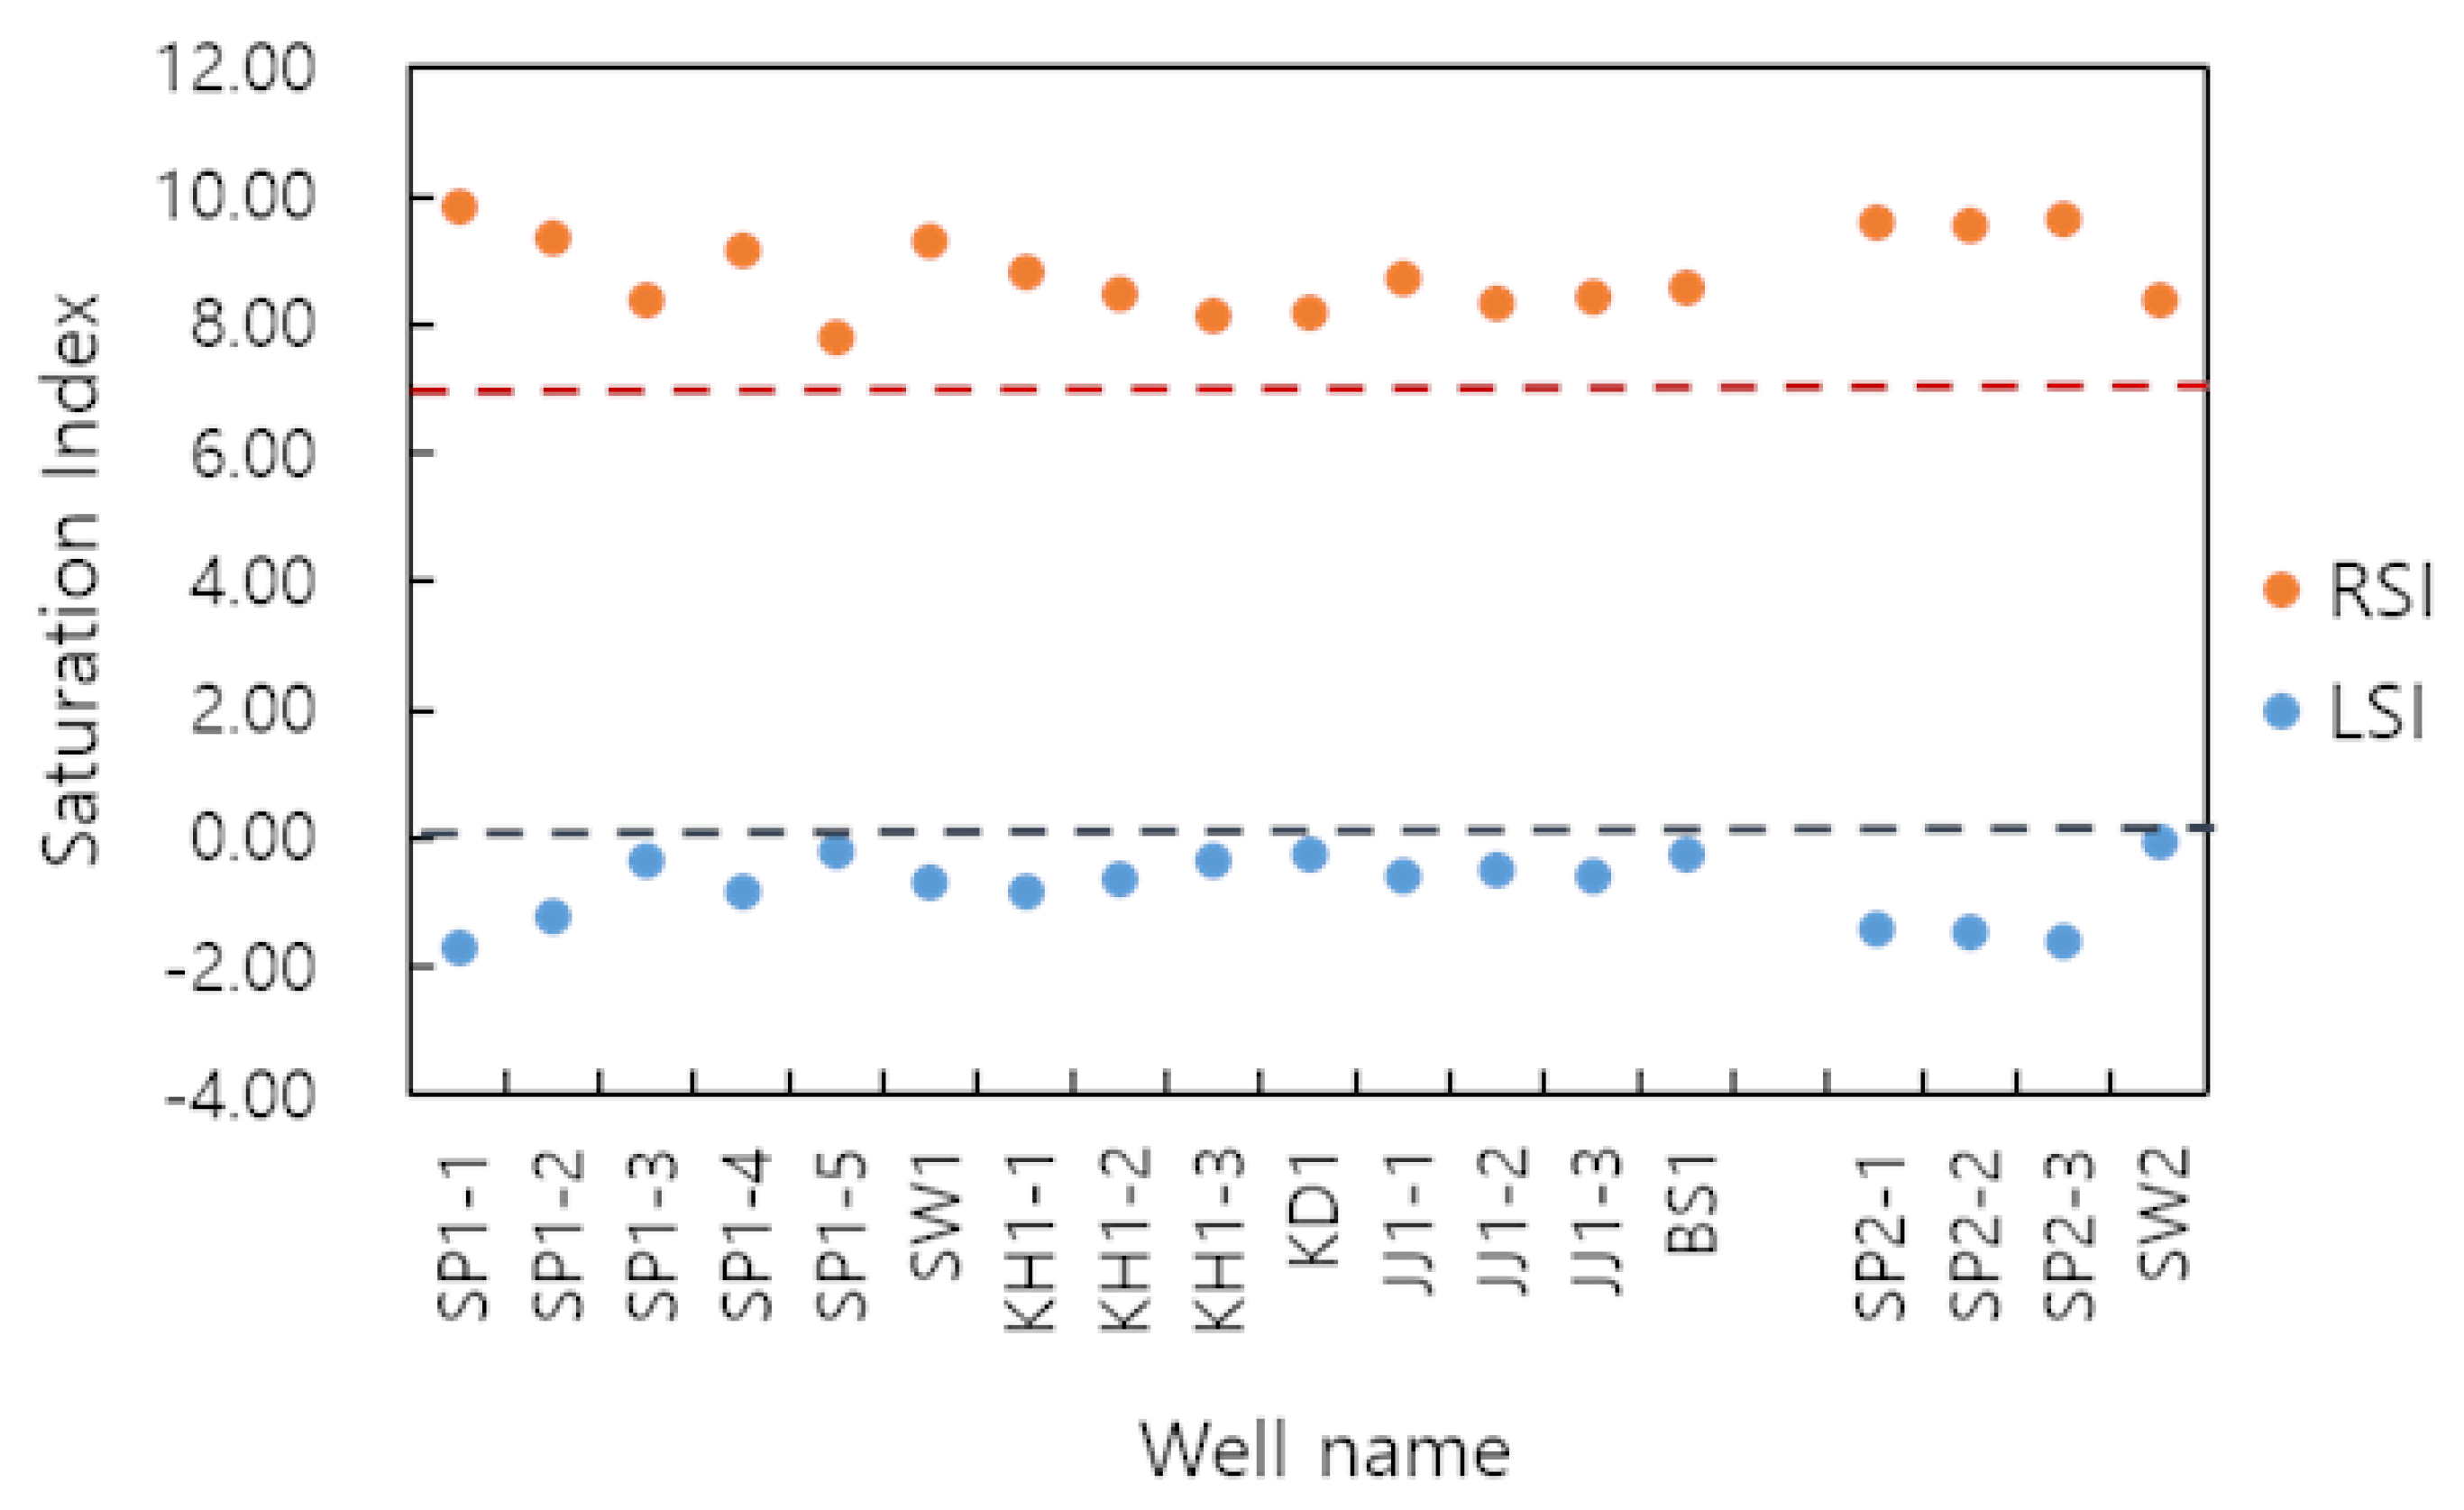
In general, RSI index < 6 means that the groundwater has scaling potential, RSI between 6 and 7 indicates carbonate equilibrium, and RSI > 7 suggests that the groundwater has corrosive potential [47]. Using the calculated LSI and RSI, the carbonate mineral saturation index of the groundwater of the study site can be expressed as shown in Figure 7.
The calculated values of both LSI (between −2 and 0) and RSI (between 8 and 10) indicate favorable conditions for carbonate dissolution. The saturation index (SI) determines the equilibrium condition between water and minerals according to physical and chemical conditions, such as the ion concentration, pH, oxidation-reduction potential (Eh), pressure, and temperature. Moreover, groundwater contains various conjugate acids and bases dissolved from bedrock minerals, such as H, OH, SO, and Cl. For these reasons, computer programs MINTEQA2 [74] and PHREEQC [75] were used to model thermodynamic properties. The basic formula for calculating SI is as follows:
where IAP is derived by multiplying the ionic activity values of dissolved ion species, and is an equilibrium constant, derived by multiplying the solubility product of water under equilibrium.
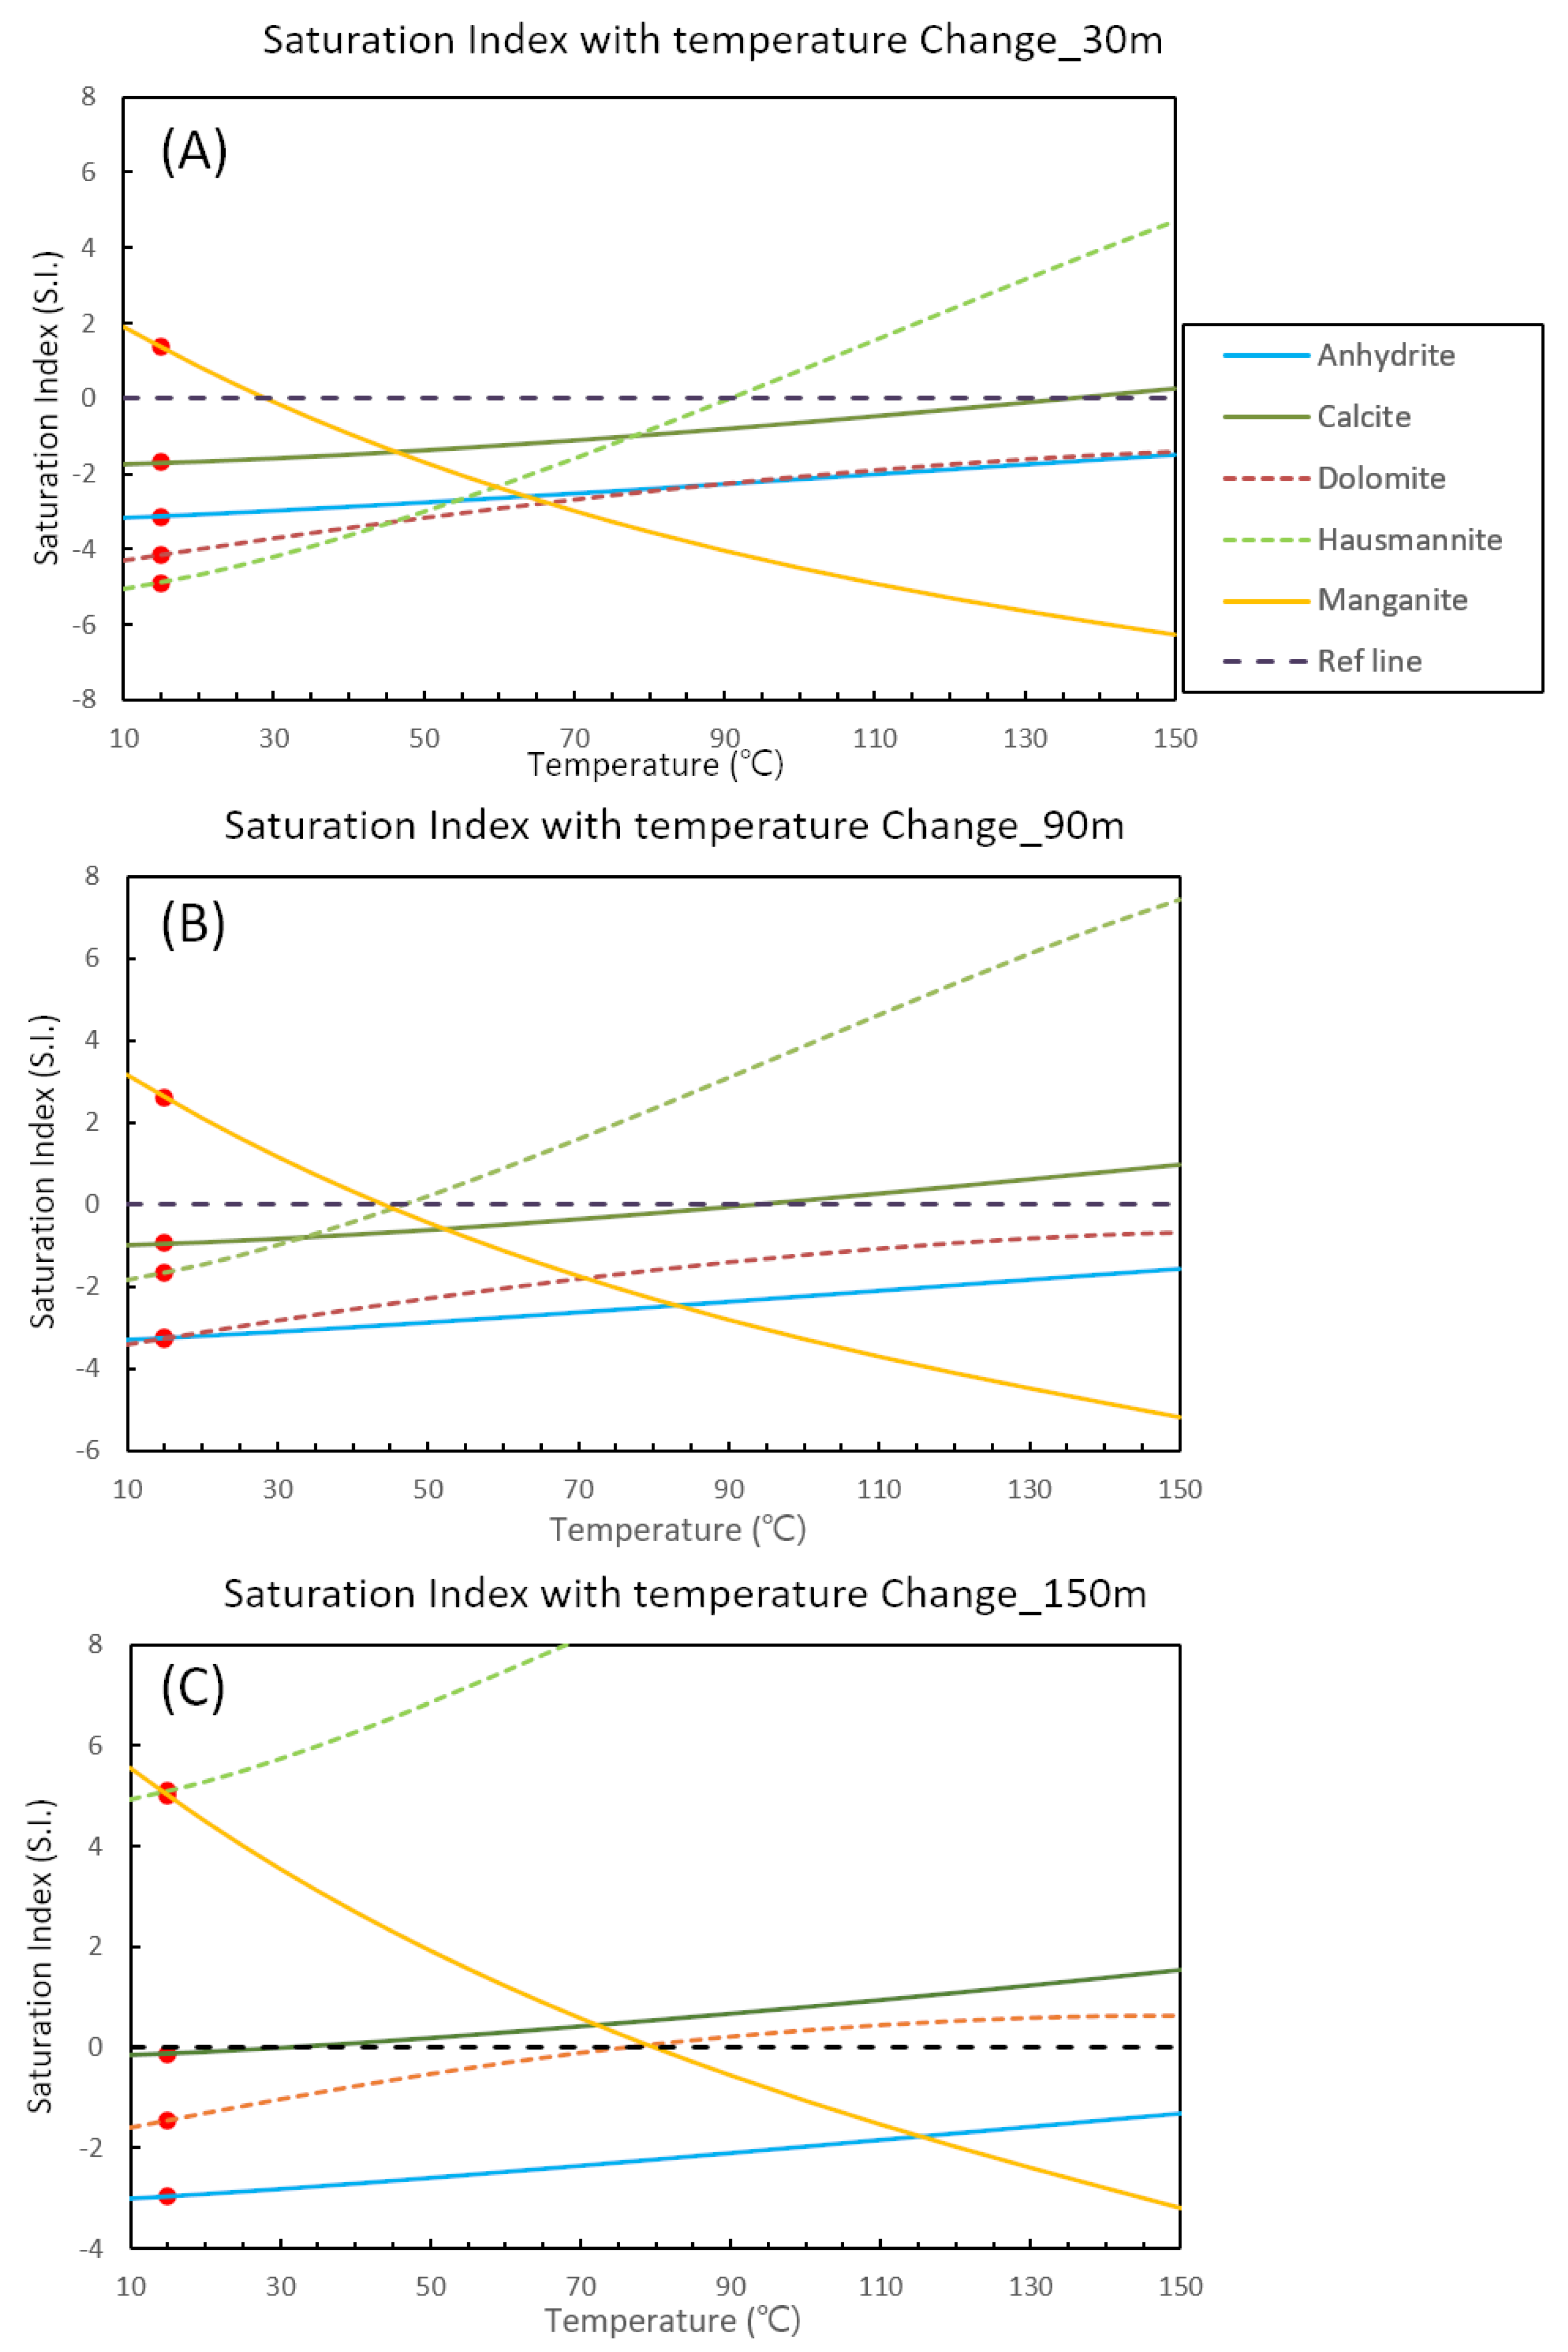
Figure 8 shows the results of mineral saturation indices with depth according to temperature changes based on data collected in January. The correlation between the actual measured values (red dots in Figure 8) and predicted values was determined using PHREEQC. In addition, as the concentration of dissolved components varied with depth, the predicted SI values also differed. As the temperature increase, manganite (MnO(OH)) begins to dissolve at 30 m depth, where the groundwater temperature exceeds 30 C. However, hausmannite (MnO) and calcite (CaCO) begins to precipitate at temperature above 95 °C and 135 C, respectively. At a 90 m depth, where the groundwater temperature exceeds 45 C, the SI of Mn hydroxide minerals (hausmannite and manganite) are reversed, and precipitation is inferred to have become dominant. At a depth of 150 m, manganite begins to dissolve, but dolomite precipitates at temperatures of >80 C. In this case, calcite scaling is simulated to have occurred at temperatures >30 C, because at this depth (150 m) the Ca concentration is considered to be higher than at shallower depths. From the calculated results, the SI of manganese oxides is the most sensitive to temperature change. It is possible to predict the mineral species which can be precipitated in the GWHP system from the temperature change in the aquifer. This approach is based on thermodynamic constants. To make a more realistic prediction of the saturation condition of various minerals, however, rate constants are also required.
5. Conclusions
The operation of shallow geothermal pump systems, including groundwater pumping and re-injection, affects the hydrochemical properties of groundwater. As dissolution or precipitation of secondary minerals may be induced, it is important to monitor hydrochemical variations during GWHP operation and termination. We conducted hydrochemical monitoring in a GWHP site, with samples collected before heating (stabilizing), during heating (mixing), and before cooling (stabilizing) operations. The results of the hydrochemical analysis revealed the low possibility of horizontal mixing between surface water and the GWHP system, because of the casing depth of the wells and the low density of fracture connection to the stream. However, the KH well located in the northwest of the study area showed water level fluctuations similar to those of the geothermal well. The water temperature also fluctuated with changes in the operation of the GWHP system.
From the major ion distribution and Sr/Sr values, these two wells were found to be connected by fracture arrays as a flow path. Evidence from Sr/Sr values and the distribution of major ions suggests that hydrochemically pristine groundwater may be present at a depth of 90 m, which corresponds to SP1-3. At this site, the shallow groundwater, i.e., above 90 m depth, is believed to be affected by anthropogenic pollutants such as NaCl, which is used as a surface management material. Deep groundwater, i.e., below 90 m depth, is regarded as more advanced groundwater, considering the long-distance flow affected by water-rock interaction. The groundwater mixing ratio of the study area reflects the actual groundwater distribution at the field site depending on GWHP operation. The mixing ratio with depth of the SP well, calculated with two tracers (Cl and Sr/Sr), indicates active vertical mixing during the heating operation period. Compared to the values before heating or cooling operation, the SP well shows that the mixing ratios of SP1-1 and SP1-4 exhibited active mixing with the KH well at 120 m, thus, demonstrating the usefulness of quantitative interpretation.
The LSI and RSI values represent that the hydrochemical conditions of the study site favor carbonate dissolution. However, if the groundwater temperature increases above 30 C due to the operation of the geothermal well, the hydrochemical conditions favor manganite dissolution at a depth of 30 m (SP1-1). At a depth of 90 m (SP1-3) and a temperature >45 C, conditions favor manganite and hausmannite dissolution, whereas at a depth of 150 m depth (SP1-5) and a temperature >80 C, manganite dissolution is expected. In contrast, calcite clogging is expected when the temperature exceeds 30 C at this depth (150 m), where the Ca ion concentration is believed to be high. Our results suggest that the hydrochemistry and water temperature are strongly affected by the operation of geothermal wells. Long-term monitoring of these wells should, therefore, be carried out in the future.
Author Contributions
H.C.: Conceptualization, Methodology, Data curation, Formal analysis, Investigation, Writing—original draft; J.K.: Validation, Formal analysis, Writing—draft; B.O.S.: Data curation, Validation, Formal analysis, Writing & editing; D.-h.K.: Data collection, Writing—review & editing. All authors have read and agreed to the published version of the manuscript.
Funding
This research was supported by the Basic Research Project of Korea Institute of Geoscience and Mineral Resources (KIGAM).
Acknowledgments
This work was supported by the Basic Research Project (20-3411) of the Korea Institute of Geoscience and Mineral Resources (KIGAM) funded by the Ministry of Science and ICT (MSIT). We thanks to the other members of Groundwater Research Center in KIGAM for their help on system setup and operation, data acquisition and sample analysis.
Conflicts of Interest
The authors declare no conflict of interest.
Abbreviations
The following abbreviations are used in this manuscript:
| GWHP | Groundwater Heat Pump |
| GSHP | Ground Source Heat Pump |
| ATES | Aquifer Thermal Energy Storage |
| BHE | Borehole Heat Exchanger |
| LSI | Langelier Saturation Index |
| RSI | Ryznar Stability Index |
Appendix A

Table A1.
The monitored altitude of study spots and groundwater level of wells in the study area.
| Site | Altitude (MASL) | Depth to Water (m) | Groundwater Level (m) | ||||
|---|---|---|---|---|---|---|---|
| January 2019 | February 2019 | June 2019 | January 2019 | February 2019 | June 2019 | ||
| SP | 46 | 5.52 | 15.2 | 5.58 | 40.48 | 30.8 | 40.42 |
| KH | 49 | 6.04 | 2.58 | 42.96 | 46.42 | ||
| KD | 53 | 2.26 | - | 50.74 | - | ||
| JJ | 48 | 5.24 | 5.64 | 42.76 | 42.36 | ||
| BS | 46 | 3.11 | 3.43 | 42.89 | 42.57 | ||
| SW | 45 | 0 | 0 | 0 | 45 | 45 | |
References
- Cuthbert, M.; Gleeson, T.; Moosdorf, N.; Befus, K.; Schneider, A.; Hartmann, J.; Lehner, B. Global patterns and dynamics of climate–Groundwater interactions. Nat. Clim. Chang. 2019, 9, 137–141. [Google Scholar] [CrossRef]
- Benz, S.A.; Bayer, P.; Blum, P. Global patterns of shallow groundwater temperatures. Environ. Res. Lett. 2017, 12, 034005. [Google Scholar] [CrossRef]
- Sørensen, B. A history of renewable energy technology. Energy Policy 1991, 19, 8–12. [Google Scholar] [CrossRef]
- Kim, J.S.; Song, S.H.; Jeong, G.C.; Cha, J.H. Analysis of Economic Feasibility and Reductions of Carbon Dioxide Emission of Geothermal Heating and Cooling System using Groundwater. J. Eng. Geol. 2015, 25, 599–612. [Google Scholar] [CrossRef]
- Karytsas, S.; Choropanitis, I. Barriers against and actions towards renewable energy technologies diffusion: A Principal Component Analysis for residential ground source heat pump (GSHP) systems. Renew. Sustain. Energy Rev. 2017, 78, 252–271. [Google Scholar] [CrossRef]
- Savaresi, A. The Paris Agreement: A new beginning? J. Energy Nat. Resour. Law 2016, 34, 16–26. [Google Scholar] [CrossRef] [Green Version]
- Blum, P.; Campillo, G.; Münch, W.; Kölbel, T. CO2 savings of ground source heat pump systems—A regional analysis. Renew. Energy 2010, 35, 122–127. [Google Scholar] [CrossRef]
- Bayer, P.; Saner, D.; Bolay, S.; Rybach, L.; Blum, P. Greenhouse gas emission savings of ground source heat pump systems in Europe: A review. Renew. Sustain. Energy Rev. 2012, 16, 1256–1267. [Google Scholar] [CrossRef]
- Müller, J.; Galgaro, A.; Dalla Santa, G.; Cultrera, M.; Karytsas, C.; Mendrinos, D.; Pera, S.; Perego, R.; O’Neill, N.; Pasquali, R.; et al. Generalized Pan-European Geological Database for Shallow Geothermal Installations. Geosciences 2018, 8, 32. [Google Scholar] [CrossRef] [Green Version]
- Rybach, L.; Eugster, W.J. Sustainability aspects of geothermal heat pump operation, with experience from Switzerland. Geothermics 2010, 39, 365–369. [Google Scholar] [CrossRef]
- Rees, S. Advances in Ground-Source Heat Pump Systems; Woodhead Publishing: Sawston, UK, 2016. [Google Scholar]
- Chiasson, A.D. Geothermal Heat Pump and Heat Engine Systems: Theory and Practice; John Wiley & Sons: Hoboken, NJ, USA, 2016. [Google Scholar]
- Busby, J.; Lewis, M.; Reeves, H.; Lawley, R. Initial geological considerations before installing ground source heat pump systems. Q. J. Eng. Geol. Hydrogeol. 2009, 42, 295–306. [Google Scholar] [CrossRef]
- García-Gil, A.; Vázquez-Suñe, E.; Schneider, E.G.; Sánchez-Navarro, J.Á.; Mateo-Lázaro, J. Relaxation factor for geothermal use development–Criteria for a more fair and sustainable geothermal use of shallow energy resources. Geothermics 2015, 56, 128–137. [Google Scholar] [CrossRef]
- Liu, X.; Hughes, P.; Spitler, J.; Anderson, A. Updated assessment of the technical potential of geothermal heat pump applications in the United States. In Proceedings of the IGSHPA Technical/Research Conference and Expo 2017; International Ground Source Heat Pump Association: Stillwater, OK, USA, 2017. [Google Scholar]
- Lund, J.W.; Boyd, T.L. Direct utilization of geothermal energy 2015 worldwide review. Geothermics 2016, 60, 66–93. [Google Scholar] [CrossRef]
- Zheng, K.; Mo, Y.; Chen, L. Twenty years of geothermal heat pumps in China. In Proceedings of the World Geothermal Congress 2015, Melbourne, Australia, 16–24 April 2015. [Google Scholar]
- Abesser, C.; Lewis, M.A.; Marchant, A.P.; Hulbert, A.G. Mapping suitability for open-loop ground source heat pump systems: A screening tool for England and Wales, UK. Q. J. Eng. Geol. Hydrogeol. 2014, 47, 373–380. [Google Scholar] [CrossRef] [Green Version]
- Farabi-Asl, H.; Chapman, A.; Itaoka, K.; Noorollahi, Y. Ground source heat pump status and supportive energy policies in Japan. Energy Procedia 2019, 158, 3614–3619. [Google Scholar] [CrossRef]
- Lee, J.Y. Current status of ground source heat pumps in Korea. Renew. Sustain. Energy Rev. 2009, 13, 1560–1568. [Google Scholar] [CrossRef]
- Lu, Q.; Narsilio, G.A.; Aditya, G.R.; Johnston, I.W. Economic analysis of vertical ground source heat pump systems in Melbourne. Energy 2017, 125, 107–117. [Google Scholar] [CrossRef]
- Santos, A.F.; de Souza, H.J.; Cantao, M.P.; Gaspar, P.D. Analysis of geothermal temperatures for heat pumps application in Paraná (Brasil). Open Eng. 2016, 6. [Google Scholar] [CrossRef]
- Raymond, J.; Malo, M.; Tanguay, D.; Grasby, S.; Bakhteyar, F. Direct utilization of geothermal energy from coast to coast: A review of current applications and research in Canada. In Proceedings of the World Geothermal Congress 2015, Melbourne, Australia, 16–24 April 2015. [Google Scholar]
- Hecht-Méndez, J.; Molina-Giraldo, N.; Blum, P.; Bayer, P. Evaluating MT3DMS for heat transport simulation of closed geothermal systems. Groundwater 2010, 48, 741–756. [Google Scholar] [CrossRef]
- Kim, H.; Nam, Y.; Jeoun, O.; mu Bae, S. Development of a Multi-Well Pairing System for Groundwater Heat Pump Systems. Energies 2018, 11, 3485. [Google Scholar] [CrossRef] [Green Version]
- Haehnlein, S.; Bayer, P.; Blum, P. International legal status of the use of shallow geothermal energy. Renew. Sustain. Energy Rev. 2010, 14, 2611–2625. [Google Scholar] [CrossRef]
- Lee, J.Y.; Won, J.H.; Hahn, J.S. Evaluation of hydrogeologic conditions for groundwater heat pumps: Analysis with data from national groundwater monitoring stations. Geosci. J. 2006, 10, 91. [Google Scholar] [CrossRef]
- Saito, T.; Hamamoto, S.; Ueki, T.; Ohkubo, S.; Moldrup, P.; Kawamoto, K.; Komatsu, T. Temperature change affected groundwater quality in a confined marine aquifer during long-term heating and cooling. Water Res. 2016, 94, 120–127. [Google Scholar] [CrossRef]
- Vienken, T.; Kreck, M.; Dietrich, P. Monitoring the impact of intensive shallow geothermal energy use on groundwater temperatures in a residential neighborhood. Geotherm. Energy 2019, 7, 8. [Google Scholar] [CrossRef]
- Fleuchaus, P.; Godschalk, B.; Stober, I.; Blum, P. Worldwide application of aquifer thermal energy storage—A review. Renew. Sustain. Energy Rev. 2018, 94, 861–876. [Google Scholar] [CrossRef]
- Rad, F.M.; Fung, A.S.; Rosen, M.A. An integrated model for designing a solar community heating system with borehole thermal storage. Energy Sustain. Dev. 2017, 36, 6–15. [Google Scholar] [CrossRef]
- Hähnlein, S.; Bayer, P.; Ferguson, G.; Blum, P. Sustainability and policy for the thermal use of shallow geothermal energy. Energy Policy 2013, 59, 914–925. [Google Scholar] [CrossRef]
- Belitz, K.; Jurgens, B.; Johnson, T. Potential Corrosivity of Untreated Groundwater in the United States; Scientific Investigations Report 2016-5092; US Geological Survey: Reston, VA, USA, 2016. [Google Scholar]
- Brons, H.; Griffioen, J.; Appelo, C.; Zehnder, A. (Bio) geochemical reactions in aquifer material from a thermal energy storage site. Water Res. 1991, 25, 729–736. [Google Scholar] [CrossRef]
- Ferguson, G. Unfinished business in geothermal energy. GroundWater 2009, 47, 167. [Google Scholar] [CrossRef]
- Bonte, M. Impacts of Shallow Geothermal Energy on Groundwater Quality; Iwa Publishing: London, UK, 2015. [Google Scholar]
- Bonte, M.; Stuyfzand, P.; Van den Berg, G.; Hijnen, W. Effects of aquifer thermal energy storage on groundwater quality and the consequences for drinking water production: A case study from the Netherlands. Water Sci. Technol. 2011, 63, 1922–1931. [Google Scholar] [CrossRef] [Green Version]
- Sowers, L.; York, K.P.; Stiles, L. Impact of Thermal Buildup on Groundwater Chemistry and Aquifer Microbes. Proceedings of Ecostock. 2006. Available online: http://citeseerx.ist.psu.edu/viewdoc/download?doi=10.1.1.572.673&rep=rep1&type=pdf (accessed on 13 May 2020).
- Zuurbier, K.G.; Hartog, N.; Valstar, J.; Post, V.E.; van Breukelen, B.M. The impact of low-temperature seasonal aquifer thermal energy storage (SATES) systems on chlorinated solvent contaminated groundwater: Modeling of spreading and degradation. J. Contam. Hydrol. 2013, 147, 1–13. [Google Scholar] [CrossRef]
- Possemiers, M.; Huysmans, M.; Batelaan, O. Influence of Aquifer Thermal Energy Storage on groundwater quality: A review illustrated by seven case studies from Belgium. J. Hydrol. Reg. Stud. 2014, 2, 20–34. [Google Scholar] [CrossRef]
- Freedman, V.L.; Waichler, S.R.; Mackley, R.D.; Horner, J.A. Assessing the thermal environmental impacts of an groundwater heat pump in southeastern Washington State. Geothermics 2012, 42, 65–77. [Google Scholar] [CrossRef]
- Griffioen, J.; Appelo, C.A.J. Nature and extent of carbonate precipitation during aquifer thermal energy storage. Appl. Geochem. 1993, 8, 161–176. [Google Scholar] [CrossRef]
- Jesußek, A.; Grandel, S.; Dahmke, A. Impacts of subsurface heat storage on aquifer hydrogeochemistry. Environ. Earth Sci. 2013, 69, 1999–2012. [Google Scholar] [CrossRef]
- Holm, T.R.; Eisenreich, S.J.; Rosenberg, H.L.; Holm, N.P. Groundwater geochemistry of short-term aquifer thermal energy storage test cycles. Water Resour. Res. 1987, 23, 1005–1019. [Google Scholar] [CrossRef]
- Perlinger, J.A.; Almendinger, J.E.; Urban, N.R.; Eisenreich, S.J. Groundwater geochemistry of aquifer thermal energy storage: Long-term test cycle. Water Resour. Res. 1987, 23, 2215–2226. [Google Scholar] [CrossRef]
- Bonte, M. Impacts of Shallow Geothermal Energy on Groundwater Quality: A Hydrochemical and Geomicrobial Study of the Effects of Ground Source Heat Pumps and Aquifer Thermal Energy Storage. Ph.D. Thesis, Vrije Universiteit, Amsterdam, The Netherlands, 2013. [Google Scholar]
- Rafferty, K. Scaling in Geothermal Heat Pump Systems; Geo-Heat Center: Klamath Falls, OR, USA, 1999. [Google Scholar]
- Dehghani, M.; Kashtgar, L.; Davoodi, S.; Shamsedini, N.; Zaravar, F. Data on the trend of corrosivity and scale formation potential of Shiraz groundwater drinking water resources during 2001–2007. Data Brief 2019, 23, 103736. [Google Scholar] [CrossRef]
- Watzlaf, G.R.; Ackman, T.E. Underground mine water for heating and cooling using geothermal heat pump systems. Mine Water Environ. 2006, 25, 1–14. [Google Scholar] [CrossRef]
- Abesser, C. Open-Loop Ground Source Heat Pumps and Groundwater Systems: A Literature Review of Current Applications, Regulations and Problems; British Geological Survey: Nottingham, UK, 2010; 23p. [Google Scholar]
- Park, Y.; Kim, N.; Lee, J.Y. Geochemical properties of groundwater affected by open loop geothermal heat pump systems in Korea. Geosci. J. 2015, 19, 515–526. [Google Scholar] [CrossRef]
- Négrel, P.; Fouillac, C.; Brach, M. A strontium isotopic study of mineral and surface waters from the Cézallier (Massif Central, France): Implications for mixing processes in areas of disseminated emergences of mineral waters. Chem. Geol. 1997, 135, 89–101. [Google Scholar] [CrossRef]
- Christensen, J.N.; Dafflon, B.; Shiel, A.E.; Tokunaga, T.K.; Wan, J.; Faybishenko, B.; Dong, W.; Williams, K.H.; Hobson, C.; Brown, S.T.; et al. Using strontium isotopes to evaluate the spatial variation of groundwater recharge. Sci. Total Environ. 2018, 637, 672–685. [Google Scholar] [CrossRef] [Green Version]
- Marques, J.; Carreira, P.; Goff, F.; Eggenkamp, H.; da Silva, M.A. Input of 87Sr/86Sr ratios and Sr geochemical signatures to update knowledge on thermal and mineral waters flow paths in fractured rocks (N-Portugal). Appl. Geochem. 2012, 27, 1471–1481. [Google Scholar] [CrossRef]
- Shand, P.; Darbyshire, D.; Love, A.; Edmunds, W. Sr isotopes in natural waters: Applications to source characterisation and water–rock interaction in contrasting landscapes. Appl. Geochem. 2009, 24, 574–586. [Google Scholar] [CrossRef]
- Casasso, A.; Sethi, R. Assessment and Minimization of Potential Environmental Impacts of Ground Source Heat Pump (GSHP) Systems. Water 2019, 11, 1573. [Google Scholar] [CrossRef] [Green Version]
- Holm, T.R.; Lu, X.; Larson, D.R. Feasibility of Groundwater Source Heat Pumps for Space Heating and Cooling in Mason County and the American Bottoms Area, Illinois; Technical Report; Illinois Sustainable Technology Center: Champaign, IL, USA, 2015. [Google Scholar]
- Park, H.; Lee, J.; Cheong, J. Explanatory Text of the Geological Map of Yuseong Sheet; Korea Research Institute of Geoscience and Mineral Resources: Daejeon, Korea, 1977. [Google Scholar]
- Appelo, C.A.J.; Postma, D. Geochemistry, Groundwater and Pollution; CRC Press: Boca Raton, FL, USA, 2004. [Google Scholar]
- Rajesh, R.; Brindha, K.; Murugan, R.; Elango, L. Influence of hydrogeochemical processes on temporal changes in groundwater quality in a part of Nalgonda district, Andhra Pradesh, India. Environ. Earth Sci. 2012, 65, 1203–1213. [Google Scholar] [CrossRef]
- Sajil Kumar, P.; James, E. Identification of hydrogeochemical processes in the Coimbatore district, Tamil Nadu, India. Hydrol. Sci. J. 2016, 61, 719–731. [Google Scholar] [CrossRef]
- Karunanidhi, D.; Aravinthasamy, P.; Deepali, M.; Subramani, T.; Roy, P.D. The effects of geochemical processes on groundwater chemistry and the health risks associated with fluoride intake in a semi-arid region of South India. RSC Adv. 2020, 10, 4840–4859. [Google Scholar] [CrossRef] [Green Version]
- Raiber, M.; Webb, J.A.; Bennetts, D.A. Strontium isotopes as tracers to delineate aquifer interactions and the influence of rainfall in the basalt plains of southeastern Australia. J. Hydrol. 2009, 367, 188–199. [Google Scholar] [CrossRef]
- Cheong, W.S.; Kim, Y.S.; Na, K.C. SHRIMP zircon U-Pb geochronology, geochemistry and Sr-Nd isotopic study of the Cheongju granitoid rocks. J. Petrol. Soc. Korea 2011, 20, 191–206. [Google Scholar] [CrossRef] [Green Version]
- Harrington, G.; Herczeg, A. The importance of silicate weathering of a sedimentary aquifer in arid Central Australia indicated by very high 87Sr/86Sr ratios. Chem. Geol. 2003, 199, 281–292. [Google Scholar] [CrossRef]
- Bullen, T.D.; Krabbenhoft, D.P.; Kendall, C. Kinetic and mineralogic controls on the evolution of groundwater chemistry and 87Sr/86Sr in a sandy silicate aquifer, northern Wisconsin, USA. Geochim. Cosmochim. Acta 1996, 60, 1807–1821. [Google Scholar] [CrossRef]
- Jeon, S.R.; Nakano, T. Geochemical comparison of stream water, rain water, and watershed geology in Central Korea. Water Air Soil Pollut. 2001, 130, 739–744. [Google Scholar] [CrossRef]
- Walter, J.; Chesnaux, R.; Cloutier, V.; Gaboury, D. The influence of water/rock- water/clay interactions and mixing in the salinization processes of groundwater. J. Hydrol. Reg. Stud. 2017, 13, 168–188. [Google Scholar] [CrossRef]
- Kouadra, R.; Demdoum, A.; Chabour, N.; Benchikh, R. The use of hydrogeochemical analyses and multivariate statistics for the characterization of thermal springs in the Constantine area, Northeastern Algeria. Acta Geochim. 2019, 38, 292–306. [Google Scholar] [CrossRef]
- Ogrinc, N.; Tamše, S.; Zavadlav, S.; Vrzel, J.; Jin, L. Evaluation of geochemical processes and nitrate pollution sources at the Ljubljansko polje aquifer (Slovenia): A stable isotope perspective. Sci. Total Environ. 2019, 646, 1588–1600. [Google Scholar] [CrossRef]
- Gunnlaugsson, E.; Ármannsson, H.; Thorhallsson, S.; Steingrímsson, B. Problems in Geothermal Operation–Scaling and Corrosion; Goethermal Training Program: Iceland, 2014; pp. 1–18. [Google Scholar]
- Boch, R.; Leis, A.; Haslinger, E.; Goldbrunner, J.E.; Mittermayr, F.; Fröschl, H.; Hippler, D.; Dietzel, M. Scale-fragment formation impairing geothermal energy production: Interacting H2S corrosion and CaCO3 crystal growth. Geotherm. Energy 2017, 5, 4. [Google Scholar] [CrossRef] [Green Version]
- Ryznar, J.W. A new index for determining amount of calcium carbonate scale formed by a water. J. Am. Water Works Assoc. 1944, 36, 472–483. [Google Scholar] [CrossRef]
- Allison, J.D.; Brown, D.S.; Novo-Gradac, K.J. MINTEQA2/PRODEFA2, a Geochemical Assessment Model for Environmental Systems: Version 3.0 User’s Manual; US Environmental Protection Agency: Washington, DC, USA, 1991.
- Parkhurst, D.L.; Appelo, C. Description of Input and Examples for PHREEQC Version 3: A Computer Program for Speciation, Batch-Reaction, One-Dimensional Transport, and Inverse Geochemical Calculations; Technical Report; US Geological Survey: Reston, VA, USA, 2013. [Google Scholar]
Figure 1.
Location (A), geology (B), and sampling sites (C) of the study area.

Figure 2.
Schematic diagram of a GWHP testbed with a hybrid BHE. The hybrid BHE consists of a BHE including closed and open systems, and the injection well (A). The structure and rock properties of the observation well are shown in (B).
Figure 2.
Schematic diagram of a GWHP testbed with a hybrid BHE. The hybrid BHE consists of a BHE including closed and open systems, and the injection well (A). The structure and rock properties of the observation well are shown in (B).

Figure 3.
Temperature variation with depth at injection (A) and observation (B) wells from 14 July to 2 September 2019.
Figure 3.
Temperature variation with depth at injection (A) and observation (B) wells from 14 July to 2 September 2019.

Figure 4.
Vertical distributions of EC (A), DO (B), Ca (C), Na (D), HCO (E), and Cl (F) in SP well and SW samples.
Figure 4.
Vertical distributions of EC (A), DO (B), Ca (C), Na (D), HCO (E), and Cl (F) in SP well and SW samples.

Figure 5.
Piper diagram of all samples (A), (Ca+Mg) vs. (SO+HCO) diagram (B), and Cl vs. Na scatter diagram (C).
Figure 5.
Piper diagram of all samples (A), (Ca+Mg) vs. (SO+HCO) diagram (B), and Cl vs. Na scatter diagram (C).

Figure 6.
Sr/Sr vs. 1/Sr distribution in water samples (A), Sr/Sr vs. Ca concentration diagram (B), and Cl vs. NO concentration diagram for water samples (C) before and during heating operation period.
Figure 6.
Sr/Sr vs. 1/Sr distribution in water samples (A), Sr/Sr vs. Ca concentration diagram (B), and Cl vs. NO concentration diagram for water samples (C) before and during heating operation period.

Figure 7.
LSI and RSI distribution in pristine groundwater samples, determined by pH and HCO ion concentration. Dotted line means the equilibrium condition with the CaCO of each index.
Figure 7.
LSI and RSI distribution in pristine groundwater samples, determined by pH and HCO ion concentration. Dotted line means the equilibrium condition with the CaCO of each index.

Figure 8.
Saturation index diagram for samples collected at depths of 30 m (A), 90 m (B), and 150 m (C). This figure shows changes in the saturation degree of target minerals with increasing temperature. Red plots: actual data, which match the modeling results.
Figure 8.
Saturation index diagram for samples collected at depths of 30 m (A), 90 m (B), and 150 m (C). This figure shows changes in the saturation degree of target minerals with increasing temperature. Red plots: actual data, which match the modeling results.

Table 1.
Field-measured values and hydrochemical data of the water samples.
| Condition | ID | Depth | pH | EC | DO | Ca | Mg | Na | K | SiO2 | Sr | Fe | Mn | HCO3 | F | Cl | Br | NO3 | SO4 |
|---|---|---|---|---|---|---|---|---|---|---|---|---|---|---|---|---|---|---|---|
| (m) | S/cm | mg/L | (mg/L) | (g/L) | mg/L | ||||||||||||||
| Before heating operation January 2019 | SW1 | - | 7.97 | 317 | 12.5 | 28.8 | 5.03 | 18.5 | 4.90 | 5.95 | 224 | BDL * | BDL | 75.9 | 0.40 | 17.8 | 0.98 | 7.86 | 36.8 |
| SP1-1 | 30 | 6.40 | 395 | 9.06 | 33.6 | 3.66 | 30.7 | 2.24 | 14.4 | 314 | 4.46 | 2.56 | 85.5 | 0.26 | 73.7 | 0.19 | 10.2 | 11.4 | |
| SP1-2 | 60 | 6.92 | 344 | 4.10 | 38.6 | 2.32 | 21.4 | 1.24 | 13.7 | 183 | 1.74 | 2.33 | 107 | 0.92 | 41.2 | 0.58 | 8.57 | 9.44 | |
| SP1-3 | 90 | 7.64 | 279 | 3.72 | 38.9 | 1.00 | 16.5 | 0.74 | 12.0 | 111 | 3.38 | 1.29 | 124 | 1.09 | 15.6 | 0.86 | 6.79 | 7.51 | |
| SP1-4 | 120 | 7.52 | 359 | 6.95 | 50.0 | 1.62 | 19.8 | 1.21 | 12.0 | 164 | 0.83 | 3.63 | 132 | 0.85 | 28.2 | 0.68 | 7.74 | 10.4 | |
| SP1-5 | 150 | 7.40 | 412 | 7.95 | 60.7 | 2.36 | 21.9 | 1.85 | 12.4 | 220 | 2.21 | 15.4 | 187 | 0.86 | 40.2 | 0.41 | 7.06 | 10.5 | |
| KH1-1 | 30 | 7.19 | 306 | 5.91 | 37.8 | 2.61 | 13.9 | 1.11 | 10.9 | 115 | BDL | BDL | 114 | 0.84 | 13.9 | 0.92 | 1.75 | 10.1 | |
| KH1-2 | 60 | 7.23 | 302 | 3.61 | 37.1 | 2.59 | 13.6 | 1.15 | 10.2 | 115 | BDL | BDL | 67.9 | 1.34 | 29.8 | 1.98 | 3.05 | 22.8 | |
| KH1-3 | 120 | 7.42 | 305 | 2.58 | 37.9 | 2.63 | 13.9 | 1.13 | 11.9 | 118 | BDL | BDL | 114 | 0.91 | 14.3 | 0.90 | 2.20 | 10.2 | |
| KD1 | - | 7.65 | 281 | 20.4 | 34.7 | 2.08 | 10.0 | 0.89 | 11.8 | 157 | BDL | BDL | 133 | 0.69 | 6.07 | 0.07 | 5.04 | 22.0 | |
| JJ1-1 | 30 | 7.48 | 359 | 4.50 | 39.4 | 2.79 | 16.0 | 1.15 | 11.7 | 180 | 75.6 | 34.2 | 115 | 1.00 | 21.2 | 0.05 | 5.50 | 7.19 | |
| JJ1-2 | 60 | 7.34 | 325 | 4.53 | 36.5 | 2.85 | 16.4 | 1.27 | 10.6 | 175 | 191 | 43.1 | 141 | 0.92 | 21.2 | 0.04 | 4.90 | 6.45 | |
| JJ1-3 | 120 | 7.22 | 320 | 4.00 | 39.0 | 2.86 | 16.3 | 1.28 | 11.8 | 186 | 202 | 47.1 | 141 | 0.93 | 21.0 | 0.05 | 5.48 | 7.20 | |
| BS1 | 60 | 8.10 | 190 | 6.59 | 22.4 | 0.67 | 9.72 | 1.31 | 8.23 | 127 | 39.9 | 20.0 | 82.7 | 0.77 | 8.99 | ND ** | 2.39 | 4.98 | |
| Heating operation February 2019 | SW2 | - | 8.21 | 500 | 12.5 | 28.1 | 5.07 | 18.4 | 4.88 | 7.43 | 223 | BDL | BDL | 97.1 | 0.17 | 36.0 | 0.03 | 13.4 | 9.45 |
| SP2-1 | 60 | 6.77 | 355 | 8.76 | 30.7 | 3.30 | 21.4 | 1.85 | 13.2 | 251 | 14.9 | 3.55 | 42.4 | 0.23 | 56.2 | 0.30 | 9.64 | 11.2 | |
| SP2-2 | 90 | 6.60 | 352 | 8.75 | 35.8 | 3.71 | 23.7 | 1.96 | 14.9 | 288 | BDL | BDL | 86.6 | 0.23 | 55.5 | 0.30 | 9.55 | 11.1 | |
| SP2-3 | 120 | 6.46 | 380 | 8.97 | 35.8 | 3.67 | 22.7 | 1.94 | 14.6 | 292 | BDL | BDL | 88.2 | 0.31 | 55.2 | 0.31 | 9.52 | 11.1 | |
| Before cooling operation June 2019 | SW3 | - | 7.63 | 310 | 9.32 | 27.5 | 4.79 | 21.3 | 5.99 | 6.47 | 200 | BDL | BDL | 92.6 | 0.38 | 34.5 | BDL | 9.78 | 14.7 |
| SP3-1 | 30 | 6.29 | 376 | 3.98 | 37.2 | 3.24 | 29.5 | 1.80 | 14.7 | 260 | BDL | BDL | 75.9 | 0.43 | 57.6 | 0.34 | 9.73 | 14.7 | |
| SP3-2 | 60 | 6.32 | 369 | 3.77 | 38.9 | 3.02 | 27.5 | 1.67 | 14.6 | 240 | BDL | BDL | 94.2 | 0.54 | 51.6 | 0.38 | 9.25 | 14.4 | |
| SP3-3 | 90 | 6.52 | 343 | 2.64 | 40.3 | 2.24 | 23.7 | 1.34 | 13.4 | 190 | BDL | BDL | 110 | 0.84 | 38.0 | 0.48 | 8.19 | 13.5 | |
| SP3-4 | 120 | 6.80 | 313 | 2.39 | 41.6 | 1.52 | 20.1 | 1.01 | 12.3 | 150 | BDL | BDL | 123 | 1.08 | 23.4 | 0.58 | 7.77 | 12.5 | |
| SP3-5 | 150 | 5.44 | 328 | 1.79 | 40.3 | 1.21 | 19.3 | 0.85 | 11.7 | 130 | 310 | BDL | 118 | 2.61 | 16.2 | 0.60 | 3.55 | 18.7 | |
| KH3-1 | 30 | 7.14 | 267 | 5.69 | 34.2 | 2.37 | 14.1 | 0.98 | 15.8 | 110 | BDL | BDL | 97.9 | 0.84 | 14.6 | 0.77 | 6.71 | 13.3 | |
| KH3-2 | 60 | 6.80 | 285 | 3.94 | 33.5 | 2.47 | 15.2 | 1.09 | 15.1 | 110 | BDL | BDL | 120 | 0.41 | 7.25 | 0.38 | 3.32 | 6.58 | |
| KH3-3 | 120 | 6.99 | 269 | 6.72 | 36.2 | 2.34 | 15.1 | 1.10 | 15.7 | 110 | BDL | BDL | 139 | 0.17 | 2.94 | 0.18 | 1.11 | 2.66 | |
| KD3 | 7.81 | 278 | 0.30 | 41.6 | 2.44 | 13.6 | 1.08 | 12.1 | 180 | BDL | BDL | 135 | 0.61 | 15.9 | BDL | 0.01 | 8.20 | ||
| JJ3-1 | 30 | 7.44 | 331 | 3.90 | 41.5 | 1.87 | 15.6 | 1.08 | 13.2 | 180 | BDL | BDL | 131 | 1.13 | 14.2 | BDL | 5.28 | 11.0 | |
| JJ3-2 | 60 | 7.49 | 292 | 4.33 | 43.4 | 1.89 | 16.2 | 1.08 | 13.3 | 180 | BDL | BDL | 139 | 1.15 | 14.3 | BDL | 5.30 | 11.3 | |
| JJ3-3 | 120 | 7.51 | 329 | 3.13 | 42.2 | 1.91 | 16.6 | 1.09 | 13.2 | 180 | BDL | BDL | 142 | 1.17 | 14.3 | BDL | 5.28 | 11.3 | |
| BS3 | 60 | 8.03 | 213 | 5.22 | 29.5 | 0.86 | 11.5 | 0.69 | 12.7 | 160 | BDL | BDL | 95.2 | 1.06 | 10.5 | BDL | 3.83 | 7.87 |
* BDL means below detection level which is 0.1 for Fe and Mn, and 0.002 for Br ion. ** ND means that not detected in this sample.
Table 2.
Calculated mixing ratios using conservative Cl ion and Sr/Sr ratio.
| End Member (EM) Mixing | Mixing Indicator | Mixing Ratio | Period | ||||
|---|---|---|---|---|---|---|---|
| EM 1 | EM 2 | Target Site | EM 1 | EM 2 | |||
| Scenario 1 | SP1-1 | KH1-2 | SP1-2 | Before heating operation | |||
| Shallow GW | 73.7 | 13.9 | 41.2 | Cl (mg/L) | 45.7 | 54.3 | |
| mixing at | 0.715785 | 0.716644 | 0.716070 | Sr/Sr | 34.2 | 65.8 | |
| 60 m | 0.314231 | 0.115052 | 0.183277 | Sr (mg/L) | |||
| Scenario 2 | SP1-1 | KH1-3 | SP1-4 | ||||
| Deep GW | 73.7 | 14.3 | 28.2 | Cl (mg/L) | 23.4 | 76.6 | |
| mixing at | 0.715785 | 0.716661 | 0.716288 | Sr/Sr | 23.3 | 76.7 | |
| 120 m | 0.314231 | 0.117828 | 0.163594 | Sr (mg/L) | |||
| Scenario 3 | SP2-1 | SP2-3 | SP2-2 | During heating operation | |||
| Vertical mixing | 56.2 | 55.2 | 55.5 | Cl (mg/L) | 30.0 | 70.0 | |
| 0.715884 | 0.715899 | 0.715889 | Sr/Sr | 10.2 | 89.8 | ||
| 0.251343 | 0.291917 | 0.287779 | Sr (mg/L) | ||||
| Scenario 4 | SP3-1 | KH3-2 | SP3-2 | Cl (mg/L) | 88.1 | 11.9 | Before cooling operation |
| Mixing at 60 m | 57.6 | 7.25 | 51.6 | ||||
| Scenario 5 | SP3-1 | KH3-3 | SP3-4 | Cl (mg/L) | 37.4 | 62.6 | |
| Mixing at 120 m | 57.6 | 2.94 | 23.4 | ||||
© 2020 by the authors. Licensee MDPI, Basel, Switzerland. This article is an open access article distributed under the terms and conditions of the Creative Commons Attribution (CC BY) license (http://creativecommons.org/licenses/by/4.0/).
Share and Cite
MDPI and ACS Style
Choi, H.; Kim, J.; Shim, B.O.; Kim, D.-h. Characterization of Aquifer Hydrochemistry from the Operation of a Shallow Geothermal System. Water 2020, 12, 1377. https://doi.org/10.3390/w12051377
AMA Style
Choi H, Kim J, Shim BO, Kim D-h. Characterization of Aquifer Hydrochemistry from the Operation of a Shallow Geothermal System. Water. 2020; 12(5):1377. https://doi.org/10.3390/w12051377
Chicago/Turabian StyleChoi, Hanna, Jaeyeon Kim, Byoung Ohan Shim, and Dong-hun Kim. 2020. "Characterization of Aquifer Hydrochemistry from the Operation of a Shallow Geothermal System" Water 12, no. 5: 1377. https://doi.org/10.3390/w12051377
Note that from the first issue of 2016, this journal uses article numbers instead of page numbers. See further details here.