Article

Implementing a Statewide Deficit Analysis for Inland Surface Waters According to the Water Framework Directive—An Exemplary Application on Phosphorus Pollution in Schleswig-Holstein (Northern Germany)

1
Institute of Bio- and Geosciences—Agrosphere (IBG-3), Forschungszentrum Jülich GmbH, 52425 Jülich, Germany
2
Department for Water Management, Marine and Coastal Protection; Ministry of Energy, Agriculture, the Environment, Nature and Digitalization Schleswig-Holstein, Mercatorstraße 3, 24106 Kiel, Germany
*
Author to whom correspondence should be addressed.
Water 2020, 12(5), 1365; https://doi.org/10.3390/w12051365
Submission received: 2 April 2020 / Revised: 3 May 2020 / Accepted: 9 May 2020 / Published: 12 May 2020
(This article belongs to the Special Issue Land Use and Water Quality)

Abstract

:
Deficit analysis—which principally deals with the question “how big are the gaps between current water status and good ecological status?”—has become an essential element of the river basin management plans prescribed by the European Water Framework Directive (WFD). In a research project on behalf of the Ministry of Energy, Agriculture, the Environment, Nature and Digitalization Schleswig-Holstein (MELUND), a deficit analysis based on distributed results from the water balance and phosphorus emission model system GROWA-MEPhos at high spatial resolution was performed. The aim was, inter alia, to identify absolute and relative required reduction in total phosphorus at any river segment or lake within the state territory as well as to highlight significant emission sources. The results of the deficit analysis were successfully validated and show an exceedance of the phosphorus target concentrations in 60% of the analyzed subcatchments. Statewide, 269 tons of phosphorus needs to be reduced yearly, which corresponds to approximately 31% of the total emission. Detailed data as well as maps generated by the deficit analysis benefit the planning and implementation of regionally efficient measures, which are indispensable with regard to meeting the environmental quality objectives set by the WFD.

1. Introduction

With the European Water Framework Directive (WFD) 2000/60/EC, the European Union is pursuing a holistic protection and utilization concept for European waters. The fundamental aim is to establish good ecological status in natural waters and good ecological potential in “heavily modified” and “artificial” waters. To achieve this objective, the EU Member States are obliged to draw up river basin management plans at regular intervals. The management plans must contain, inter alia, a summary of significant pressures and impact of human activity on water status, a map of established monitoring networks and results of monitoring programs carried out as well as a summary of binding measures required [1].
In order to properly target their programs of measures, Member States need to identify how measures can be combined in the most cost-effective way to close the gaps between current water status and good ecological status [2]. A deficit analysis—which principally deals with the question “how big are the gaps between current water status and good ecological status?”—needs to be carried out to determine what has to be done to meet the objective, how much time it will take and who will bear the expenses [2,3]. Furthermore, exceptions due to technical impracticability or disproportionate costs can only be duly justified on the basis of this analysis [2]. Further, even where derogations are justified, Member States must ensure that measures are taken to achieve the closest possible approximation to the objective [2]. Acknowledging the importance of the deficit analysis in measure planning processes, the German Working Group on water issues of the Federal States and the Federal Government (LAWA) developed a guidance document for a harmonized approach in the context of nutrient management [3]. The LAWA proposes that the deficit analysis should be carried out for river basin districts as well as their hydrological subareas and not only on basis of nutrient concentrations, but also based on nutrient loads. Monitoring, modeled data or a combination of both can be used in a deficit analysis. Furthermore, for each deficit identified, significant emission sources should be highlighted.
Due to the federal political structure in Germany, the 16 German states are responsible for the implementation of the EU Directives in the water sector [4]. In Schleswig-Holstein, the input of phosphorus into surface waters presents a substantial problem [5]. The physicochemical conditions of surface waters in the state were assessed in 2017 on the basis of monitoring data. The assessment revealed that approximately two-thirds of the river water bodies in Schleswig-Holstein do not comply with the orientation values for total phosphorus, which are stipulated in Annex 7, Ordinance on the Protection of Surface Waters 2016 (OGewV 2016). This result exerts a great pressure on the responsible water management institutions.
Although the results of the monitoring can be used to calculate the distance to good ecological status as a concentration, mg/L, information as the load in tons per year or information about the most significant emission paths are not feasible. It should also be noted that, due to the lack of measurements, some river segments had to be assessed on the basis of neighboring water bodies. Since monitoring data are not available in sufficient quantities for every water body in Schleswig-Holstein, it is advantageous to take model results into account. A prerequisite is that the models are implemented consistently and comprehensively at the state level and all the relevant diffuse and point source inputs are considered. The high-resolution model results by Tetzlaff et al. [6] fulfill these requirements and therefore can be taken into consideration.
Against this background, the main objective of this paper is to develop a method to perform a deficit analysis according to the LAWA for the entire federal state of Schleswig-Holstein based on available data and model results. Inter alia, the following results are to be achieved:
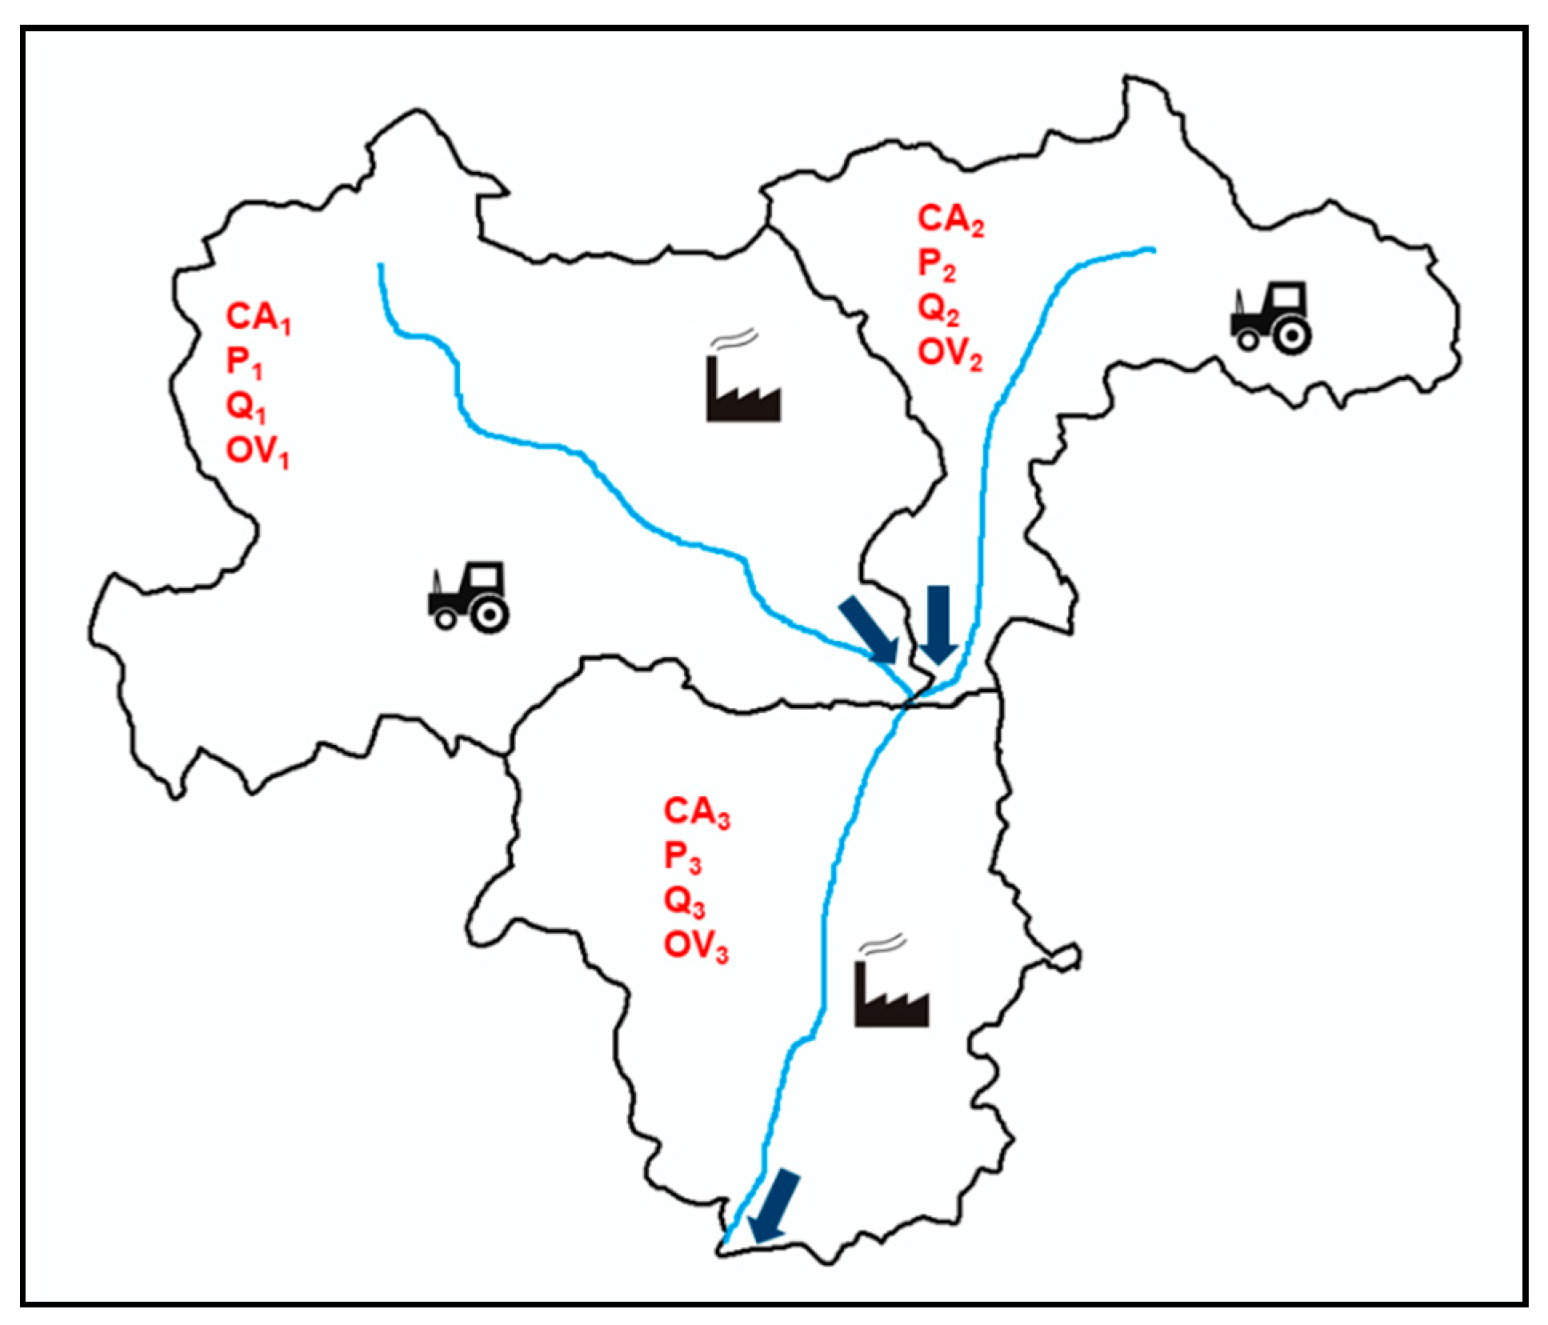
  • Absolute and area-specific phosphorus loads for each subcatchment;
  • Maximum and second-highest input path from a comparison of all paths;
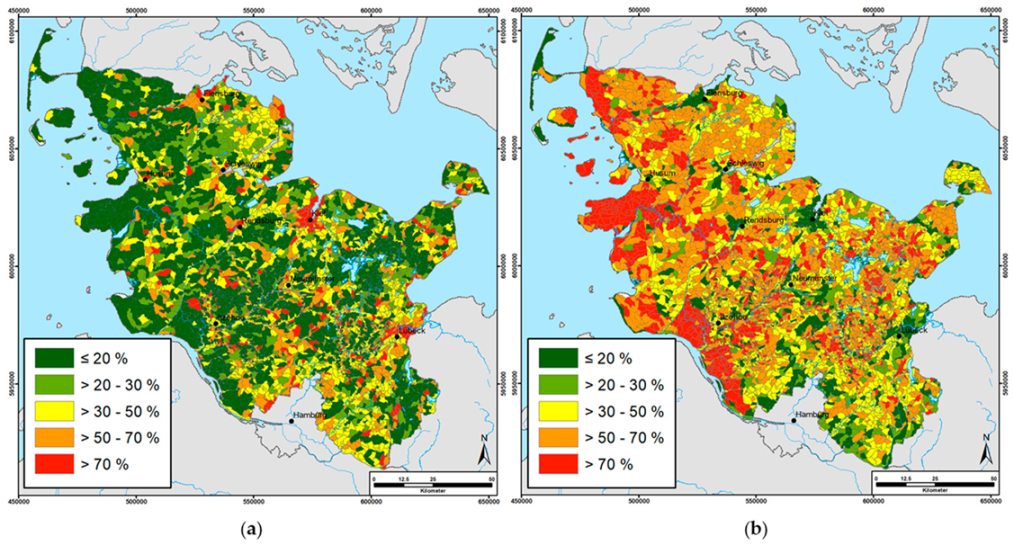
  • Percentage shares of point and diffuse sources for each subcatchment;
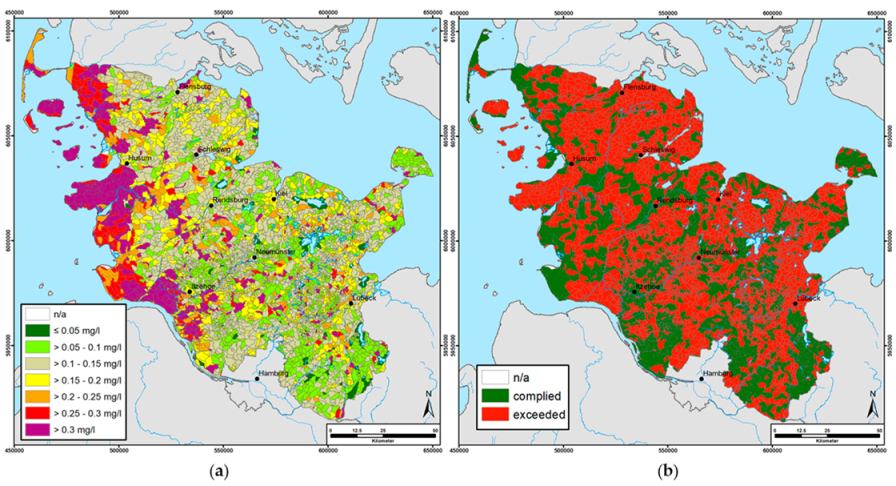
  • Expected phosphorus concentration in each subcatchment;
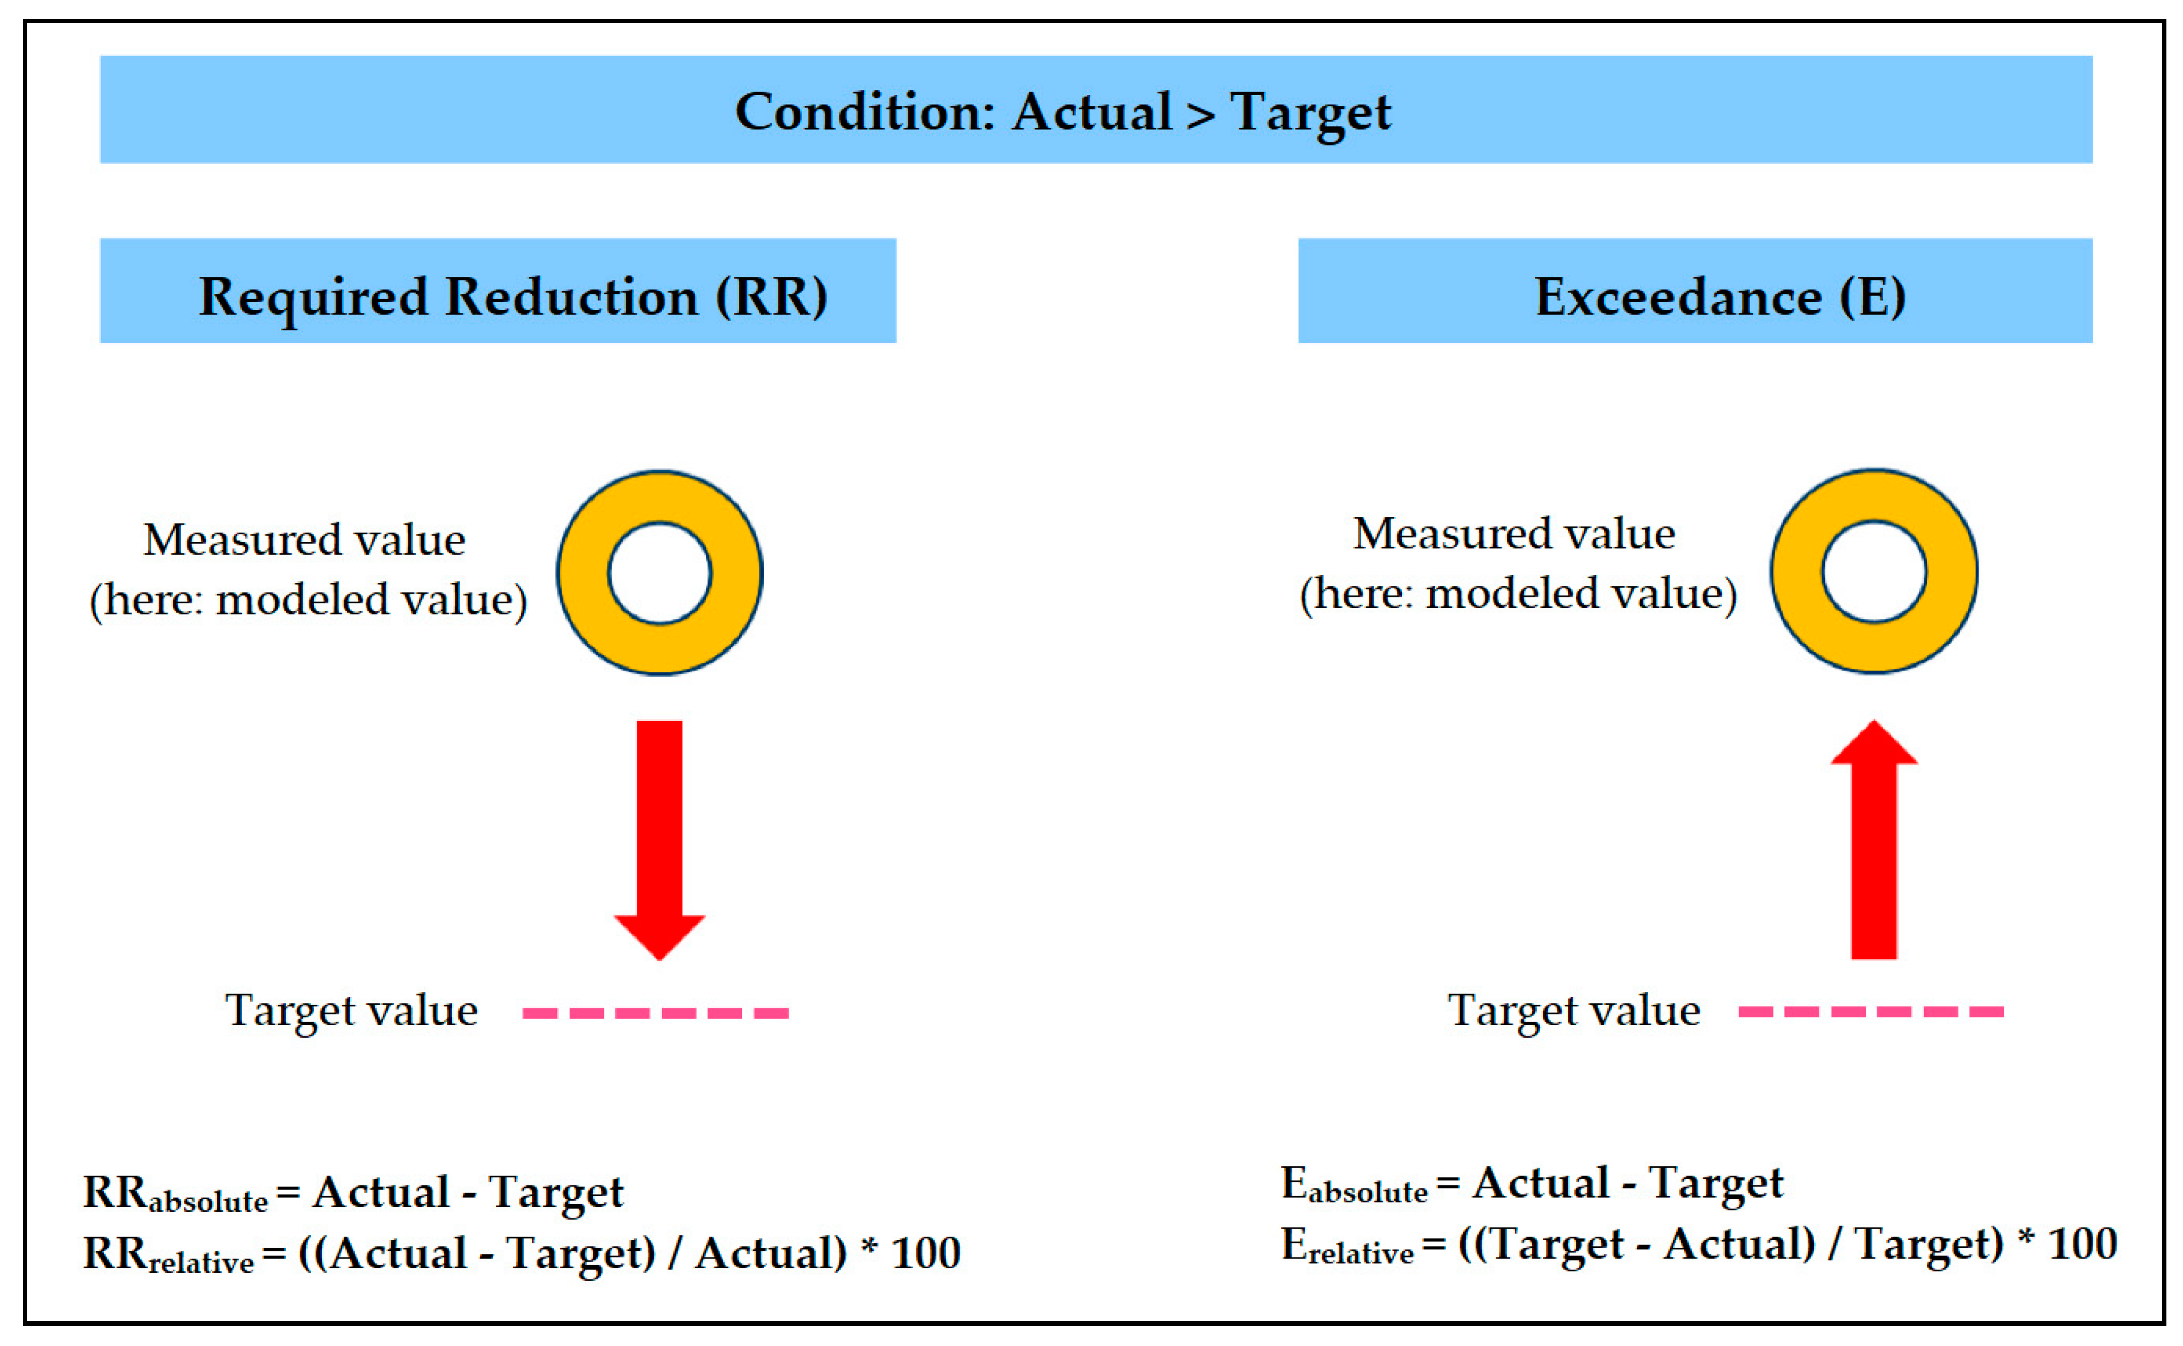
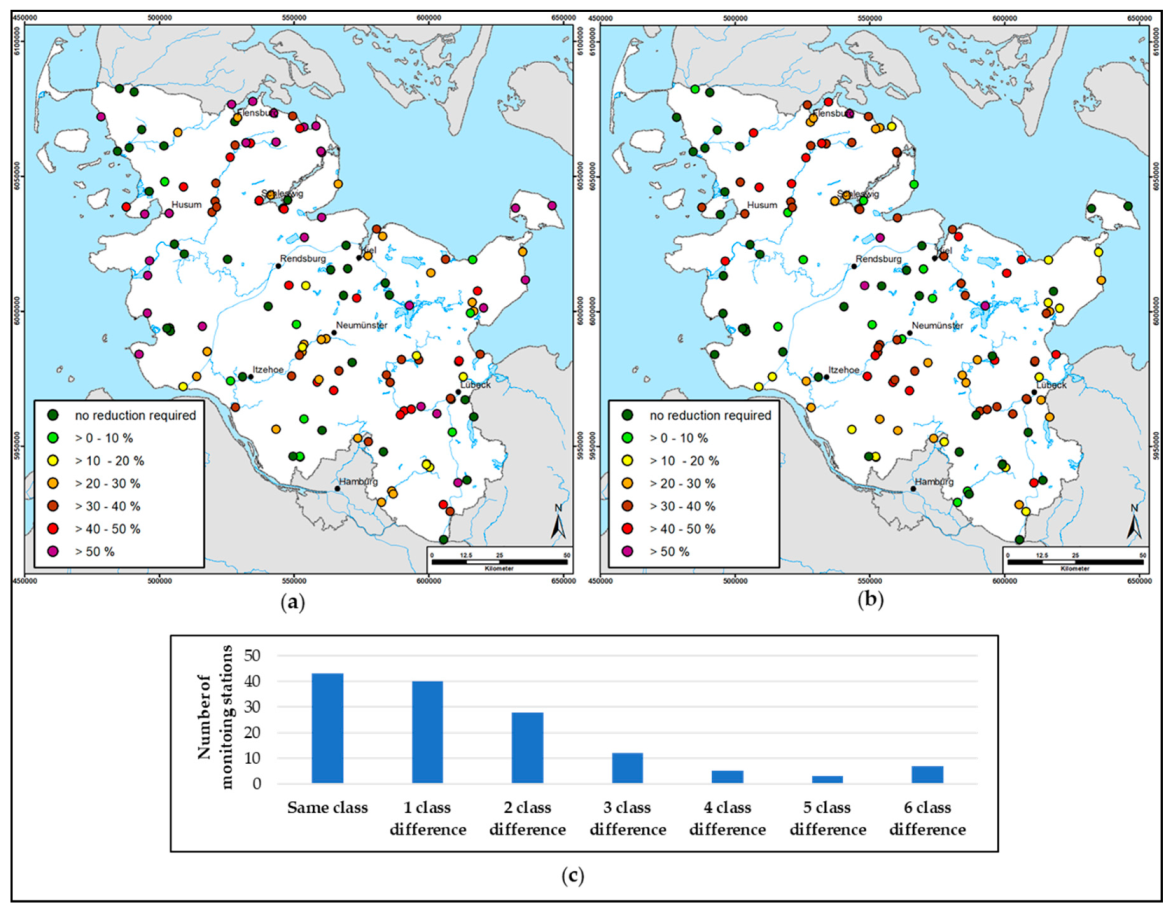
  • Absolute and relative required reduction in mg/L, t/yr or % for each subcatchment in order to meet the orientation values according to OGewV;
  • Number of subcatchments which do not achieve good ecological status, statewide and for each river basin district;
  • Required reduction statewide and for each river basin district. Results of the deficit analysis are also available for more detailed units such as planning units (Planungseinheiten) and subbasin areas (Bearbeitungsgebiete). In order to keep this paper short and easily readable, these results will not be included but can be provided if necessary.
The research works have been carried out by the authors in a project on behalf of the Ministry of Energy, Agriculture, the Environment, Nature and Digitalization Schleswig-Holstein (MELUND).

2. Methods

2.1. Study Area

The Federal State of Schleswig-Holstein is located in Northern Germany and comprises a total area of 15,800 km2, with a population of 2.9 million and a population density of 183.7 inhabitants per km2 (2019).
Schleswig-Holstein is characterized by a dense network of streams and rivers, which sum up to a total length of approximately 30,000 km, as well as a large number of natural lakes. Typical for Schleswig-Holstein are streams with small catchment areas, low gradients and a short flow path towards the nearest lake or sea. Most of the streams are no wider than 2 m. Larger river systems are Treene, Eider, Stör, Trave, Füsinger Au and Schwentine [7]. Approximately 300 natural [8] and a few artificial lakes located along the North Sea Coast encompass an area of more than 350 km2, which makes up more than 2% of the state area.
Schleswig-Holstein is divided into three river basin districts, Elbe, Eider and Schlei/Trave [9], as well as three natural regions, “Marsh” (on the North Sea coast), “Geest” (in the state interior) and “Morainic Uplands” (in the east) [10] (p. 8). Approximately 69% of the state area is used for agriculture. Arable land (46%) is widely distributed in all parts of the country, while grassland (23%) is strongly limited to the “Marsh” as well as lowlands and floodplains. Special crops play a minor role in comparison to other agricultural land use types.

2.2. Methods of the Deficit Analysis

The deficit analysis makes use of available spatially distributed results on mean annual discharges and mean phosphorus emissions in tons per year for ten different pathways, which were modeled in a previous research project on behalf of MELUND (2010–2014) [6]. The main idea is to determine long-term phosphorus concentrations at any river segment or lake in Schleswig-Holstein and compare them with orientation concentrations for achieving good ecological status according to OGewV 2016. In a first step, modeled phosphorus loads and long-term modeled annual discharges were assigned for each of the LAWA subcatchments, which represent the smallest existing subdivision of a river basin according to the rules written by the LAWA [11]. This was performed in GIS based on spatial relationships. Subsequently, the modeled phosphorus loads and discharges were summed up from upstream to downstream subcatchments based on their hierarchy, which can be decoded from the hydrological area register Schleswig-Holstein. The modeled phosphorus concentration in the river segment of each subcatchment was then derived as the quotient of the total load and the total discharge. If the calculated concentration is higher than the orientation value, the required reduction in mg/L is calculated as the difference between these two values. In order to obtain the absolute required reductions in tons per year, the required reductions in mg/L are multiplied by the total discharges. The reduction amount can also be expressed as a relative percentage. The methods described are illustrated in the example below.
Figure 1 shows a total of three subcatchments (CA). Following the river flow directions, subcatchments 1 and 2 are upper basins and both drain into subcatchment 3. The phosphorus loads in t/yr arising from individual subcatchments are marked as P1, P2 and P3. Q1 to Q3 characterize the average annual discharges in mm/yr (or m3/yr) originating from the respective subcatchments 1 to 3. A specific phosphorus orientation value in mg/L based on the characteristics of the water body was taken from OGewV 2016 and assigned for each subcatchment. Since subcatchments 1 and 2 are also basins without loads from upstream, the total loads and total discharges (subscript k, considered all upstream subcatchments) correspond to their own loads and discharges: P1,k = P1 and Q1,k = Q1 as well as P2,k = P2 and Q2,k = Q2. For subcatchment 3, the total phosphorus load is calculated as:
P 3 , k = P 1 + P 2 + P 3
and the total discharge, respectively:
Q 3 , k = Q 1 + Q 2 + Q 3
The phosphorus concentration in the river segment of the subcatchment numbered i can be determined as follows:
C i = P i , k Q i , k
The LAWA recommends that phosphorus retention and release in lakes should be taken into account, as neglecting such processes can lead to incorrect calculation of the concentration in the outflows and therefore the required reduction amount. However, the phosphorus cycle in lakes is complex and usually requires a large number of temporally and spatially high-resolution parameters, e.g., sedimentation rates, kinetic coefficients or diffusion coefficients of different layers of the water column, etc. Due to the availability of data, only phosphorus concentrations in lakes could be estimated based on inflow phosphorus loads. In a lake subcatchment numbered j, the phosphorus concentration is estimated using the formula according to Vollenweider and Kerekes [12] (Equation (4)). The retention and release processes, which possibly affect the lake outflows were neglected in this study due to the lack of suitable formulae for German, or rather Schleswig-Holstein, conditions as well as the lack of measurements.
C j = L j , k · TW j z j · ( 1 + TW j )
Cj = modeled phosphorus concentration in lake [ mg L ] ,
Lj,k = annual phosphorus load per lake area [ g yr · m 2 ] ,
TWj = theoretical water retention time [ yr ] , and
zj = average depth of the lake [ m ] .
If the determined concentration Ci or Cj is higher than the orientation value OVi or OVj, respectively, there is a need to reduce the phosphorus loads (Figure 2).
An important indicator in terms of nutrient loads according to the LAWA [3] is the number of water bodies that are not in a good ecological status. The deficit analysis carried out in this paper indicates the number of subcatchments in which the river segments or lakes do not achieve good ecological status, statewide as well as for each of the river basin districts.
A further important question is how much of the phosphorus load each river basin district has to reduce. This is also subject of the deficit analysis. The calculation of the total reduction for each unit is explained using the example below. Assuming that there are n river subcatchments and m lake subcatchments in a river basin district, the required reduction to be met from this river basin district is calculated as follows:
i = 1 n ( C i OV i ) · Q i + j = 1 m ( C j OV j ) · z j · ( 1 + TW j ) · A j TW j
for C i   >   OV i and C j   >   OV j with A j is the area of the lake.
Equation (5) applies under the assumption that each individual subcatchment complies with the orientation value on the basis of its own phosphorus load and its own discharge. As a result, neither negative reductions nor “dilution effects” are taken into consideration.
In addition to the phosphorus concentrations and the amount of reductions that may be necessary, further results are provided by the deficit analysis. Information and maps of the absolute and area-specific phosphorus loads for each subcatchment—from individual subcatchments as well as from all upstream areas inclusive (as a sum value or broken down by paths)—can serve to identify hotspots. Furthermore, the maximum and second-highest phosphorus input path for each subcatchment can be highlighted. In the context of an integrated and holistic river basin management approach followed by the WFD, these results enable a more targeted planning of measures.

2.3. Input Data for the Deficit Analysis

Table 1 provides an overview of the input data required for the deficit analysis. These include, among others, the phosphorus emission over all input paths, the average annual discharge, the information on the hierarchy between subcatchments as well as the orientation values according to OGewV 2016. All data must be fully available for each subcatchment.

2.3.1. The German Catchment Coding System and the Hydrological Area Register Schleswig-Holstein

The German catchment coding system was firstly established in 1970 by the LAWA and updated two times, in 1993 and 2005 [11]. The numbering is executed from the source of the river to its mouth. Thus, the system is hydrology based and highly hierarchical. Every catchment can be subdivided into 9 subcatchments. Every subdivision of a catchment into subcatchments introduces a new digit, where an odd digit indicates the intercatchment areas along the main river and an even digit implies tributary catchments. The greater the number of digits, the more detailed the subcatchments. The latest version of the hydrological area register Schleswig-Holstein comprises 6428 subcatchments with a maximum digit number of 9, which is equivalent to the 9th level of subdivision. The average size of each subcatchment is approximately 2.5 km2. A few subcatchments, which have the same coding numbers and further attributes, e.g., orientation value, are merged together.
For each of the subcatchments, the direct downstream basin was determined based on the described LAWA regulations. In order to check the correctness of the derived drain directions, a further routine was developed and implemented, which can identify and graphically illustrate codings, which do not comply with the guideline written by the LAWA [11]. These issues were discussed in several stages with the State Agency for Agriculture, Environment and Rural Areas Schleswig-Holstein (LLUR) and corrected where necessary.
Within the framework of this study, the focus lies on inland waters or, to be more precise, on inland rivers and lakes. Coastal and transitional water bodies are not part of the work and therefore were removed from their subcatchments (Figure 3). The remaining parts of the cut-off subcatchments are treated as outflows into the sea and are assigned river orientation values. Consequently, the state area of Schleswig-Holstein can be completely taken into account.
After all the above-mentioned processing steps, instead of 6428, 6407 subcatchments are available for the state of Schleswig-Holstein.

2.3.2. Average Annual Discharge Modeled with GROWA

GROWA [13] is a grid-based empirical water-balance model that was developed, calibrated and validated for central-European site conditions. GROWA conceptually combines distributed meteorological data (precipitation and potential evapotranspiration) with distributed site parameters (land use, soil properties, slope gradient and exposure, mean depth to groundwater) to calculate long-term annual averages of water-balance components [14]. During the last 17 years, GROWA has been applied and successfully used for various water management issues at different scales, from national, i.e., in Lower Saxony [15], Hamburg Metropolitan Region [16], North Rhine-Westphalia [14], etc., to international, i.e., Greece [17] and Slovenia [18].
The statewide average annual discharge was determined with the GROWA model for the period 1971–2000 in the framework of the research project “Regional differentiated modeling of nutrient inputs into groundwater and surface waters in Schleswig-Holstein” on behalf of MELUND [6]. The result was successfully validated [6] (p. 120) and is available as a high-resolution raster of 25 m × 25 m [6] (p. 112). The highest values partly exceeded 400 mm/yr and can be observed in the “Geest” region. As the annual precipitation decreases towards the east, the total discharge falls to values of 100 to 200 mm/yr at a maximum.

2.3.3. Phosphorus Emission Modeled with MEPhos

The MEPhos model is based on an area- and pathway-differentiated emissions approach [19]. The model uses a modular structure to quantify the mean long-term phosphorus inputs separately for different pathways. While entries from municipal sewage treatment plants and industrial effluents are considered as site specific using point data, entries by rainwater sewers and combined sewer overflows are calculated integratively for subcatchments of 10–520 km2 in size [20]. Within MEPhos, diffuse phosphorus entries via artificial drainage, groundwater outflow, interflow, erosion and wash-off are modeled based on phosphotopes [20]. Phosphotopes are regarded as homogenous types of subareas representing discontinuous source areas for non-point phosphate inputs. Analogous to hydrotopes, phosphotopes include a set of parameters that control the phosphorus emissions, e.g., soil types, land use or hydraulic connectivity to surface waters, etc. By means of MEPhos, differentiated phosphorus emissions in Schleswig-Holstein were modeled and successfully validated [6] (p. 168). The highest phosphorus input into surface waters originates from artificial drainage (371 t/yr), followed by municipal sewage treatment plants (145 t/yr), groundwater outflow (136 t/yr), rainwater sewers (82 t/yr), erosion (70 t/yr), deposition (38 t/yr), small sewage treatment plants (37 t/yr) and industrial effluents (19 t/yr). Inputs via interflow and wash-off are considerably lower and amount to 5 and 2 t/yr, respectively. All the results are available as high-resolution datasets.

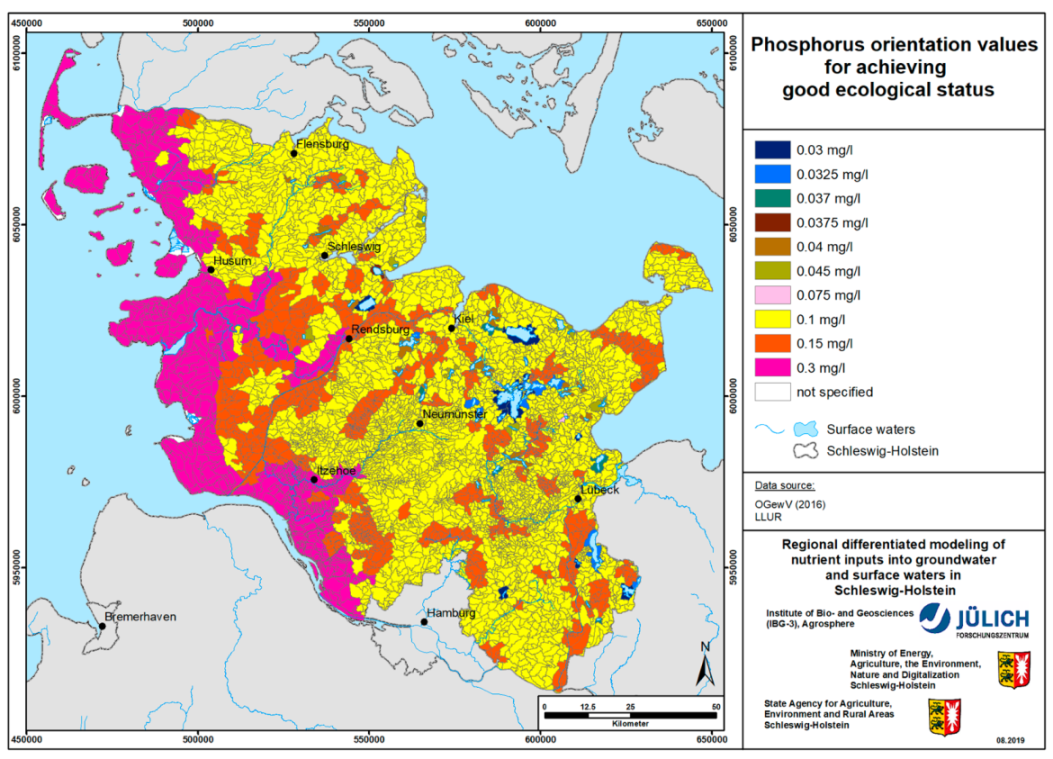
2.3.4. Phosphorus Orientation Values for Surface Waters

Phosphorus orientation values for achieving good ecological status vary depending on the type of water body and are defined in OGewV 2016 (Table 2).
By means of the processing method presented in Table 1, the orientation values can be assigned to each of the subcatchments. Their spatial distribution is illustrated in Figure 4.
It should be noted at this point that a wide range of methods are currently being used by Member States of the European Union for deriving nutrient thresholds to support good ecological status in surface waters [21]. As a consequence, thresholds vary greatly among countries, even for similar water body types and in some cases show more than a 10-fold difference in concentrations [21,22]. Poikane et al. suggest that nutrient criteria should be derived from biological responses to nutrients and a harmonization of methods between countries should be established [21].

3. Results

The results of the deficit analysis using the methods described above and based on the water balance and phosphorus emission model combination GROWA-MEPhos are shown in Figure 5, Figure 6, Figure 7, Figure 8 and Figure 9. Since these figures consider the phosphorus emissions originating from individual subcatchments as well as from their upstream areas, they support the integrated and holistic river basin management approach followed by the WFD.
The maximum phosphorus emission path is illustrated in Figure 5a. It is obvious that, in the landscapes “Marsh” and “Geest”, artificial drainage represents the dominant input path. In the landscape “Schleswig-Holstein Morainic Uplands” in the east, erosion characterizes the maximum phosphorus emission. As upstream areas are considered, site-specific sewage treatment plants become more noticeable in the map. In the large cities of Kiel and Lübeck and the medium-sized towns of Flensburg, Rendsburg, etc., phosphorus mostly emits to the surface waters through rainwater sewers. Deposition plays a major role in the subcatchment areas of the lakes.
Figure 5b provides information on which emission path represents the second-highest phosphorus input into surface waters. It can be seen that input via groundwater, which is not particularly noticeable in Figure 5a, dominates in almost the entire state. Phosphorus input through artificial drainage, sewage treatment plants and erosion can still be observed. The emission from small sewage treatment plants emerges spatially aggregated in the areas southeast of Flensburg, southwest of Itzehoe and in the northern surroundings of Lübeck.
The percentage shares of point sources (comprised of wastewater treatment plants, industry, rainwater sewers and small sewage treatment plants) in the total modelled phosphorus loads are shown in Figure 6a. The map shows a high proportion (over 70%) in the cities and surrounding areas. Figure 6b showing the percentage shares of the diffuse sources due to agriculture (artificial drainage, erosion and wash-off) indicates almost the opposite of Figure 6a. A very high proportion of agricultural sources of over 70% can be observed in the “Marsh”, which is strongly caused by artificial drainage. Except in the cities, at least 30% and mostly more than 50% of phosphorus emissions originate from agricultural sources.
Figure 7a provides an overview of the modeled absolute phosphorus loads. Along large rivers, the phosphorus loads accumulate, which is clearly shown in the map, for example, along the Treene, Schwentine, Stör and Trave. The map of absolute phosphorus loads is strongly dependent on the size of the catchments. In order to assess and compare the spatial distribution of phosphorus emissions, it is of advantage to relate the loads to the catchment area sizes. Figure 7b shows the so-called area-specific phosphorus loads in kg/(ha·yr). Compared to the rest of the state, higher values in the “Marsh” can be observed. Alternatively, phosphorus loads due to agriculture can also be related to the agricultural area of catchments.
The modeled phosphorus concentrations in the surface waters of the subcatchments are shown in Figure 8a. Due to the high loads (Figure 7a,b), high phosphorus concentrations were calculated for the “Marsh”, which, to a large extent, exceed the orientation value of 0.3 mg/L that applies in this region. In the rest of the state, with the exception of cities and their surroundings, modeled phosphorus concentrations are predominantly below 0.15 mg/L.
If the modeled phosphorus concentrations are compared with the orientation values from Figure 4, problematic areas and required reductions can be identified, which are shown in Figure 8b and Figure 9a,b. It is obvious that for a large part of the state, phosphorus reduction is urgently necessary. In some isolated subcatchments, over 80% of total phosphorus emissions needs to be reduced. In such cases, information about the maximum emission path as well as the percentage shares of point and diffuse sources offers great help in developing targeted measures and assessing their feasibility.
The need for action regarding phosphorus emissions into inland surface waters in Schleswig-Holstein is summarized in Table 3. Accordingly, 60% of the subcatchments exceed the orientation values for phosphorus. Approximately 31% of the total phosphorus emissions should be reduced in order to achieve good ecological according to the WFD. This corresponds to approximately 269 t/yr. It should be noted that the total phosphorus load for Schleswig-Holstein in Table 3 differs from the sum given in Section 2.3.3 (905 t/yr). This is due to the neglect of coastal and transitional water bodies, whereby large water areas with high phosphorus inputs through deposition are not taken into consideration. However, the difference of 25 t/yr or 2.7% of the total emission is to be regarded as minor.

4. Validation of Results and Discussion

In order to assess the accuracy and reliability of the implemented deficit analysis, possibilities for validating the results were sought. In the “Waterbody and Nutrient Information System Schleswig-Holstein”, measured phosphorus concentrations in rivers for the period 1991–2018 are available. Additionally, seasonal mean concentrations of phosphorus in the lakes were provided by the LLUR’s lake department.
These data underwent a detailed analysis and subsequently were processed and then compared with the modeled results. If there is a satisfactory agreement for a sufficiently large number of quality monitoring stations, it can be assumed that representative statements can be made with the underlying deficit analysis. In order to keep unavoidable uncertainties as small as possible, only monitoring stations with at least 50 concentration measurements were used.

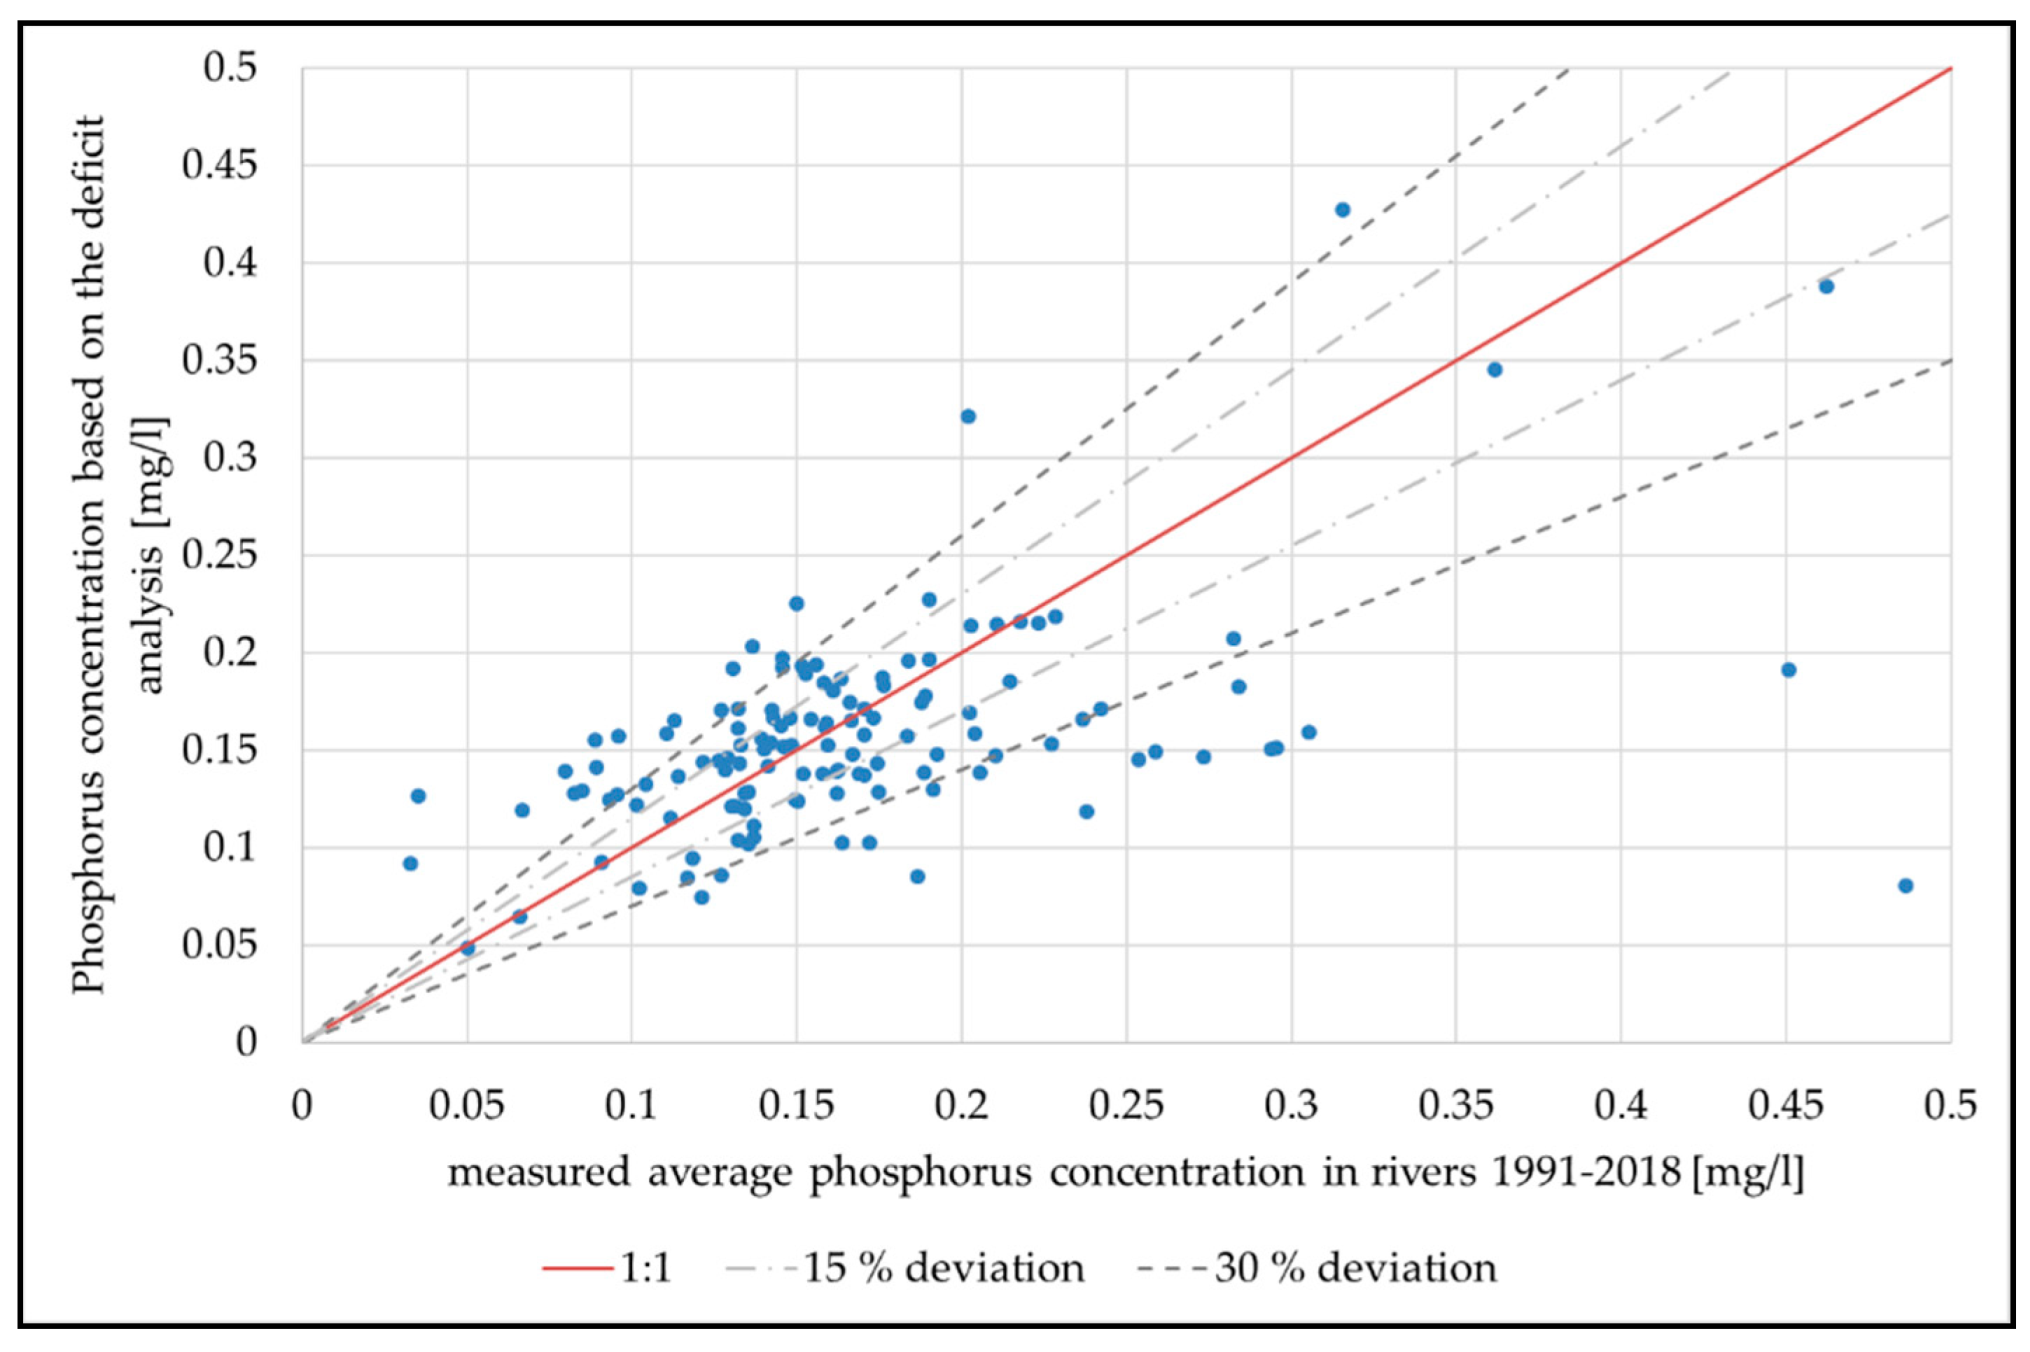
4.1. Validation Based on Phosphorus Concentrations Measured in Rivers (at Least 50 Measurements per Measuring Station)

In total, there are 138 monitoring stations that meet the quality criterion of at least 50 measurements. With approximately 12 measurements per year, the criterion corresponds to approximately four years of monitoring. The 138 monitoring stations are distributed homogeneously throughout the state and cover all river basin districts and the state’s major rivers. Figure 10 shows the comparison between the mean measured and modeled phosphorus concentrations. Most of the points are located in the zone of ±30% deviation. The mean absolute percentage error amounts to 29%. However, larger deviations, which are over 100% in extreme cases, can be observed. A more detailed analysis revealed that monitoring stations with the largest deviations are located near coastal areas, for example in the island of Fehmarn, as the tidal influence could not be considered in the models. Furthermore, for some of the stations, the monitoring time was not continuous, so that their average values are not fully comparable with model results, which generally characterize mean long-term conditions. It should also be noted that the input parameters for the GROWA-MEPhos model combination was derived from statewide available databases. As a consequence, local obviously deviating model results may have been due to databases being insufficiently accurate for local issues [23].
Figure 11 shows a comparison of measured and modeled relative required reduction for the 138 monitoring stations used for validation as well as their agreement based on classes defined in the upper panels. In general, good agreement can be considered, as there are mainly no, one or two class differences between measured and modeled results. A perfect match between them is also not realistic, since on the one hand the available data used for validation and the modeled results do not cover the exact same period of time, on the other hand there are fundamental uncertainties in the modeling, but also in the handling of measured values below the determination limits or in the estimation method used to determine the phosphorus loads at the monitoring stations.

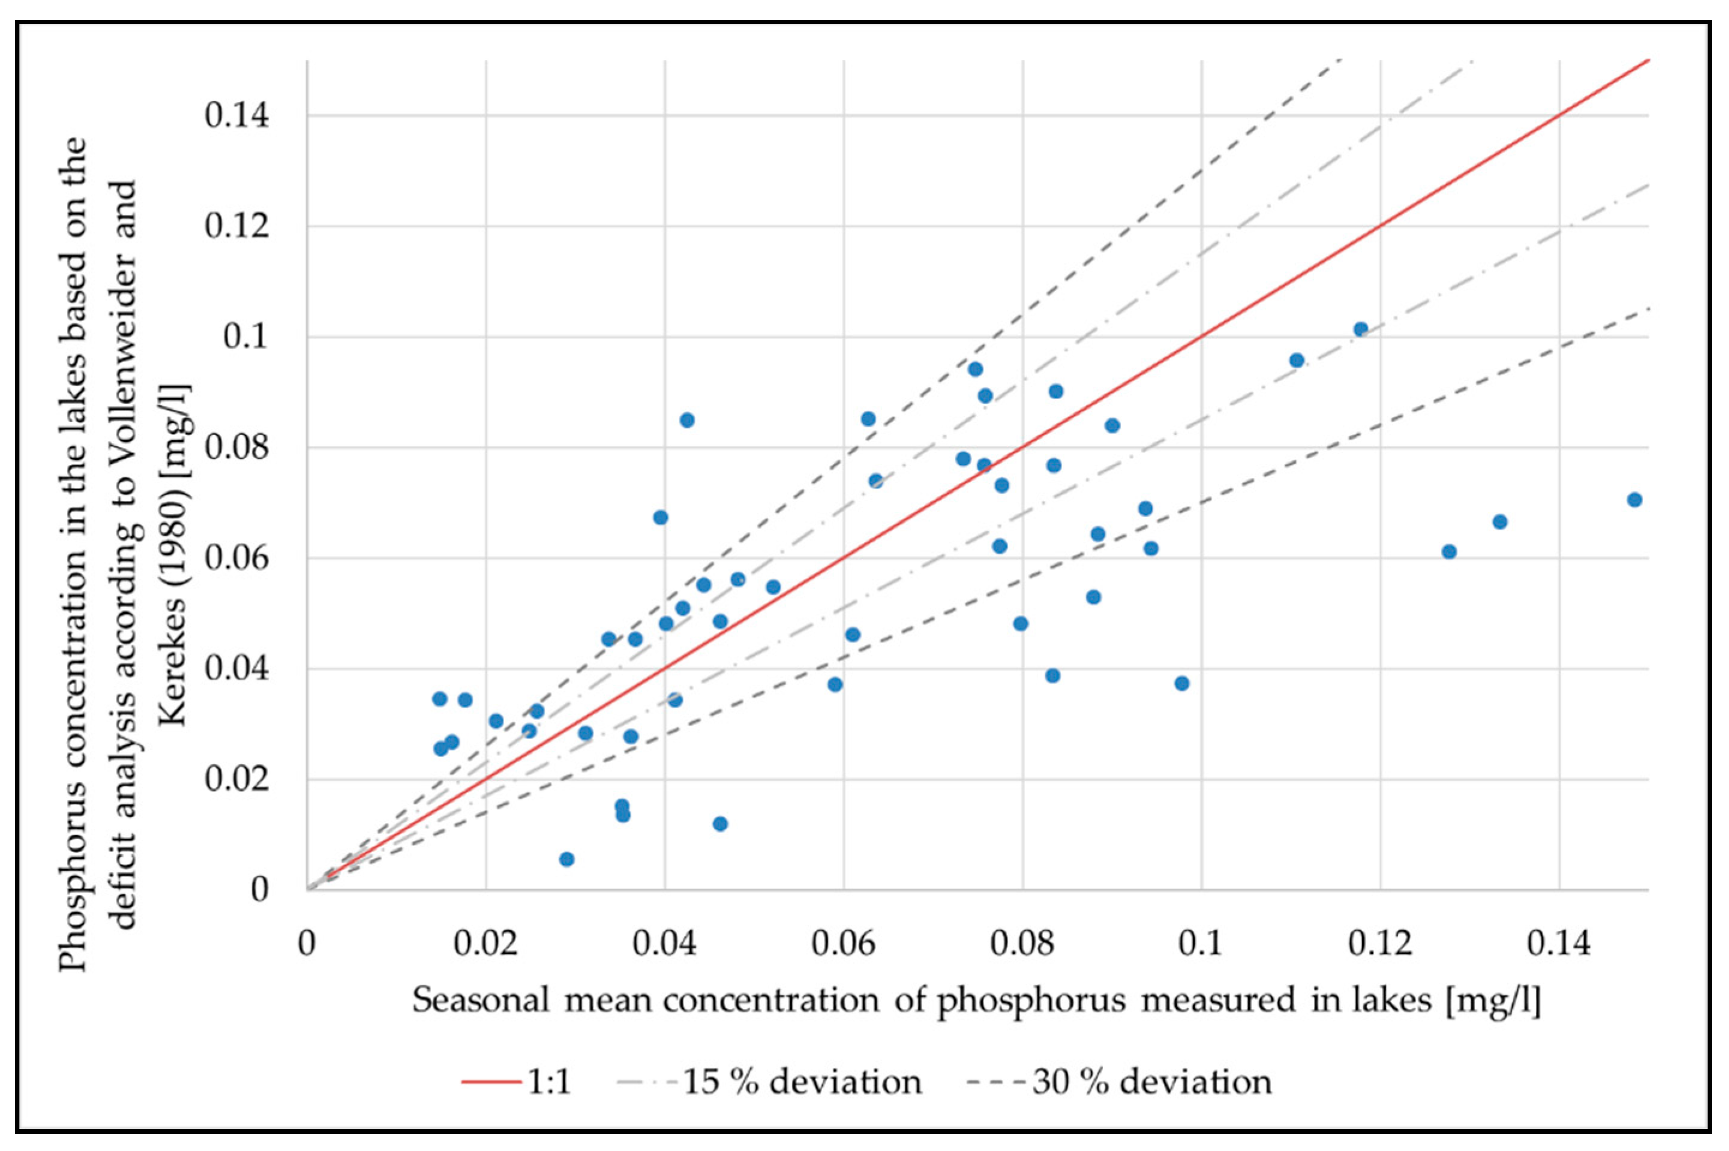
4.2. Validation Based on Phosphorus Concentrations Measured in Lakes

Figure 12 compares the phosphorus concentrations estimated according to Vollenweider and Kerekes [12] with the seasonal mean values provided by the LLUR’s Lake Department for a total of 59 lakes. The mean absolute percentage error amounts to 39% and is relatively high at first sight. However, some aspects have to be considered. First of all, the formula according to Vollenweider and Kerekes only provides an estimate of the lake concentrations. Uncertainties can reach up to a factor of 2. Furthermore, some lakes (e.g., Großer Ratzeburger See or Schaalsee) receive loads from Mecklenburg-Vorpommern, which could not be taken into account. Finally, the measured seasonal mean values are based on the period from March to October and only one seasonal mean value was provided for each lake. In view of the uncertainties listed above, which could add up in unfavorable cases, the result can be classified as satisfactory.

5. Conclusions and Outlook

A deficit analysis according to [3] was performed for all inland surface waters in the Federal State of Schleswig-Holstein. The results could be considered as successfully validated. According to the analysis, 60% of the subcatchments exceed the orientation values for total phosphorus. The phosphorus reduction required for Schleswig-Holstein amounts to approximately 31% on average, which corresponds to approximately 269 t/yr. These model results are consistent with the investigation carried out by Obernolte and Trepel [24], in which the type-specific orientation values for total phosphorus are not met in 68% of the water bodies in Schleswig-Holstein and a required reduction for phosphorus emissions into rivers and lakes of approximately 30% is necessary [25]. Since a large part of phosphorus inputs into surface waters in Schleswig-Holstein comes from agricultural diffuse sources, an implementation of measures with regard to fertilization management as well as erosion control is conceivable. Nevertheless, an increase in clarification efficiency in sewage treatment plants must not be out of consideration, especially in urban areas and surroundings, where they are playing the major role as maximum phosphorus emission path.
Generally, there is a need for further refinements and developments of the model combination, which generated the results used in this paper, so that the deviations can be minimized for better representation of the reality. This includes the use of actual and more accurate data, e.g., soil map and emissions of sewage treatment plants as well as calculation at higher time resolutions, such as on a daily or monthly basis. In the context of the deficit analysis, technically sound and plausible methods for describing phosphorus retention processes, especially in lakes as well as deep and slow rivers, should be developed. Furthermore, a new module for studying the impacts of possibly applied measures should be implemented. This could benefit the planning of regional efficient measures, which are indispensable with regard to achieving the quality objectives set by the WFD.
The methods of the deficit analysis presented in this paper are not limited to phosphorus or to the Federal State of Schleswig-Holstein. Other substances, such as nitrogen, which was also modeled statewide for Schleswig-Holstein [6], can be the next subject of the deficit analysis. Such a nitrogen analysis is advantageous, especially in the context of the EU policy on marine protection. The described deficit analysis can also be implemented for other federal states in Germany, e.g., North Rhine-Westfalia, Mecklenburg-Vorpommern, etc., where the model combination GROWA-MEPhos was successfully applied [26,27]. In other European countries, such as Austria and Switzerland, other models [28,29] were used to quantify nitrogen and phosphorus emissions to surface waters. With appropriate modification, these results can also be used as input data for the deficit analysis.

Author Contributions

Conceptualization, P.T., B.T., M.T. and F.W.; methodology, P.T., B.T. and M.T.; software, P.T. and B.T.; validation, P.T., B.T., M.T. and F.W.; resources, B.T. and M.T.; data curation, P.T.; writing—original draft preparation, P.T.; writing—review and editing, P.T., B.T., M.T. and F.W.; visualization, P.T.; supervision, B.T., M.T. and F.W.; project administration, B.T. and M.T.; funding acquisition, B.T. All authors have read and agreed to the published version of the manuscript.

Funding

This research was funded by the Ministry of Energy, Agriculture, the Environment, Nature and Digitalization Schleswig-Holstein (MELUND) through the project: “Further development of nutrient model Schleswig-Holstein”; project duration: 2017–2019; grant number: T/Z 1015.07.17.

Acknowledgments

The authors would like to thank the State Agency for Agriculture, Environment and Rural Areas Schleswig-Holstein for providing important data and valuable insights as well as the editors and the anonymous reviewers for their crucial comments, which helped improve the quality of this paper.

Conflicts of Interest

The authors declare no conflict of interest.

References

  1. European Parliament; Council of the European Union. Directive 2000/60/EC of the European Parliament and of the Council of 23 October 2000 Establishing a Framework for Community Action in the Field of Water Policy. Off. J. Eur. Communities 2000, L327, 1–73. Available online: https://eur-lex.europa.eu/eli/dir/2000/60/oj (accessed on 10 January 2020).
  2. European Union: European Commission. Wasserrahmenrichtlinie und Hochwasserrichtlinie-Maßnahmen zum Erreichen eines guten Gewässerzustands in der EU und zur Verringerung der Hochwasserrisiken, Mitteilung der Kommission an das Europäische Parlament und den Rat, COM(2015) 120 Final: Brussels, 9 March 2015. Available online: https://ec.europa.eu/environment/water/water-framework/pdf/4th_report/COM_2015_120_de.pdf (accessed on 10 January 2020).
  3. The German Working Group on water issues: LAWA. Empfehlungen für eine harmonisierte Vorgehensweise zum Nährstoffmanagement (Defizitanalyse, Nährstoffbilanzen, Wirksamkeit landwirtschaftlicher Maßnahmen) in Flussgebietseinheiten; Ständiger Ausschuss Oberirdische Gewässer und Küstengewässer LAWA-AO: Magdeburg, Germany, 14 July 2017; Available online: https://www.wasserblick.net/servlet/is/142651/WRRL_AO_35-36-37_Vorgehensweise_Naehrstoffmanagement_20170714.pdf?command=downloadContent&filename=WRRL_AO_35-36-37_Vorgehensweise_Naehrstoffmanagement_20170714.pdf (accessed on 10 January 2020).
  4. Tetzlaff, B.; Haider, J.; Kreins, P.; Kuhr, P.; Kunkel, R.; Wendland, F. Grid-based modelling of nutrient inputs from diffuse and point sources for the state of North Rhine-Westphalia (Germany) as a tool for river basin management according to EU-WFD. River Syst. 2013, 20, 213–229. [Google Scholar] [CrossRef]
  5. Haustein, V.; Janson, P.; Petenati, T.; Plambeck, G.; Schrey, J.; Steinmann, F.; Trepel, M. Nährstoffe in Gewässern Schleswig-Holsteins—Entwicklung und Bewirtschaftungsziele; Landesamt für Landwirtschaft, Umwelt und ländliche Räume Schleswig-Holstein: Flintbek, Germany, 2014; Available online: https://www.umweltdaten.landsh.de/nuis/wafis/fliess/gewaessernaehrstoffe.pdf (accessed on 10 January 2020).
  6. Tetzlaff, B.; Keller, L.; Kuhr, P.; Kreins, P.; Kunkel, R.; Wendland, F. Räumlich differenzierte Quantifizierung der Nährstoffeinträge ins Grundwasser und die Oberflächengewässer Schleswig-Holsteins unter Anwendung der Modellkombination RAUMIS-GROWA-WEKU-MEPhos; Final Report: Jülich, Germany, 2017. Available online: https://www.schleswig-holstein.de/DE/Fachinhalte/W/wasserrahmenrichtlinie/Downloads/Bewirtschaftungszeitraum2/endberichtNaehrstoffmodellierung.pdf;jsessionid=7A97800F5A6E2E67340B24574A4C1BF1.delivery2-master?__blob=publicationFile&v=1 (accessed on 10 January 2020).
  7. Official Website of the Federal State of Schleswig-Holstein: Rivers and Streams. Available online: https://www.schleswig-holstein.de/DE/Themen/F/fluesse_baeche.html (accessed on 10 January 2020).
  8. Official Website of the Federal State of Schleswig-Holstein: Lakes. Available online: https://www.schleswig-holstein.de/DE/Themen/S/seen.html (accessed on 10 January 2020).
  9. Official Website of the Federal State of Schleswig-Holstein: Flussgebietseinheiten (FGE), Bearbeitungsgebiete und Wasserkörper. Available online: https://www.schleswig-holstein.de/DE/Fachinhalte/F/fluesse_baeche/flussgebietseinheiten.html (accessed on 22 April 2020).
  10. Statistisches Amt für Hamburg und Schleswig-Holstein. Kartenatlas zur Landwirtschaft in Hamburg und Schleswig-Holstein 2013, Endgültige Ergebnisse der Agrarstrukturerhebung 2013. Available online: https://www.statistik-nord.de/fileadmin/Dokumente/Statistische_Berichte/landwirtschaft/C_IV_Teil_1_S_Bodennutzung_Agrarstruktur/Kartenatlas_ASE_2013_Teil_1.pdf (accessed on 10 January 2020).
  11. The German Working Group on water issues: LAWA. Richtlinie für die Gebiets- und Gewässerverschlüsselung, ausgearbeitet vom LAWA-Unterausschuss Gewässerverschlüsselung in der Wasserrahmenrichtlinie beim Ständigen Ausschuss Daten, Herausgegeben von der Länderarbeitsgemeinschaft Wasser (LAWA), Ministerium für Umwelt und Naturschutz, Landwirtschaft und Verbraucherschutz des Landes Nordrhein-Westfalen. April 2005. [Google Scholar]
  12. Vollenweider, R.; Kerekes, J. The loading concept as a basis for controlling eutrophication: Philosophy and preliminary results of the OECD programme on eutrophication. Progress Water Technol. 1980, 12, 5–38. [Google Scholar]
  13. Kunkel, R.; Wendland, F. The GROWA98 model for water balance analysis in large river basins—The river Elbe case study. J. Hydrol. 2002, 259, 152–162. [Google Scholar] [CrossRef]
  14. Bogena, H.; Kunkel, R.; Schobel, T.; Schrey, H.P.; Wendland, F. Distributed modeling of groundwater recharge at the macroscale. Ecol. Model. 2005, 187, 15–26. [Google Scholar] [CrossRef]
  15. Wendland, F.; Kunkel, R.; Tetzlaff, B.; Dorhofer, G. GIS-based determination of the mean long-term groundwater recharge in Lower Saxony. Environ. Geol. 2003, 45, 273–278. [Google Scholar] [CrossRef]
  16. Tetzlaff, B.; Kunkel, R.; Taugs, R.; Wendland, F. Grundlagen für eine nachhaltige Bewirtschaftung von Grundwasserressourcen in der Metropolregion Hamburg; Umwelt/Environment; Forschungszentrum Jülich: Jülich, Germany, 2004; Volume 46. [Google Scholar]
  17. Panagopoulos, A.; Arampatzis, G.; Kuhr, P.; Kunkel, R.; Tziritis, E.; Wendland, F. Area-differentiated modeling of water balance in Pinios Basin, central Greece. Glob. Nest 2015, 17, 221–235. [Google Scholar]
  18. Tetzlaff, B.; Andjelov, M.; Kuhr, P.; Uhan, J.; Wendland, F. Model-based assessment of groundwater recharge in Slovenia. Environ. Earth Sci. 2015, 74, 6177–6192. [Google Scholar] [CrossRef]
  19. Tetzlaff, B.; Vereecken, H.; Kunkel, R.; Wendland, F. Modelling phosphorus inputs from agricultural sources and urban areas in river basins. Environ. Geol. 2008, 57, 183–193. [Google Scholar] [CrossRef]
  20. Tetzlaff, B.; Kreins, P.; Kunkel, R.; Wendland, F. Area-differentiated modelling of P-fluxes in heterogeneous macroscale river basins. Water Sci. Technol. 2007, 55, 123–131. [Google Scholar] [CrossRef] [PubMed]
  21. Poikane, S.; Kelly, M.; Salas Herrero, F.; Pitt, J.; Jarvie, H.; Claussen, U.; Leujak, W.; Lyche Solheim, A.; Teixeira, H.; Phillips, G. Nutrient criteria for surface waters under the European Water Framework Directive: Current state-of-the-art, challenges and future outlook. Sci. Total Environ. 2019, 695, 133888. [Google Scholar] [CrossRef] [PubMed]
  22. Phillips, G.; Kelly, M.; Teixeira, H.; Salas, F.; Free, G.; Leujak, W.; Solheim, A.L.; Várbíró, G.; Poikane, S. Best Practice for Establishing Nutrient Concentrations to Support Good Ecological Status; Technical Report EUR 29329 EN.; Publications Office of the European Union: Luxembourg, 2018; p. 67. Available online: https://publications.jrc.ec.europa.eu/repository/bitstream/JRC112667/bpg_online_corrected.pdf (accessed on 22 April 2020).
  23. Wendland, F.; Bergmann, S.; Eisele, M.; Gömann, H.; Herrmann, F.; Kreins, P.; Kunkel, R. Model-Based Analysis of Nitrate Concentration in the Leachate—The North Rhine-Westfalia Case Study, Germany. Water 2020, 12, 550. [Google Scholar] [CrossRef] [Green Version]
  24. Obernolte, M.; Trepel, M. Beurteilung der physikalisch-chemischen Bedingungen der Fließgewässer Schleswig-holsteins und Maßnahmen zur Verringerung der Nährstoffbelastung. 2017. Available online: http://www.umweltdaten.landsh.de/public/wrrl/massnahmen_db/download/FG_pc_sh_171222.pdf (accessed on 10 January 2020).
  25. Trepel, M. Entwicklung von Nährstoffkonzentrationen- und -frachten in Fließgewässern Schleswig-Holsteins. Presentation, 20 October 2015. Available online: https://www.lung.mv-regierung.de/dateien/20151020_trepel.pdf (accessed on 10 January 2020).
  26. Wendland, F.; Kreins, P.; Kuhr, P.; Kunkel, R.; Tetzlaff, B.; Vereecken, H. Räumlich differenzierte Quantifizierung der N- und P-Einträge in Grundwasser und Oberflächengewässer in Nordrhein-Westfalen unter besonderer Berücksichtigung diffuser landwirtschaftlicher Quellen; Schriften des Forschungszentrums Jülich, Reihe Energie & Umwelt/Energy & Environment, Band/Volume 88; Forschungszentrums Jülich: Jülich, Germany, 2010; Available online: https://www.flussgebiete.nrw.de/system/files/atoms/files/raeumlich_differenzierte_quantifizierung_eintraege_n_p_grundwasser_ow_wendland_etal_2010.pdf (accessed on 10 January 2020).
  27. Wendland, F.; Keller, L.; Kuhr, P.; Kunkel, R.; Tetzlaff, B. Regional differenzierte Quantifizierung der Nährstoffeinträge in das Grundwasser und in die Oberflächengewässer Mecklenburg-Vorpommerns unter Anwendung der Modellkombination GROWA-DENUZ-WEKU-MEPhos; Final Report. 2015. Available online: https://www.wrrl-mv.de/doku/hintergrund/modellierung_naehrstoffeintraege_mv.pdf (accessed on 10 January 2020).
  28. Schilling, C.; Zessner, M.; Kovacs, A.; Hochedlinger, G.; Windhofer, G.; Gabriel, O.; Thaler, S.; Parajka, J.; Natho, S. Stickstoff- und Phosphorbelastungen der Fließgewässer Österreichs und Möglichkeiten zu deren Reduktion. Österreichische Wasser- und Abfallwirtschaft 2011, 63, 105–116. [Google Scholar] [CrossRef]
  29. Hürdler, J.; Prasuhn, V.; Spiess, E. Abschätzung diffuser Stickstoff- und Phosphoreinträge in die Gewässer der Schweiz MODIFFUS 3.0; Bericht im Auftrag des Bundesamtes für Umwelt (BAFU); Publ. Agroscope INH: Zürich, Switzerland, 2015; pp. 1–117. Available online: https://www.agroscope.admin.ch/agroscope/de/home/themen/nutztiere/bienen/bienenprodukte/honig/honigqualitaet/_jcr_content/par/columncontrols_1833305568/items/0/column/externalcontent_1350153509.external.exturl.html/aHR0cHM6Ly9pcmEuYWdyb3Njb3BlLmNoL2VuLVVTL3B1YmxpY2/F0aW9uLzM1MDUy.html (accessed on 10 January 2020).
Figure 1. Example for the deficit analysis (CA: subcatchment, P: phosphorus load, Q: annual discharge, and OV: phosphorus orientation value).
Water 12 01365 g001
Figure 2. Methodological approaches of deficit analysis in the context of nutrients, according to the guidance of the German Working Group on water issues of the Federal States and the Federal Government (LAWA) [3]. Instead of measured values, modeled values are used as discussed in the introduction chapter.
Water 12 01365 g002
Figure 3. Removal of the coastal water bodies from the subcatchments using the example of the river Schlei: (a) original subcatchments; (b) coastal water bodies (blue); (c) cut-off subcatchments.
Water 12 01365 g003
Figure 4. Phosphorus orientation values for achieving good ecological status.
Water 12 01365 g004
Figure 5. (a) Maximum and (b) second-highest phosphorus emission path from individual subcatchments and upstream areas.
Water 12 01365 g005
Figure 6. (a) Point sources and (b) agricultural diffuse sources as percentage shares of the total modeled phosphorus loads from individual subcatchments and upstream areas.
Water 12 01365 g006
Figure 7. (a) Absolute and (b) area-specific phosphorus loads from individual subcatchments and upstream areas.
Water 12 01365 g007
Figure 8. (a) Modeled phosphorus concentration; (b) compliance or exceedance of the phosphorus orientation values based on model results.
Water 12 01365 g008
Figure 9. (a) Absolute and (b) relative required reduction in phosphorus emissions from individual subcatchments and upstream areas.
Water 12 01365 g009
Figure 10. Validation based on phosphorus concentrations measured in rivers.
Water 12 01365 g010
Figure 11. (a) Measured and (b) modeled relative required reduction for 138 monitoring stations used for validation; (c) agreement between panels (a) and (b) based on their classes.
Water 12 01365 g011
Figure 12. Validation based on phosphorus concentrations measured in lakes.
Water 12 01365 g012
Table 1. Input data for the deficit analysis.
Input DataData SourceProcessing Method
hierarchy between subcatchmentshydrological area register Schleswig-Holstein (GFV)decoding based on [11]
total and agricultural area of subcatchmentsGFV, Integrated Administration and Control System (InVeKoS 2011)derivation in GIS
information relating to river basin districtsState Agency for Agriculture, Environment and Rural Areas Schleswig-Holstein (LLUR)transfer to subcatchments
lake informationexpert information system for water management: lakestransfer to lake subcatchments
average annual dischargewater balance model GROWA [6]spatially intersecting in GIS
phosphorus emission phosphorus emission model MEPhos [6]spatially intersecting in GIS
type of surface water bodyGFV, database of surface water body characteristicslink column SH_CD_WB from GFV to surface water body database
orientation valueOGewV 2016, LLUR (Table 2)transfer to subcatchments based on the type of surface water body
Table 2. Orientation values for phosphorus according to Ordinance on the Protection of Surface Waters 2016 (OGewV 2016).
TypeExplanationPhosphorus Orientation Value [mg/L]
Rivers14Small sand-dominated lowland rivers0.1
15Mid-sized and large sand and loam-dominated lowland rivers0.1
16Small gravel-dominated lowland rivers0.1
17Mid-sized and large gravel-dominated lowland rivers0.1
19Small streams in riverine floodplains0.15
20Very large sand-dominated rivers0.1
21_NLake outflows in the North German lowlands0.1
22.1Marshland streams with catchments almost completely inside the marshes, which flow directly into the North Sea or lower reaches of large rivers0.3
22.2Marshland streams with catchments in ground moraines of young and old moraine landscapes0.3
22.3Very large marshland rivers (only Elbe and Weser)0.3
77Kiel Canal0.15 (in agreement with LLUR)
Lakes10.1Lowland layered lakes with relatively large catchment area0.0325
10.2Lowland layered lakes with relatively large catchment area0.037
11.1Lowland polymictic lakes with relatively large catchment area0.04
11.2Lowland polymictic lakes with relatively large catchment area0.045
12Lowland river-like lakes0.075
13Lowland layered lakes with relatively small catchment area0.03
14Lowland polymictic lakes with relatively small catchment area0.037
99Artificial lakes located along the North Sea CoastNot considered as in good condition
Table 3. Modeled phosphorus loads and required reductions.
River Basin DistrictNumber of SubcatchmentsNumber of Subcatchments Exceeding Orientation ValuesPhosphorus Loads [t/yr]Required Reductions [t/yr]
Elbe28151609 (57%)313101 (32%)
Eider1170718 (61%)359100 (28%)
Schlei/Trave24221542 (64%)20868 (33%)
Schleswig-Holstein64073869 (60%)880269 (31%)

