1. Introduction
Groundwater, which makes up the majority of freshwater globally, is an important reserve that humans and ecosystems can access to adapt to variations in precipitation [
1,
2,
3,
4]. Although uncertainties in global climate models (GCMs) still limit our understanding of whether changes in precipitation will impact groundwater resources [
5], the increased length of dry spells and shorter, more intense heavy rain events [
6,
7] will result in changes in surface runoff and soil moisture conditions. Moreover, whilst it is similarly uncertain whether drought frequencies are increasing [
8,
9], the main consensus is that more areas will become susceptible to drought, with droughts establishing more quickly and with greater intensity [
10]. These two changes are likely to directly impact recharge processes and longer-term groundwater vulnerability to changes in quantity and quality [
11,
12]. Hence, quantification of recharge and understanding recharge dynamics are core hydrological parameters needed to be able to effectively manage groundwater resources.
Groundwater recharge remains one of the most difficult hydrogeological variables to quantify accurately [
13]. Discrepancies between studies have been attributed to both the methods used as well as the spatial and temporal resolution of recharge studies [
14]. Recharge in semi-arid environments is particularly difficult to quantify due to a smaller and more variable recharge flux in comparison with humid areas, meaning that fewer recharge estimation techniques can be applied successfully [
13,
15]. The chloride mass balance (CMB) technique for quantification of groundwater recharge [
16] is a well-established and straightforward method for calculating recharge and has been successfully used in many different types of environments [
17,
18,
19,
20,
21]. While modifications and adaptions have been made to the original CMB technique over the past decade [
22,
23], the fundamental basis for estimating recharge using the CMB technique is that (1) the chloride in the groundwater must originate solely from precipitation, (2) the chloride must be conservative in the system, (3) the chloride mass flux has not changed over time and (4) there is no recycling or concentrations of chloride in the aquifer [
20]. If these conditions are met, then CMB provides a cost-effective estimation of recharge that is often easier to obtain than that by physical methods [
24]. It also provides a time-integrated recharge value [
20] that is particularly useful in semi-arid areas where rainfall varies in both time and space.
The problem with using CMB in semi-arid and arid environments is that these conditions are often hard to meet because chloride is both recycled and concentrated in these environments. A specific concern is deposition of wind-blown marine salts in coastal regions, particularly in the dry summer months, with the salts subsequently washed down into the groundwater system during the wet winter months [
25]. These types of processes are further complicated by the density and type of vegetation in the catchment [
26], preferential flow pathways leading to spatial variability in the chloride concentration in groundwater [
27], as well as additional potential sources of chloride, particularly in agricultural regions [
23]. For these reasons, it is often recommended that the CMB method be combined with another recharge estimation technique to provide additional validation of results [
24]. Although stable isotopes can not quantify recharge rates directly [
14], they are excellent tracers of surface water–groundwater interaction and groundwater flow. For this reason, many studies have combined the CMB technique for quantifying recharge with stable isotopes to understand groundwater flow patterns [
28].
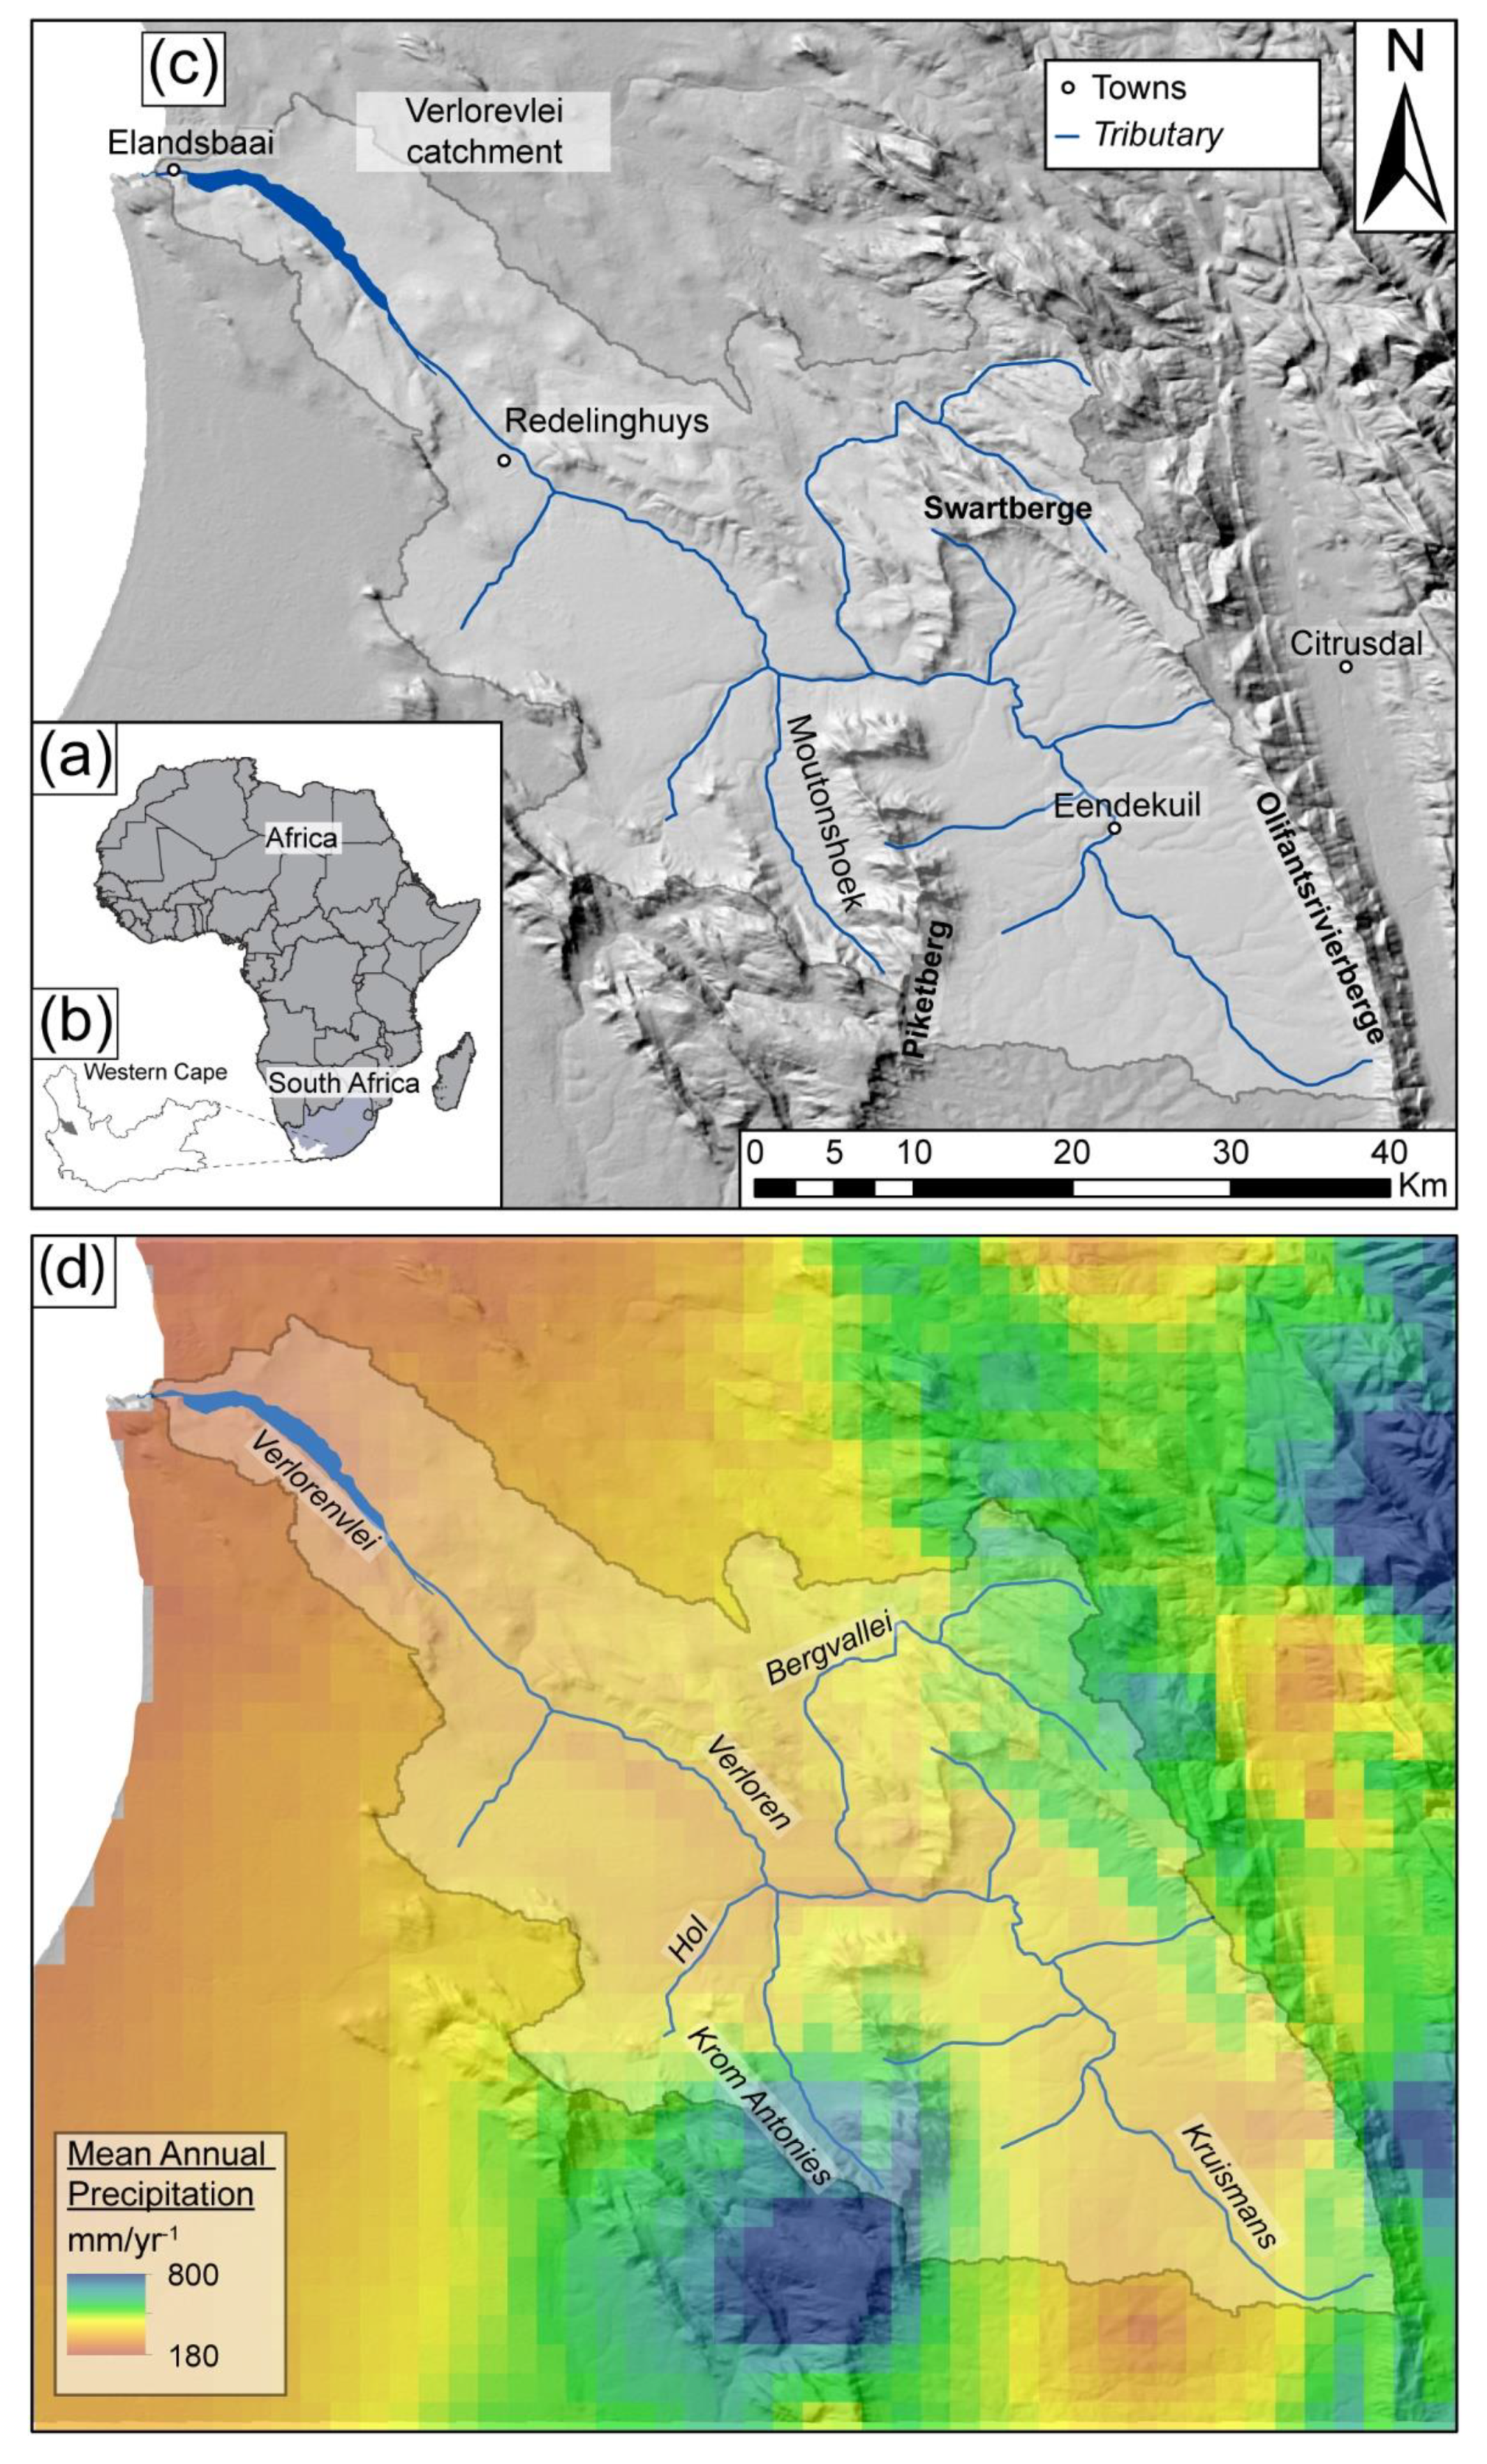
The Verlorenvlei is a RAMSAR (#525)-listed estuarine wetland situated 200 km north of Cape Town in the Sandveld, South Africa (
Figure 1). The intermittent connection between the wetland and ocean has created an environment that supports large numbers of fish and aquatic birds as well as plant species, all of which contributes to the high biodiversity of the region [
29]. The combined demands on water resources in the region driven by the agricultural sector, as well as the needs of the natural ecosystems during periods of drought, have resulted in a groundwater system under significant water stress [
30]. This pressure has become even more acute in recent years as a severe drought related to the 2015–2017 El Ninõ cycle caused the lake to dry out, leaving the estuarine system dependent on baseflow from the aquifers. However, in this environment, baseflow driven by groundwater becomes progressively more saline down the catchment and can lead to saline plumes in the lake which impact on species diversity in the lake. In order to effectively manage this system, a better understanding of the groundwater flows into the lake is needed, but this requires a better understanding of the recharge dynamics into the different aquifers that provide this flow, as well as where and when the salts are accumulating in the groundwater system.
The aim of this study is to characterise groundwater in the Verlorenvlei catchment using hydrochemistry and stable isotopes with a view to constrain when and where the salts are accumulating in the groundwater system. Thereafter, the CMB approach is used to evaluate recharge to the groundwater system by excluding data from regions that show a clear concentration of chloride. Previous work has suggested that baseflow into the Verlorenvlei lake is derived from the deeper groundwater system hosted by shales associated with the Late-Neoproterozoic to Cambrian Malmesbury Group [
32]. This aquifer is therefore the primary focus of this study. However, modelling of percolation in the catchment suggests that these deeper shales are themselves recharged via the fractured sandstones of the Table Mountain Group that occupy the high-elevation regions where precipitation rates are higher [
33]. Thus, the recharge contribution of the Table Mountain Group was also considered in this study. The alluvial aquifer system was not considered, primarily because there was little to no flow in this system because of the drought conditions at the time of the study. However, interaction between the shallow alluvial, Table Mountain Group and Malmesbury Group aquifers will be considered to assess the future health of the groundwater and wetlands systems since predicated climate change patterns suggest that these drought conditions will become more prevalent. Finally, the approach applied in this study will be used to create a robust filtering technique for estimating recharge using the CMB approach in other semi-arid areas where salinisation is a cause for concern.
2. Materials and Methods
The CMB approach is difficult to apply in catchments where the groundwater is saline. The approach taken in this study was to use stable isotopes to evaluate flow paths and to separate regions of fresh groundwater from regions where additional salts are being collected. The CMB approach was then applied to the fresh groundwater flows only and then used to evaluate how and where additional salts are being added into the groundwater system. The sampling period coincided with the severe drought experienced by Cape Town between 2015 and 2017. This impacted the amount of rainwater collected as annual precipitation was well below average.
2.1. Environmental Setting
The Verlorenvlei extends between the villages of Elands Bay and Redelinghuys on the West Coast of South Africa, making it one of South Africa’s largest estuarine lakes (15 km
2) (
Figure 1). The lake is an important feeding ground for a variety of endangered bird species [
34]. Evaporative losses from the lake are significant, especially given its large surface area and relatively shallow depth [
32]. The lake is fed by surface water and groundwater from the catchment [
35], which usually sustains the lake system, although recently the lake has suffered severe water shortages [
33].
2.1.1. Rainfall and Climate
The Verlorenvlei is described as a Mediterranean climate, with 80% of the rainfall occurring in the winter months between April and September [
33,
36]. The highest rainfall occurs in the Piketberg Mountains to the southeast of the catchment, which is the origin of the Krom Antonies, an important tributary to the Verloren River that directly feeds the lake (
Figure 1). Average annual precipitation is between 370 and 785 mm/year for the Piketberg Mountains, which reaches a maximum of 800 mm/year [
31] (
Figure 1b). Towards the east of the catchment, this value decreases significantly, with Elands Bay (the mouth of the Verlorenvlei) receiving around 210 mm/year (
Figure 1b). The winter rainfall period corresponds to lower average temperatures between 8 and 13 °C, with average summer temperatures of 17 to 23 °C [
37]. Evaporation increases towards the coast, where at the confluence of the major tributaries, potential evaporation is 1460 mm/year, as opposed to 950 mm/year in the upper reaches of the Krom Antonies [
33].
2.1.2. Hydrology
The drainage catchment to the Verlorenvlei covers an area of approximately 1890 km
2, and is bounded by the Swartberg and Olifantsrivier mountains in the east and north-east, and the Piketberg Mountains in the west and south-west (
Figure 1a). The Verloren River contributes the bulk of the fresh water input to the Verlorenvlei estuarine system. It flows mainly during winter and early summer, with its flow being reduced to a trickle in the dry summer months [
34]. At a length of 50 km, the Kruismans is the longest tributary and drains the extensive, low-lying Kruismans basin between the Olifantsrivier Mountains and the Piketberg Mountain range (
Figure 1a). The Bergvallei tributary drains the Swartberge and flows south into the Kruismans. It is mostly dry, and the lack of surface water flow has resulted in parts of the river bed being ploughed for agriculture [
36]. The Hol and Krom Antonies tributaries drain northwards into the Kruismans, from the same quaternary catchment, with the Hol only flowing sporadically after very good rains. The Krom Antonies is the shortest tributary of the Verlorenvlei, but from preliminary investigations is suggested to be the most significant in terms of freshwater input, as it drains the Moutonshoek Valley of the Piketberg Mountain range (
Figure 1c) where rainfall is high [
38].
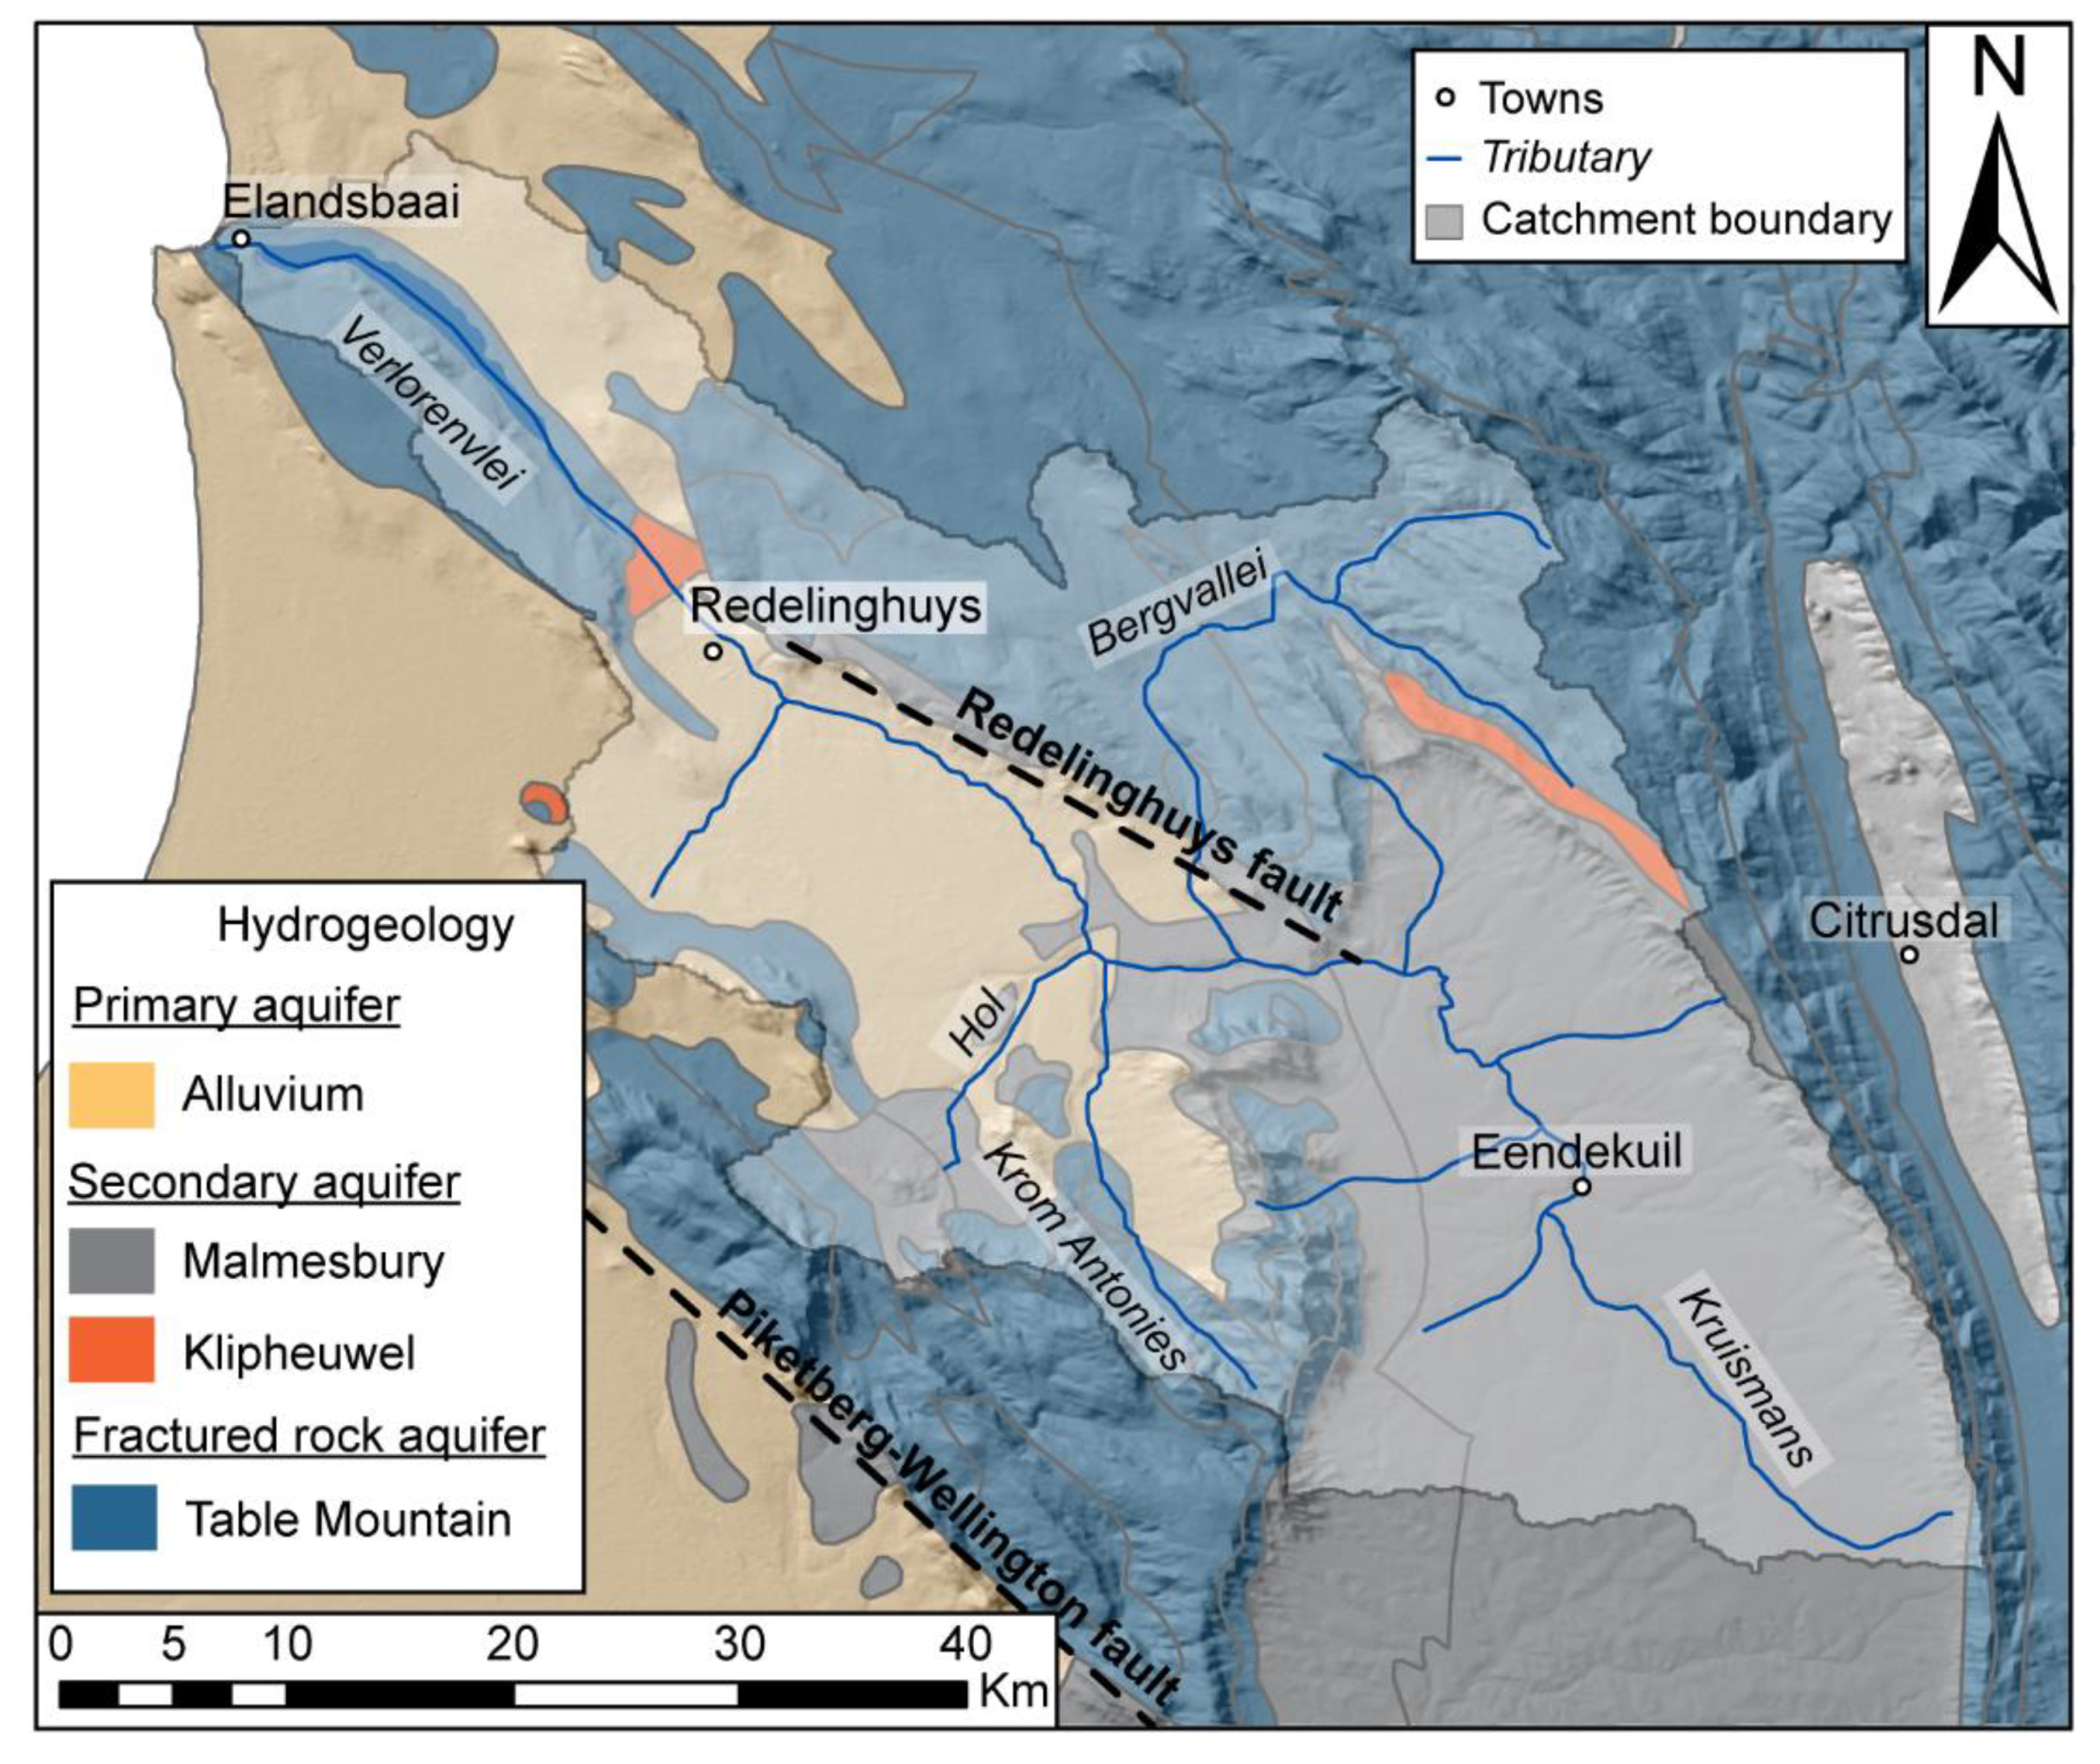
2.1.3. Hydrogeology
The Verlorenvlei catchment has both unconsolidated primary porosity and fractured rock secondary porosity aquifers (
Figure 2). The unconfined primary porosity alluvial aquifer is hosted by coarse-grained, unconsolidated sands, with a flow direction that follows topography and tributaries (GEOSS, 2006). It produces high-yielding boreholes and dominates the west of the Verlorenvlei catchment. Due to its shallow, unconfined nature, it is variably saline where salinity increases towards the coast [
30] and is prone to contamination from anthropogenic activities [
30]. The alluvial aquifer is also present in the Moutonshoek Valley of the Piketberg Mountain range (
Figure 1c and
Figure 2) and decreases in thickness up the valley as the sediments give way to the sandstone formations of the Table Mountain Group (TMG). The alluvial aquifers are characterised by low recharge due to low rainfall, thick sands and high potential evaporation in the valleys [
39].
The alluvial aquifer(s) is everywhere underlain by a semiconfined to confined secondary porosity aquifer hosted by the Malmesbury Group (MG), with a partial clay aquitard overlying it [
30]. Faults, weathering zones and bedding planes are the primary features that control groundwater flow [
30]. The MG aquifer is associated with high-yielding artesian boreholes and good-quality groundwater in places (particularly along the Krom Antonies). The MG aquifer does not show any direct response to precipitation [
33]. It is therefore likely that the MG aquifer derives a significant amount of recharge from the TMG aquifer as a result of high hydraulic gradients from the mountains, and groundwater flow following a SE-NW direction, primarily controlled by faults [
30,
40,
41,
42].
The Piketberg Mountains host the fractured rock TMG aquifer. This aquifer consists of several thick sandstone and quartzite formations, the most important of which are the Peninsula and Skurweberg Formations. In the study area, the Peninsula Formation is the dominant aquifer formation, but the similar Nardouw Formation occurs in the mountains on the southern margin of the catchment. The Peninsula Formation is underlain by the Graafwater Formation, which acts as a partial aquitard, and thereafter the Piekenierskloof Formation. Both the Graafwater and Piekenierskloof formations have limited outcrop in the study area. Recharge is primarily via the fracture network in the Peninsula Formation exposed along the top of the mountains, where precipitation is highest and has been previously estimated to be up to 15% of mean annual precipitation (MAP) [
33].
2.1.4. Land Use and Cover
Most of the indigenous vegetation in the catchment is Strandveld Fynbos, a semisucculent vegetation that is described as a transition between Coastal Fynbos and Succulent Karoo vegetation [
36]. Both are ecologically important biomes and have been identified by the government of South Africa as a top conservation priority [
43]. Agriculture is the predominant water user in the catchment and accounts for more than 90% of the total water demand [
43]. The primary food crops grown are table grapes, potatoes and increasingly, citrus. While table grapes and citrus make use of drip and microjet irrigation, potato production is dependent on centre pivot irrigation. Of the catchment, 12,500 hectares (125 km
2) has been cultivated for potato production and 5200 (52 km
2) hectares for table grapes and citrus [
44]. Altogether, 5900 hectares (59 km
2) is actively irrigated [
45]. Previous estimates suggest that potato production uses roughly 20% of the annual recharged groundwater [
43]. Rooibos tea production covers a significant area of the land, but this arid crop relies predominantly on precipitation and therefore contributes little to the water demands. Likewise, natural vegetation provides grazing lands for livestock.
2.2. Sampling
2.2.1. Rainwater Sampling
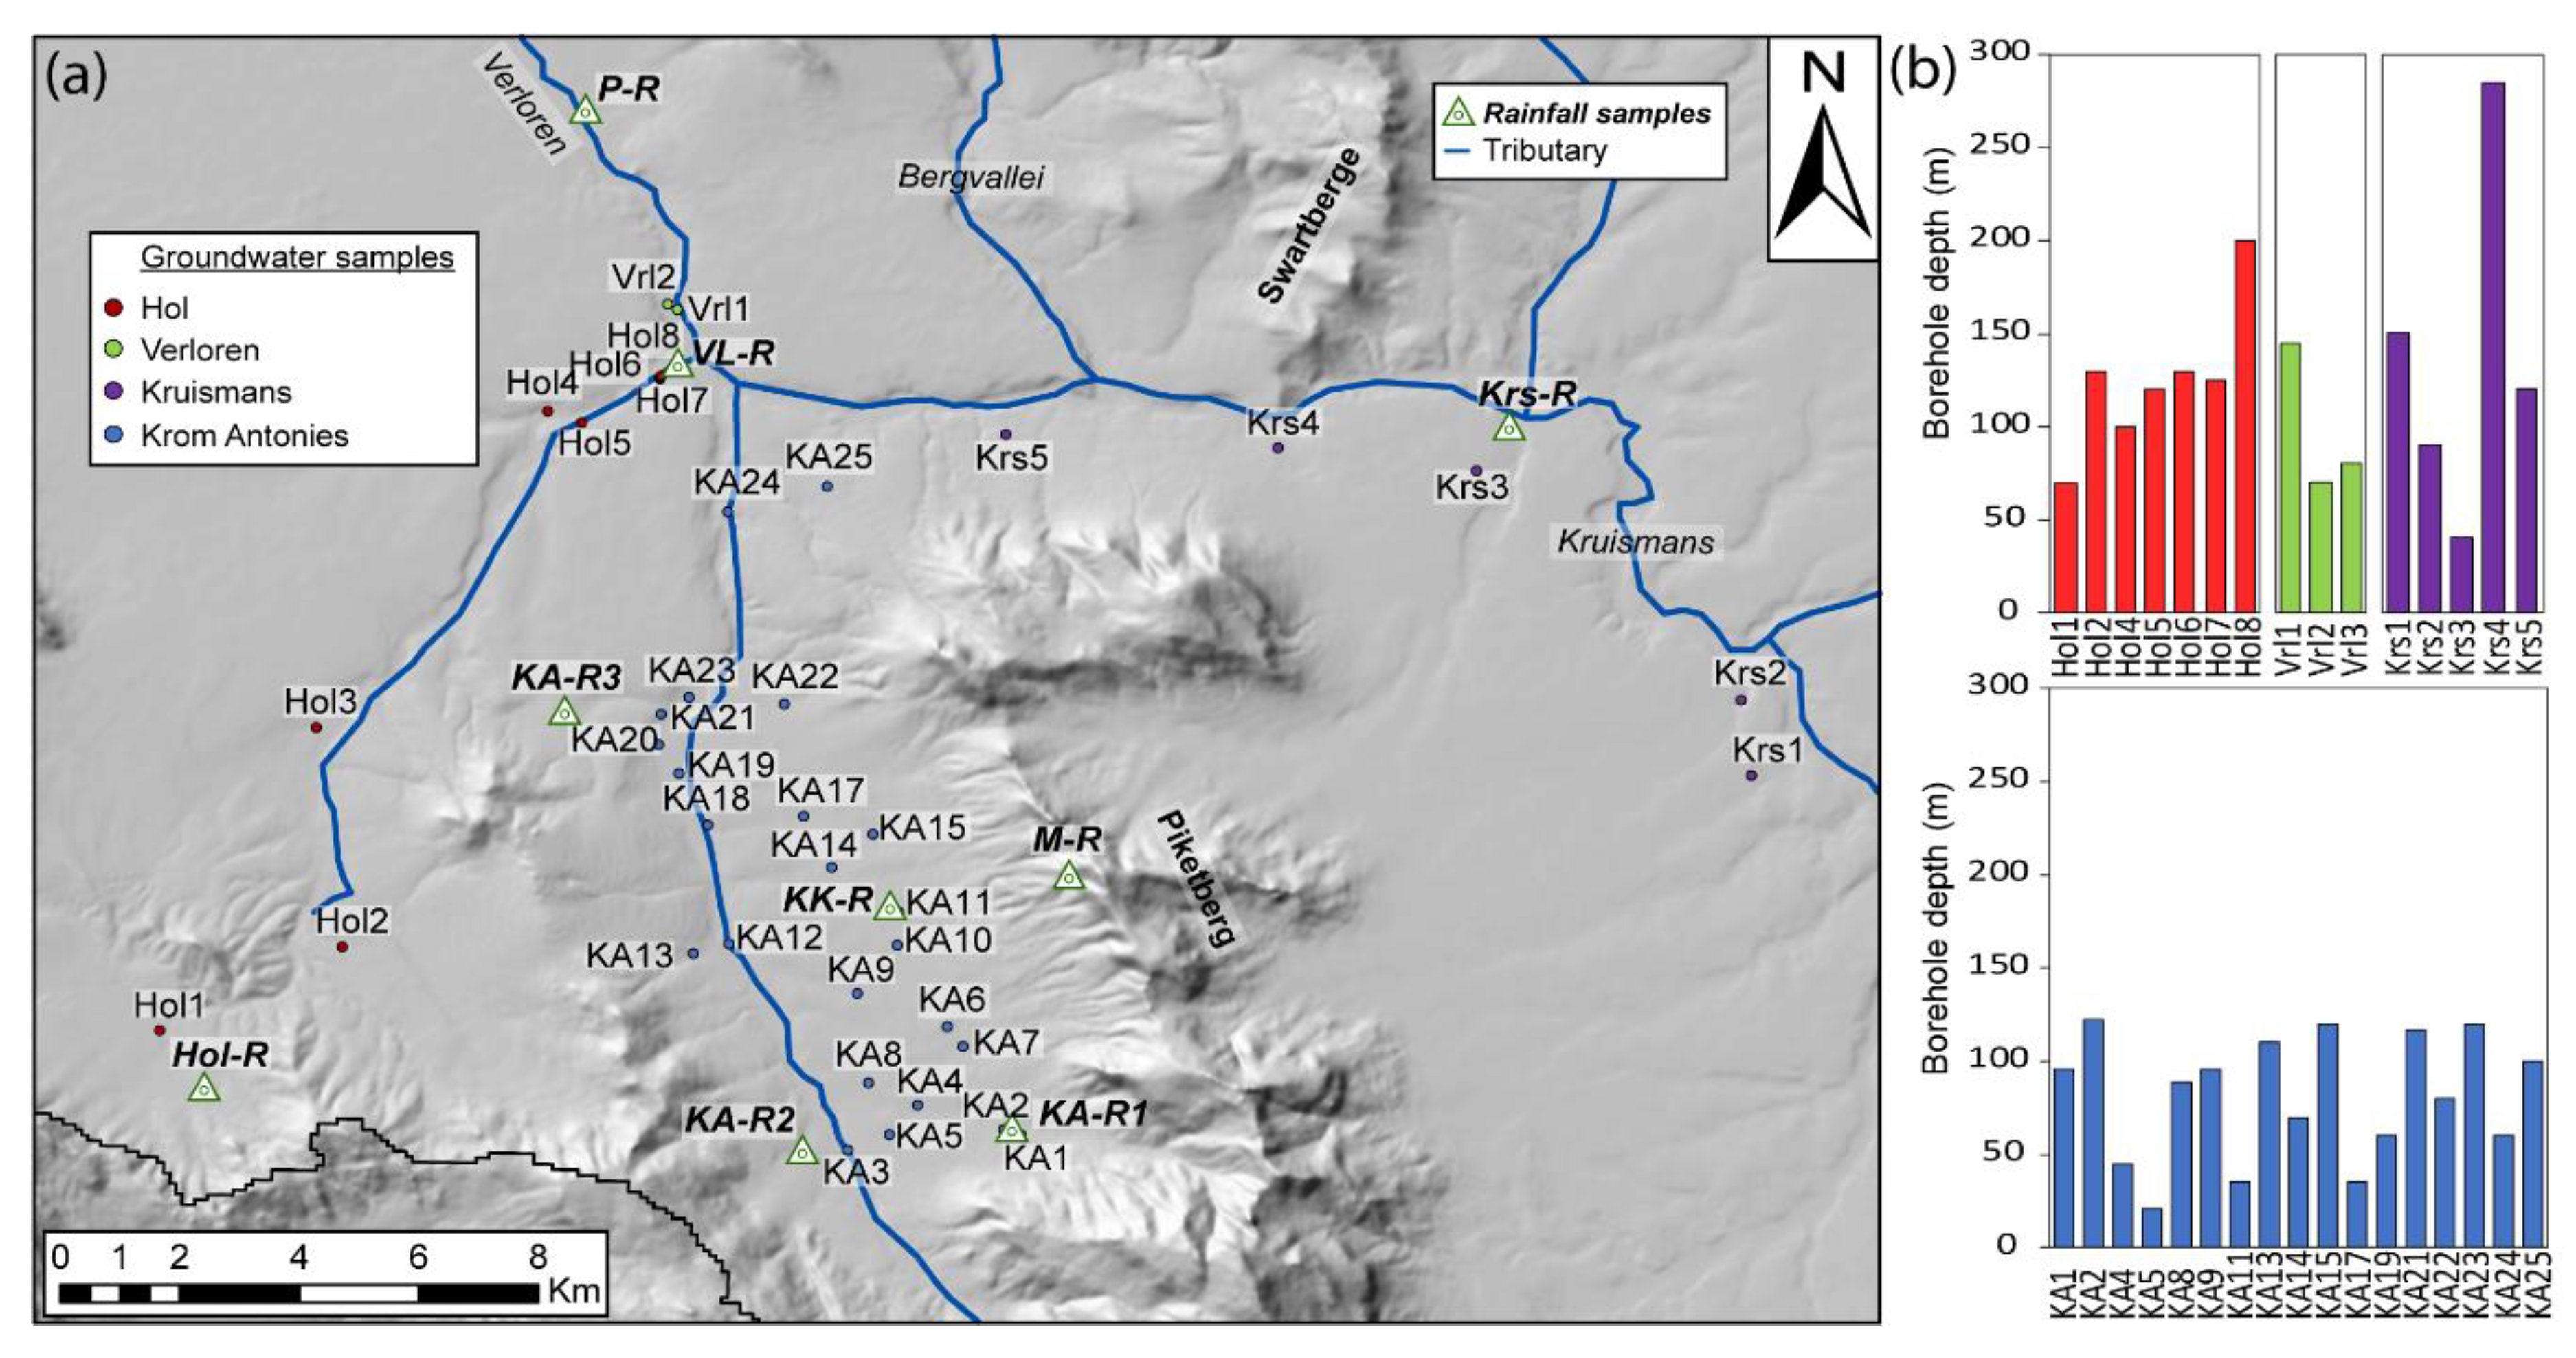
Precipitation is spatially variable in the Verlorenvlei catchment, and local farmers were asked to collect rainwater. Although eight sites for monitoring of precipitation were chosen, only three sites had enough precipitation samples collected to be considered representative. These sites were KA-R2 at the top of the Moutonshoek valley, KK-R along the Krom Antonies and VL-R near the confluence of the four main tributaries (
Figure 3). The collection locations were situated a minimum of five metres from any trees or obstacles, and not near any large dirt roads, to minimise dust pollution. In addition to these three daily precipitation collection points in the valley, a cumulative precipitation collector (M-R) was erected on the Piketberg Mountains in March 2016, with sample collection in September of that year (
Figure 3). This was to address the large discrepancy between precipitation falling at the top of the mountain and precipitation falling on the lower slopes and in the valleys themselves. The collector was equipped with a measuring gauge to assess the total precipitation, as well as a mesh covering and bird spikes to prevent any solid deposition from contaminating the sample. Cumulative precipitation collector M-R is located at an elevation of 620 metres above sea level (m a.s.l.), compared with 53 m a.s.l., 145 m a.s.l. and 111 m a.s.l. for VL-R, KK-R and KA-R2, respectively.
Sampling for KK-R and VL-R commenced in June 2015 and KA-R2 in July 2015. KK-R collected samples for one year until June 2016, while KA-R2 and VL-R continued collecting samples until October and September 2016, respectively (
Figure 4). The people collecting rainwater samples were instructed to collect rainwater after every precipitation event at 8am, to minimise the effects of evaporation and to have a standardized collection time. The collection procedure involved transferring the rainwater from the gauge to a clean 50 mL polypropylene (PP) tube, noting the time and amount of precipitation, and then refrigerating the sample until collection. Discrepancies exist between the recorded amount of precipitation at each collector and the amount of rainwater actually collected. This is principally because small-volume events were often not sampled and occasionally, the people doing the collection were away. KA-R2, KK-R and VL-R collected a minimum of 20 samples each between 2015 and 2016. KA-R2 collected the largest percentage of total precipitation (87% in 2016), with KK-R and VL-R collecting a smaller percentage of total precipitation (between 51% and 76%) (
Figure 4). Before chloride and stable isotope analysis, samples were filtered into two clean 15 mL PP tubes using 0.45 μm cellulose acetate filters.
2.2.2. Groundwater Sampling
Six groundwater sampling trips took place during 2015 (June, September, November) and 2016 (March, June, November), with 102 samples collected from 41 boreholes across the catchment (
Figure 3a). All boreholes were tapping into the MG aquifer. Of the 41 boreholes sampled, the depths of nine boreholes are unknown. The shallowest boreholes occur along the Krom Antonies, ranging between 21 and 122 metres in depth, with only 6 of the 17 recorded depths being greater than 100 metres (
Figure 3b). The deepest borehole sampled in this study occurs along the Kruismans at Krs4 (
Figure 3b), with a depth of 285 metres, and could possibly be tapping into a deeper aquifer. Along the Hol tributary, borehole depths range between 70 and 200 m, with the deepest borehole (200 m) occurring at the confluence (Hol8). The three boreholes situated after the confluence in the Verloren range in depth from 70 to 145 m. Not all boreholes were able to be sampled every field trip due to logistical difficulties associated with the drought. No samples were collected from the Bergvallei tributary because of a lack of suitable boreholes to sample from.
Sixty-four groundwater samples were collected in 2015, and 38 in 2016. An electric pump was fitted to 38 of the boreholes, allowing them to be purged before sampling. Artesian boreholes KA12, KA17 and KA19 flow throughout the year and hence did not require a pump or purging to sample. In all cases, samples were taken as close as possible to the borehole. However, in some instances it was not possible to take a sample at the borehole and the sample could only be taken at a take-off point, usually delivered through a length of black agricultural PVC pipe. The longest distance between borehole and sampling point was 300 m, and purging times were adjusted accordingly to account for this distance. Prior to sampling, boreholes were purged until the electrical conductivity (EC) had stabilised. All samples were filtered through 0.45 μm cellulose acetate filters, and the collection tubes were thoroughly rinsed with filtered sample water before being filled with no headspace. All samples were kept cool and dark until analysis. Samples for major cations and anions as well as selected trace elements were collected in 50 mL PP tubes. The cation samples were acidified with nitric acid to prevent the precipitation of metals. Samples for stable isotope analysis were collected in 15 mL PP tubes. Alkalinity samples were processed in the Department of Soil Science, Stellenbosch University within one day of sampling.
2.3. Analytical Techniques
EC, pH and temperature were measured in the field with portable EXTECH EC500 pH/conductivity probes. Probes were calibrated each day against pH standards of 4, 7 and 10, and EC standards of 1413 μS/cm and 12,200 μS/cm. EC was also measured in the laboratory of the Department of Soil Science (Stellenbosch University) using a Eutech con700 EC meter, to validate the values obtained by field probes. Alkalinity was determined using a Metrohm 702 SM Tritrino Autotitrator. For all samples, total alkalinity was equal to the bicarbonate alkalinity (given as mg/L HCO3−).
Cations (Na+, Mg2+, Ca2+, K+) were analysed on a Thermo iCAP inductively coupled plasma optical emission spectrometer (ICP-OES) in the Central Analytical Facility at Stellenbosch University. NIST traceable standards were used for calibration, and the relative standard deviation on analyses was less than 5%. Groundwater Cl− and SO42- were measured on a Dionex DX-120 IC at the Institute for Groundwater Studies at the University of the Free State. The instrument was calibrated daily against six prepared standards of NaCl and Na2SO4, where the relative standard deviation was less than 2%. Rainwater typically has very low chloride concentrations, and extra care was taken to properly evaluate the concentration of chloride in these samples. A total of 94 rainwater samples were analysed for chloride. From this total, 34 samples (collected in 2015) were only analysed in the Department of Soil Sciences at Stellenbosch University using a Dionex DX-129 IC, and 60 samples (collected in 2016) were only analysed in the Institute for Groundwater Studies again at the University of the Free State using the same method for the groundwater samples. A random selection of seven samples (collected in 2015) were analysed at both the Department of Soil Sciences and the Institute for Groundwater Studies, for comparative purposes. The results were within 2% of each other. The TDS (total dissolved solids) is defined as the total sum of major anions and cations for each sample, and is presented as mg/L.
An average charge balance of −2.3% was obtained for the 102 groundwater samples. The 64 samples collected in 2015 recorded an average charge balance of −5.5%, whilst those from 2016 recorded an average charge balance of +4.0%. For piper diagrams, only samples with a charge balance of between −10% and +10% were used (n = 72). Of the 30 samples that failed charge balance calculations, 23 came from 2015 and 22 of these had excess anions over cations. For 2016, 7 samples failed charge balance with 6 having excess cations over anions. Poor charge balance is most likely related to issues with measurement of HCO3− concentrations and as a result, all chloride data was used in the CMB calculations.
Stable oxygen and hydrogen isotope analyses were undertaken by the Environmental Isotope Group (EIG) at iThemba Laboratories in Johannesburg, South Africa using a PDZ Europa GEO 20-20 gas mass spectrometer. The analysis technique uses a PDZ water equilibration system (WES), using dual inlet mode. Calibrated laboratory standards LGR2, VSMOW2 and IA-RO53 are run with every batch of samples, and δ18O and δ2H isotope values are reported relative to Standard Mean Ocean Water (SMOW). The results are presented in the common δ-notation, which shows a deviation (in parts per thousand) from SMOW. Analytical precision is estimated to be 0.1‰ for δ18O and 0.3‰ for δ2H. Deuterium excess (d) was calculated according to d = δ2H − 8 × δ18O.
2.4. Chloride Mass Balance Approach
The established relationship between precipitation and recharge used to calculate recharge using the chloride mass balance approach is expressed as
where
is the recharge flux expressed in mm/year,
is annual precipitation in mm/year,
is the weighted mean concentration of chloride in precipitation and
is the average concentration of chloride in the groundwater, both in mg/L [
16]. The weighted mean values of chloride in rainwater were calculated by multiplying the daily precipitation amount (mm) with the chloride concentration in the rainwater (mg/L) for the sample taken that day, according to
where
is the daily recorded precipitation amount (in mm) and
the chloride concentration of the rainwater sample corresponding to that day of precipitation (in mg/L). Weighted average compositions for δ
18O and δ
2H in precipitation are calculated in the same manner. For the mean chloride concentration in groundwater, the above approach is not applicable because there is no amount parameter. Instead, the chloride concentration in groundwater is calculated using a harmonic mean approach for each sample location where more than two samples were taken.
4. Discussion
Using the hydrochemical and stable isotope data described above to identify areas where groundwater salt recycling is occurring, the CMB technique can be applied in regions where chloride is conservative. The approach relies on developing a conceptual understanding of the dominant groundwater flow paths and potential mixing points, using rain and groundwater compositions. This is used to identify the dominant recharge pathways and from this, the selection of groundwater compositions to be used for CMB calculations.
4.1. Groundwater Characterisation
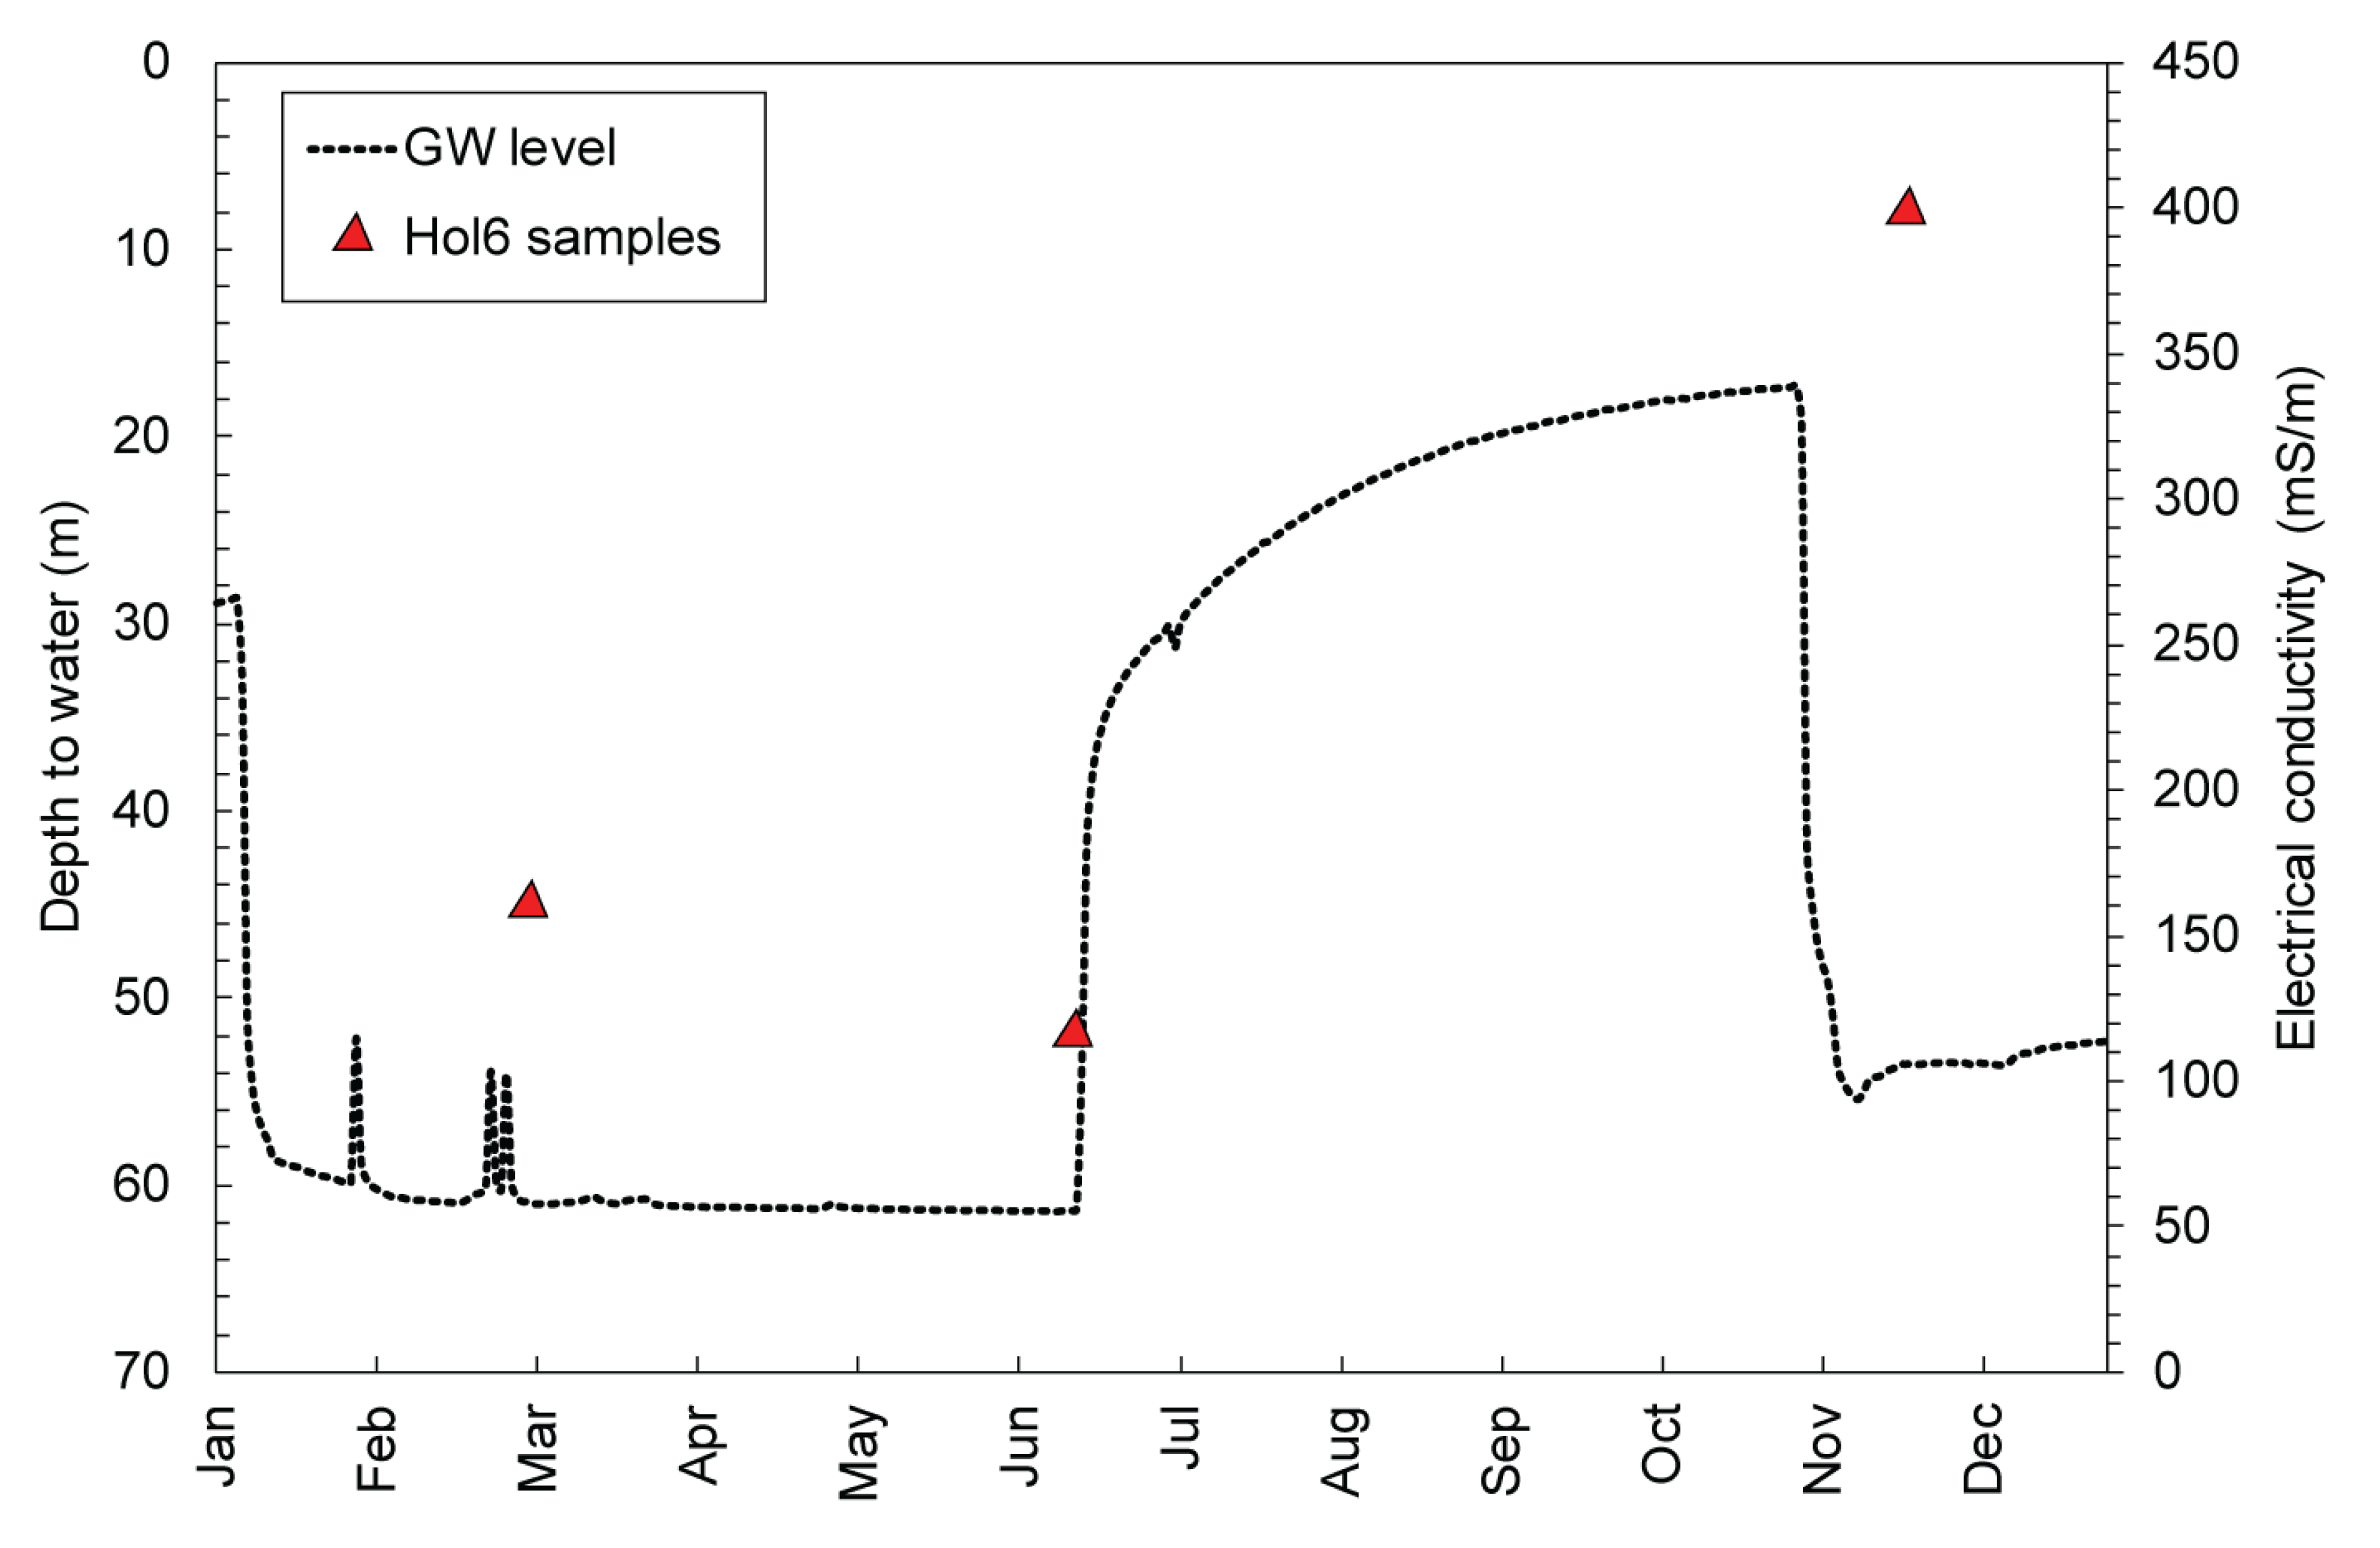
Although most of the groundwater samples show minor seasonality effects, there are some boreholes where the groundwater hydrochemistry was more variable than expected given the low rates of recharge and groundwater flow characteristics of the aquifers postulated thus far [
30,
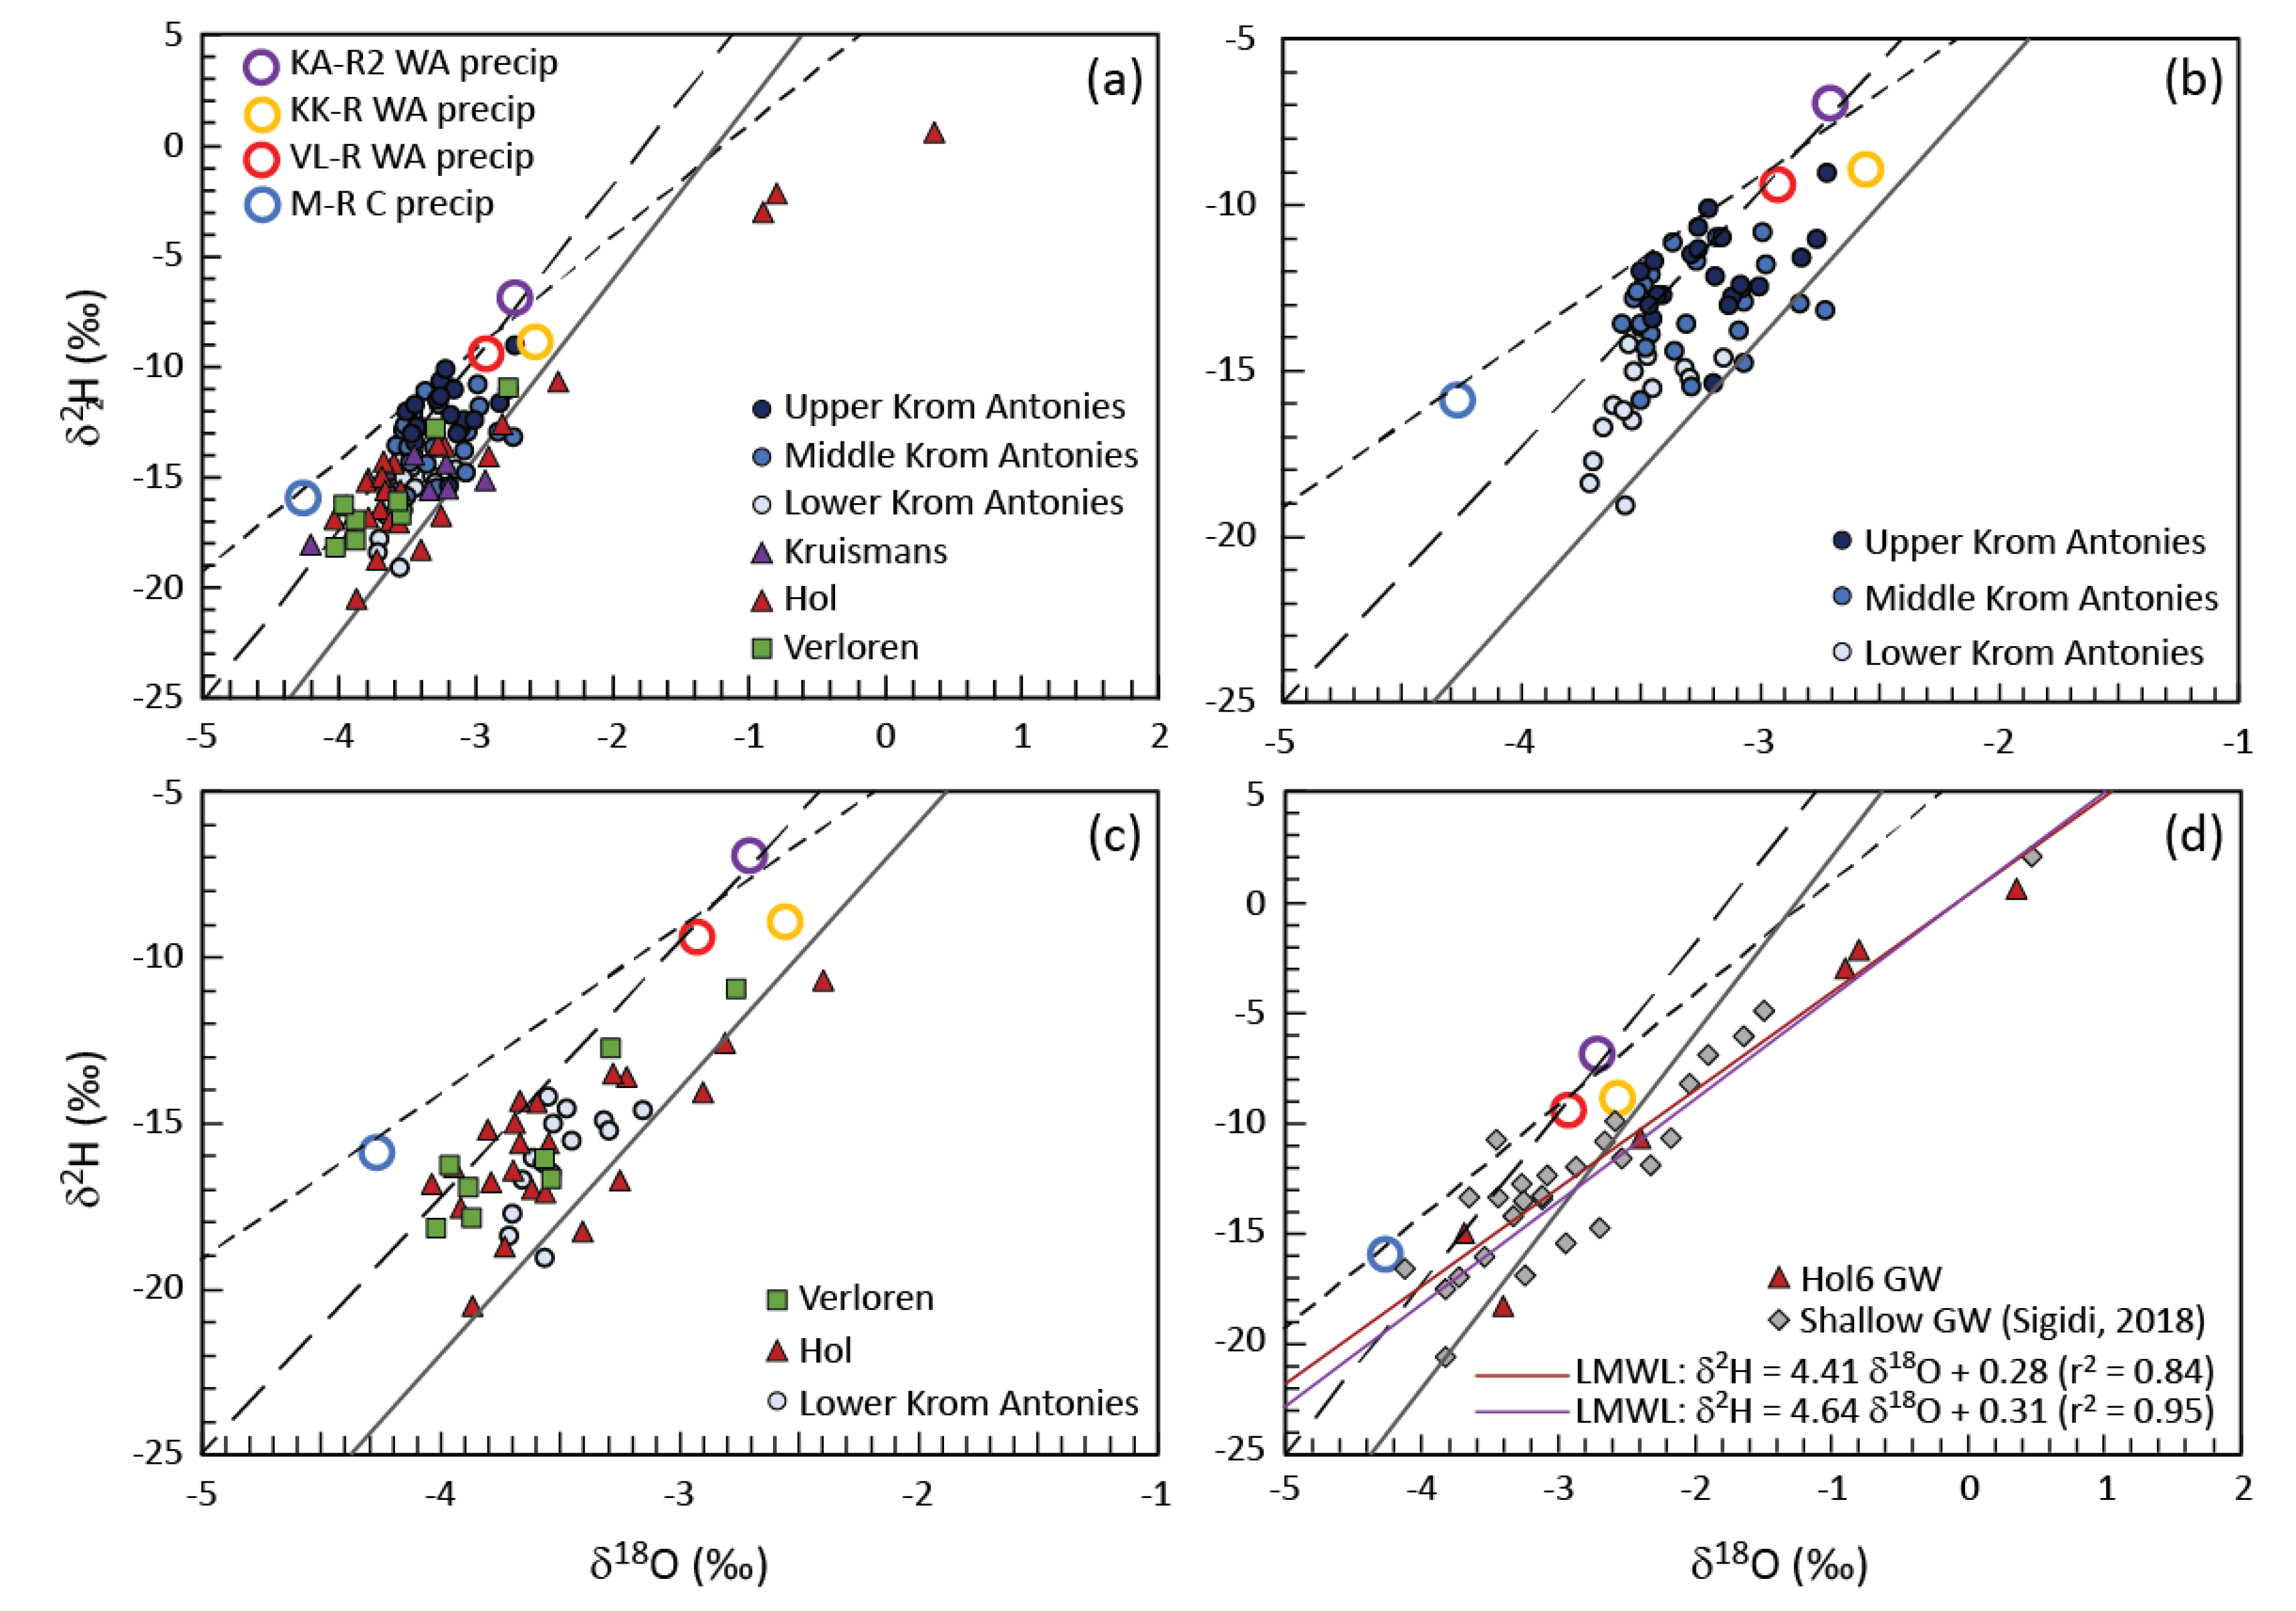
33]. This is well represented by location Hol6 where for the six times this borehole was sampled, the average EC was 292 mS/m, a median EC of 308 mS/m, with a standard deviation of 136 mS/m. In comparison, Krs3, which was also sampled on six occasions and has a similar microclimate, had an average EC of 53.2 mS/m, a median of 56.1 mS/m, with a standard deviation of 6.91 mS/m. In both cases, the difference between the average and the median is approximately 2.6%, however, Hol6 exhibited a much larger standard deviation between the recorded EC. Comparison of the stable isotope composition of Hol6 with shallow groundwater of the alluvial aquifer system (
Figure 8d) suggests that borehole Hol6 in the MG aquifer is connected to the shallow alluvial aquifer. However, a more detailed analysis of the relationship between the MG aquifer and the alluvial aquifer based on stable isotopes [
38,
48] indicates that this is not the norm for the catchment, and that generally the two aquifer systems show limited signs of connection. This is further supported by hydrological modelling and measured groundwater levels [
32,
33]. We therefore interpret that groundwater which exhibits considerable variation in hydrochemical parameters, such as of borehole Hol6, is impacted by groundwater mixing from the alluvial aquifer upon drawdown of the MG aquifer, due to pumping that transports saline groundwater into the MG aquifer system (
Figure 9).
4.2. Groundwater Flow Paths
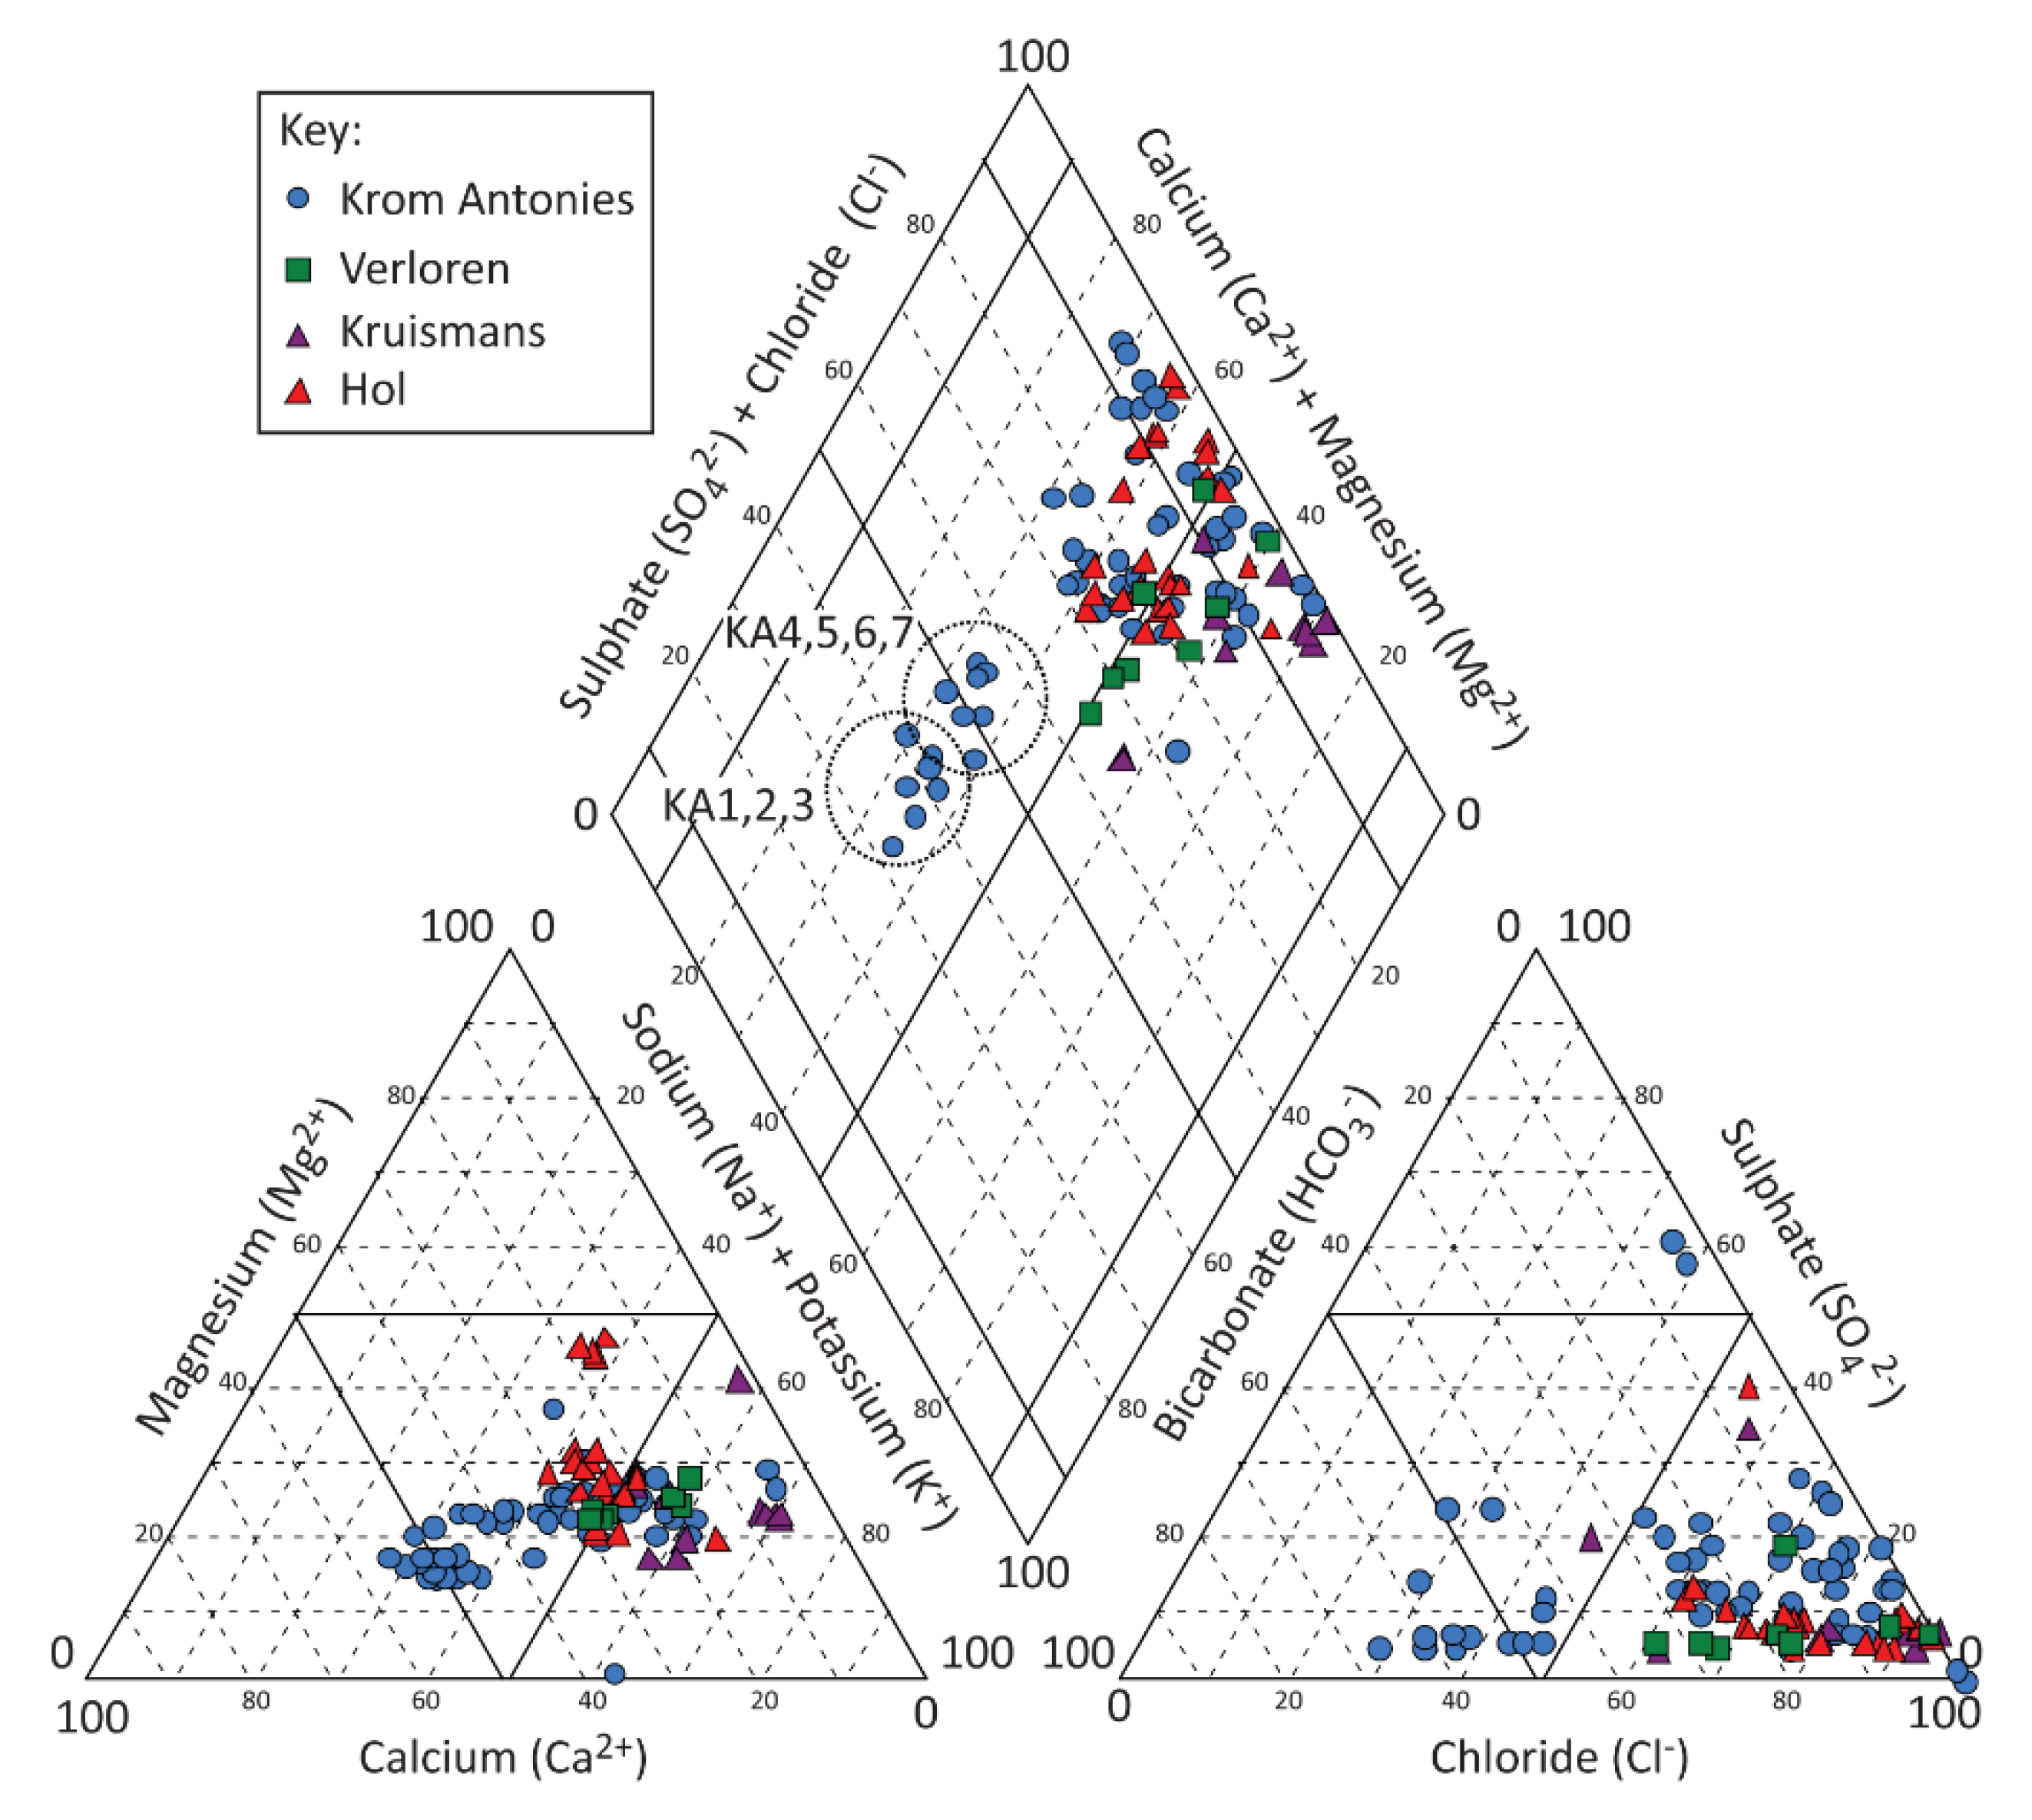
Groundwater in the Kruismans, Hol and Krom Antonies tributaries can be separated based on hydrochemistry and stable isotopes. The Kruismans is characterized by Na+-Cl− type groundwater. Little to no interaction between the alluvial and MG aquifers exists along the Kruismans, a function of the clay aquitard and the saline composition of the MG aquifer that may relate to the presence of older groundwater, possibly with palaeo-marine salts. The Hol groundwater is Ca2++Mg2+-Cl− type transitional to Na+-Cl− type. In comparison, groundwater in the upper Krom Antonies is a fresher Ca2+-HCO3− type evolving to a Na+-Cl− type in the lower parts of the catchment. The Verloren represents the confluence of these tributaries and itself is Na+-Cl− type groundwater. To constrain the resident salt contribution from direct percolation of rainwater, tributaries and sections of the catchment which resemble dominant Na+-Cl− type groundwater need to be separated from those with a Ca2+-HCO3− and Ca2++Mg2+-Cl− type. The Krom Antonies is thus the only tributary where chloride is conservative. However, along the Krom Antonies there is a shift from calcium to sodium as the dominant cation, and bicarbonate to chloride as the dominant anion, and therefore it is necessary to establish where this occurs and why. The most likely explanation is mixing with more saline groundwater types from either the Hol or the Kruismans, and thus, it is necessary to understand the dominant groundwater flow paths within the Krom Antonies in order to constrain the resident groundwater chloride.
4.3. Constraining Resident Groundwater Chloride
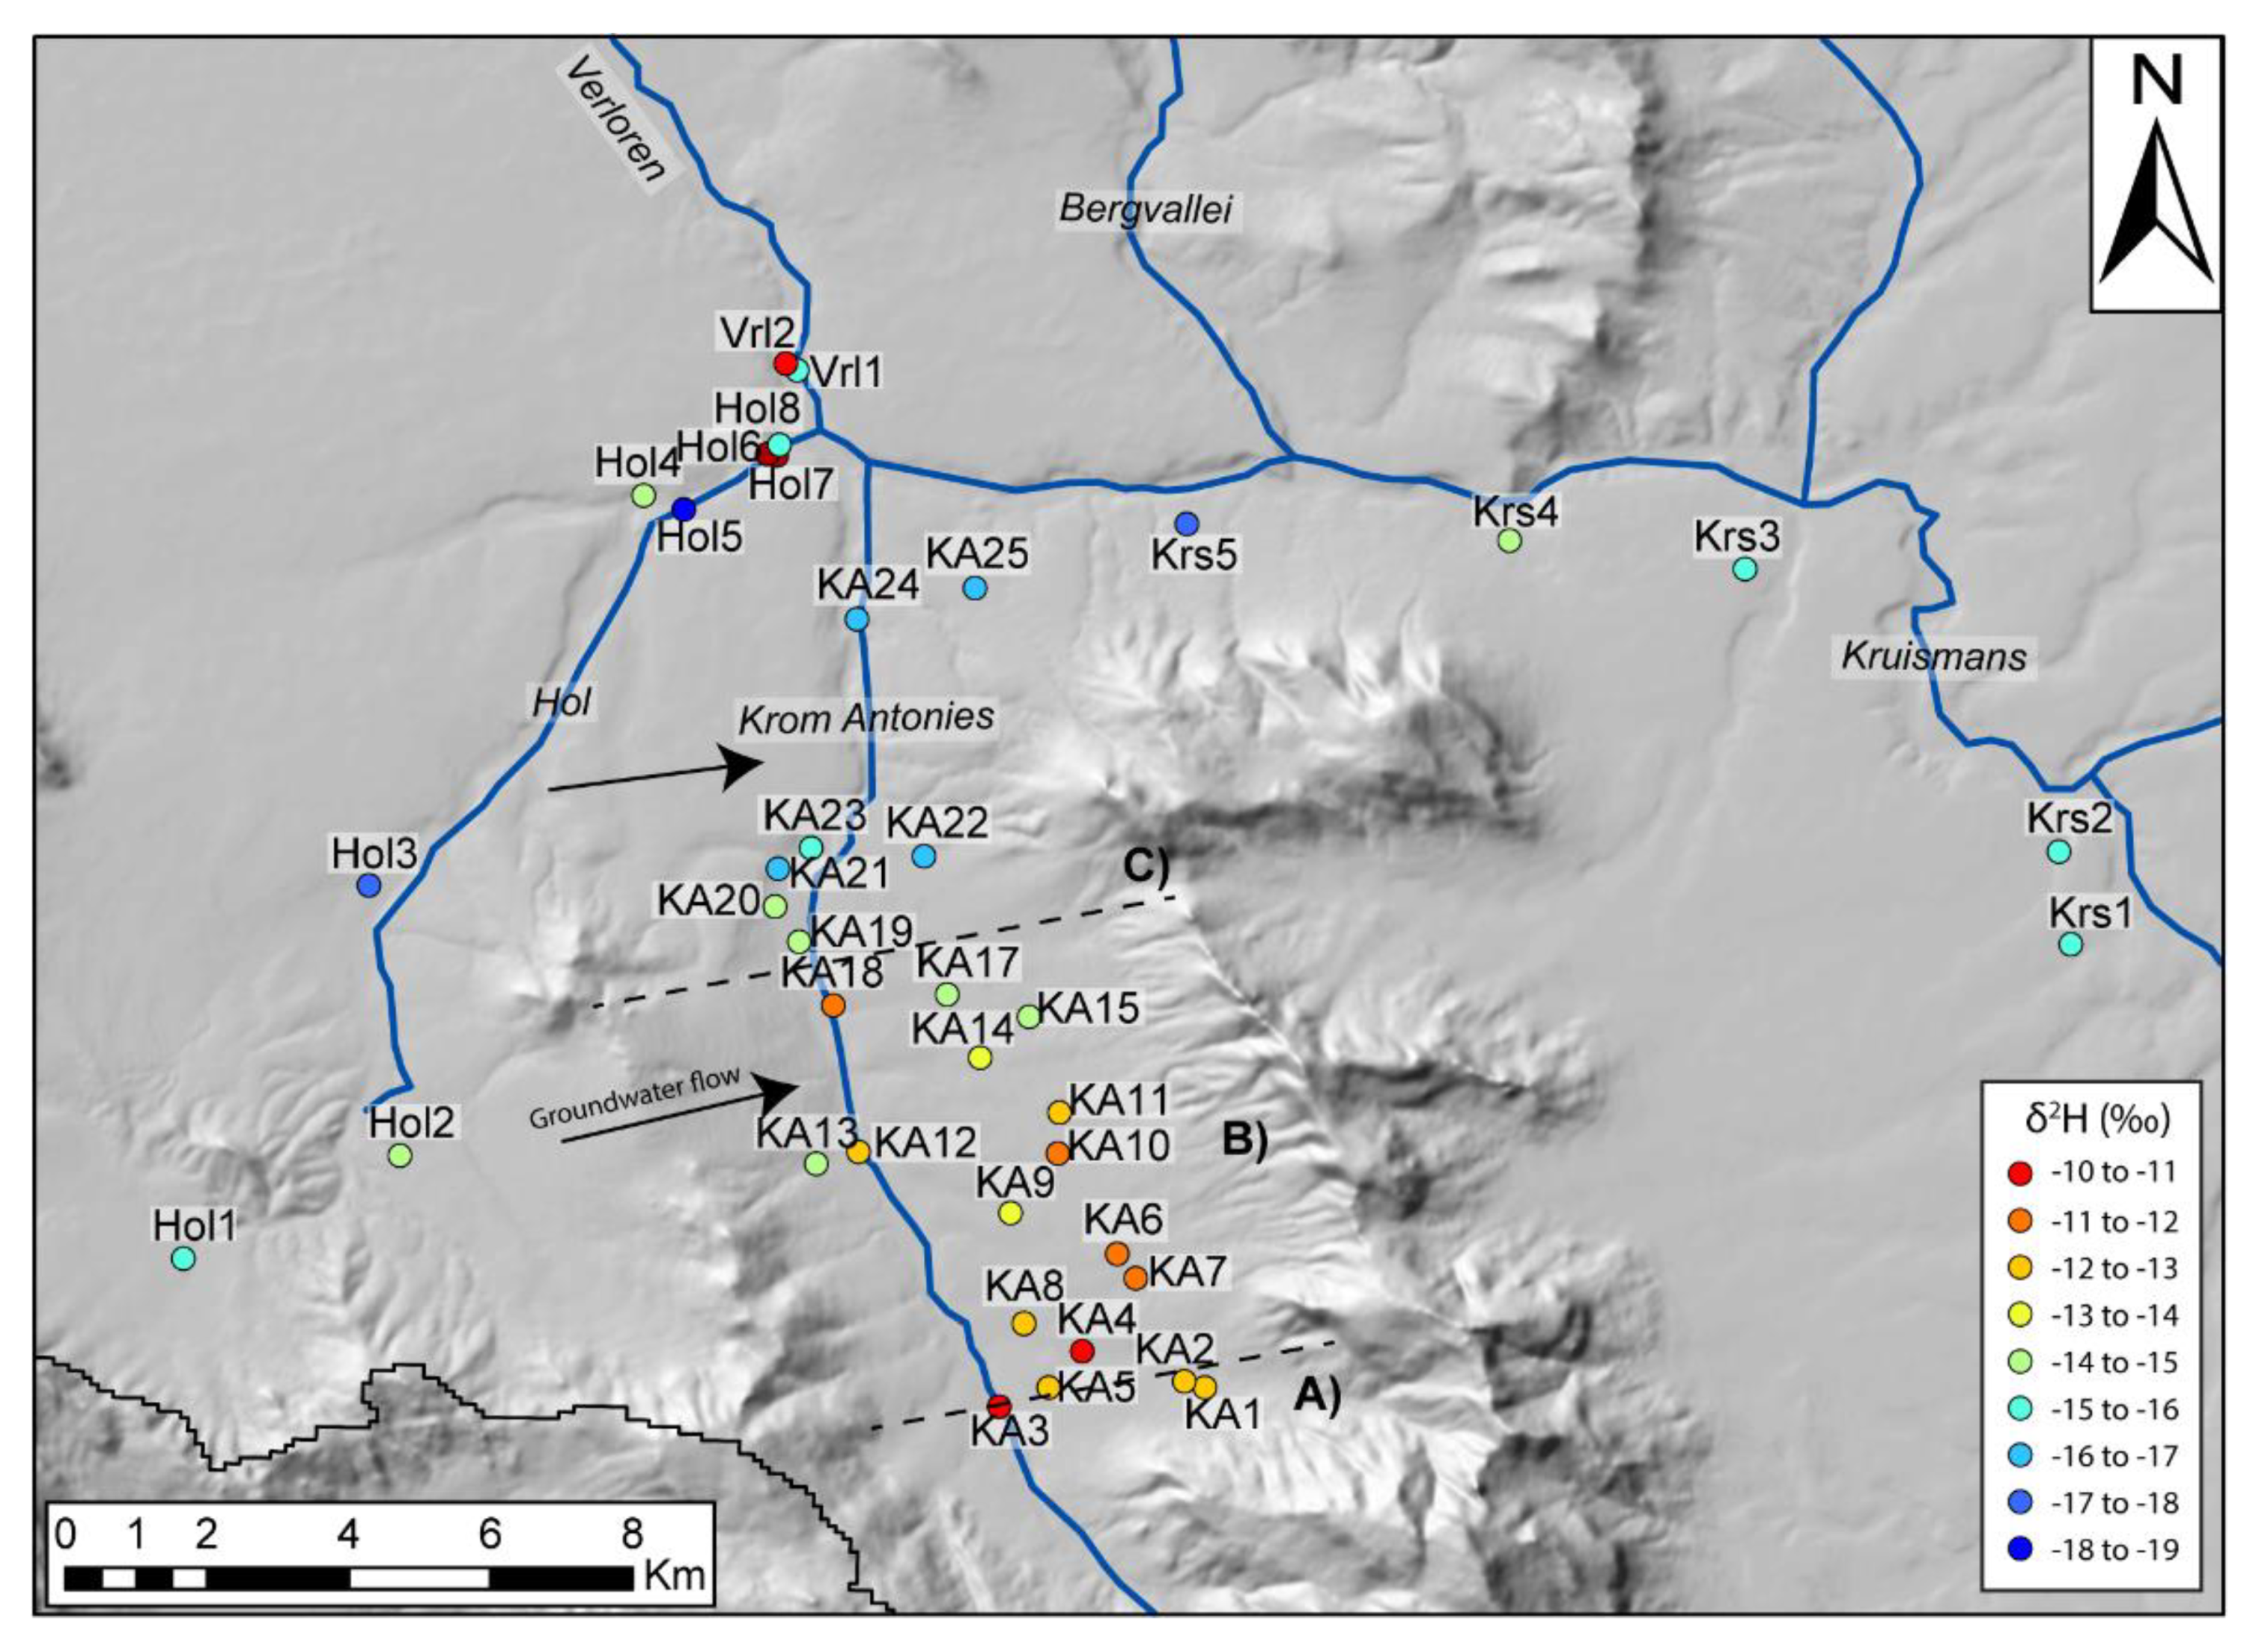
The delineation of the Krom Antonies into different sections for CMB calculations requires a tracer to identify where additional salts are introduced. In this catchment, this is best achieved using δ
2H ratios and chloride concentrations that both show strong spatial variations (
Figure 10 and
Figure 11). Groundwater in the upper Krom Antonies has more positive δ
2H ratios and greater variations in d-excess, while in the lower Krom Antonies groundwater is characterized by more negative δ
2H ratios and smaller variations in d-excess (with an isotopic slope that runs parallel to the GMWL) (
Figure 10). As such, boreholes KA1 to KA3, which have a Ca
2+-HCO
3− type groundwater, will be referred to as from the upper Krom Antonies. The groundwater of the upper Krom Antonies is likely to represent direct recharge as the boreholes are nearest to the Piketberg mountain range and receive more precipitation than the rest of the catchment. Boreholes KA4–KA18 show the same average isotopic signature as those from the upper Krom Antonies but have chloride as the dominant anion. These boreholes are located in what will be referred to as the middle Krom Antonies. Boreholes KA19 to KA25, characterised by more negative δ
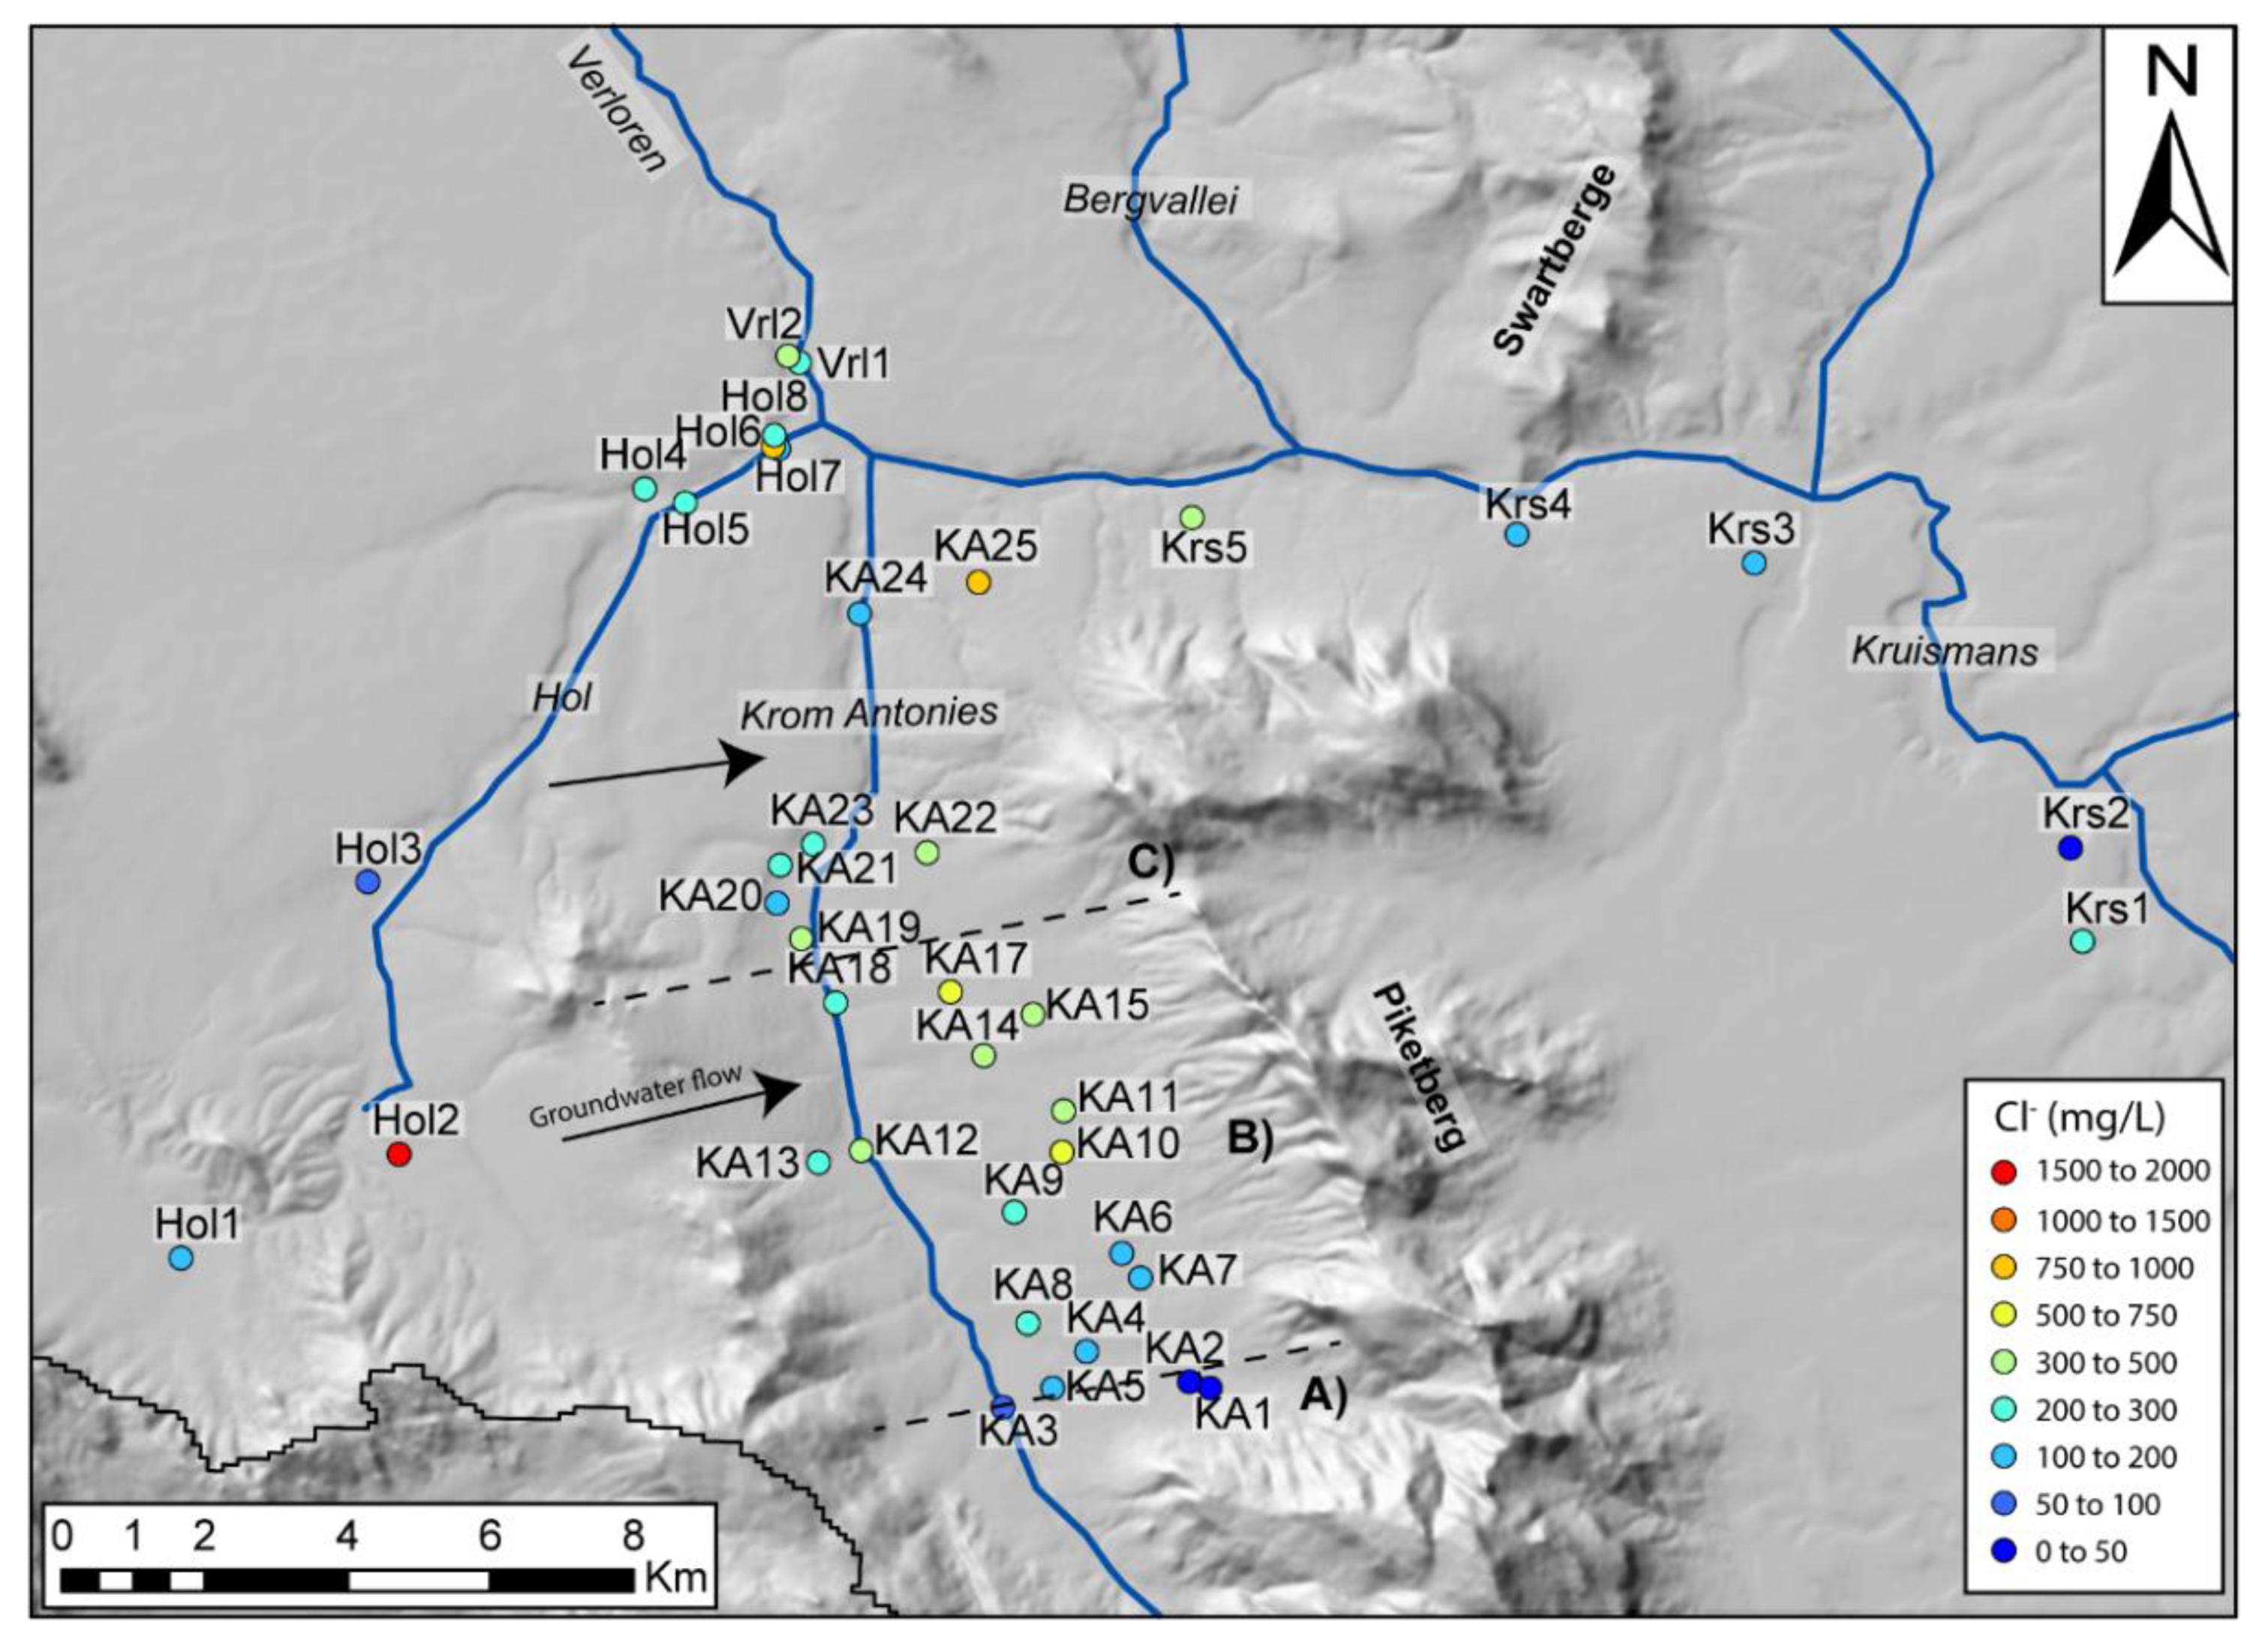
2H ratios and smaller variations in d-excess again with higher chloride concentrations, are located in what will be referred to as the lower Krom Antonies. This pattern of changing hydrochemistry and stable isotopes down the Krom Antonies suggests that an external mixing component is being added into the Krom Antonies tributary. Based on a comparison of compositions, it is apparent that groundwater from the Hol tributary is entering into the Krom Antonies from the middle Krom Antonies downwards. Analysis of the orientation of aquifer bedding planes indicates that the mountain range on the east boundary between the Krom Antonies and the Hol directs Hol groundwater into the middle and lower sections of the Krom Antonies (
Figure 11).
Furthermore, a wide neck of low topology, adjacent to the most saline borehole, Hol2, provides a mixing pathway for saline groundwater into the middle of the Krom Antonies. Similar saline conditions do not occur at Hol1 and Hol3, which have similar borehole depths to Hol2, as they are situated outside of the boundaries of the Piketberg Mountain range and are likely to not be affected by this local saline hotspot.
While understanding the mechanism of salt recycling is important for future research in the area, being able to characterise and identify regions where salt is being introduced is critical when applying CMB for recharge estimation. While the stable isotope composition of the middle and upper Krom Antonies suggest a similar recharge source, along the flow path and after the upper Krom Antonies, additional salts are prevalent in the sampled groundwater. A similar isotopic composition of the alluvial and MG aquifer for both upper and middle Krom Antonies, as well as low overall EC (~133 mS/m) for the alluvial aquifer in comparison to the other tributaries (Hol: ~740 mS/m; Kruismans: (~746 mS/m) [
38], suggest that the TMG, via transmission loss through the alluvial aquifer, supports recharge for the MG aquifer. Given this analysis of how the groundwater system in the Krom Antonies is interconnected, it would seem that only groundwater in the upper Krom Antonies is appropriate to use in the calculation of recharge using CMB. However, recharge will be calculated for the upper, middle and lower Krom Antonies to evaluate the impact of these additional salts on the CMB results.
4.4. CMB Estimation of Recharge
Precipitation collector KA-R2 was used to estimate recharge for boreholes KA1–3 in the upper Krom Antonies, collector KK-R for boreholes KA4–18 in the middle Krom Antonies and collector VL-R for boreholes KA19–25 in the lower Krom Antonies. In addition, the bulk chloride concentration in precipitation from mountain collector M-R was also used in combination with both the upper and middle Krom Antonies groundwater samples as no boreholes are available at location M-R. Results of CMB calculations are given in
Table 3 and shown in comparison to the potential recharge for similar locations provided by [
33]. The highest recharge estimates are calculated in the upper Krom Antonies and range between 21.4 and 28.4 mm/year or 4.2–5.6% of MAP using precipitation from KA-R2 and 37.6 to 50.0 mm/year or 11.5–15.4% of MAP for precipitation from M-R (
Table 3). Recharge estimates for the middle Krom Antonies, where additional salts start to be introduced, drop significantly to between 1.6 and 6.4 mm/year or 0.5–2.1% of MAP using KK-R precipitation volumes. Using the M-R precipitation volumes and chloride concentrations for the middle Krom Antonies yields recharge between 4.5 (KA10) and 18.4 (KA4) mm/year or 1.4–5.6% of MAP (
Table 3). However, high salts being added into the middle parts of the Krom Antonies from the Hol suggest that in the absence of this influx of saline water, net recharge would be on the higher end of these estimates, since groundwater chloride would be lower and more in line with chloride concentrations from KA4–6. Recharge rises again slightly for the lower Krom Antonies to between 1.9 and 9.3 mm/year or 0.7–3.3% of MAP using precipitation volumes from VL-R.
These calculations are interpreted to be robust, as changing the calculations to use the precipitation records from collector M-R for all of the boreholes makes some differences in the recharge rate, but not substantially, and does not change the overall interpretation that the bulk of recharge is occurring in the upper Krom Antonies. For example, using the chloride and precipitation volumes from collector M-R changes the average recharge rate for the 15 boreholes in the middle Krom Antonies from 3.3 mm/year and 1.1% of MAP, to 9.5 mm/year and 2.9% of MAP. Similarly, for the seven boreholes in the lower Krom Antonies, using the precipitation volumes and chloride concentration for the M-R collector changes the average recharge rate from 4.7 mm/year and 1.7% of MAP to 9.8 mm/year and 3.0% of MAP. These are still distinctly lower than the average recharge rates for the upper Krom Antonies, which are 26.0 mm/year and 5.1% of MAP using precipitation records from KA-R2 and 45.7 mm/year and 13.8% of MAP using precipitation records from M-R. Furthermore, the recharge calculations for the middle Krom Antonies, irrespective of the rainfallrecords used and the potential additional salts coming in from the Hol, are distinctly lower than those predicated by hydrological modelling [
33].
4.5. Comparison to Other Recharge Estimates
The recharge rates calculated for the upper Krom Antonies agree with previous recharge estimates of 6–8% of MAP for KA-R2 and 11–15% of MAP for M-R [
33] (
Table 3). Similarly, recharge estimates by [
30] of 13%–20% in the Piketberg Mountains agree with recharge rates calculated for the upper Krom Antonies. Discrepancies between estimates from this study and previous studies are apparent in the middle Krom Antonies, where an influx of saline groundwater has become evident. Previous studies suggest a significantly higher recharge rate of 11–15% and 18% for [
33] and [
30]. For the lower Krom Antonies, previous estimates of recharge of 2–3% of MAP for [
33] and 2.8% of MAP for [
30] are in agreement with the range of recharge rates calculated for the lower Krom Antonies in this study (
Table 3). In particular, recharge estimates for boreholes KA20 and KA24, which exhibit much lower groundwater Cl
− and more positive δ
2H values, are within ranges of previous estimates. In this study, the identification of boreholes where groundwater reflects an external mixing component was critical to understanding subtle details in the groundwater flow patterns that are difficult to identify using modelling approaches such as that employed by [
33]. This work highlights the importance of adequate hydrochemical understanding of groundwater movement and character to ensure that modelling boundary conditions are properly constrained. However, while sampling of groundwater δ
2H and Cl
− has been an effective tool to identify groundwater mixing components in this study, the identification of precipitation event volumes which contribute the bulk of recharge is important to improve the sampling of precipitation. As cumulative precipitation collectors can be biased by a single precipitation event of high Cl
−, it also becomes important to identify recharge event thresholds to improve daily precipitation collection.
4.6. What Constitutes a Recharge Event?
Collection of daily precipitation for both volume and chloride in this study has also allowed analysis of what size precipitation event contributes groundwater recharge (
Table 4). The highest recharge estimates were calculated using the mean chloride concentrations in rainwater, i.e., not weighted averages. In contrast, the lowest estimates were calculated using the mean chloride values from precipitation events >20 mm, indicating the dilution effect of chloride aerosol particles for high-precipitation events. However, these are both unrealistic scenarios, as precipitation events <20 mm are also likely to contribute to recharge, but larger-precipitation events are still likely to contribute the most. The weighted average concentration of chloride in precipitation is therefore likely to be the most representative of chloride contribution to groundwater. The weighted average chloride approach yields an average recharge estimate for KA1 of 5.5%. Analysis of recharge estimates using only precipitation events of a particular size (
Table 4) indicates that this falls between the estimate of 7.5% for precipitation events >5 mm and the estimate of 4.3% for precipitation events >10mm (
Table 4), indicating that precipitation events need to be at least ~7mm in size to overcome vegetation interception and soil moisture deficits and thereafter generate recharge. The same situation is repeated for boreholes KA2 and KA3. This is consistent with previous conceptual studies indicating that high-volume precipitation events in semi-arid conditions are required to generate significant contributions to the saturated zone [
49,
50]. This is a positive finding since climate change scenarios also predict that precipitation in these types of areas will be received in fewer but heavier precipitation events, which are on the basis of the above, far more likely to generate recharge [
51].
4.7. Groundwater Sustainability in Verlorenvlei
It is important to assess the overall sustainability of the groundwater system of the Verlorenvlei, given the demand for agricultural and socio-economic development and the threat that climate change poses to the availability of future water resources in the area. The mixing pathways and recharge calculations from this study can be used to understand the renewability of the groundwater system and the overall potential impact that agricultural abstractions might pose to the sustainability of the Verlorenvlei groundwater system. While the likely renewability of the fractured rock TMG aquifer has been highlighted in this study, the MG aquifer represents a more tenuous situation. Groundwater mixing relationships downstream in combination with relatively low overall recharge rates suggest that the MG aquifer is characterised by a large fossil/old groundwater component. This has direct implications as to how groundwater should be managed in the area, as over abstraction, above the renewable portion of the aquifer, means that groundwater is essentially being mined and groundwater depletion from the MG aquifer will become more pronounced. Evidence for this isalready occurring, with the number of “dry” holes increasing and constant borehole drilling being the norm. This has been further exacerbated by ongoing dry conditions in 2017 and 2018, which have both impacted agriculture and contributed to the ongoing drying of the Verlorenvlei lake, which had yet to recover from the 2015–2016 El Ninõ cycle.
While the recharge rates from this study and previous studies [
32,
33] suggest that the Verlorenvlei estuarine lake is not supported by baseflow from the groundwater system during low-flow conditions, the connection between the fractured rock TMG aquifer and MG aquifer is an important mechanism through which freshwater is being supplied to the Verlorenvlei groundwater system. The over abstraction in the catchment and diversion of water courses upstream therefore threatens the supplementation of relatively fresh groundwater from the fractured rock TMG aquifer, putting pressure on the downstream ecosystem which is adapted to specific salinity conditions. Low recharge rates, coupled with declining precipitation and extensive groundwater abstraction, is contributing to salinsation of the shallow groundwater system [
34] and will generate ongoing changes to the biogeochemical balance in the lake [
34]. Numerous similar studies using stable isotopes and chloride have been conducted worldwide, from Lake Chad in Africa [
52] to the Hulun Lake in China [
53], all reporting on the increasing fragility of groundwater systems and their struggle with hydrological resilience. Despite the short time frame over which this study occurred, the sampling at the height of severe drought helps to form a picture of just how difficult hydrological resilience might be to maintain into the future.


