Global Warming Impacts on Severe Drought Characteristics in Asia Monsoon Region


Department of Civil & Environmental Engineering, Sejong University, 209 Neungdong-ro, Gwangjin-Gu, Seoul 05006, Korea
*
Author to whom correspondence should be addressed.
Water 2020, 12(5), 1360; https://doi.org/10.3390/w12051360
Submission received: 2 April 2020
/
Revised: 29 April 2020
/
Accepted: 7 May 2020
/
Published: 12 May 2020
(This article belongs to the Section Hydrology)
Abstract
:Climate change influences the changes in drought features. This study assesses the changes in severe drought characteristics over the Asian monsoon region responding to 1.5 and 2.0 °C of global average temperature increases above preindustrial levels. Based on the selected 5 global climate models, the drought characteristics are analyzed according to different regional climate zones using the standardized precipitation index. Under global warming, the severity and frequency of severe drought (i.e., SPI <−1.5) are modulated by the changes in seasonal and regional precipitation features regardless of the region. Due to the different regional change trends, global warming is likely to aggravate (or alleviate) severe drought in warm (or dry/cold) climate zones. For seasonal analysis, the ranges of changes in drought severity (and frequency) are −11.5%~6.1% (and −57.1%~23.2%) under 1.5 and 2.0 °C of warming compared to reference condition. The significant decreases in drought frequency are indicated in all climate zones due to the increasing precipitation tendency. In general, drought features under global warming closely tend to be affected by the changes in the amount of precipitation as well as the changes in dry spell length. As the warming enhanced, the spatial variation of drought severity will be increased across climate zones, which can lead to increased water stress over Asia. This study demonstrates that precipitation characteristic changes can explicitly modulate severe regional drought features.
1. Introduction
Drought is a water imbalance phenomenon caused by a lack of precipitation and periodically recurring climate features. Drought occurs in areas where rainfall is below the long-term mean average [1]; therefore, drought is well known as a far-reaching and long-lasting natural disaster. Additionally, even after the drought is over, it results in various effects in related areas, such as agriculture. In this regard, drought it still challenging to determine quantitatively.
The general method used to assess drought is based on drought indices, which are commonly applied as a tool for drought analysis by analyzing drought both spatially and temporally [2]. Drought indices can be categorized as meteorological, agricultural, hydrological, and socioeconomic, depending on the analytical approach and the input variables, such as precipitation, soil moisture, and runoff [3,4]. Among them, due to the simplicity and availability of meteorological drought indices, the standardized precipitation index (SPI) and the standardized Precipitation Evapotranspiration Index (SPEI) are frequently used. Compared to the SPEI, the SPI is commonly used for operational purposes and suggested as standard drought-monitoring indices [5]. Although the SPEI characterizes drought more elaborately by considering both precipitation and potential evapotranspiration (PET) in determining drought, it typically includes the level of uncertainty in estimating the PET [6,7]. In addition, the main focus of this study is to analyze the changes in meteorological drought features in connection with changes in drought features under global warming; therefore, we selected the SPI to examine the drought characteristics. The SPI, introduced by Mckee et al. [8], is derived from the notion that droughts are initiated by a reduction in precipitation resulting from a lack of water relative to the demand for water. Since the SPI is defined only based on the precipitation in each period compared with normal or average values, it is more closely related to the variability of water cycle especially in the monsoon region.
Around the world, Asia is highly vulnerable to drought disaster due to the monsoon climate as well as large population [9]. Most of Asia such as East and Southeast Asia is highly influenced by drought [10,11,12]. The monsoon system in this region determines climates (e.g., prevailing wind direction, precipitation, evaporation); therefore, drought features depend on it [12,13,14]. For example, drought features are differ based on the season since monsoon climate in this region accompanies the seasonal precipitation variability between wet season and dry season. Additionally, various climate zones within Asia (e.g., tropical, arid climate, warm or cold temperature climate) represent the regional differences in monsoon characteristics [15] and subsequently drought occurrence even during the same season [16]. Due to these reasons, it is difficult to understand the drought features in Asia that have been impacted by complex factors.
Moreover, climate change can result in a rise in temperature, a change in precipitation patterns, an increase in evaporation volume, and temporal and spatial variations in runoff, which can change the water cycle as well as hydrologic processes in the future [10,17,18,19]. Therefore, drought characteristics for the future are expected change due to an increase in water demand and intensification of the water cycle. Recently, interest in changing the water cycle responding to enhanced greenhouse (GHG) emissions has been based on the more realistic global warming concept derived from the 2015 Paris Agreement (e.g., 1.5 and 2.0 °C global warming targets). The United Nations Framework Convention on Climate Change (UNFCCC) reached an agreement on the global warming target, which is the limitation to avoid disastrous consequences [20]. This agreement is aimed at keeping an increase in global mean temperature (GMT) below 2.0 °C above preindustrial (PI) levels and attempting a target to hold the increase to 1.5 °C above PI levels. Therefore, current studies have attempted to examine the benefits of an extra 0.5 °C increase in temperature based on the simulated change patterns under global temperature increases of 1.5 and 2.0 °C [21]. Many studies show significant impacts of a 0.5 °C warming on drought [22,23,24]. Naumann et al. [23] assessed the drought characteristics (e.g., drought magnitude) under 1.5, 2.0, and 3.0 °C global warming levels at global scale and suggested changes in drought magnitude for individual macro-regions using the drought index. Su et al. [22] and Chen et al. [24] assessed impacts of stabilized 1.5 and 2.0 °C warming on drought events in China. The findings indicate the necessity of understanding global warming impacts on drought and the need to find countermeasures to reduce the potential damage that can be induced under 1.5 and 2.0 °C of global warming. The current research on drought mainly focuses on change patterns in drought under global warming. To date, intrinsic climate characteristics of each subregion (e.g., climate zones) have been paid relatively little attention in future drought analysis.
In this study, we assess changes in drought characteristics under 1.5 and 2.0 °C of global warming over the Asia monsoon region based on the multiple projections obtained from five selected global climate models (GCMs). Our drought analysis is focused on changes in seasonal drought features and the broad continental-scale climate zones of the Asian monsoon region outlined by Asia-Pacific Network (APN) [25]. Since climate extreme events (e.g., drought and flood) are an inherent part of climate, we classify the subregions in the Asian monsoon region considering regional climate characteristics. Based on this regional classification, we suggest change behavior of climate (and hydroclimate) extremes for individual climate zone under global warming.
2. Data and Methodology
2.1. Methodology
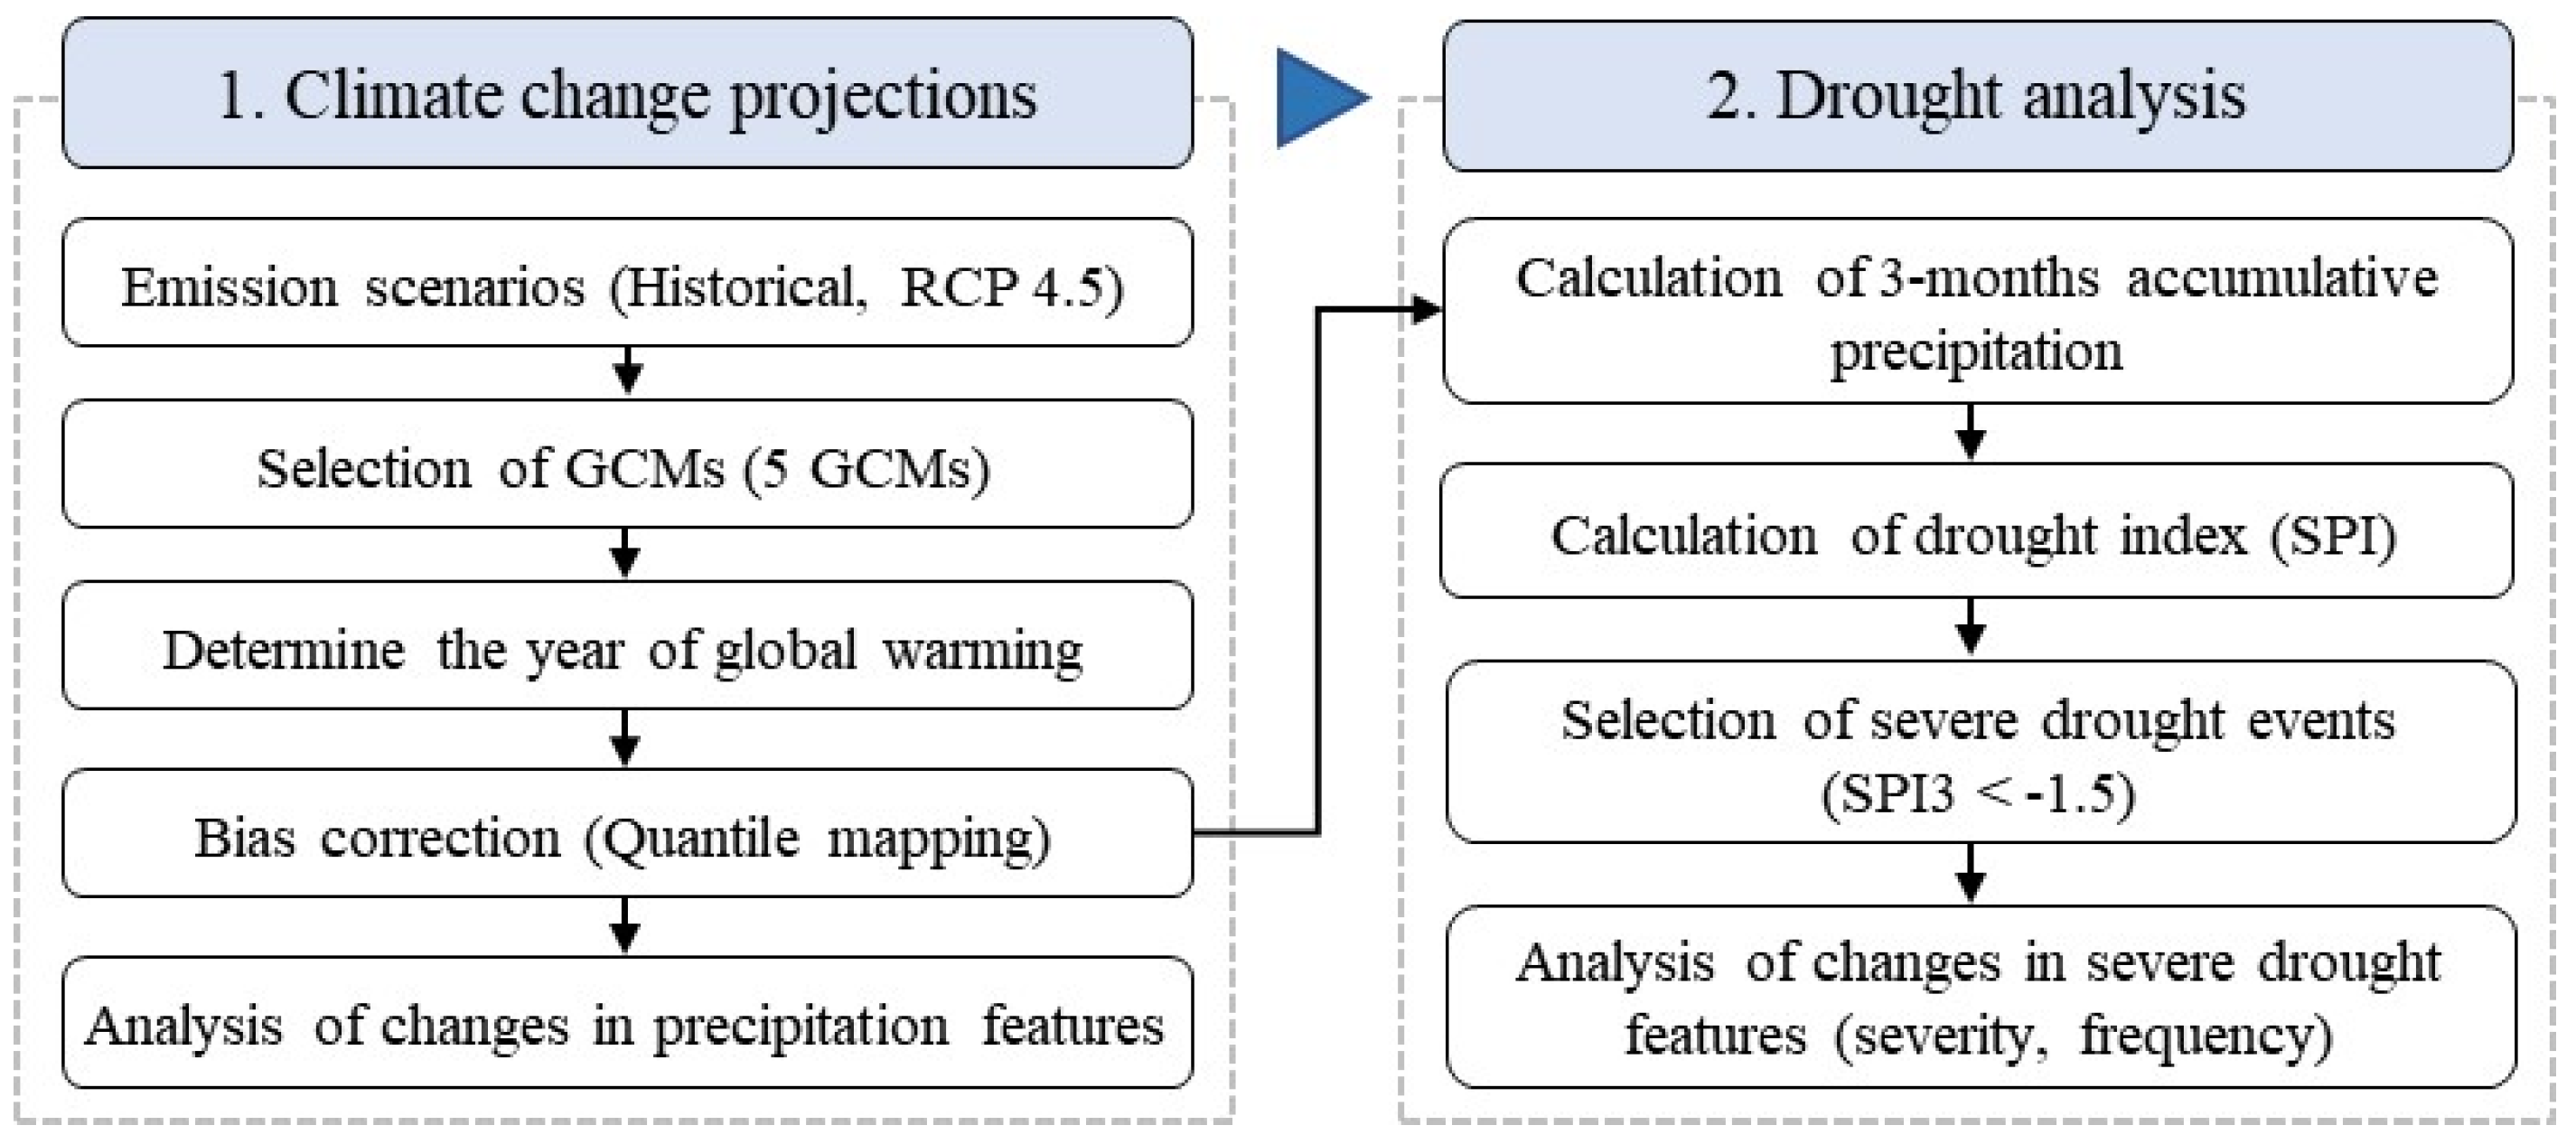
Figure 1 represents the procedure of this study that ranges from future climate projection forced by a representative concentration pathway (RCP) 4.5 scenario to regional drought analysis under global warming. For climate projections, we select five GCM outputs of the Coupled Model Intercomparison Project phase 5 (CMIP5) [26] through an evaluation procedure [27], and then, we determine a 30-year reference time period and two different 30-year future time periods corresponding to 1.5 and 2.0 °C increases in GMT above the PI levels (1861–1890) for individual GCM projections. For this process, we applied the method described by Sylla et al. [28]. Spatially disaggregated global projections of precipitation are provided as an input for the SPI after the systematic bias in each projection is removed by using the quantile mapping method. To assess the 1.5 and 2.0 °C of global warming impact on the regional climate, changes in precipitation are spatially analyzed according to identified subregions based on the climate zone.
Next, we convert the daily precipitation data extracted from each GCM to 3-months accumulative precipitation data and then calculate SPI with a 3-month duration (i.e., SPI3). To examine the severe (and extreme) drought responses under GMT increases, severe drought events (SPI3 <−1.5) are selected. Under global warming, the changes in spatial patterns and characteristics of the SPI3 (e.g., drought severity and frequency) are analyzed by comparing with those of the SPI3 for the reference period. The enhanced reliability of future precipitation and drought projections is suggested based on multimodel ensemble (MME) projections with the intermodel agreement. The MME based outputs for climate projection are effective in extracting the reliable climate data because the MME approach reduces the uncertainty among the GCMs (e.g., climate sensitivities to climate conditions [29,30,31]). This study indicates that drought change patterns are related to regional climate and future precipitation characteristics under anthropogenically induced global warming. More detailed description of each procedure is suggested in Section 2.3 and Section 2.4.
2.2. Study Area and Data Description
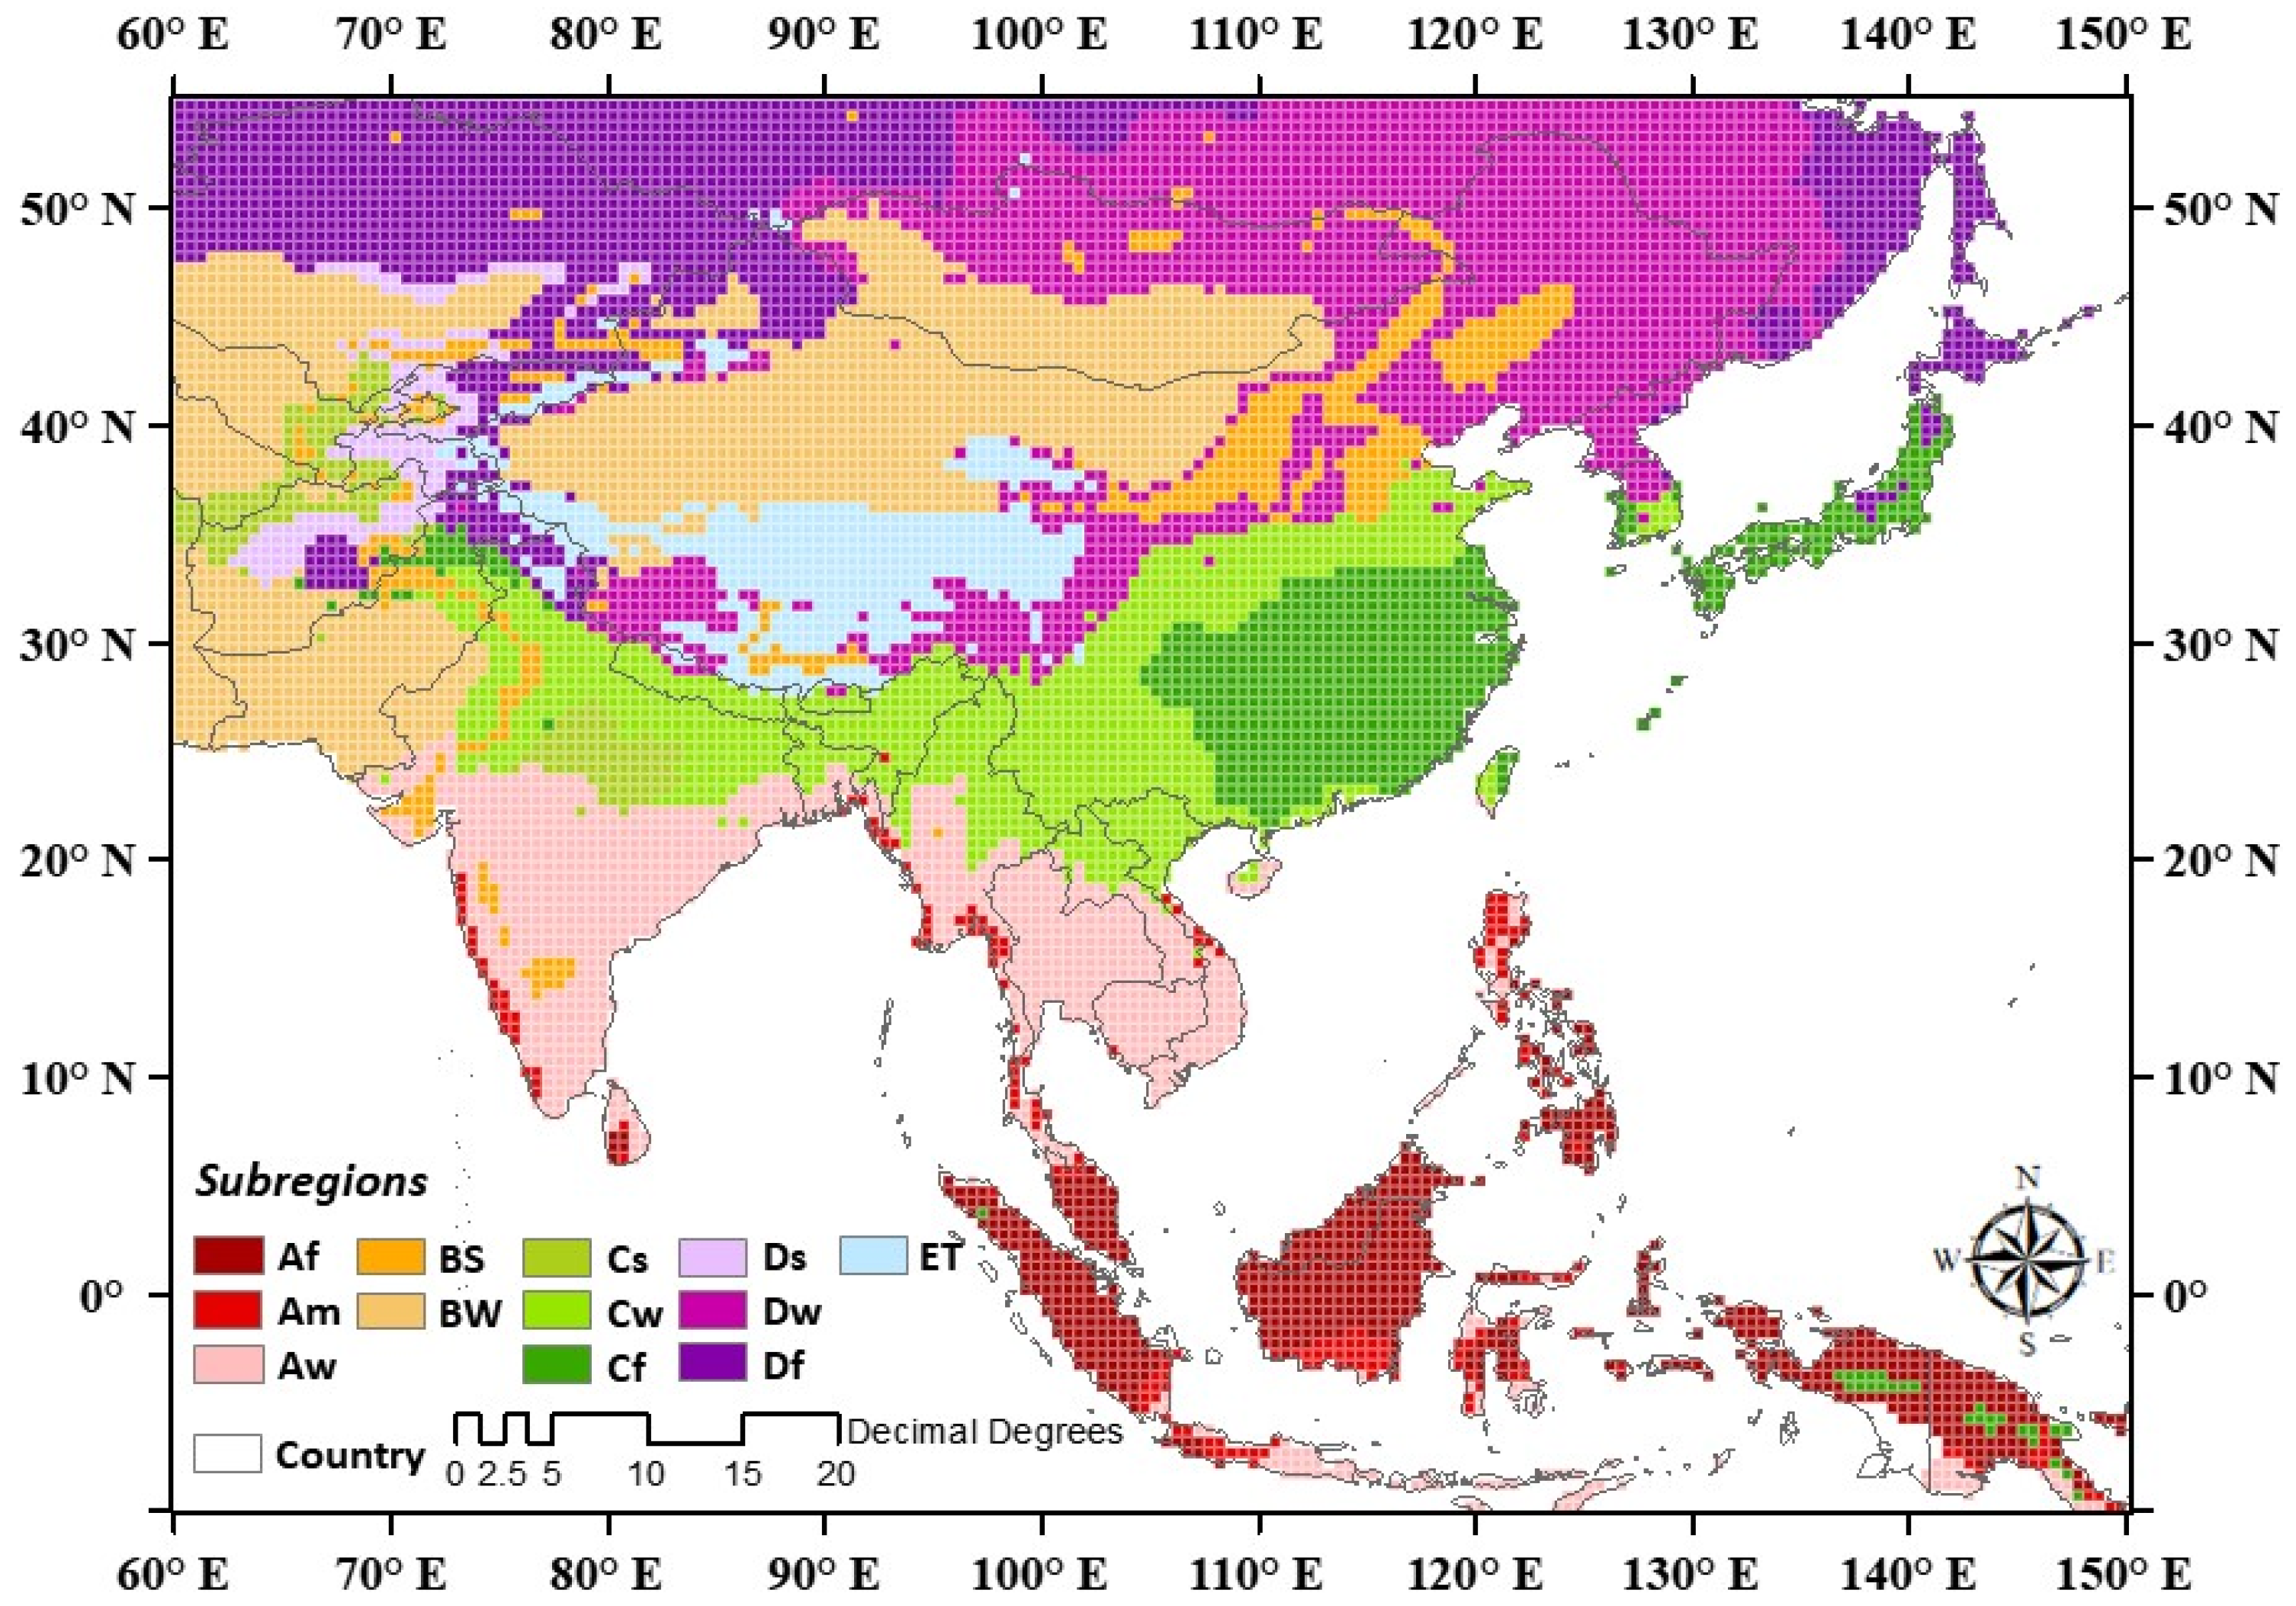
The Asian monsoon region is selected to assess the global warming impacts on drought characteristics according to GMT rise, which results from enhanced greenhouse gas (GHG) emissions. The spatial extent of the region is the range 9.75°S~54.75°N and 60.25°E~149.75°E including different climate features as shown in Figure 2. We subdivide the region into several subregions based on the regional precipitation and temperature patterns using Köppen’s climate classification method to identify the regional climate features [32]. Our regional analyses for change of drought characteristics are performed for classified subregions with individual climate feature. Each subregion is categorized as a mainly tropical climate (A), arid climate (B), warm temperate climate (C), snow climate (D), and polar climate (E) according to climate boundary conditions, which are based on threshold values of monthly temperature for climate zones A, C, D and monthly precipitation for climate zone B. Due to the method’s simplicity with ecologically meaningful classifications, it has been widely used in previous studies, such as climate change impact assessments on different climatic characteristics [33,34]. To apply this method, we used long-term past observations (i.e., maximum temperature, minimum temperature, and precipitation data) from January 1976 to December 2005. Figure 2 shows the climate zones classified by applying Köppen’s climate classification method suggested in previous study [35]. The Asia monsoon region was divided into 12 climate zones according to regional temperature and precipitation features (Table S1). The tropical climate zone (A) spreads over Indonesia, Malaysia, the Philippines, and Thailand (Af; mainly located in low latitudes); the western coastal region of India, Myanmar (Am); and some part of Indonesia, India, Vietnam, Thailand, and Myanmar (Aw; mainly located between 9°N and 25°N). The arid climate zone (B) spreads over northwestern China, some parts of Mongolia, India, Pakistan, and Afghanistan (BS), as well as northern China, southern Mongolia, Pakistan, and Kazakhstan (BW). The warm temperature climate zone (C) appeared in central and northern India and some parts of Afghanistan (Cs); the south and eastern parts of China, northern part of India, Vietnam, Thailand, Myanmar, and southern part of South Korea (Cw); and most of the southeastern part of China, costal region of South Korea, and southern part of Japan (Cf). The cold climate zone (D) spreads over the northern part of Afghanistan (Ds), northeastern China, and most of the inland region in the high latitudes (Dw, Df) above 38°N. The tundra climate zone (ET) appears on the Tibetan Plateau and the Himalayan Mountain region. The highest number of Asian monsoon region grid points is in zone D, followed by zones B, C, A, and E.
We obtained the observed precipitation data from the Asian Precipitation-Highly Resolved Observational Data Integration Toward Evaluation of water resources (APHRODITE) [36], and the maximum and minimum near-surface temperature data are acquired from the University of Washington [37,38]. The reanalysis data used here is the coupled European Centre for Medium-Range Weather Forecasts reAnalysis system-20C (CERA-20C) [39]. The various climate variables (e.g., near-surface air temperature, outgoing longwave radiation, sea-level pressure, sea surface temperature, air temperature, geopotential height, zonal wind, and meridional wind) are extracted from the CERA-20C. The observational and reanalysis data (hereafter simply referred as “OBS”), which are gridded with a same 0.5° × 0.5° horizontal resolution, are used to validate the performance of the GCM historical simulations for the period 1976–2005 and select the better-performing GCMs.
2.3. Climate Change Projections and Determination for Target Warming Periods
The five GCMs; bcc-csm1-1-m, CanESM2, CMCC-CMS, CNRM-CM5, and NorESM1-M projections from the CMIP5 are implemented in this study (for more details see in Table 1) [35]. The five GCMs among the 19 available GCMs are selected through a scrupulous evaluation scheme based on the GCM’s capability to simulate historical climate features for the period from 1976 to 2005 in the Asia monsoon region. In evaluation scheme for GCM selection as suggested by Kim et al. [30], spatial correlation coefficient (SCC) and root mean square error (RMSE) between historical simulation derived from individual GCM and the OBS are calculated for individual twelve variables (e.g., precipitation, near-surface air mean, maximum and minimum air temperature, outgoing longwave radiation, sea-level pressure, sea surface temperature, air temperature, geopotential height, specific humidity, zonal wind, and meridional wind) to evaluate the GCM performance. Moreover, we select the best-performing 5 GCMs based on its performance after screening the low-performing GCMs. The simulations for the reference period (1850–2005) and for the future period (2006–2100) under RCP4.5 scenario are employed to determine the 1.5 and 2.0 °C target warming periods of each GCM with a spatial resolution of 0.5° (approximately 50 km). More detailed description of selection of GCMs and results of GCM performance can be found in a previous paper [30].
The reference period corresponding to 0.48 °C since the PI period (i.e., 1861–1890) and two future periods corresponding to 1.5 °C and 2.0 °C warming since the PI period are determined following the method suggested in Sylla et al. [28]. Once we calculate the 30-year running average of the annual mean near-surface temperature derived from individual GCMs during the whole period (i.e., 1850–2100), the anomalies are computed from the difference between the central year (i.e., 1875) value of the PI period and the central year value of the reference period and future period. The years are taken as the central years when the anomalies exceed 0.48, 1.5, and 2.0 °C for the reference and two future periods with 1.5 and 2.0 °C of global warming. The 0.48 °C warming obtained from the observation data temperature data (i.e., HadCRUT.4.6) is suggested in Sylla et al. [28]. The central year and period corresponding to reference and target global warming for individual GCMs are suggested in Table 2. The results show a different definition of the central year and period for warming climate among the 5 GCMs. Individual GCMs differently respond to the same forcing, because they differ in the approach to modeling physical climate system and feedback process [27].
Although the GCM is commonly implemented in climate change impact studies [18,45,46,47], all GCMs have substantial limitations in simulating regional climate features due to low spatial resolution and systematic model errors [45,47]. Among the various bias correction methods used to remove systematic biases, we apply the quantile mapping (QM) method, which statistically adjusts biases by matching the cumulative distribution function (CDF) of raw GCM outputs to the observed CDF [45,47]. The QM method, which is a simple and effective way to improve the mean, variance, and extreme values [45], is applied for climatic variables (e.g., temperature and precipitation) with a daily time scale in this study. The precipitation data derived from individual GCMs is used to calculate drought index (e.g., SPI) after bias correction.
2.4. Drought Analysis
Climate change directly impacts the climate variables (e.g., temperature and precipitation) and the related extreme climate events (e.g., droughts, floods). The climate changes would lead to changes in low precipitation extremes and consequently drought events. The drought events can be described using the drought indices based on percentile-based extreme measures and using the low precipitation extremes based on duration-based dry spells, such as the maximum length of dry spell (CDD) suggested from Expert Team on Climate Change Detection and Indices (ETCCDI). Although the value of CDD index is used to describe the drought features by analyzing the lengths of dry spell (based on the number of consecutive days with daily precipitation <1 mm) with the drought occurrences, it may not directly be connected to drought events according to the regions because the relationship between the length of dry spell and each drought event depends on the regional climate features. Therefore, the CDD analysis has a limitation in comparing drought events among the different climate features. On the other hand, the results of SPI can compare the regional drought features (e.g., severity) among the various regions with the different climate features because the value of SPI are categorized by the objective criteria using the regional precipitation thresholds.
In this regard, drought indices are required to analyze the current drought phenomenon and changes in drought features due to climate change. We select the SPI [8], which is derived from the concept that drought is initiated by a decrease in precipitation that causes a water shortage compared to water demand. The index is developed under the assumption that precipitation has a direct impact on hydrological variables (e.g., river discharge, ground water and soil moisture). SPI has commonly been used to estimate the occurrence of meteorological drought due to its simplicity for calculation, required minimal input data and applicability for various durations [48,49,50]. Since the SPI quantifies the precipitation deficit for multiple time scales, it can describe the effects of a lack of precipitation on the water source for different selected time spans, such as 3, 6, 9, and 12 months [48]. Here, to assess the seasonal changes in drought under global warming corresponding to 1.5 and 2.0 °C, we selected the SPI with a 3-month duration (i.e., SPI3). SPI3 is calculated for a three-month accumulation period based on the time series of monthly precipitation derived from bias-corrected individual GCMs. Once the SPI is fitted to a probability distribution (gamma distribution) with estimated parameters, it is transformed into a normal distribution to standardize the SPI values (i.e., Z) [8]. While the mean SPI is zero, negative (or positive) values represent the dry (or wet) condition, which means the mean precipitation is less (or greater) than that of normal condition. The SPI is used for monitoring both dry and wet conditions; the same classification is applied to discern drought conditions according to the SPI range, as indicated by Table 3. We analyze the SPI with a focus on changes in the frequency and severity of droughts (e.g., −1.5 > Z) under warming period compared to the reference period.
3. Results
3.1. Future Projections of Precipitation
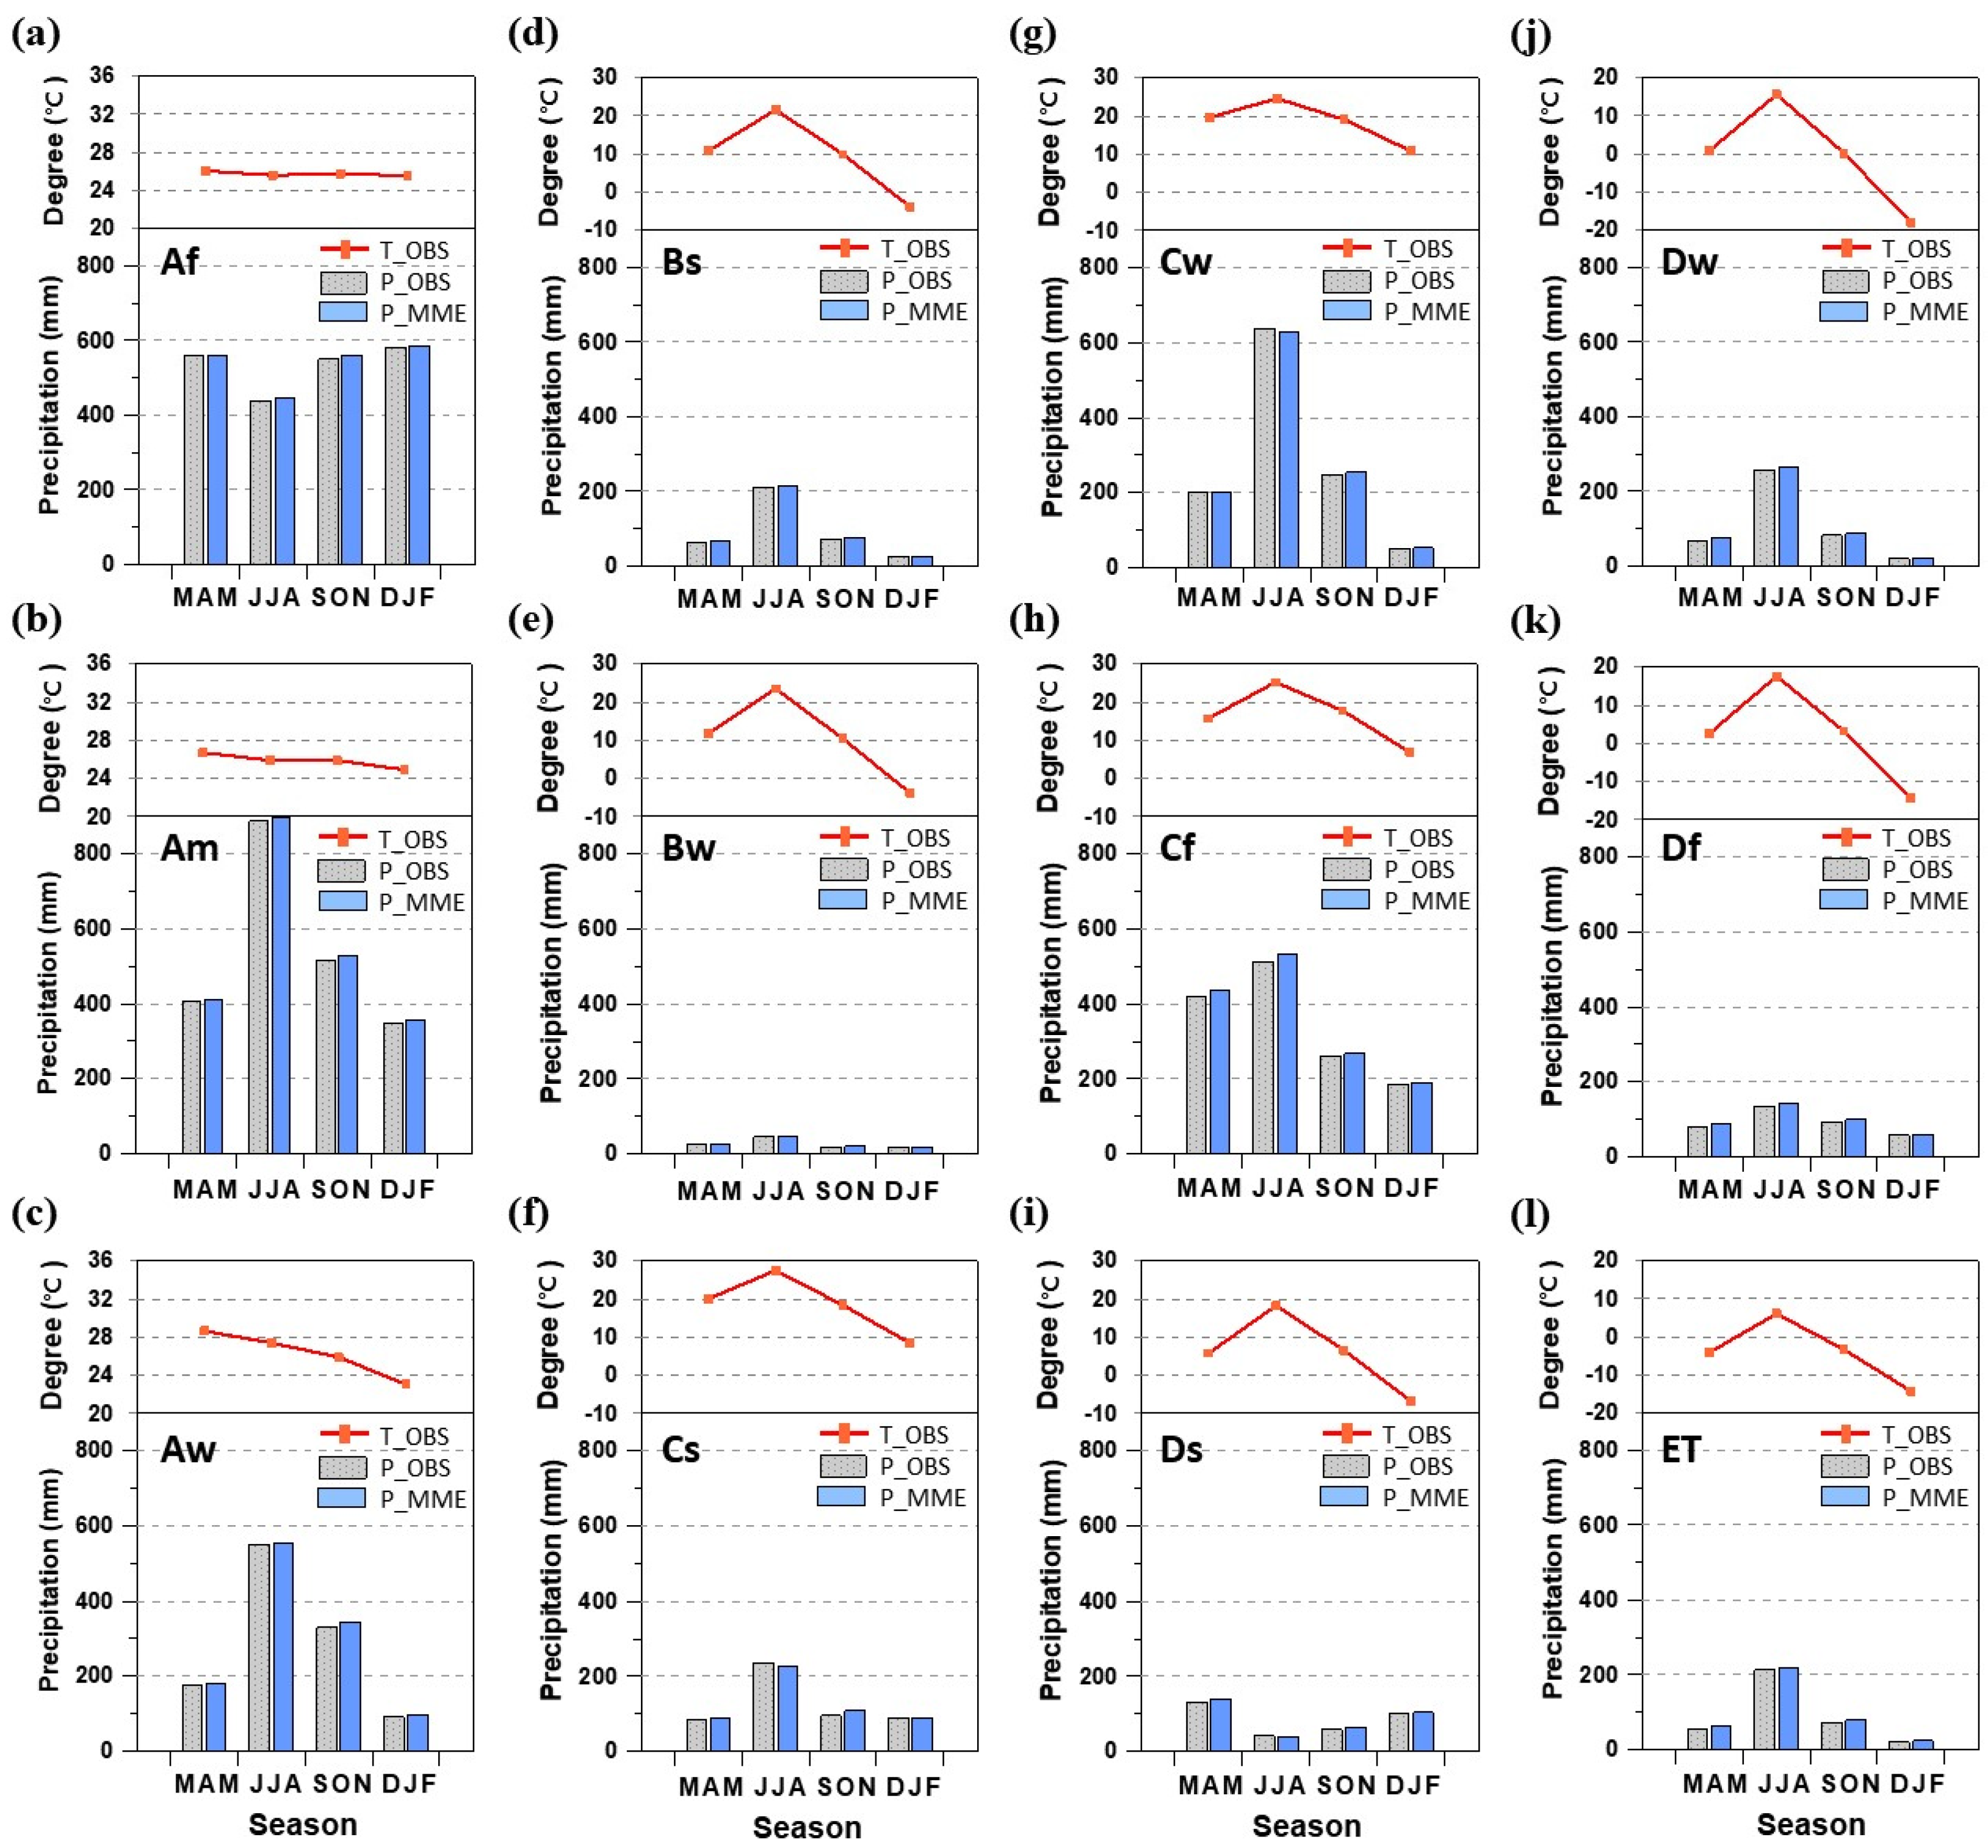
We first validate the bias-corrected GCMs to examine whether they are able to adequately simulate the observed seasonal climatological characteristics for the 30-yr historical period (1976–2005). In this study, the four seasons are typically defined as spring (March–April–May, MAM), summer (June–July–August, JJA), fall (September–October–November, SON), and winter (December–January–February, DJF). For the comparison, the gridded seasonal precipitation datasets are extracted from the five GCMs and OBS (i.e., APHRODITE), and, the individual precipitation datasets in all grids within each climate zone are converted to area-averaged values. Hereafter, the results are derived from the MME of the five GCMs and APHRODITE and referred as MME and OBS, respectively. Figure 3 shows the seasonal mean precipitation from MME and OBS and temperature from OBS for 12 climate zones. In each climate zone, the seasonal precipitation from MME is generally consistent with that from OBS in terms of the regional patterns. Both MME and OBS show the seasonal variation in regional precipitation over Asia. Most of the climate zones show large seasonal variability of precipitation, except in the zones Af and Ds. Across the climate zones, the precipitation disparity between the summer (JJA) and winter (DJF) seasons ranges from 2.4-fold to 13.7-fold based on the OBS, which are similar to ranges of MME. The MME well captures the shape of the seasonal cycle; however, it tends to slightly overestimate or underestimate seasonal precipitation, averaging approximately 5.2 mm in each zone. This comparison demonstrates that the MME of five GCM are reasonable for examining meteorological and drought responses to warmer climate environments.
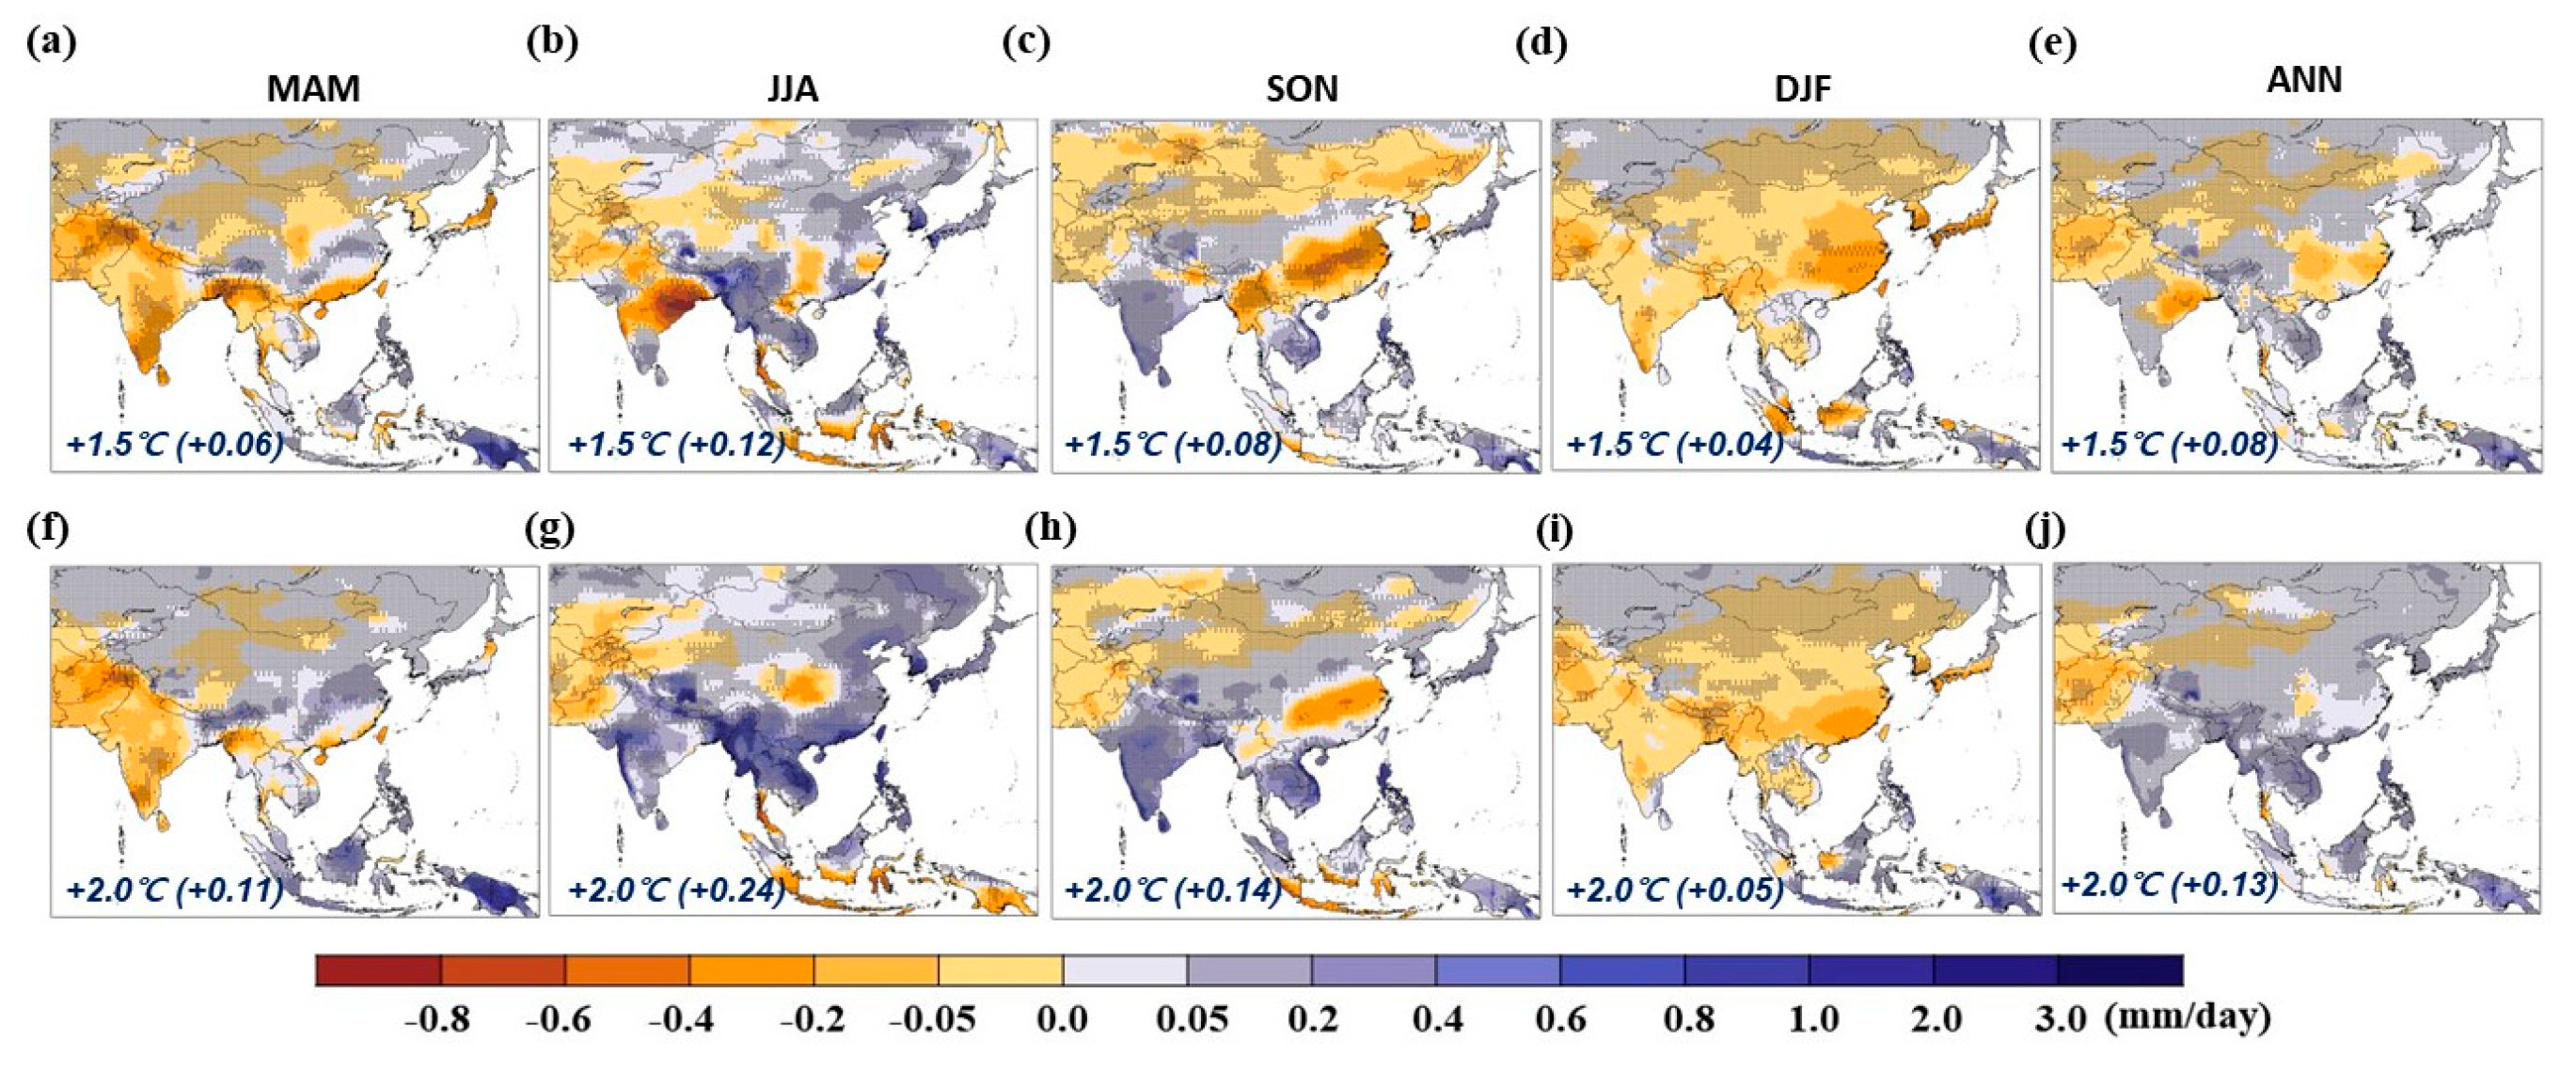
We assess the future projections of precipitation taken from the five GCMs. The analysis is suggested based on the MME of the five GCMs averaged over the historical (future) period with the central year surpassing 0.48 °C (1.5 and 2.0 °C) of warming. Hereafter, the results of the reference period and future periods with 1.5 °C (2.0 °C) of warming are denoted as REF and +1.5 °C (+2.0 °C), respectively. Future changes are estimated based on a difference between REF and the individual warming scenarios. Figure 4 represents the spatial distribution of changes in seasonal (from MAM to DJF) and annual mean precipitation. We discern the regions where 80% of the models (i.e., 4 out of 5) agree on the sign of the change to assess the consistency among different GCMs. The large spatial disparity is shown in the projection of seasonal precipitation due to the regional climate and geographical characteristics. The dominant precipitation patterns that occur in the future projections are an increase in JJA across the C and D climate zones and a decrease in DJF over Asia under global warming. This result demonstrates the intensification of precipitation seasonality, which in turn leads to variability of drought events. Under the enhanced global warming scenario, areas with an increasing signal in JJA and SON become more expanded compared to less warming conditions with high robustness, especially in zones A, C, and D.
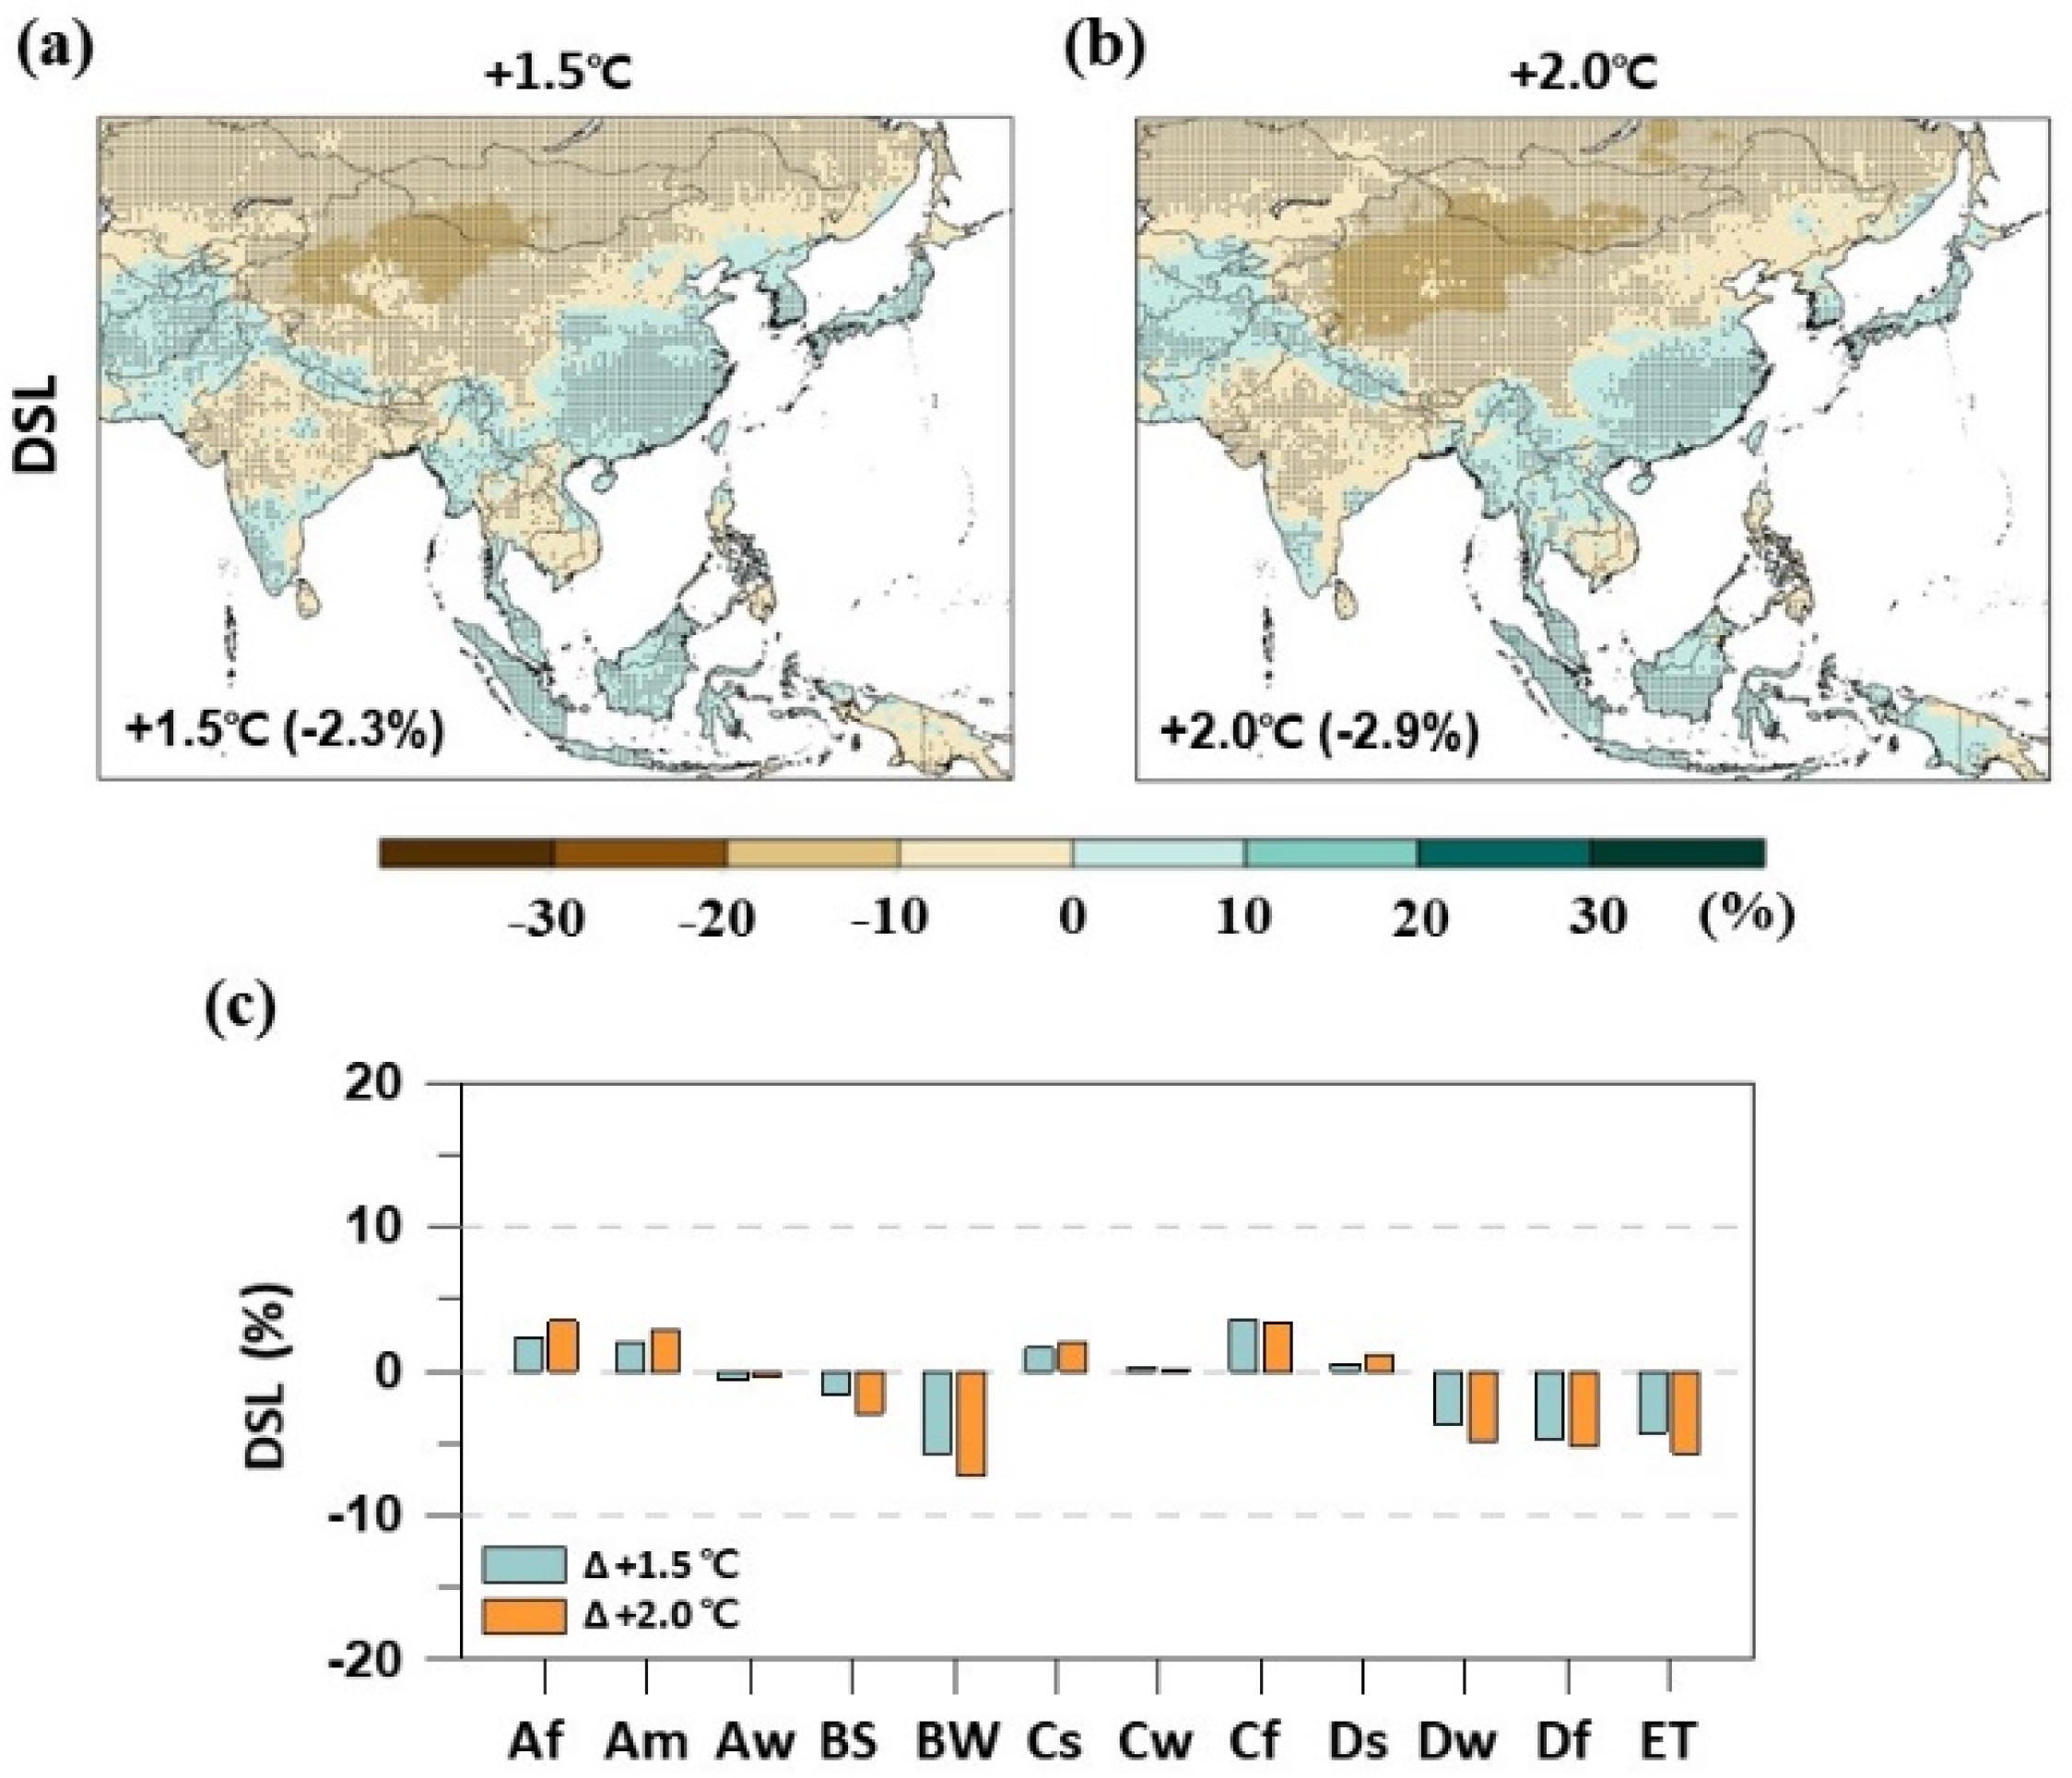
The meteorological drought features are affected by the amount of precipitation during seasonal and annual scales as well as the dry and wet spell lengths on the basis of daily scale. We selected the mean annual dry spell length (DSL) to examine the changes in precipitation characteristics related to drought. The DSL is defined as the number of consecutive dry days during each dry spell per year, and each dry day in this study is considered to have less than 1 mm of precipitation per day. Figure 5 shows the relative changes in DSL under 1.5 and 2.0 °C global warming compared with the DSL under REF. In this analysis, the positive and negative change signals represent an increase and a decrease in the length of the annual mean dry spell, respectively. The area-averaged mean DSL in the whole domain is expected to decrease by −2.3% at +1.5 °C and −2.9% at +2.0 °C compared to the REF period (Figure 5a,b). The decreasing change patterns of averaged DSL over Asia are dominated under two targets of global warming. However, it does not mean a decrease in individual grids within the domain. The change patterns under global warming show an opposite change signal (e.g., increasing or decreasing signal) depending on the region. For instance, zones A and C with positive signals are expected to increase by +1.7% at 1.5 °C and by +2.1% at 2.0 °C, whereas zones B, D, and E with negative signals are expected to decrease by −3.5% at 1.5 °C and by −4.4% at 2.0 °C (Figure 5c). This result implies that the intensification of regional variability in DSL over Asia resulted from an increase in GMT.
3.2. Changes in Severe Drought Characteristics
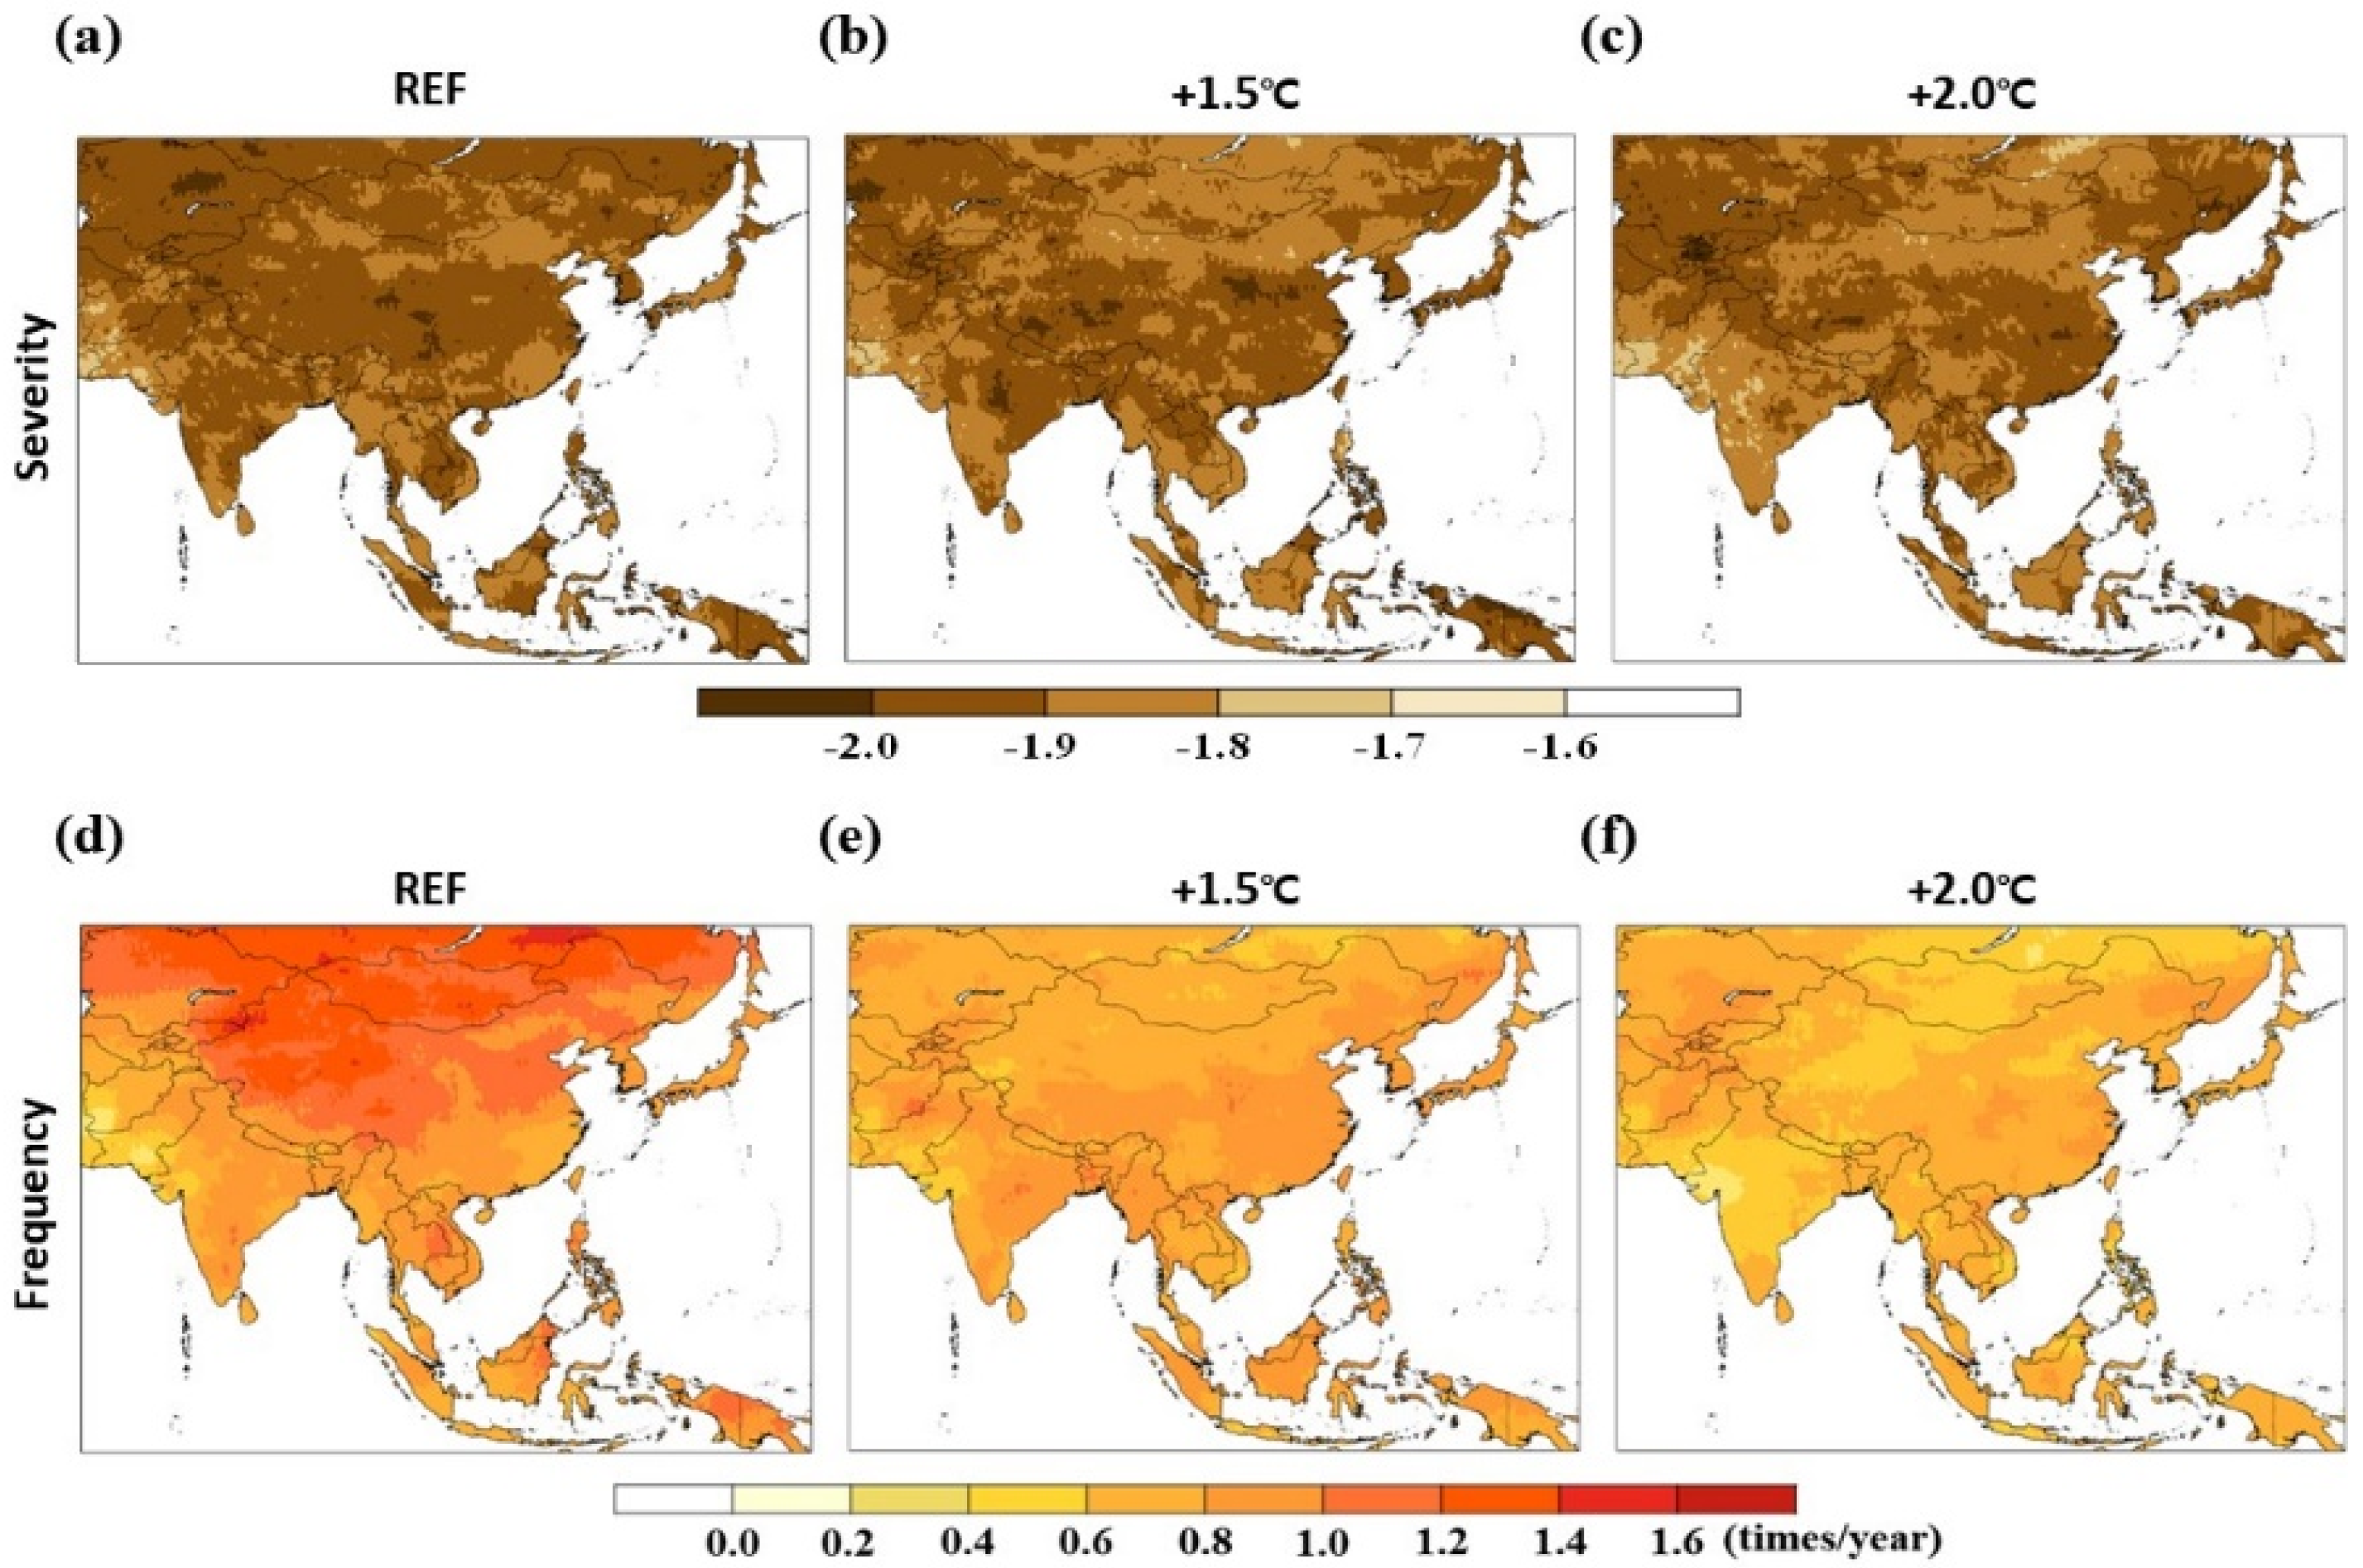
We investigate the future projections of the SPI3 obtained from the MME with a focus on severe and extreme drought events (e.g., SPI3 <−1.5). Once the drought frequency for individual GCMs is calculated from the number of months with drought events throughout the year, it is averaged over the 30-year REF period and two future periods. Finally, the results from MME are obtained by averaging the results of five GCMs. Figure 6 shows the spatial distribution of annual mean SPI3 based on the MME for each period. The area-averaged mean drought severity is approximately −1.92, −1.91, and −1.90 for REF, +1.5 and +2.0 °C, respectively, which is included in the ranges of severe dry conditions. Under global warming, significant changes in the magnitude of drought severity are not represented in Figure 6; however, there are the changes in the spatial pattern. As the GMT increases, the drought severity will increase in the C zone, including the southeastern part of China. On the other hand, drought severity decreases in zones A, B, and D, including the northern part of the Tibetan Plateau and southern part of India. The changes in the area-averaged mean drought frequency represent a consistent decrease in most of the study area according to global warming due to increasing trends of annual precipitation. The drought frequency averaged over Asia is likely to decrease by 0.77 (times/year) at +1.5 °C and 0.66 (times/year) at +2.0 °C compared to 1.01 (times/year) at REF.
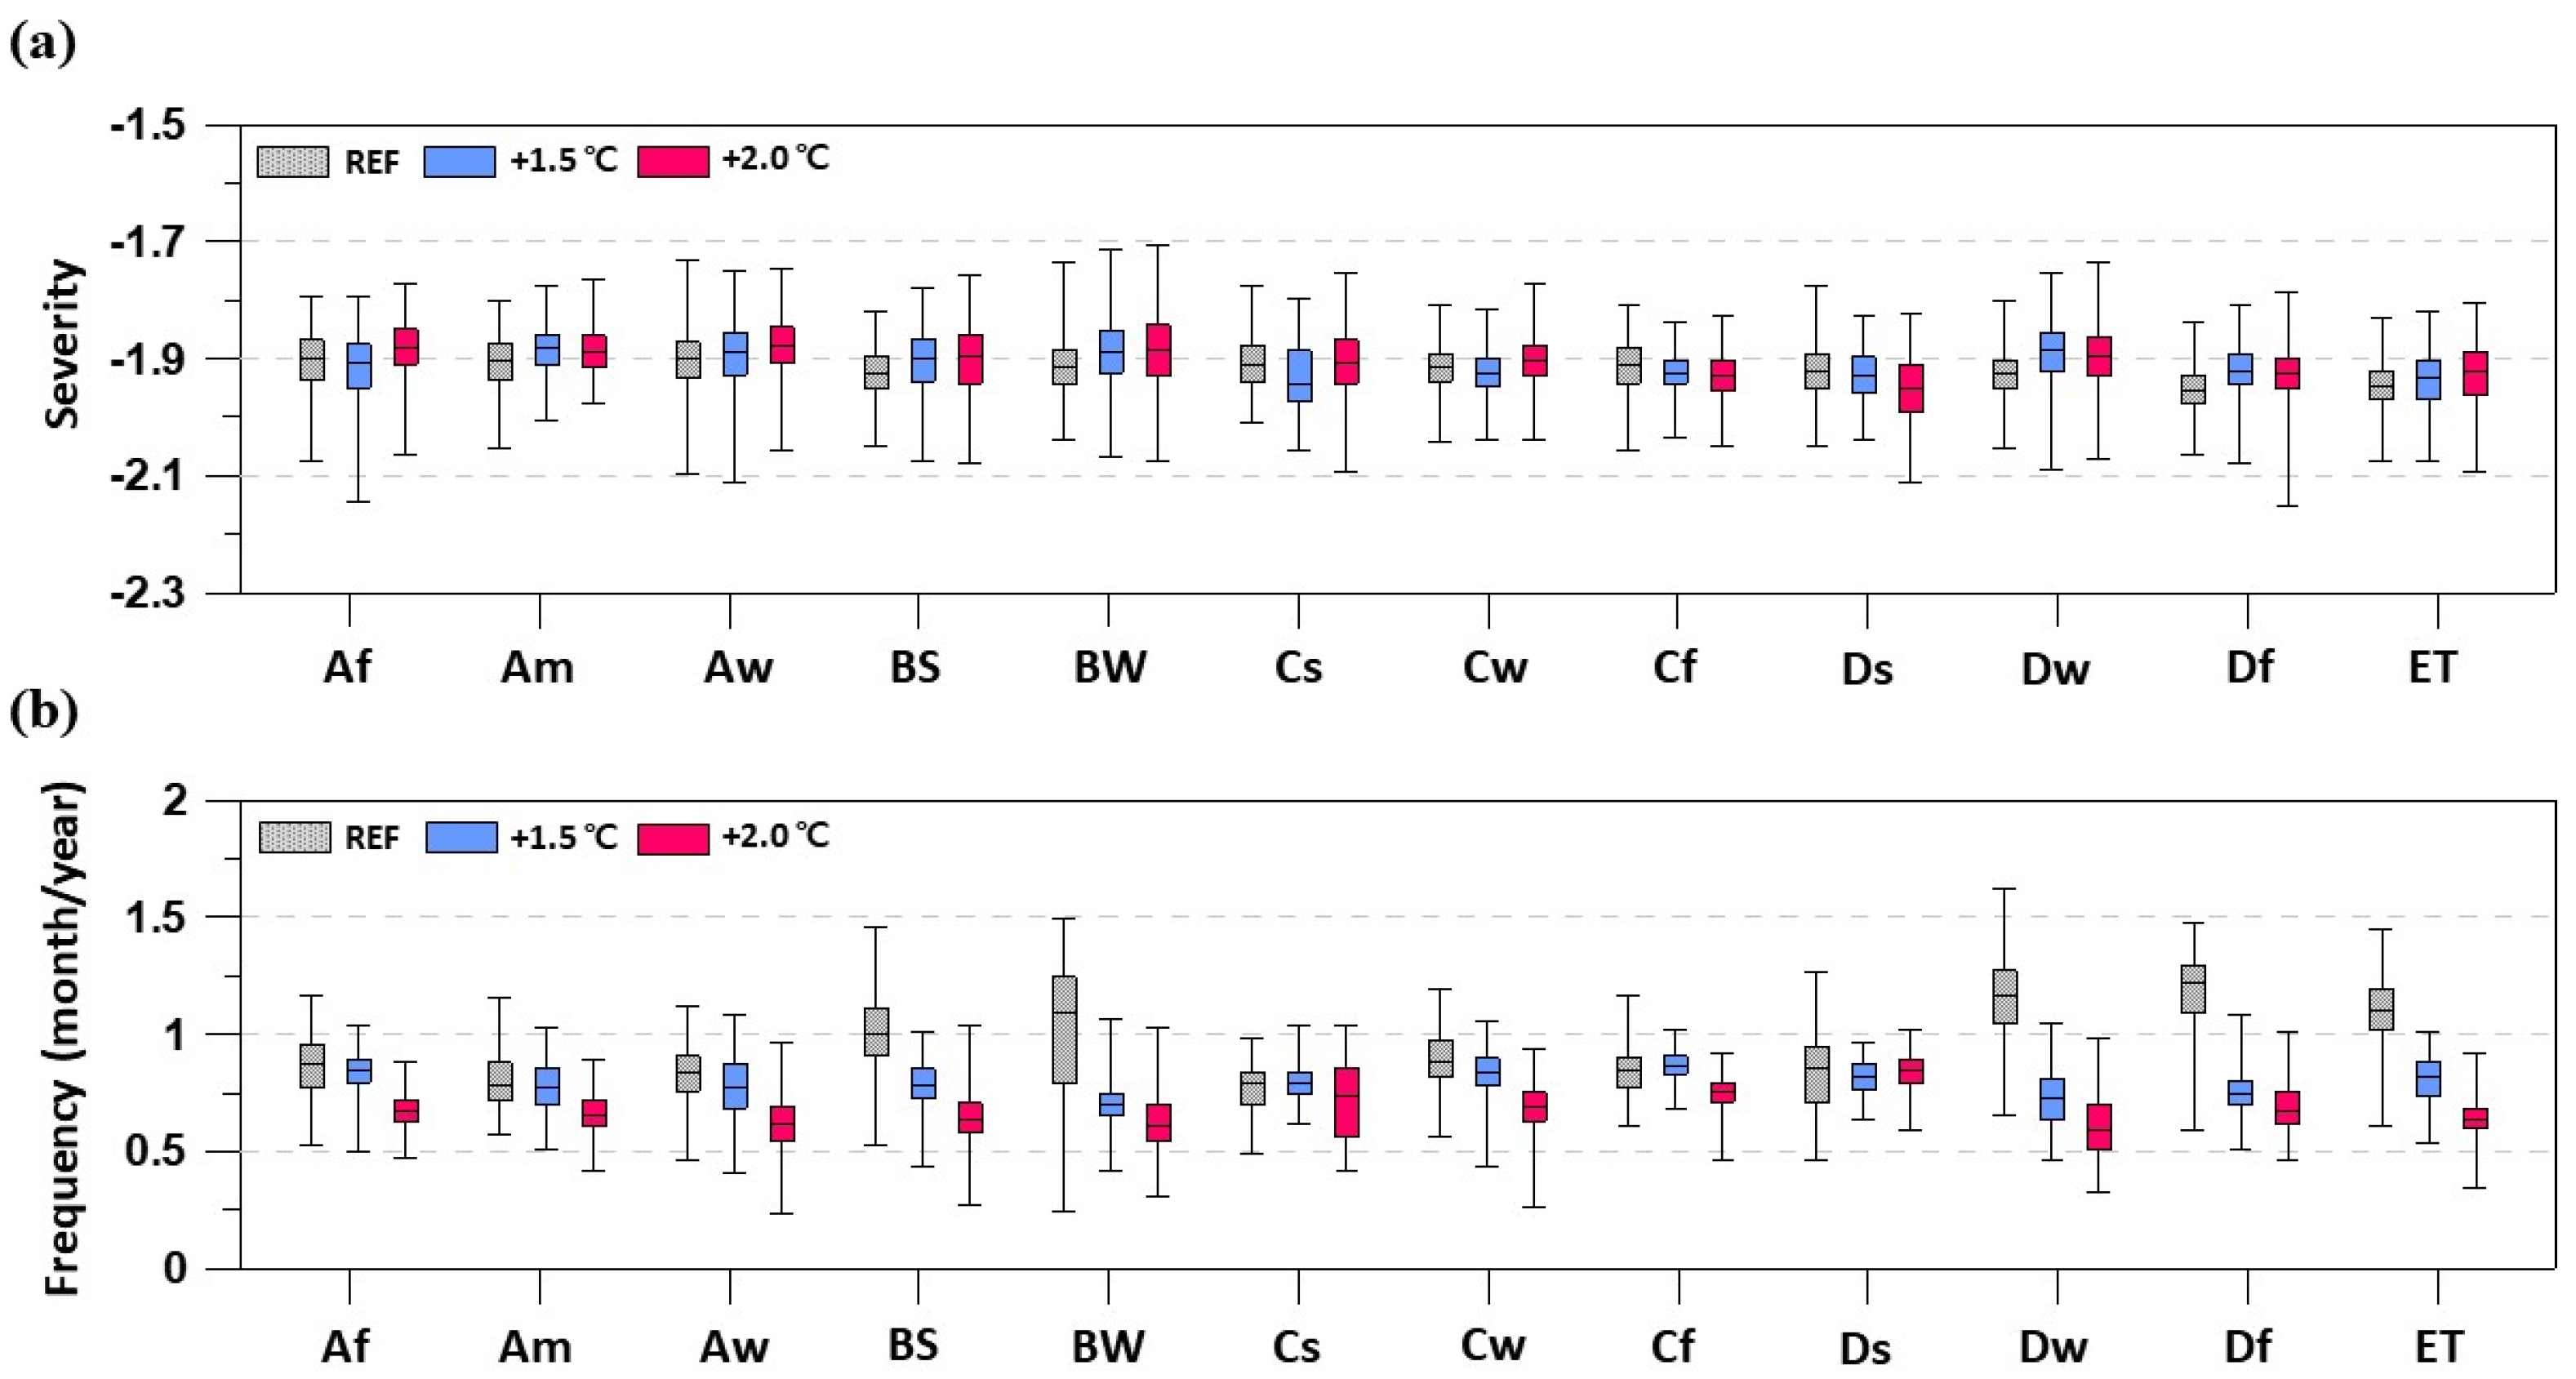
Figure 7 presents a box-whisker plot of annual mean extreme drought (e.g., SPI <−1.5) severity and frequency during the REF period and future periods (i.e., under 1.5 and 2.0 °C of global warming) in terms of their spatial variability for 12 climate zones. Each box-whisker, which means the spatial variability of extreme drought severity and frequency during the period, is generated from some MME grid values corresponding to grids included in each climate zone. For the individual period, the drought severity and frequency of extreme drought events (e.g., SPI <−1.5) per year are averaged over a 30-year period to calculate the representative value of the period. Even in the same climate zones, the results show high spatial variability in drought severity and frequency during the REF period and future periods, as shown in Figure 7. Compared to other climate zones, zones C and Ds include a large number of grids with lower annual mean SPI3 values during the REF period as well as future periods (Figure 7a). Meanwhile, the box-whisker plot of the drought severity in zone A is higher than the others, which reveals relatively less severe conditions. As shown in Figure 7b, the highest spatial variability in the drought frequency during the REF period is shown in zones B and D.
Under warmer conditions, the frequency of SPI3 is expected to increase in some regions (e.g., zones Bw, Cs, Cw, and Cf), but the majority of zones show decreasing patterns of drought frequency. In particular, dramatic decreases are observed in zones B and D under 2.0 °C global warming. Future projections of drought severity show an increasing trend in most climate zones (e.g., zones A, B, D, and E) and a decreasing trend in zones C (Cs, Cw, and Cf) and D (Ds). Overall, both the mean and maximum values of each box-whisker are shifted to higher values, whereas the minimum value of each box-whisker is shifted to lower values compared to REF. On the other hand, the drought frequency is low in zones A (Af, Am, and Aw) and C (Cs, Cw, and Cf), where the projection of precipitation is expected to be increased (Figure 7b). Due to the increase in precipitation with warming, the drought frequency decreases in all climate zones under both 1.5 and 2.0 °C global warming. A significant decrease in the future projection of drought frequency occurs in zones B, D, and E.
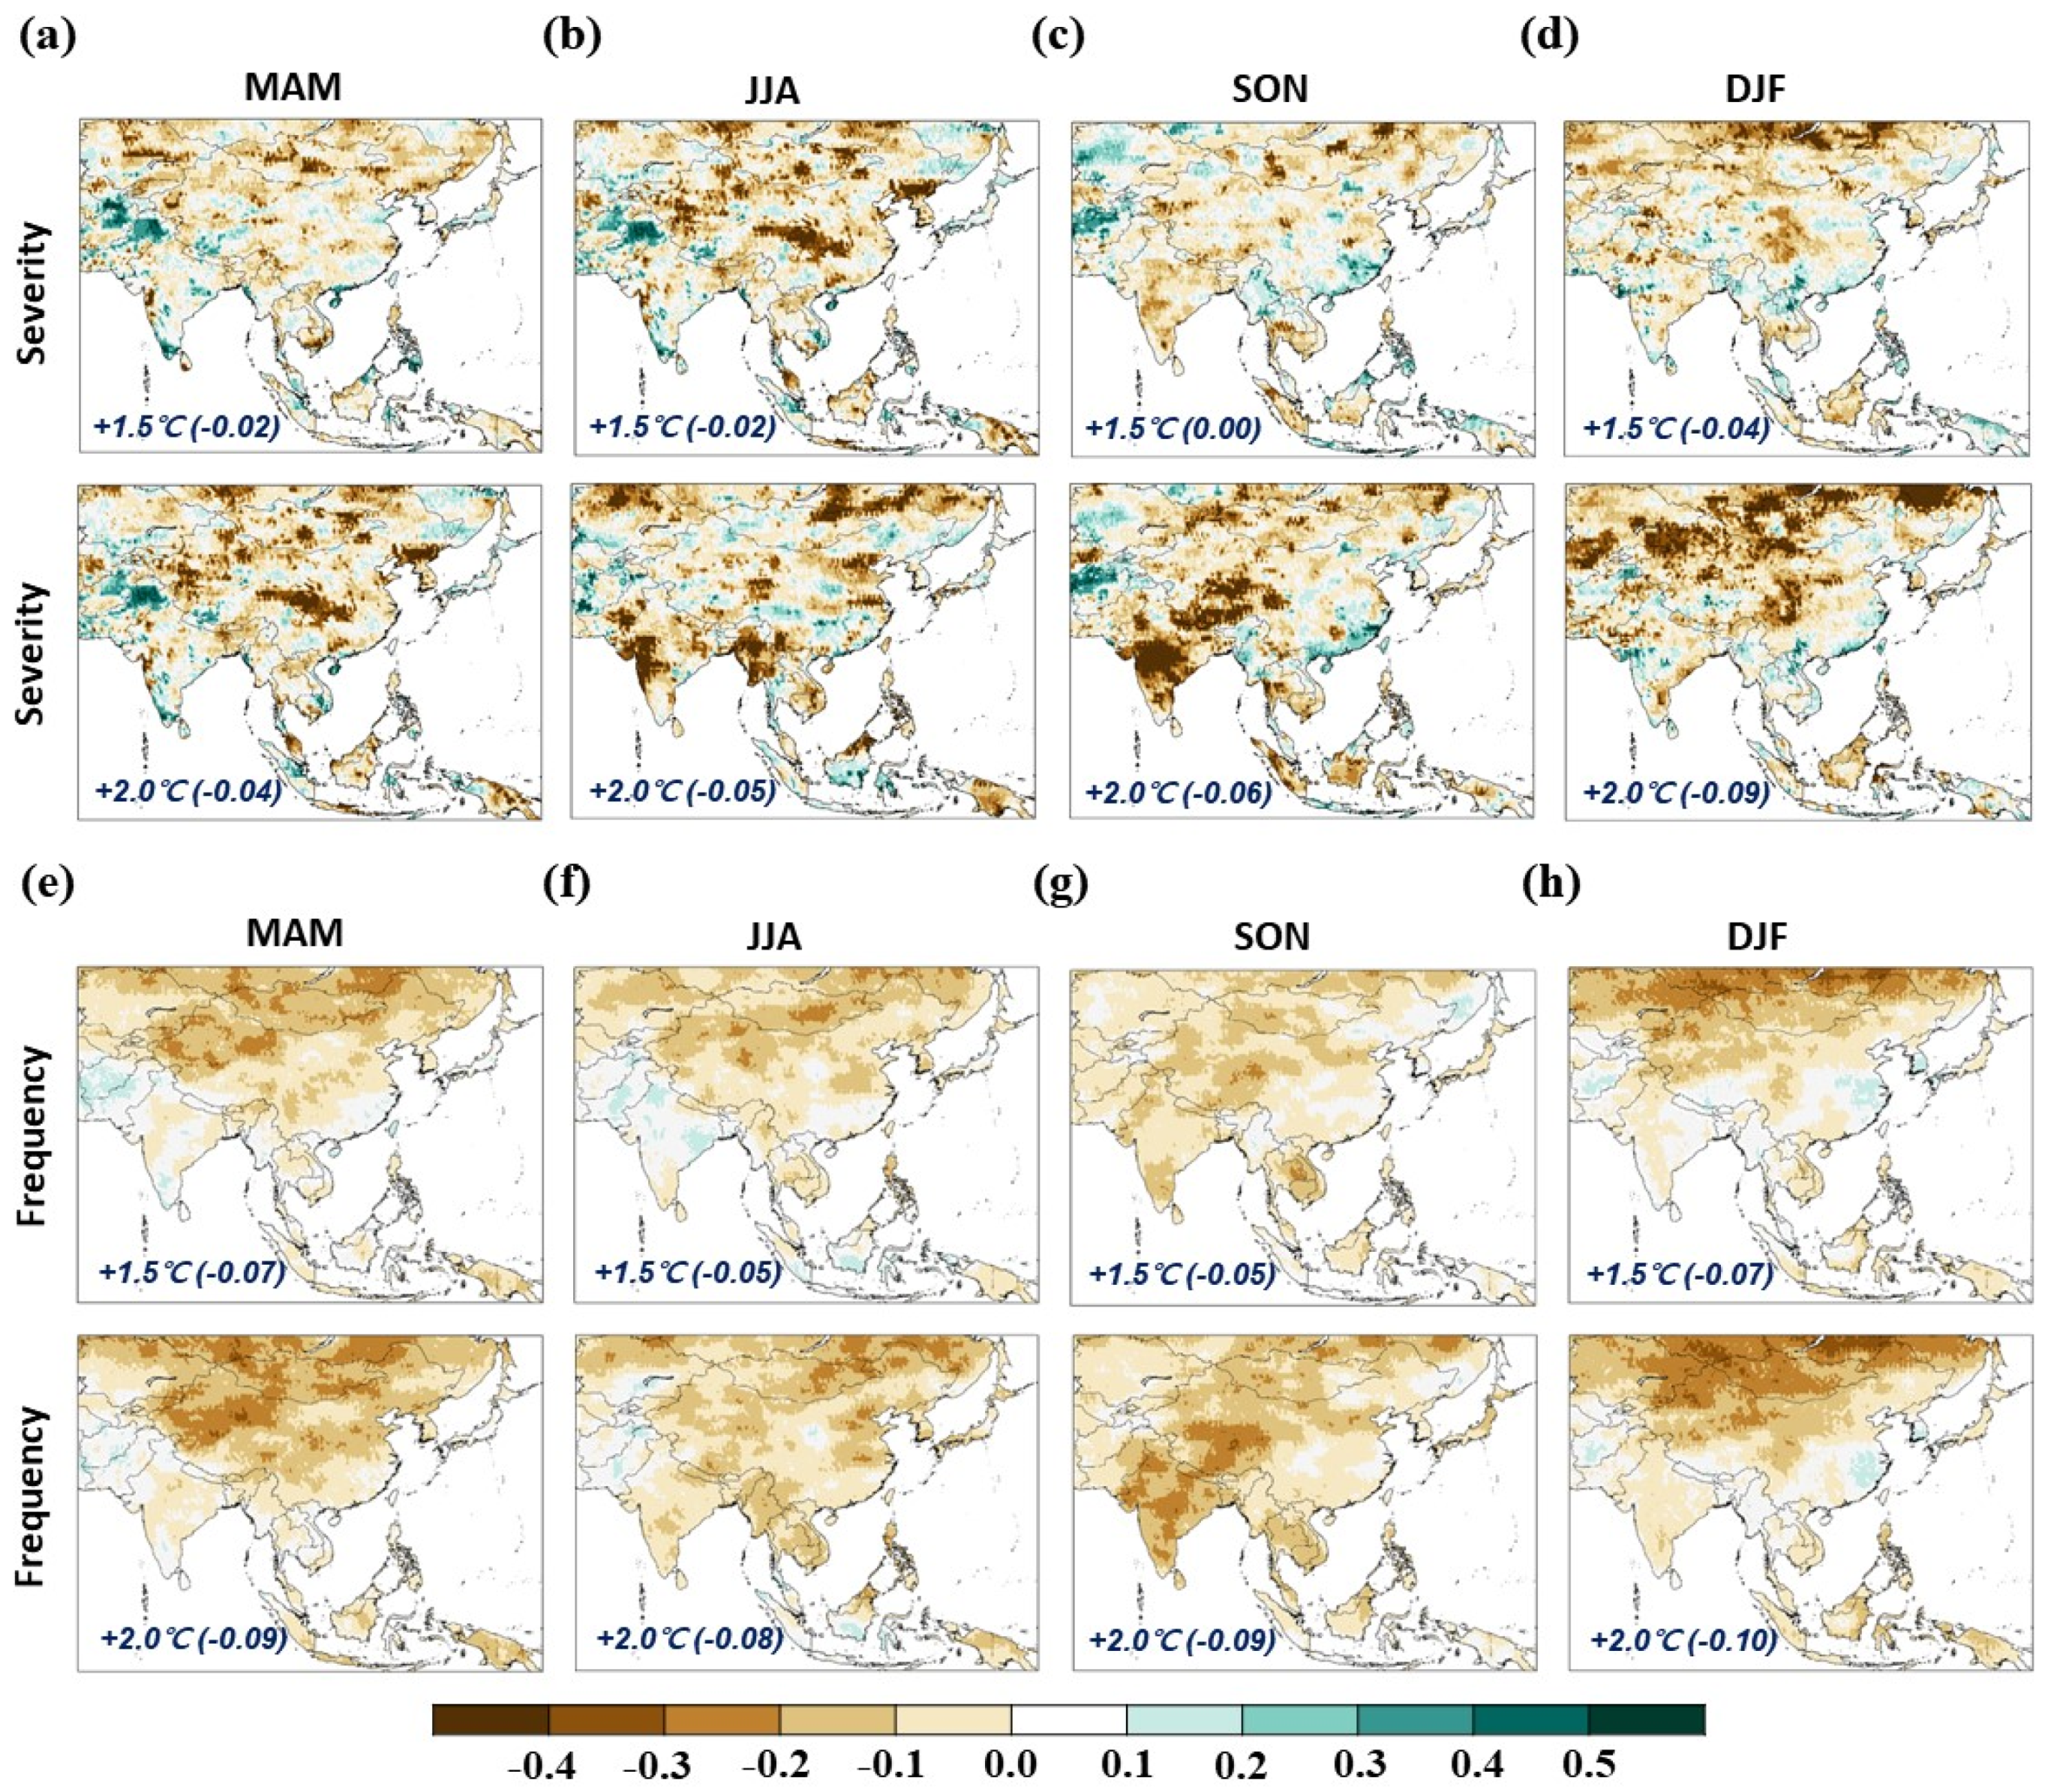
Figure 8 shows the spatial distribution of seasonal mean SPI3 based on MME for each period. The seasonal mean SPI3 is calculated by averaging the monthly SPI3 corresponding to each season, and then, the value of seasonal mean SPI3 of less than −1.5 is used in this analysis. In Figure 8, Figure 9, Figure 10 and Figure 11, the positive (negative) signals represent the future change trend towards a more (less) tough condition on severe drought events. Although the severity and frequency changes in seasonal droughts show large regional variations, a great decrease in severity and frequency is shown in DJF rather than in JJA. Among the various climate zones, the future drought severity deteriorated in the zone Ds (northern part of Afghanistan and Tajikistan) during MAM and JJA and in zone Cf (southeastern part of China) during SON and DJF. In these regions (i.e., zones Ds and Cf), drought occurs more frequently for future periods. However, across the climate zones of Asia, severe drought is expected to be alleviated under further warming conditions in terms of severity and frequency due to an increase in precipitation.
3.3. Regional Drought Analysis
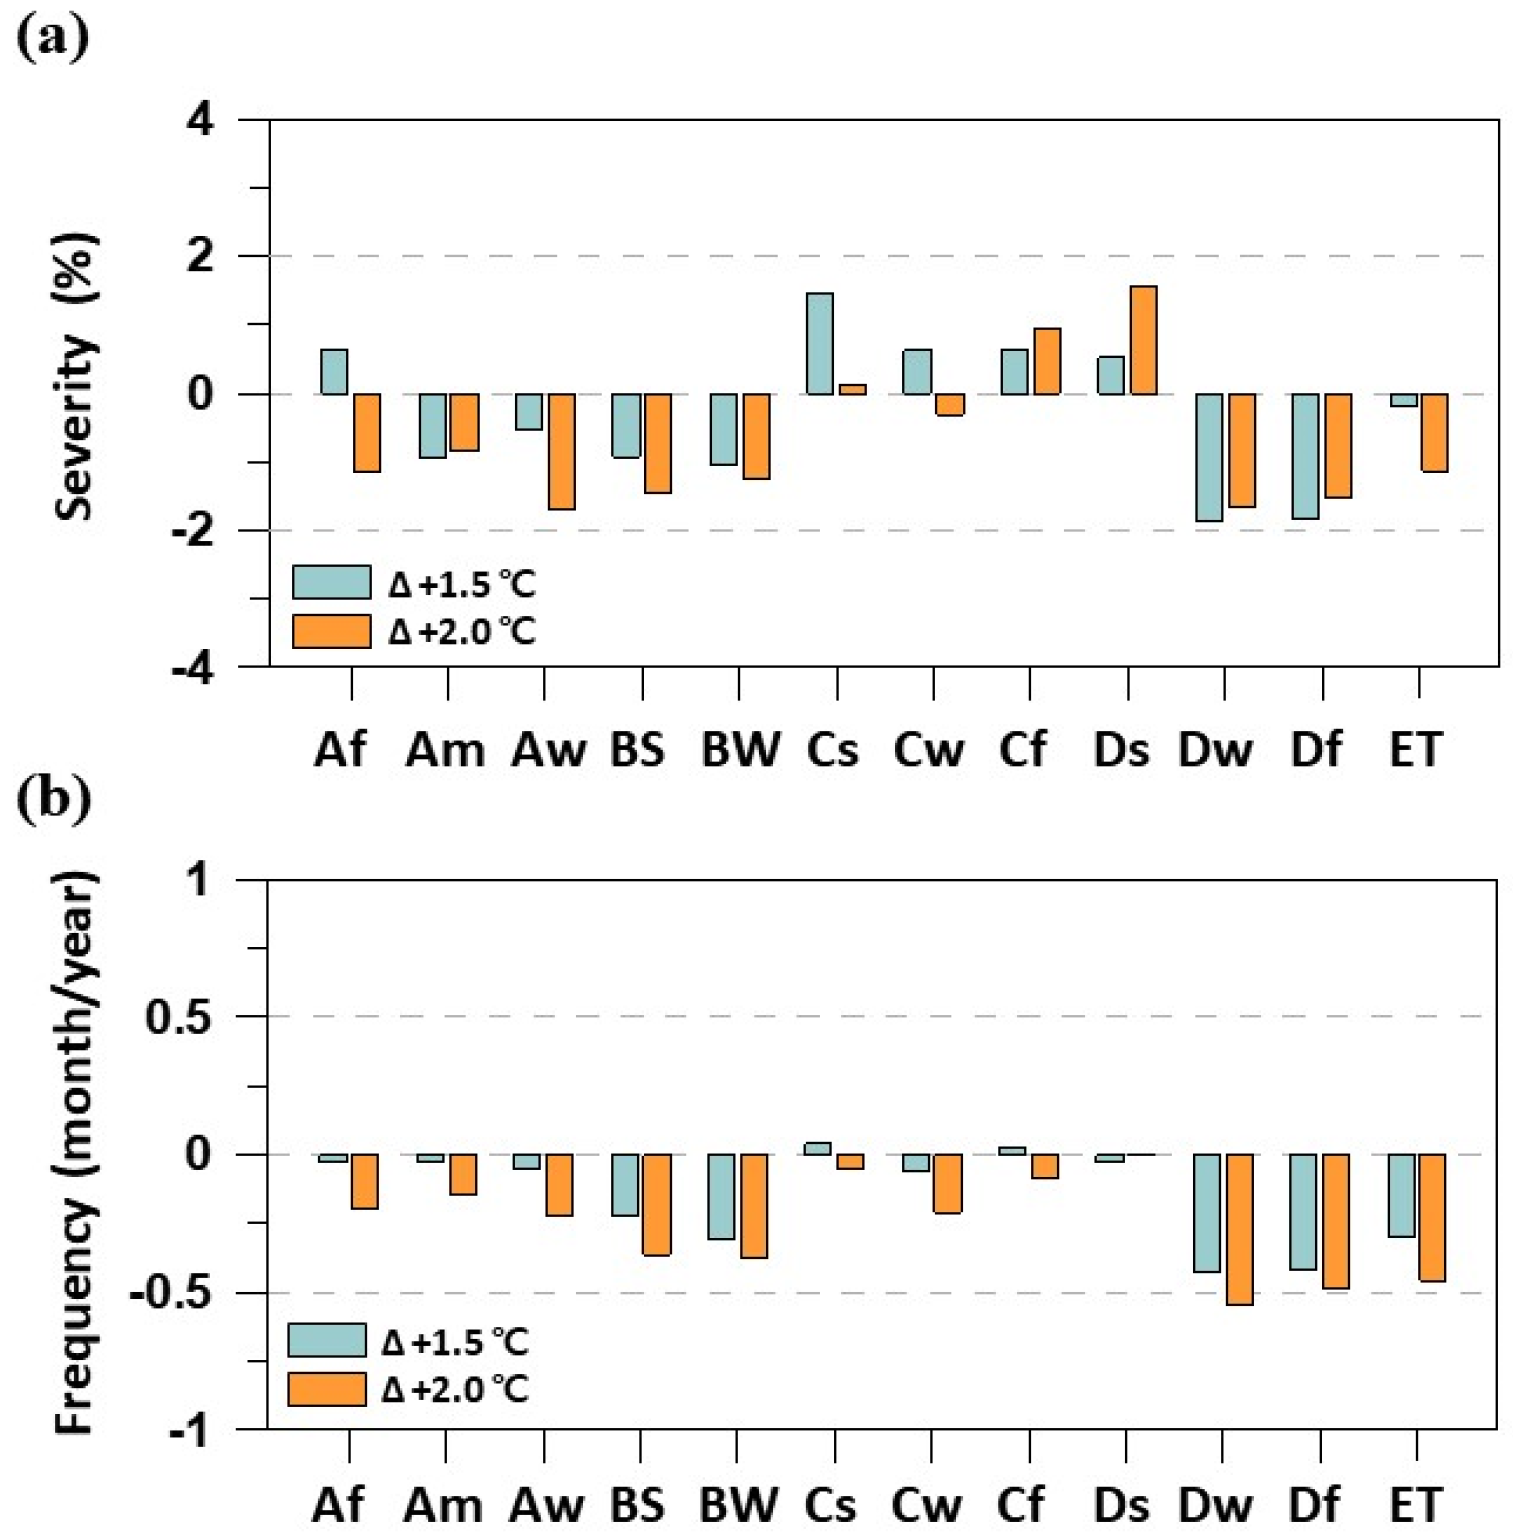
Figure 9 describes the relative changes in the annual mean drought severity and frequency in each climate zone under global warming compared to REF. Changes in drought severity are decreased in most climate zones (e.g., zones A, B, D, and ET), and these change patterns are more apparent under 2.0 °C warming (see Figure 9a). On the other hand, the drought severity of the zone C will increase under global warming as a result of the decreases in seasonal precipitation during SON and DJF. As shown in Figure 9b, the drought frequency is likely to be decreased in the zones A, B, D, and ET, especially in the 2.0 °C warming. Large decreases in the magnitude of change in drought frequency are shown in these climate zones (e.g., zones B, D, and ET).
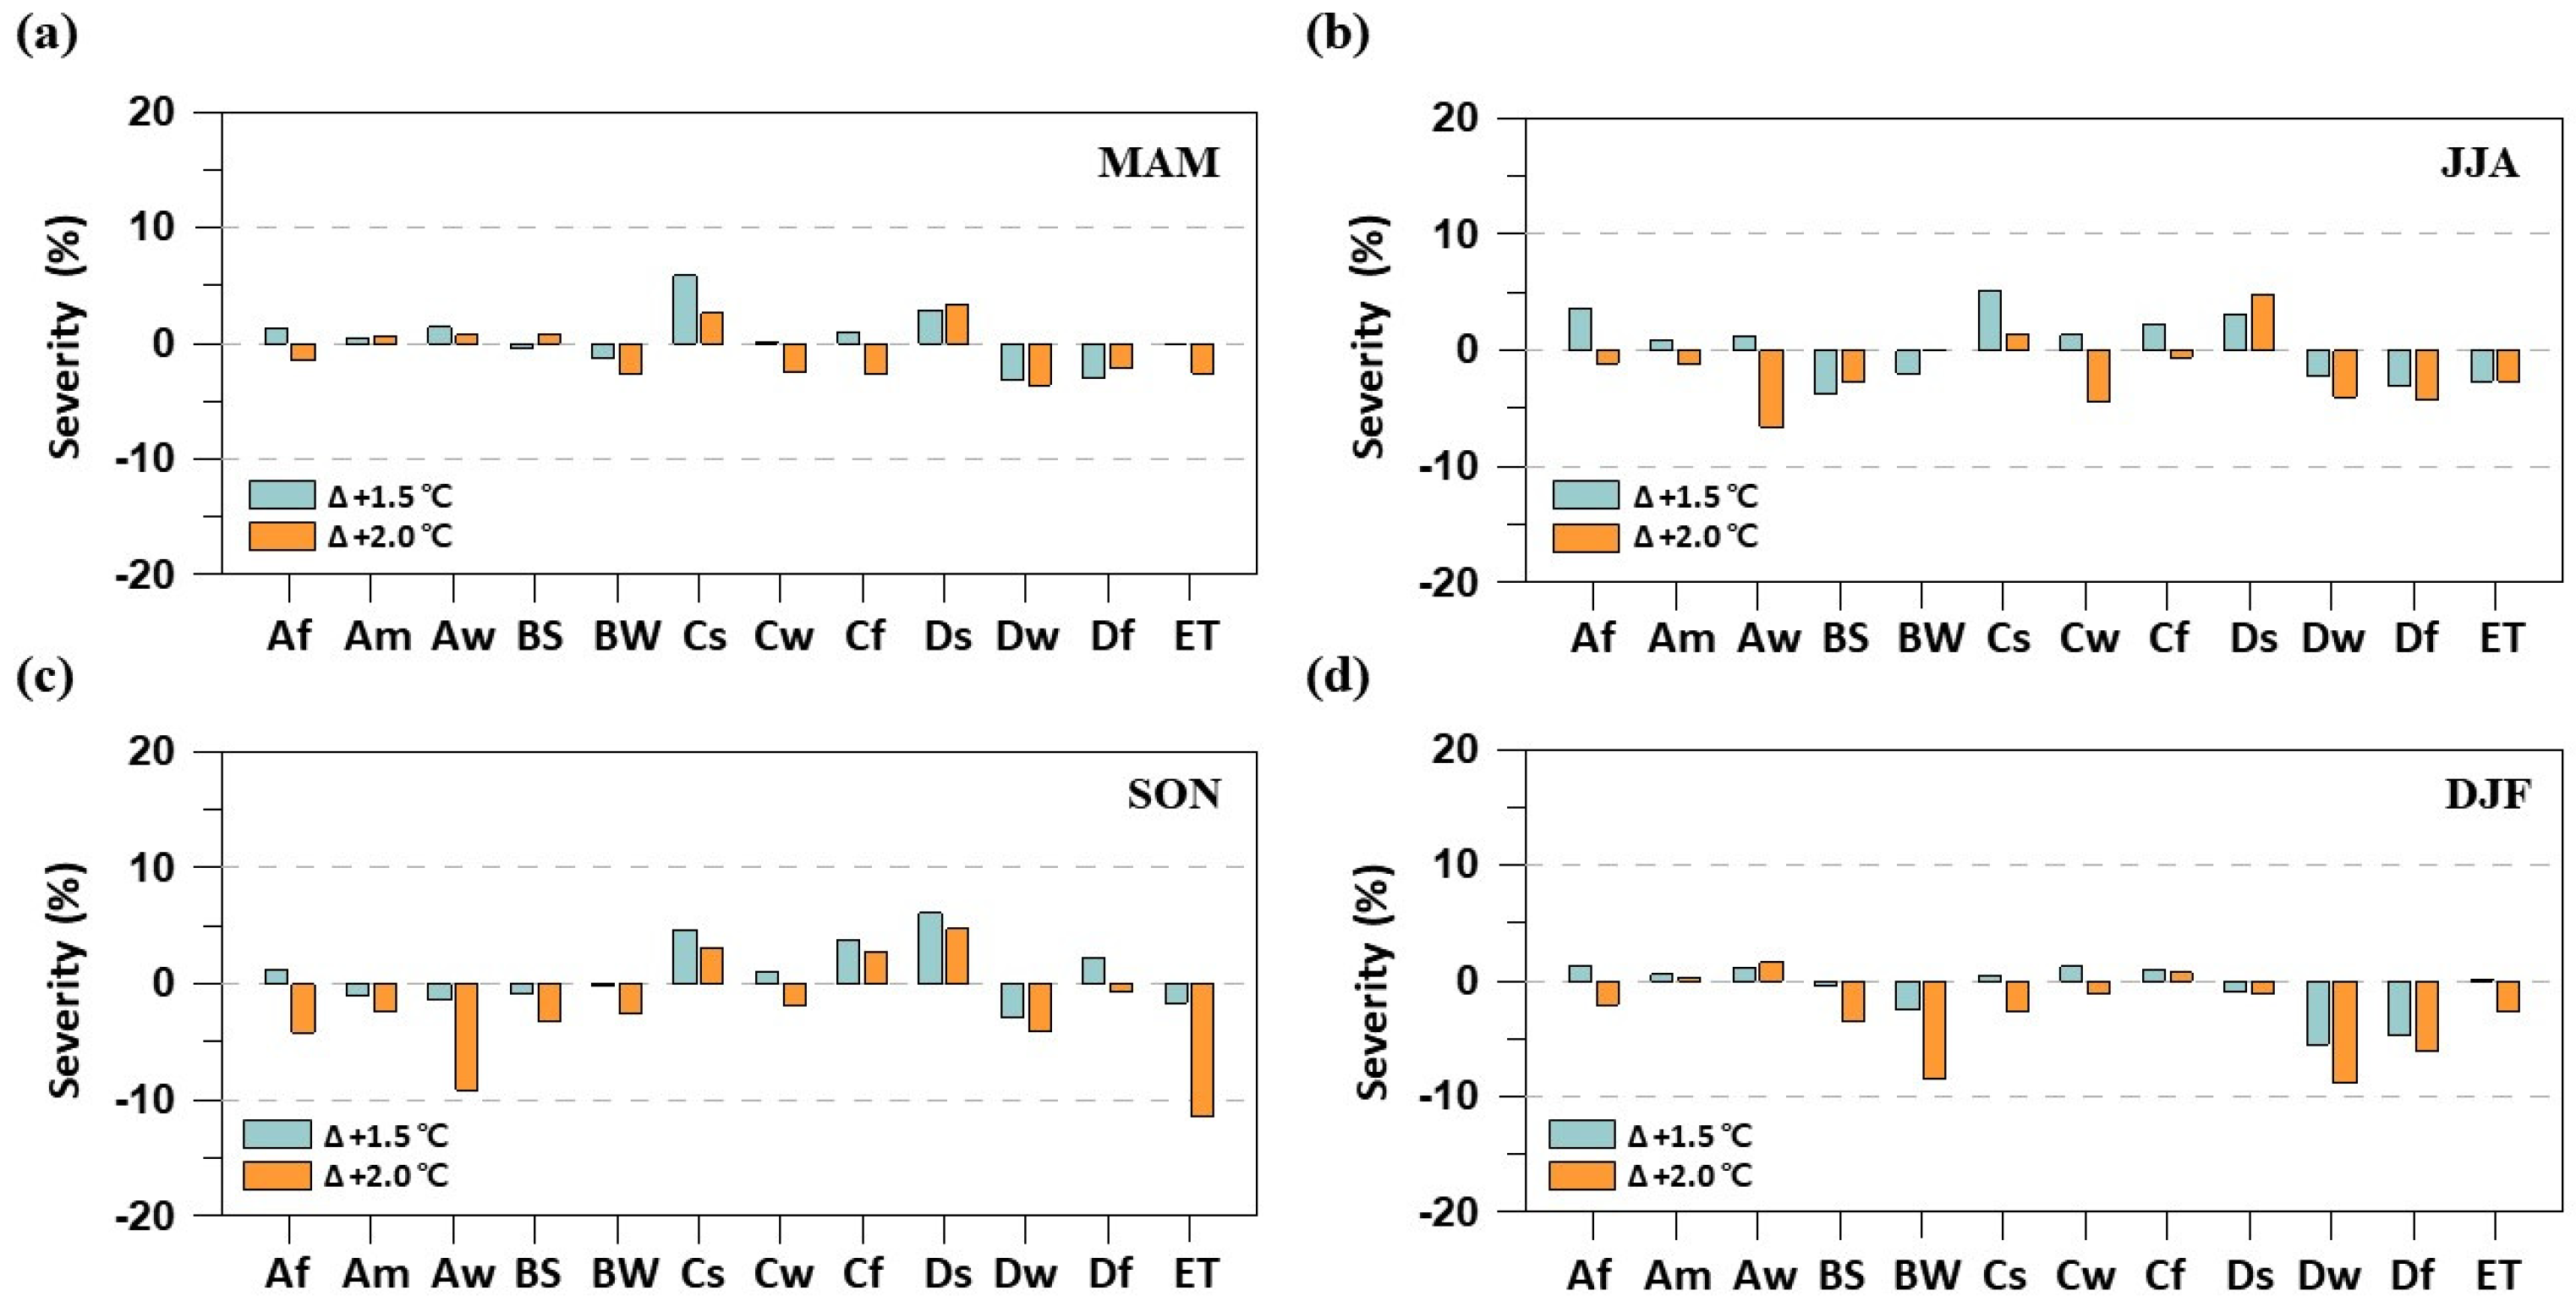
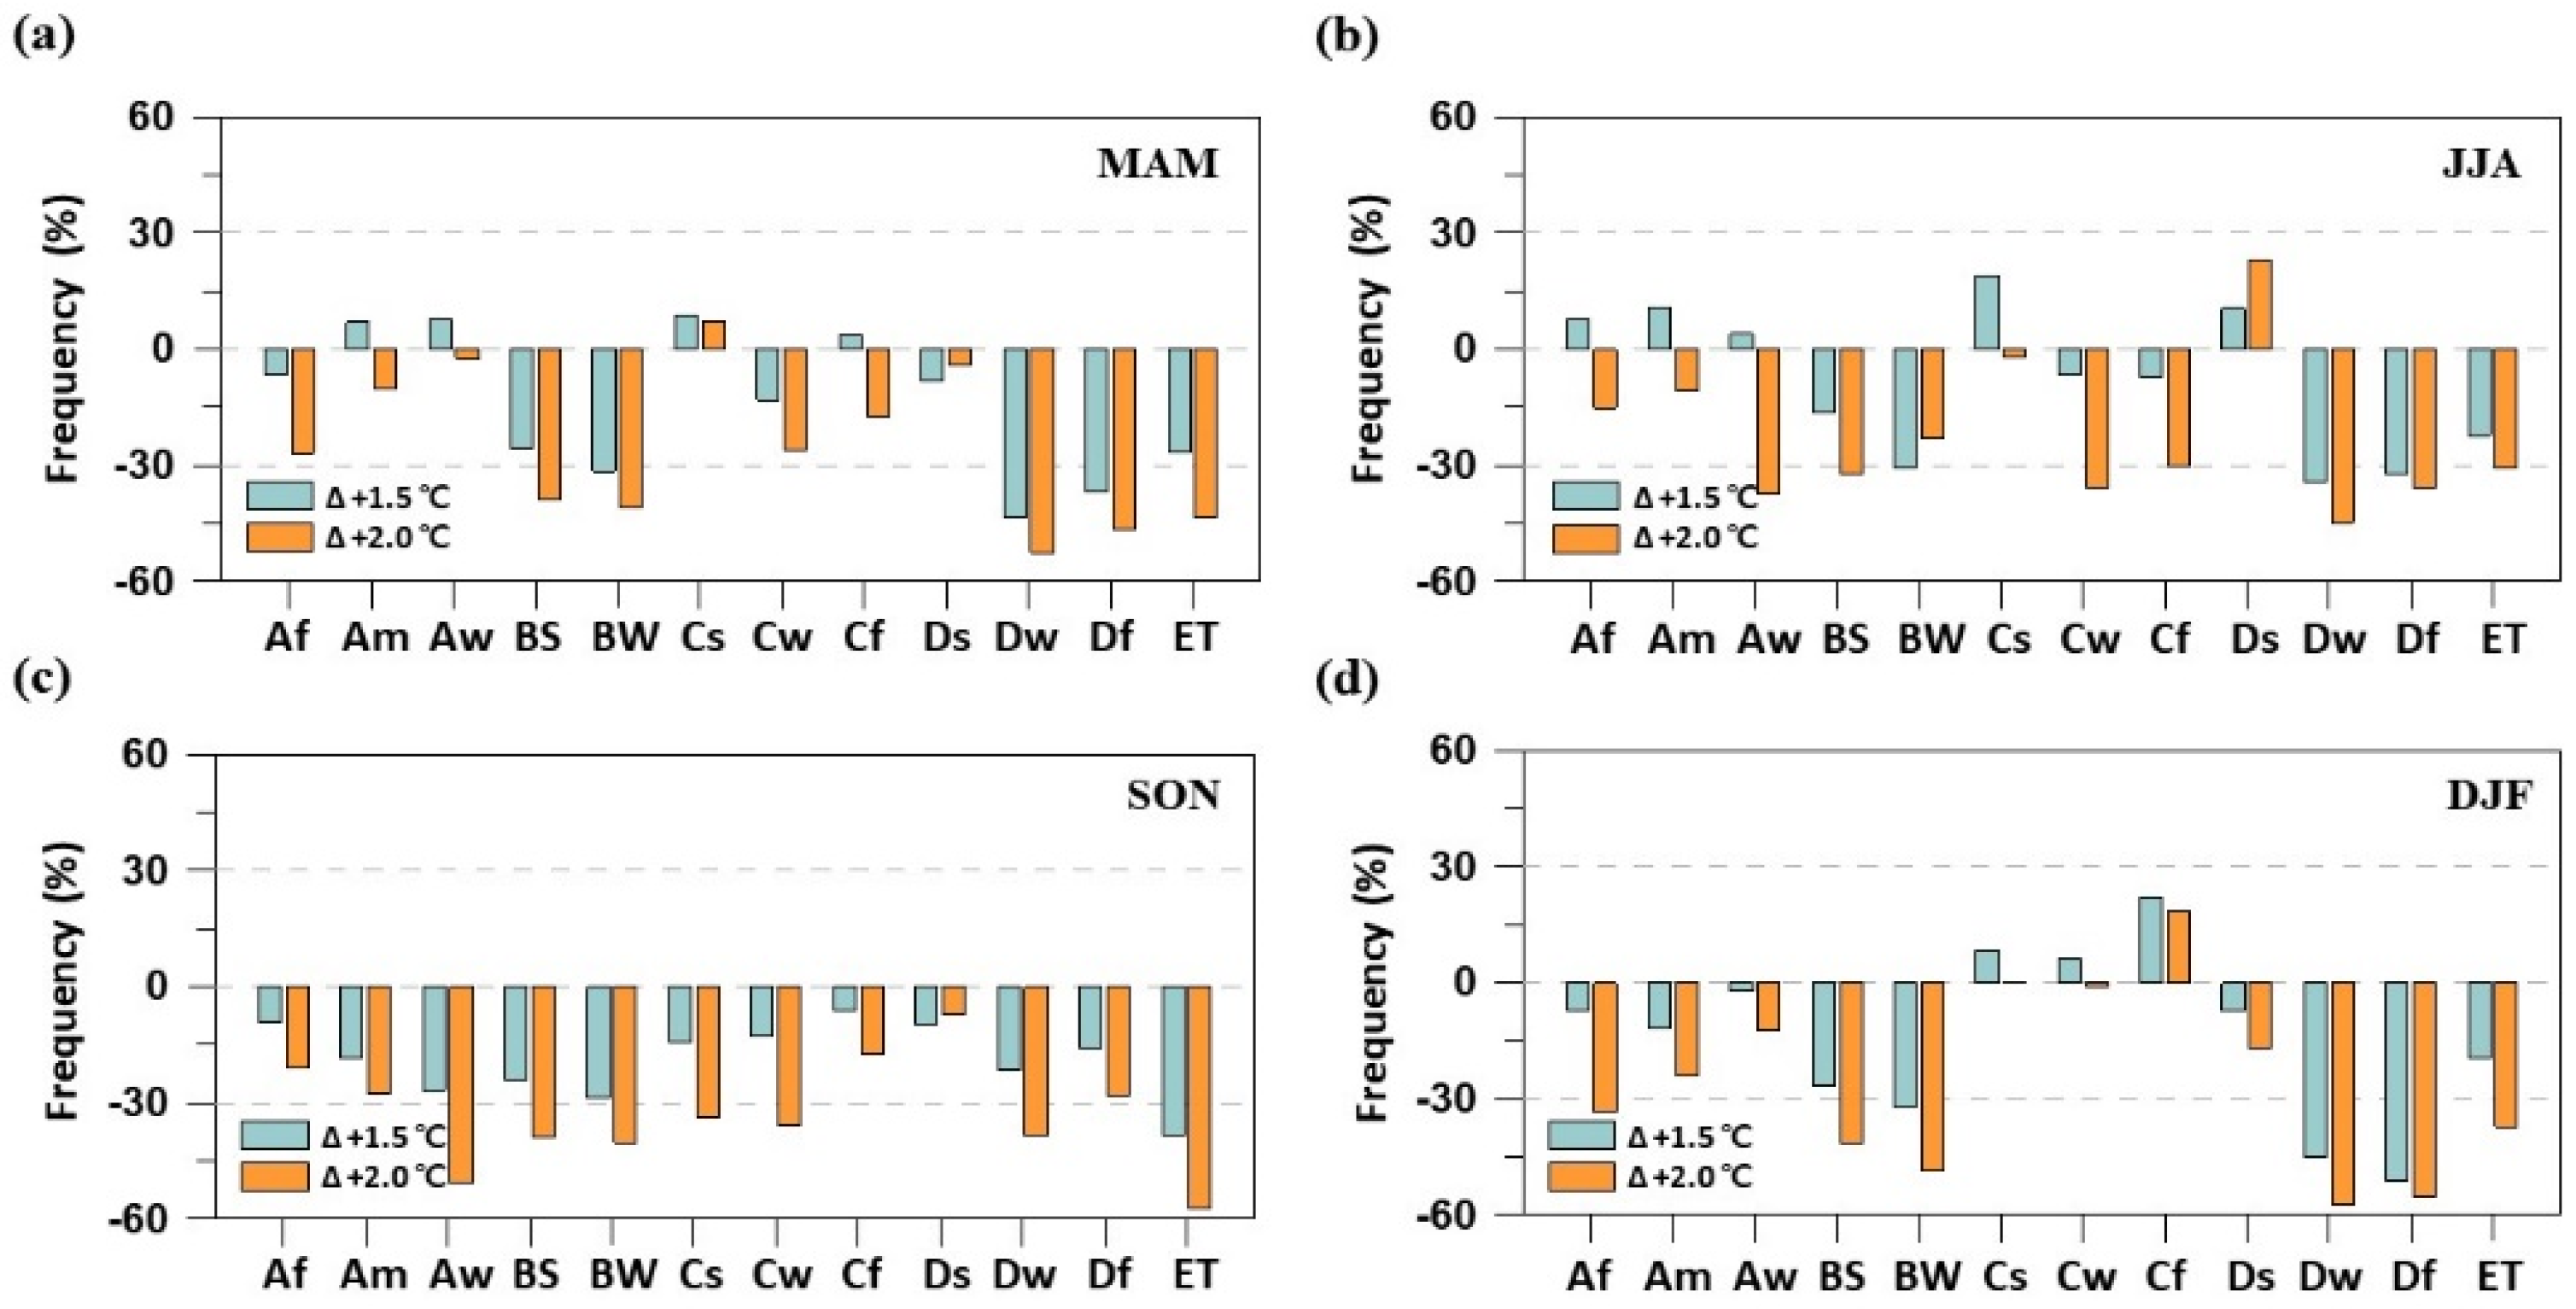
Figure 10 and Figure 11 show the relative changes in seasonal mean drought severity and frequency in each climate zone, respectively. The change signal of seasonal drought severity shows the regional difference in various climate zones. Most of the seasonal drought severity in zones A and C will increase under 1.5 °C of warming, whereas those in zones B and D (except Ds) and ET will decrease under both 1.5 and 2.0 °C of warming (see Figure 10). As shown in Figure 11, changes in seasonal drought frequency are consistent in all climate zones compared to changes in seasonal drought severity. Namely, drought frequency during each season shows decreasing change patterns across the climate zones, especially during SON. Under targeted warming conditions, zones B and D show consistent reduction tendencies in all seasonal drought frequencies. Although the seasonal variation is represented in zones A and C, these regions show an increase in drought frequency during MAM, JJA, and DJF.
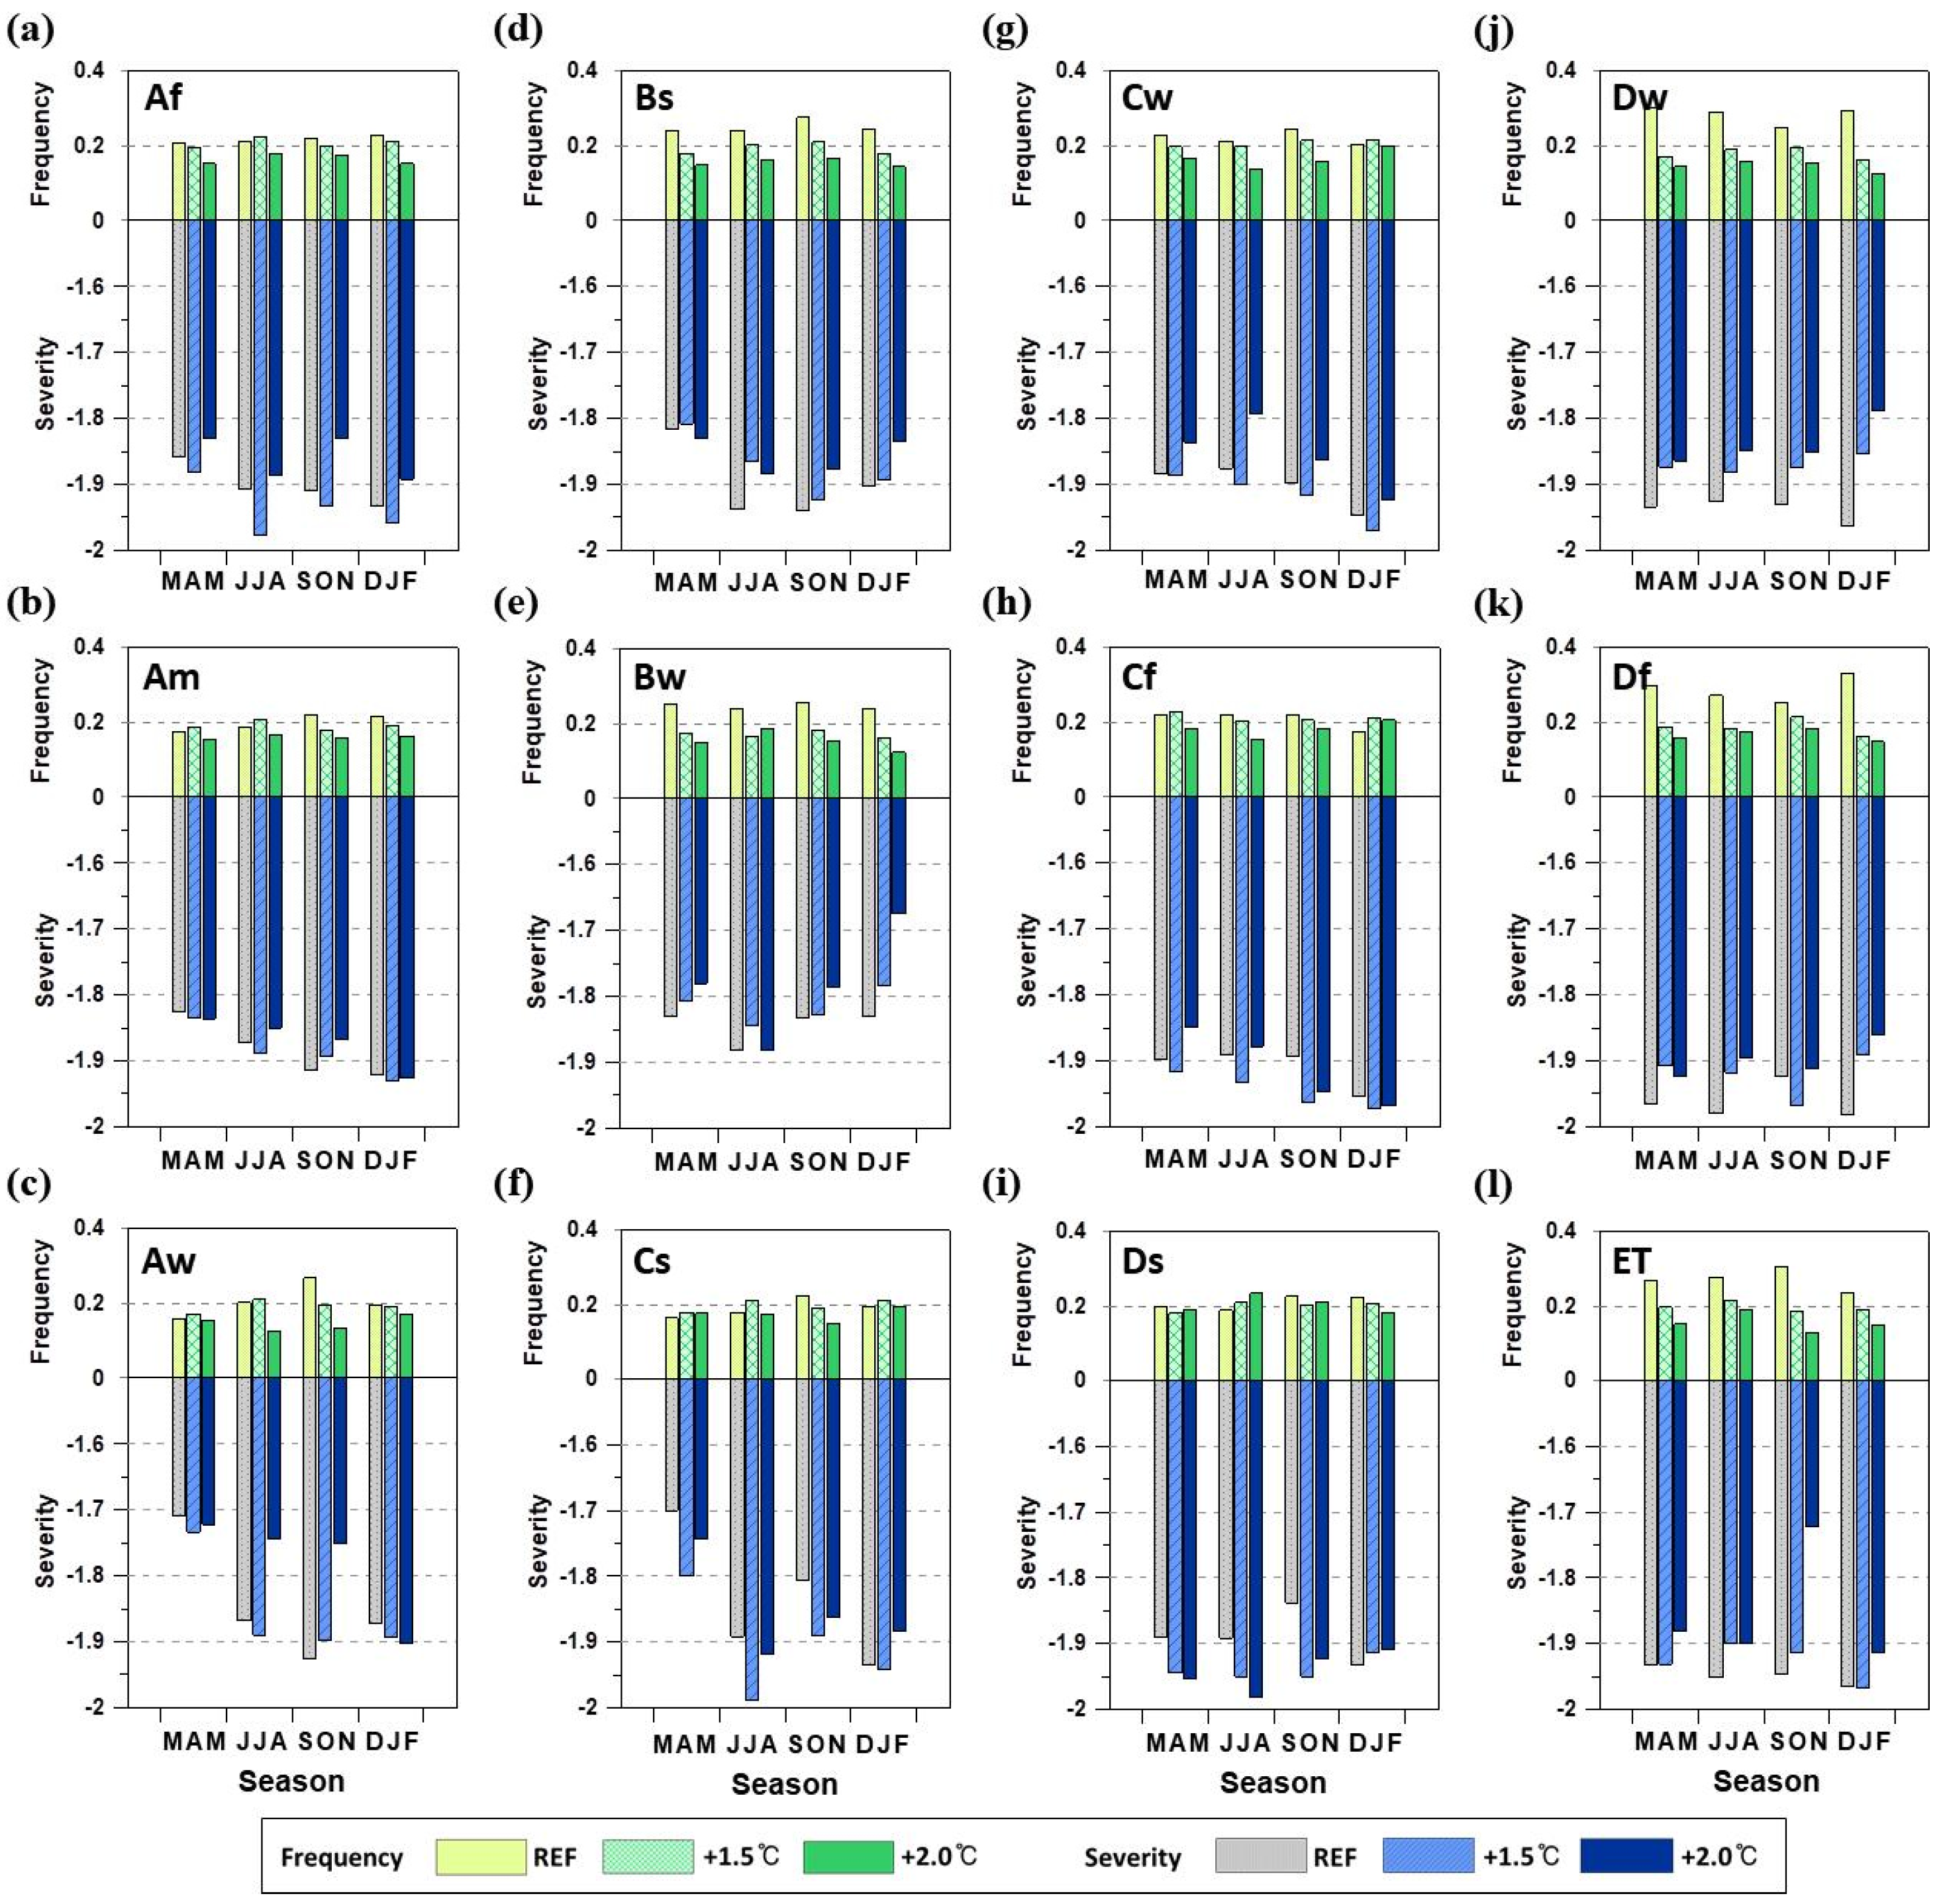
Figure 12 represents the seasonal mean drought severity and frequency for both the REF period and future periods in each climate zone. For the REF period, zones C (except Cs), D, and E are highly vulnerable to severe drought in terms of its severity compared to other zones. In terms of drought frequency, zones B, D, and E are highly vulnerable to severe drought compared with other climate zones. The results reveal that a global warming environment leads to more serious drought events in A, C, and Ds. Moreover, these features are clearly shown in the severity of changes under 1.5 °C of warming rather than 2.0 °C of warming because the precipitation increases under more warming conditions.
4. Discussion
Global warming is well known as a main factor that intensifies the hydrologic cycle, and it consequently leads the changes in wet extremes as well as dry extremes [51,52,53]. Although there is a difference in the regional changes of drought features under the same target global warming, the previous studies have demonstrated that the anthropogenic warming causes the changes in frequency, duration, and intensity of meteorological drought [15,24,54]. Moreover, this drought features are related to changes in climate such as precipitation and evaporation variables [55], including longer dry spells [52,53]. However, to date, hydrological impact assessments responding to global warming have received relatively little attention in terms of seasonal drought analysis considering the diverse features of climate zones over Asia and intensified hydrologic cycle.
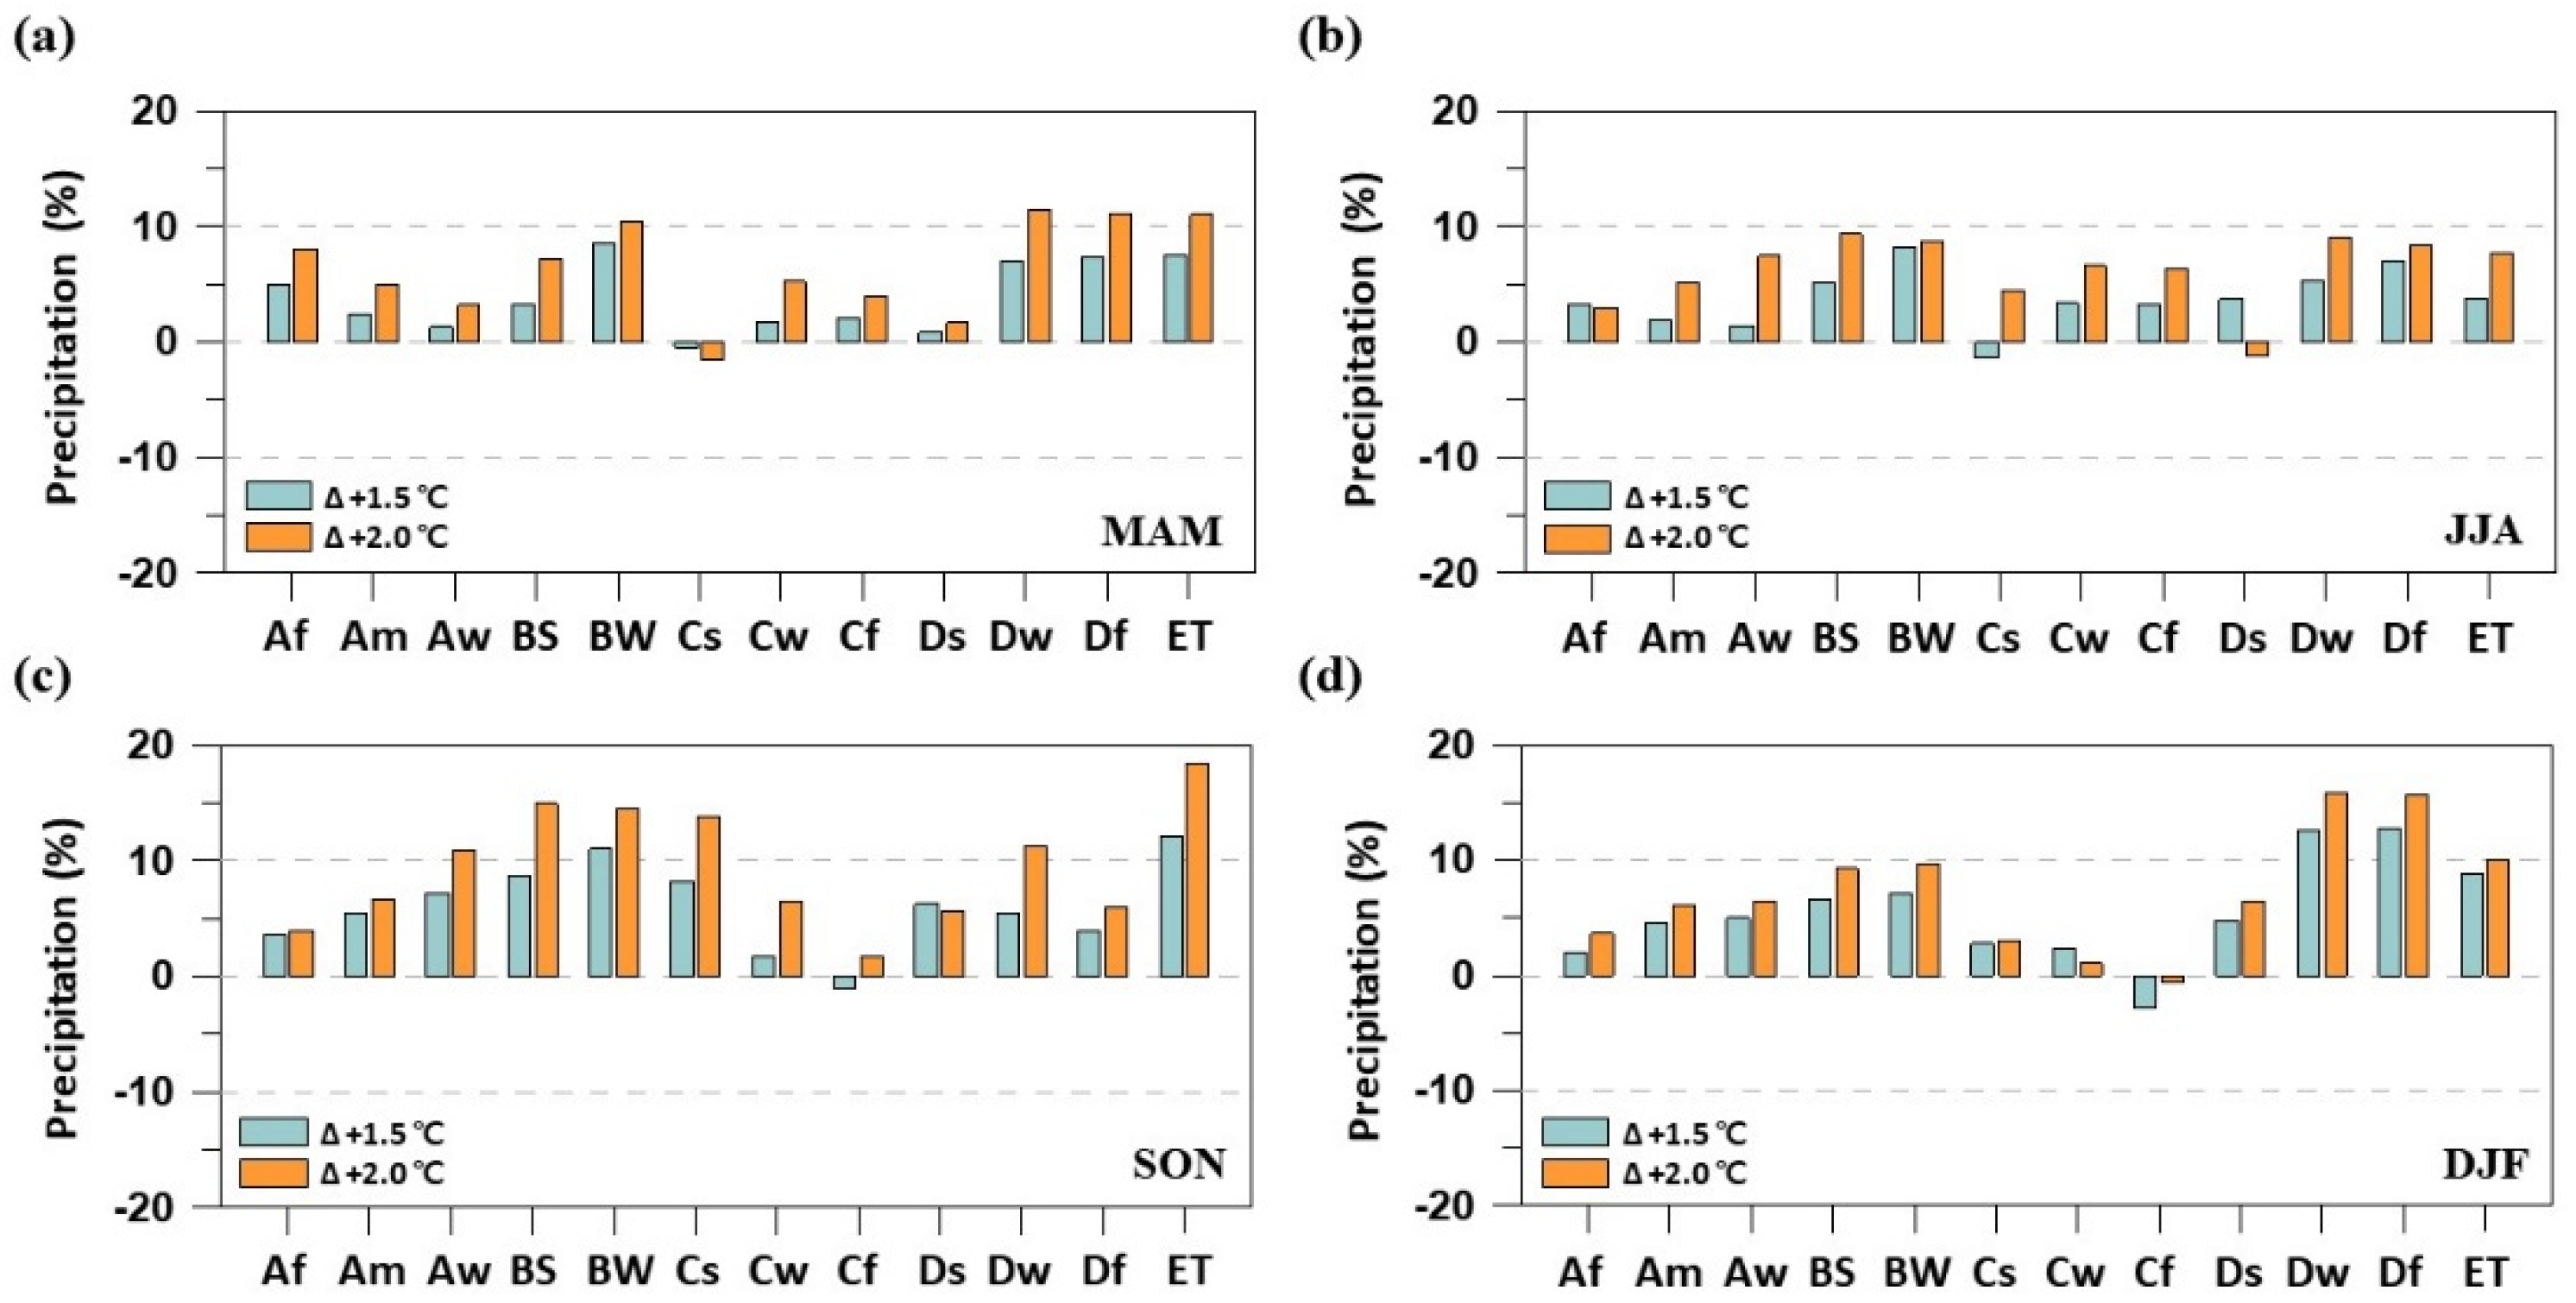
In this study, the annual and seasonal means of SPI3 over Asia are analyzed with regional precipitation features under 1.5 and 2.0 °C global warming. Overall, the change features of severe drought are similar to those of regional precipitation; therefore, the future severe drought characteristics show different change patterns according to climate zones. In particular, change patterns of seasonal drought contribute to annual drought patterns in all climate zones (Figure 9, Figure 10 and Figure 11). Figure 13 shows relative changes in seasonal mean precipitation averaged over each climate zone. As shown in Figure 10, Figure 11, Figure 12 and Figure 13, there is a disparity between the changes in annual and seasonal drought characteristics due to the seasonal variation in regional climate variables under target warming conditions. This finding implies that annual drought changes need to be analyzed with seasonal drought changes under global warming, especially at the regional scale over Asia.
Across the Asia monsoon region, further warmer climate conditions will lead to increased precipitation, subsequently alleviating severe drought in terms of severity and frequency. However, the increase in seasonal precipitation is not directly linked to a decrease in seasonal drought risk in terms of severity and frequency (Figure 10, Figure 11 and Figure 13). Some regions corresponding to the arid climate zone (B) or cold climate zone (D and ET) show a decrease in both severity and frequency in all seasons as the GMT increases. Meanwhile, severe drought in the warm climate zone (C) is projected to increase the severity of SPI3 annually and in most seasons. This finding indicates that drought changes are affected by the precipitation amount as well as other conditions, such as the length of the dry or wet spell. For this reason, the decrease in DSL is significant in arid (B) or cold climate zones (D and ET), where the severity and frequency of SPI3 are clearly decreased annually as well as in all seasons. Although the changes in DSL at annual scale is suggested in here, it is quite related to the drought characteristics.
5. Conclusions
In this paper, we focused on the global warming impact on the severe and extreme drought characteristics in the regional climate zone over the Asian monsoon region. We select the five RCP4.5 projections in the CMIP5 based on the evaluation of their reference simulations and determine the future global warming periods corresponding to 1.5 and 2.0 °C of GMT increases above the PI level to consider the individual GCMs for emission forcings. The precipitation variable needed to calculate meteorological drought indices, such as SPI3, is extracted from five GCMs after bias correction by applying QM. Our analysis shows a comparison of the changes in SPI3 at each climate zone under 1.5 and 2.0 °C global warming scenarios in terms of their spatial distributions and change patterns.
Precipitation in the most climate zones across the Asian monsoon region responding to global warming shows different seasonal features, which causes an uneven precipitation distribution among seasons. Subsequently, these changes can impact regional drought characteristics such as severity and frequency. The changes in drought severity and frequency show different features in individual climate zones in terms of the change signal and their magnitude, especially in terms of drought severity. For future periods, potential drought vulnerability in zones C and Ds will increase with global warming. In addition, spatial variability will be increased under 1.5 and 2.0 °C global warming compared to REF, while drought severity and frequency will decrease in most climate zones (e.g., zones A, B, D, and ET). Our results from MME provide a certain level of reliability based the level of agreement among the five projections. Given that benefits are expected to be obtained by keeping global warming to 1.5 °C, this study supports the need to understand the changes in severe drought characteristics under global warming considering regional climate characteristics.
Here, the MME is calculated based on the multimodel averaging approach; the results commonly show reduced uncertainty in climate projections compared to the individual model projection. However, Tegegne et al. [30] and Tegegne et al. [31] proposed the improved MME approach, namely, the reliability ensemble averaging method for enhanced assessment of impacts of climate change on climate extremes. This approach improves the accuracy of MME results by using the new weight assignation mechanisms. Like this, the efforts of improving the reliability of climate projections are important to estimate the more realistic changes in climate extremes under global warming. Moreover, the drought characteristics are analyzed in terms of the meteorological point view based on the SPI to examine the impact of change of precipitation in this study. Since the drought indices include the hydrologic variables (e.g., actual evaporation, runoff) considering the water balance process, they are able to simulate more realistic drought features. Therefore, change of drought features based on drought indices such as the standardized runoff index (SRI) are needed to analyze the direct impact on society (e.g., water supply, agriculture).
Supplementary Materials
The following are available online at https://www.mdpi.com/2073-4441/12/5/1360/s1, Table S1: The climate zone classification method of Köppen using temperature and precipitation and the ratio of area corresponding to each climate zone over Asia monsoon region. (Tmin(max): monthly averaged minimum (maximum) temperature, Pmin: monthly averaged minimum precipitation, PANN: annual averaged precipitation, Psmin(smax): minimum (maximum) precipitation in the summer season, Pwmin(wmax): minimum (maximum) precipitation in the winter season, and Pth: dryness threshold calculated as a linear function of regional temperature).
Author Contributions
Conceptualization, J.-B.K. and D.-H.B.; methodology, J.-B.K. and J.-M.S.; validation, J.-B.K. and J.-M.S.; formal analysis, J.-B.K.; resources, J.-B.K. and D.-H.B.; data curation, J.-B.K. and J.-M.S.; writing—original draft preparation, J.-B.K.; writing—review & editing, J.-B.K., J.-M.S. and D.-H.B.; visualization, J.-B.K.; supervision, D.-H.B.; project administration, D.-H.B.; funding acquisition, D.-H.B. All authors have read and agreed to the published version of the manuscript.
Funding
This work was supported by KOREA HYDRO & NUCLEAR POWER CO., LTD. (No. H18S023000).
Conflicts of Interest
The authors declare no conflict of interest.
References
- Maliva, R.; Missimer, T. Aridity and drought. Arid Lands Water Evaluation and Management, Environmental Science and Engineering (Environmental Engineering); Springer: Berlin, Germany, 2012; pp. 21–39. [Google Scholar] [CrossRef]
- Guo, Y.; Huang, S.; Huang, Q.; Wang, H.; Fang, W.; Yanga, Y.; Wang, L. Assessing socioeconomic drought based on an improved Multivariate Standardized Reliability and Resilience Index. J. Hydrol. 2019, 568, 904–918. [Google Scholar] [CrossRef]
- WMO. Drought Monitoring and Early Warning: Concepts, Progress and Future Challenges; WMO Publication No. 1006; WMO: Geneva, Switzerland, 2006. [Google Scholar]
- Zargar, A.; Sadiq, R.; Naser, B.; Khan, F.I. A review of drought indices. Environ. Rev. 2011, 19, 333–349. Available online: https://www.jstor.org/stable/envirevi.19.333 (accessed on 13 September 2011). [CrossRef]
- Hao, Z.; AghaKouchak, A. Multivariate Standardized Drought Index:Aparametric multi-index model. Adv. Water Resour. 2013, 57, 12–18. [Google Scholar] [CrossRef] [Green Version]
- Kingston, D.G.; Todd, M.C.; Richard, G.T.; Thompson, J.R.; Arnell, N.W. Uncertainty in the estimation of potential evapotranspiration under climate change. Geophys. Res. Lett. 2009, 36, 259–279. [Google Scholar] [CrossRef] [Green Version]
- Thompson, J.R.; Green, A.J.; Kingston, D.G.; Todd, M.C.; Richard, G.T. Potential evapotranspiration-related uncertainty in climate change impacts on river flow: An assessment for the Mekong River basin. J. Hydrol. 2014, 510, 503–523. [Google Scholar] [CrossRef] [Green Version]
- Mckee, T.B.; Doesken, N.J.; Kleist, J. The relationship of drought frequency and duration to time scales. In Proceedings of the AMS 8th Conference on Applied Climatology, American Meteorological Society, Anaheim, CA, USA, 17–22 January 1993; pp. 179–184. [Google Scholar]
- IPCC. Climate Change 2013: The Physical Science Basis. In Contribution of Working Group I to the Fifth Assessment Report of the Intergovernmental Panel on Climate Change; Cambridge University Press: Cambridge, UK; New York, NY, USA, 2013. [Google Scholar]
- Dai, A. Drought under global warming: A review. Wiley Interdiscip. Rev. Clim. Chang. 2011, 2, 45–65. [Google Scholar] [CrossRef] [Green Version]
- Zou, X.; Zhai, P.; Zhang, Q. Variations in droughts over China: 1951-2003. Geophys. Res. Lett. 2005, 32, L04707. [Google Scholar] [CrossRef]
- Zhang, L.; Zhou, T. Drought over East Asia: A Review. J. Clim. 2015, 28, 3375–3399. [Google Scholar] [CrossRef]
- Son, K.-H.; Bae, D.-H. Drought analysis according to shifting of climate zones to arid climate zone over Asia monsoon region. J. Hydrol. 2015, 529, 1021–1029. [Google Scholar] [CrossRef]
- Barlow, M.; Zaitchik, B.; Paz, S.; Black, E.; Evans, J.; Hoell, A. A Review of Drought in the Middle East and Southwest Asia. J. Clim. 2016, 29, 8547–8574. [Google Scholar] [CrossRef]
- Chen, T.-C.; Wang, S.-Y.; Huang, W.R.; Yen, M.-C. Variation of the East Asian Summer Monsoon Rainfall. J. Clim. 2004, 17, 744–762. [Google Scholar] [CrossRef]
- Oh, S.B.; Byun, H.R.; Kim, D.W. Spatiotemporal characteristics of regional drought occurrence in East Asia. Theor. Appl. Climatol. 2013, 117, 89–101. [Google Scholar] [CrossRef]
- IPCC. Climate Change 2001: The Scientific Basis, IPCC Contribution of Working Group Ⅰ to the Third Assessment Report of the Intergovernmental Panel on Climate Change; Cambridge University Press: Cambridge, UK, 2001. [Google Scholar]
- Bae, D.H.; Jung, I.W.; Chang, H.J. Potential changes in Korean water resources estimated by high-resolution climate simulation. Clim. Res. 2008, 35, 213–226. [Google Scholar] [CrossRef]
- Lee, J.H.; Kwon, H.-H.; Jang, H.-W.; Kim, T.-W. Future Changes in Drought Characteristics under Extreme Climate Change over South Korea. Adv. Meteorol. 2016, 2016, 1–19. [Google Scholar] [CrossRef]
- UNFCCC. Report of the Conference of the Parties on its Twenty-First Session, Held in Paris from 30 November to 13 December 2015. Part Two: Action Taken by the Conference of the Parties at its Twenty-First Session. United Nations. FCCC/CP/2015/10/Add.1. 2015. Available online: http://unfccc.int/resource/docs/2015/cop21/eng/10a01.pdf (accessed on 29 January 2016).
- IPCC. Global Warming of 1.5°C: An IPCC Special Report on the Impacts of Global Warming of 1.5°C above Pre-Industrial Levels and Related Global Greenhouse gas Emission Pathways, in the Context of Strengthening the Global Response to the Threat of Climate Change; Masson-Delmotte, V., Zhai, P., Pörtner, H.O., Roberts, D., Skea, J., Shukla, P.R., Pirani, A., Moufouma-Okia, W., Péan, C., Pidcock, R., Eds.; World Meteorological Organization: Geneva, Switzerland, 2018. [Google Scholar]
- Naumann, G.; Alfieri, L.; Wyser, K.; Mentaschi, L.; Betts, R.A.; Carrao, H.; Spinoni, J.; Vogt, J.; Feyen, L. Global changes in drought conditions under different levels of warming. Geophys. Res. 2018, 45, 3285–3296. [Google Scholar] [CrossRef]
- Su, B.; Huang, J.; Fischer, T.; Wang, Y.; Kundzewicz, Z.W.; Zhai, J.; Sun, H.; Wang, A.; Zeng, X.; Wang, G.; et al. Drought losses in China might double between the 1.5 °C and 2.0 °C warming. Proc. Natl. Acad. Sci. USA 2018, 115, 10600–10605. [Google Scholar] [CrossRef] [PubMed] [Green Version]
- Chen, H.; Sun, J. Increased population exposure to extreme droughts in China due to 0.5°C of additional warming. Environ. Res. Lett. 2019, 14, 1–9. [Google Scholar] [CrossRef]
- Asia-Pacific Network (APN). Climate Change Impact Assessment on the Asia-Pacific Water Resources under AWCI/GEOSS; Asia-Pacific Network for Global Change Research. 2013. Available online: http://www.apn-gcr.org/resources/items/show/1576 (accessed on 1 January 2014).
- Taylor, K.E.; Stouffer, R.J.; Meehl, G.A. An overview of CMIP5 and the experiment design. Bull. Am. Meteorol. Soc. 2012, 93, 485–498. [Google Scholar] [CrossRef] [Green Version]
- Kim, J.B.; Im, E.S.; Bae, D.H. Intensified hydroclimatic regime in Korean basins under 1.5 and 2°C global warming. Int. J. Climatol. 2020, 40, 1965–1978. [Google Scholar] [CrossRef]
- Sylla, M.B.; Faye, A.; Giorgi, F.; Diedhiou, A.; Kunstmann, H. Projected heat stress under 1.5 °C and 2 °C global warming scenarios creates unprecedented discomfort for humans in West Africa. Earth’s Future 2018, 6, 1029–1044. [Google Scholar] [CrossRef]
- Xu, Y.; Gao, X.; Giorgi, F.J. Upgrades to the reliability ensemble averaging method for producing probabilistic climate-change projections. Clim. Res. 2010, 41, 2375–2385. [Google Scholar] [CrossRef] [Green Version]
- Tegegne, G.; Kim, Y.O.; Lee, J.K. Spatiotemporal reliability ensemble averaging of multi-model simulations. Geophys. Res. Lett. 2019, 46, 1–11. [Google Scholar] [CrossRef]
- Tegegne, G.; Melesse, A.M.; Worqlul, A.W. Development of multi-model ensemble approach for enhanced assessment of impacts of climate change on climate extremes. Sci. Total Environ. 2020, 704, 12321–12330. [Google Scholar] [CrossRef] [PubMed]
- Köppen, W. Das Geographische System der Klimate. In Handbuch der Klimato Logie; Köppen, W., Geiger, R., Eds.; Gebrüder Borntraeger: Berlin, Germany, 1936. [Google Scholar]
- Lee, M.H.; Bae, D.H. Climate Change Impact Assessment on Green and Blue Water over Asian Monsoon Region. Water Resour. Manag. 2015, 29, 2407–2427. [Google Scholar] [CrossRef]
- Fernandez, J.P.R.; Franchito, S.H.; Rao, V.B.; Llopart, M. Change in Koppen-Trewartha climate classification over South America from RegCM4 projections. Atmos. Sci. Lett. 2017, 18, 427–434. [Google Scholar] [CrossRef]
- Kim, J.B.; Bae, D.H. Intensification characteristics of hydroclimatic extremes in the Asia monsoon region under 1.5 and 2.0 °C of global warming. Hydrol. Earth Syst. Sci. in press.
- Yatagai, A.; Kamiguchi, K.; Arakawa, O.; Hamada, A.; Yasutomi, N.; Kitoh, A. APHRODITE: Constracting a Long-Term Daily Gridded Precipitation Dataset for Asia Based on a Dense Network of Rain Gauges. Bull. Am. Meteorol. Soc. 2012, 93, 1401–1415. [Google Scholar] [CrossRef]
- Adam, J.C.; Lettenmaier, D.P. Adjustment of global gridded precipitation for systematic bias. J. Geophys. Res. 2003, 108, 1–14. [Google Scholar] [CrossRef]
- Adam, J.C.; Clark, E.A.; Lettenmaier, D.P.; Wood, E.F. Correction of Global Precipitation Products for Orographic Effects. J. Clim. 2006, 19, 15–38. [Google Scholar] [CrossRef]
- Laloyaux, P.; de Boisseson, E.; Balmaseda, M.; Bidlot, J.R.; Broennimann, S.; Buizza, R.; Dalhgren, P.; Dee, D.; Haimberger, L.; Hersbach, H.; et al. CERA-20C: A coupled reanalysis of the twentieth century. J. Adv. Modeling Earth Syst. 2018, 10, 1172–1195. [Google Scholar] [CrossRef]
- Wu, T.; Song, L.; Li, W.; Wang, Z.; Zhang, H.; Xin, X.; Zhang, Y.; Zhang, L.; Li, J.; Wu, F.; et al. An overview of BCC climate system model development and application for climate change studies. J. Meteorol. Res. 2014, 28, 34–56. [Google Scholar] [CrossRef]
- Yang, D.; Saenko, O.A. Ocean Heat Transport and Its Projected Change in CanESM2. J. Clim. 2012, 25, 8148–8163. [Google Scholar] [CrossRef]
- Davini, P.; Cagnazzo, C.; Anstey, J.A. A blocking view of the stratosphere-troposphere coupling. J. Geophys. Res. Atmos. 2014, 119, 11100–11115. [Google Scholar] [CrossRef]
- Voldoire, A.; Sanchez-Gomez, E.; Salas y Me´lia, D.; Decharme, B.; Cassou, C.; Se ´ne ´si, S.; Valcke, S.; Beau, I.; Alias, A.; Chevallier, M.; et al. The CNRM-CM5.1 global climate model: Description and basic evaluation. Clim. Dyn. 2013, 40, 2091–2121. [Google Scholar] [CrossRef]
- Bentsen, M.; Bethke, I.; Debernard, J.B.; Iversen, T.; Kirkevåg, A.; Seland, Ø.; Drange, H.; Roelandt, C.; Seierstad, I.A.; Hoose, C.; et al. The Norwegian Earth System Model, NorESM1-M—Part 1: Description and basic evaluation of the physical climate. Geosci. Model Dev. 2013, 6, 687–720. [Google Scholar] [CrossRef] [Green Version]
- Maurer, E.P.; Pierce, D.W. Bias correction can modify climate model simulated precipitation changes without adverse effect on the ensemble mean. Hydrol. Earth Syst. Sci. 2014, 18, 915–925. [Google Scholar] [CrossRef] [Green Version]
- Cannon, A.J. Selecting GCM scenarios that span the range of changes in a multimodel ensemble: Application to CMIP5 climate extremes indices. J. Clim. 2015, 28, 1260–1267. [Google Scholar] [CrossRef]
- Maraun, D.; Shepherd, T.G.; Widmann, M.; Zappa, G.; Walton, D.; Hall, A.; Gutierrez, J.M.; Hagemann, S.; Richter, I.; Soares, P.; et al. Towards process-informed bias correction of climate change simulations. Nat. Clim. Chang. 2017, 7, 764–773. [Google Scholar] [CrossRef] [Green Version]
- WMO. Standardized Precipitation Index User Guide (WMO-No.1090); Svoboda, M., Hayes, M., Wood, D., Eds.; World Meteorological Organization: Geneva, Switzerland, 2012. [Google Scholar]
- Spinoni, J.; Naumann, G.; Carrao, H.; Barbosa, P.; Vogt, J. World drought frequency, duration, and severity for 1951–2010. Int. J. Climatol. 2013, 34, 2792–2804. [Google Scholar] [CrossRef] [Green Version]
- Spioni, J.; Barbosa, P.; Bucchgnai, E.; Cassano, J.; Cavazos, T.; Christensen, J.H.; Christensen, O.B.; Coppola, E.; Evans, J.; Giorgi, F.; et al. Future Global Meteorological Drought Hot Spots: A Study Based on CORDEX Data. J. Clim. 2020, 33, 3375–3399. [Google Scholar] [CrossRef]
- Held, I.M.; Soden, B.J. Water vapor feedback and global warming. Annu. Rev. Energy Environ. 2000, 25, 441–475. [Google Scholar] [CrossRef] [Green Version]
- Giorgi, F.; Im, E.S.; Coppola, E.; Diffenbaugh, N.S.; Gao, X.J.; Mariotti, L.; Shi, Y. Higher hydroclimatic intensity with global warming. J. Clim. 2011, 24, 5309–5324. [Google Scholar] [CrossRef]
- Im, E.S.; Choi, Y.W.; Ahn, J.B. Robust intensification of hydroclimatic intensity over East Asia from multi-model ensemble regional projections. Theor. Appl. Climatol. 2017, 129, 1241–1254. [Google Scholar] [CrossRef] [Green Version]
- Xu, L.; Nengcheng, C.; Zhang, X. Global drought trends under 1.5 and 2 °C warming. Int. J. Climatol. 2018, 39, 2375–2385. [Google Scholar] [CrossRef]
- King, A.D.; Karoly, D. Climate extremes in Europe at 1.5 and 2 degrees of global warming. Environ. Res. Lett. 2017, 12. [Google Scholar] [CrossRef]
Figure 1.
Modeling procedure used in this study.

Figure 2.
The spatial extent of study region with classified subregions for the regional analysis. The black lines indicate the boundary of each country in the Asia monsoon region. The individual grids with 12 different colors indicate the classified climate zones based on the Köppen climate zone method [35].

Figure 3.
(a–l) Seasonal mean precipitation (mm) and temperature (°C) for individual 12 climate zone based on the observational and reanalysis data (OBS) datasets and the multimodel ensemble (MME) of five bias-corrected GCMs.
Figure 3.
(a–l) Seasonal mean precipitation (mm) and temperature (°C) for individual 12 climate zone based on the observational and reanalysis data (OBS) datasets and the multimodel ensemble (MME) of five bias-corrected GCMs.

Figure 4.
Spatial distribution of changes in (a–d,f–i) seasonal (March–April–May, MAM; June–July–August, JJA; September–October–November, SON; and December–January–February, DJF) and (e,j) annual mean precipitation (unit: mm/day) under 1.5 and 2.0 °C global warming compared to the reference period in the Asian monsoon region, respectively. The values in parentheses indicate the change in the area-averaged mean over the Asian monsoon region.

Figure 5.
Spatial distribution of relative changes in dry spell length (DSL) under (a) 1.5 °C and (b) 2.0 °C global warming compared to reference period (REF) (unit: %). The values in parentheses indicate the change in the area-averaged mean over the Asian monsoon region. (c) Relative changes in DSL for individual 12 climate zone under 1.5 °C and 2.0 °C global warming compared to reference period (REF) (unit: %).

Figure 6.
Spatial distribution of annual mean (a–c) value of severe (extreme) drought; (d–f) frequency of severe drought (unit: times/year) based on standardized precipitation index (SPI) under 1.5 and 2.0 °C global warming compared to the reference period (REF) in the Asian monsoon region.
Figure 6.
Spatial distribution of annual mean (a–c) value of severe (extreme) drought; (d–f) frequency of severe drought (unit: times/year) based on standardized precipitation index (SPI) under 1.5 and 2.0 °C global warming compared to the reference period (REF) in the Asian monsoon region.

Figure 7.
Box-whisker plot for spatial variability of mean (a) value of severe drought; (b) frequency of severe drought (unit: times/year) based on the severe drought events (e.g., SPI3 <-1.5) during the REF period and 1.5 °C (2.0 °C) of global warming period in the Asian monsoon region. The gray, blue, and red colors indicate the MME-based results of REF period and 1.5 and 2.0 °C global warming period, respectively.

Figure 8.
Spatial distribution of relative changes in the seasonal mean (a–d) value of severe drought; (e–h) frequency of severe drought (unit: times/year) based on SPI under 1.5 and 2.0 °C global warming compared to the reference period in the Asian monsoon region. The values in parentheses indicate the change in the area-averaged mean at the all grids within the domain.

Figure 9.
Changes in annual mean (a) value of severe drought (unit: %); (b) frequency of severe drought (unit: times/year) based on SPI under 1.5 and 2.0 °C global warming compared to the reference period in the Asian monsoon region.
Figure 9.
Changes in annual mean (a) value of severe drought (unit: %); (b) frequency of severe drought (unit: times/year) based on SPI under 1.5 and 2.0 °C global warming compared to the reference period in the Asian monsoon region.

Figure 10.
Relative changes in the (a–d) seasonal mean severity of severe drought (unit: %) based on SPI3 under 1.5 and 2.0 °C global warming compared to the reference period in the Asian monsoon region.
Figure 10.
Relative changes in the (a–d) seasonal mean severity of severe drought (unit: %) based on SPI3 under 1.5 and 2.0 °C global warming compared to the reference period in the Asian monsoon region.

Figure 11.
Relative changes in the (a–d) seasonal mean frequency of severe drought (unit: %) based on SPI3 under 1.5 and 2.0 °C global warming compared to the reference period in the Asian monsoon region.
Figure 11.
Relative changes in the (a–d) seasonal mean frequency of severe drought (unit: %) based on SPI3 under 1.5 and 2.0 °C global warming compared to the reference period in the Asian monsoon region.

Figure 12.
(a–l) Seasonal mean frequency of severe drought and severity of severe drought based on SPI3 under reference (REF) and future (+1.5 °C and +2.0 °C) climate scenarios for individual 12 climate zones.
Figure 12.
(a–l) Seasonal mean frequency of severe drought and severity of severe drought based on SPI3 under reference (REF) and future (+1.5 °C and +2.0 °C) climate scenarios for individual 12 climate zones.

Figure 13.
Relative changes in (a–d) seasonal mean precipitation based on the MME of 5 GCMs under reference (REF) and future (+1.5 °C and +2.0 °C) climate scenarios for 12 climate zones.
Figure 13.
Relative changes in (a–d) seasonal mean precipitation based on the MME of 5 GCMs under reference (REF) and future (+1.5 °C and +2.0 °C) climate scenarios for 12 climate zones.


Table 1.
List of the five selected global climate models (GCMs) used in this study.
| No. | GCMs | Resolution (Lon. × Lat.) | Institute | Nation | References |
|---|---|---|---|---|---|
| 1 | bcc-csm1-1-m | 1.125˚ × 1.125˚ | BCC | China | Wu et al. [40] |
| 2 | CanESM2 | 2.8125˚ × 2.8125˚ | CCCma | Canada | Yang and Saenko [41] |
| 3 | CMCC-CMS | 1.875˚ × 1.875˚ | CMCC | Italy | Davini et al. [42] |
| 4 | CNRM-CM5 | 1.40625˚ × 1.40625˚ | CNRM-CERFACS | France | Voldoire et al. [43] |
| 5 | NorESM1-M | 2.5˚ × 1.875˚ | NCC | Norway | Bentsen et al. [44] |
Table 2.
Central years and averaged periods for 0.48, 1.5, and 2.0 °C global warming under the RCP4.5 scenario for the individual GCMs.
Table 2.
Central years and averaged periods for 0.48, 1.5, and 2.0 °C global warming under the RCP4.5 scenario for the individual GCMs.
| GCMs | Central Year (0.48 °C) | Reference Period (0.48 °C) | Central Year (1.5 °C) | Future Period (1.5 °C) | Central Year (2.0 °C) | Future Period (2.0 °C) |
|---|---|---|---|---|---|---|
| bcc-csm1-1-m | 1973 | 1959–1988 | 2013 | 2006–2035 | 2039 | 2025–2054 |
| CanESM2 | 1983 | 1969–1998 | 2016 | 2006–2035 | 2031 | 2017–2046 |
| CMCC-CMS | 1996 | 1982–2011 | 2034 | 2020–2049 | 2052 | 2038–2067 |
| CNRM-CM5 | 1988 | 1974–2003 | 2035 | 2021–2050 | 2056 | 2042–2071 |
| NorESM1-M | 1991 | 1977–2006 | 2041 | 2027–2056 | 2075 | 2061–2090 |
Table 3.
Classification of drought severity for the range of index values [6].
Table 3.
Classification of drought severity for the range of index values [6].
| SPI Values | Drought Category | Probability Range (%) |
|---|---|---|
| 2.00 Z | Extremely wet | 2.3 |
| 1.50 Z 1.99 | Very wet | 4.4 |
| 1.00 Z 1.49 | Moderately wet | 9.2 |
| −0.99 Z 0.99 | Near normal | 68.2 |
| −1.49 Z −1.00 | Moderately dry | 9.1 |
| −1.99 Z −1.50 | Severe dry | 4.4 |
| Z 2.00 | Extremely dry | 2.3 |
© 2020 by the authors. Licensee MDPI, Basel, Switzerland. This article is an open access article distributed under the terms and conditions of the Creative Commons Attribution (CC BY) license (http://creativecommons.org/licenses/by/4.0/).
Share and Cite
MDPI and ACS Style
Kim, J.-B.; So, J.-M.; Bae, D.-H. Global Warming Impacts on Severe Drought Characteristics in Asia Monsoon Region. Water 2020, 12, 1360. https://doi.org/10.3390/w12051360
AMA Style
Kim J-B, So J-M, Bae D-H. Global Warming Impacts on Severe Drought Characteristics in Asia Monsoon Region. Water. 2020; 12(5):1360. https://doi.org/10.3390/w12051360
Chicago/Turabian StyleKim, Jeong-Bae, Jae-Min So, and Deg-Hyo Bae. 2020. "Global Warming Impacts on Severe Drought Characteristics in Asia Monsoon Region" Water 12, no. 5: 1360. https://doi.org/10.3390/w12051360
Note that from the first issue of 2016, this journal uses article numbers instead of page numbers. See further details here.