Multisource Groundwater Contamination under Data Scarcity: The Case Study of Six Municipalities in the Proximity of the Naameh Landfill, Lebanon


 , , ,
, , ,
Abstract
:
1. Introduction
- In view of the solid waste crisis of 2015–2016, are there any residual damages on the quality of surface and groundwater resources (springs and wells)?
- What are the other threats affecting the water quality in the area?
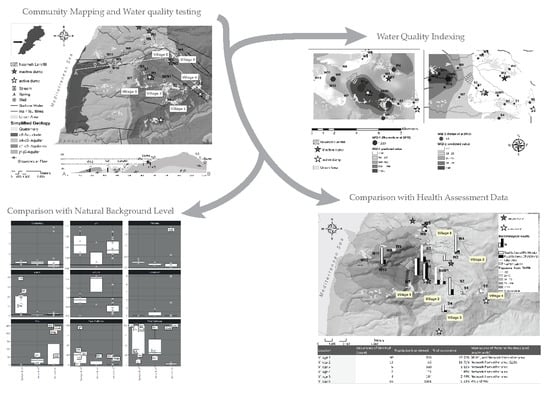
2. Materials and Methods
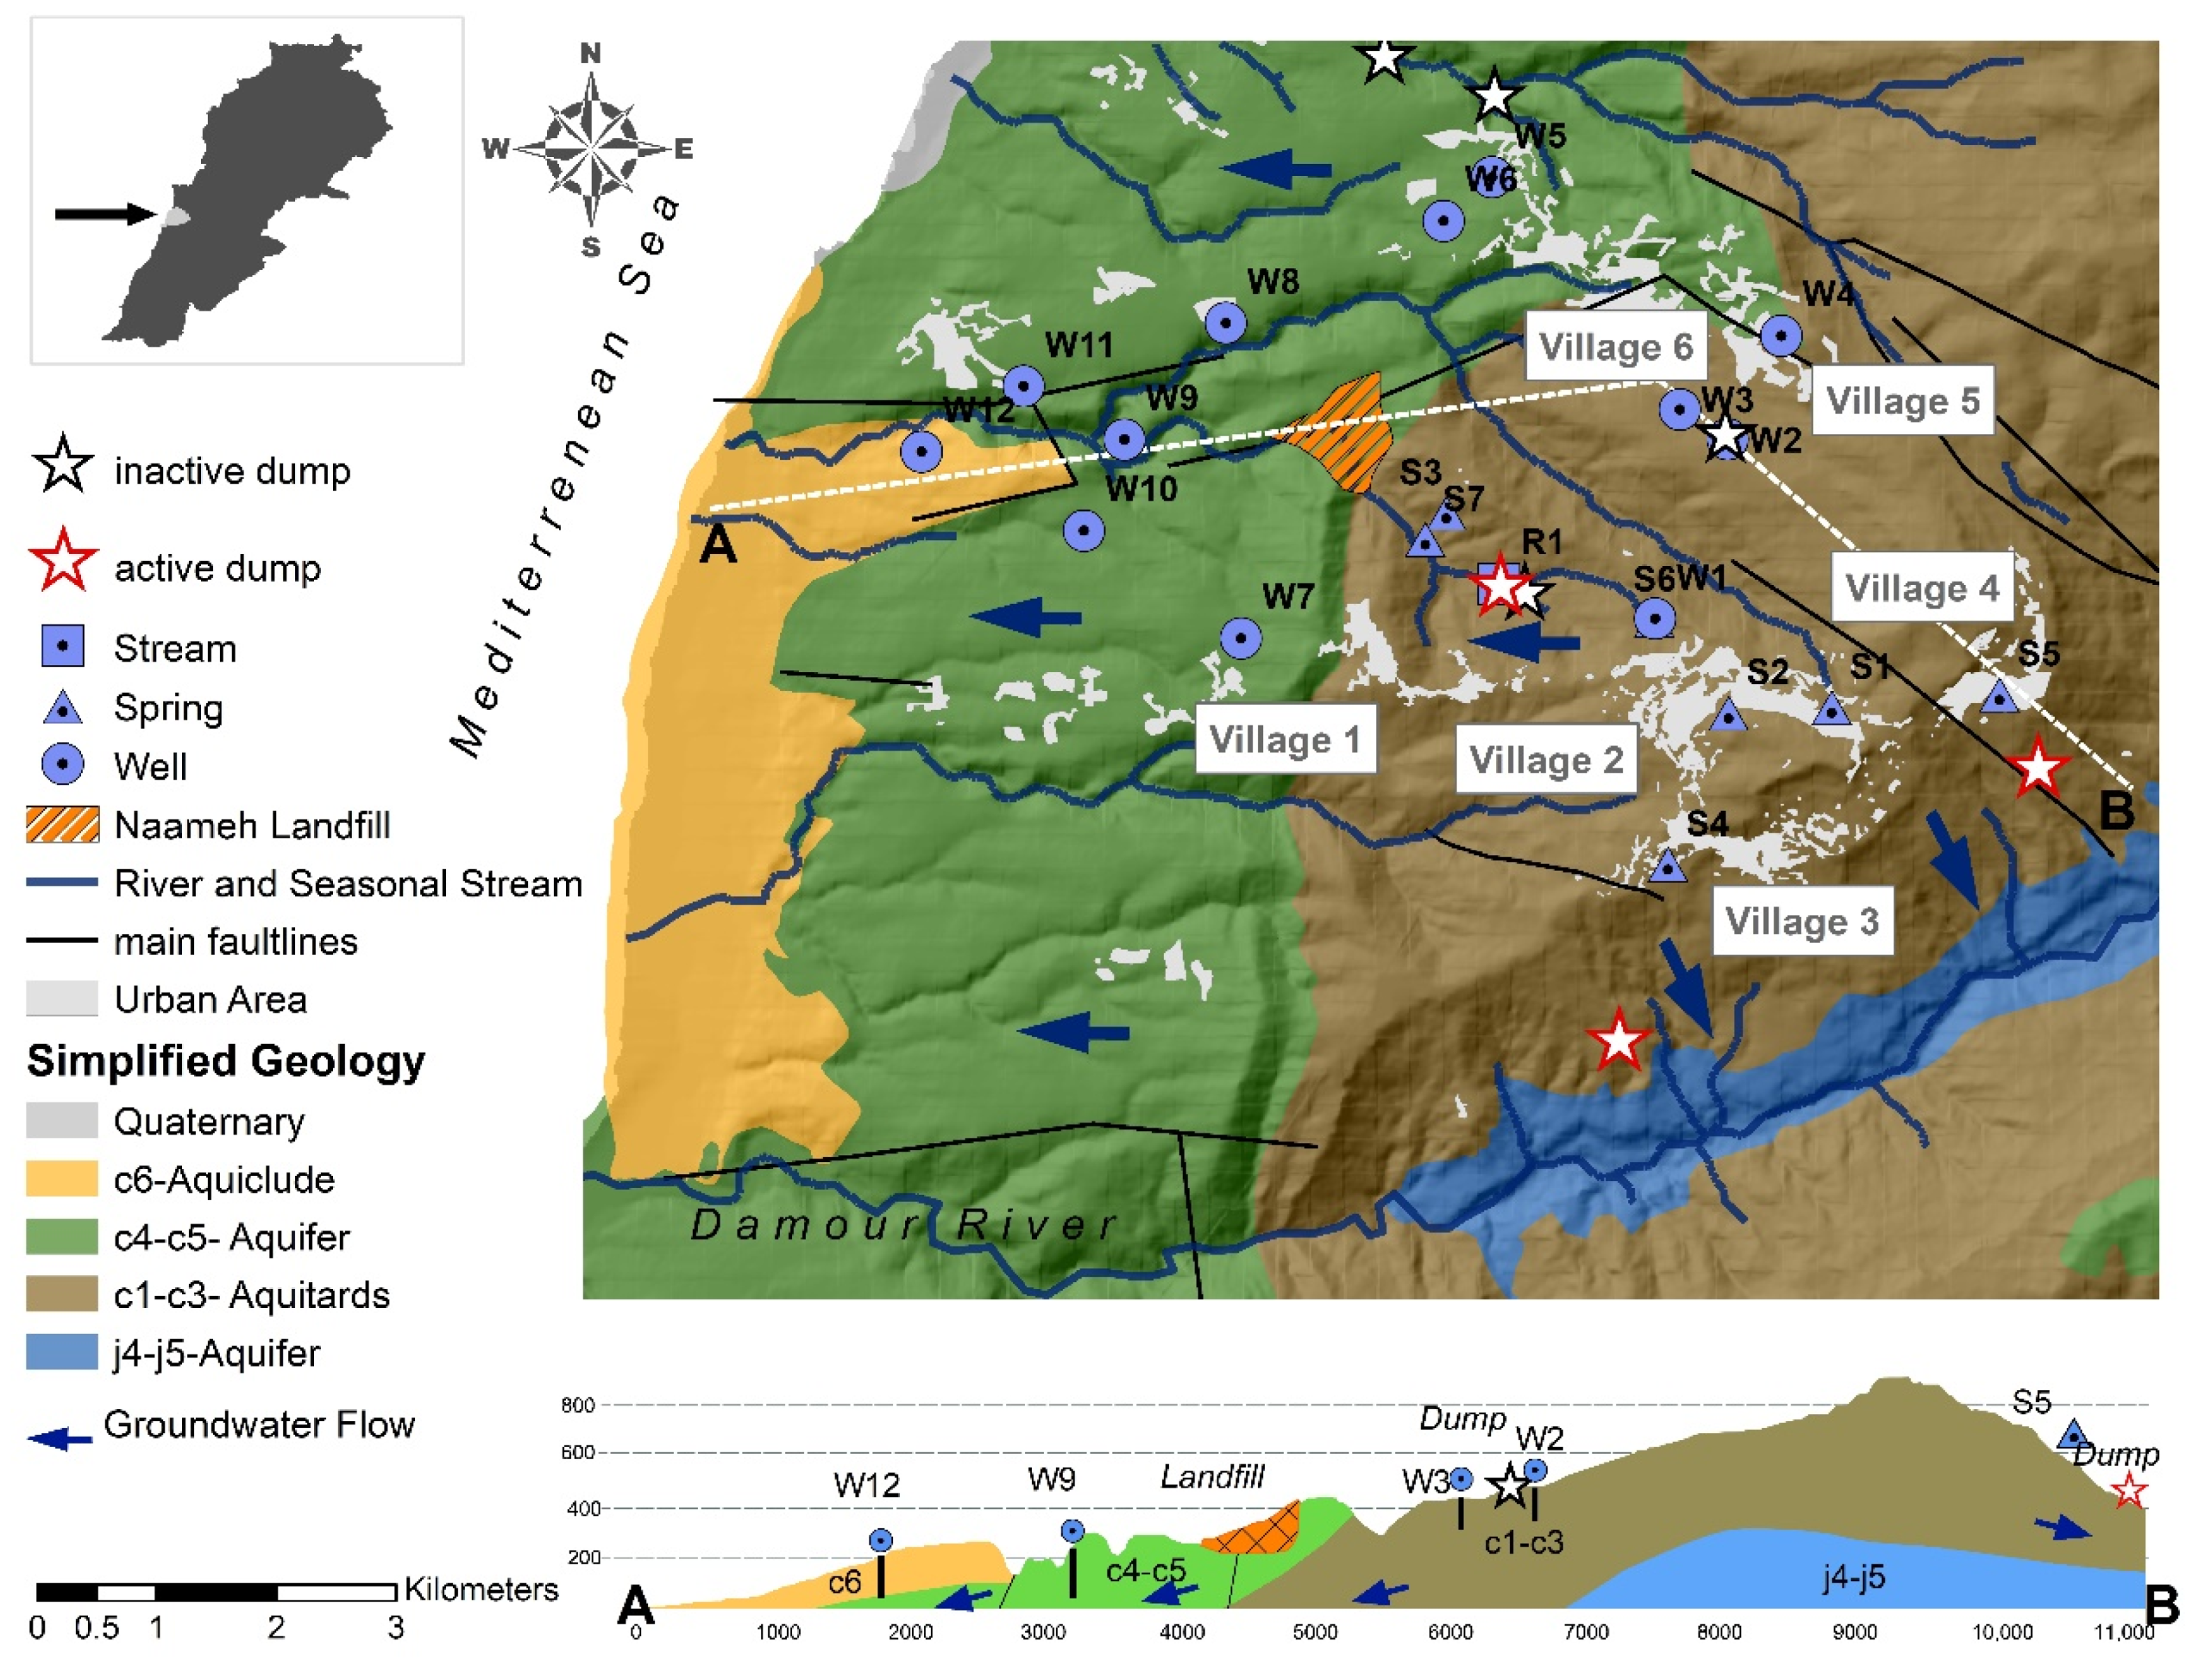
2.1. Study Area
2.2. Methods
3. Results
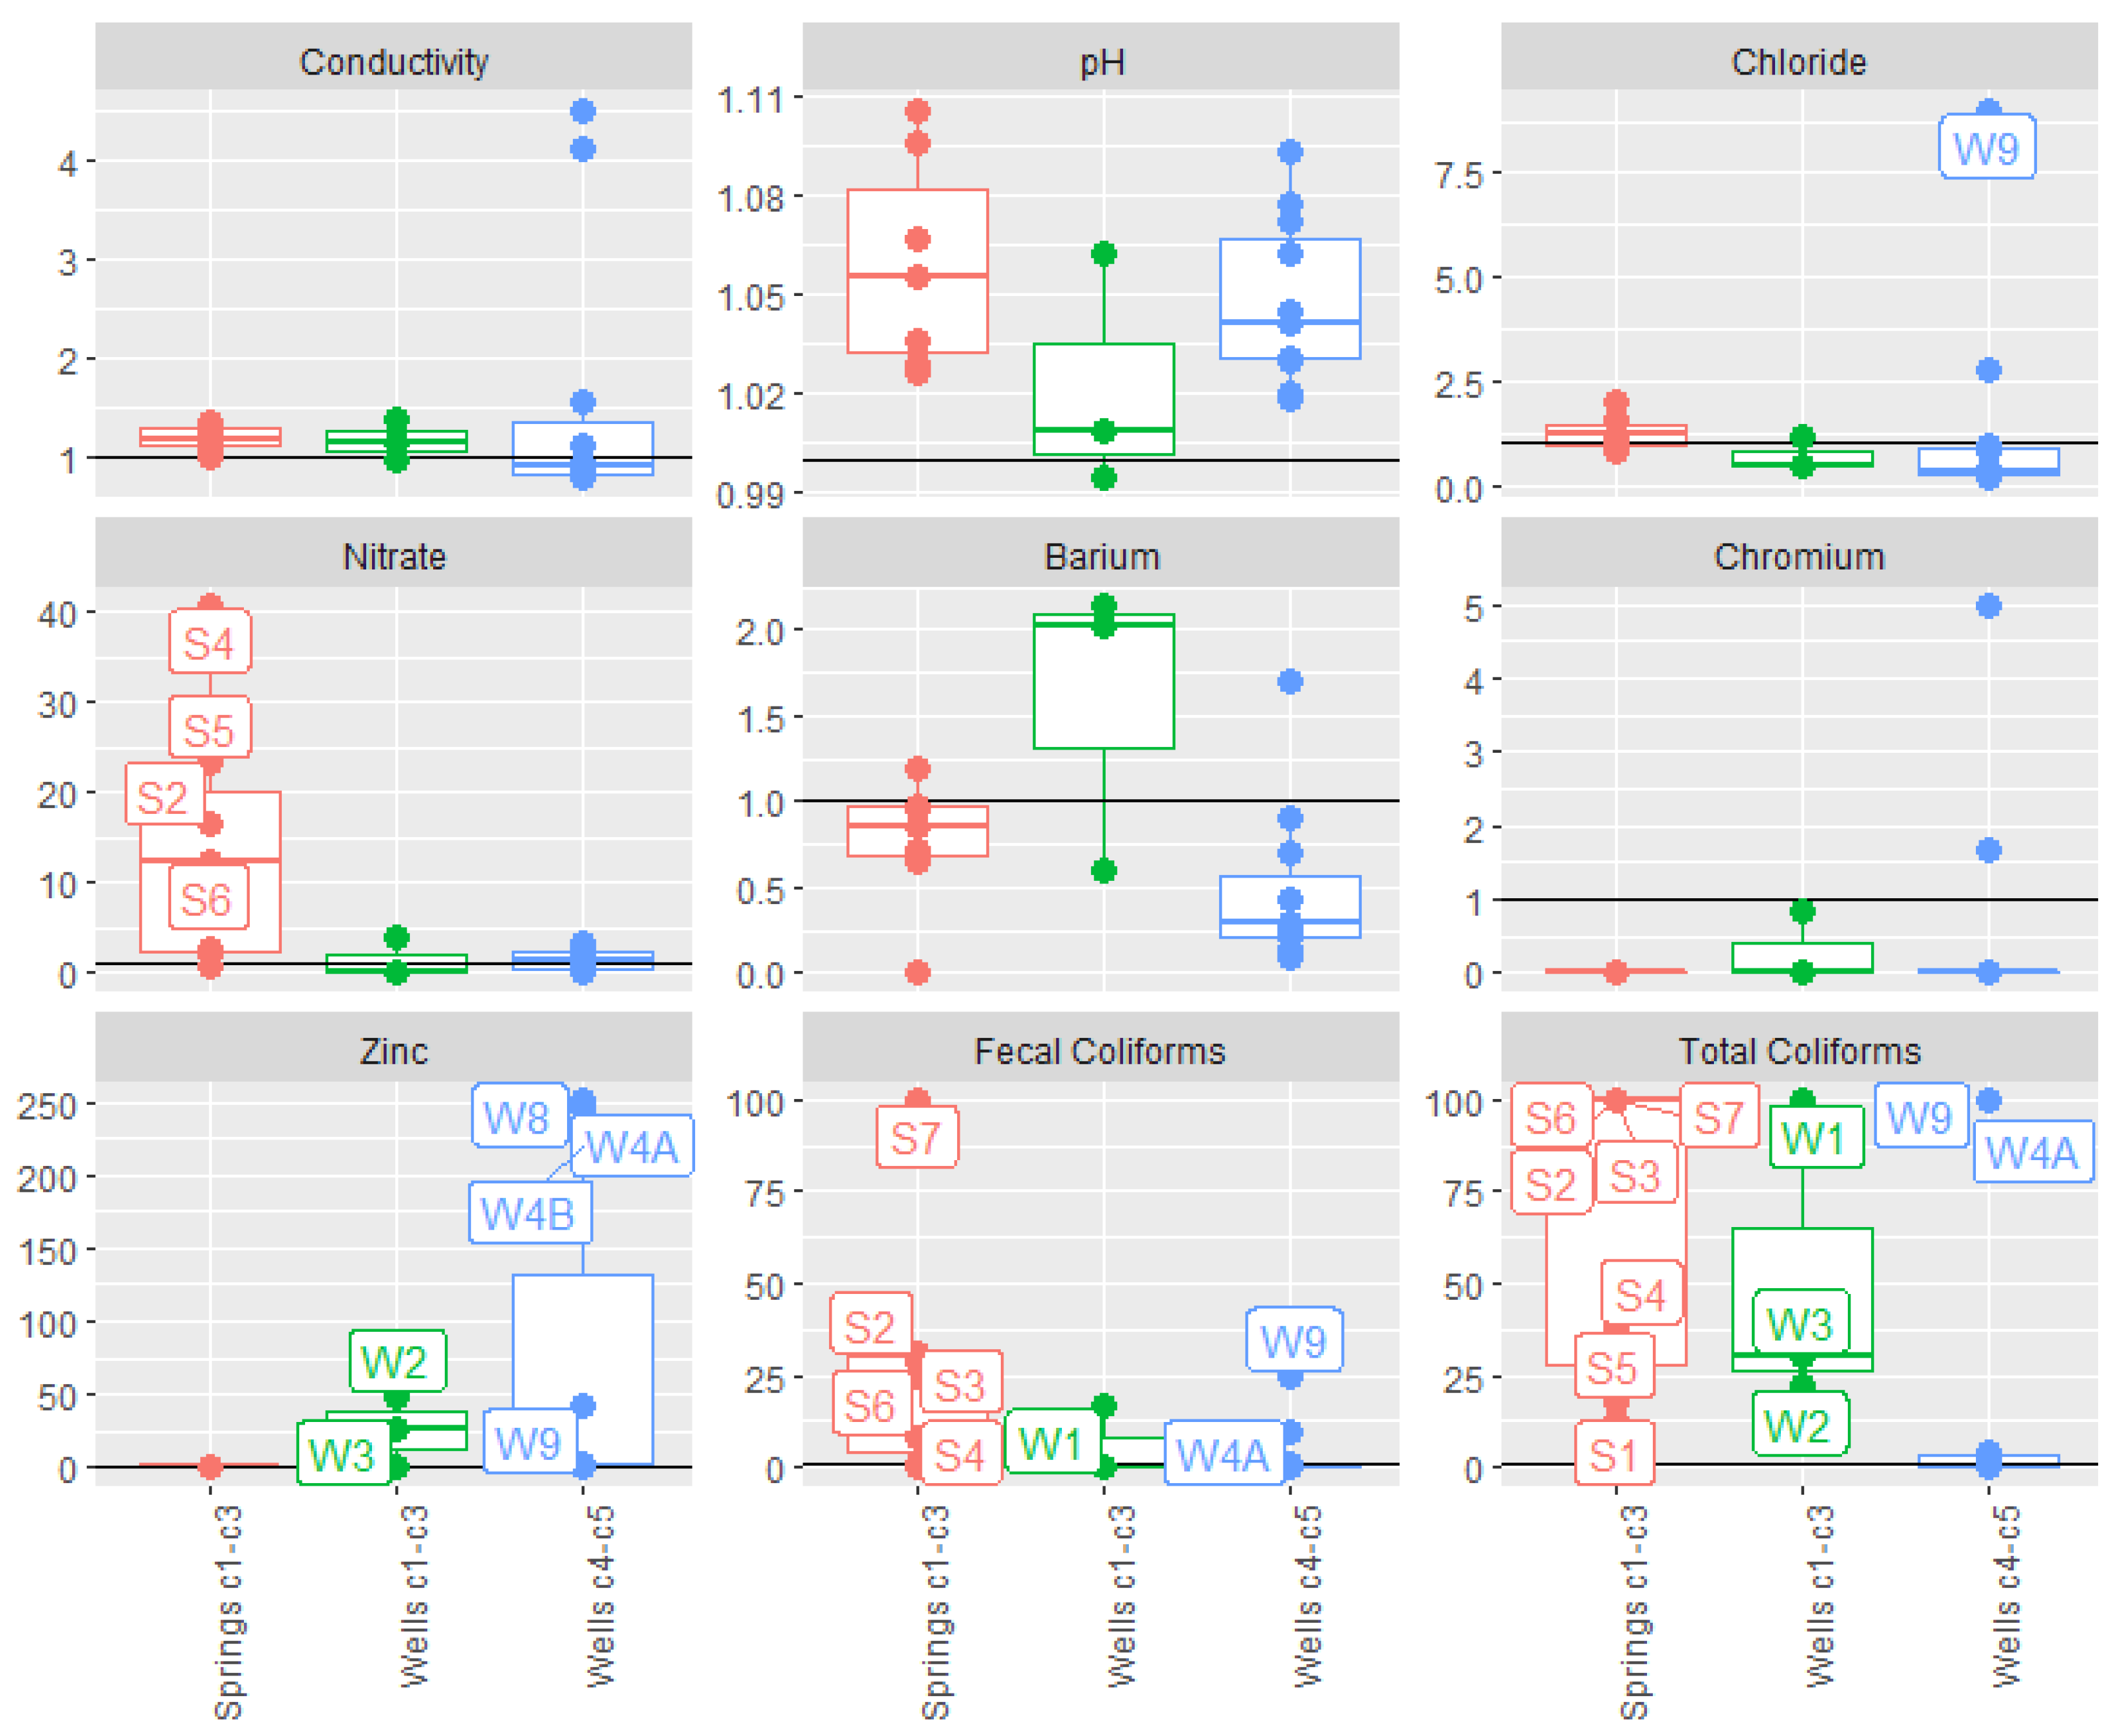
3.1. Stream
3.2. C1-C3 Groundwater Basin
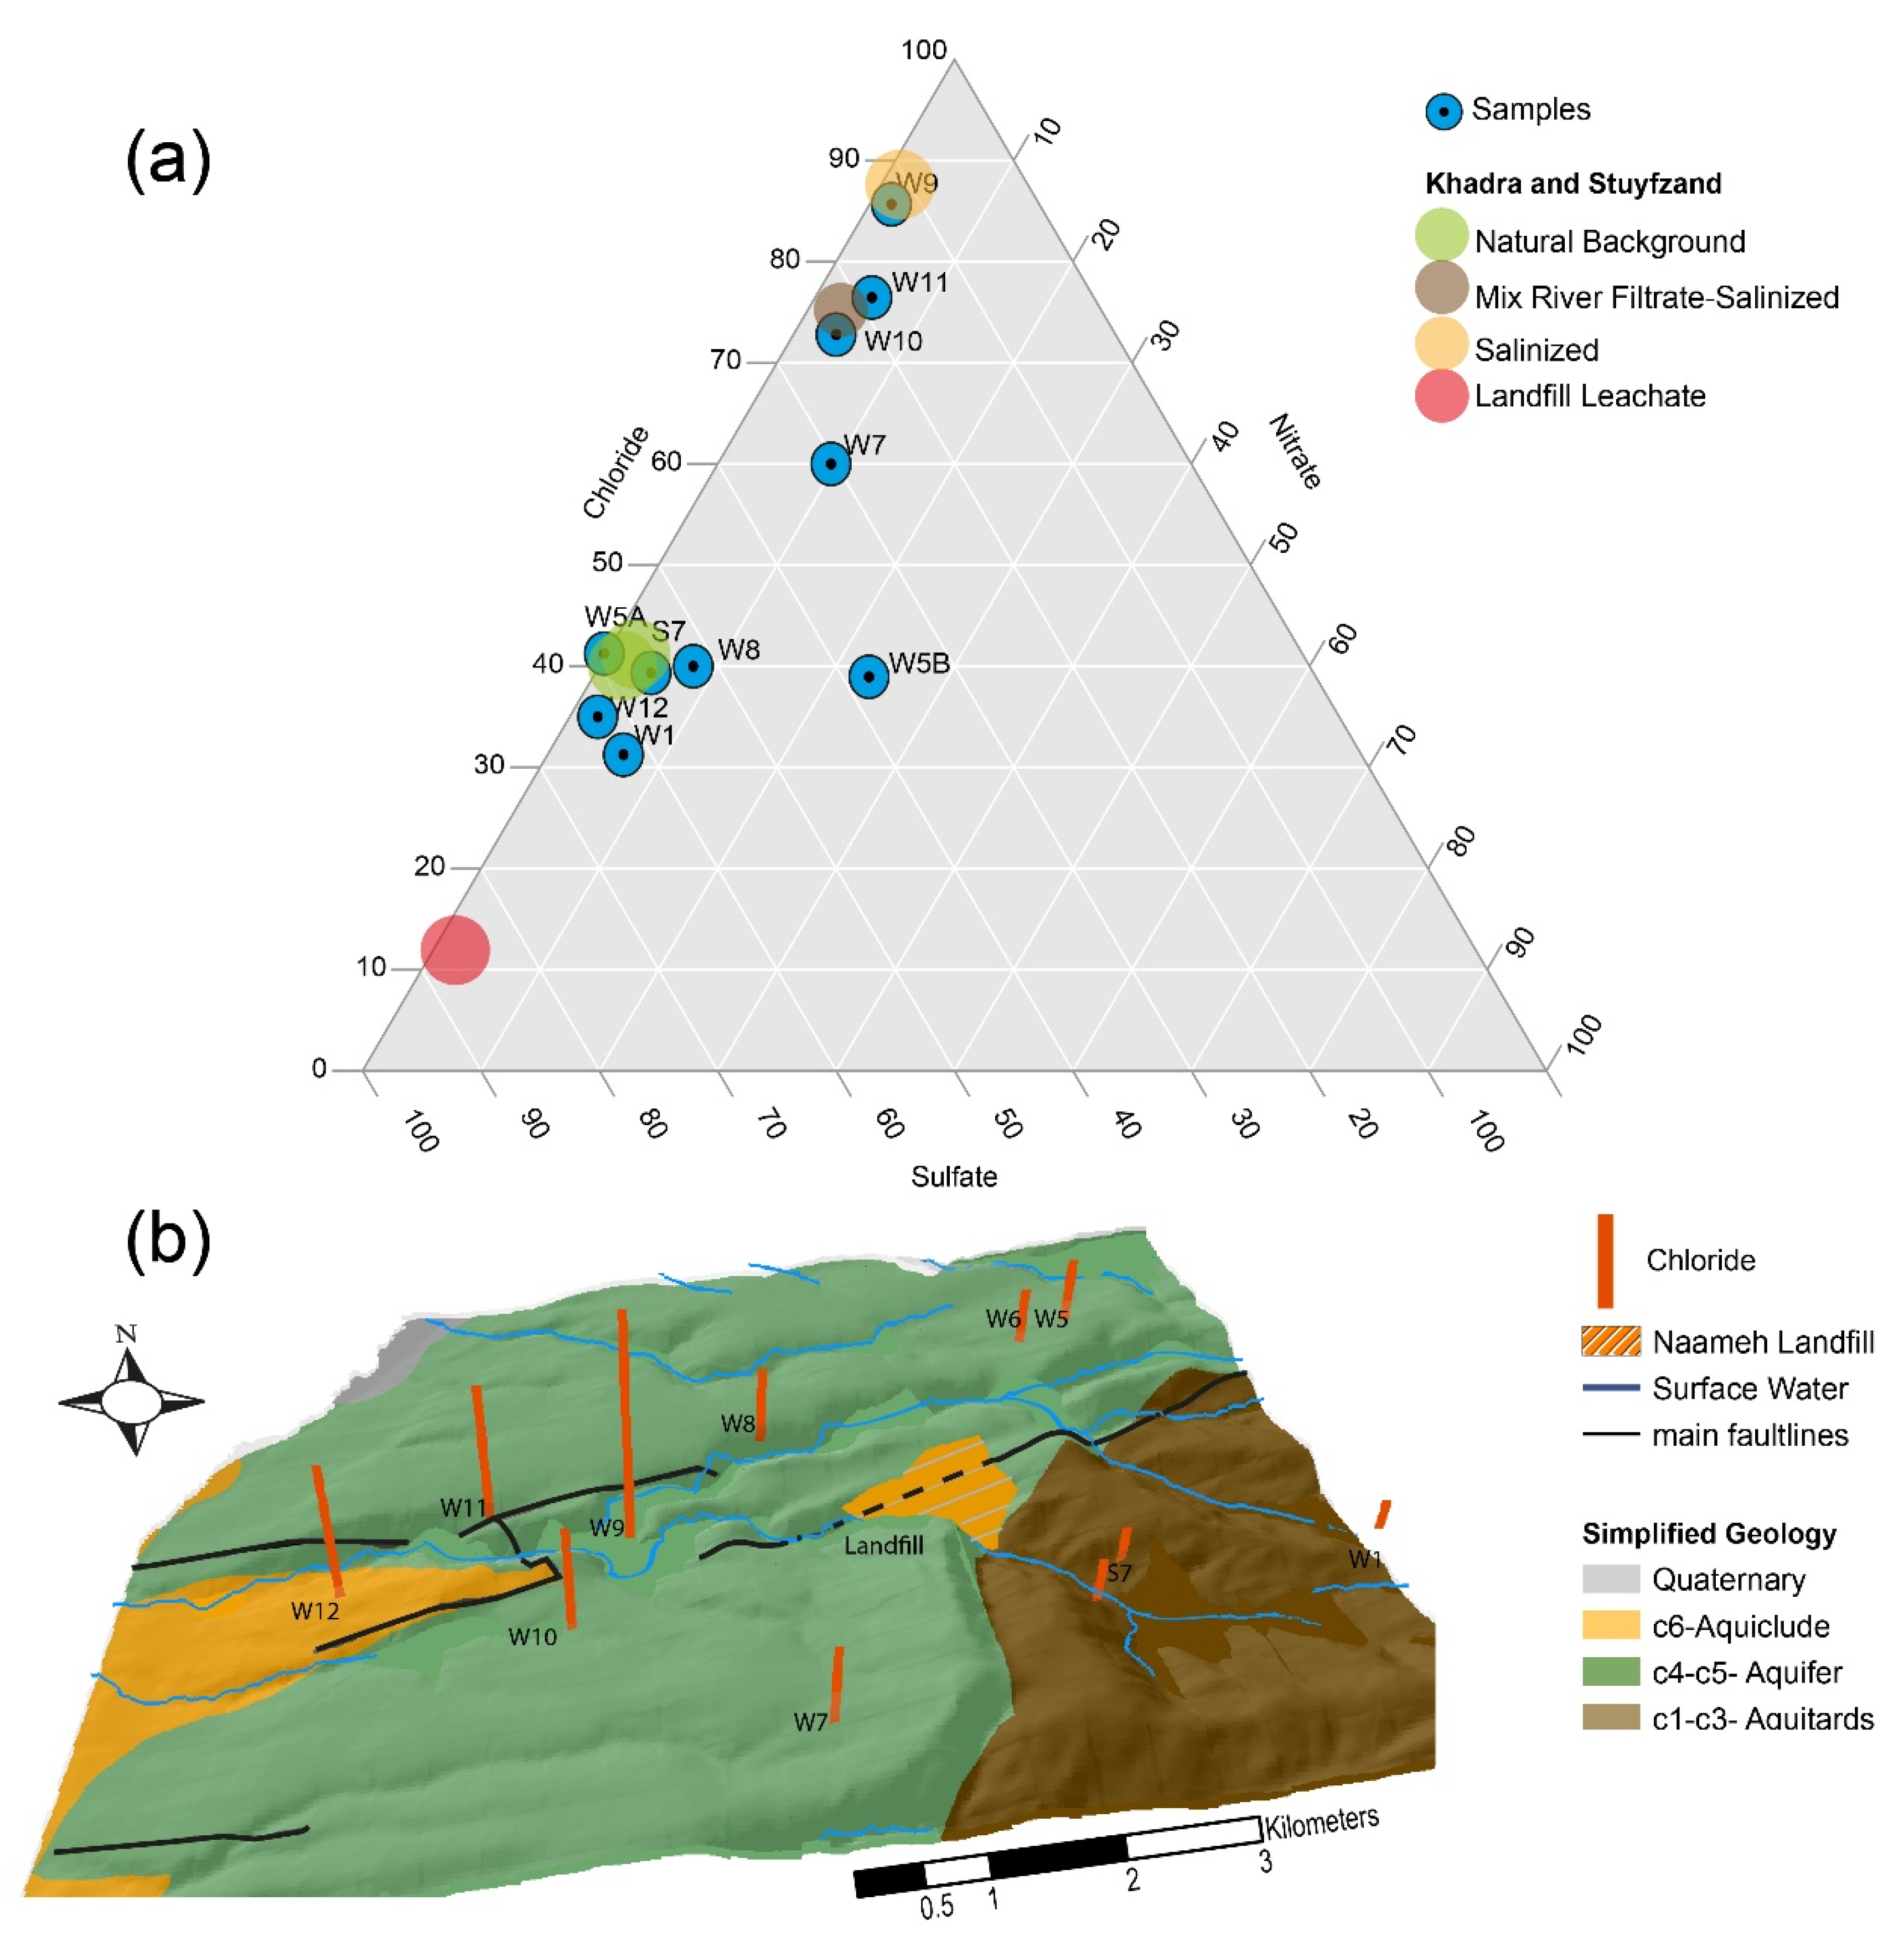
3.3. C4-C5 Groundwater Basin
3.4. WQI
4. Discussion
4.1. Comparison with Natural Background
4.2. Possible Sources Of Contamination
4.3. Water Quality Index and Community Public Health
5. Conclusions
Supplementary Materials
Author Contributions
Funding
Acknowledgments
Conflicts of Interest
Appendix A
References
- Dietz, T.; Ostrom, E.; Stern, P.C. The struggle to govern the commons. Science 2003, 302, 1907–1912. [Google Scholar] [CrossRef] [PubMed] [Green Version]
- Resolution, A. RES/64/292. The human right to water and sanitation. In Proceedings of the Sixty-Fourth United Nations General Assembly, New York, NY, USA, 15 September 2009–14 September 2010. [Google Scholar]
- World Health Organization. Unicef, Progress on Drinking Water, Sanitation and Hygiene: 2017 Update and SDG Baselines; WHO: Geneva, Switzerland, 2017; pp. 9–10. [Google Scholar]
- Massoud, M.A.; Mokbel, M.; Alawieh, S. Reframing environmental problems: Lessons from the solid waste crisis in Lebanon. J. Mater. Cycles Waste Manag. 2019, 21, 1311–1320. [Google Scholar] [CrossRef]
- Leenders, R. Spoils of Truce: Corruption and State-Building in Postwar Lebanon; Cornell University Press: Ithaca, NY, USA, 2012. [Google Scholar]
- Khalaf, S. Lebanon Adrift: From Battleground to Playground; Saqi: 2012. Available online: https://books.google.com.lb/books?hl=en&lr=&id=EzwhBQAAQBAJ&oi=fnd&pg=PT3&dq=6.%09Khalaf,+S.+Lebanon+Adrift:+From+Battleground+to+Playground%3B+Saqi:+&ots=PM6JXi0M37&sig=pK7V-XL8pAdHYdgEZJ0Y-WtwGXQ&redir_esc=y#v=onepage&q=6.%09Khalaf%2C%20S.%20Lebanon%20Adrift%3A%20From%20Battleground%20to%20Playground%3B%20Saqi%3A&f=false (accessed on 20 April 2020).
- El Mufti, K. Official response to the Syrian refugee crisis in Lebanon, the disastrous policy of no-policy. Beirut: Civ. Soc. Knowl. Cent., Leban. Support 2014. [Google Scholar] [CrossRef]
- Bizri, A.R.; Fares, J.; Musharrafieh, U. Infectious diseases in the era of refugees: Hepatitis A outbreak in Lebanon. Avicenna J. Med. 2018, 8, 147. [Google Scholar] [CrossRef] [PubMed]
- Khalil, C.; Al Hageh, C.; Korfali, S.; Khnayzer, R.S. Municipal leachates health risks: Chemical and cytotoxicity assessment from regulated and unregulated municipal dumpsites in Lebanon. Chemosphere 2018, 208, 1–13. [Google Scholar] [CrossRef]
- Abbas, I.I.; Chaaban, J.K.; Al-Rabaa, A.-R.; Shaar, A.A. Solid Waste Management in Lebanon: Challenges and Recommendations. J. Environ. Waste Manag. 2017, 4, 53–63. [Google Scholar]
- Khawaja, B. ‘‘As If You're Inhaling Your Death": The Health Risks of Burning Waste in Lebanon; Human Rights Watch: New York, NY, USA, 2017. [Google Scholar]
- Massoud, M.; El-Fadel, M.; Scrimshaw, M.; Lester, J. Land Use Impact on the Spatial and Seasonal Variation of the Contaminant Loads to Abou Ali River and Its Coastal Zone in North Lebanon; Cornell University Library: Ithaca, NY, USA, 2004. [Google Scholar]
- Linzalone, N.; Bianchi, F. Studying risks of waste landfill sites on human health: Updates and perspectives. Epidemiol. Prev. 2005, 29, 51–53. [Google Scholar]
- Baalbaki, R.; Ahmad, S.H.; Kays, W.; Talhouk, S.N.; Saliba, N.A.; Al-Hindi, M. Citizen science in Lebanon—A case study for groundwater quality monitoring. R. Soc. Open Sci. 2019, 6, 181871. [Google Scholar] [CrossRef] [Green Version]
- Baalbaki, R.; El Hage, R.; Nassar, J.; Gerard, J.; Saliba, N.B.; Zaarour, R.; Saliba, N. Exposure to atmospheric PMs, PAHs, PCDD/Fs and metals near an open air waste burning site in Beirut. Leban. Sci. J. 2016, 17, 91–103. [Google Scholar]
- Karnib, A. Assessing population coverage of safely managed wastewater systems: A case study of Lebanon. J. Water Sanit. Hyg. Dev. 2016, 6, 313–319. [Google Scholar] [CrossRef]
- Doummar, J.; Aoun, M. Occurrence of selected domestic and hospital emerging micropollutants on a rural surface water basin linked to a groundwater karst catchment. Environ. Earth Sci. 2018, 77, 351. [Google Scholar] [CrossRef]
- Apollaro, C.; Fuoco, I.; Brozzo, G.; De Rosa, R. Release and fate of Cr (VI) in the ophiolitic aquifers of Italy: The role of Fe (III) as a potential oxidant of Cr (III) supported by reaction path modelling. Sci. Total Environ. 2019, 660, 1459–1471. [Google Scholar] [CrossRef] [PubMed]
- Critelli, T.; Vespasiano, G.; Apollaro, C.; Muto, F.; Marini, L.; De Rosa, R. Hydrogeochemical study of an ophiolitic aquifer: A case study of Lago (Southern Italy, Calabria). Environ. Earth Sci. 2015, 74, 533–543. [Google Scholar] [CrossRef]
- Singh, K.; Walter, T.; Whitmore, M. Hydrogeochemical changes and watershed degradation induced by hemlock loss in northeastern riparian forests. Work. Watersheds Coast. Syst. Res. Manag. 2019, 56. [Google Scholar]
- Thomas, L. Karst Hydrogeology, Hydrogeochemistry and Processes of Tufa Deposition in Carboniferous Limestone Springs of the Mells Valley, Somerset; Bath Spa University: Somerset, UK, 2007. [Google Scholar]
- Mauser, W.; Klepper, G.; Rice, M.; Schmalzbauer, B.S.; Hackmann, H.; Leemans, R.; Moore, H. Transdisciplinary global change research: The co-creation of knowledge for sustainability. Curr. Opin. Environ. Sustain. 2013, 5, 420–431. [Google Scholar] [CrossRef] [Green Version]
- Clark, W.C.; Van Kerkhoff, L.; Lebel, L.; Gallopin, G.C. Crafting usable knowledge for sustainable development. Proc. Natl. Acad. Sci. USA 2016, 113, 4570–4578. [Google Scholar] [CrossRef] [Green Version]
- Chammas, G.; Kayed, S.; Shami, A.A.; Kays, W.; Citton, M.; Kalot, M.; Marj, A.E.; Fakhr, M.; Yehya, N.A.; Talhouk, S.N. Transdisciplinary interventions for environmental sustainability. Waste Manag. 2020, 107, 159–171. [Google Scholar] [CrossRef]
- Massoud, M.A.; Al-Abady, A.; Jurdi, M.; Nuwayhid, I. The challenges of sustainable access to safe drinking water in rural areas of developing countries: Case of Zawtar El-Charkieh, Southern Lebanon. J. Environ. Health 2010, 72, 24–30. [Google Scholar]
- Khair, K.; Aker, N.; Haddad, F.; Jurdi, M.; Hachach, A. The environmental impacts of humans on groundwater in Lebanon. Water Air Soil Pollut. 1994, 78, 37–49. [Google Scholar] [CrossRef]
- Korfali, S.I.; Davies, B.E. Seasonal variations of trace metal chemical forms in bed sediments of a karstic river in Lebanon: Implications for self-purification. Environ. Geochem. Health 2005, 27, 385–395. [Google Scholar] [CrossRef]
- Jütting, J.; Mc Donnell, I. Mc Donnell I.a; Development Co-operation Report 2017, Overview: What will it take for data to enable development? 2017. Available online: https://www.oecd-ilibrary.org/development/development-co-operation-report-2017/overview-what-will-it-take-for-data-to-enable-development_dcr-2017-6-en;jsessionid=BPDJ3wKaPVQvwIOdKQYYuZyW.ip-10-240-5-164 (accessed on 20 April 2020).
- Bou-Zeid, E.; El-Fadel, M. Climate change and water resources in Lebanon and the Middle East. J. Water Resour. Plan. Manag. 2002, 128, 343–355. [Google Scholar] [CrossRef] [Green Version]
- Arkadan, A.-R.M. Climatic changes in lebanon, predicting uncertain precipitation events—Do climatic cycles exist. In Climatic Changes and Water Resources in the Middle East and North Africa; Springer: Berlin, Germany, 2008; pp. 59–74. [Google Scholar]
- Beydoun, Z.R. The Levantine countries: The geology of Syria and Lebanon (maritime regions). In the Ocean Basins and Margins; Springer: Berlin, Germany, 1977; pp. 319–353. [Google Scholar]
- Kayal, D.B.J.; Issam, K.; Farid, B.; Eric, T.; Levent, E.; Mehmet, M.; Fadi, N.; Wajdi, G.; Rachad, B.; David, A.; et al. Assessment of the Groundwater Resources of Lebanon; UNDP- Lebanon Ministry of Energy and Water: Beirut, Lebanon, 2014; Available online: https://www.lb.undp.org/content/lebanon/en/home/library/environment_energy/assessment-of-groundwater-resources-of-lebanon.html (accessed on 20 April 2020).
- Khadra, W.M.; Stuyfzand, P.J. Separating baseline conditions from anthropogenic impacts: Example of the Damour coastal aquifer (Lebanon). Hydrol. Sci. J. 2014, 59, 1872–1893. [Google Scholar] [CrossRef]
- Khadra, W.M. Hydrogeology of the Damour Upper Sannine-Maameltain aquifer-by Wisam Mahmoud Khadra; Master Thesis, American University of Beirut: Beirut, Lebanon, 2003. [Google Scholar]
- Awad, H.M. Geomorphology, stratigraphy and hydrogeology of the Doha-Damour area and hinterland. Master Thesis, American University of Beirut, Beirut, Lebanon, 1983. [Google Scholar]
- Khadra, W.M.; Stuyfzand, P.J.; van Breukelen, B.M. Hydrochemical effects of saltwater intrusion in a limestone and dolomitic limestone aquifer in Lebanon. Appl. Geochem. 2017, 79, 36–51. [Google Scholar] [CrossRef]
- Masciopinto, C. Management of aquifer recharge in Lebanon by removing seawater intrusion from coastal aquifers. J. Environ. Manag. 2013, 130, 306–312. [Google Scholar] [CrossRef]
- Stuyfzand, P.J. Hydrochemistry and Hydrology of the Coastal Dune Area of the Western Netherlands. Ph.D. Thesis, Vrije Universiteit Amsterdam, Amsterdam, The Netherlands, 25 May 1993. [Google Scholar]
- Ejlertsson, J.; Karlsson, A.; Lagerkvist, A.; Hjertberg, T.; Svensson, B.H. Effects of co-disposal of wastes containing organic pollutants with municipal solid waste—a landfill simulation reactor study. Adv. Environ. Res. 2003, 7, 949–960. [Google Scholar] [CrossRef]
- Durmusoglu, E.; Taspinar, F.; Karademir, A. Health risk assessment of BTEX emissions in the landfill environment. J. Hazard. Mater. 2010, 176, 870–877. [Google Scholar] [CrossRef]
- Grimvall, A.; Asplund, G.; Borén, H.; Jonsson, S. Origin of adsorbable organic halogens (AOX) in aquatic environments. In Organic Micropollutants in the Aquatic Environment; Springer: Berlin, Germany, 1991; pp. 458–464. [Google Scholar]
- Shomar, B. Sources of adsorbable organic halogens (AOX) in sludge of Gaza. Chemosphere 2007, 69, 1130–1135. [Google Scholar] [CrossRef]
- Müller, G. Sense or no-sense of the sum parameter for water soluble “adsorbable organic halogens”(AOX) and “absorbed organic halogens”(AOX-S18) for the assessment of organohalogens in sludges and sediments. Chemosphere 2003, 52, 371–379. [Google Scholar] [CrossRef]
- Lebanese Ministry of Health (MOH). Water Decree 1039, Standard 161:1999 (Drinking Water) & 162:1999 (Bottled Water); Official Gazette: Beirut, Lebanon, 1999; Available online: https://www.informea.org/en/legislation/decree-no-1039-adopting-standardizations-no-1611999-potable-water-and-no-1621999 (accessed on 28 April 2020).
- Edition, T. Guidelines for drinking-water quality. WHO Chron. 2008, 1, 334–415. [Google Scholar]
- Muzenda, F.; Masocha, M.; Misi, S.N. Groundwater quality assessment using a water quality index and GIS: A case of Ushewokunze Settlement, Harare, Zimbabwe. Phys. Chem. Earth Parts A/B/C 2019, 112, 134–140. [Google Scholar] [CrossRef]
- Soltan, M. Evaluation of ground water quality in dakhla oasis (Egyptian Western Desert). Environ. Monit. Assess. 1999, 57, 157–168. [Google Scholar] [CrossRef]
- Kopp, S. Using ArcGIS Spatial Analyst: GIS by ESRI; Environmental Systems Research Institute: Redlands, CA, USA, 2002. [Google Scholar]
- Wickham, H. ggplot2. Wiley Interdiscip. Rev. Comput. Stat. 2011, 3, 180–185. [Google Scholar] [CrossRef]
- Halwani, D.A.; Jurdi, M.; Salem, F.K.A.; Jaffa, M.A.; Amacha, N.; Habib, R.R.; Dhaini, H.R. Cadmium health risk assessment and anthropogenic sources of pollution in mount-lebanon springs. Expo. Health 2019. [Google Scholar] [CrossRef]
- Daou, C.; Salloum, M.; Legube, B.; Kassouf, A.; Ouaini, N. Characterization of spatial and temporal patterns in surface water quality: A case study of four major Lebanese rivers. Environ. Monit. Assess. 2018, 190, 485. [Google Scholar] [CrossRef] [PubMed]
- Christensen, T.H.; Kjeldsen, P.; Bjerg, P.L.; Jensen, D.L.; Christensen, J.B.; Baun, A.; Albrechtsen, H.-J.; Heron, G. Biogeochemistry of landfill leachate plumes. Appl. Geochem. 2001, 16, 659–718. [Google Scholar] [CrossRef]
- Lehmann, E.C. Landfill Research Focus; Nova Publishers: Hauppauge, NY, USA, 2007. [Google Scholar]
- Arnade, L.J. Seasonal correlation of well contamination and septic tank distance. Groundwater 1999, 37, 920–923. [Google Scholar] [CrossRef]
- Doyle, M.P.; Erickson, M.C. Closing the door on the fecal coliform assay. Microbe 2006, 1, 162–163. [Google Scholar] [CrossRef] [Green Version]
- Böhlke, J.-K. Groundwater recharge and agricultural contamination. Hydrogeol. J. 2002, 10, 153–179. [Google Scholar] [CrossRef]
- Kelly, W.R.; Panno, S.V.; Hackley, K.C.; Hwang, H.-H.; Martinsek, A.T.; Markus, M. Using chloride and other ions to trace sewage and road salt in the Illinois Waterway. Appl. Geochem. 2010, 25, 661–673. [Google Scholar] [CrossRef]
- Alcalá, F.J.; Custodio, E. Use of the Cl/Br ratio as tracer to identifity the origin of salinity in some Spanish coastal aquifers. In Proceedings of the 18th SWIM, Cartagena, Spain, 31 May–3 June 2004. [Google Scholar]
- Cartwright, I.; Weaver, T.R.; Fifield, L.K. Cl/Br ratios and environmental isotopes as indicators of recharge variability and groundwater flow: An example from the southeast Murray Basin, Australia. Chem. Geol. 2006, 231, 38–56. [Google Scholar] [CrossRef]
- Kurata, Y.; Ono, Y.; Ono, Y. Occurrence of phenols in leachates from municipal solid waste landfill sites in Japan. J. Mater. Cycles Waste Manag. 2008, 10, 144–152. [Google Scholar] [CrossRef]
- Anku, W.W.; Mamo, M.A.; Govender, P.P. Phenolic compounds in water: Sources, reactivity, toxicity and treatment methods. Phenolic Compd. Nat. Sour. Importance Appl. 2017, 420–443. [Google Scholar] [CrossRef] [Green Version]
- Soto-Hernández, M.; Tenango, M.P.; García-Mateos, R. Phenolic Compounds: Natural Sources, Importance and Applications; BoD–Books on Demand: Norderstedt, Germany, 2017. [Google Scholar]
- Faour, G. Topology of landuse at 1:20,000 Scale. In CNRS, N.C. f. R. S., Beirut, Lebanon, Ed. 2011. Available online: https://www.researchgate.net/publication/267625027_La_carte_de_l’occupation_du_sol_de_Liban/stats (accessed on 28 April 2020).
- Hurley, P.J.; Physick, W.L.; Luhar, A.K. TAPM: A practical approach to prognostic meteorological and air pollution modelling. Environ. Model. Softw. 2005, 20, 737–752. [Google Scholar] [CrossRef]
- Zurawsky, M.A.; Robertson, W.D.; Ptacek, C.J.; Schiff, S.L. Geochemical stability of phosphorus solids below septic system infiltration beds. J. Contam. Hydrol. 2004, 73, 129–143. [Google Scholar] [CrossRef] [PubMed]


| Analysis Group | Analysis | Unit | Sample R1 | MOH-MCL- Surface Water |
|---|---|---|---|---|
| Field data | Conductivity | uS/cm | 1576 | - |
| pH | 7.4 | 6–9 | ||
| Temperature | °C | 20 | ||
| General chemical | Ammonia | mg/L | 5.8 | 10 |
| Fluoride | mg/L | 0.45 | 25 | |
| Nitrate (NO3) | mg/L | 117.3 | 90 | |
| Orthophosphates | mg/L | 1.51 | 5 | |
| Phosphorous | mg/L | 0.08 | 16 | |
| Sulfides | mg/L | 0.185 | <0.005 | |
| Sulfates | mg/L | 48.5 | 1000 | |
| Other chemical | Total organic carbon (TOC) | mg/L | 100 | 75 |
| Total suspended solids | mg/L | 67.5 | 200 | |
| Metals | Aluminum | ug/L | 3 | 10,000 |
| Barium | ug/L | 8 | 2000 | |
| Cobalt | ug/L | 30 | 500 | |
| Manganese | ug/L | 1680 | 1000 | |
| Microbiology | E. coli | >10,000 | 2000 | |
| Fecal coliforms | CFU/250 mL | >10,000 | 2000 | |
| Other bacteria | P/A | Present | - | |
| Salmonellae | P/A | Present | Absent |
| Analysis Group | Analysis | Unit | N of Tests—Wells | Average Wells +/− 95% CI | N of Tests—Springs | Average Springs +/- 95% CI | Natural Background | EPA/WHO MCL | MOPH MCL |
|---|---|---|---|---|---|---|---|---|---|
| Field data | Conductivity | uS/cm | 3 | 604.7 +/− 122.7 | 7 | 619.3 +/− 50.5 | 519 | - | 1500.00 |
| pH | - | 3 | 7.4 +/− 0.3 | 7 | 7.6 +/− 0.2 | 7.2 | 6–8 | 6–8 | |
| General chemical | Temperature | °C | 2 | 17.4 +/− 3.8 | 6 | 16.7 +/- 1.9 | - | - | - |
| Chlorides | mg/L | 3 | 17.4 +/− 10.6 | 7 | 30.6 +/− 7.4 | 24.1 | 250 | 200 | |
| Nitrate (NO3) | mg/L | 3 | 1.6 +/− 3 | 7 | 16.9 +/− 12.9 | 1.2 | 45 | 45 | |
| Phosphorous | mg/L | 3 | 0 +/− 0 | 7 | 0 +/− 0 | 0.1 | - | - | |
| Orthophosphates | mg/L | 1 | NA | 6 | 0 +/− 0.1 | - | 0.03 | 1 | |
| Diphosphorus Pentoxide | mg/L | 2 | 0 +/− 0 | 6 | 0 +/− 0.1 | - | - | - | |
| Sulfates | mg/L | 1 | 0 | - | - | 12 | 250 | 250 | |
| Metals | Barium | ug/L | 3 | 13.3 +/− 8.2 | 7 | 6.4 +/− 2.4 | 8.4 | 2000 | 2000 |
| Chromium | ug/L | 3 | 0.2 +/− 0.3 | 7 | 0 +/− 0.1 | 0.6 | 100 | ||
| Selenium | ug/L | 3 | 0.2 +/− 0.3 | 7 | 0 +/− 0.1 | <0.05 | 50 | 10 | |
| Zinc | ug/L | 3 | 103.3 +/− 113.3 | 7 | 0 +/− 0.1 | 4.1 | 5000 | 5000 | |
| Petroleum hydrocarbons | TPH (Total) | mg/L | 1 | NA | 6 | 0.7 +/− 1.4 | - | - | - |
| Microbiology | E. coli | P/A | 3 | Present (1/3) | 7 | Present (5/7) | - | A | A |
| Fecal coliforms | CFU/250 mL | 3 | 5.7 +/− 11.1 | 7 | 27.7 +/− 25.5 | - | <1 cfu | <1 cfu | |
| Total coliforms | CFU/100 mL | 3 | 50.7 +/- 48.6 | 7 | 67 +/− 31 | - | <1 CFU | <1 CFU | |
| Other | P/A | 3 | Present (3/3) | 7 | Present (7/7) | - | - | - |
| Subgroup | Analysis | Unit | N of Tests—Wells | Average Wells +/− 95% CI | Natural Background | EPA/WHO MCL | MOPH MCL |
|---|---|---|---|---|---|---|---|
| Field data | Conductivity | uS/cm | 11 | 1189 +/− 616 | 757 | - | 1500.00 |
| pH | 11 | 7.4 +/− 0.1 | 7.1 | 6-8 | 6-8 | ||
| Temperature | °C | 9 | 20.3 +/− 2.4 | - | - | ||
| General chemical | Bromide | mg/L | 6 | 0.4 +/− 0.7 | 0.3 | - | - |
| Chlorides | mg/L | 11 | 115.5 +/− 127.9 | 82.1 | 250 | 200 | |
| Nitrate (NO3) | mg/L | 11 | 8.3 +/− 3.6 | 5.5 | 45 | 45 | |
| Nitrite (NO2) | mg/L | 4 | 0 +/− 0 | - | 1 | 0.05 | |
| Sulfates | mg/L | 8 | 51.4 +/− 34 | 71.9 | 250 | 250 | |
| Metals | Arsenic | ug/L | 11 | 0.1 +/− 0.2 | 0 | 50 | 50 |
| Boron | ug/L | 6 | 16.7 +/- 32.7 | 42 | - | - | |
| Barium | ug/L | 11 | 24.2 +/− 14.4 | 51.1 | 200 | 200 | |
| Chromium | ug/L | 11 | 0.4 +/− 0.5 | 0.6 | 100 | 100 | |
| Copper | ug/L | 10 | 0.8 +/- 1.6 | 0.9 | 1300 | 1000 | |
| Mercury | ug/L | 11 | 0 +/− 0 | 0 | 2 | 5 | |
| Molybdenum | ug/L | 9 | 0.4 +/− 0.8 | 0.2 | - | - | |
| Nickel | ug/L | 11 | 0.5 +/- 1.1 | 0.2 | 20 | 10 | |
| Zinc | ug/L | 11 | 228.7 +/− 214.9 | 3.3 | 5000 | 5000 | |
| Miscellaneous organic compounds | Biphenyl | ug/L | 7 | 0 +/− 0 | - | - | |
| Petroleum hydrocarbons | TPH (total) | ug/L | 7 | 16.3 +/− 12.6 | - | - | |
| Phenols | Phenol | ug/L | 7 | 64.3 +/− 116.2 | - | - | |
| Volatile halogenated hydrocarbons | Trichloromethane | ug/L | 7 | 0.2 +/− 0.2 | 100 | 100 | |
| Microbiology | E. coli | P/A | 5 | Present (2/5) | A | A | |
| Fecal coliforms | CFU/250 mL | 5 | 7.2 +/− 9.5 | <1 CFU | <1 CFU | ||
| Total coliforms | CFU/100 mL | 5 | 41.4 +/− 46.94 | <1 CFU | <1 CFU | ||
| Other (present or absent) | P/A | 5 | Present (5/5) | - | - |
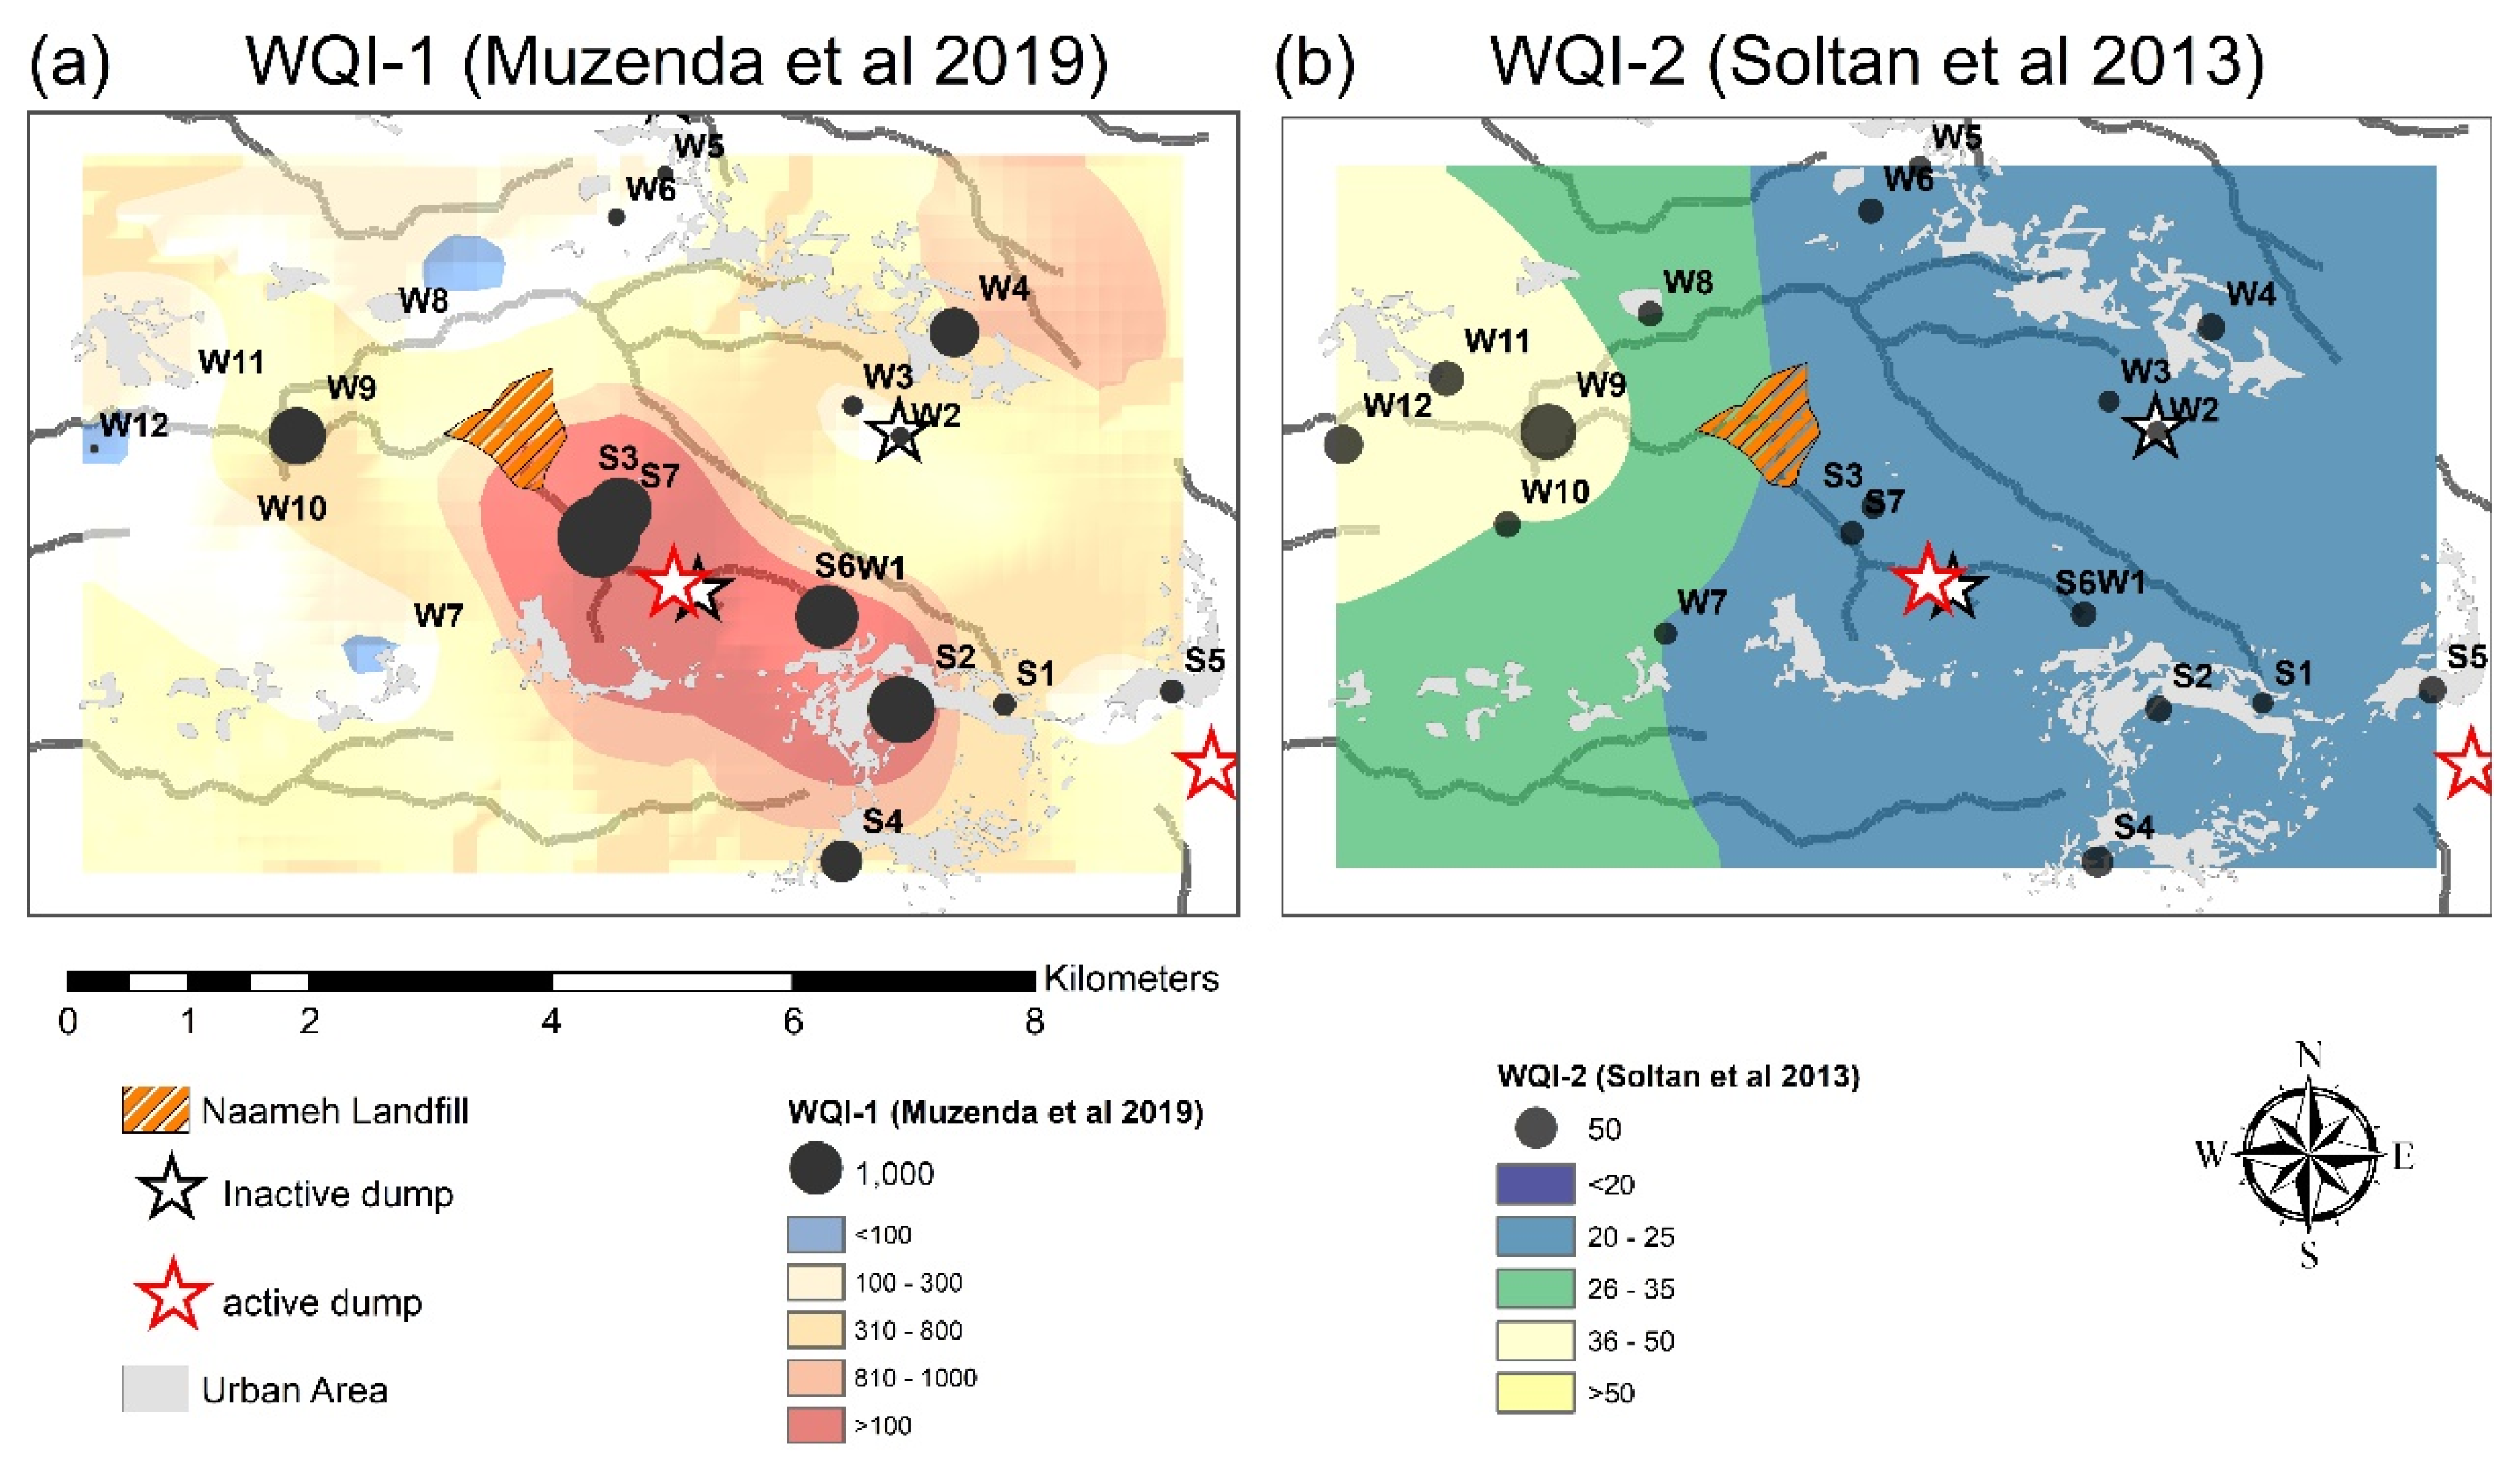
| Hydro-Geological Setting | Water Source | WQI-1 1 | WQI-2 2 |
|---|---|---|---|
| Springs C1-C3 | S1 | 177 | 16 |
| S2 | 1598 | 23 | |
| S3 | 1455 | 18 | |
| S4 | 617 | 30 | |
| S5 | 212 | 24 | |
| S6 | 1382 | 20 | |
| S7 | 2404 | 18 | |
| Average Springs C1-C3 | 1121 | 21 | |
| Wells C1-C3 | W1 | 1066 | 19 |
| W2 | 129 | 16 | |
| W3 | 136 | 15 | |
| Average Wells C1-C3 | 444 | 17 | |
| Wells C4-C5 | W4 | 874 | 24 |
| W5 | 102 | 17 | |
| W6 | 114 | 20 | |
| W7 | - | 17 | |
| W8 | - | 21 | |
| W9 | 1145 | 81 | |
| W10 | - | 22 | |
| W11 | 1 | 36 | |
| W12 | 28 | 44 | |
| Average Wells C4-C5 | 377 | 31 |
© 2020 by the authors. Licensee MDPI, Basel, Switzerland. This article is an open access article distributed under the terms and conditions of the Creative Commons Attribution (CC BY) license (http://creativecommons.org/licenses/by/4.0/).
Share and Cite
Citton, M.; Croonenberg, S.; Shami, A.E.; Chammas, G.; Kayed, S.; Aoun Saliba, N.; Abou Najm, M.; Tamim, H.; Zeineldine, S.; Makki, M.; et al. Multisource Groundwater Contamination under Data Scarcity: The Case Study of Six Municipalities in the Proximity of the Naameh Landfill, Lebanon. Water 2020, 12, 1358. https://doi.org/10.3390/w12051358
Citton M, Croonenberg S, Shami AE, Chammas G, Kayed S, Aoun Saliba N, Abou Najm M, Tamim H, Zeineldine S, Makki M, et al. Multisource Groundwater Contamination under Data Scarcity: The Case Study of Six Municipalities in the Proximity of the Naameh Landfill, Lebanon. Water. 2020; 12(5):1358. https://doi.org/10.3390/w12051358
Chicago/Turabian StyleCitton, Michele, Sofie Croonenberg, Anwar El Shami, Ghina Chammas, Sammy Kayed, Najat Aoun Saliba, Majdi Abou Najm, Hani Tamim, Salah Zeineldine, Maha Makki, and et al. 2020. "Multisource Groundwater Contamination under Data Scarcity: The Case Study of Six Municipalities in the Proximity of the Naameh Landfill, Lebanon" Water 12, no. 5: 1358. https://doi.org/10.3390/w12051358