Sand Content Prediction in Urban WWTPs Using MARS
by
 ,
,
Vanesa Mateo Pérez
, 
José Manuel Mesa Fernández
*,
Francisco Ortega Fernández
and
Henar Morán Palacios
Project Engineering Area, University of Oviedo, Independencia, nº 13, 33012 Oviedo, Asturias, Spain
*
Author to whom correspondence should be addressed.
Water 2020, 12(5), 1357; https://doi.org/10.3390/w12051357
Submission received: 17 April 2020
/
Revised: 26 April 2020
/
Accepted: 8 May 2020
/
Published: 11 May 2020
(This article belongs to the Special Issue Urban Wastewater Treatment and Sustainable Drainage Systems)
Abstract
:The pre-treatment stage of wastewater treatment plants (WWTP), where most of the larger waste, including sand and fat, is removed, is of great importance for the performance and durability of these plants. This work develops a model that predicts the sand content that reaches the plant. For this purpose, data were collected from one operation year of the Villapérez Wastewater Treatment Plant located in the northeast of the city of Oviedo (Asturias, Spain) and the MARS (Multivariate Adaptive Regression Splines) method was used for modelling. The accuracy of the MARS model developed using the determination coefficient is R2 = 0.74 for training data and R2 = 0.70 in validation data. These results indicate that it is possible to predict trend changes in sand production as a function of input variables changes such as flow rate, pH, ammonia, etc. This will prevent the plant from possible operational problems, as actions could be taken, such as starting up more pre-treatment lines or emptying the containers, so that the arrival of the sand can be assumed without any problem. In this way, the possibility of letting sand contents over the established limits pass that could affect the following processes of the treatment plant is avoided.
1. Introduction
General urban wastewater contains various components such as suspended solids, organic matter, oils and fat, but usually no hazardous substances. This composition is a consequence of the fact that most collectors are usually unitary, that is, they not only collect domestic water but also all kinds of waste from the streets dragged by rainwater, irrigation or municipal cleaning.
The initial pre-treatment phase is of great importance for the proper functioning of WWTP (wastewater treatment plants) [1]; however, as indicated by several authors [2,3], the next steps of these facilities have been studied further given their great impact on water recovery. Parameters such as pH, chemical oxygen demand (COD), biochemical oxygen demand (BOD) and suspended solids (SS) in later stages have been the subject of numerous studies [4,5,6,7]. In contrast, the pretreatment stage has been studied much less, and efficient operation is considered to primarily depend on a good initial plant design and proper operations management.
In this pre-treatment stage, several operations are carried out such as roughing, sand removal and degreasing. The purpose of the pretreatment is to remove suspended solids in the water by mechanical processes [8]. The usual pretreatment stage in WWTP begins with automatic bar screens where larger wastes, such as rags and plastics, are removed. Then, depending on the WWTP design, gross solids are also collected by mean of different types of screens as, for example, rotor screens or statics screens. Finally, aerated grit chambers are generally used for the sand removal process. Included in this “sand” are various inorganic and organic components [9].
General practice [8] indicates that sand trap systems recover 95% of the sand above 200 microns and therefore eliminate most of the possible operational problems of the facilities [10]. However, on rainy days, with a higher input flowrate and an increase in the amount of sand, its passage to the following treatment stages increases, generating problems such as abrasion of the equipment of the sludge line or affecting the performance of the biological processes [2]. An accurate prediction of the sand content in the input flow of wastewater treatment plants would allow different preventive actions to be taken, such as commissioning more pre-treatment lines, emptying the containers beforehand and ultimately prepare the treatment plant for the elimination of this sand during the pre-treatment. Besides, this will reduce energy consumption, since it is not necessary to transport this sand to other stages of the treatment plant, and increase the service life of the electromechanical equipment, especially the pumps.
Therefore, the aim of this work is to predict the sand content in the WWTP inlet flow to anticipate the most convenient operational decisions and improve the efficiency of the pretreatment facilities. In order to achieve this prediction will be used a method based on data called MARS [11]. This technique is a novelty in this area of study but has been used successfully in many other applications as described in the next section.
2. Materials and Methods
2.1. Case Study
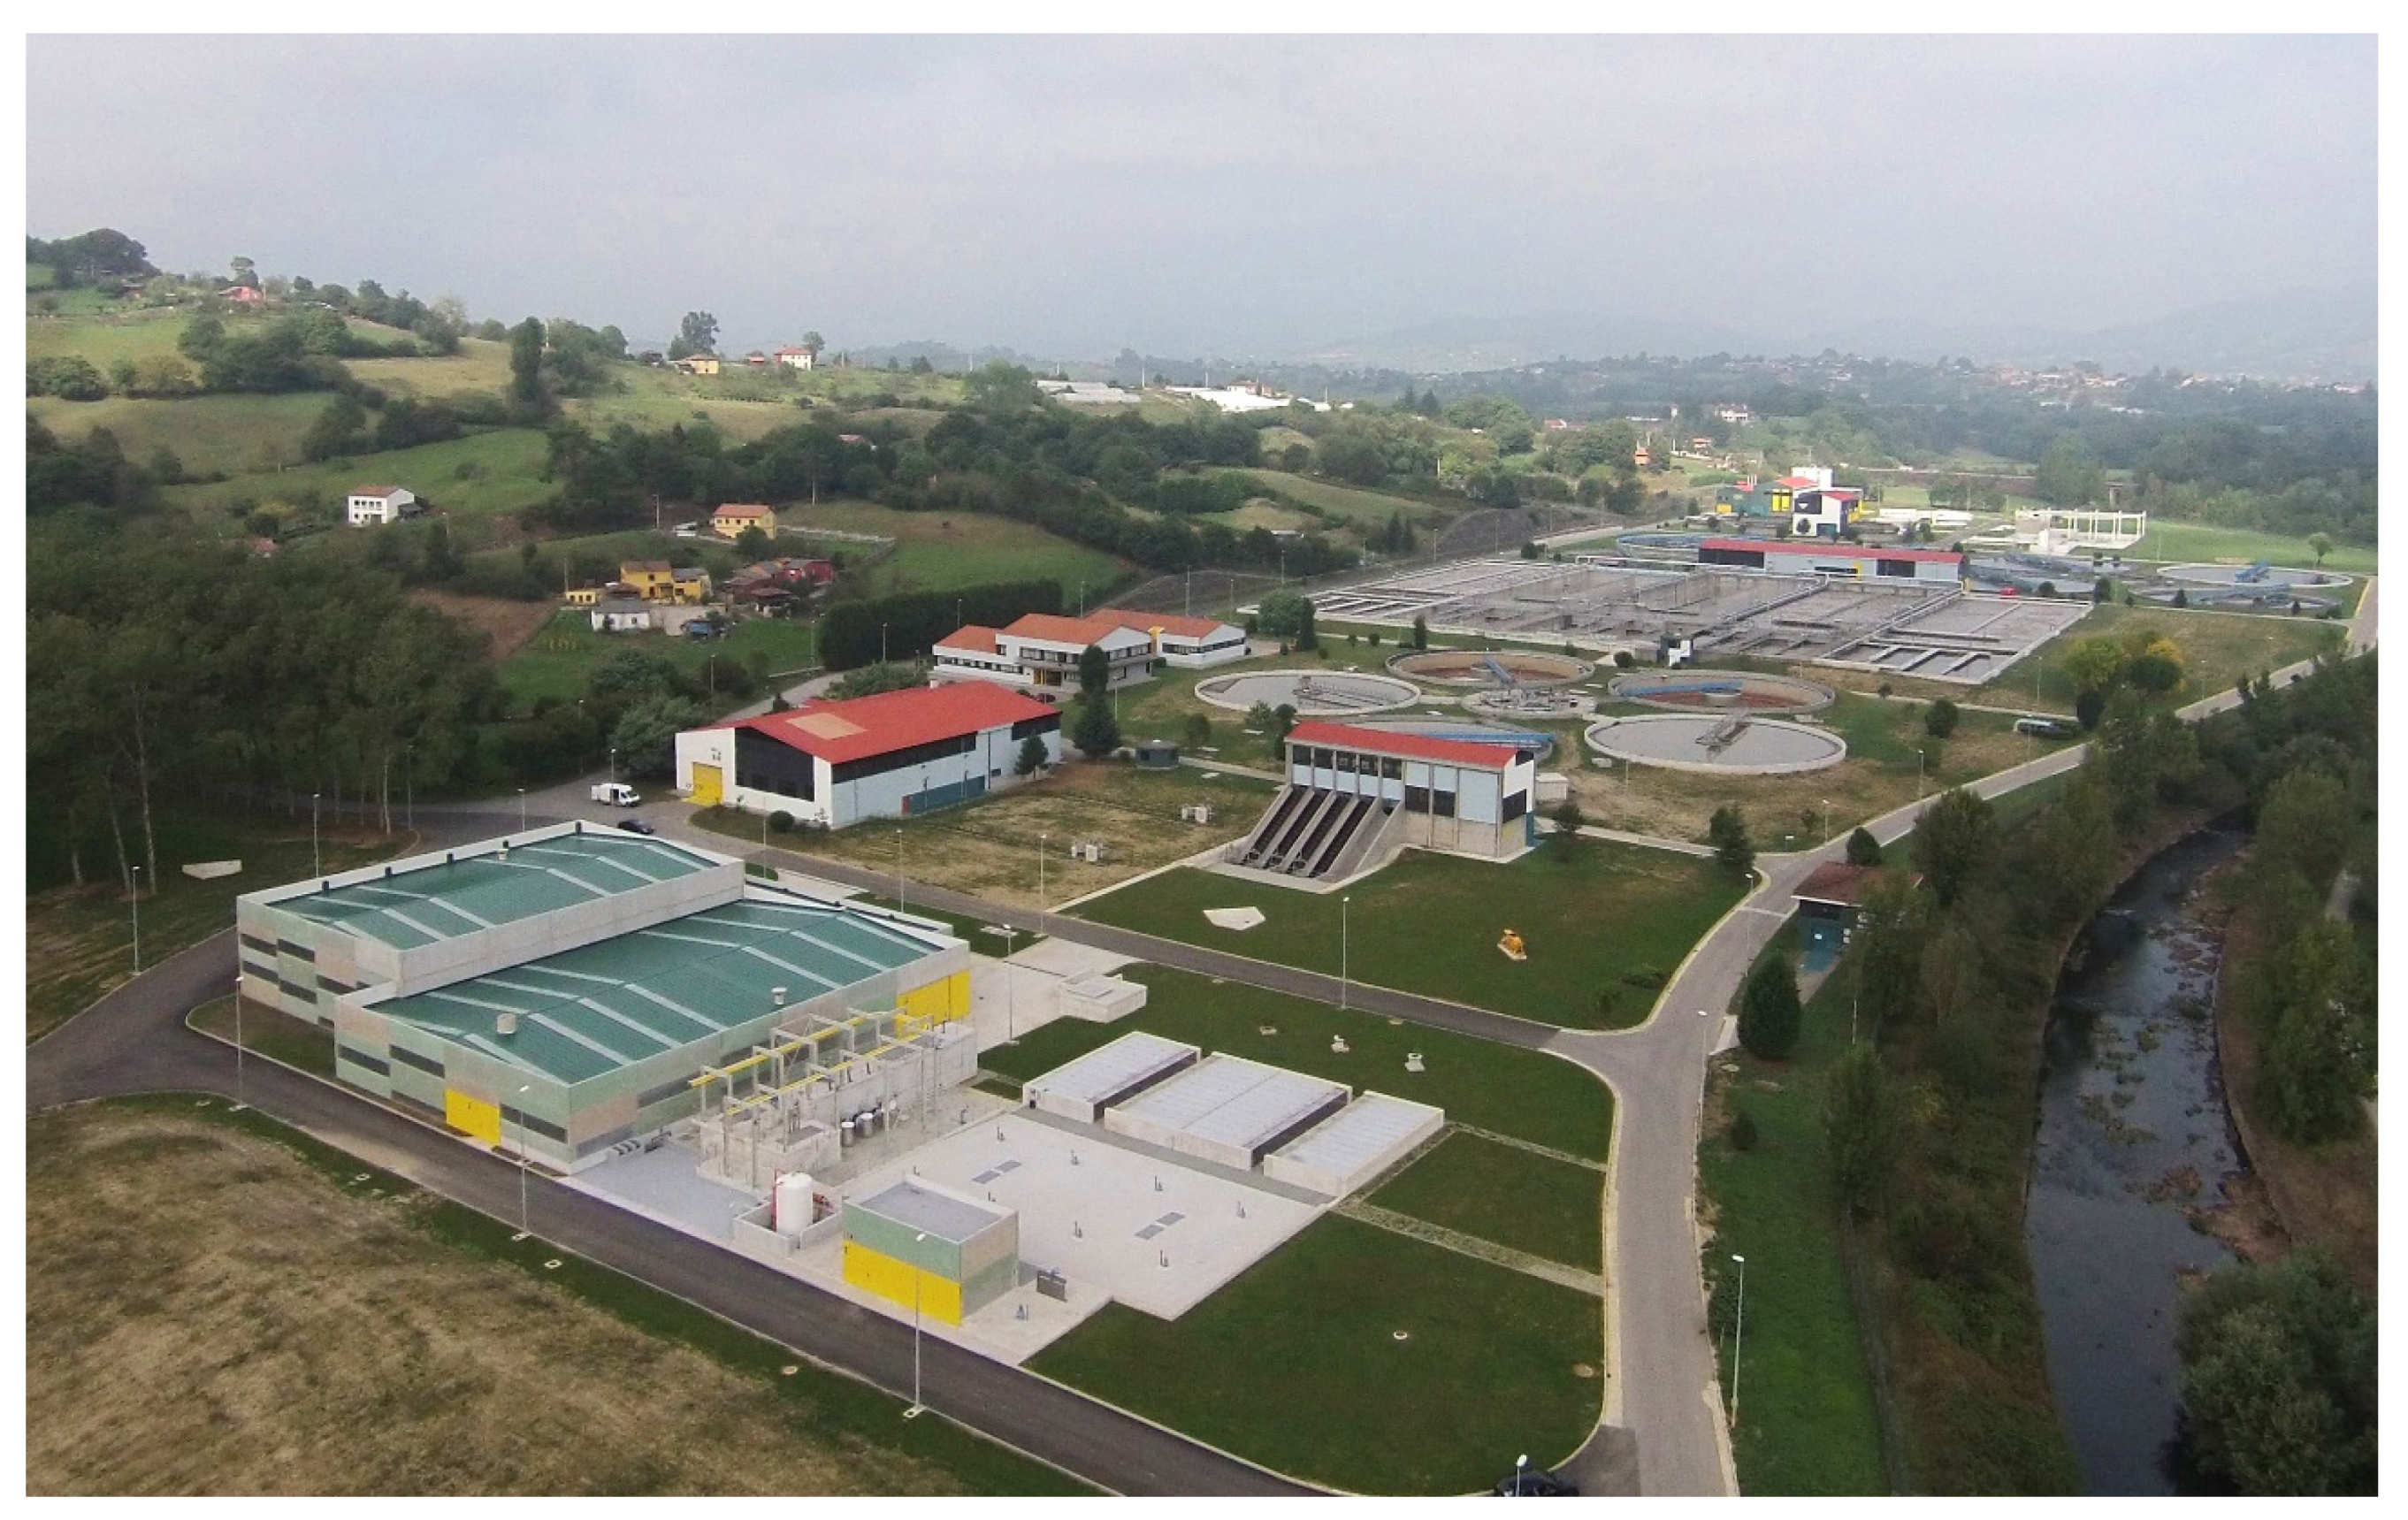
The Villapérez Wastewater Treatment Plant is located in the northeast of the city of Oviedo (Asturias, Spain) covers an area of nearly 21 hectares (Figure 1). It provides service to a population of approximately 723,000 inhabitants equivalent. The network of collectors feeding the treatment plant is unitary. The process line of this WWTP includes pre-treatment, storm treatment, primary decantation, biological treatment, secondary decantation and tertiary treatment of wastewater.
The pre-treatment has the capacity to treat an inflow of 8.5 m3/s and starts with two thick wells, equipped with a 500-L clamshell bucket. The plant then has four roughing channels, each of which includes an automatic cleaning screen with a 60 mm clearance and a self-cleaning fines screen with a 3 mm clearance and an inclination of 50°. After the roughing stage, water arrives at the raw water fat and sand separation facilities, which consist of 5 rectangular sand traps with a unit useful volume of 449.8 m3. These sand removal units guarantee the elimination of particles of size equal to or greater than 0.2 millimeters. Air is injected into the grit removal channel by means of coarse bubble diffusers in the first third and submerged aerators in the remaining two thirds, which ensure a rotating flow and the floating of the fat. This system aims to break up the emulsion of the fat in the water and the separation of the floating particles, as well as helping to decant and clean the sand.
The main design parameters of the treatment plant are included in Table 1.
2.2. Data
All data used in this work were collected in the period from 1 March 2017 to 6 March 2018 and come from different sources:
- Data related to wastewater were obtained through the SCADA software (Supervisory Control and Data Acquisition) of the WWTP. This system registers every 9 min 226 parameters from measuring equipment and sensors distributed all over the treatment plant. From this set of data, the data associated to the measurement of input parameters in the raw water during the pre-treatment stage were used. The parameters measured in the raw water are the input flow rate, pH, raw water temperature, conductivity and ammonia. The data associated with these variables are identified by the time and date of the data measurement.
- Sand data were collected from the container removal delivery notes, which contain the actual data of the waste total weight inside each container. The number of containers in the study period was 187. Their filling time was used as time intervals to group the data of the SCADA system.
- Climate data comes from the Spanish State Agency for Meteorology website (Agencia Estatal de Meteorología, Aemet) and the pluviometry data (instantaneous and accumulated rainfall) is obtained from those recorded by the plant’s own weather station. All of them are also grouped considering the intervals in which the containers are filled. From these data, a new calculated variable from the instantaneous precipitation is also created, corresponding to the number of previous days without rain.
The obtained data set (187 cases) was divided into two groups. Eighty percent of the data were used for training the MARS (Multivariate Adaptive Regression Splines) model and the remaining 20% were kept for validating the model. This method was selected over other data-based techniques for its ability to identify non-linear relationships in the data, for being easier to understand the importance of input variables, and for the relatively lower computational cost.
Statistical data for the variables initially considered in the study are presented in Table 2. As indicated above, the reference is the time interval (Time) from when an empty container is placed to when it is removed. When each container is removed, it is weighed, and the data is recorded on the corresponding delivery note. The data corresponding to each of these periods was summarized by calculating for each variable its minimum, mean and maximum value, as shown in Table 2.
2.3. Methods
Since Jerome H. Friedman presented the non-parametric regression method known as MARS (Multivariate adaptive regression splines) it has been used in many applications in various fields [11]. Among its advantages are its ability to identify non-linear relationships in the data, to generate simple and more easily interpreted models from a large number of input variables, to show their relative importance, and to be computationally efficient compared to other techniques [12,13,14]. In the field of WWTPs, it has recently been used in different studies to predict the biochemical and chemical oxygen demand, the nitrogen, phosphorus and total suspended solids concentration [7,15], the activated sludge sedimentation capacity [15] or cost reduction [16].
The MARS model of a dependent variable, with n base functions or terms can be expressed as [11]:
where is the dependent variable predicted by the MARS model, c0 is a constant, Bi are the n basis functions and ci are the coefficients of each one of them. The basis functions Bi look like or where t is a constant called node or cut-off point for the different variables. These space partition points, as well as the model parameters, are obtained from the analyzed data using a two-step forward/backward algorithm. First, using the forward stepwise algorithm, an over-fitted model with a large number of basis functions is generated and then, using the backward stepwise algorithm, the nodes that contribute the least to the overall fit are removed. The space is divided into regions; in each region a linear basis function is adjusted. The final model is a combination of all basis functions generated; whose number indicates the complexity of the model. Greater detail of the MARS method compared to other prediction techniques such as artificial neural networks (ANN) has been well described by Nalcaci et al. [13].
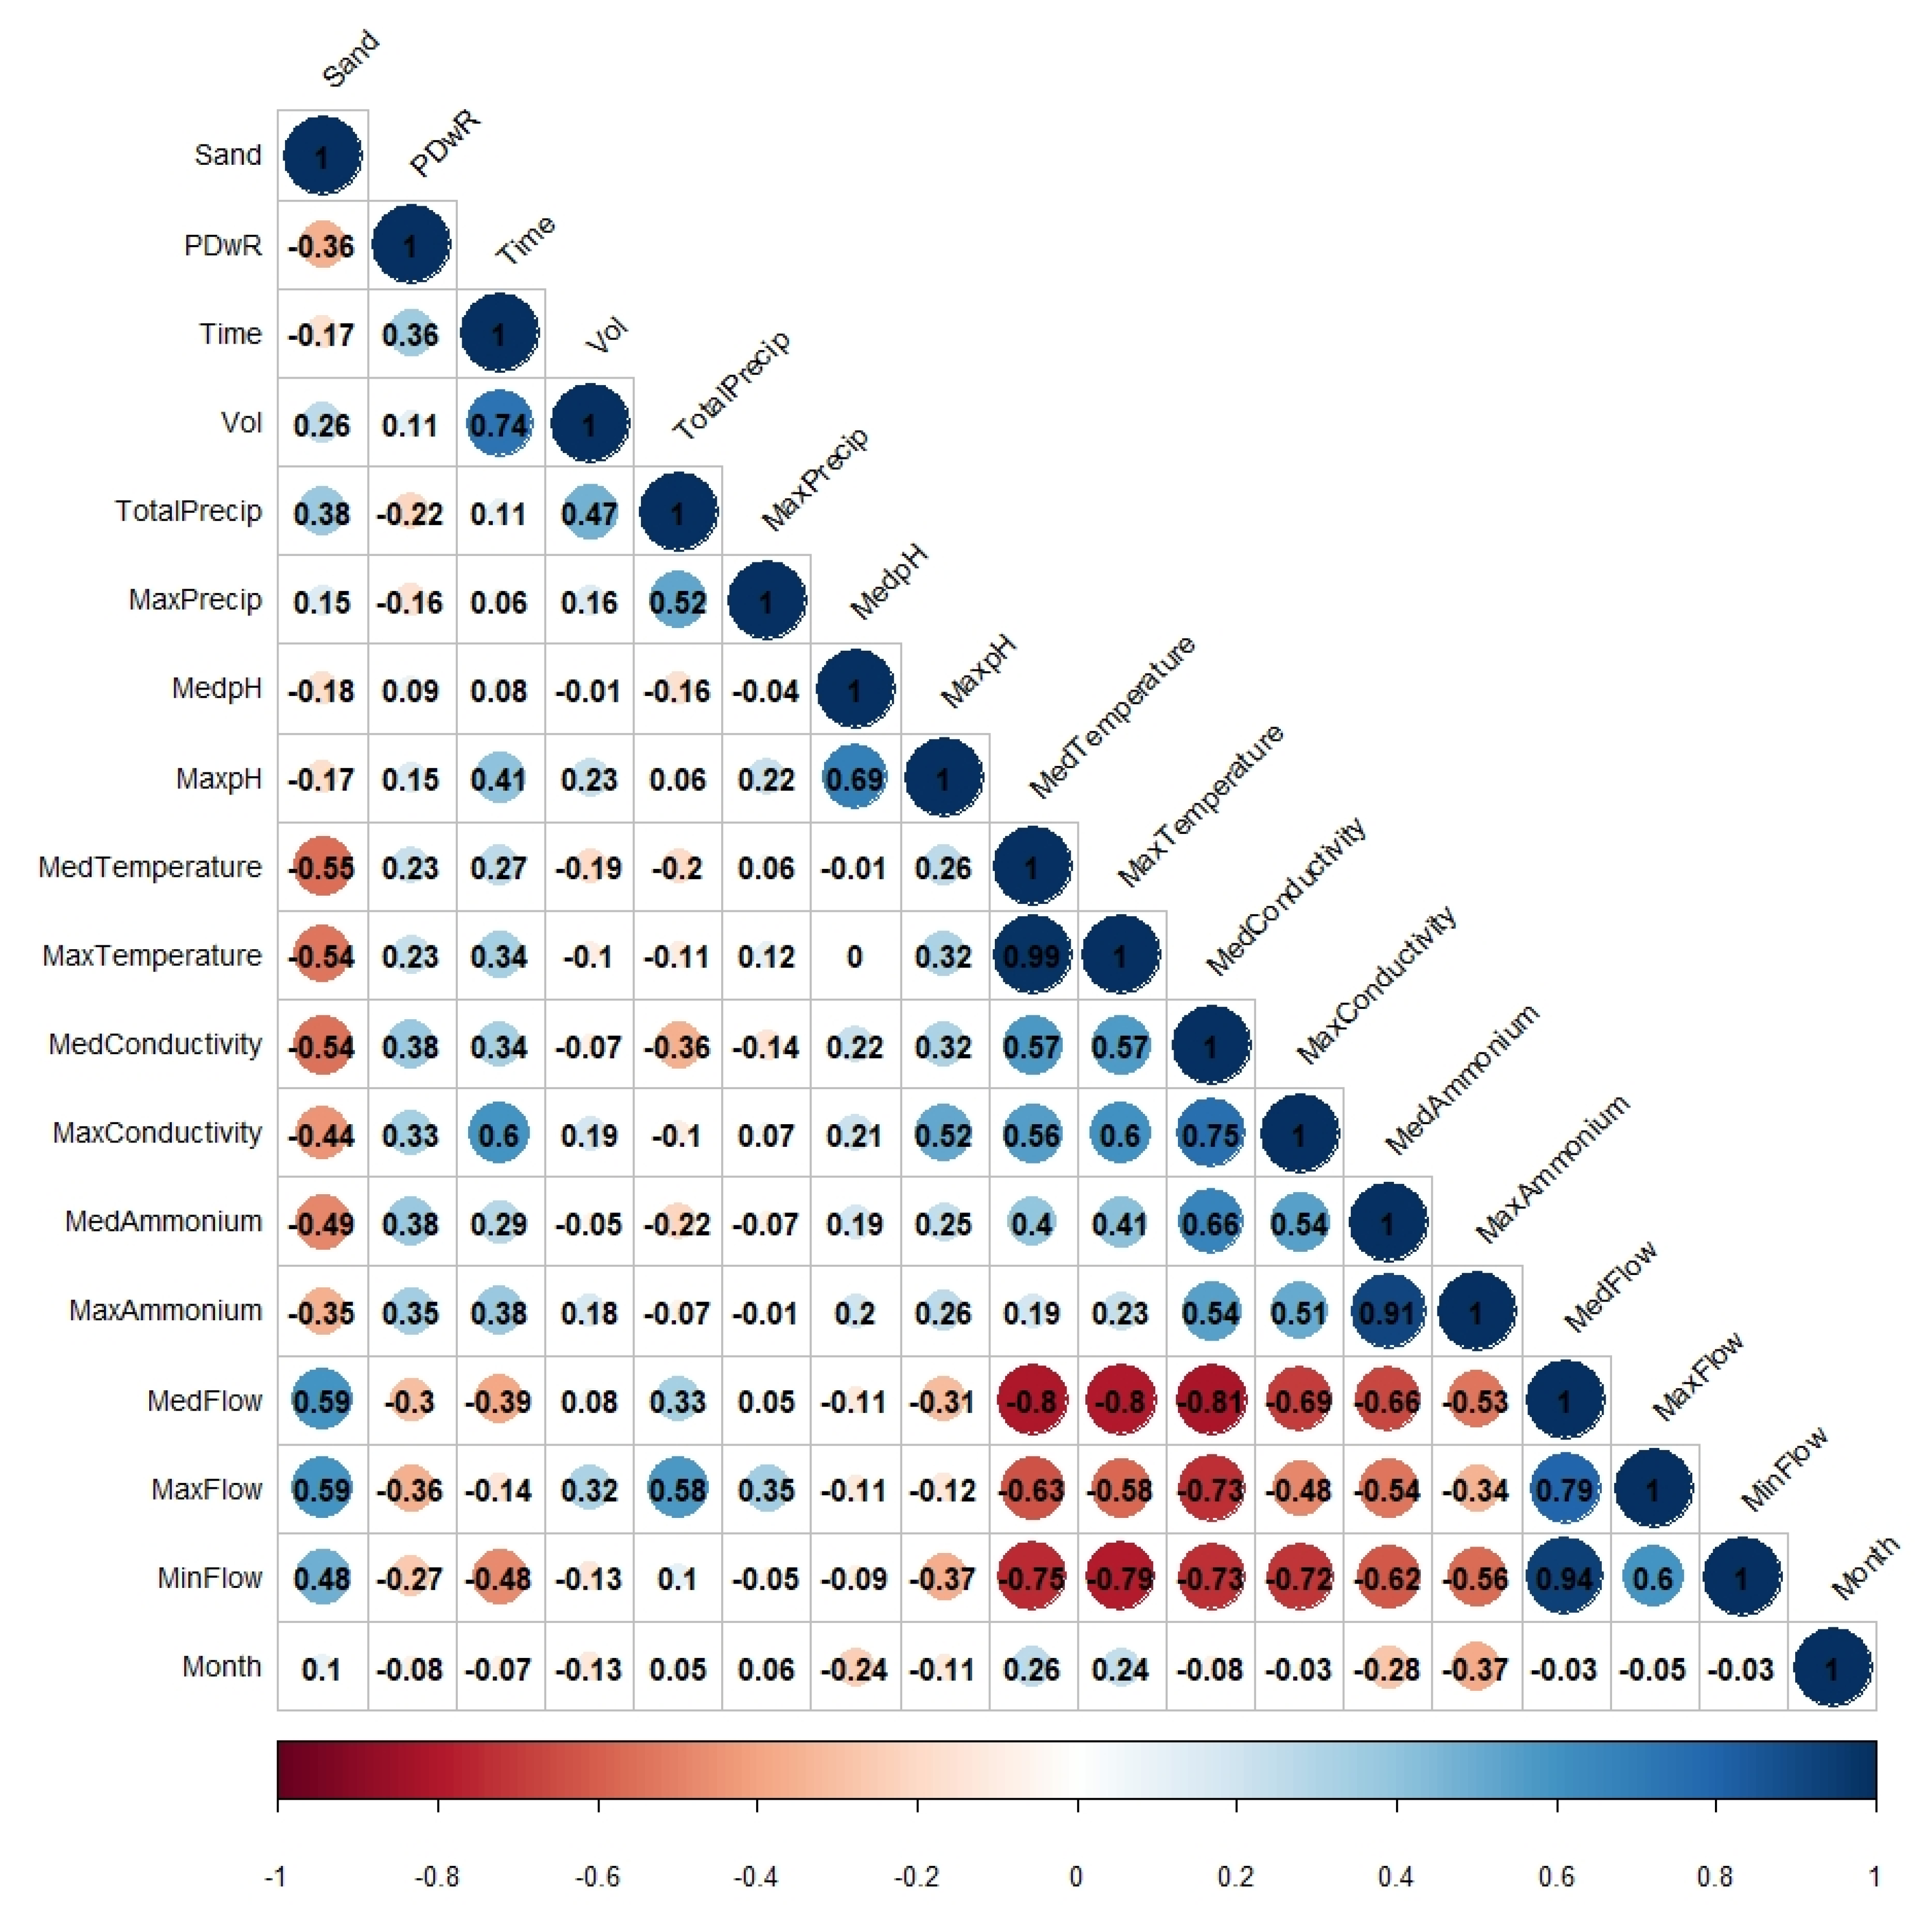
Through this process, the MARS method makes an automatic selection of input variables, that is, it includes the important variables in the model and excludes the non-relevant ones. However, it is necessary to previously consider the possible collinearity of the predictor variables. In this case, the correlation between the variables was studied and the variance inflation factor (VIF) was determined. Consequently, those variables with a VIF greater than 10 were eliminated as possible predictor variables. Figure 2 includes the correlation values of all variables initially studied.
3. Results
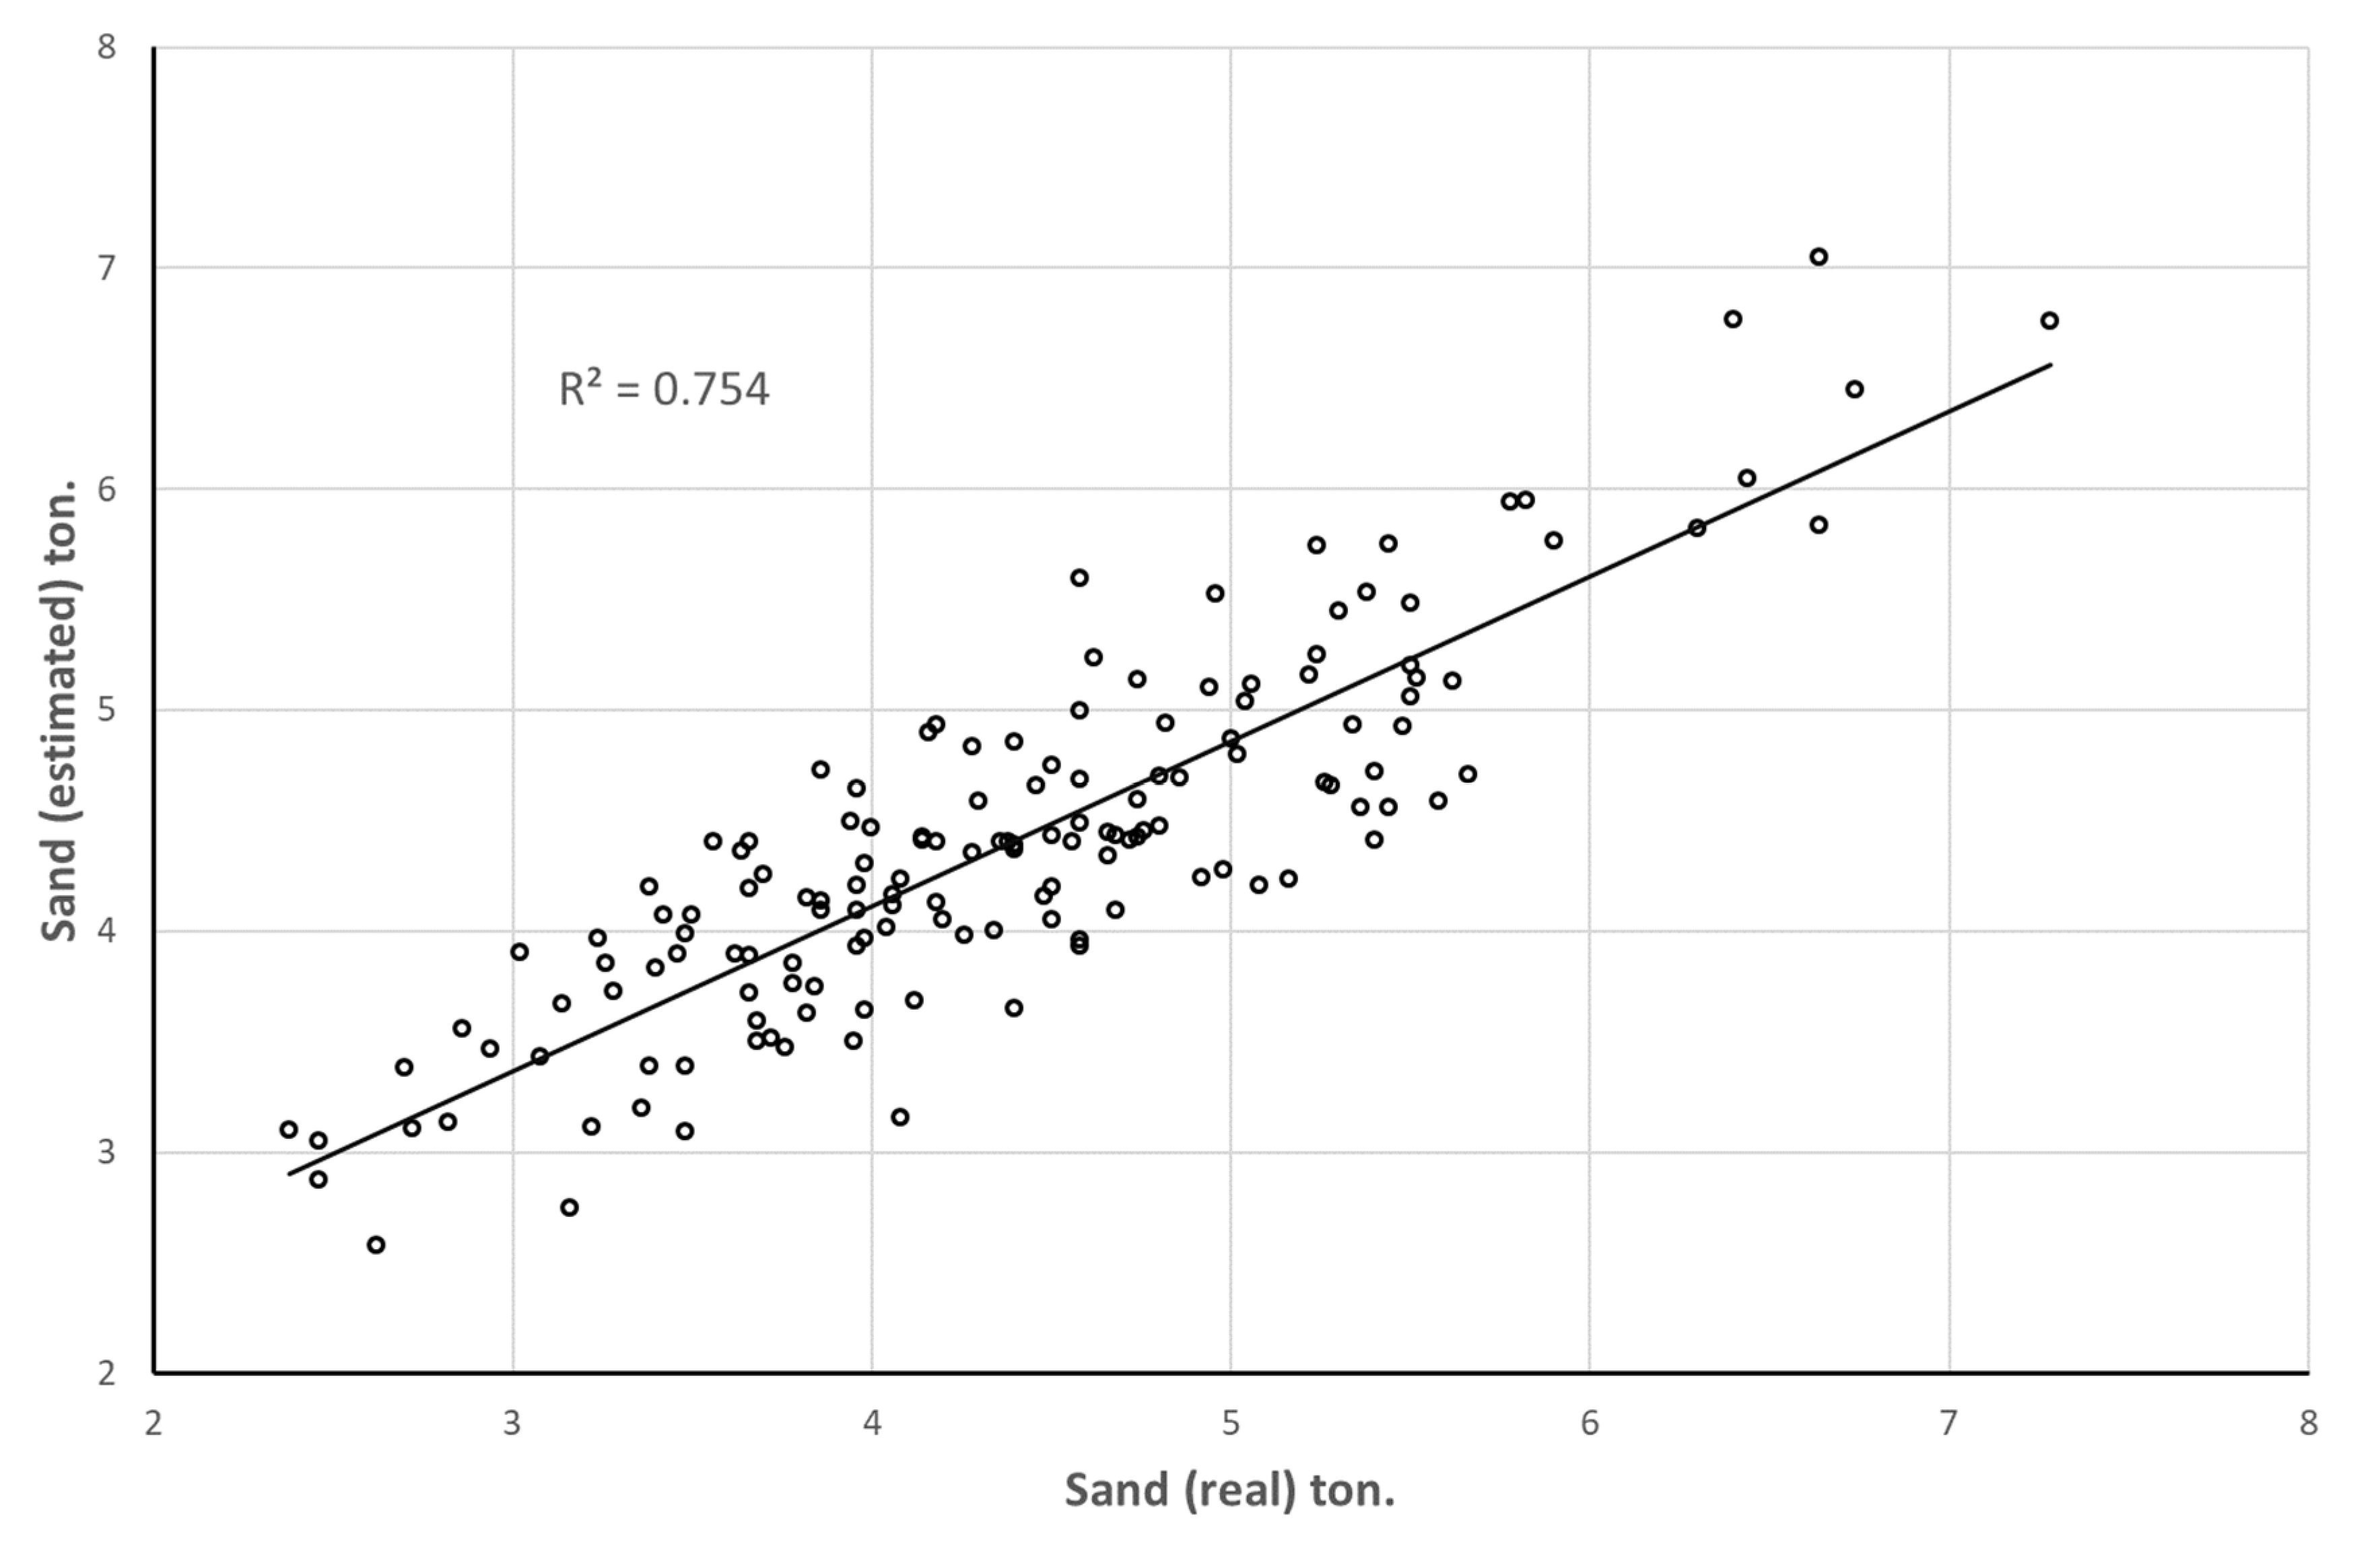
The assessment of the suitability of the prediction model, developed with the R earth package [17], was performed by using the determination coefficient (adjusted R2) between the predicted values versus the actual dataset. In this case, although the accuracy of the MARS model obtained is not very high, R2 = 0.74 (Figure 3) for training data and R2 = 0.70 in validation data, it is enough for predicting trend changes in sand recovery during pre-treatment phases.
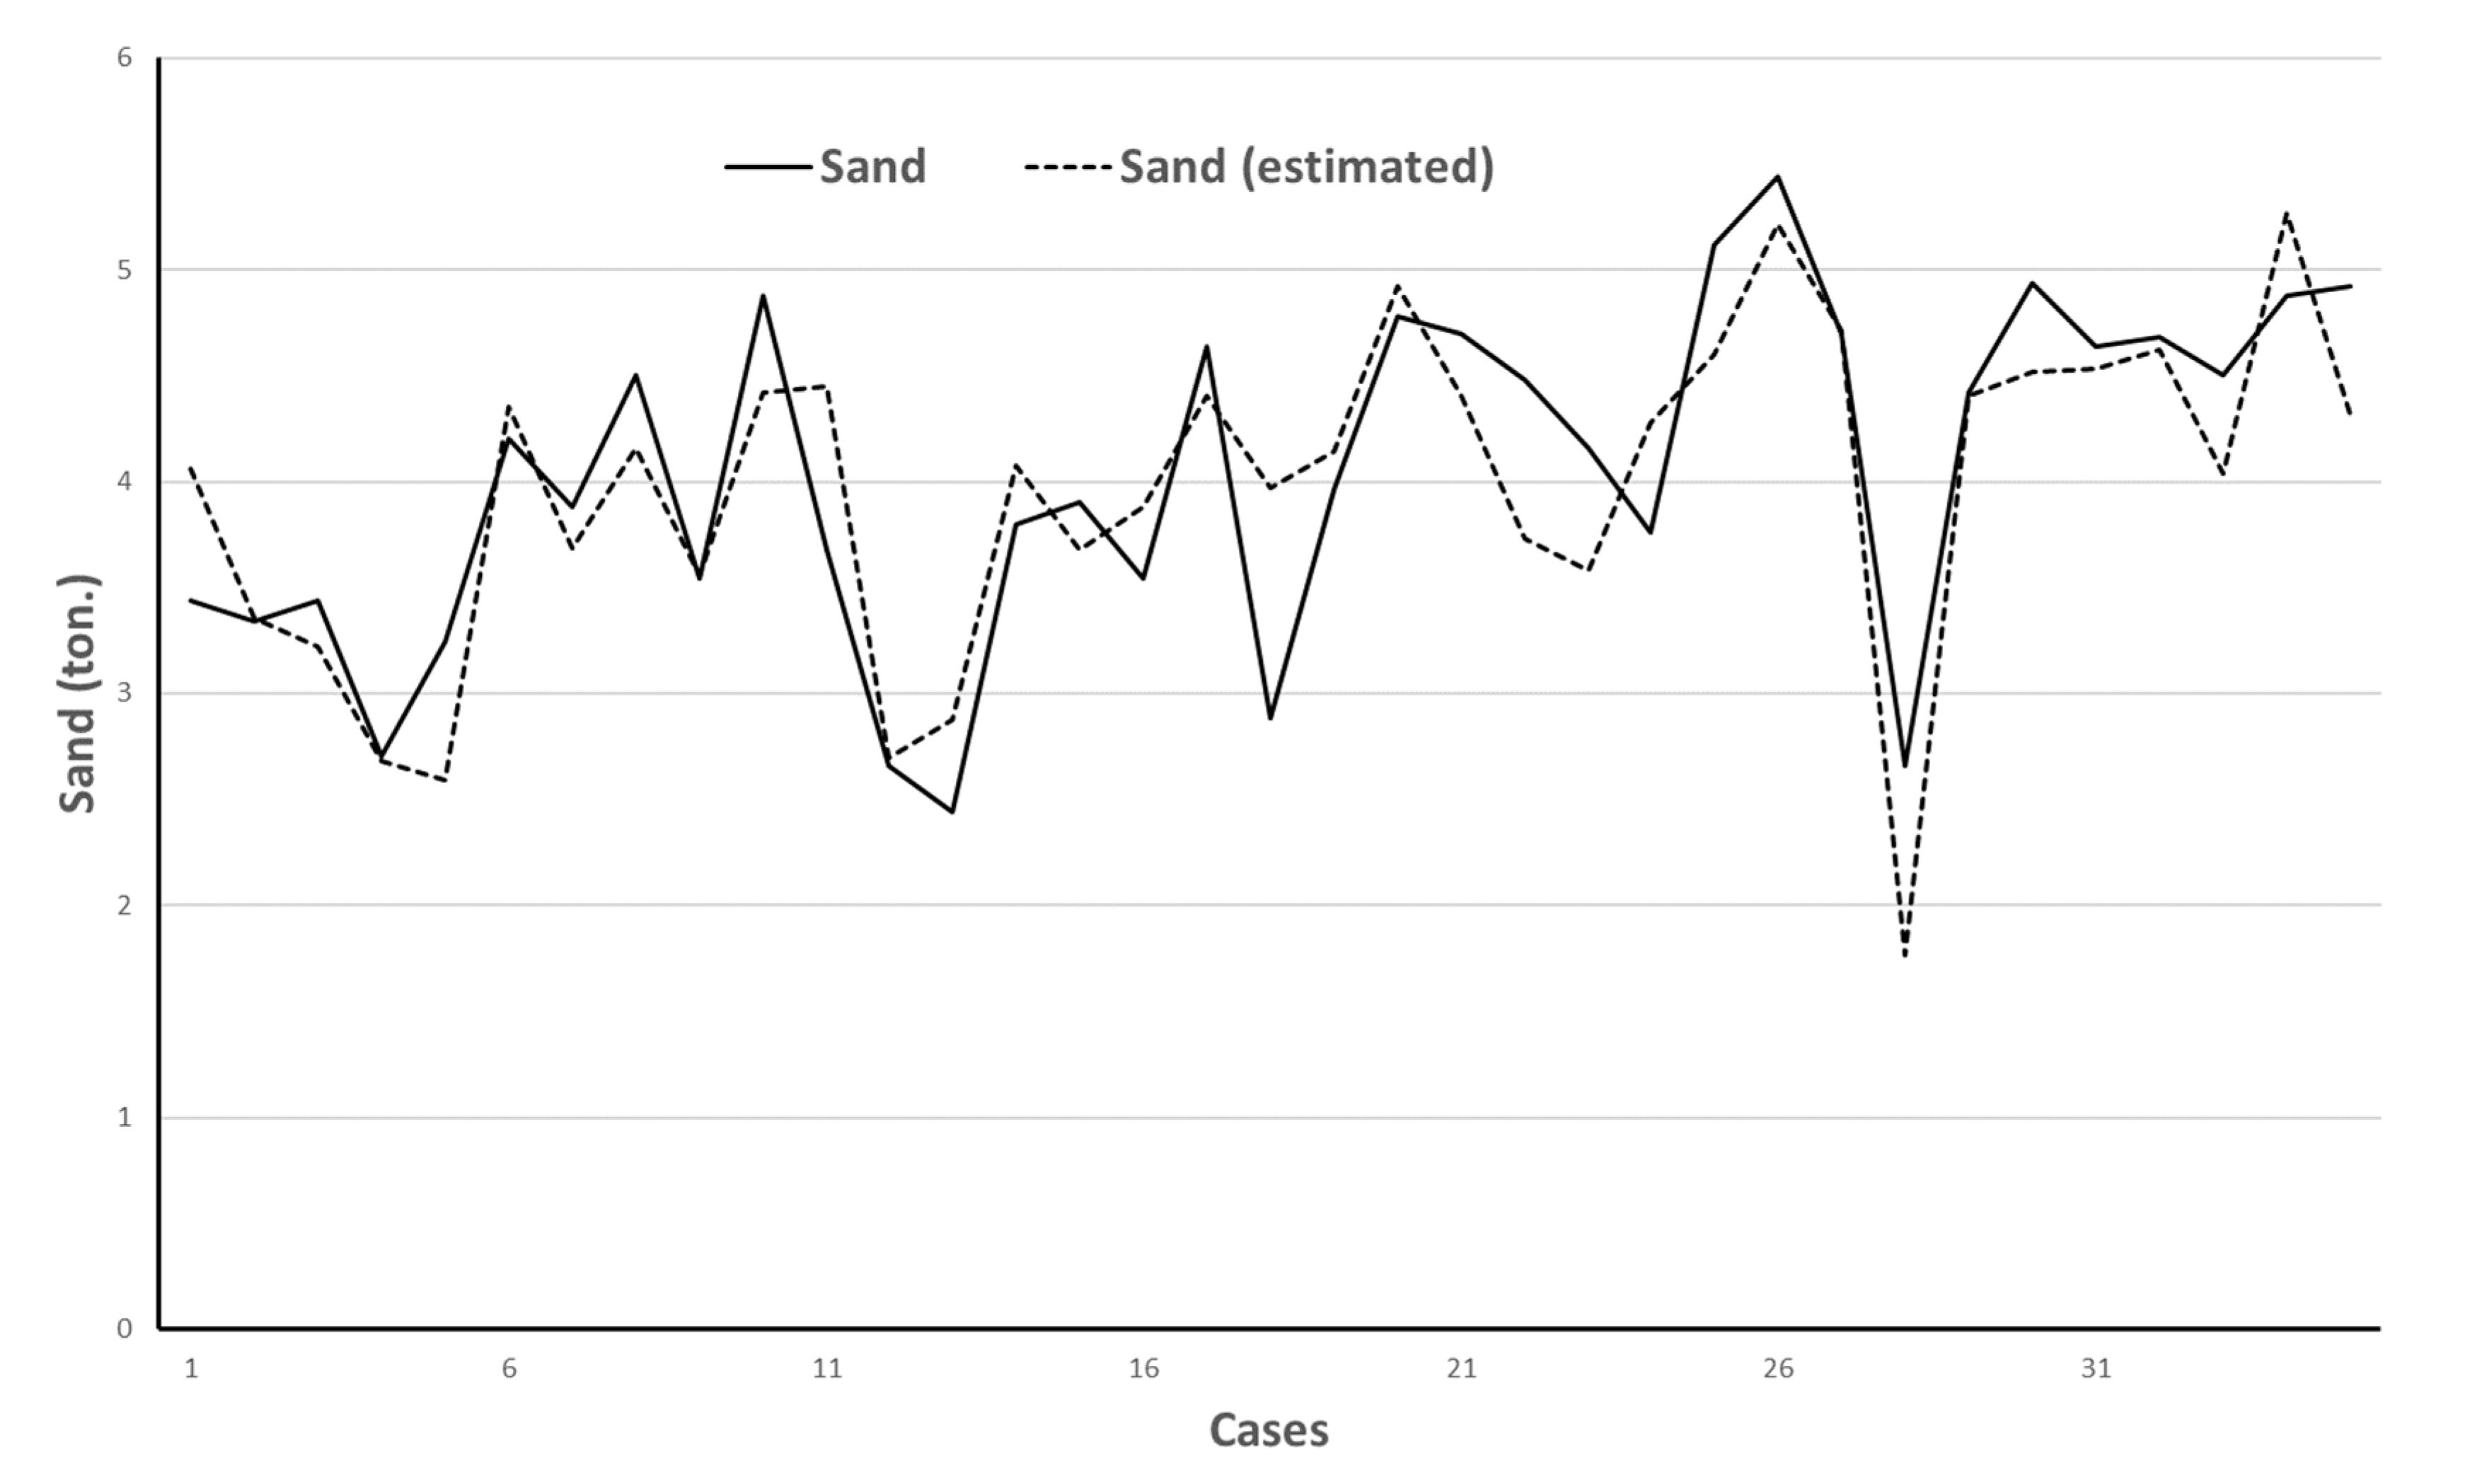
Figure 4 shows the estimated and actual sand values over time, corresponding to the validation data set. It is possible to observe that the model is capable of detecting when changes in the amount of sand arrival to the treatment plant occur.
The basis functions of the MARS model obtained, and their coefficients are shown in Table 3.
Table 4 presents an assessment of the importance of each variable in the model according to the following criteria: the number of subsets of the model in which each variable is included (Nsubsets), GVC (Generalized cross-validation) and RSS (residual sums of squares). These last two parameters (GVC and RSS) are presented on a scale from 0 to 100. The GVC value shown in Table 4 can be understood as the model’s ability to generalize and it is analyzed with the test data. Similarly, the RSS value represents the error that reduces a certain variable accumulated in each of the defined subsets. Therefore, the variables that cause a greater reduction of that error are considered more significant in the model.
As shown in Table 4, the main variable that determines the amount of sand reaching the treatment plant is the flow (MedFlow). As expected, the greater the flow, the more sand is collected, although this relationship is not directly proportional to it. Sand content in wastewater is relatively low. Nevertheless, it is higher in rainwater, as may be indicated by the TotalPrecipitation variable, which also appears as significant. Experience indicates that, in periods of continuous rain, the arrival of sand is constant and there is no washing effect of the collector.
The pH, included in this case as an average value (MedpH), is another relevant variable since it indicates that there is a variation in the composition of the wastewater due to the presence of rainwater. While in dry weather the composition of the wastewater is fairly constant, when it rains, the pH value recorded is modified by the dilution effect.
The length of time intervals (Time) indicates the time it takes to fill the containers, while the variable corresponding to the month (Month) reflects the seasonality of sand production. The behaviour is different depending on the time of year, i.e., in rainy seasons or periods with a greater probability of rain, a greater quantity of sand is produced.
Like the pH, ammonium (MedAmmonium) is a variable conditioned by water dilution, but also by industrial activity. In other words, during working days, when there is greater industrial activity, the average value of ammonium increases. However, with the pH, this effect is not detected because certain industrial activities reduce the pH value while others increase it.
4. Discussion
An appropriate operation and control of wastewater treatment plants is receiving more and more attention due to the growing social concern for environmental issues [18]. As a result, different advanced plant control strategies are being implemented. Many of them are mainly based on monitoring different plant parameters [19]. Thus, variations in the composition and quantity of incoming wastewater, as well as the complexity of the treatment processes themselves, make it necessary to model different parameters to improve the operational control of the facility [4]. With this aim, and taking advantage of the data availability from the facilities’ control systems (SCADA), different modelling techniques have been used, such as ANN (Artificial Neural Networks) [18], FIS (Fuzzy Inference System), ANFIS (Adaptive Neural Fuzzy Inference Systems), RF (Random Forest).
In this paper, the technique introduced is MARS methodology, which has been frequently used in other sectors, but which had not been used in the field of WWTPs parameter modelling. Achieving good results in all these modelling techniques, like MARS, depends fundamentally on the quantity and quality of the data used during training. In this work, great effort has been made in data collection and its initial preparation. Collecting a database corresponding to a full year of the variables indicated in Section 2 was the starting point. In addition to usual pre-processing of missing, wrong or incomplete data, in this case, due to the lack of continuous measurement of the sand received, it has been necessary to group the data of the remaining variables, according to data obtained from weighing sand containers when they are removed.
One of the positive aspects of using MARS is the greater ease in interpreting the resulting model compared to other techniques. For example, models based on ANN or RF cannot be easily interpreted [19]. This allows contrasting the results obtained with previous experience. In the presented model, as indicated in the Results section, the most significant variables correspond to the expected ones, considering the collected wastewater specific characteristics at the Villapérez station, with a unitary network that also receives a certain amount of industrial water.
The characteristics of wastewater entering the plant depend on the characteristics of the area it serves, population or industrial activities presence and they are affected by various factors, such as, seasonality or weather phenomena. Different works have studied cases in which plants operating conditions differ greatly from the designed working conditions, storms is a common example. On such occasions, as the facility performance gets worse, different treatment processes may be affected [20]. In the scope of this study, domestic wastewater does not contain sand, but it is associated with rainwater.
During these episodes of heavy rainfall and especially if it has not rained for some time, the arrival of sand increases notably, so having a model that detects these changes as soon as possible, makes it easier for the plant operators to take the most appropriate decisions. This is another of the outstanding aspects of this work, which focuses on predicting an input parameter, sand, in the initial treatment stage, which, as indicated above (Section 2), has an important influence on the performance and conservation of any treatment plant. In general, most studies focus on predicting other parameters such as COD, BOD, temperature, pH, in more advanced stages of the treatment process [18].
5. Conclusions
Although wastewater pre-treatment in WWTPs has been addressed by relatively little research, it is one of the stages most affected by untreated water discharges and on which the performance and durability of the rest of the plant also depends to a large extent. Not completing the pre-treatment process correctly i.e., not removing the larger waste, sand and fat, necessarily generates problems in the remaining treatments.
For the development of this model, data has been collected for approximately one year using the plant’s SCADA system. This system registers 226 parameters every 9 min. In addition, climatic and sand data recovered in pretreatment have been collected in the same period. All this amount of data has been filtered and processed until obtaining 187 valid cases with the values corresponding to 17 variables.
In this work, the prediction of one of these components, sand, is addressed using a data-based model applying the MARS method. The accuracy achieved in the validation tests (R2 = 0.70), which is similar to that obtained during training (R2 = 0.74), provides a new tool for better management of WWTPs. Having an estimation of sand production will make it easier to open pretreatment lines based on the prediction of significant increases in sand production or, on the other hand, to close lines if a significant decrease is predicted. Similarly, regarding the filling of containers, warnings could be programmed into the SCADA plant control system, so that it is possible to predict when their removal will be necessary.
The MARS model obtained reflects the importance of certain variables and makes it possible to interpret, based on plant experience, that the variation in input values such as flow, pH, ammonia, etc., indicate changes due to rain or industrial activity, for example. Among all the variables introduced in the model, the mean flow (MedFlow) and the mean pH (MedpH), are the most outstanding variables according to the number of subsets, GVC and RSS.
Finally, it should be pointed out that it would also be possible to extend the prediction, with a modelling process similar to that developed in this work, to the other components of the pre-treatment stage as fats and gross solids, which would lead to operational improvements at the plant.
Author Contributions
Conceptualization, V.M.P. and F.O.F.; methodology, J.M.M.F.; data curation, V.M.P.; writing—original draft preparation, J.M.M.F. and V.M.P.; writing—review and editing, F.O.F. and H.M.P. All authors have read and agreed to the published version of the manuscript.
Funding
This work was funded by the Science, Technology and Innovation Plan of the Principality of Asturias (Spain) Ref: FC-GRUPIN-IDI/2018/000225, which is part-funded by the European Regional Development Fund (ERDF).
Acknowledgments
The authors would like to thank Aguas de las Cuencas de España (ACUAES) and the joint venture formed by Dragados S.A. and Drace Infraestructuras S.A. for their collaboration in this work.
Conflicts of Interest
The authors declare no conflict of interest.
References
- Borges, N.B.; Campos, J.R.; Pablos, J.M. Characterization of residual sand removed from the grit chambers of a wastewater treatment plant and its use as fine aggregate in the preparation of non-structural concrete. Water Pr. Technol. 2015, 10, 164–171. [Google Scholar] [CrossRef]
- He, L.; Tan, T.; Gao, Z.; Fan, L. The Shock Effect of Inorganic Suspended Solids in Surface Runoff on Wastewater Treatment Plant Performance. Int. J. Environ. Res. Public Heal. 2019, 16, 453. [Google Scholar] [CrossRef] [PubMed] [Green Version]
- Do Prado, G.S.; Campos, J.R. O emprego da análise de imagem na determinação da distribuição de tamanho de partículas da areia presente no esgoto sanitário. Eng. Sanit. e Ambient. 2009, 14, 401–409. [Google Scholar] [CrossRef] [Green Version]
- Yel, E.; Yalpir, S. Prediction of primary treatment effluent parameters by Fuzzy Inference System (FIS) approach. Procedia Comput. Sci. 2011, 3, 659–665. [Google Scholar] [CrossRef] [Green Version]
- Zhang, J.; Du, C.; Feng, X. Research on a soft measurement model of sewage treatment based on a case-based reasoning approach. Water Sci. Technol. 2017, 76, 3181–3189. [Google Scholar] [CrossRef] [PubMed]
- Civelekoglu, G.; Yigit, N.O.; Diamadopoulos, E.; Kitis, M. Modelling of COD removal in a biological wastewater treatment plant using adaptive neuro-fuzzy inference system and artificial neural network. Water Sci. Technol. 2009, 60, 1475–1487. [Google Scholar] [CrossRef] [PubMed]
- Bakia, O.T.; Arasb, E.; Akdemirc, U.O.; Yilmaza, B. Biochemical oxygen demand prediction in wastewater treatment plant by using different regression analysis models. Desalin. Water Treat. 2019, 157, 79–89. [Google Scholar] [CrossRef] [Green Version]
- Metcalf & Eddy, Inc.; Tchobanoglous, G.; Burton, F.; Stensel, H.D. Wastewater Engineering: Treatment and Reuse; McGraw-Hill Education: New York, NY, USA, 2002; ISBN 978-0-07-041878-3. [Google Scholar]
- Office of Water. Wastewater Technology Fact Sheet: Screening and Grit Removal; Environmental Protection Agency (EPA): Washington, DC, USA, 2003; p. 11. [Google Scholar]
- Do Prado, G.S.; Campos, J.R. Determinação da quantidade de areia no esgoto sanitário: Metodologia e estudo de caso. Eng. Sanit. e Ambient. 2008, 13, 306–312. [Google Scholar] [CrossRef] [Green Version]
- Friedman, J.H. Multivariate Adaptive Regression Splines. Ann. Statist. 1991, 19, 1–67. [Google Scholar] [CrossRef]
- Li, D.H.W.; Chen, W.; Li, S.; Lou, S. Estimation of hourly global solar radiation using Multivariate Adaptive Regression Spline (MARS)—A case study of Hong Kong. Energy 2019, 186, 115857. [Google Scholar] [CrossRef]
- Nalcaci, G.; Özmen, A.; Weber, G.W. Long-term load forecasting: Models based on MARS, ANN and LR methods. Central Eur. J. Oper. Res. 2019, 27, 1033–1049. [Google Scholar] [CrossRef]
- Zhang, X.; Fang, F.; Liu, J. Weather-Classification-MARS-Based Photovoltaic Power Forecasting for Energy Imbalance Market. IEEE Trans. Ind. Electron. 2019, 66, 8692–8702. [Google Scholar] [CrossRef]
- Szeląg, B.; Bartkiewicz, L.; Studziński, J.; Barbusiński, K. Evaluation of the impact of explanatory variables on the accuracy of prediction of daily inflow to the sewage treatment plant by selected models nonlinear. Arch. Environ. Prot. 2017, 43, 74–81. [Google Scholar] [CrossRef] [Green Version]
- Zadorojniy, A.; Wasserkrug, S.; Zeltyn, S.; Lipets, V. Unleashing Analytics to Reduce Costs and Improve Quality in Wastewater Treatment. Inf. J. Appl. Anal. 2019, 49, 262–268. [Google Scholar] [CrossRef]
- R Core Team. R: A language and Environment for Statistical Computing; R Foundation for Statistical Computing: Vienna, Austria, 2017. [Google Scholar]
- Hamed, M.M.; Khalafallah, M.G.; Hassanien, E.A. Prediction of wastewater treatment plant performance using artificial neural networks. Environ. Model. Softw. 2004, 19, 919–928. [Google Scholar] [CrossRef]
- Dürrenmatt, D.J.; Gujer, W. Data-driven modeling approaches to support wastewater treatment plant operation. Environ. Model. Softw. 2012, 30, 47–56. [Google Scholar] [CrossRef]
- El-Din, A.G.; Smith, D.W. A neural network model to predict the wastewater inflow incorporating rainfall events. Water Res. 2002, 36, 1115–1126. [Google Scholar] [CrossRef]
Figure 1.
View of the wastewater treatment plant (WWTP) of Villapérez (Asturias, Spain).

Figure 2.
Correlation between variables.

Figure 3.
Prediction performance of the Multivariate Adaptive Regression Splines (MARS) model (training data).
Figure 3.
Prediction performance of the Multivariate Adaptive Regression Splines (MARS) model (training data).

Figure 4.
Prediction performance of MARS model (validation data).


Table 1.
Design parameters of wastewater treatment plant of Villapérez (Asturias, Spain).
| Maximum Inflow (rainy weather) | 8.50 m3/s |
| Maximum Inflow (dry weather) | 2.89 m3/s |
| DBO5 | 418.00 mg/L |
| DQO | 652.00 mg/L |
| SST | 329.00 mg/L |
| N-NTK | 47.40 mg/L |
| N-NO3 | 0.76 mg/L |
| Nt | 48.20 mg/L |
| N-NH4+ | 25.00 mg/L |
| Pt | 6.50 mg/L |
| P-PO4 | 3.24 mg/L |
Table 2.
Statistical description of the variables.
| Variable | Description | Unit | Mean | Standard Deviation | Minimum | Maximum |
|---|---|---|---|---|---|---|
| Sand (Output) | Removed sand | ton | 4.35 | 0.93 | 2.38 | 7.28 |
| PDwR | Previous days without rain | day | 1.06 | 2.39 | 0.00 | 19.79 |
| Time | Time interval | h | 44.70 | 40.70 | 0.32 | 264.64 |
| Vol | Water volume | m3 | 202,380.29 | 172,009.62 | 3404.22 | 990,263.20 |
| TotalPrecip | Total precipitation | m3 | 4.96 | 8.11 | 0.00 | 59.40 |
| MaxPrecip | Maximum precipitation | mm | 0.72 | 1.39 | 0.00 | 12.00 |
| MedpH | Medium pH | - | 7.10 | 0.47 | 5.59 | 8.05 |
| MaxpH | Maximum pH | - | 7.72 | 0.73 | 5.60 | 11.65 |
| MedTemperature | Medium temperature | °C | 17.24 | 3.39 | 9.11 | 22.85 |
| MaxTemperature | Maximum temperature | °C | 18.22 | 3.40 | 9.20 | 23.65 |
| MedConductivity | Medium conductivity | µS/cm | 880.99 | 282.38 | 147.19 | 1550.38 |
| MaxConductivity | Maximum conductivity | µS/cm | 1428.30 | 621.12 | 176.28 | 3350.60 |
| MedAmmonium | Ammonium | mg/L | 19.21 | 8.58 | 2.38 | 45.71 |
| MaxAmmonium | Maximum ammonium | mg/L | 24.56 | 10.99 | 2.97 | 57.99 |
| MedFlow | Medium flow | m3/h | 5550.69 | 3107.41 | 2528.54 | 16,297.02 |
| MaxFlow | Maximum flow | m3/h | 8602.23 | 3686.51 | 3224.42 | 17,885.11 |
| MinFlow | Minimum flow | m3/h | 3634.63 | 3018.53 | 975.59 | 15,977.44 |
Table 3.
List of basic functions of MARS model.
| Basis Function | Definition | ci |
|---|---|---|
| B1 | 1 | 4.402074 |
| B2 | max(0, MedFlow − 4784.547) | 0.000155372 |
| B3 | max(0, 1.4 − TotalPrecip) × max(0, 4784.547 − MedFlow) | −0.0004165734 |
| B4 | max(0, MedpH − 6.841621) × max(0, 4784.547 − MedFlow) | −0.0008090167 |
| B5 | max(0, MedpH − 7.193376) × max(0, Month − 4) | +0.9243512 |
| B6 | max(0, Month − 4) × max(0, 18.58 − MedAmmonium) | +0.008425636 |
| B7 | max(0, 24.32 − Time) × max(0, MedFlow − 4784.547) × Month | −1.45412 × 10⁻⁶ |
| B8 | max(0, 1.4 − TotalPrecip) × max(0, 4784.547 − MedFlow) × max(0, Month − 4) | +5.940599 × 10⁻⁵ |
| B9 | max(0, MedpH − 7.193376) × max(0, Month − 4) × max(0, MedAmmonium − 12.56) | −0.2440937 |
| B10 | max(0, MedpH − 7.193376) × max(0, Month − 4) × max(0,12.56 − MedAmmonium) | −0.2182406 |
| B11 | max(0, MedpH − 7.193376) × max(0, Month − 4) × max(0, MedAmmonium − 16.22) | +0.2774549 |
Table 4.
Importance assessment of variables in the model.
| Variable | Nsubsets | GCV | RSS |
|---|---|---|---|
| MedFlow | 10 | 100 | 100 |
| MedpH | 8 | 85.2 | 85.5 |
| Time | 8 | 55.8 | 61.3 |
| Month | 7 | 51.4 | 56.1 |
| MedAmmonium | 6 | 45.1 | 49.6 |
| TotalPrecipitation | 2 | 24.9 | 26.6 |
© 2020 by the authors. Licensee MDPI, Basel, Switzerland. This article is an open access article distributed under the terms and conditions of the Creative Commons Attribution (CC BY) license (http://creativecommons.org/licenses/by/4.0/).
Share and Cite
MDPI and ACS Style
Mateo Pérez, V.; Mesa Fernández, J.M.; Ortega Fernández, F.; Morán Palacios, H. Sand Content Prediction in Urban WWTPs Using MARS. Water 2020, 12, 1357. https://doi.org/10.3390/w12051357
AMA Style
Mateo Pérez V, Mesa Fernández JM, Ortega Fernández F, Morán Palacios H. Sand Content Prediction in Urban WWTPs Using MARS. Water. 2020; 12(5):1357. https://doi.org/10.3390/w12051357
Chicago/Turabian StyleMateo Pérez, Vanesa, José Manuel Mesa Fernández, Francisco Ortega Fernández, and Henar Morán Palacios. 2020. "Sand Content Prediction in Urban WWTPs Using MARS" Water 12, no. 5: 1357. https://doi.org/10.3390/w12051357
Note that from the first issue of 2016, this journal uses article numbers instead of page numbers. See further details here.