Article

Changes in Hydromorphological Conditions in an Endorheic Lake Influenced by Climate and Increasing Water Consumption, and Potential Effects on Water Quality

by
Danuta Szumińska
1,*,
Sebastian Czapiewski
1 and
Jacek Goszczyński
2
1
Institute of Geography, Kazimierz Wielki University, 8 Kościelecki Sq., 85-033 Bydgoszcz, Poland
2
Inspectorate of Environmental Protection, Regional Department of Environmental Monitoring in Bydgoszcz, 3 Jagiellońska St., 05-018 Bydgoszcz, Poland
*
Author to whom correspondence should be addressed.
Water 2020, 12(5), 1348; https://doi.org/10.3390/w12051348
Submission received: 29 February 2020 / Revised: 1 May 2020 / Accepted: 7 May 2020 / Published: 9 May 2020

Abstract

:
The study aims to analyse changes in the morphological conditions of the endorheic Lake Borówno (39.06 ha) that occurred in the 20th century and early 21st century. The analysis was based on bathymetric measurements carried out in 2018 and cartographic materials, and performed using QGIS 3.10 and SAGA GIS 6.4 software. Moreover, changes in physical (temperature, transparency), chemical (dissolved oxygen, phosphorus, and nitrogen content) and biological (chlorophyll a, phytoplankton) parameters were analysed based on the results of measurements conducted by the Voivodeship Inspectorate of Environment Protection (VIEP) in Bydgoszcz in the period 1984–2017. It was found that Lake Borówno is subject to a constant reduction in surface area and volume, the rate of which increased in the second decade of the 21st century. The lake’s progressive disappearance results from the co-occurrence of hydrological drought over the last several years and an increase in the use of groundwater resources. A decrease in the maximum depth of the lake entails a change in temperature distribution in the vertical profile, which contributes to the tendency toward the lake transforming into an unstratified reservoir. The increase in water temperature affects oxygen content in the bottom water, improves water transparency, and influences the maximum occurrence of chlorophyll a in spring.

1. Introduction

The processes affecting the hydrological and hydrochemical conditions in catchment areas depend on many factors such as climate, geological structure, soil conditions, and land use as well as anthropogenic activities including groundwater use [1,2,3]. Small, endorheic lakes are particularly susceptible to changes in these factors. Such lakes are sensitive to both human impact [4,5,6,7,8,9,10] and climate changes [11,12]. Changes in land use in the catchment area affect the local water balance including surface run-off and underground drainage conditions, water retention in soil, and extent of evaporation [11,12,13,14,15,16,17]. The use of water for agriculture, as it intensifies, may lower the groundwater table and, in turn, reduce the water level in the lake [18]. Water used in agrotechnical processes is contaminated with fertilisers and organic substances. As it returns via surface run-off to the lake, it may pose a threat to the lake’s chemical status [19,20]. High levels of risk to surface waters are also posed by livestock farming (particularly on large-scale farms) and improper storage of natural and artificial fertilisers [4,6,7,9,10]. Eutrophication rates may increase as a result of over-exposure of surface water to substances of anthropogenic, and particularly agricultural, origin. This process can occur naturally in lakes as part of their evolution [21] and can be intensified by an increase in the concentrations of phosphorus and nitrogen supplied to the lake from external sources (cultivation and fertilisation, animal husbandry) [22,23]. Excessive use of groundwater can lead to a significant drop in the water table, resulting in lower water levels in surrounding lakes and watercourses [24,25,26]. The exploitation of larger groundwater intakes to meet livelihood needs may cause the formation of depression cones [27]. The occurrence of large depression cones may also be the effect of mining activity [28,29], which may lead to significant changes in ground and surface water levels [30,31,32,33,34].
Climate variability is the second key factor influencing hydrological conditions in catchments and water bodies. Feyen and Dankers emphasised that global warming is likely to favour conditions for the development of droughts in many regions of Europe in the 21st century [35]. The complexity and extent of the reaction of a basin to diminishing water resources were touched upon by Van Loon [36]. According to the author, hydrological drought is associated with a lack of water in the hydrological system and is caused by prolonged low soil moisture. In Poland, the first decades of the 21st century demonstrated an increased frequency of heat waves, which in turn is likely to have resulted in recurring negative water balance [37], and thus a rapidly growing demand for water. Some urban areas have already been struggling with periodic water shortages in the summer season. Furthermore, drastically falling outflow of small rivers [38] and accelerating disappearance of lakes have been observed [39]. Taking into account the potential risk implicated by the impact of hydrological drought phenomena on lakes, particular attention should be given to lakes subject to strong human pressure.
This paper investigated the impact of climate and catchment factors on the hydrological stability and water quality of the endorheic Lake Borówno (39.06 ha). The study was initiated due to problems resulting from a significant drop in the lake water level in the second decade of the 21st century. Therefore, the aim of the study involves analysing changes in the morphological conditions of Lake Borówno from the mid-20th century to the present including changes in the surface area (in the years 1964–2018), water table (1912–2018), and lake depth (1964–2018). In addition, the analysis included changes that occurred throughout the study period in selected chemical, physical, and biological parameters of water (in the years 1984–2017). Particular attention was also given to changes in water management in the lake’s catchment. The presented case-study demonstrates a comprehensive approach to investigating the causes of the quantitative and qualitative transformations of a lake’s water, and offers insight into lake evolution within a human-transformed environment. Due to the significant differences in the characteristics of individual lakes and their catchment areas, each lake may have a different set of factors determining its evolution [3]. Therefore, in addition to the multi-area studies showing the overall tendency of lake changes for the entire area, individual cases should also be investigated to better explain possible deviations from general trends. The proposed research may offer insights into climate-driven changes that are further accelerated by anthropogenic pressure within water catchment areas [40,41].

2. Materials and Methods

2.1. Lake Bathymetry and Catchment Analysis

In July 2018, the bathymetry of Lake Borówno was measured using a single beam sonar (Lowrance Elite). In addition, the water level was measured using an GPS positioning device (16-channels). The current bathymetric map of the lake was developed on the basis of those measurements using open source Geographic Information System software QGIS 3.10 and SAGA GIS 6.4. Furthermore, the bathymetry of the lake from 2018 was compared with archival measurements from 1964 (measurements made by the Inland Fisheries Institute—IRŚ). The changes in the area of Lake Borówno between the years 1964–2012–2018 were compared against the changes in this parameter in the neighbouring lakes—Kusowo and Dobrcz—in order to verify the trends of changes in water resources in the entire closed catchment area of the three lakes. Changes in the water level in the lakes between 1912 and 2018 were compared on the basis of an archival map from 1912, measurements from 1964 (measurements made by IRŚ), and our own measurements from 2018. Based on a 1:10,000 topographical map from 1987, and orthophotomaps from 2005 and 2018, changes in the building development in the catchment were analysed.
A digital elevation model (DEM) based on LIDAR data (31 sheets) served as a basis for developing an up-to-date hydrographic map with a division into sub-catchments and a subsequent analysis of slope gradients. Data interpolation and terrain modeling were performed using the multilevel b-spline interpolation method [42]. Based on the DEM, lines of surface water runoff were determined, which were the basis for the correction of the course of the watersheds. The surface drainage network was developed on the basis of the numerical terrain model using the Strahler order river network identification method [43] and verified in the field. On the basis of data from the orthophotomap from 2018, a land-use map was prepared. In addition to the analysis of the aforementioned maps, the authors performed a review of archival materials pertaining to Lake Borówno and its tributaries, which are available at the Voivodeship Inspectorate of Environmental Protection in Bydgoszcz (VIEP).
Long-term changes in annual air temperature (t, °C), precipitation (P, mm), and relative air humidity (f, %) were analysed against average monthly values of air temperature for the period of 1951–2018 against the data available for Toruń (the nearest meteorological station conducting long-term meteorological observations). The calculations were performed using data from national weather monitoring made available by the Polish Institute of Meteorology and Water Management—National Research Institute [44]. Annual values of weather parameters were calculated based on the monthly values of each parameter, and the homogeneity of the data series was confirmed using von Neumann’s test. The presented changes in the study parameters in the period 1952–2018 were calculated using the linear regression equation y = ax + b. The resulting linear trend values were investigated in terms of statistical significance by means of the parametric Student’s t-test at a significance level of 0.05.

2.2. Water Quality Measurements

The analysis of physical, chemical, and biological parameters of Lake Borówno was performed on the basis of the results of research carried out by the Voivodeship Inspectorate of Environmental Protection in Bydgoszcz in 1984, 1992, 2002, 2009, and 2017, which concerned water temperature and oxygen content at various depths. Moreover, the VIEP measured water transparency (Secchi disk visibility) and collected water samples for the analysis of chlorophyll a, phytoplankton counts, phosphorus and nitrogen content. The research into Lake Borówno was conducted as part of the National Environment Monitoring network, which is implemented by a national institution—the Voivodeship Inspectorate of Environmental Protection—using the methodology specified for monitoring water quality (VIEP) [45]. The date of measurements and sampling is presented in Table 1. Measurements of temperature (°C) and oxygen content (mg·O2·dm−3) took place by the end of summer thermal stratification. The measurements were performed in situ with a WTW OXI portable oxygen meter 197 (measurement accuracy: T 0.1 K, O2 concentration ±0.5% of value) in the vertical profile located in the deepest section of the lake with a vertical interval of 1 m. Samples for laboratory analysis were collected twice a year during spring thermal homothermy and summer thermal stratification (Table 1)—with the use of a Ruttner bathometer with a volume of 5 L and stored in 1 L glass bottles to minimise the risk of sample contamination. Sampling containers were rinsed with the sample water three times, and then filled without air bubbles to prevent the loss of analytes to headspace. All collected water was stored and transported to the laboratory of VIEP in Bydgoszcz and stored at low temperatures (approx. +4 °C). Chemical and biological analyses were conducted at a certified laboratory of VIEP in Bydgoszcz (current accreditation number AB 161 of Polish Centre for Accreditation, the laboratory was certified throughout the entire research period 1984–2017) [46]. Phosphorus and nitrogen in the water samples were determined using a UV–Vis Varian Cary 50 spectrophotometer Total phosphorus analyses were performed in compliance with PN-EN ISO 6878 [47], with an accuracy of ±0.01 and measurement range of 0.02–20.0 mg·dm−3. The concentration of total nitrogen was expressed as the sum of the various forms of nitrogen according to procedure PN-C-04576-14 [48]. Various forms of nitrogen were measured with accuracy of ±0.01 in accordance with procedures: ammonium nitrogen—PN-ISO 7150-1 [49] (measurement ranges 0.04–10.0 mg·dm−3), nitrite nitrogen—PN-EN 26777 [50] (measurement ranges 0.004–2.5 mg·dm−3), nitrate nitrogen—PN-82/C-04576.08 [51] (measurement ranges 0.04–100.0 mg·dm−3), and nitrogen in organic substances—PN-EN 25663 [52] (measurement ranges 0.02–10.0 mg·dm−3). In 2002, samples for phosphorus and nitrogen analyses were also taken from tributaries of Lake Borówno. Moreover, in 2002, an analysis was performed to indicate chemical oxygen demand in the tributaries of Lake Borówno, employing the titration method in compliance with PN-ISO 6060 [53]. In the summer of 2018, field research of tributaries were carried out (presence of flow and condition of channels).
Chlorophyll a was determined using a Cadas 200 spectrophotometer in accordance with procedure PN ISO 10260 [54]. Prior to the analysis, samples were prepared via extraction in acidified (0.002 M HCl) 50% methanol. In the case of phytoplankton, due to methodological differences between the period 1984–1992 and the later years, only the data from the last two years of the study (2009 and 2017) were compared in the case of phytoplankton biomass, and data from the years 2002, 2009, and 2017 in the case of phytoplankton composition [55,56]. Water samples for the study were collected during the spring and summer months (Table 1) within the vertical profile in the central part of the lake. The assessment of phytoplankton biomass was performed in compliance with PN-EN 15204 [57], using the Utermöhl method [58] with the use of sedimentation cylinders, whereas the quantity was estimated with the use of the Nikon Eclipse Ts2R inverted microscope.
Due to the fact that the analysis employed the results of archival VIEP studies, the range of physical and chemical parameters under analysis was restricted to those that proved to be comparable in terms of the analysis methodology and could be supported with monitoring data applying to all four analysed years.

3. Study Area

The studied lake is located in a young post-glacial zone, in the vicinity of the 50–60 m escarpment zone of a moraine plateau (the Świecie Upland), separating its area from the Vistula River valley (Figure 1). In the immediate vicinity of the lake, there is the small town of Borówno (permanent population: 1118 [59]), and at a distance of 14.5 km, the city of Bydgoszcz (population: 350,178 [60]). Due to its proximity to Bydgoszcz—the main town of the voivodeship—the lake plays a recreational role for the inhabitants of the city as well as being a location for weekend stays at agritourism farms, holiday resorts, and private recreational plots. Due to its location within agricultural areas and the neighbouring city of Bydgoszcz, the lake is subject to various forms of anthropogenic pressures. The catchment area is also crossed by the S5 national road, which has recently been undergoing intensive development.

3.1. Hydrological Background and Land Use

Lake Borówno, together with Lakes Kusowo and Dobrcz and their surroundings, is a closed catchment area that is part of the river basin of the Brda (a left-bank tributary of the Vistula River) [62] (Figure 1). The depression that holds the lakes is poorly distinguished in terms of topographical relief and has no distinct edges. The analysed area consists of smaller closed systems, which are drained towards the centrally located lakes through a drainage network and drainage ditches (Figure 2). Lake Borówno is supplied by six such tributaries with periodic discharge (nos. 1–6 in Figure 2a). The areas of the designated catchments are, respectively: the catchment area of Lake Borówno—335.65 ha and the closed catchment area of the lakes of Borówno, Kusowo and Dobrcz—1850.35 ha. Due to a lack of natural surface runoff between Lake Borówno and Lake Kusowo, the direct catchment area of Lake Borówno also constitutes its total surface catchment area. The calculated slopes for the direct catchment area of the lake to an average of 1.5°, with a maximum of 18.1°, and, for the catchment area of the three lakes, were an average of 1.5° and a maximum of 24.5°. Both basins demonstrated a prevalence of areas with minor slope gradient (0–2°), which cover 96.8% and 84.5% of their area, respectively, whereas terrains with the slope gradient exceeding 10° comprise only 0.6% and 0.4% of the aforementioned areas.
Agricultural function is the predominant land use both within the catchment area of Lake Borówno and the catchment of the three-lake complex (Table 2) (Figure 2b). Meadows and pastures are found mostly at the bottoms of hollows, mainly in the Dobrcz–Kusowo–Borówno lake complex. To the west and north-west of Lake Borówno, there is a small forest complex. In total, in the direct catchment area of Lake Borówno, agricultural land occupies 171.02 ha (50.96% of the area), urbanised areas are 58.21 ha (17.35% of the area); forests are 49.79 ha (14.83% of the area), water covers 43.65 ha (13% of the area), meadows are 10.48 ha (3.12% of the area). In the catchment area of the three lakes—Borówno, Kusowo and Dobrcz—there is a slightly higher share of agricultural land and meadows and a smaller share of forests (Table 2).

3.2. Geological and Hydrogeological Background

The surface geological structure of the area around Lake Borówno is dominated by Quaternary formations—fine sands, sandy loam, loamy sands and till—with a thickness of 18–55 m [65,66]. Underneath them are Neogene formations, developed in the form of clay series, layers of brown coals, and fine sands. In the vicinity of Lakes Borówno, Kusowo, and Dobrcz, there are two usable aquifers [66,67]. The first, with a thickness of 3–10 m, is composed mainly of Quaternary fine sands and silty sands, and its local drainage base is formed by the three lakes. This aquifer is characterised by a water level that is unconfined, but locally confined where aquifers are deposited under impermeable formations. It is mainly supplied by infiltrating precipitation and can therefore be subject to considerable fluctuations in the groundwater level throughout the year and over a multi-year period. There is also a high risk of pollution of agricultural origin being introduced into the waters of this aquifer. The main usable aquifer includes Quaternary and Tertiary formations and is composed of fine- and medium-grained sands, the thickness of which is variable (13–20 m). It is characterised by a confined water table. The groundwater within this aquifer flows from the north-west towards the main basis of drainage formed by the Vistula River. This aquifer is mainly supplied by lateral underground inflow, and to a lesser extent, by precipitation infiltration into the geological substrate.
The first usable aquifer is utilised mainly by the users of individual recreational plots on the southern shore of Lake Borówno [66]. In the past, this aquifer was also used by individual farms, which are now supplied with water mainly from the municipal water supply system. The main usable aquifer is reached by means of wells drilled within the system of municipal intakes. They supply water to farms, leisure resorts, and allotment gardens as well as individual households [66].
Comparison of the location of the water table near Lake Borówno indicates a lowering of the first usable aquifer by 0.3–2.0 m across a significant area (locally raised by 0.2–0.7 m) in the years 2005–2018, and a lowering of the main water table across the entire study area (by a maximum of 1.4 m in the immediate vicinity of water intakes) from the 1970s to 2018 [66].

4. Results

4.1. Climate and Water Consumption Changes

Air temperatures recorded in Toruń indicate a significant increasing trend starting from the mid-20th century, which amounts to 0.31 °C per 10 years (statistically significant at the 0.05 level) (Figure 3a). One may also note that, starting in 1989, mean air temperature in most years exceeded 8 °C, whereas the mean value for the period of 1989–2018 amounted to 8.9 °C. The mean calculated for the years 1951–1988 was 7.6 °C, while the mean air temperature for the entire period of 1951–2018 amounted to 8.2 °C. The annual sums of precipitation in the city of Toruń indicate a minor increasing trend in the study period. However, said trend did not prove statistically significant (Figure 3b). Particularly, low precipitation was recorded in 1951, 1982, and 1989, and amounted to 312, 316, and 310 mm, respectively. Precipitation sums in the last two decades of the study period were similar to the mean value for the entire period of 1951–2018 (532 mm), or slightly higher. Precipitation was lower than the mean value for the period in question—by approximately 100 mm—only in the years 2014, 2015, and 2018. Despite the fact that in the past few decades there has been no prolonged precipitation deficit, a clear downward trend can be noted in relative air humidity (Figure 3b). Its value decreased by 4% throughout the entire study period of 1951–2018 (statistically significant at the 0.05 level).
The location of Lake Borówno in the vicinity of the city of Bydgoszcz paired with the suburban-recreational character of its basin has resulted in a successive increase in buildings and infrastructure (Table 3, Figure 4). The most notable growth pertained to single-family housing, which affected the immediate vicinity of Lake Borówno (Figure 4). In 1986, single-family housing occupied 4.3% of the direct catchment area. In 2019, it was 10.8%. This development is concentrated mostly near the north-eastern lakeshore (i.e., the building area belonging to the village of Borówno) and in the vicinity of the southern lakeshore, near the allotment gardens.
Data presented in Figure 3a show an increase in water consumption from 1985 to the present. High water consumption is related to utility purposes as well as to the watering of the allotment gardens during summer droughts. Moreover, the aforementioned increase may also correspond to the presence of several outdoor swimming pools established as part of residential development.
The field work conducted by the authors in the summer of 2018 shows no discharges in Lake Borówno’s tributaries. Moreover, the channels of streams were overgrown by plants and filled by sediments and tree branches. Apart from 2002, no outflows were observed in the tributaries during spring and summer sampling dates. Furthermore, in 2018, the authors interviewed residents of the vicinity of the lake and received information that there had been no discharges in the tributaries in the last few years. In some years, water had stagnated in the channels in spring. However, no flowing water was observed. The residents also reported that in the last few years, severely hot summers had occurred and they had needed a lot of water to irrigate their plants.

4.2. Changes in the Morphometry of Lake Borówno

Calculations of the surface area of Lake Borówno in different periods indicate that in the years 1964–2012, the lake area decreased by 5.7%, and by a further 5.1% between 2012 and 2018 (Table 4). In total, between 1964 and 2018, the lake reduced its area by 10.8%. In Lakes Kusowo and Dobrcz, between 1964 and 2018, the losses in area were 27.0% and 27.2%, respectively. As in the case of Lake Borówno, a substantial decrease in the area of these two lakes was observed in the years 2012–2018.
Lake Borówno is characterised by a greater maximum depth than either Lake Kusowo or Lake Dobrcz, amounting to 14.1 m in 1964 (Table 4). According to the list of lake water level altitudes (Table 5), the water level of Lake Borówno is approximately 3 m higher than the water level of Kusowo and Dobrcz. Taking into account the depths of these lakes, it is visible that the basin of Lake Borówno is the deepest depression in the surrounding area. Its depth is located at an altitude of approximately 72.3 m a.s.l. (i.e., about 1.5 m lower than the deepest point of the basin of Lake Kusowo and 5 m lower than the bottom of Lake Dobrcz).
The altitudes of the water tables of the lakes recorded on cartographic materials from different periods indicate that between 1912 and 1964 (IRŚ measurements), the water levels of Lake Borówno and Lake Dobrcz did not change, while those of Kusowo decreased by 0.2 m. The total drop in the water levels of the lakes between 1912 and 2018 was 0.94 m for Lake Borówno, 1.25 m for Lake Kusowo, and 1.57 m for Lake Dobrcz. However, one should note that said drop occurred mostly between the years 1964 and 2018 (Table 5).
In Lake Borówno, in the period 1964–2018, the water level decreased by 0.94 m (Table 6), the surface area of the lake dropped by 4.74 ha (10.8%) and the volume of the lake reduced by 474.96 × 10³ m3 (14.4%). This decrease in depth mainly applies to the south-eastern part of the lake and fragments located along the southern shore (Figure 5). In this zone, the alluvial fan is visible in the lake basin in the mouth section of the tributary, which drains the arable land located south-east of Lake Borówno (Figure 5). Along the northern shore and in the northern part of the basin, the depth increased locally. The current bathygraphic curve of Lake Borówno (Figure 6) shows a slope break at the depths of 4 m, 10 m, and 12 m. The 0–4 m depth zone contains almost 48.1% of the lake’s water volume and the 0–10 m zone holds 93.2% of total water mass (Table 7). The deepest zone, below 10 m, contains only 6.8% of the total water mass of Lake Borówno.

4.3. Changes in Physical, Chemical, and Biological Properties of Water in Lake Borówno, 1984–2017

The course of water temperature during summer stagnation (Figure 7a) demonstrates the stratified character of Lake Borówno. The epilimnion included water masses up to 4–5 m in depth. A comparison of water temperature in subsequent years showed an increase in the temperature of the surface layer when comparing the year 1984 against other researched years of the last three decades. The metalimnion ended, on average, at a depth of 8 m and the temperature gradient within it was not high—between 1 and 2 °C. It can also be noted that the summer stratification that has emerged in recent years is incomplete (i.e., no hypolimnion is present). In the following years, the temperature of the benthic layers increased from approx. 6–7 °C in the 1990s to over 10 °C in 2002, 2009, and 2017. In 2009, water temperature at a depth of 2 m was lower than in the surface waters and the metalimnion (Figure 7a). This resulted from a considerable fluctuation in daily air temperature, which ranged from 16 to 23 °C on the days preceding data collection. Air temperature fluctuation thus translated into more notable differences in water temperature across the epilimnion, which in turn affected the content of oxygen (Figure 7b), whose solubility rises as water temperature drops.
A constant feature of the vertical oxygen content distribution in the vertical profile of Lake Borówno during the period of summer thermal stratification is the occurrence of oxygen deficits below the metalimnion (Figure 7b). The occurrence of hydrogen sulphide was recorded in the benthic zone as early as in 1992 (unpublished data from the VIEP in Bydgoszcz). Hydrogen sulphide was also detected in 2002, when the anaerobic zone covered 50% of the bottom surface area. The presented data show that in 1984, oxygen in water ranged between 1 and 3 mg·O2·dm−3 in the lake’s bottom zone (Figure 7b). It can also be observed that the years 1992, 2002, and 2017 were characterised by an increase in the thickness of the oxygen deficiency zone, which in those years covered water masses from the depth of 6–8 m to the bottom of the lake.
The analysis of the data from the following years shows an ambiguous trend in the seasonality of lake water transparency changes (Figure 8). In 1984 and 1992, greater water transparency was observed in spring than in summer, while in the following years, it reversed (transparency proved to be higher in summer). There is also a general tendency towards increasing transparency in the following years, except for the last year of observations (2017). Water transparency reached the maximum value of 3.5 m in 2009, while in 1992, it was only 1.2 m. The absolute maximum of 5.8 m was found in early summer of 2009 in the so-called “clean” water phase (VIEP Bydgoszcz, unpublished data).
Chlorophyll a displays a typical time distribution in Lake Borówno. The characteristic peak occurs in spring, while in summer, the trophogenic layer shows a lower concentration of this pigment (Figure 9), which is related to the decline of phytoplankton. This is due to the exhaustion of the pool of available biogenic nutrients affecting the growth intensity of algae and cyanobacteria. The concentration of chlorophyll a over the years showed fluctuations from 2.4 µg·dm−3 to 13.3 µg·dm−3, with a higher chlorophyll a content in the summer season compared to spring, except for 1984.
The value of phytoplankton biomass studied in 2009 and 2017 shows this biological parameter to have been stable. The amount of phytoplankton was 1.36 mg·dm−3 and 0.68 mg·dm−3 in spring and summer of 2009, respectively, and 1.39 mg·dm−3 and 0.25 mg·dm−3 in spring and summer of 2017, respectively. The analysis of phytoplankton composition in the summer months, in relation to the quantitative share of cyanobacteria, indicated that the share of this taxon was marginal and in 2002, 2009, and 2017, it ranged around 4–5% (unpublished data from the VIEP in Bydgoszcz). Ceratium hirundinella was present at all times in the summer. In 2002, large proportions of Chlorophyta accounting for 58.5% and Pyrrophyta accounting for 35.4% of the phycoflora composition were recorded. The Chlorophyta was also found to be an important element of the lake’s phycoflora in the remaining years.
In the case of total phosphorus concentrations, a significant decrease was recorded in successive years (Figure 10). The maximum value of 0.194 mg·dm−3 for phosphorus was found in spring 1984 and the minimum value of 0.015 mg·dm−3 in summer of 1992. In all the study years, higher contents of this element in water were recorded in spring, rather than in summer (Figure 10). In spring, the main share in total phosphorus was represented by phosphates, whose concentrations in the surface layer were 0.13 mg·dm−3 in 1984, 0.023 mg·dm−3 in 1992, 0.04 mg·dm−3 in 2002, and ≤0.016 mg·dm−3 in 2009 (unpublished data from the VIEP in Bydgoszcz). The concentration of phosphates in the hypolimnion was 0.09 mg·dm−3 in 1992, 0.25 mg·dm−3 in 2002, and 0.03 mg·dm−3 in 2009. It is therefore evident that export of this element from the sediments occurred only once, in 2002.
Total nitrogen concentration in the studied lake ranged between 1.05 mg·dm−3 in spring and 1.85 mg·dm−3 in the summer of 1992 (Figure 11). In the first two years (1984 and 1992), nitrogen concentrations were higher in summer than in spring (Figure 11). In subsequent years (2002, 2009, and 2017), the level of nitrogen, as with phosphorus, was higher in spring than in summer. Since 2002, a stable low level of total nitrogen has been observed. However, one should note that in previous years, the highest values of total nitrogen were observed (Figure 11). Nitrate concentrations in Lake Borówno in individual spring periods were as follows: 1984—0.12 mg·dm−3, 1992—0.32 mg·dm−3, 2002—0.54 mg·dm−3, 2009—0.09 mg·dm−3, and 2017—0.23 mg·dm−3. Studies on ammonium nitrogen concentration in the hypolimnion indicate that the amount of ammonium nitrogen increased significantly from 0.49 mg·dm−3 in 1992 to 2.58 mg·dm−3 in 2002, and decreased to 0.31 mg·dm−3 in the next studied year, 2009 (unpublished data from the VIEP in Bydgoszcz).
As mentioned before, the samples were taken in 2002 in Lake Borówno tributaries, because in 2002, flowing water was observed in these streams. The chemical parameters of the tributary waters flowing into Lake Borówno examined in 2002 indicate an increased nitrate content in the north-eastern tributary (No. 1 in Figure 2). The nitrate concentration was 6.60 mg·dm−3 in tributary 1, while in tributary 2, it was only 0.80 mg·dm−3. In light of the provisions of the Nitrates Directive [73], such concentrations are believed to present no risk of nitrogen pollution in waters of agricultural origin. In the north-eastern and south-eastern tributaries, the study revealed an increased content of organic matter, determined as chemical oxygen demand. It amounted to 52.0 mg·O2·dm−3 and 71.0 mg·O2·dm−3, respectively. Such concentrations may represent the result of an inflow of humic substances. According to the VIEP archive, in the next years, the inflow in tributaries was sporadic.

5. Discussion

5.1. Changes in Lake Morphology and Water Resources

The increase in air temperature in Poland in the second half of the 20th century slightly exceeded 0.2 °C per 10 years [74,75]. However, the increase within the study area was higher compared to other regions and amounted in Toruń to 0.31 °C per 10 years [76]. In the study area, as in other parts of Poland [77], no reduction in annual sums of precipitation was observed in the second half of the 20th century or the first two decades of the 21st century. However, Radzka [37] indicates an increasing frequency of negative climatic balances in the growing seasons of 1971–2005, which increased the extent of Poland’s dry zone, those areas characterised by climate balance ranges from −90 mm to −120 mm [77]. Meanwhile, calculations by Meresa et al. [78] showed a large discrepancy between the results of calculations of drought indicators that only take climate parameters into account, and the Standardised Runoff Index, which can be used to identify hydrological drought [78]. The calculations by the cited authors indicate that, in the Narewka lowland catchment in 1971–2000, the drought index calculated on the basis of outflows indicated hydrological drought in most of the studied years from the period 1984–2000. These results differ significantly from those for drought calculated based on precipitation, or on precipitation and evapotranspiration. The occurrence of hydrological drought in recent decades has also been confirmed by studies of other lowland basins of Poland, which recorded that underground outflow fell in the second half of the 20th century [79], and total outflow fell within smaller catchment areas [80] as well as in the lowland left-bank catchment of the Vistula River [81].
Similar to those areas above-mentioned, Lake Borówno and its catchment are subject to considerable transformations in terms of hydrological conditions. As demonstrated in this study, a significant reduction in surface area, paired with a lowering of the water table, was recorded in Lake Borówno as well as in the neighbouring Lakes Kusowo and Dobrcz. This process intensified particularly in the second decade of the 21st century, when the reduction in surface area was comparable to that of the previous 45 years and the drop in water table more than doubled. Comparison of the obtained values with the rate of lake disappearance in different regions of Poland indicates that the decrease in the surface area of Lake Borówno is similar, while Lakes Kusowo and Dobrcz displayed larger-than-average decreases in area over a period of about 50 years, as calculated by Choiński [82], amounting to 9.6% and 9.98% for the Pomorskie Lake District and the Mazurskie Lake District. The rate of lake surface area decline in Poland is very diverse, and in the perspective of the next 100 years may, in extreme cases, reach even several dozen percent of the initial area [29,39,83,84,85]. The authors above-mentioned emphasise that the process of lake surface reduction depends on many natural and anthropogenic factors, and therefore each lake should be analysed individually. In the case of many lakes, the process of progressive disappearance associated with a decrease in surface area and water table lowering has accelerated significantly in the 21st century. It is related to an increase in air temperature [39,84], which causes higher potential evaporation [76]. Annual potential evaporation in the research area in the years 1952–2018—measured at the meteorological station in Toruń—increased by 183.9 mm [76]. The authors found that the highest increase occurred in the spring (March–May) and summer (July–September). Moreover, an increase in the differences in evaporation between the Baltic sea coast and inland regions was observed in the years 1952–2018. Therefore, the lakes located further away from the Southern Baltic Coastlands such as Lake Borówno, may be highly exposed to climate-driven water level changes.
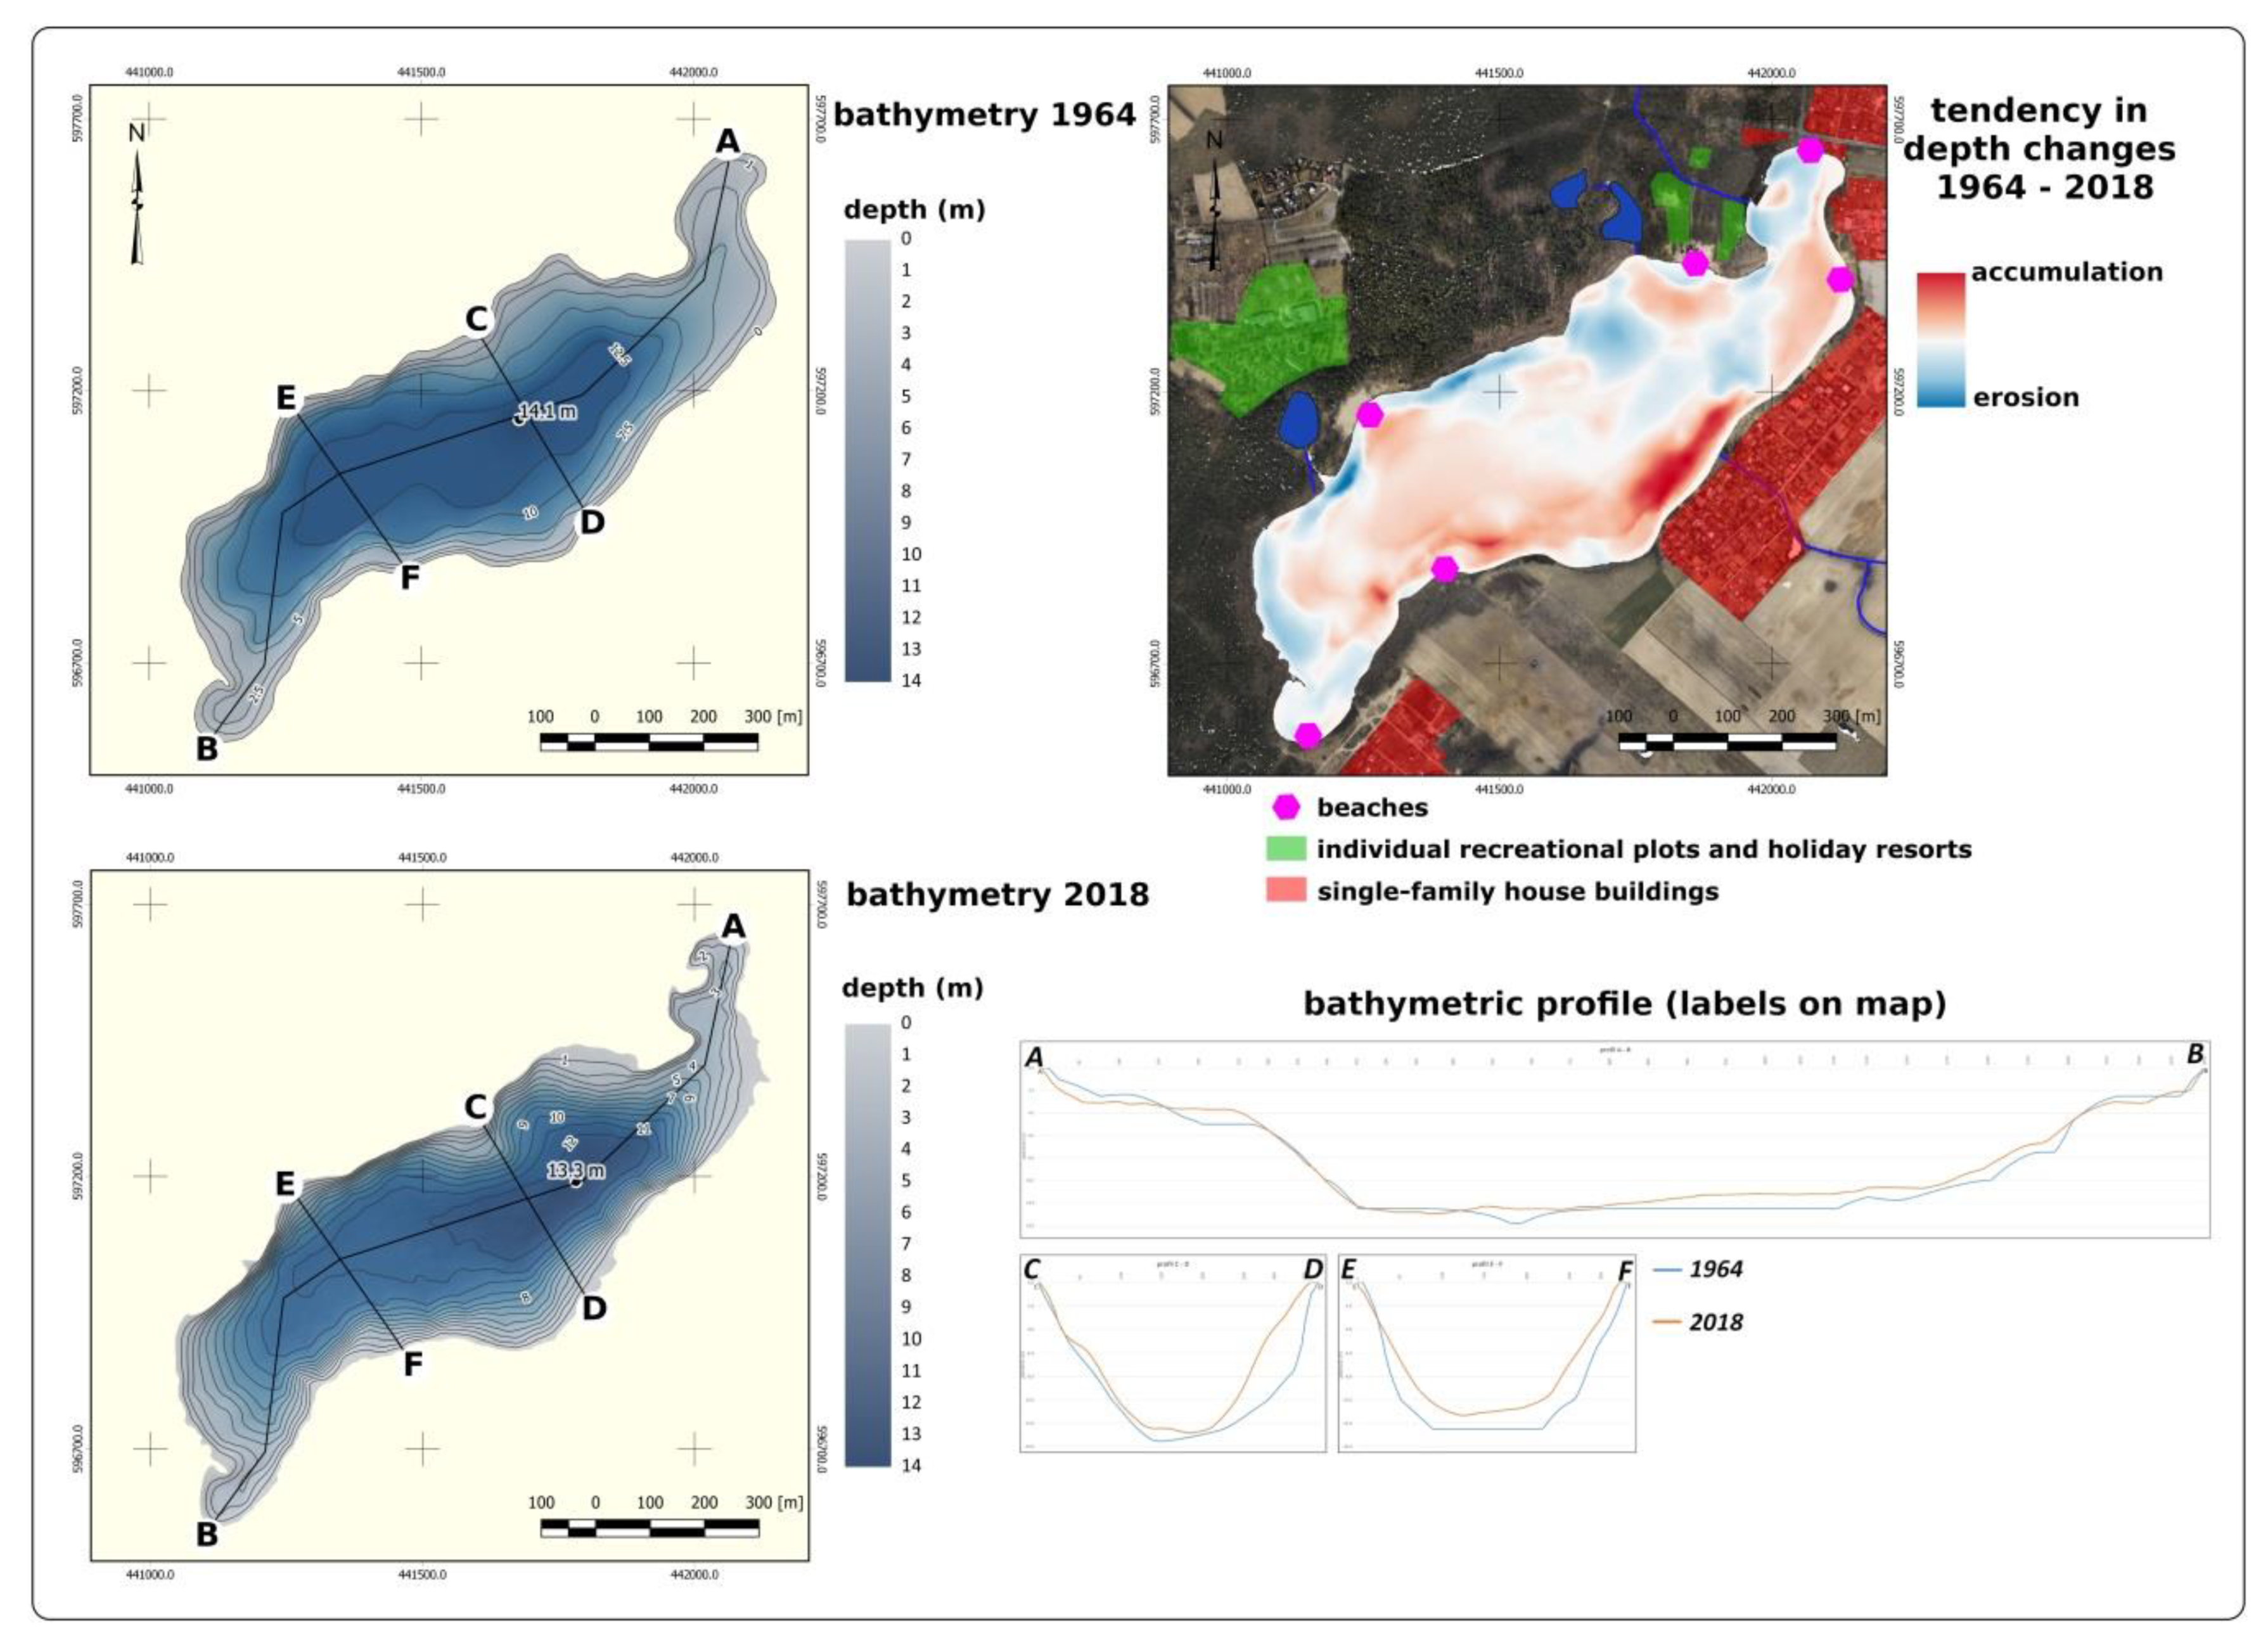
A graphic representation of the differences in depth of Lake Borówno between 1964 and 2018 (
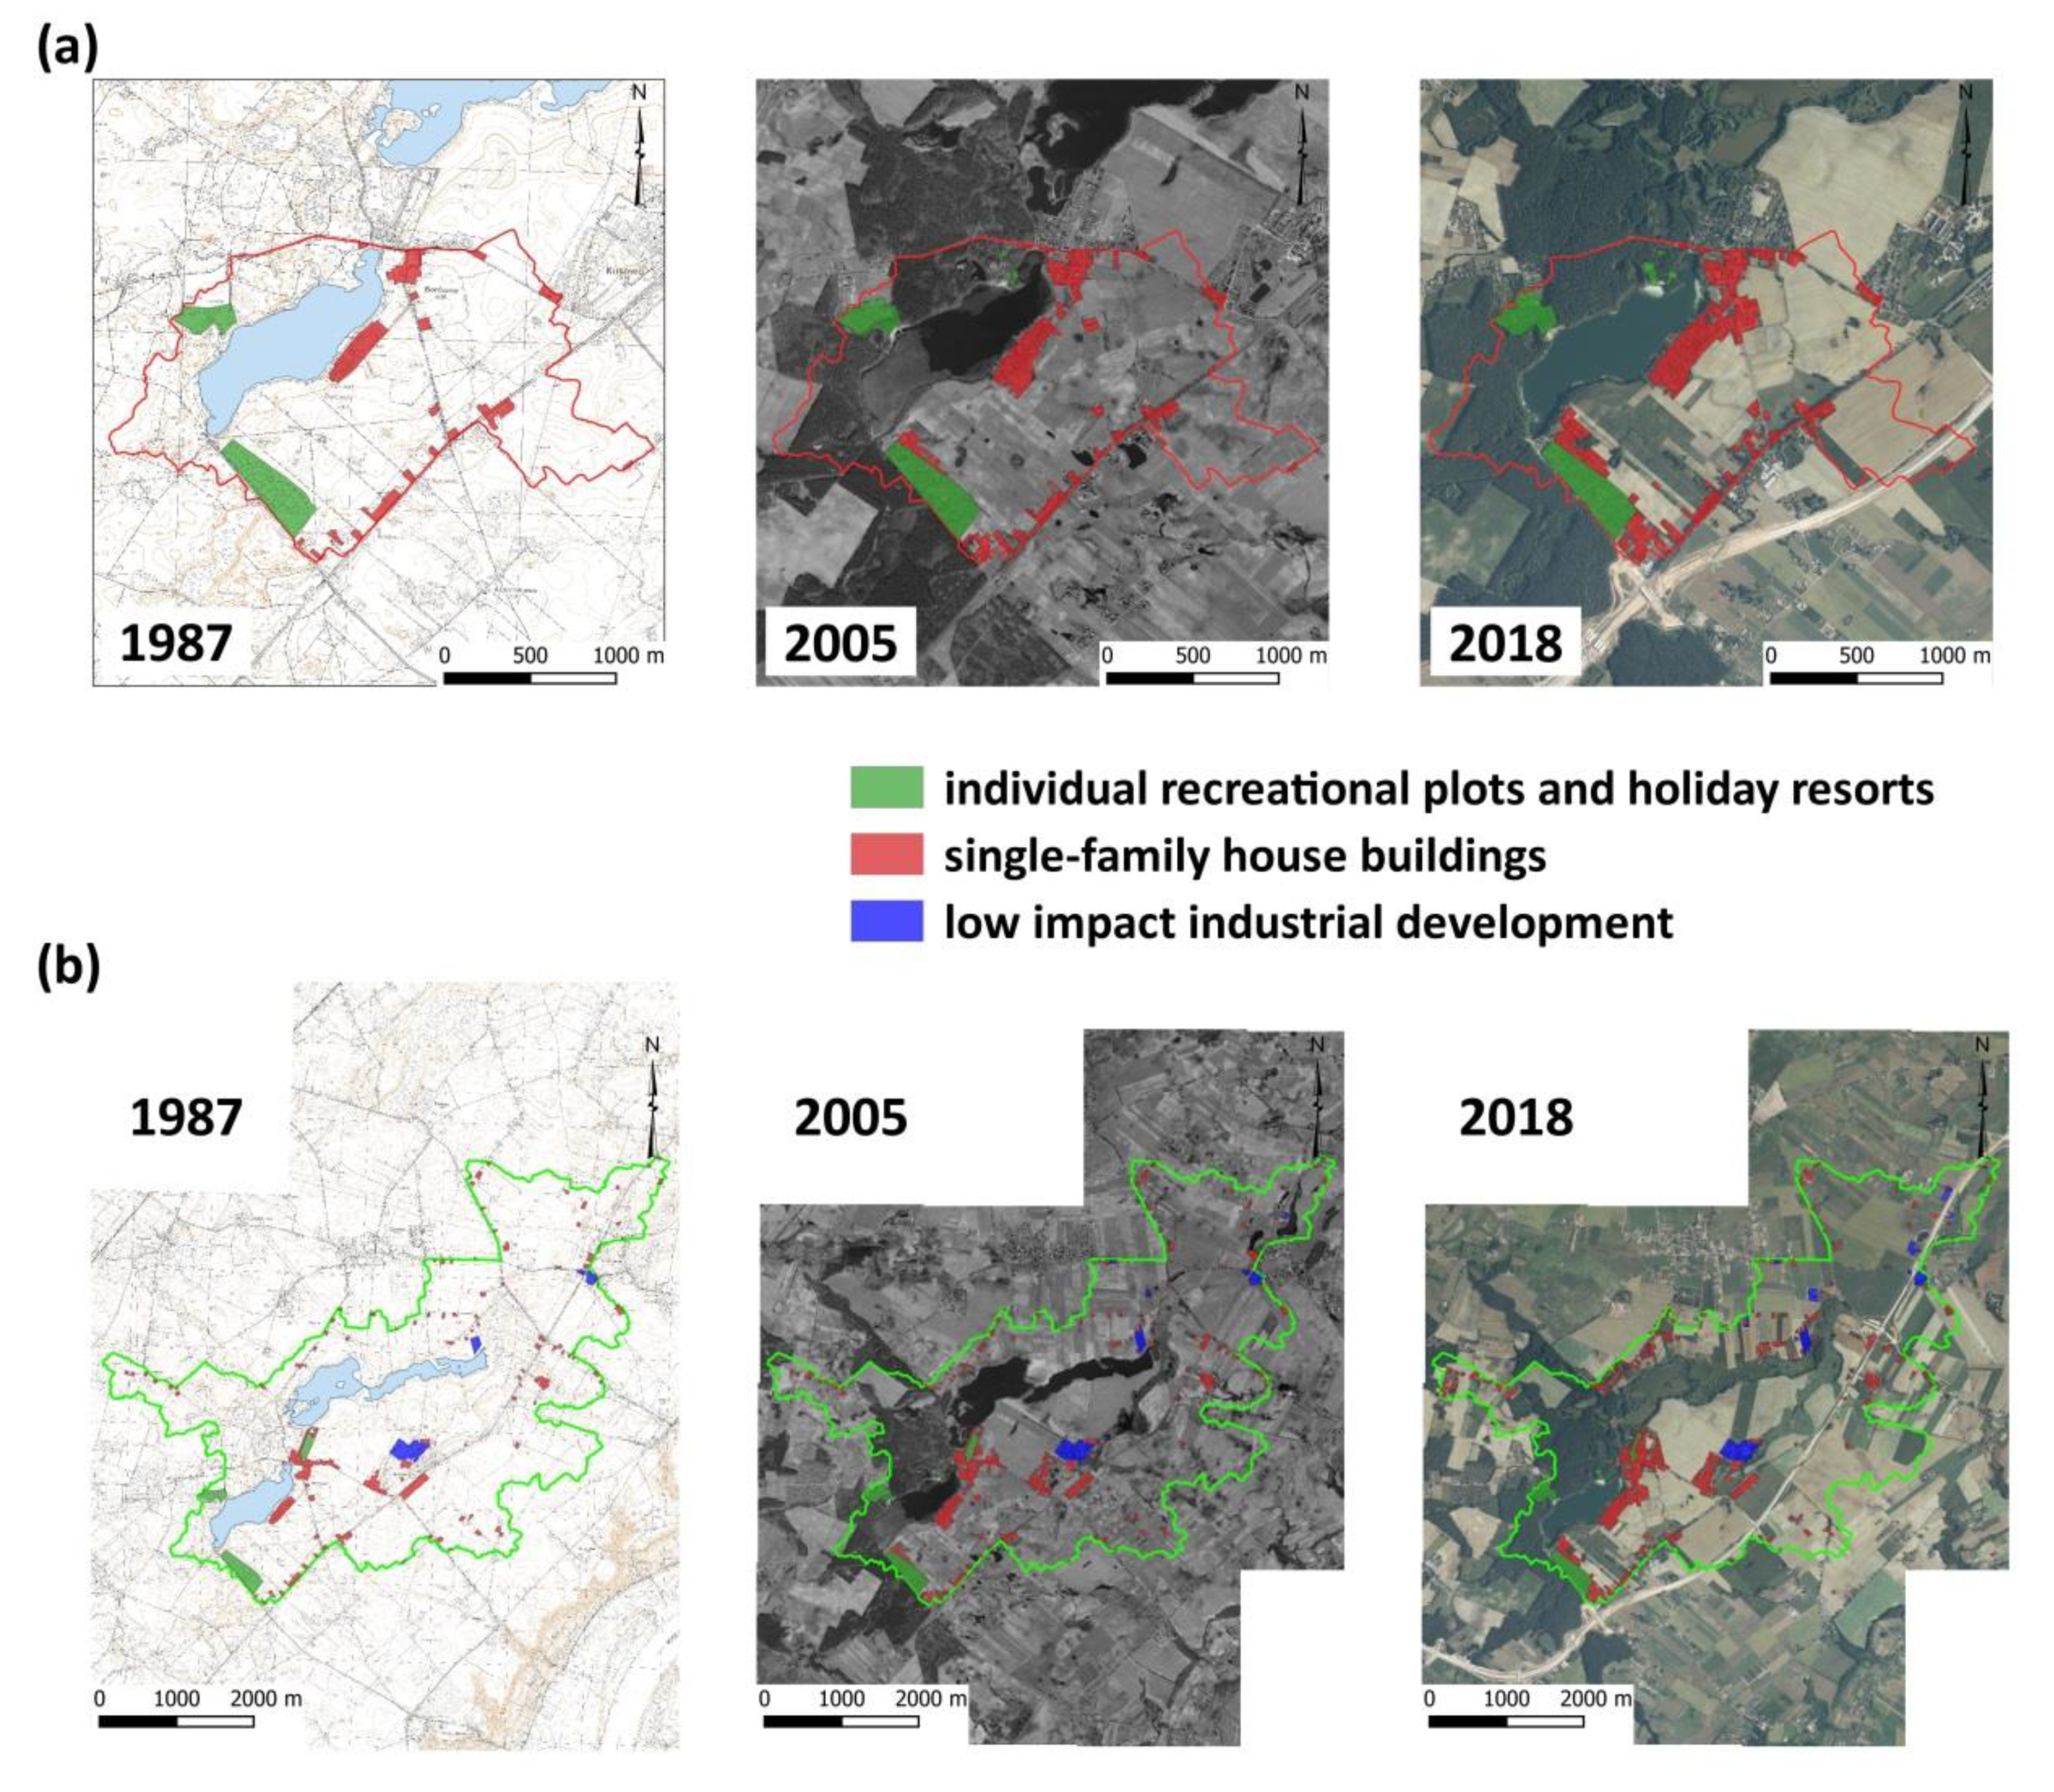
Figure 5) indicates that shallowing has occurred together with a lowering of water level. The lake shallowed most along the south-eastern shore (i.e., where it borders agricultural areas), single-family housing areas, and allotment gardens. On this shore, there are three tributaries that can supply mineral material and organic matter from agricultural areas to the eastern and north-eastern parts of the lake. The results presented in Figure 5 compared with field observations performed in 2018 indicate that beaches may constitute the source of supply of sandy material, which caused shallowing of the selected sections of the lake’s shore. This phenomenon was observed both in the area of holiday resorts and the so-called “wild” beaches used by local residents and allotment garden owners. Along the shore sections used as public beaches, there are zones of considerable size that are devoid of vegetation cover, which may explain the supply of mineral material to the lake basin. The map of depth differences (Figure 5) indicates that the shallowing of the shore zone in comparison to 1964 also occurred near the beach in the proximity of other beaches. The accumulation of material can be also observed in deeper parts. It is possible that this is due to the movement of material from the shore zone to the deeper parts of the lake basin as a result of works to maintain bathing areas. Another potential source of sandy material accumulated in the lake derives from the relatively rapid exposure of lakeshore caused by the lowering of its water level. It should be emphasised that the intense tourist pressure and heavy use of beaches on Lake Borówno in recent decades is also conditioned by climatic factors. Summer heat waves intensify the use of beaches and lakes by weekend tourists.
The lowering of the water table by 0.94 m between 1912 and 2018 at Lake Borówno shows that water resources in its catchment area are diminishing. The significantly greater lowering of the water table observed at the two remaining lakes—Kusowo and Dobrcz—results from their smaller depth and lack of contact with the main usable aquifer supplying Lake Borówno. Lakes of greater depths act as hydrogeological windows, allowing surface waters to contact deeper aquifers [86,87,88]. Despite its more favourable supply conditions associated with deeper drainage, Lake Borówno lost 10.8% of its surface area and 14.4% of its water volume between 1964 and 2018. In the light of the research regarding changes in the water table within the two usable aquifers in the area [
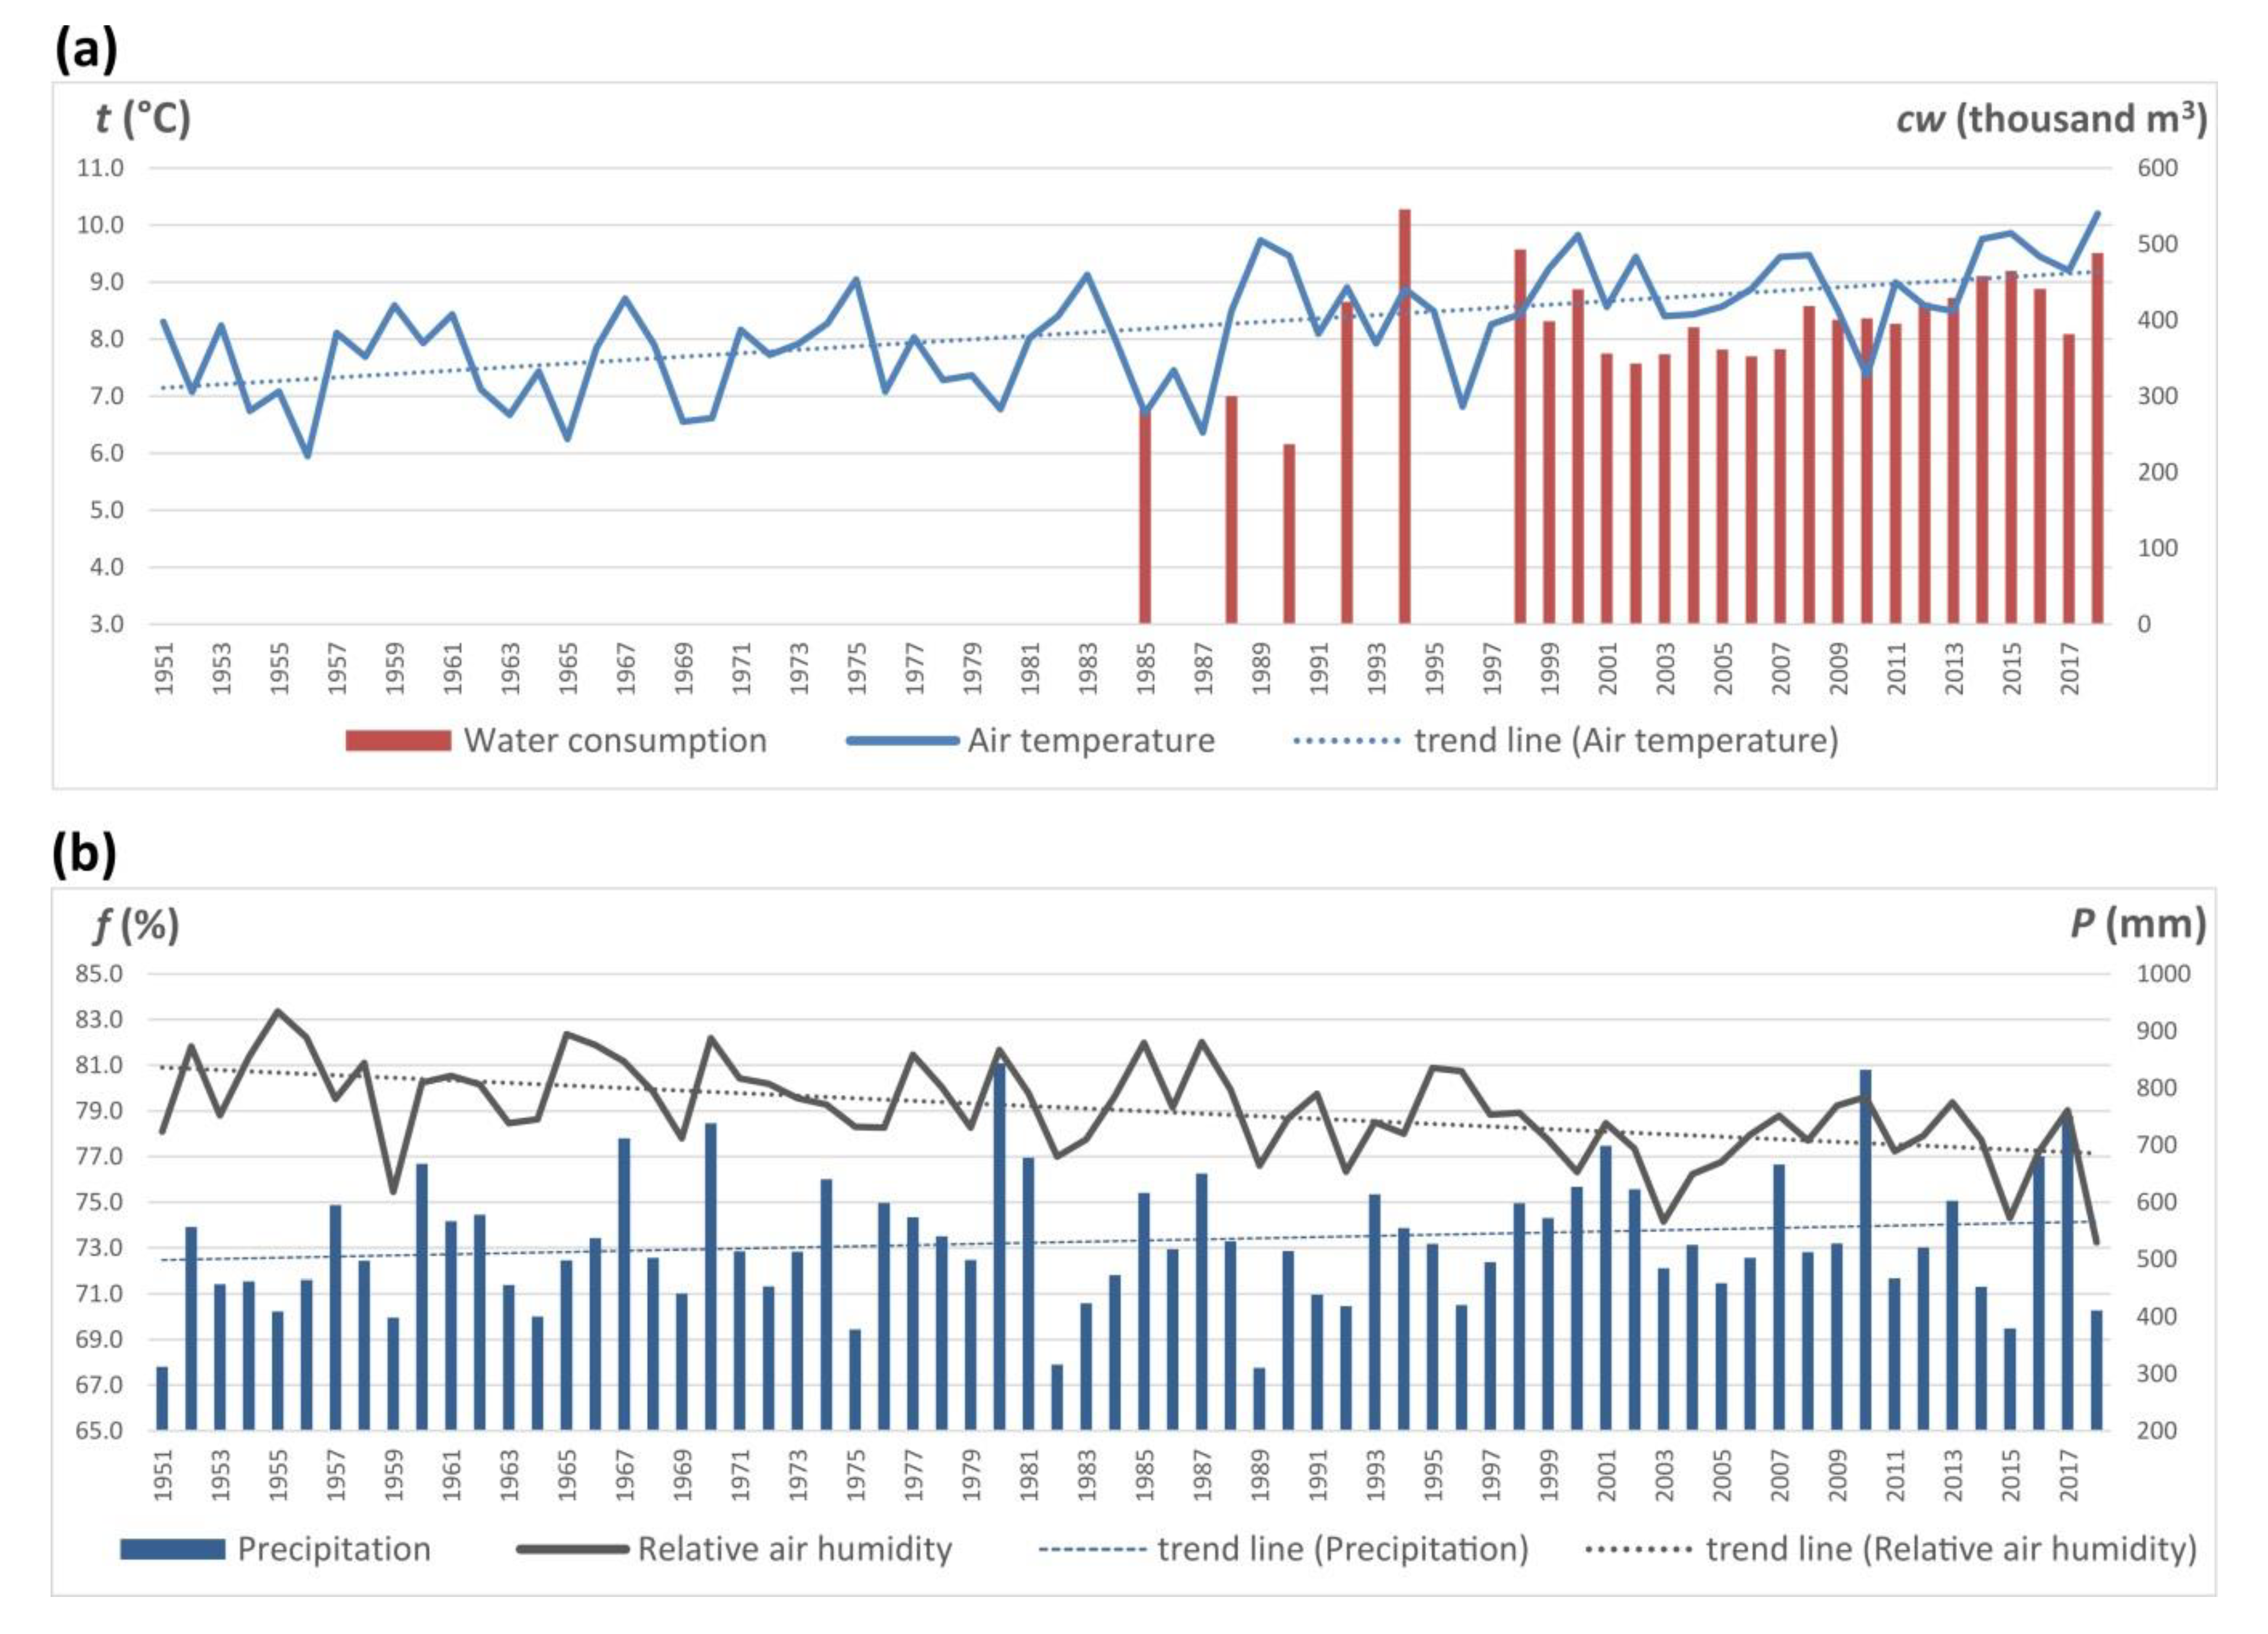
66], it can be assumed that the deteriorating climatic conditions coincided with intensified use of groundwater (Figure 3). In particular, the depletion of the main usable aquifer, which does not have a high capacity to recover, may permanently change water relations in the study area. This aquifer is intensively exploited as a result of the expansion of municipal waterworks, and estimates show that it will be several years before precipitation water infiltrates back into this aquifer [66]. Since the 1970s, there has been a local lowering of the water table in the main aquifer of several dozen centimetres (up to a maximum of 1.4 m). This shows a steady trend of diminishing resources as well as indicating large-scale and long-term exploitation of groundwater in this usable aquifer [66]. Groundwater resource depletion can also be related to the use of these waters in individual intakes; for example, for watering allotment gardens or greenhouse crops [
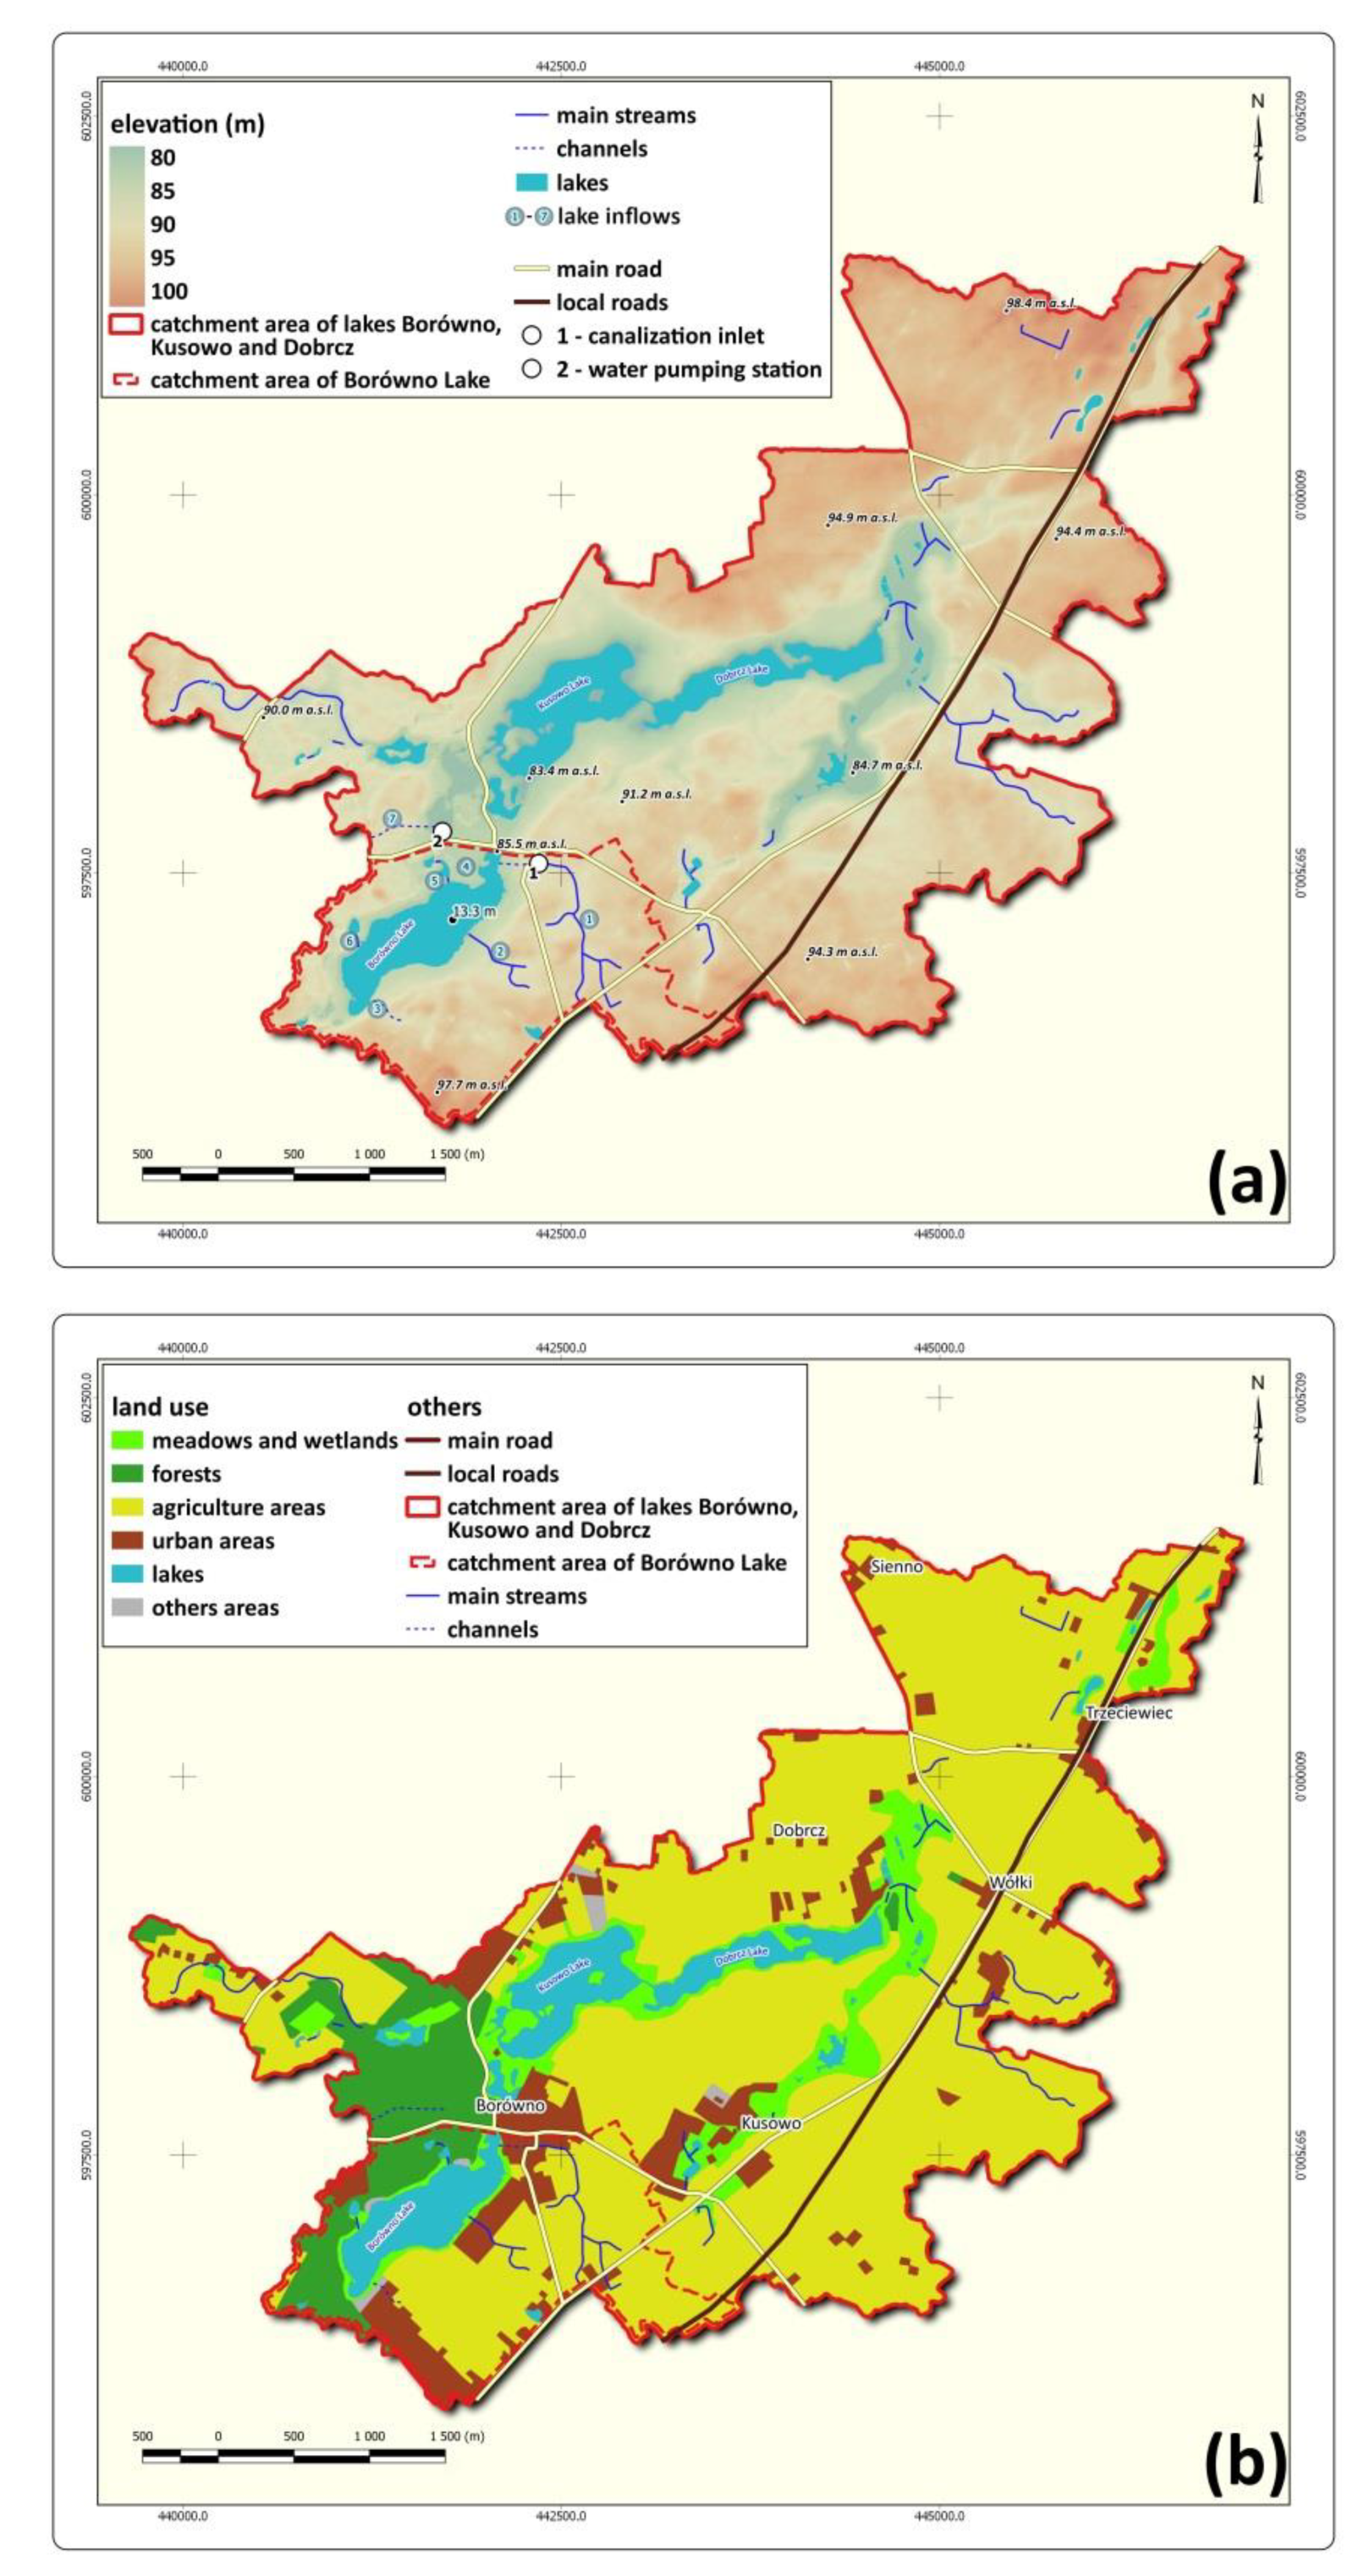
89]. In the case of Lake Borówno, an additional adverse factor increasing the risk of water resources depletion and lake water level decrease is the catchment area’s location near the edge of the Vistula River valley. As indicated by hydrological surveys carried out in the catchment area of the Wda—a left-bank tributary of the Vistula River—sections of this catchment area located near the edge of the Vistula River valley are characterised by a lower outflow volume than the areas located further from this edge [90,91]. This is due to the draining influence of the deep Vistula River valley. Similar conclusions were reached by Glazik and Pius (2007) [92] in their study pertaining to the Vistula River section between Toruń and Tczew. The cited authors found that the Vistula River is fed by deep circulation groundwaters in this section, and the edges of the valley are a place of heavy drainage of these waters. The location of Lake Borówno in the edge zone may additionally influence the stronger reaction of groundwater to changes in climatic conditions and the increase in exploitation.
A decrease in water level in lakes resulting from increased evaporation caused by heat waves recorded in the summer of 2018 was also observed in other parts of Europe including England [93]. However, instead of focusing on the losses in water resources per se, a number of European countries became alarmed with the coinciding losses in agriculture [94], which translated, among other things, into less restrictive approaches to protecting water resources and their use for irrigation [95]. Toreti et al. [96] indicated that the drought of 2018 proved to affect a considerable portion of Europe. However, having analysed seven climate scenarios, the authors anticipate that droughts of comparable severity will occur more frequently in the 21st century, and may in fact become the norm in the 2050s. At the same time, the increased demand for potable water and prioritisation of agriculture in the course of the drought of 2018 [95,97] suggest that the observed reaction of lakes to drought may constitute a combined result of diminishing water resources and increased use of basin water. Lake Borówno demonstrated a considerable drop in the water table in the second decade of the 20th century and, in light of the scenarios presented by Toreti et al. [96] and Meresa [98], we may anticipate that such hydroclimatic conditions will be recurring. The map presented by Feyen and Dankers [
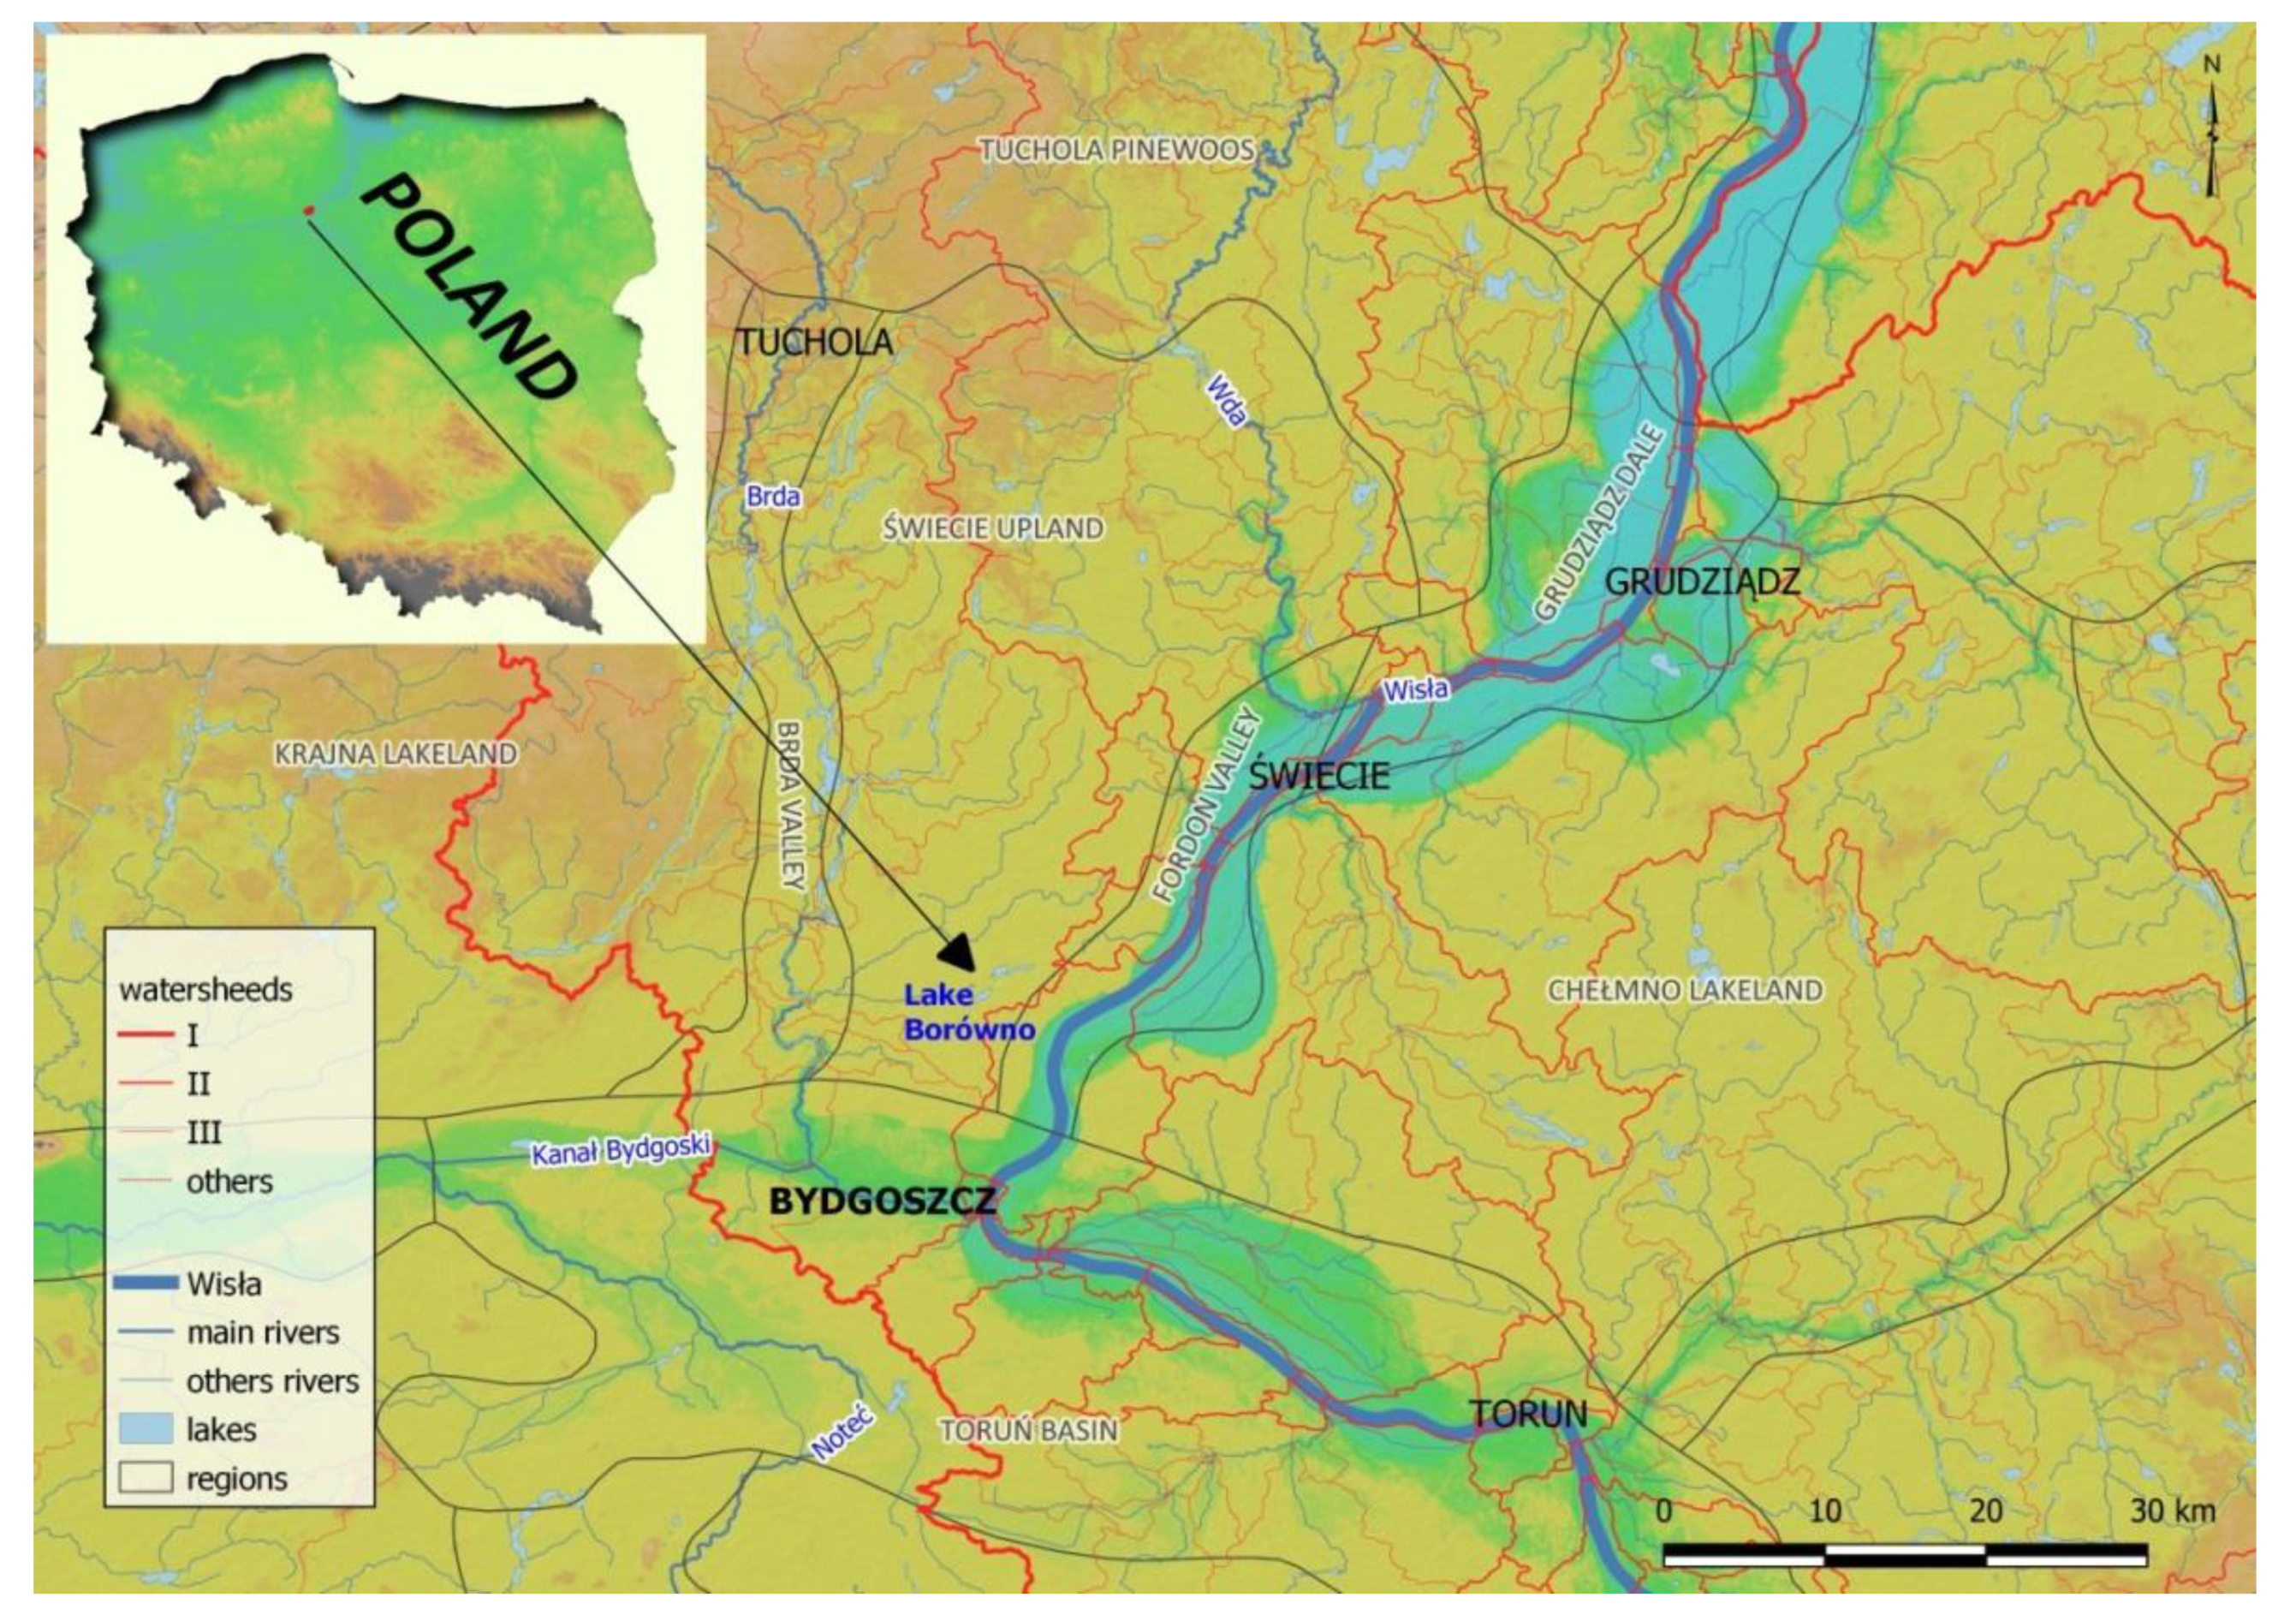
35] shows that the research area and the whole territory of Poland is at the edge of an area covering southern and south-western Europe, which in the 21st century will suffer from an outflow deficit. Furthermore, taking into consideration that Lake Borówno is located in the suburban area of Bydgoszcz, it constitutes an attractive location for settlement as well as for seasonal migration of citizens during hot summer days, which is particularly true for the owners of nearby allotment gardens. Therefore, we may expect further growth of anthropopressure and increasing water consumption. Water use has been indicated as a factor intensifying hydrological drought by, among others, Wada et al. [40] as well as Wanders and Wada [41]. Taking into consideration the accelerated problems with drought caused by forecasted climate warming and accompanying water demand, Van Loon argues that future studies on droughts should concentrate on four key tasks, one of which involves “moving to including the human aspects of hydrological drought”. He also advocates the concept of “socio-hydrology”, a new science of people and water introduced by Sivapalan et al. [99]. Moreover, in the second decade of the 21st century, the International Association of Hydrological Sciences (IAHS) identified a new important field of research related to the link between hydrological drought and society [100]. As noticed by Arnell et al. [101], the current state of knowledge pertaining to the impact of climate change on water management is largely insufficient. Therefore, in recent years, an effort has been made in Poland to develop a six-year nationwide programme known as the “Drought Effects Counteracting Plan” (2021–2027) [102]. In this programme, several dozen of retention works are planned to increase the retention in areas most exposed to drought including central Poland.

5.2. Factors Affecting Water Quality

The chemical status of the water in the lake is shaped by a number of factors that are related to the lake itself and its catchment area [103]. The assessment of the susceptibility of Lake Borówno to eutrophication [104] showed that in terms of catchment criteria, the lake represented the second group of catchment area susceptibility. This means that “the catchment area is characterised by a low susceptibility to activation of the load deposited in its area and a low possibility of it reaching the lake”. Such an assessment results, among other things, from the low slope gradients within the lake’s catchment area and the only periodical functioning of the small watercourses supplying them and draining the agricultural areas. However, the observed lowering of the water level in Lake Borówno may determine the ecological type of the lake and the rate of eutrophication. A change in the parameters of average depth, water stratification percentage, and active bottom surface area decreases the lake’s resistance to external factors [105].
As shown above, in the second half of the 20th century, changes shaping the lake’s water resources occurred, which resulted in a decrease in the water level, surface area, and depth of the lake. These changes may be the cause of the observed shifts in the thermal stratification of Lake Borówno. According to Piasecki and Skowron (2014) [29] and Magee and Wu (2017) [106], changes in lake stratification, which depend mainly on the type of lake basin and its depth, are strongly related to climate change. Reduction of the maximum depth of Lake Borówno and lowering of the water table results in incomplete summer stratification (lack of hypolimnion) and the water temperature in the entire profile is higher in the 21st century than in the 20th century. Results presented by Woolway et al. [107] in relation to 20 lakes in Central Europe show an increasing trend in lake surface water temperature in the past 50 to 100 years, with the most notable growth reported in the late 1980s. Studies concerning individual lakes show that, despite the fact that the trend concerning changes in surface water temperature in Europe appears to be uniform, the processes related to heat transport within lakes tend to vary on a lake-by-lake basis [108,109,110]. Increased supply of heat to the surface layer of water accompanied by lower wind intensity may increase the temperature difference between the epilimnion and the hypolimnion [108]. Lake Borówno displays a rise in temperature across the entire vertical profile; however, we also observed an increase in the difference between surface water temperature and hypolimnion. Moreover, similar to Upper Raduńskie Lake [108], but unlike Lake Geneva [
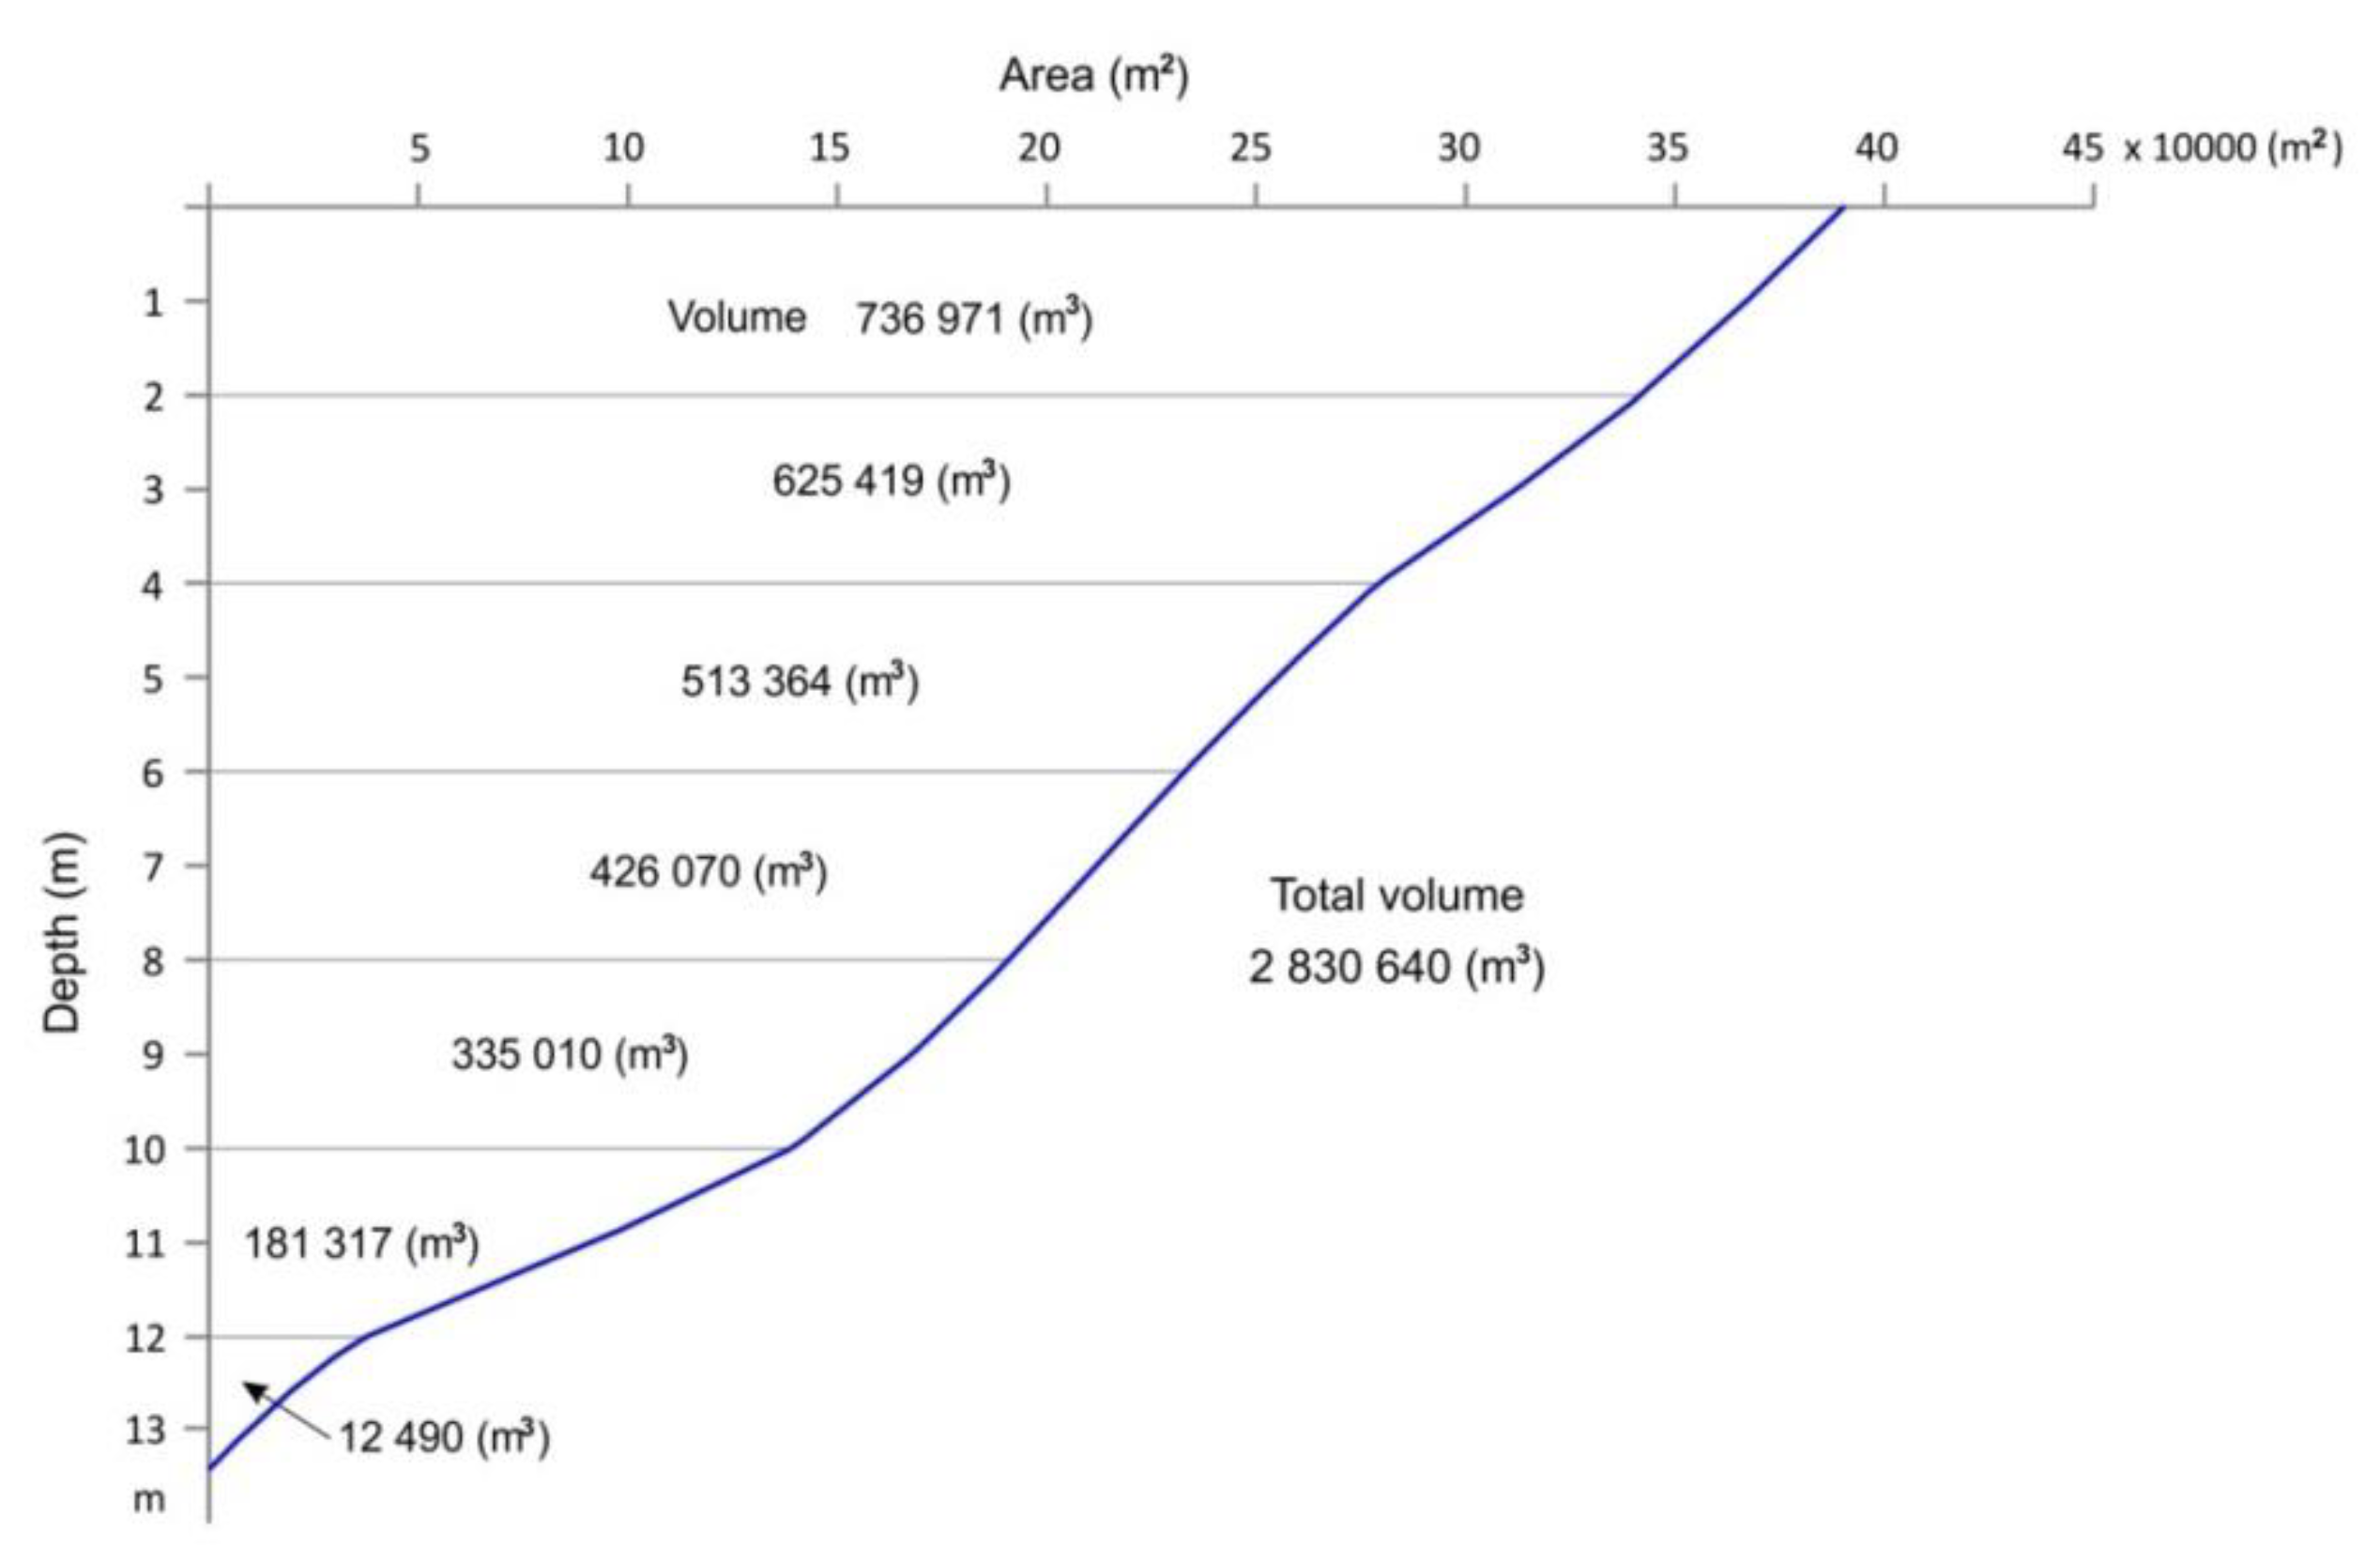
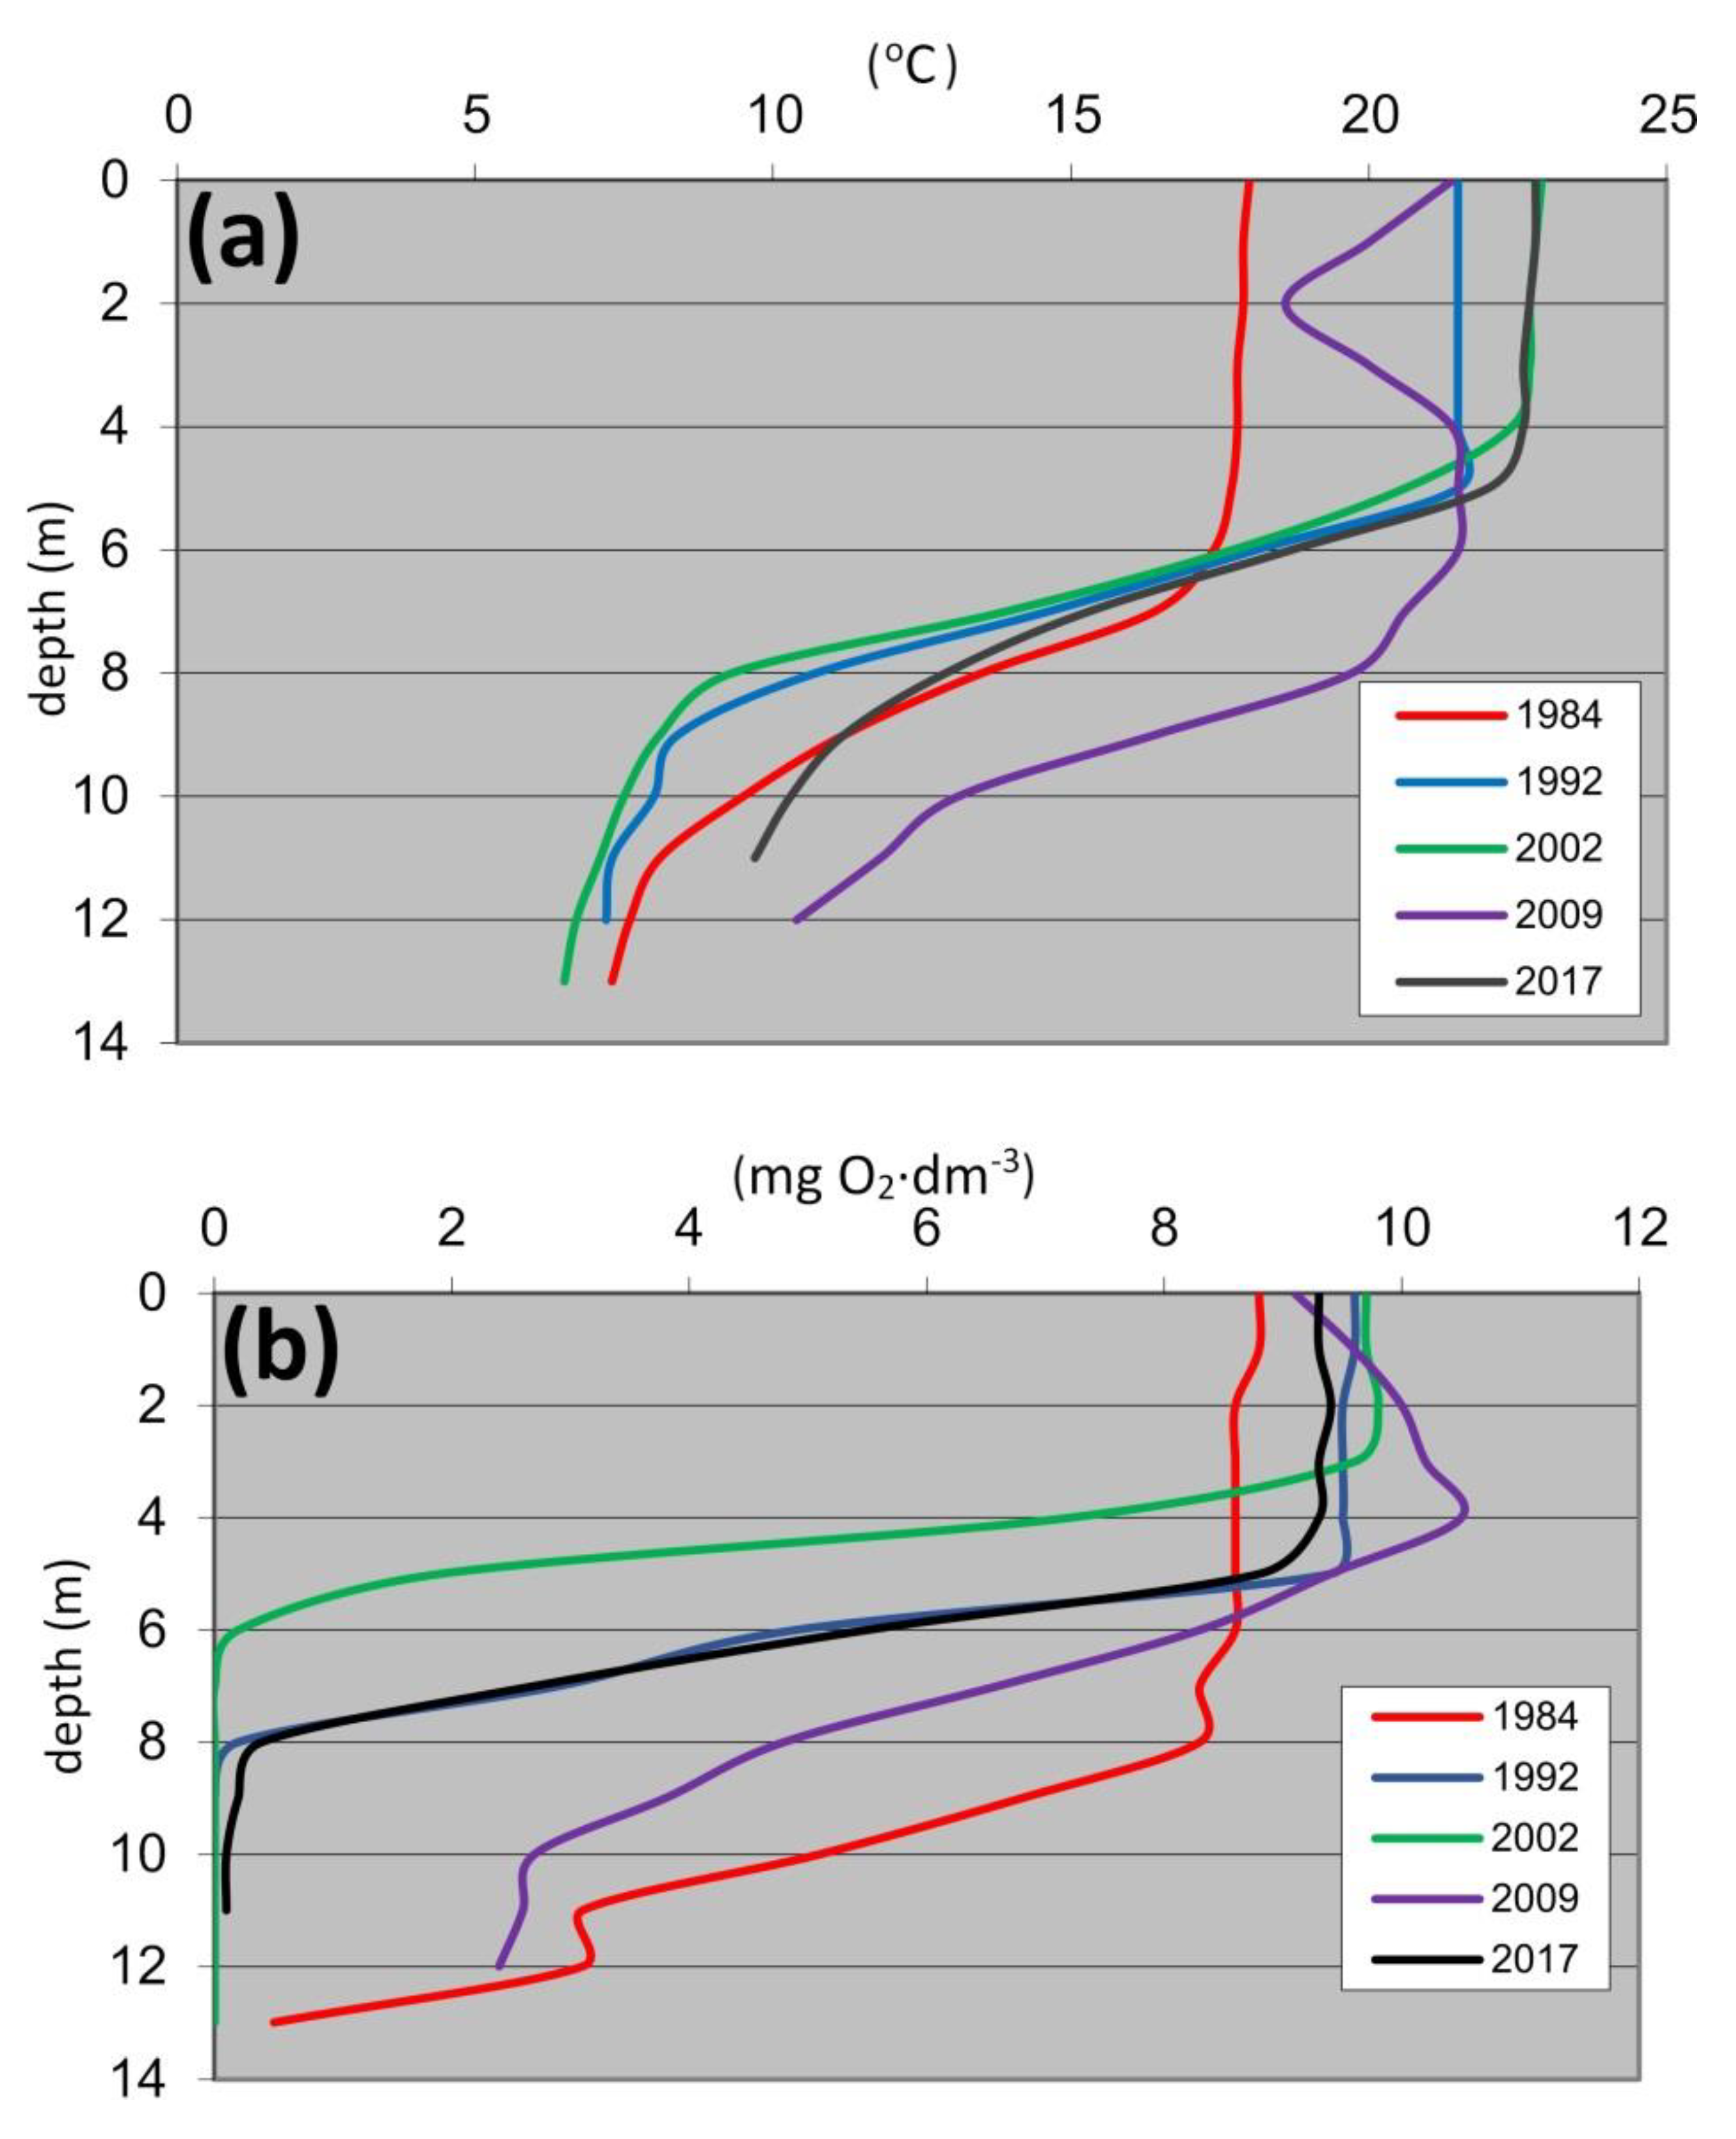
109], the depth of the thermocline was observed to have decreased. However, it should also be noted that the shallow zone’s high share in total lake volume means that currently heated surface layers of 4–6 m deep and a temperature of 20–23 °C account for as much as 66.7% of water by volume, while only about 7% by volume are colder waters at depths of over 8 m, with a temperature reaching 7–11 °C during summer stratification (Figure 7a, Table 7). It is often emphasised that an increase in surface water temperature in mixed lakes results in greater stability of water masses within the lake related to briefer water mixing and a longer duration of stratification in summer [106,108,111,112]. Moreover, changes in vertical mixing within the water column constitute an important factor changing the availability of nutrients and light [113,114].
The decrease in the depth of the lake and its high stability of water masses also entails changes in relation to oxygen distribution. The anoxia observed in Lake Borówno at the depth of 6–14 m (Figure 7b) may be a result of changes in heat distribution within the lake water as well as processes related to the decomposition of organic matter. An increase in water temperature results in a reduced capacity to dissolve oxygen, especially in relatively warm benthic layers [115]. Moreover, a prolonged period of summer stratification and shorter period of water mass mixing could worsen conditions for oxygen delivery, and also exacerbate seasonal oxygen deficiency in the bottom water [116]. In the case of the analysed period, one may note that in the years featuring the occurrence of bottom zone anoxia, the mean annual air temperature was relatively high, and in the years 1992, 2002, and 2017 amounted to 8.9 °C, 9.4 °C, and 9.2 °C, respectively (Figure 3a). In the years 1984 and 2009, in turn, it was lower: 8.0 °C and 8.5 °C. It should be stressed that Wiśniewska and Paczuska also did not observe any oxygen deficit in Lake Borówno in the year 2009 [117], when the mean annual temperature was lower than in the years when the above-mentioned occurrence was recorded. Due to the limitation of existing data, in order to provide a detailed analysis pertaining to the susceptibility of Lake Borówno to eutrophication and the potential risk of anoxia, further research is required, particularly in terms of the contents of carbonates in the spring–autumn cycle.
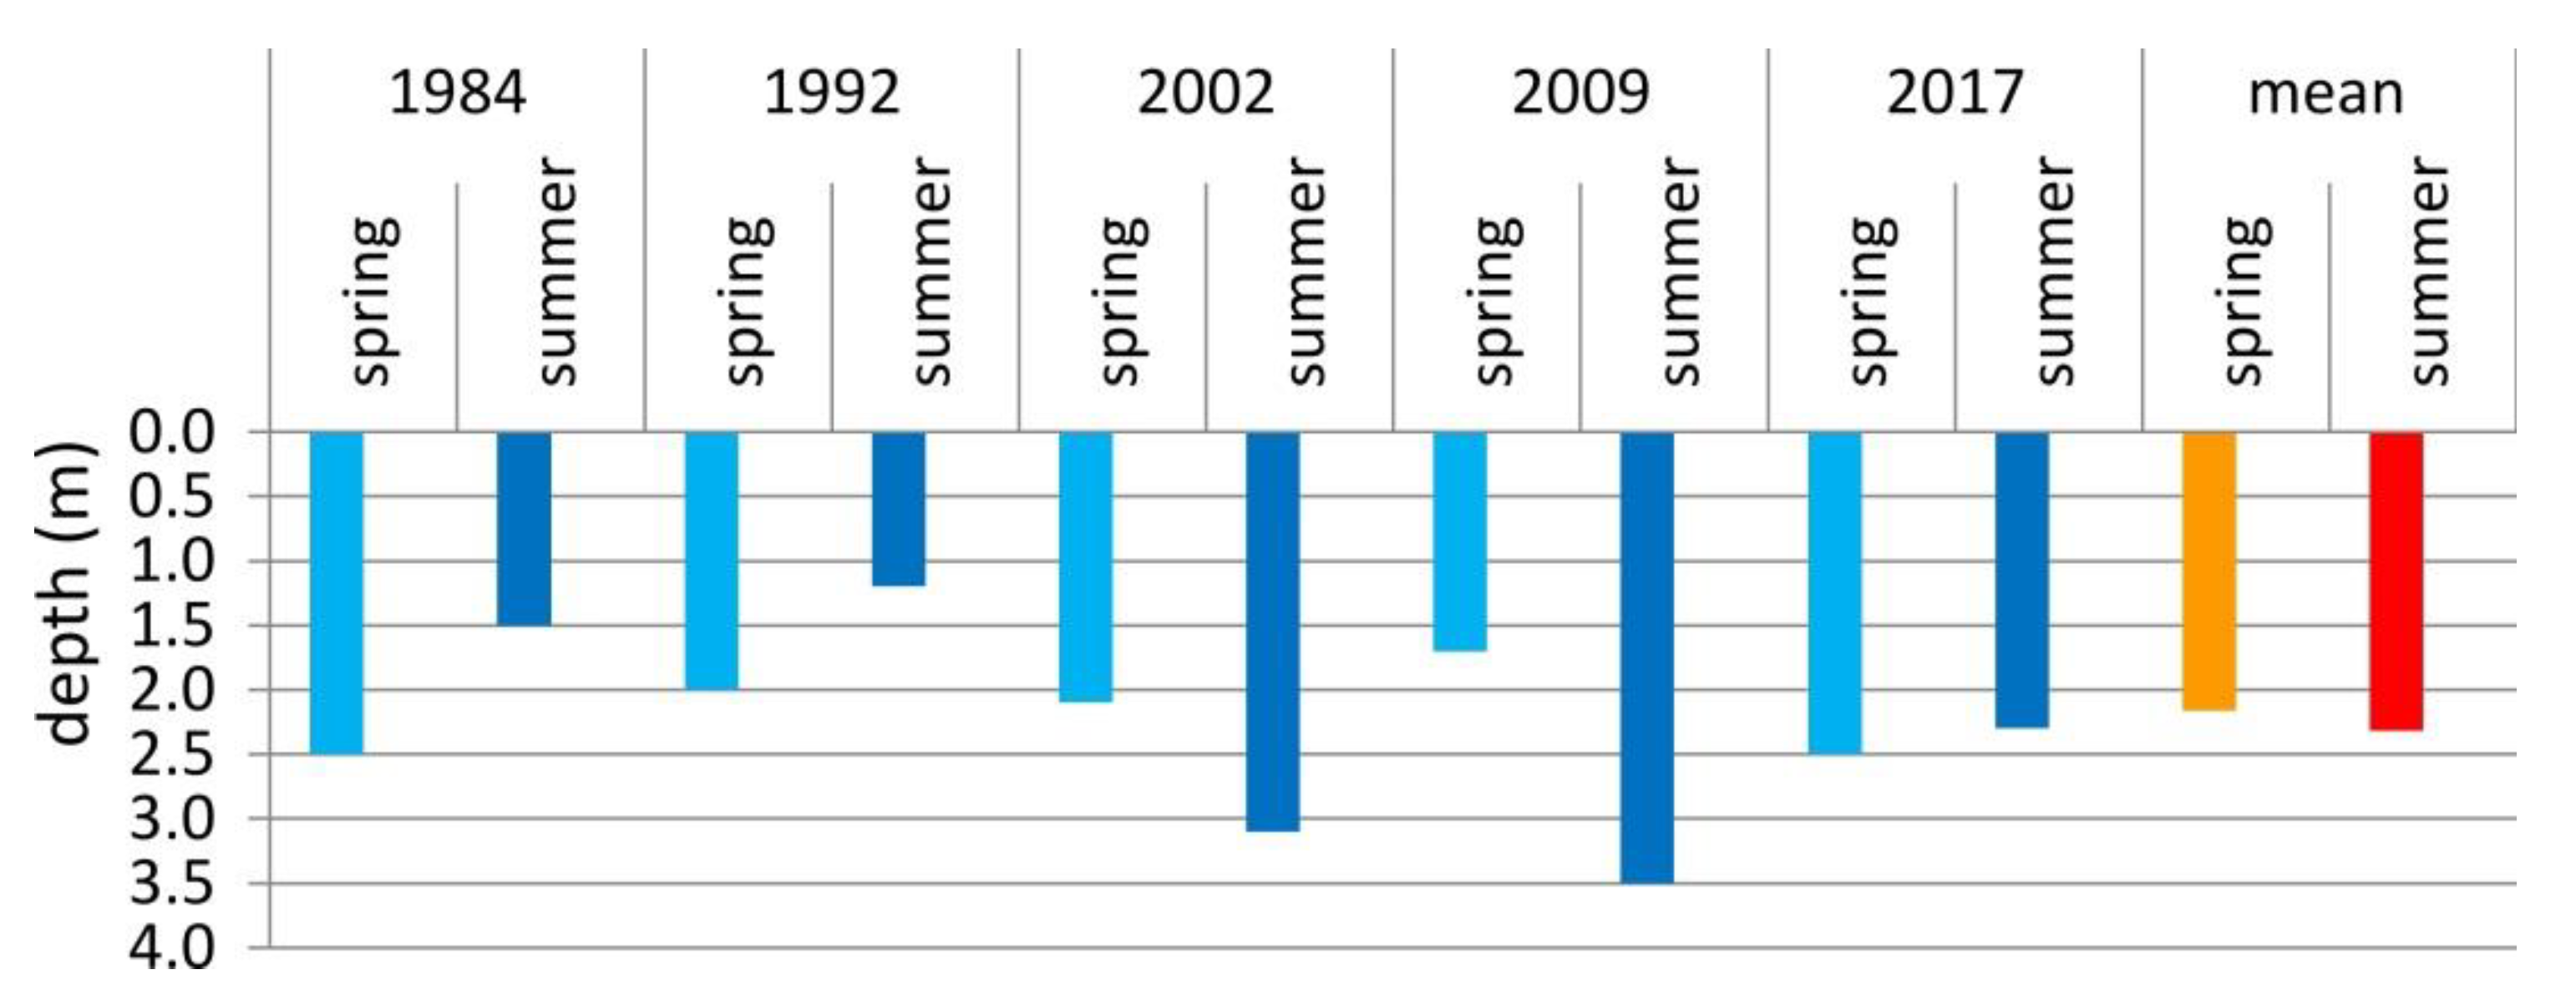
Transformations of the thermal character of the lake waters may also cause changes in water transparency (Secchi disk visibility) [118]. This parameter is mainly related to the amount of organic and inorganic substances suspended in water and the content of chlorophyll a and phytoplankton [115,119,120]. In Lake Borówno, an increase in water transparency in the summer season was observed in the last three years of the study compared to the previous period. It can therefore be assumed that the increase in transparency during the summer season was due to the relatively high stability of the epilimnion, associated with high air temperatures during the summer months [120].
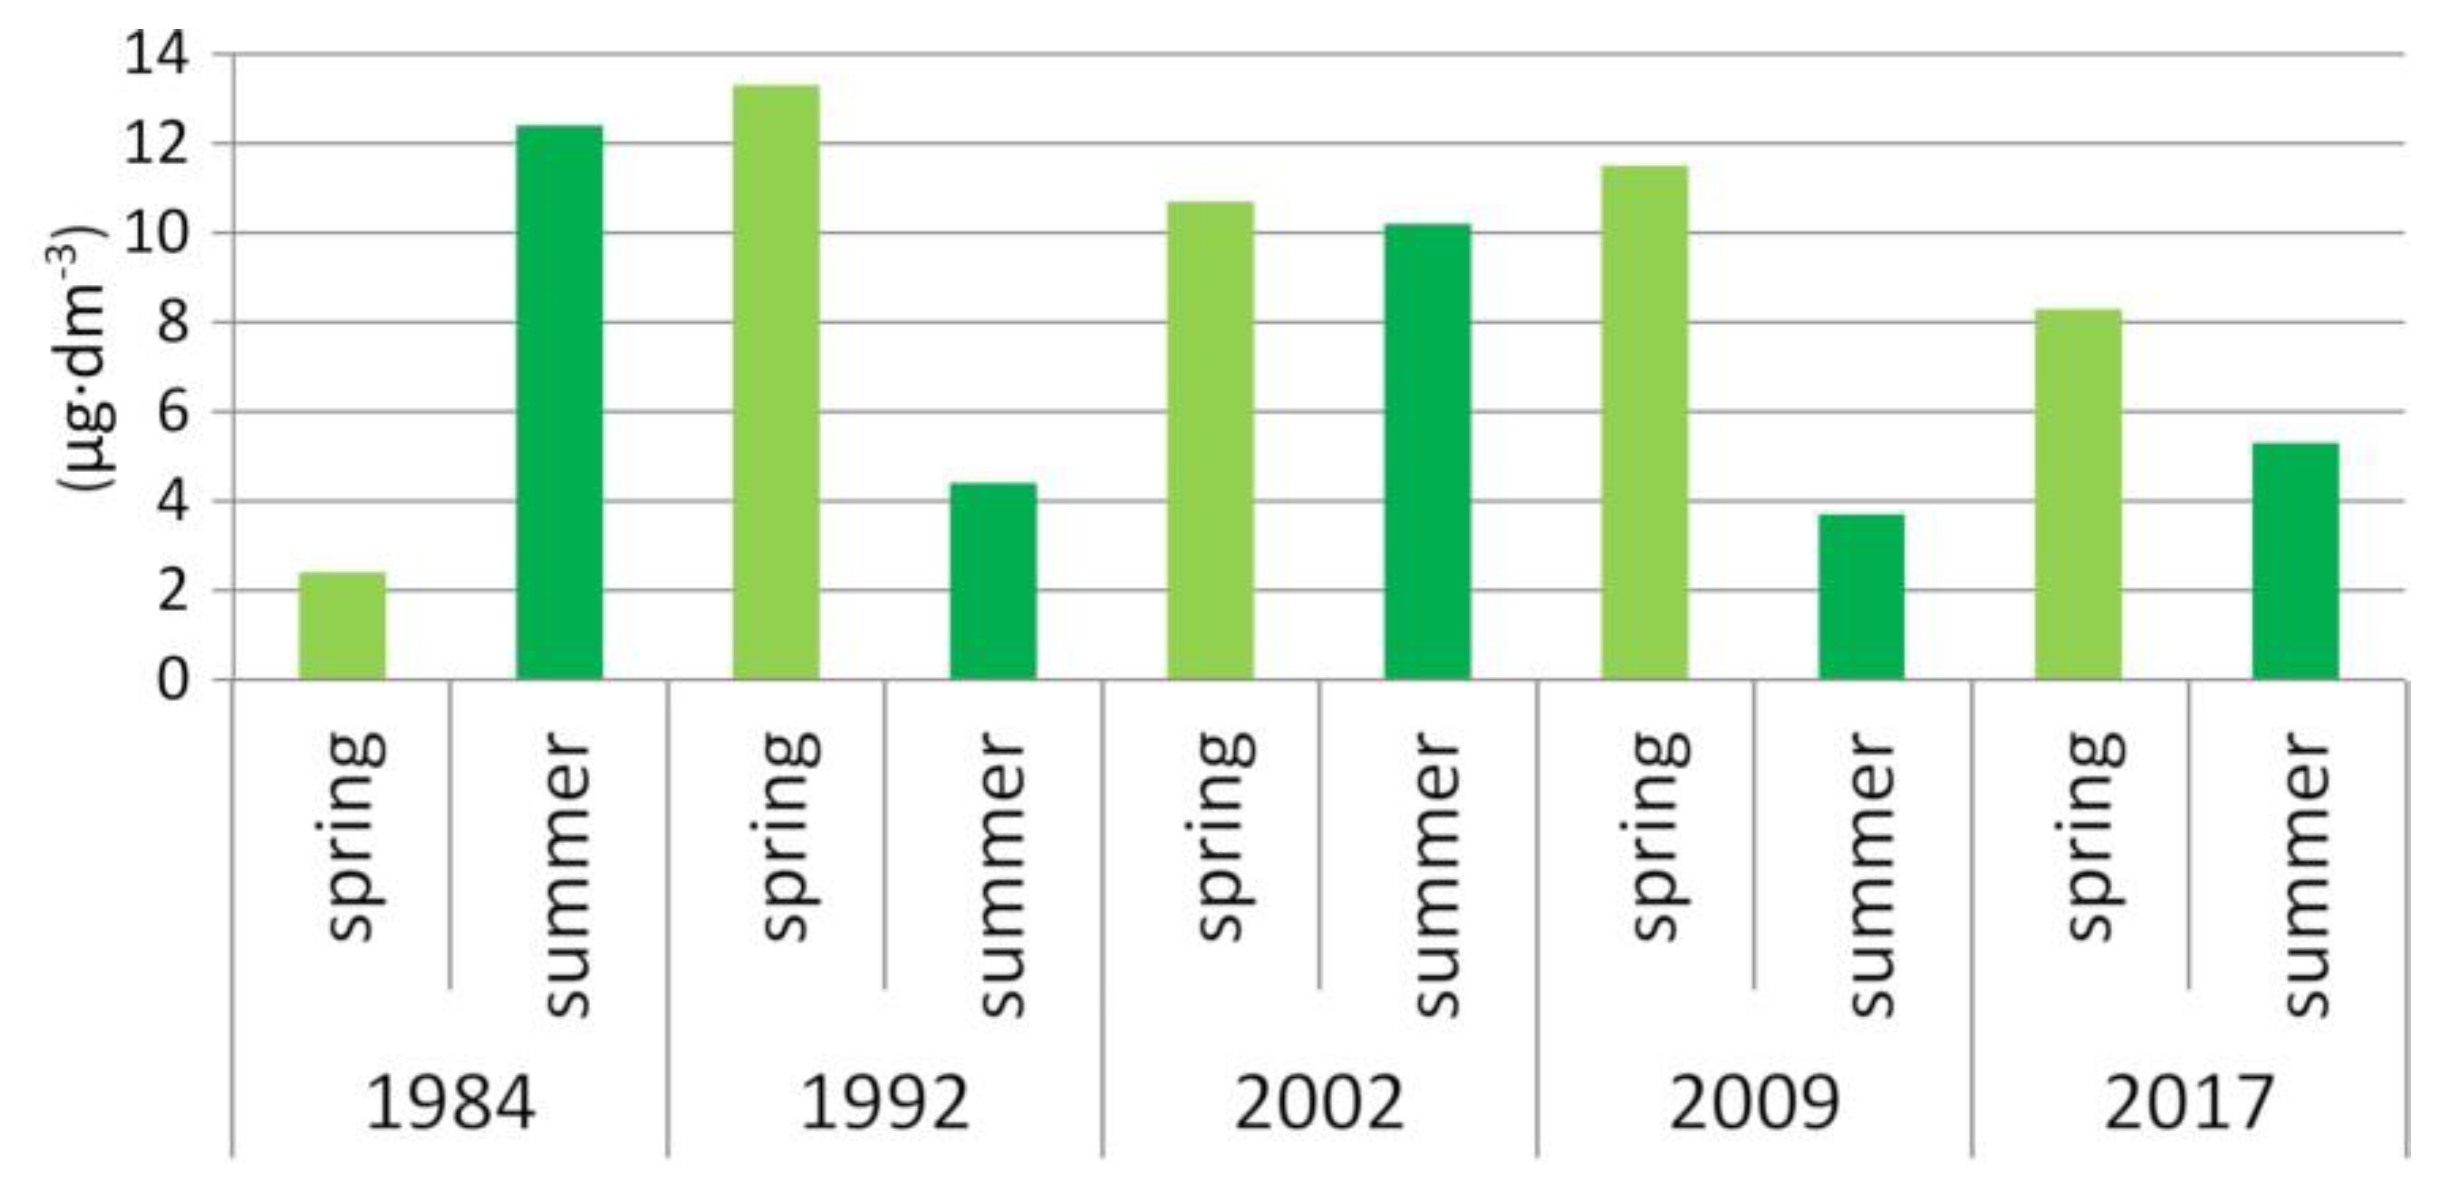
Neither the amount and composition of the phytoplankton nor chlorophyll a in the lake showed significant changes over time. The collected data prove the generally low capacity of Lake Borówno for intensive primary production. Low content of phytoplankton (1.23–5.74 mg·dm−3), albeit slightly higher than in the presented study (0.25–1.39 mg·dm−3), was observed by Wiśniewska and Paczuska in 2009 [117]. The aforementioned authors recorded the highest contents of phytoplankton in the summer season (July–August), but the highest content of chlorophyll a (36.1 mg·m−3) was in May 2009. They classified the lake as mesotrophic. In our study, similar to the aforementioned study, higher values of chlorophyll a were seen in spring than summer, though phytoplankton mass was higher in spring than in summer. The differences in these results may be associated with the higher sampling frequency in the research by Wiśniewska and Paczuska [117].
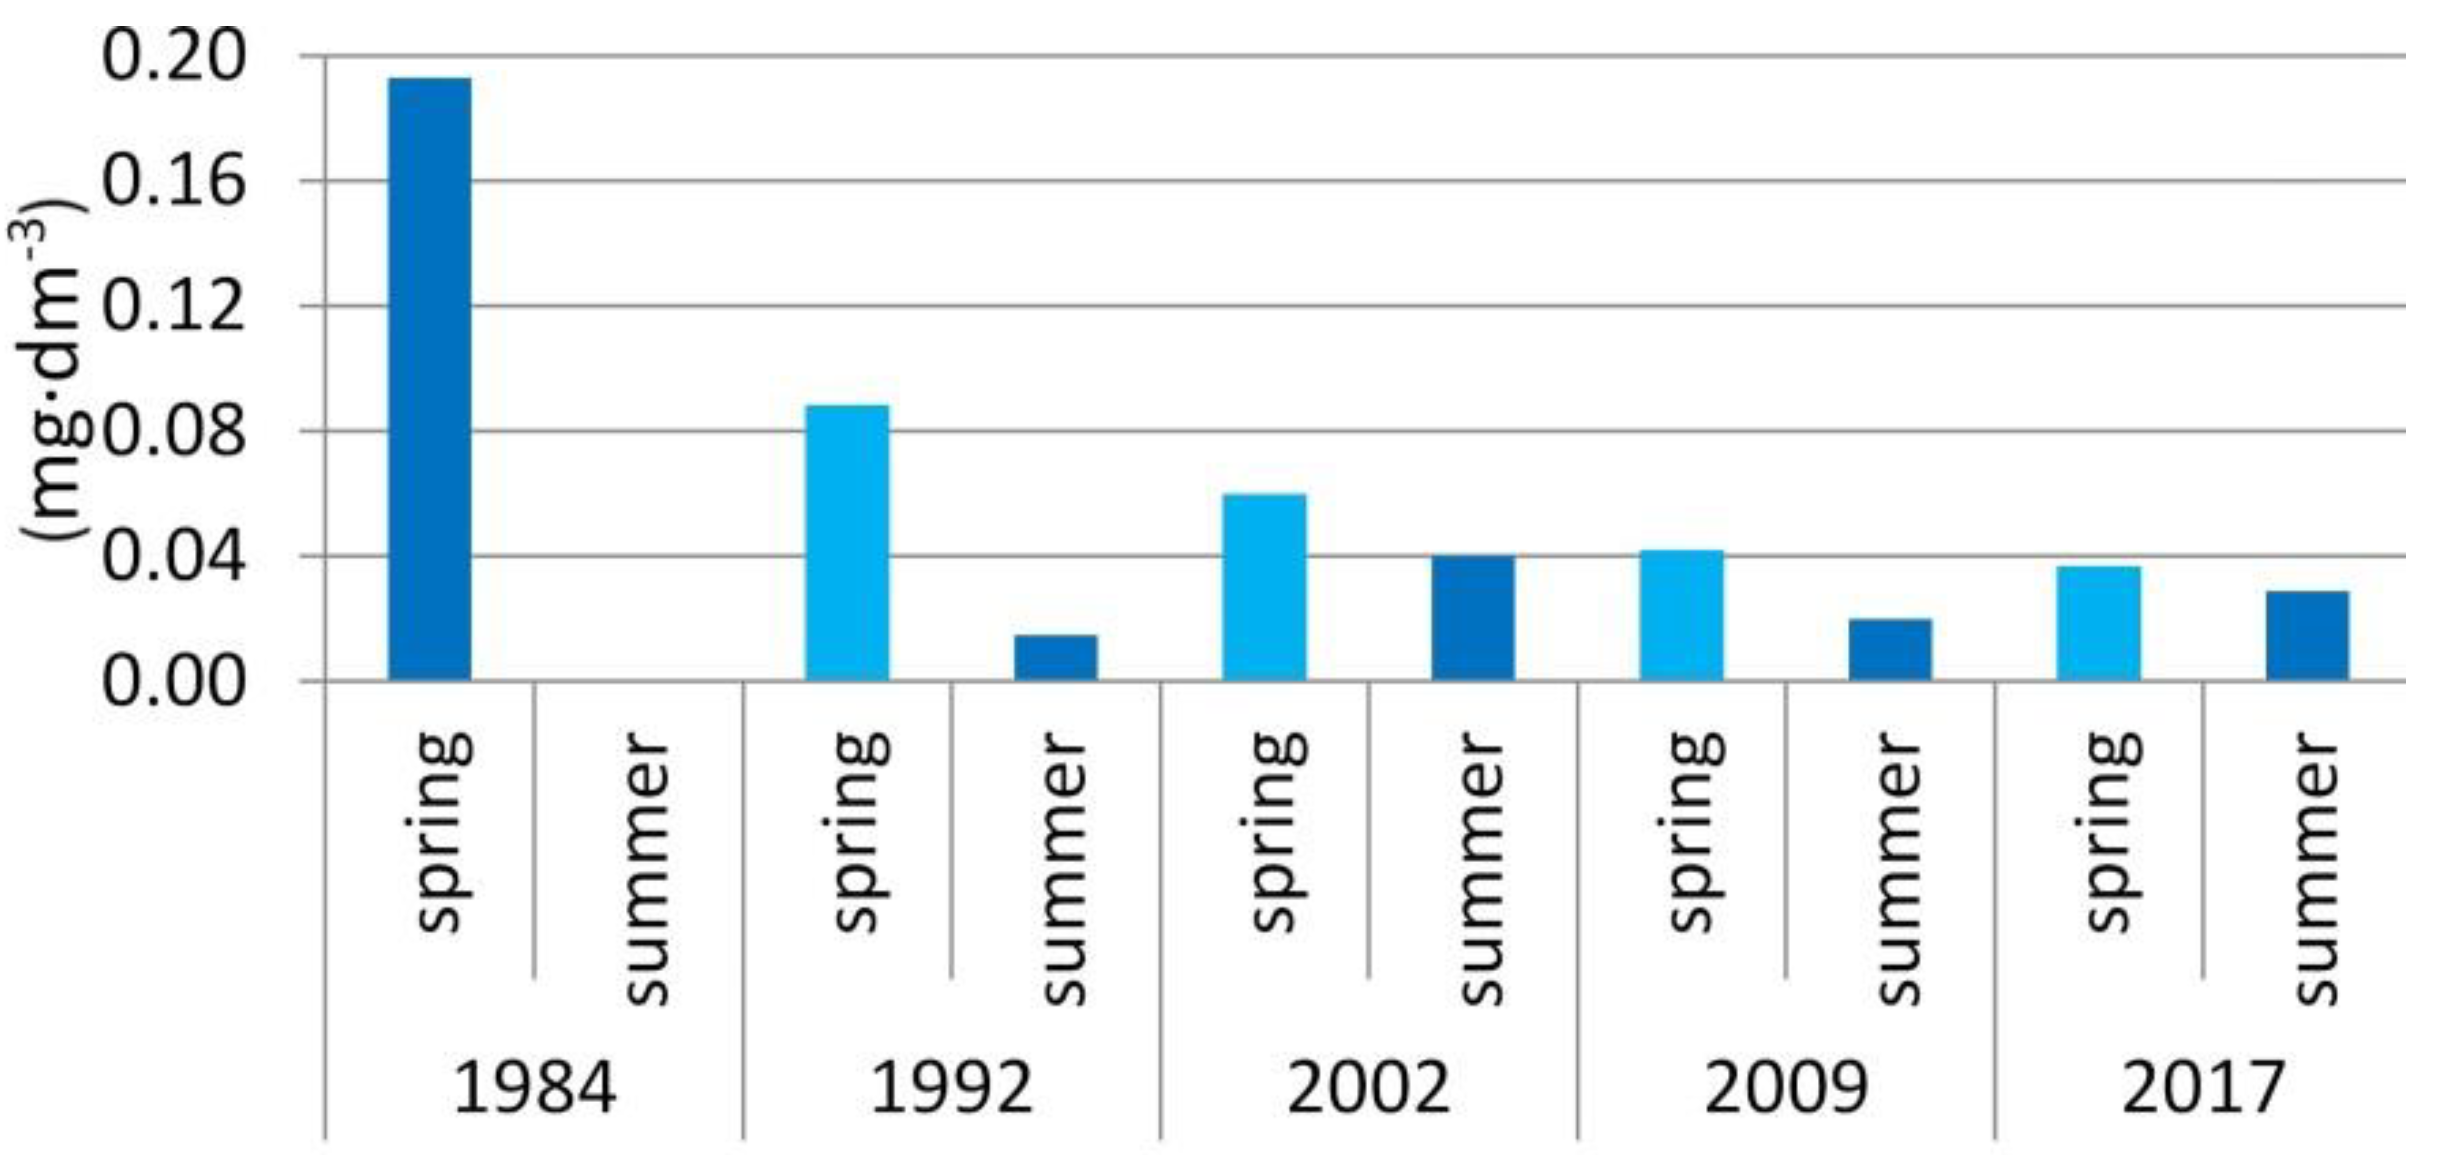
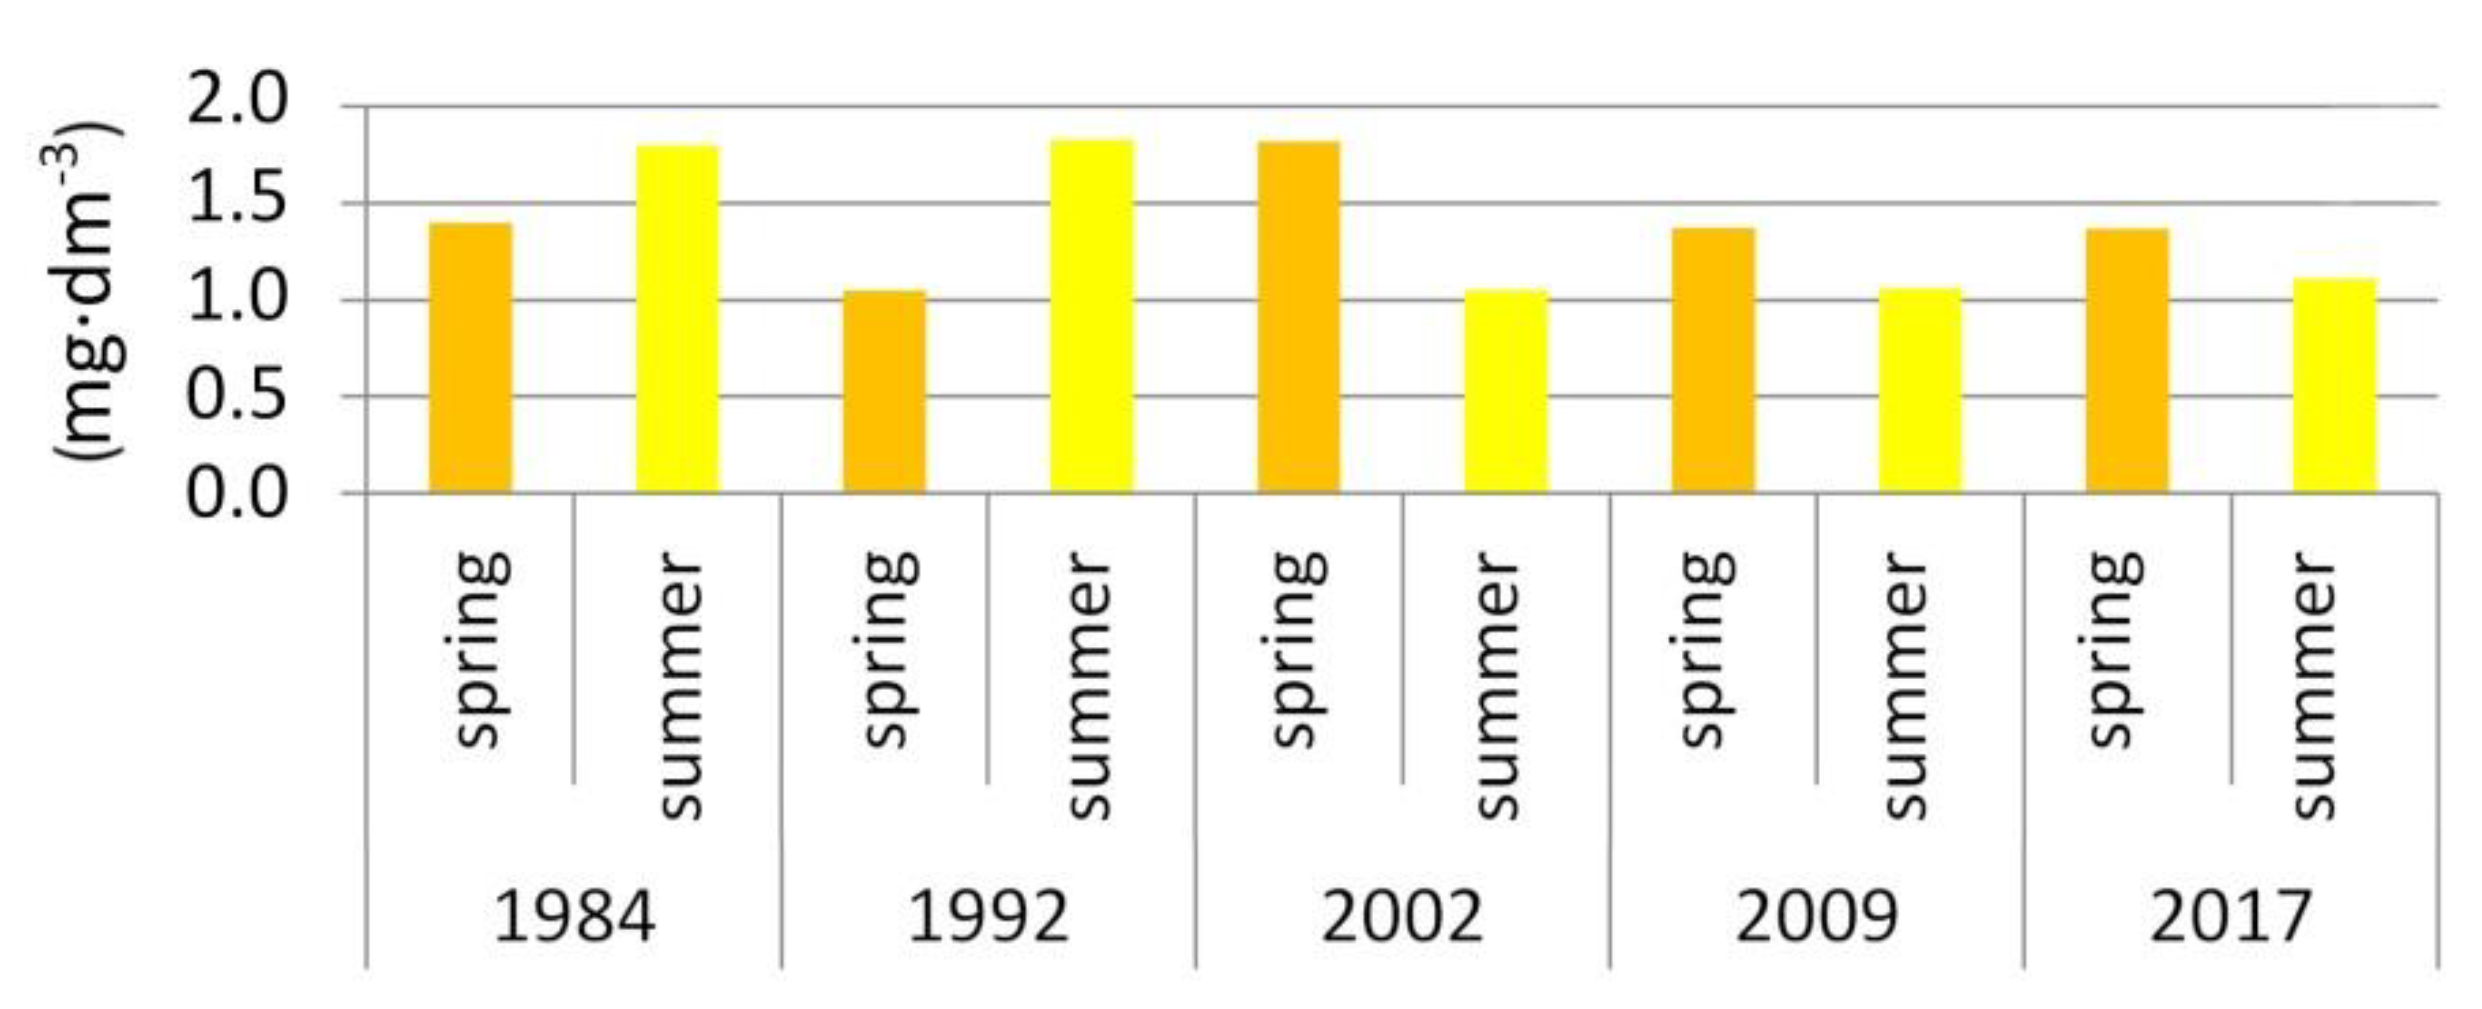
Generally reduced phytoplankton blooms may result from low surface outflow in the lake’s catchment having caused low nutrient contents [22]. The obtained results showed a decrease in total phosphorus and total nitrogen in the 21st century, especially in the summer (Figure 10). Temporary enrichment in nutrients was observed in 2002, when tributaries were flowing during the sampling dates, showing that surface outflow may be a source of nitrates and organic matter. However, probably due to their periodic character and decreasing outflow in the last dozen or so years, the total supply of phosphorus and nitrogen compounds to Lake Borówno is not particularly heavy and has been decreasing in recent decades. A decrease in the flow of nitrogen and phosphorus compounds, along with a reduction of outflow were observed in many flowing waters [121,122]. The discharge in periodic tributaries of Lake Borówno is activated in spring, which explains the higher level of nitrogen and phosphorus in spring than in summer in the last three years of the study. It is difficult to determine whether such seasonality, associated with seasonal discharge of water, will be maintained. In the 21st century, on the one hand, a further increase in air temperatures is predicted, which will translate into high evaporation values [85], but on the other hand, there is also a possibility of more frequent heavy rainfalls. Such precipitation under conditions of significant soil dryness may result in the activation of surface run-off [123]. This may well increase the inflow of compounds of agricultural origin in some years, as can be concluded from high nitrogen concentrations in the hypolimnion of Lake Borówno in 2002 (2.58 mg·dm−3), when the lake was intensively supplied by the inflowing watercourses. However, our results also suggest the possible activation of a mechanism of periodic internal enrichment of the lake with phosphorus secreted from bottom sediments in the lake. This indicates the importance of both allochthonous nutrients and nutrients previously stored in bottom sediments in the eutrophication of Lake Borówno. In this lake, the process of eutrophication can take place spontaneously with low external pressure.

6. Conclusions

On the basis of the conducted research, it was found that Lake Borówno is undergoing a constant process of surface area and volume reduction, which has increased drastically since 2012. The process of lake disappearance in the second decade of the 21st century shows the combined effects of hydrological drought over the last several years and an increase in the use of groundwater resources in the catchment area. The observed lake’s response to climate stress and human impact may be exacerbated in the future, especially when considering the projected increase in air temperature, which is bound to have a strong impact on lakes in developing suburban areas of large urban centres.
The study of physical, chemical, and biological parameters of Lake Borówno water indicates the occurrence of processes related to the climate warming observed in the second half of the 20th century. Said processes have also been found in other lakes and include an increase in surface water temperature, growing stability of water masses, and prolonged summer thermal stratification. However, one should note that climate warming may result in a reduction of lake depth, which in turn affects the capacity to transfer heat into the deeper zone. Reduction in depth also entails a change in temperature distribution in the vertical profile during the summer period. In shallower lakes, this process contributes to the tendency for such lakes to transform into unstratified reservoirs due to incomplete development of the hypolimnion zone. Secondary effects of air and lake water temperature increase include changes in oxygen content in bottom water, higher water transparency, and maximum occurrence of chlorophyll a in spring. This last phenomenon is related to the observed low content of nutrients resulting from diminishing runoff and dissolution during drought. In the light of climate forecasts that assume further increases in air temperature and higher frequency of extreme phenomena (including heavy rainfall), it remains uncertain what impact runoff from the catchment area will have on water quality in Lake Borówno. With this in mind, it is advisable to continue the observation of water levels and selected physical and chemical factors at Lake Borówno and other lakes subject to strong anthropopressure. As suggested by Mosley [121], when forecasting climate conditions, it is important to adopt a comprehensive approach to water resources and account for likely instances of increased water use during droughts. Furthermore, measures should be taken to establish and follow rational principles of water management in order to enable aquifers to recharge.

Author Contributions

Conceptualisation, D.S. and J.G.; Methodology, D.S., S.C., and J.G.; Formal analysis, D.S., S.C., and J.G; Investigation, D.S., S.C., and J.G.; Resources, D.S. and J.G.; Software, D.S. and S.C; Validation, D.S, S.C., and J.G.; Data curation, D.S., S.C., and J.G.; Writing—original draft preparation, D.S., S.C., and J.G.; Writing—review and editing, D.S.; Visualisation, D.S. and S.C.; Supervision, D.S.; Project administration, D.S.; Funding acquisition, D.S. and J.G. All authors have read and agreed to the published version of the manuscript.

Funding

This research was funded by the District Office in Bydgoszcz, as part of the study entitled “Assessment of the current state of the soil and water environment of Lake Borówno together with the concept of studies and observations to determine the causes of the disappearance of the lake”.

Acknowledgments

The authors would like to thank Michał Habel for his help with the lake bathymetry measurements.

Conflicts of Interest

The authors declare no conflict of interest.

References

  1. Tong, S.T.Y.; Chen, W. Modeling the relationship between land use and surface water quality. J. Environ. Manag. 2002, 66, 377–393. [Google Scholar] [CrossRef] [PubMed]
  2. Pasztaleniec, A.; Kutyła, S. The Ecological Status of Lakes in National and Landscape Parks: Does the Location of a Lake and Its Catchment within a Protected Area Matter? Pol. J. Environ. Stud. 2015, 24, 227–240. [Google Scholar] [CrossRef]
  3. Adrian, R.; Hessen, D.O.; Blenckner, T.; Hillebrand, H.; Hilt, S.; Jeppesen, E.; Livingstone, D.M.; Trolle, D. Environmental Impacts—Lake Ecosystems. In North Sea Region Climate Change Assessment; Quante, M., Colijn, F., Eds.; Springer International Publishing: Cham, Germany, 2016; pp. 315–340. ISBN 978-3-319-39743-6. [Google Scholar]
  4. Collins, R.; Jenkins, A. The impact of agricultural land use on stream chemistry in the Middle Hills of the Himalayas, Nepal. J. Hydrol. 1996, 185, 71–86. [Google Scholar] [CrossRef]
  5. Johnes, P.J.; Heathwaite, A.L. Modelling the impact of land use change on water quality in agricultural catchments. Hydrol. Process. 1997, 11, 269–286. [Google Scholar] [CrossRef]
  6. Knox, J.C. Agricultural influence on landscape sensitivity in the Upper Mississippi River Valley. Catena 2001, 42, 193–224. [Google Scholar] [CrossRef]
  7. Zalidis, G.; Stamatiadis, S.; Takavakoglou, V.; Eskridge, K.; Misopolinos, N. Impacts of agricultural practices on soil and water quality in the Mediterranean region and proposed assessment methodology. Agric. Ecosyst. Environ. 2002, 88, 137–146. [Google Scholar] [CrossRef]
  8. Burkholder, J.; Libra, B.; Weyer, P.; Heathcote, S.; Kolpin, D.; Thorne, P.S.; Wichman, M. Impacts of Waste from Concentrated Animal Feeding Operations on Water Quality. Environ. Health Perspect. 2007, 115, 308–312. [Google Scholar] [CrossRef] [Green Version]
  9. Makarewicz, J.C.; Lewis, T.W.; Bosch, I.; Noll, M.R.; Herendeen, N.; Simon, R.D.; Zollweg, J.; Vodacek, A. The impact of agricultural best management practices on downstream systems: Soil loss and nutrient chemistry and flux to Conesus Lake, New York, USA. J. Great Lakes Res. 2009, 35, 23–36. [Google Scholar] [CrossRef]
  10. Koff, T.; Vandel, E.; Marzecová, A.; Avi, E.; Mikomägi, A. Assessment of the effect of anthropogenic pollution on the ecology of small shallow lakes using the palaeolimnological approach. Est. J. Earth Sci. 2016, 65, 221. [Google Scholar] [CrossRef]
  11. Fohrer, N.; Haverkamp, S.; Eckhardt, K.; Frede, H.-G. Hydrologic Response to land use changes on the catchment scale. Phys. Chem. Earth Part B Hydrol. Ocean. Atmos. 2001, 26, 577–582. [Google Scholar] [CrossRef]
  12. Mushtaq, F.; Pandey, A.C. Assessment of land use/land cover dynamics vis-à-vis hydrometeorological variability in Wular Lake environs Kashmir Valley, India using multitemporal satellite data. Arab. J. Geosci. 2014, 7, 4707–4715. [Google Scholar] [CrossRef]
  13. Calder, I.R.; Hall, R.L.; Bastable, H.G.; Gunston, H.M.; Shela, O.; Chirwa, A.; Kafundu, R. The impact of land use change on water resources in sub-Saharan Africa: A modelling study of Lake Malawi. J. Hydrol. 1995, 170, 123–135. [Google Scholar] [CrossRef]
  14. Li, X.-Y.; Ma, Y.-J.; Xu, H.-Y.; Wang, J.-H.; Zhang, D.-S. Impact of land use and land cover change on environmental degradation in lake Qinghai watershed, northeast Qinghai-Tibet Plateau. Land Degrad. Dev. 2009, 20, 69–83. [Google Scholar] [CrossRef]
  15. Huang, J.; Zhan, J.; Yan, H.; Wu, F.; Deng, X. Evaluation of the Impacts of Land Use on Water Quality: A Case Study in The Chaohu Lake Basin. Sci. World J. 2013, 2013, 1–7. [Google Scholar] [CrossRef] [Green Version]
  16. Nendel, C.; Hu, Y.; Lakes, T. Land-use change and land degradation on the Mongolian Plateau from 1975 to 2015-A case study from Xilingol, China. Land Degrad. Dev. 2018, 29, 1595–1606. [Google Scholar] [CrossRef]
  17. Sertel, E.; Imamoglu, M.Z.; Cuceloglu, G.; Erturk, A. Impacts of Land Cover/Use Changes on Hydrological Processes in a Rapidly Urbanizing Mid-latitude Water Supply Catchment. Water 2019, 11, 1075. [Google Scholar] [CrossRef] [Green Version]
  18. Döll, P.; Müller Schmied, H.; Schuh, C.; Portmann, F.T.; Eicker, A. Global-scale assessment of groundwater depletion and related groundwater abstractions: Combining hydrological modeling with information from well observations and GRACE satellites. Water Resour. Res. 2014, 50, 5698–5720. [Google Scholar] [CrossRef]
  19. Faramarzi, N. Agricultural Water Use in Lake Urmia Basin, Iran: An Approach to Adaptive Policies and Transition to Sustainable Irrigation Water Use. Ph.D. Thesis, Uppsala University, Uppsala, Sweden, 2012. [Google Scholar]
  20. Meyer, K. The Impact of Agricultural Land Use Change on Lake Water Quality: Evidence from Iowa. Stud. Agric. Econ. 2018, 120, 105–111. [Google Scholar] [CrossRef]
  21. Chislock, M.F.; Doster, E.; Zitomer, R.A.; Wilson, A.E. Eutrophication: Causes, Consequences, and Controls in Aquatic Ecosystems Learn Science at Scitable. Available online: https://www.nature.com/scitable/knowledge/library/eutrophication-causes-consequences-and-controls-in-aquatic-102364466/ (accessed on 3 April 2020).
  22. Bechmann, M.E.; Berge, D.; Eggestad, H.O.; Vandsemb, S.M. Phosphorus transfer from agricultural areas and its impact on the eutrophication of lakes—two long-term integrated studies from Norway. J. Hydrol. 2005, 304, 238–250. [Google Scholar] [CrossRef]
  23. Schmalz, B.; Bieger, K.; Fohrer, N. A method to assess instream water quality – the role of nitrogen entries in a North German rural lowland catchment. Adv. Geosci. 2008, 18, 37–41. [Google Scholar] [CrossRef] [Green Version]
  24. Winter, T.C. Ground Water and Surface Water: A Single Resource; U.S. Geological Survey: Denver, CO, USA, 1998; ISBN 978-0-607-89339-7.
  25. Yihdego, Y.; Khalil, A. Groundwater Resources Assessment and Impact Analysis Using a Conceptual Water Balance Model and Time Series Data Analysis: Case of Decision Making Tool. Hydrology 2017, 4, 25. [Google Scholar] [CrossRef] [Green Version]
  26. Yihdego, Y.; Webb, J.; Vaheddoost, B. Highlighting the Role of Groundwater in Lake– Aquifer Interaction to Reduce Vulnerability and Enhance Resilience to Climate Change. Hydrology 2017, 4, 10. [Google Scholar] [CrossRef] [Green Version]
  27. Michalczyk, Z.; Chmiel, S.; Głowacki, S.; Sposób, J. Exploitation of groundwaters resources in Lublin in 1955–2015. Przegl. Geol. 2017, 65, 1344–1349. [Google Scholar]
  28. Marszelewski, W.; Skowron, R. Związki między odwodnieniem odkrywki Tomisławice a wybranymi elementami ustroju hydrologicznego jeziora Gopło. Rocz. Glebozn. 2011, 62, 273–282. (In Polish) [Google Scholar]
  29. Piasecki, A.; Skowron, R. Changing the geometry of basins and water resources of Lakes Gopło and Ostrowskie under the influence of anthropopressure. Limnol. Rev. 2014, 14, 33–43. [Google Scholar] [CrossRef] [Green Version]
  30. Rösner, U. Effects of historical mining activities on surface water and groundwater - an example from northwest Arizona. Environ. Geol. 1998, 33, 224–230. [Google Scholar] [CrossRef]
  31. Jańczak, J. Rekultywacja a ochrona jeziora Gopło. Zesz. Nauk. Inżynieria Środowiska Politech. Zielonogórska 2001, 125, 141–149. (In Polish) [Google Scholar]
  32. Karmakar, H.N.; Das, P.K. Impact of Mining on Ground and Surface Waters; International Mine Water Association IMWA: Ljubljana-Portschach, Slovenia, 1991. [Google Scholar]
  33. Jhariya, D.; Khan, R.; Thakur, G.S. Impact of Mining Activity on Water Resource: An Overview study. In Proceedings of the Recent Practices and Innovations in Mining Industry, Raipur, India, 19–20 February 2016; pp. 271–277. [Google Scholar]
  34. Leppänen, J.J.; Weckström, J.; Korhola, A. Multiple mining impacts induce widespread changes in ecosystem dynamics in a boreal lake. Sci. Rep. 2017, 7, 10581. [Google Scholar] [CrossRef]
  35. Feyen, L.; Dankers, R. Impact of global warming on streamflow drought in Europe. J. Geophys. Res. 2009, 114, D17116. [Google Scholar] [CrossRef]
  36. Van Loon, A.F. Hydrological drought explained: Hydrological drought explained. Wires Water 2015, 2, 359–392. [Google Scholar] [CrossRef]
  37. Radzka, E. Climatic water balance for the vegetation season (according to Iwanow’s equation) in central-eastern Poland. Water Environ. Rural Areas 2014, 14, 67–76. [Google Scholar]
  38. Kędziora, A. Climatic conditions and water balance of the Kujawy Lakeland. Rocz. Glebozn. 2011, 62, 189–203. [Google Scholar]
  39. Choiński, A.; Ptak, M.; Ławniczak, A. Changes in Water Resources of Polish Lakes as Influenced by Natural and Anthropogenic Factors. Pol. J. Environ. Stud. 2016, 25, 1883–1890. [Google Scholar] [CrossRef]
  40. Wada, Y.; van Beek, L.P.H.; Wanders, N.; Bierkens, M.F.P. Human water consumption intensifies hydrological drought worldwide. Environ. Res. Lett. 2013, 8, 034036. [Google Scholar] [CrossRef] [Green Version]
  41. Wanders, N.; Wada, Y. Human and climate impacts on the 21st century hydrological drought. J. Hydrol. 2015, 526, 208–220. [Google Scholar] [CrossRef]
  42. Lee, S.; Wolberg, G.; Shin, S.Y. Scattered data interpolation with multilevel B-splines. IEE Trans. Vis. Comput. Graph. 1997, 3, 228–244. [Google Scholar] [CrossRef] [Green Version]
  43. Parmar, S.S. Sediment Yield Assessment Using SAGA GIS and USLE model: A Case Study of Watershed–63 of Narmada River, Gujarat, India. IJETT 2019, 67, 1–13. [Google Scholar] [CrossRef]
  44. IMGW Dane publiczne IMGW-PIB. Available online: www.danepubliczne.imgw.pl (accessed on 14 February 2020).
  45. GIOŚ Inspectorate of Environmental Protection. Available online: www.gios.gov.pl/en/ (accessed on 14 February 2020).
  46. PCA Polish Centre for Accreditation. Available online: www.pca.gov.pl/en/ (accessed on 14 February 2020).
  47. PN-EN ISO 6878. Water Quality. Determination of Phosphorus – Spectrophotometric Method with Ammonium Molybdate; Polish Committee for Standardization: Warsaw, Poland, 2006. [Google Scholar]
  48. PN-C-04576-14. Water and Wastewater–Tests for Nitrogen Concentration. Calculation of Total Nitrogen; Polish Committee for Standardization: Warsaw, Poland, 1973. [Google Scholar]
  49. PN-ISO 7150-1. Water Quality. Determination of Ammonium Nitrogen; Polish Committee for Standardization: Warsaw, Poland, 2002. [Google Scholar]
  50. PN-EN 26777. Water Quality—Determination of Nitrite—Molecular Absorption Spectrometric Method; Polish Committee for Standardization: Warsaw, Poland, 1999. [Google Scholar]
  51. PN 82/C-04576.08. Water and Waste Water—Tests for Content of Nitrogen Compounds—Determination of Nitrate Nitrogen by Colorimetric Method with Sodium Salicilate; Polish Committee for Standardization: Warsaw, Poland, 1982. [Google Scholar]
  52. PN-ISO 25663. Water Quality–Determination of Kjeldahl NitrogenMethod after Mineralization with Selenium; Polish Committee for Standardization: Warsaw, Poland, 2001. [Google Scholar]
  53. PN-ISO 6060. Water Quality–Determination of the Chemical Oxygen Demand; Polish Committee for Standardization: Warsaw, Poland, 2006. [Google Scholar]
  54. PN ISO 10260. Water Quality—Measurement of Biochemical Parameters—Spectrometric Determination of the Chlorophyll-a Concentration; Polish Committee for Standardization: Warsaw, Poland, 2002. [Google Scholar]
  55. Wojewódzki Inspektorat Ochrony Środowiska. Raport o Stanie Środowiska Województwa Kujawsko-Pomorskiego w 2006 Roku; Wojewódzki Inspektorat Ochrony Środowiska w Bydgoszczy: Bydgoszcz, Poland, 2007.
  56. Wojewódzki Inspektorat Ochrony Środowiska. Raport o Stanie Środowiska Województwa Kujawsko-Pomorskiego w 2015 Roku; Wojewódzki Inspektorat Ochrony Środowiska w Bydgoszczy: Bydgoszcz, Poland, 2016.
  57. PN-EN 15204. Water Quality—Guidance Standard on the Enumeration of Phytoplankton Using Inverted Microscopy (Utermhl Technique); Polish Committee for Standardization: Warsaw, Poland, 2006. [Google Scholar]
  58. Utermöh, H. Zur Vervollkommnung der quantitativen Phytoplankton-Methodik: Mit 1 Tabelle und 15 abbildungen im Text und auf 1 Tafel. SIL Commun. 1953–1996 1958, 9, 1–38. [Google Scholar] [CrossRef]
  59. GUS LOCAL DATA BANK. Available online: Stat.gov.pl 2016 (accessed on 14 February 2020).
  60. GUS LOCAL DATA BANK. Available online: Stat.gov.pl 2018 (accessed on 14 February 2020).
  61. NASA Jet Propulsion Laboratory (JPL) NASA Shuttle Radar Topography Mission Global 3 arc second. Version 3. 6°S, 69°W NASA EOSDIS Land Processes DAAC. Available online: https://lpdaac.usgs.gov (accessed on 14 February 2020).
  62. Czarnecka, H. Atlas Podziału Hydrograficznego Polski; IMGW: Warszawa, Poland, 2005. [Google Scholar]
  63. GUGiK. LiDAR Data, Map Sheet: N-34-97-A-a-4-4-3, N-34-97-A-a-4-4-4, N-34-97-A-b-3-2-3, N-34-97-A-b-3-2-4, N-34-97-A-b-3-3-3, N-34-97-A-b-3-3-4, N-34-97-A-b-3-4-1, N-34-97-A-b-3-4-2, N-34-97-A-b-3-4-3, N-34-97-A-b-3-4-4, N-34-97-A-b-4-1-3, N-34-97-A-b-4-1-4, N-34-97-A-b-4-3-1, N-34-97-A-b-4-3-3, N-34-97-A-c-2-2-1, N-34-97-A-c-2-2-2, N-34-97-A-c-2-2-3, N-34-97-A-c-2-2-4, N-34-97-A-c-2-4-2, N-34-97-A-d-1-1-1, N-34-97-A-d-1-1-2, N-34-97-A-d-1-1-3, N-34-97-A-d-1-1-4, N-34-97-A-d-1-2-1, N-34-97-A-d-1-2-2, N-34-97-A-d-1-2-3, N-34-97-A-d-1-2-4, N-34-97-A-d-1-3-1, N-34-97-A-d-1-3-2, N-34-97-A-d-2-1-1, N-34-97-A-d-2-1-3; GUGiK: Warszawa, Poland, 2018. [Google Scholar]
  64. Copernicus Sentinel Data, Sheet: S2A_MSIL1C_20180804T100031_N0206_R122_ T34UCE_20180804T121518; ESA. 2018. Available online: https://scihub.copernicus.eu/dhus/#/home (accessed on 14 February 2020).
  65. Kozłowska, M.; Kozłowski, I. Szczegółowa Mapa Geologiczna Polski w skali 1:50 000 ark. Żołędowo (280) (N-34-97-A); Państwowy Instytut Geologiczny: Warszava, Poland, 1985. [Google Scholar]
  66. Smetana, J. Charakterystyka hydrogeologiczna obszaru zlewni jeziora. Aktualny stan ujęć wód podziemnych. Porównanie z istniejącymi danymi historycznymi. Próba interpretacji uzyskanych wyników. In Ocena Aktualnego Stanu Środowiska Gruntowo-Wodnego Jeziora Borówno Wraz z Koncepcją Badań i Obserwacji w Celu Ustalenia Przyczyn Zanikania Jeziora; Szumińska, D., Goszczyński, J., Smetana, J., Czapiewski, S., Eds.; Poland, 2018; Unpublished work, archive material of the District Office in Bydgoszcz. [Google Scholar]
  67. Nowak, I. Mapa Hydrogeologiczna Polski w Skali 1:50 000 Arkusz Żołędowo; Państwowy Instytut Geologiczny: Warszava, Poland, 2000. [Google Scholar]
  68. GUGiK. Mapa topograficzna Polski w skali 1:10 000, sheet: 344 442, 344-443, 344-444, 354-221, 354-222; GUGiK: Warszawa, Poland, 1987. [Google Scholar]
  69. GUGiK. Orthophoto Data, Sheet: N-34-97-A-a-4-4, N-34-97-A-b-3-2, N-34-97-A-b-3-3, N-34-97-A-b-3-4, N-34-97-A-b-4-1, N-34-97-A-b-4-3, N-34-97-A-c-2-2, N-34-97-A-c-2-4, N-34-97-A-d-1-1, N-34-97-A-d-1-2, N-34-97-A-d-1-3, N-34-97-A-d-1-4, N-34-97-A-d-2-1; GUGiK: Warszawa, Poland, 2005. [Google Scholar]
  70. GUGiK. Orthophoto Data, Sheet: N-34-97-A-a-4-4, N-34-97-A-b-3-2, N-34-97-A-b-3-3, N-34-97-A-b-3-4, N-34-97-A-b-4-1, N-34-97-A-b-4-3, N-34-97-A-c-2-2, N-34-97-A-c-2-4, N-34-97-A-d-1-1, N-34-97-A-d-1-2, N-34-97-A-d-1-3, N-34-97-A-d-1-4, N-34-97-A-d-2-1; GUGiK: Warszawa, Poland, 2012. [Google Scholar]
  71. Brodzińska, B.; Jańczak, J.; Kowalik, A.; Lamparska, A.; Rekowska, J.; Sziwa, R. Atlas Jezior Polski; Jańczak, J., Ed.; Bogucki Wydawnictwo Naukowe: Poznań, Poland, 1997; Volume 2, ISBN 8386001437. [Google Scholar]
  72. Prussian topographic map in the scale 1:25 000, sheet: Zolondowo 1912.
  73. European Communities Council. Directive 91/676/EEC of 12 December 1991 Concerning the Protection of Waters Against Pollution Caused by Nitrates from Agricultural Sources; European Communities Council: Strasbourg, France, 1991. [Google Scholar]
  74. Michalska, B. Tendencies of air temperature changes in Poland. Pr. Studia Geogr. 2011, 67–75. [Google Scholar]
  75. Wójcik, R.; Miętus, M. Some features of long-term variability in air temperature in Poland (1951–2010). Przegląd Geogr. 2014, 83, 339–364. [Google Scholar]
  76. Okoniewska, M.; Szumińska, D. Changes in Potential Evaporation in the Years 1952–2018 in North-Western Poland in Terms of the Impact of Climatic Changes on Hydrological and Hydrochemical Conditions. Water 2020, 12, 877. [Google Scholar] [CrossRef] [Green Version]
  77. Ziernicka-Wojtaszek, A. Klimatyczny bilans wodny na obszarze Polski w świetle współczesnych zmian klimatu. Woda-Środowisko-Obsz. Wiej. 2015, 15, 93–100. [Google Scholar]
  78. Meresa, H.; Osuch, M.; Romanowicz, R. Hydro-Meteorological Drought Projections into the 21-st Century for Selected Polish Catchments. Water 2016, 8, 206. [Google Scholar] [CrossRef] [Green Version]
  79. Olichwer, T.; Tarka, R. Impact of climate change on the groundwater run-off in south-west Poland. Open Geosci. 2014, 7. [Google Scholar] [CrossRef] [Green Version]
  80. Banasik, K. Kazanowska Impact of Climate Change on Low Flow Characteristics in a Small Catchment of Central Poland. In Proceedings of the American Geophysical Union, Fall Meeting, San Francisco, CA, USA, 12–16 December 2016. [Google Scholar]
  81. Wrzesiński, D.; Sobkowiak, L. Detection of changes in flow regime of rivers in Poland. J. Hydrol. Hydromech. 2018, 66, 55–64. [Google Scholar] [CrossRef] [Green Version]
  82. Choiński, A. Katalog jezior Polski; Wydawnictwo Naukowe UAM: Poznań, Poland, 2006; ISBN 978-83-232-1732-9. [Google Scholar]
  83. Marszelewski, W.; Ptak, M.; Skowron, R. Anthropogenic and natural conditionings of disappearing lakes in the Wielkopolska-Kujawy Lake Distric. Rocz. Glebozn. 2011, 62, 283–294. [Google Scholar]
  84. Skowron, R.; Jaworski, T. Changes in lake area as a consequence of plant overgrowth in the South Baltic Lakelands (Northern Poland). Bull. Geogr. Phys. Geogr. Ser. 2017, 12, 19–30. [Google Scholar] [CrossRef] [Green Version]
  85. Ptak, M. Zmiany powierzchni i batymetrii wybranych jezior Pojezierza Pomorskiego. Pr. Geogr. 2013, 61–76. [Google Scholar]
  86. Drwal, J. Jeziora w egzoreicznych systemach pojezierzy młodoglacjalnych (Lakes in exoreic systems of young-glacial lakelands). Zesz. Nauk. Wydz. Binoz Ug 1985, 14, 7–15. [Google Scholar]
  87. Borowiak, D. Water regimes and hydrological functions of Polish Lowland lakes. Bad. Limnol. 2Wyd. KlugGdańsk 2000, 164. [Google Scholar]
  88. Jańczak, J. Porównanie odpływu z większych jezior pojezierzy Wielkopolskiego i Pomorskiego [in:] Zasoby i ochrona wód. Red. R.; Bogdanowicz, J. FacBeneda. Fund. Rozw. Uniw. Gdańskiego 2009, 3, 63–73. [Google Scholar]
  89. Malakar, A.; Snow, D.D.; Ray, C. Irrigation Water Quality—A Contemporary Perspective. Water 2019, 11, 1482. [Google Scholar] [CrossRef] [Green Version]
  90. Szumińska, D. Dynamika i uwarunkowania odpływu w południowej części zlewni Wdy [in:] A. Magnuszewski (red.), Hydrologia w ochronie i kształtowaniu środowiska. Monogr. Kom. Inżynierii Środowiska Pan 2010, 69, 129–137. [Google Scholar]
  91. Szumińska, D. Przebieg Odpływu w Zlewni Wdy na tle Zmian Intensywności Użytkowania Wód w Drugiej Połowie XX Wieku; UKW, Wdecki Park Krajobrazowy: Bydgoszcz, Poland, 2014. [Google Scholar]
  92. Glazik, R.; Pius, B. Zasilanie doliny Wisły wodami podziemnymi na odcinku Toruń-Tczew. [in:] Michalczyk, Z. (red.) Obieg wody w środowisku naturalnym i przekształconym. Wydaw. Uniw. Marii Curie-SkłodowskiejLub. 2007, 227–234. [Google Scholar]
  93. Hannaford, J. UK Hydrological Status Update – Early August 2018. Available online: https://www.ceh.ac.uk/news-and-media/blogs/uk-hydrological-status-update-early-august-2018 (accessed on 14 February 2020).
  94. D’Agostino, V. Drought in Europe Summer 2018: Crisis Management in an Orderly Chaos. Available online: www.farm-europe.eu/blog-en/drought-in-europe-summer-2018-crisis-management-in-an-orderly-chaos/ (accessed on 14 Feb 2020).
  95. Harvey, F. UK Farmers Allowed to Take More Water from Rivers as Heatwave Continues. Available online: www.theguardian.com/environment/2018/aug/01/uk-farmers-allowed-to-take-more-water-from-rivers-as-heatwave-continues (accessed on 14 February 2020).
  96. Toreti, A.; Belward, A.; Perez-Dominguez, I.; Naumann, G.; Luterbacher, J.; Cronie, O.; Seguini, L.; Manfron, G.; Lopez-Lozano, R.; Baruth, B.; et al. The Exceptional 2018 European Water Seesaw Calls for Action on Adaptation. Earth’s Future 2019, 7, 652–663. [Google Scholar] [CrossRef]
  97. Paltan, H.A. June-July Heatwave Makes Global Impact on Water. Available online: www.globalwaterforum.org/2018/10/08/june-july-heatwave-makes-global-impact-on-water/ (accessed on 14 February 2020).
  98. Meresa, H.K. River flow characteristics and changes under the influence of varying climate conditions. Nat. Resour. Modeling 2020, 33. [Google Scholar] [CrossRef]
  99. Sivapalan, M.; Savenije, H.H.G.; Blöschl, G. Socio-hydrology: A new science of people and water: INVITED COMMENTARY. Hydrol. Process. 2012, 26, 1270–1276. [Google Scholar] [CrossRef]
  100. McMillan, H.; Montanari, A.; Cudennec, C.; Savenije, H.; Kreibich, H.; Krueger, T.; Liu, J.; Mejia, A.; Van Loon, A.; Aksoy, H.; et al. Panta Rhei 2013–2015: Global perspectives on hydrology, society and change. Hydrol. Sci. J. 2016, 1–18. [Google Scholar] [CrossRef] [Green Version]
  101. Arnell, N.W.; Halliday, S.J.; Battarbee, R.W.; Skeffington, R.A.; Wade, A.J. The implications of climate change for the water environment in England. Prog. Phys. Geogr. Earth Environ. 2015, 39, 93–120. [Google Scholar] [CrossRef] [Green Version]
  102. The National Water Management State Water Holding Polish Waters. Available online: https://stopsuszy.pl/en/about-the-project/about-the-project/ (accessed on 14 February 2020).
  103. Håkanson, L. The importance of lake morphometry and catchment characteristics in limnology – ranking based on statistical analyses. Hydrobiologia 2005, 541, 117–137. [Google Scholar] [CrossRef]
  104. Goszczyński, J. Ocena stanu środowiska wodnego jeziora Borówno wraz z tendencjami zmian oraz z oceną podatności na eutrofizację. In Ocena Aktualnego Stanu Środowiska Gruntowo-Wodnego Jeziora Borówno Wraz z Koncepcją badań i Obserwacji w Celu Ustalenia Przyczyn Zanikania Jeziora; Szumińska, D., Goszczyński, J., Smetana, J., Czapiewski, S., Eds.; Poland, 2018; Unpublished work, archive material of the District Office in Bydgoszcz. [Google Scholar]
  105. Stefanidis, K.; Papastergiadou, E. Relationships between lake morphometry, water quality, and aquatic macrophytes, in greek lakes. Fresenius Environ. Bull. 2012, 21, 3018–3026. [Google Scholar]
  106. Magee, M.R.; Wu, C.H. Response of water temperatures and stratification to changing climate in three lakes with different morphometry. Hydrol. Earth Syst. Sci. 2017, 21, 6253–6274. [Google Scholar] [CrossRef] [Green Version]
  107. Woolway, R.I.; Dokulil, M.T.; Marszelewski, W.; Schmid, M.; Bouffard, D.; Merchant, C.J. Warming of Central European lakes and their response to the 1980s climate regime shift. Clim. Chang. 2017, 142, 505–520. [Google Scholar] [CrossRef]
  108. Borowiak, D.; Nowiński, K.; Barańczuk, J. Thermal transformations of Upper Raduńskie lake during the years 1961–2005. Ozera Ta Shtuchni Vodoimi Ukr. Suchasnii Stan I Antropog. Zmini. Izd. Vnu 2008, 151–155. [Google Scholar]
  109. Perroud, M.; Goyette, S. Impacts of warmer climate on Lake Geneva water-temperature profiles. Boreal Environ. Res. 2010, 15, 255–278. [Google Scholar]
  110. Jones, I.; Sahlberg, J.; Persson, I. Modelling the Impact of Climate Change on the Thermal Characteristics of Lakes. In The Impact of Climate Change on European Lakes; George, G., Ed.; Springer: Dordrecht, The Netherlands, 2010; ISBN 978-90-481-2944-7. [Google Scholar]
  111. North, R.P.; North, R.L.; Livingstone, D.M.; Köster, O.; Kipfer, R. Long-term changes in hypoxia and soluble reactive phosphorus in the hypolimnion of a large temperate lake: Consequences of a climate regime shift. Glob. Chang. Biol. 2014, 20, 811–823. [Google Scholar] [CrossRef] [PubMed]
  112. Palmer, M.E.; Yan, N.D.; Somers, K.M. Climate change drives coherent trends in physics and oxygen content in North American lakes. Clim. Chang. 2014, 124, 285–299. [Google Scholar] [CrossRef]
  113. Anneville, O.; Gammeter, S.; Straile, D. Phosphorus decrease and climate variability: Mediators of synchrony in phytoplankton changes among European peri-alpine lakes. Freshw. Biol. 2005, 50, 1731–1746. [Google Scholar] [CrossRef]
  114. Winder, M.; Hunter, D.A. Temporal organization of phytoplankton communities linked to physical forcing. Oecologia 2008, 156, 179–192. [Google Scholar] [CrossRef]
  115. Oszczapińska, K.; Skoczko, I.; Szczykowska, J. Impact of Catchment Area Activities on Water Quality in Small Retention Reservoirs. E3s Web Conf. 2018, 30, 01013. [Google Scholar] [CrossRef] [Green Version]
  116. Arvola, L.; George, G.; Livingstone, D.M.; Järvinen, M.; Blenckner, T.; Dokulil, M.T.; Jennings, E.; Aonghusa, C.N.; Nõges, P.; Nõges, T.; et al. The Impact of the Changing Climate on the Thermal Characteristics of Lakes. In the Impact of Climate Change on European Lakes; George, G., Ed.; Springer: Dordrecht, The Netherlands, 2009; pp. 85–101. ISBN 978-90-481-2944-7. [Google Scholar]
  117. Wiśniewska, M.; Paczuska, B. Dynamics of the phytoplankton community in mesotrophic Lake Borówno. Oceanol. Hydrobiol. Stud. 2013, 42. [Google Scholar] [CrossRef] [Green Version]
  118. Gaiser, E.E.; Deyrup, N.D.; Bachmann, R.W.; Battoe, L.E.; Swain, H.M. Effects of climate variability on transparency and thermal structure in subtropical, monomictic Lake Annie, Florida. Fund. App. Lim. 2009, 175, 217–230. [Google Scholar] [CrossRef]
  119. Tilzer, M.M. Secchi disk—chlorophyll relationships in a lake with highly variable phytoplankton biomass. Hydrobiologia 1988, 162, 163–171. [Google Scholar] [CrossRef]
  120. Pernica, P.; Wells, M.G.; Sprules, W.G. Internal waves and mixing in the epilimnion of a lake affects spatial patterns of zooplankton in a body-size dependent manner: Influence of internal waves on zooplankton. Limnol. Oceanogr. Fluids Environ. 2013, 3, 279–294. [Google Scholar] [CrossRef]
  121. Mosley, L.M. Drought impacts on the water quality of freshwater systems; review and integration. Earth Sci. Rev. 2015, 140, 203–214. [Google Scholar] [CrossRef]
  122. Lutz, S.R.; Mallucci, S.; Diamantini, E.; Majone, B.; Bellin, A.; Merz, R. Hydroclimatic and water quality trends across three Mediterranean river basins. Sci. Total Environ. 2016, 571, 1392–1406. [Google Scholar] [CrossRef] [Green Version]
  123. Joel, A.; Messing, I.; Seguel, O.; Casanova, M. Measurement of surface water runoff from plots of two different sizes. Hydrol. Process. 2002, 16, 1467–1478. [Google Scholar] [CrossRef]
Figure 1. Location of Lake Borówno against the background of hydrographic division (prepared based on [61,62]).
Water 12 01348 g001
Figure 2. Total and direct catchment of Lake Borówno: (a) against the background of the numerical terrain model (prepared based on [62,63]), (b) against the background of land use (prepared based on [63,64]).
Water 12 01348 g002
Figure 3. Air temperature (t, °C), precipitation (P, mm), and relative air humidity (f, %) in the period 1951–2018 in Toruń and water consumption (cw, thousand m3) in the Dobrcz commune (prepared based on data obtained from the Polish Institute of Meteorology and Water Management—National Research Institute and Statistic Poland—Local Data Bank [44,60]).
Water 12 01348 g003
Figure 4. Changes in the building development area in: (a) the catchment of Lake Borówno, and (b) the catchment of Lakes Borówno, Kusowo, and Dobrcz (prepared based on [63,68,69]).
Water 12 01348 g004
Figure 5. Changes in the bathymetry of Lake Borówno in the years 1964–2018 (prepared on the basis of the data of IRŚ [63,71], and own measurements).
Water 12 01348 g005
Figure 6. Bathygraphic curve of Lake Borówno (prepared on the basis of bathymetric measurements conducted in 2018).
Water 12 01348 g006
Figure 7. (a) Changes in water temperature t (°C) in the vertical profile of Lake Borówno between 1984 and 2017 at the end of summer thermal stratification; (b) Changes in dissolved oxygen content (mg·O2·dm−3) in the vertical profile of Lake Borówno between 1984 and 2017 (prepared based on unpublished VIEP data).
Water 12 01348 g007
Figure 8. Changes in the Secchi disk visibility (m) in Lake Borówno in 1984–2017 (prepared based on unpublished VIEP data).
Water 12 01348 g008
Figure 9. Changes in chlorophyll a concentrations (µg·dm−3) in Lake Borówno from 1984 to 2017 (prepared based on unpublished VIEP data).
Water 12 01348 g009
Figure 10. Changes in concentrations of total phosphorus (mg·dm−3) in Lake Borówno in 1984–2017 (prepared based on unpublished VIEP data).
Water 12 01348 g010
Figure 11. Changes in concentrations of total nitrogen (mg·dm−3) in Lake Borówno in 19842017 (prepared based on unpublished VIEP data).
Water 12 01348 g011
Table 1. Dates of the measurements and sampling conducted by Voivodeship Inspectorate of Environmental Protection in Bydgoszcz VIEP and presented in this study.
Measued/Analysed Parameters19841992200220092017
18 April30 July24 March29 July20 February14 August1 April18 August27 March7 August
Temperature x x x x x
Oxygen x x x x x
Transparencyxxxxxxxxxx
Chlorophyll axxxxxxxxxx
Phytoplankton xxxxxx
Phosphorusxxxxxxxxxx
Nitrogenxxxxxxxxxx
Table 2. Land use in the catchment of Lake Borówno and the catchment of the three lakes, Borówno, Kusowo, and Dobrcz (calculated on the basis of satellite image Sentinel, 2018 [64]).
Type of Land UseCatchment of Lakes Borówno, Kusowo, and Dobrcz Lake Borówno Catchment
(ha)(%)(ha)(%)
Meadows138.917.5110.483.12
Forests141.217.6349.7914.83
Agricultural land1270.6968.68171.0250.96
Urbanised areas167.549.0558.2117.35
Water124.386.7243.6513.00
Other and wastelands7.620.412.500.74
TOTAL1850.35100.00335.65100.00
Table 3. Changes in the building development area [A] and floor area ratio [FAr] in the catchment of Lake Borówno and the catchment of Lakes Borówno, Kusowo, and Dobrcz (measured and calculation based on [63,68,69]).
Type of Building Development198720052019198720052019
A (ha)A (ha)A (ha)FAr (%)FAr (%)FAr (%)
Catchment Area of Lake Borówno
Individual recreational plots (allotment gardens) and holiday resorts15.616.718.14.65.05.4
Single-family house buildings14.623.536.34.37.010.8
Catchment Area of Borówno, Kusowo, and Dobrcz Lakes
Individual recreational plots (allotment gardens) and holiday resorts19.120.220.41.01.11.1
Single-family house buildings49.372.7107.02.73.95.8
Low-impact industrial development13.316.220.50.70.91.1
Table 4. Comparison of the surface area and the depth of Lakes Borówno, Kusowo, and Dobrcz on the basis of source materials from different years (based on: Sentinel data [64], orthophotomap [70], Inland Fisheries Institute (IRŚ) measurements [71], and own measurements).
Lake Borówno Lake Kusowo Lake Dobrcz
IRŚ Data (1964)—Area (ha)43.844.030.2
IRŚ Data (1964)—Max. depth (m)14.19.26.3
IRŚ Data (1964)—Mean depth (m)7.53.44.4
Orthophotomap (2012)—Area (ha)41.3139.1626.82
Sentinel (2018)—Area (ha)39.0632.1021.98
Lake area decrease 1964–2012 (ha)/(%)2.49/5.74.84/11.03.38/11.2
Lake area decrease 2012–2018 (ha)/(%)2.25/5.17.06/16.04.84/16.0
Lake area decrease 1964–2018 (ha)/(%)4.74/10.811.9/27.08.22/27.2
Table 5. Comparison of the altitudes of the water tables and the bottoms of Lakes Borówno, Kusowo, and Dobrcz on the basis of various source materials [71,72], and own measurements.
Lake Water/Bottom LevelDateLake Borówno Lake Kusowo Lake Dobrcz
Authors’ own study (m a.s.l.)October 201885.4681.9581.93
Authors’ own study (m a.s.l.)July 201885.52a/72.22b
IRŚ Data (m a.s.l.)196486.4a/72.3b83.0a/73.8 b83.5a/77.2 b
Prussian 1:25,000 topographic mapc (m a.s.l.)191286.483.283.5
Water Level Changes Lake BorównoLake KusowoLake Dobrcz
1912–2018 (m)−0.94−1.25−1.57
1964–2018 (m)−0.94−1.05−1.57
1912–1964 (m)0.00−0.200.00
a Water table altitude, b Bottom altitude, c The difference resulting from a different reference system for the altitudes on the maps is 0.084 m, as such, it does not significantly affect the interpretation of the lowering of the water level in the lakes.
Table 6. Morphometric data of Lake Borówno on the basis of measurements in 1964 [71], and own measurements in 2018.
Parameter19642018Change
Water level (m a.s.l.)86.485.46−0.94
Area (ha)43.839.06−4.74
Volume (×103 m3)3305.62830.64−474.96
Max. depth (m)14.113.3−0.80
Mean depth (m)7.57.23−0.27
Shoreline (m)39503817.51−132.49
Table 7. Morphometric data of Lake Borówno (prepared on the basis of bathymetric measurements conducted in 2018).
DepthPercentage of Depth Zones in Total Lake VolumeSummative Percentage in Total Lake Volume
0–2 m26.026.0
2–4 m22.148.1
4–6 m18.166.3
6–8 m15.181.3
8–10 m11.893.2
10–12 m6.499.6
12–13.3 m0.4100.0

