An Improved SCS-CN Method Incorporating Slope, Soil Moisture, and Storm Duration Factors for Runoff Prediction

1
Key Laboratory of Subsurface Hydrology and Ecological Effects in Arid Region, Chang’an University, Ministry of Education, Xi’an 710054, China
2
School of Water and Environment, Chang’an University, Xi’an 710054, China
*
Author to whom correspondence should be addressed.
Water 2020, 12(5), 1335; https://doi.org/10.3390/w12051335
Submission received: 9 April 2020
/
Revised: 4 May 2020
/
Accepted: 7 May 2020
/
Published: 8 May 2020
(This article belongs to the Special Issue Soil Conservation Service Curve Number (SCS-CN) Method Current Applications, Remaining Challenges, and Future Perspectives)
Abstract
:Soil Conservation Service Curve Number (SCS-CN) is a popular surface runoff prediction method because it is simple in principle, convenient in application, and easy to accept. However, the method still has several limitations, such as lack of a land slope factor, discounting the storm duration, and the absence of guidance on antecedent moisture conditions. In this study, an equation was developed to improve the SCS-CN method by combining the CN value with the tabulated CN2 value and three introduced factors (slope gradient, soil moisture, and storm duration). The proposed method was tested for calibration and validation with a dataset from three runoff plots in a watershed of the Loess Plateau. The results showed the model efficiencies of the proposed method were improved to 80.58% and 80.44% during the calibration and validation period, respectively, which was better than the standard SCS-CN and the other two modified SCS-CN methods where only a single factor of soil moisture or slope gradient was considered, respectively. Using the parameters calibrated and validated by dataset of the initial three runoff plots, the proposed method was then applied to runoff estimation of the remaining three runoff plots in another watershed. The proposed method reduced the root-mean-square error between the observed and estimated runoff values from 5.53 to 2.01 mm. Furthermore, the parameters of soil moisture (b1 and b2) is the most sensitive, followed by parameters in storm duration (c) and slope equations (a1 and a2), and the least sensitive parameter is the initial abstraction ratio λ on the basis of the proposed method sensitivity analysis. Conclusions can be drawn from the above results that the proposed method incorporating the three factors in the SCS method may estimate runoff more accurately in the Loess Plateau of China.
1. Introduction
The ability to make surface runoff estimations has become an essential part of development strategies in water resources management, flood control, and water and soil conservation [1]. A multitude of hydrologic models have been developed to predict direct runoff. Among these methods, the Soil Conservation Service Curve Number (SCS-CN) method [2] is one of the most widely used. The method was originally developed for surface runoff prediction, but has been applied to several other areas such as the infiltration, sediment yield, and transport of pollutants [3,4]. Moreover, it has been extensively integrated into many hydrological and ecological models [5], including AnnAGNPS (Annualized Agricultural Nonpoint Source Pollution Model) [6], CREAMS (Chemicals, Runoff, and Erosion from Agricultural Management Systems) [7], EPIC (Environmental Policy Integrated Climate) [8], SWAT (Soil and Water Assessment Tool) [9], and EBA4SUB (Event-Based Approach for Small and Ungauged Basins) [10,11].
The popularity of the SCS-CN method is due to its simplicity, convenience, widespread acceptance, applicability to ungauged watersheds, and requirement of only one parameter (CN), which is determined by four readily grasped watershed characteristics (soil group, land cover, surface condition, and antecedent moisture condition (AMC)) [12,13]. However, the SCS-CN also has some limitations such as lack of a land slope factor, discounting the storm duration, and the absence of guidance on antecedent moisture conditions [14,15,16,17,18,19]. These advantages and disadvantages made the SCS-CN method a perennial topic of discussion over the last four decades [20,21,22,23,24,25].
Storm duration is a vital part of the rainfall-runoff process, which could greatly influence runoff estimations [14]. However, the storm duration is not considered in the SCS-CN method, which leads to uncertainty in runoff prediction because of the spatiotemporal variability of rainfall [12]. Several enhanced SCS-CN methods have been proposed to overcome the problem of discounting the storm duration. Jain et al. [17] suggested a new model formulation with storm duration-based rainfall adjustment; Mishra et al. [18] presented a rainfall duration-dependent procedure by developing an equation for the new CN value with an introduced minimum CN and rainfall duration; Petroselli et al. [26] presented a model for continuous simulation and the SCS-CN method was modified to calculate the net rainfall by resolving the problem of insufficient including infiltration; Sahu et al. [27] incorporated the storm duration factor into the SCS-CN method by dividing the cumulative infiltration amount F into dynamic infiltration and static infiltration (Fc), which is a product of the minimum infiltration rate and rainfall duration; Shi et al. [25] introduced the static infiltration into the soil moisture accounting (SMA)-based SCS-CN method to improve runoff predictions on the Loess Plateau. However, all these methods have no contact with the CN value of the original SCS-CN method, which has limited the application of the models.
Antecedent moisture condition (AMC) is a significant factor determining the initial abstraction of the SCS-CN method. The AMC prior to a storm event is divided into three levels: dry (AMC 1), average (AMC 2), and wet (AMC 3) based on the five-day antecedent rainfall amount in the traditional SCS-CN method, which will cause the CN value to suddenly jump from one level to another [28]. Soil moisture seems to be a better choice for selecting an appropriate AMC value as compared with the five-day antecedent rainfall depth, and improved knowledge of the relationship between antecedent moisture and the CN value would greatly improve the runoff estimation of the SCS-CN method [29,30]. Saxton [31] redefined the antecedent moisture condition with a step function of soil water content. Koelliker [32] suggested that CN changes linearly with the soil moisture. The EPIC and SWAT models also adopted a continuous equation between soil moisture and CN for runoff prediction. Jacobs et al. [33] used remote sensing of soil moisture for CN adjustment to predict runoff in five basins of Oklahoma. Based on the climatic conditions of the Loess Plateau in China, Huang et al. [34] established an equation between soil water content and CN value for better runoff estimation.
The land slope is another main factor affecting flow movement within the landscape. The CN values in the USDA‒NRCS (US Department of Agriculture–Natural Resources and Conservation Service) handbook table are based on 5% slope, and should be adjusted according to the actual slope. Several efforts have also been made on consideration of a slope factor in the CN method. Sharpley and Williams [8] introduced a slope-adjusted CN2 in the calculation of the runoff volume, but it has not been tested in the field. Based on the data of experimental plots with slopes varying from 14% to 140% on the Loess Plateau of China, Huang et al. [15] proposed an equation for considering the influence of slope on CN value. However, there is no study that couples these factors (storm duration, soil moisture, and slope) in the SCS-CN method for predicting runoff, which would be the focus of this study.
Therefore, the objectives of this study are (1) to develop an equation of the CN value with original CN2 value, slope gradient, soil moisture, and storm duration in the conventional SCS-CN method; (2) to compare the performance of the standard SCS-CN method, those from Huang et al. [15] and Huang et al. [34], and the proposed method by observing three experimental plots in the Loess Plateau region; (3) to apply the proposed method to predict runoff from three runoff plots in the other watershed.
2. Methods
2.1. The Original SCS-CN Method
The SCS-CN method [2] was originally developed based on two fundamental hypotheses and one simple water balance equation, which can be written as follows:
where P and Q are the depth of observed rainfall and direct runoff, respectively (mm); Ia and λ are the initial abstraction (mm) and coefficient of initial abstraction (dimensionless), respectively; F is the cumulative amount of infiltration (mm); and S is the maximum potential retention (mm), which can be calculated by
where CN is in the range of 0–100 (dimensionless). This CN value is determined by the CN value (CN2) of the average moisture condition (AMC 2), which depends on land cover, soil group, and hydrologic conditions using a table from the SCS handbook [2], and is then converted to AMC 1 or AMC 3 based on the five-day-prior precipitation.
2.2. The Proposed Method
In the proposed method, slope gradient, soil moisture, and storm duration factors are considered. The CN value for each rainfall-runoff event can be improved by multiplying the reference value of SCS handbook CN2, and the function of slope, soil moisture, and storm duration:
where α is the slope gradient (m m−1), θ is soil moisture (cm3 cm−3), and t is storm duration (h). f(α), f(θ), and f(t) are functions of α, θ, and t, respectively.
The slope equation proposed by Huang et al. [15] was used to consider the influence of slope on the CN2 value. They used the modified SCS-CN method to evaluate runoff prediction in runoff plots with an 11-year observation experiment and a slope range of 14–140% in Xifeng City of the Loess Plateau. It is adopted in this study:
A nonlinear equation between CN and soil moisture was developed by Huang et al. [34], who found that the V0 value prior to each storm event can be expressed by the water storage in the upper 15 cm soil. It is also adopted and can be expressed as follows:
For the storm duration function, we proposed a one-parameter (c) equation for f(t) after several trials:
where a1, a2, b1, b2, and c are the empirical coefficients.
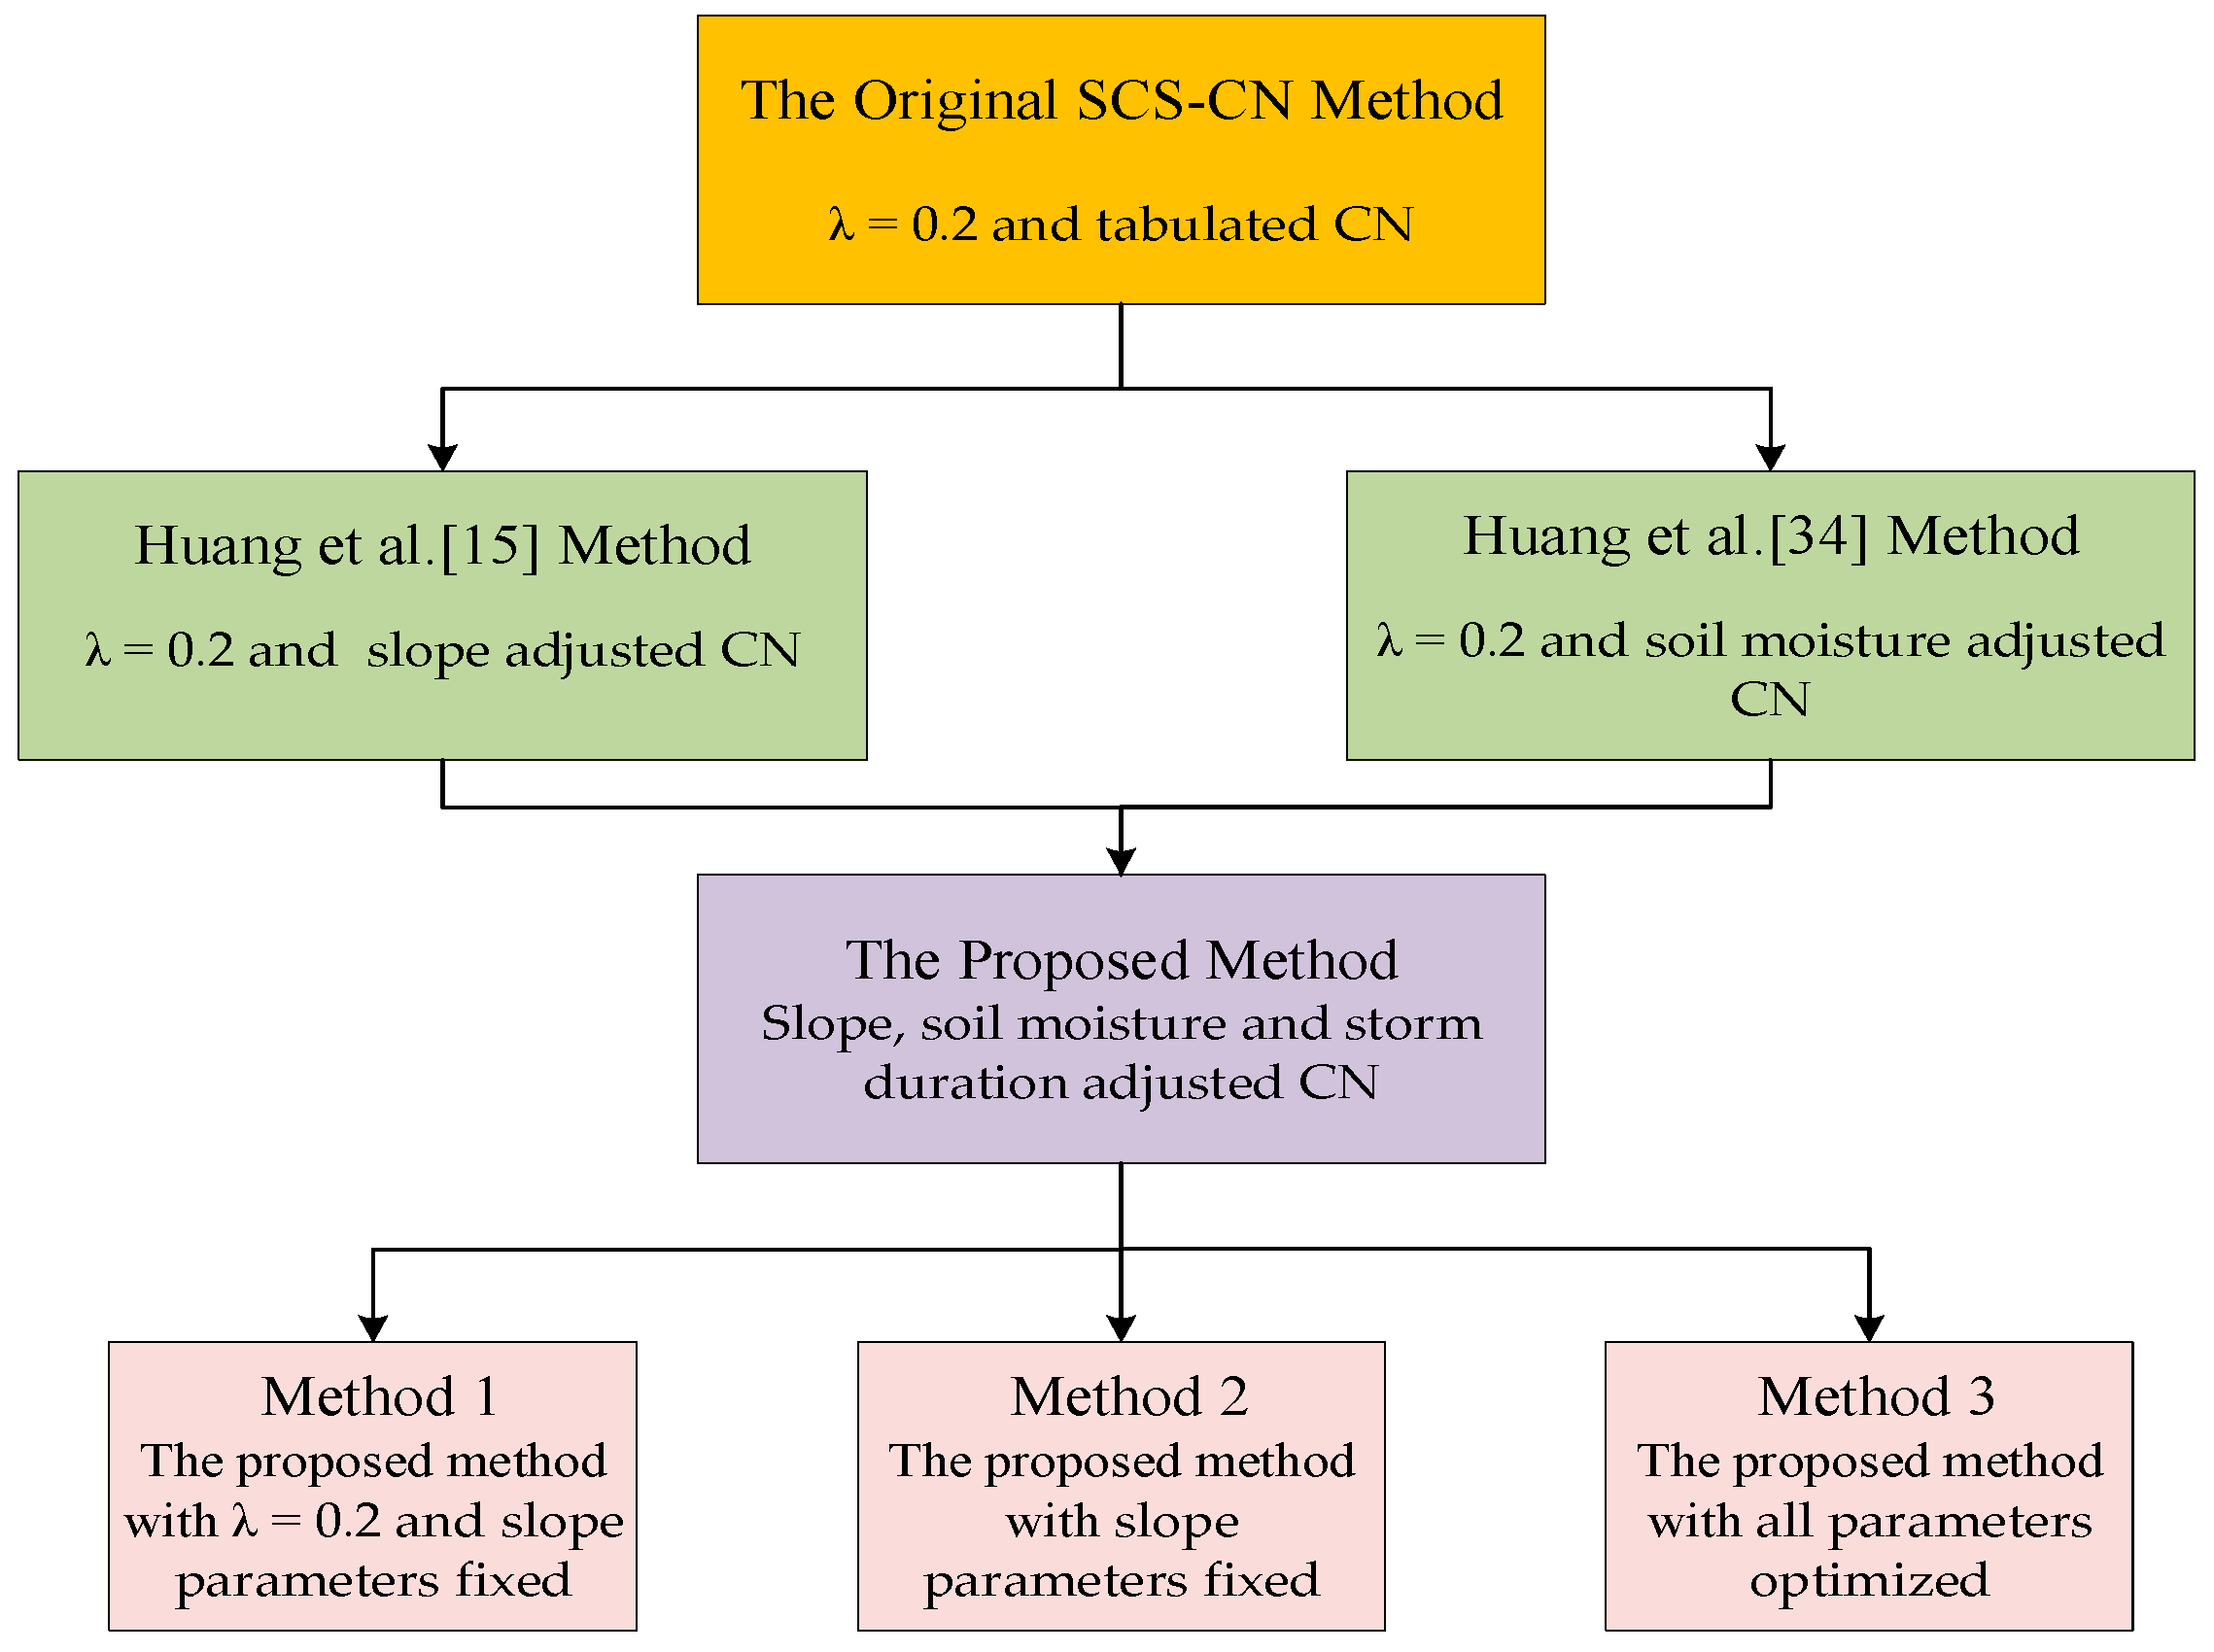
Therefore, Equations (5)–(8) combined with Equations (1)–(4) make up the proposed method for runoff prediction. The flowchart of the whole methodology applied in this study is shown in Figure 1.
2.3. Performance of the Methods
The following two statistical indices were used to evaluate the performance of the methods:
where NSE is the Nash–Sutcliffe efficiency [35,36] and RMSE is the root-mean-square error; and are the ith observed and estimated runoff, respectively; is the average measured runoff of events; and N is the total events. Higher NSE and lower RMSE values indicate that the model has better agreement with the observations.
3. Study Area and Data
3.1. Study Area
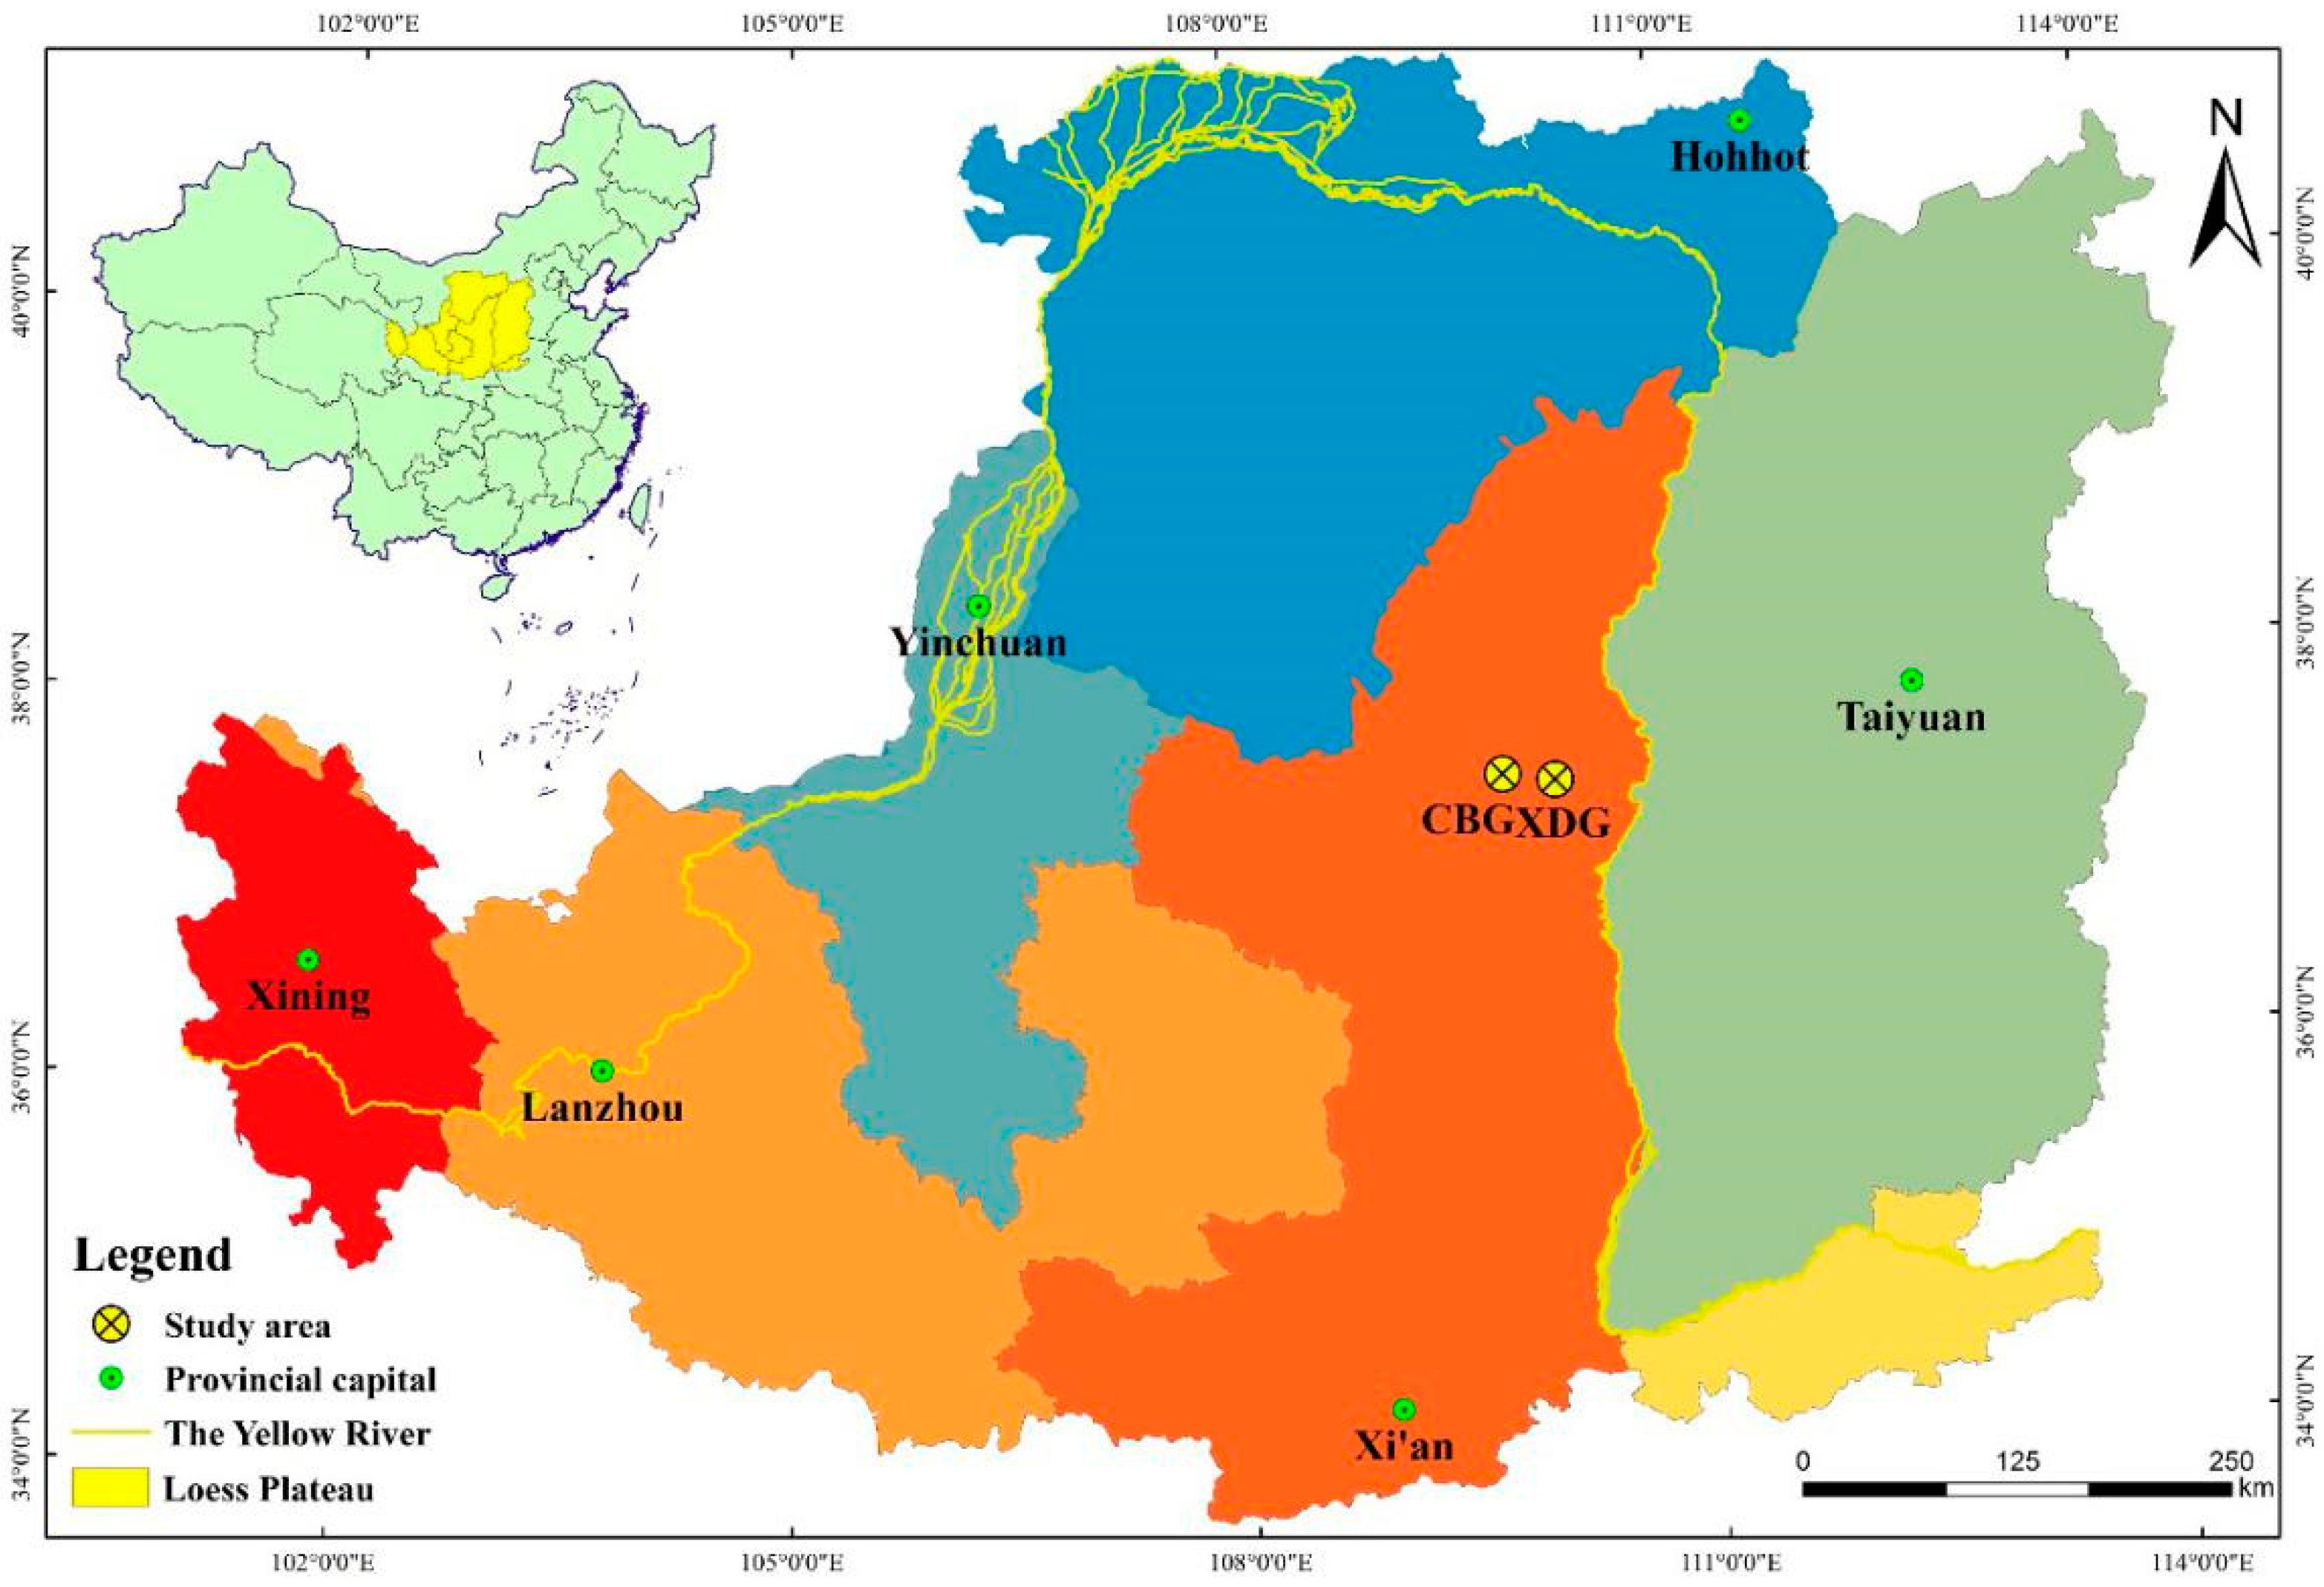
This study was conducted in six test plots, three each in the Xindiangou (XDG) and Chabagou (CBG) watersheds, which are both in the hilly region of the Loess Plateau (Figure 2).
The XDG watershed (latitude: 37°29′ N, longitude: 110°08′ E, elevation: 990–1010 MASL, area: 30 km2) is located in Suide County. The average annual temperature is 8 °C and the mean annual precipitation is 470 mm, mostly between June and September. The soil type of the XDG watershed is mainly silty loam. The characteristics of soil physical and particle size distribution are homogeneous in the top 30 cm soil [37].
The CBG watershed (latitude: 37°31′ N, longitude: 109°47′ E; elevation: 900–1100 MASL; area: 205 km2) is located in Zizhou County. The mean temperature is also 8 °C and the average annual precipitation is 450 mm. The precipitation from July to August accounts for more than 70%, most of which are heavy and short-term rainstorms. The main soil in CBG watershed is Malan loess soil, in which the content of clay particles is less than 40%, leading to the large porosity of soil and the vulnerability to erosion [38].
In the XDG watershed, alfalfa (Medicago sativa L.), sweet clover (Melilotus suavcolen), and millet (Setaria italica) were planted in the three runoff plots during the observation period from 1954 to 1959. In the CBG watershed, the three experimental plots were grown with pasture (Arundinella hirta), potatoes (Solanum tuberosum L.), and millet during the test period from 1959 to 1965, respectively (Table 1).
3.2. Data Collection
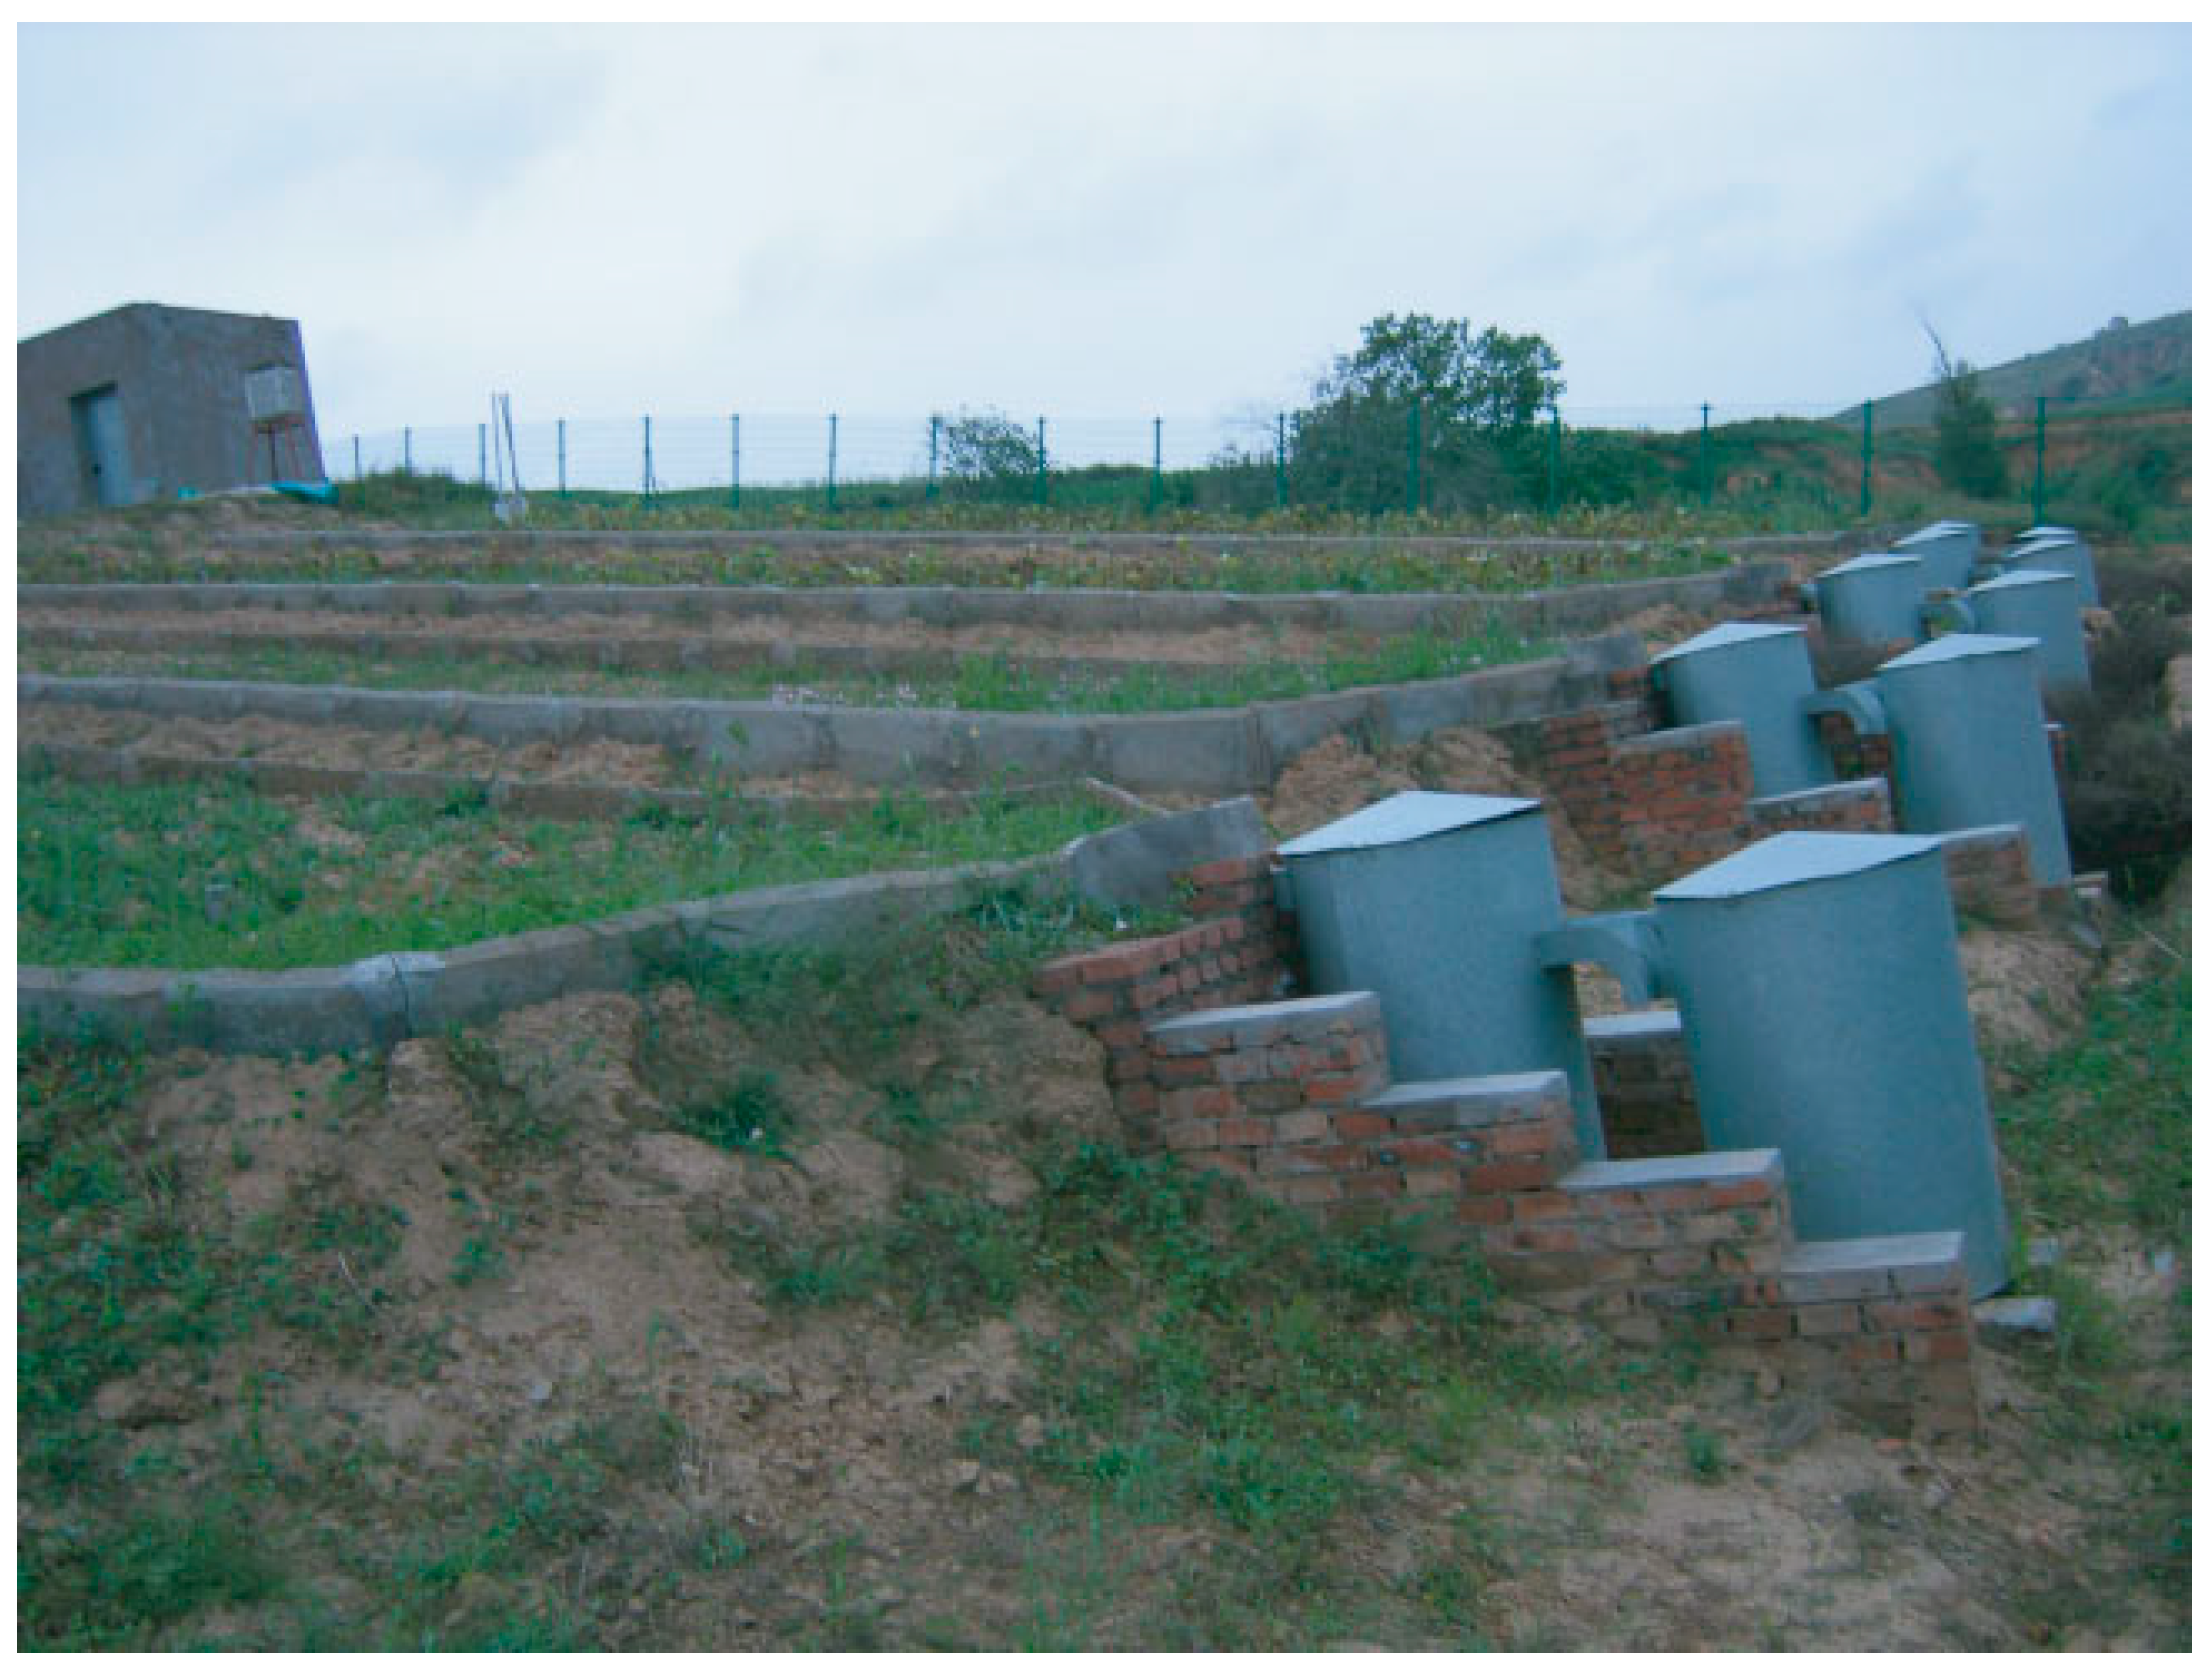
Rainfall characteristics in the six plots, including depth and duration of each rainfall, were monitored by self-recording rain gauges. For all the experimental sites in the two watersheds, the rain gauges were located less than 500 m from each experimental plot. At the downstream end of each plot, a funnel-type collector was adopted to collect the surface runoff (Figure 3). Soil samples in each plot were collected at an interval of 10 cm for 0–50 cm soil layer at 10:00 a.m. during the monitoring period, and the gravimetric water content of the collected soil samples was then determined by the oven-drying method. The water content of the top 15 cm soil could be calculated from the mean soil water measurements at 10 and 20 cm soil depth. These datasets have been compiled based on rainfall-runoff events and printed for internal use by the Yellow River Administration Committee of the Ministry of Water Resources and the Shaanxi Institute of Soil and Water Conservation.
The standard SCS-CN and proposed methods were tested using data derived from the three plots in the XDG watershed for calibration and validation, and the tested methods were then applied to the remaining three runoff plots in the CBG watershed.
3.3. Parameter Estimation
The rainfall-runoff events of the three plots in the XDG watersheds were divided into two groups: the datasets of cropland and one grassland plot were used for calibration, and the remaining datasets of another grassland plot were used for validation. The Marquardt [39] algorithm for solving constrained least squares problems was adopted to optimize all the parameters of the test methods. In order to examine the applicability of the models, λ = 0.2, assigned in its original development, is adopted for the traditional SCS-CN, Huang et al. [15], Huang et al. [34], and the proposed method (Method 1). The slope parameters (a1 and a2) obtained from Huang et al. [15] were also used for Huang et al. [15] and the proposed method (Method 1). Moreover, the effect of initial abstraction and slope on the proposed method was tested with the optimized λ (Method 2) and both optimized λ and slope parameters (Method 3).
4. Results
4.1. Model Calibration and Validation
The number of storm events observed for calibration and validation in watershed XDG was 47 and 29, respectively. Table 2 presents the parameters of the tested methods optimized with the calibration dataset. The overall performance of all tested models based on statistical indicators is compared in Table 3.
4.1.1. The Original SCS-CN Method
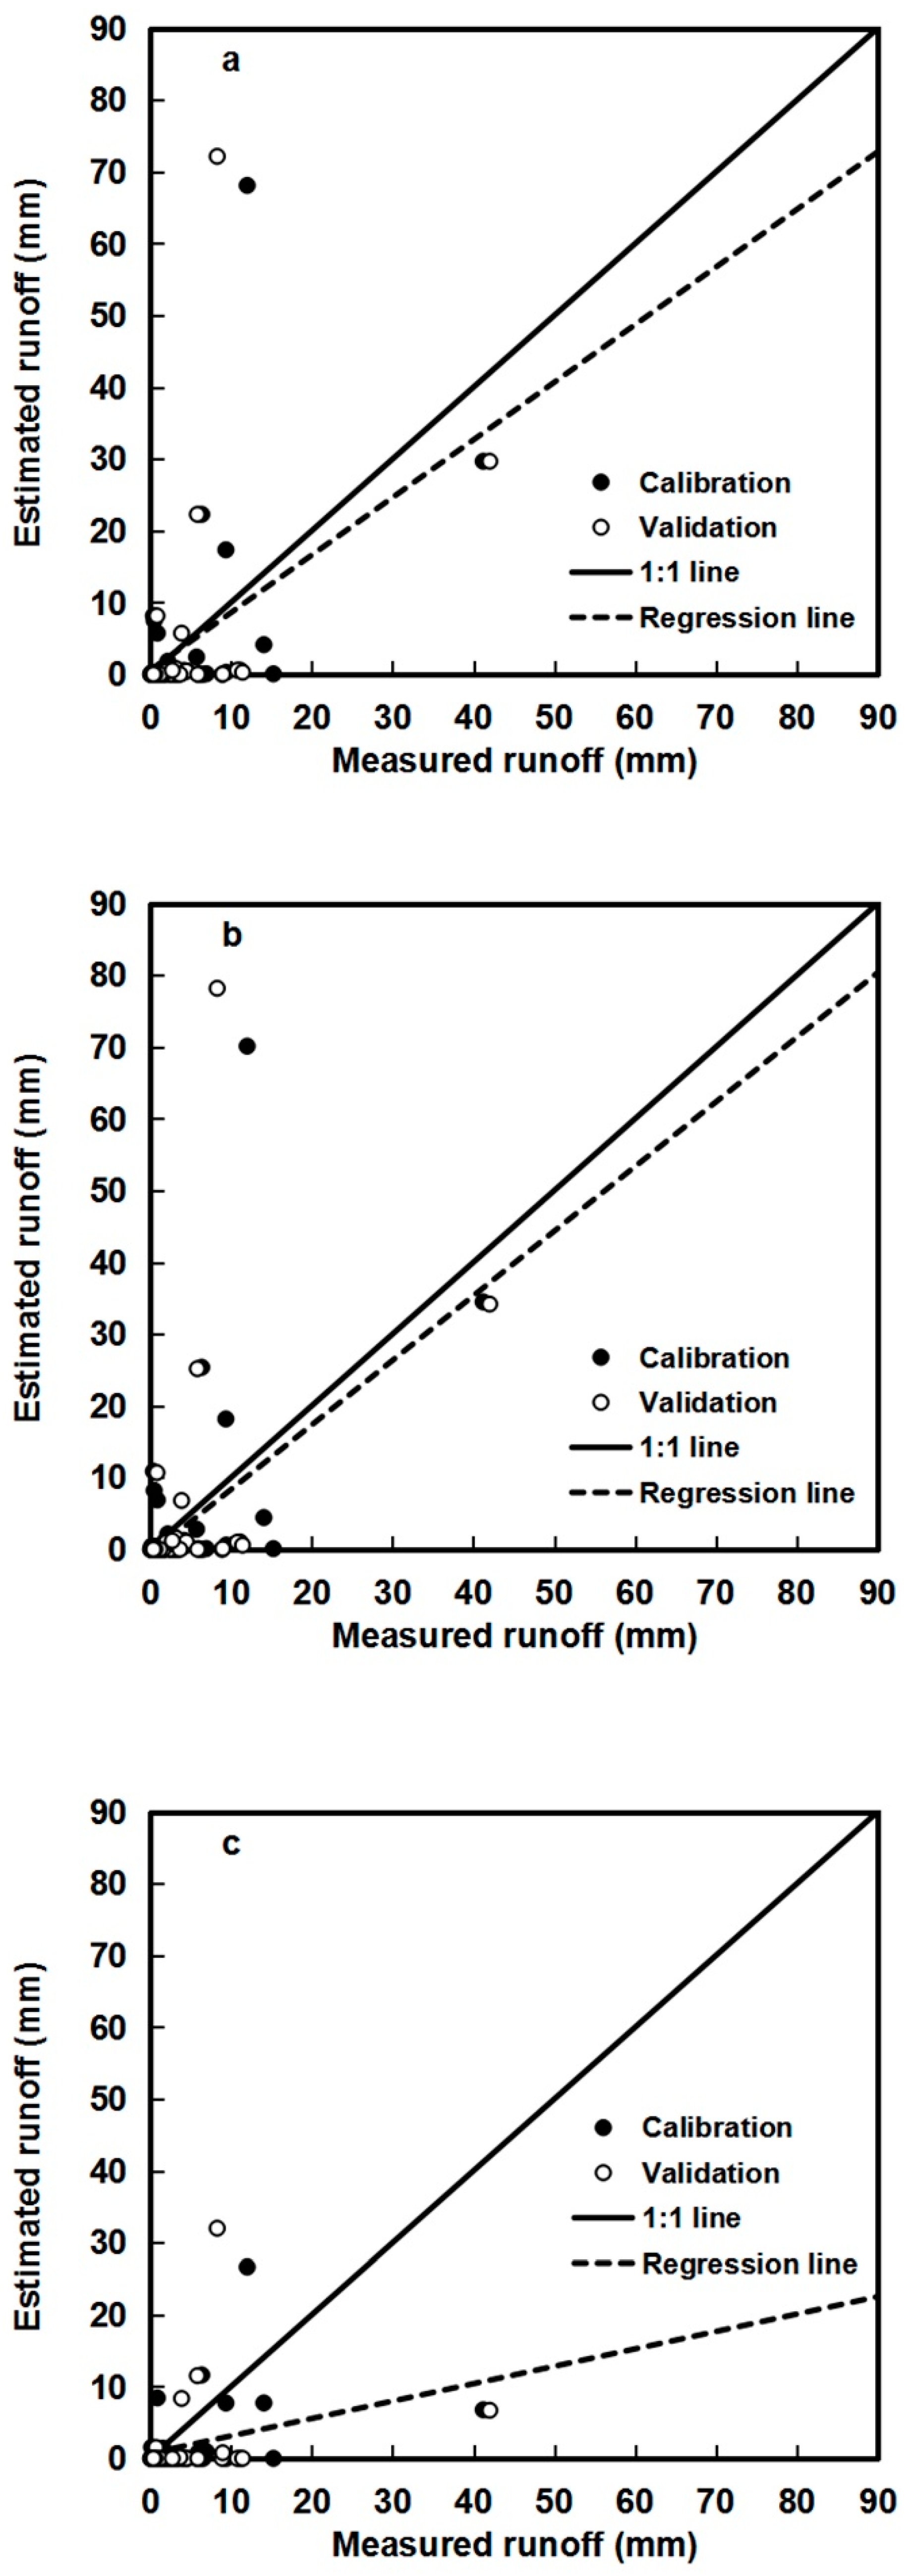
Figure 4 presents the runoff estimated by the original method plotted against the corresponding observed values for the full datasets in XDG watershed. The standard SCS-CN method underpredicted the large and overpredicted as well as underpredicted some small storm-runoff events (Figure 4a). This is also confirmed by the statistical indexes in Table 3. There is a similar pattern in the calibration and validation sub-datasets, where the slopes of regression are 0.83 and 0.77, and the NSE values is −118.64% and −182.60%, respectively (Table 3), which illustrates the poor performance of the conventional SCS-CN method.
4.1.2. The Huang et al. and Huang et al. Methods
The Huang et al. [15] and Huang et al. [34] methods incorporated the slope gradient and soil moisture condition factors into the standard SCS-CN method. The prediction of large storm-runoff events was improved with a higher slope of 0.90 using the Huang et al. [15] method as compared with the conventional SCS-CN method (0.80) (Figure 4b). However, it also overpredicted some small storm-runoff events when the slope factor is considered in the original SCS-CN method. Therefore, it can be seen that the Huang et al. [15] method did not improve the prediction accuracy of the full dataset much, as verified by the NSE value, which decreased from −148.17% (original SCS-CN method) to −177.63% (Table 3)
Table 3 also shows that the NSE value (−9.8%) of the Huang et al. [34] method during the calibration period was significantly improved as compared to the SCS-CN (−118.64%) and Huang et al. [15] method (−133.00%). The overprediction of the latter two methods incurred for some small storm-runoff events were mitigated. However, the regression slope of the Huang et al. [34] method deviates more from the 1:1 line more than the traditional SCS-CN and Huang et al. [15] method, which suggests that the former still underestimated large and overestimated as well as underestimated small runoff events (Figure 4c).
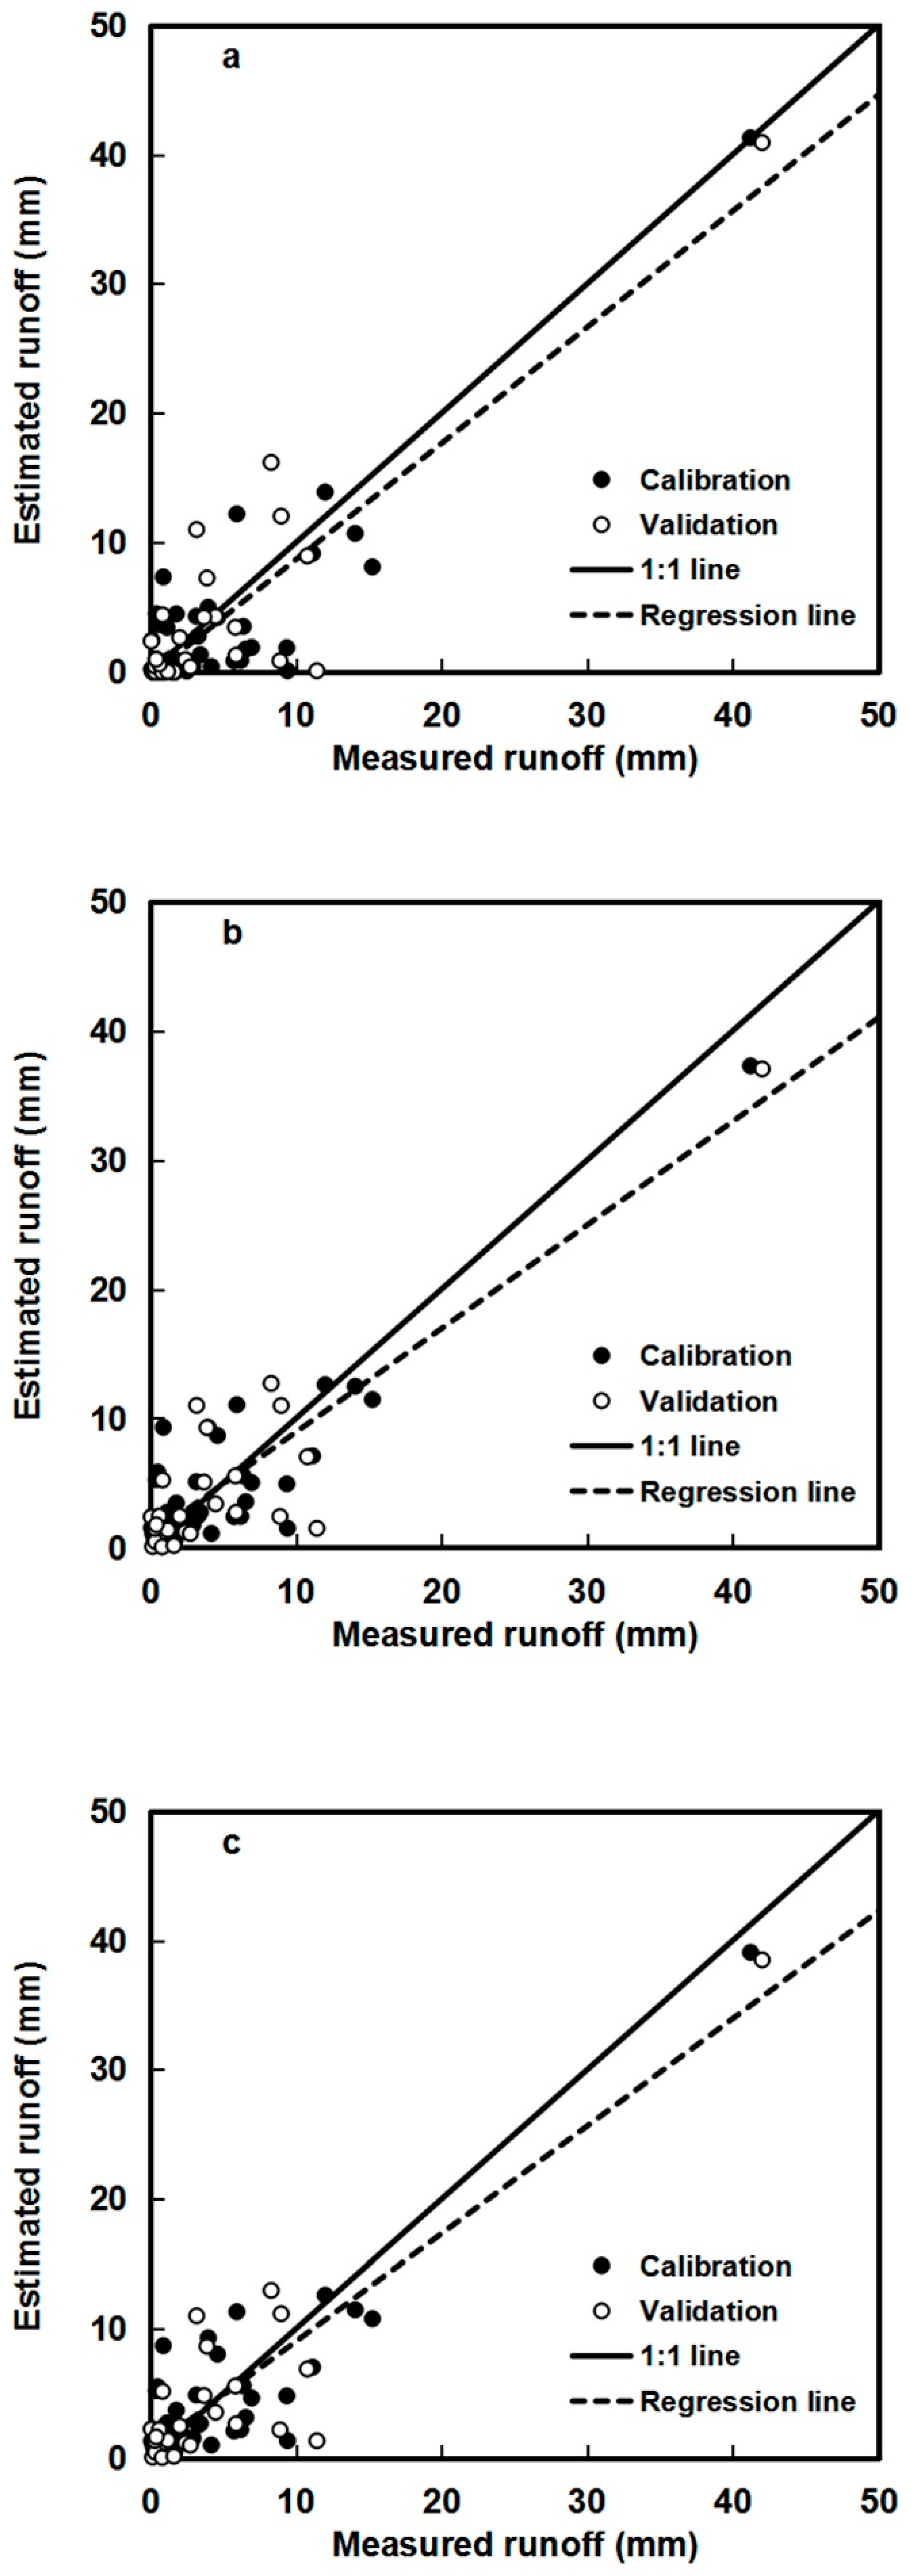
4.1.3. The Proposed Method (Methods 1–3)
The runoff estimated by Method 1 is closer to the observed values, with the coefficient of determination R2 increasing to 0.79 from 0.21 (the SCS-CN method), and the regression line of which is closer to the perfect line, where the regression line slope and intercept is 0.90 and 0.30, respectively (Table 3). Moreover, the prediction results of Method 1 are satisfactory because most of the values are closer to the perfect prediction line, and in good agreement with observed runoff even for large runoff events (Figure 5a). Method 1 yielded a larger NSE value of 75.84% and a smaller RMSE value of 3.26 mm in the calibration case, whereas the NSE value of Method 1 increases from −182.60% (the traditional SCS-CN method) to 77.45%, and the RMSE value decreased from 13.18 to 3.72 mm in the validation case (Table 3). Thus, we can conclude that Method 1 performed the best of the four methods for both the calibration and validation cases.
However, the points of Method 1 around the 1:1 line are still scattered, which might be inherent in the CN method where the initial abstraction ratio λ is set to a standard value of 0.2. The assumption that λ = 0.2 is often questioned by many scholars [12,41]. Therefore, in order to improve the SCS-CN method, we introduced Method 2 with an optimized λ based on Method 1 to test the effect of initial abstraction on the proposed method. Moreover, we also optimized the parameters in Equation (6) (a1 and a2) (Method 3) based on Method 2 to test the slope factor on the proposed method as compared with the fixed values obtained from Huang et al. [15].
Figure 5b,c presents the comparison of runoff predicted by Methods 2 and 3 and the corresponding observed values, respectively. It can be seen that the runoff estimation is a great improvement over Method 1, with observation points close to the perfect line, especially when the depths of runoff are between 10 and 20 mm. The statistics also demonstrate the predictive capacity of Methods 2 and 3 with a higher model efficiency of 80.50% and 80.95%, respectively, in Table 3. However, there is a slight improvement with Method 3, which uses an optimized slope parameter (a1 = 213.99 and a2 = 25.38), as compared with Method 2, with NSE values of 80.73% vs. 80.44% in calibration and 81.21% vs. 80.58% in validation. The results indicated that the proposed methods with optimized λ (Methods 2 and 3) could further improve the SCS-CN method for runoff prediction in this study area.
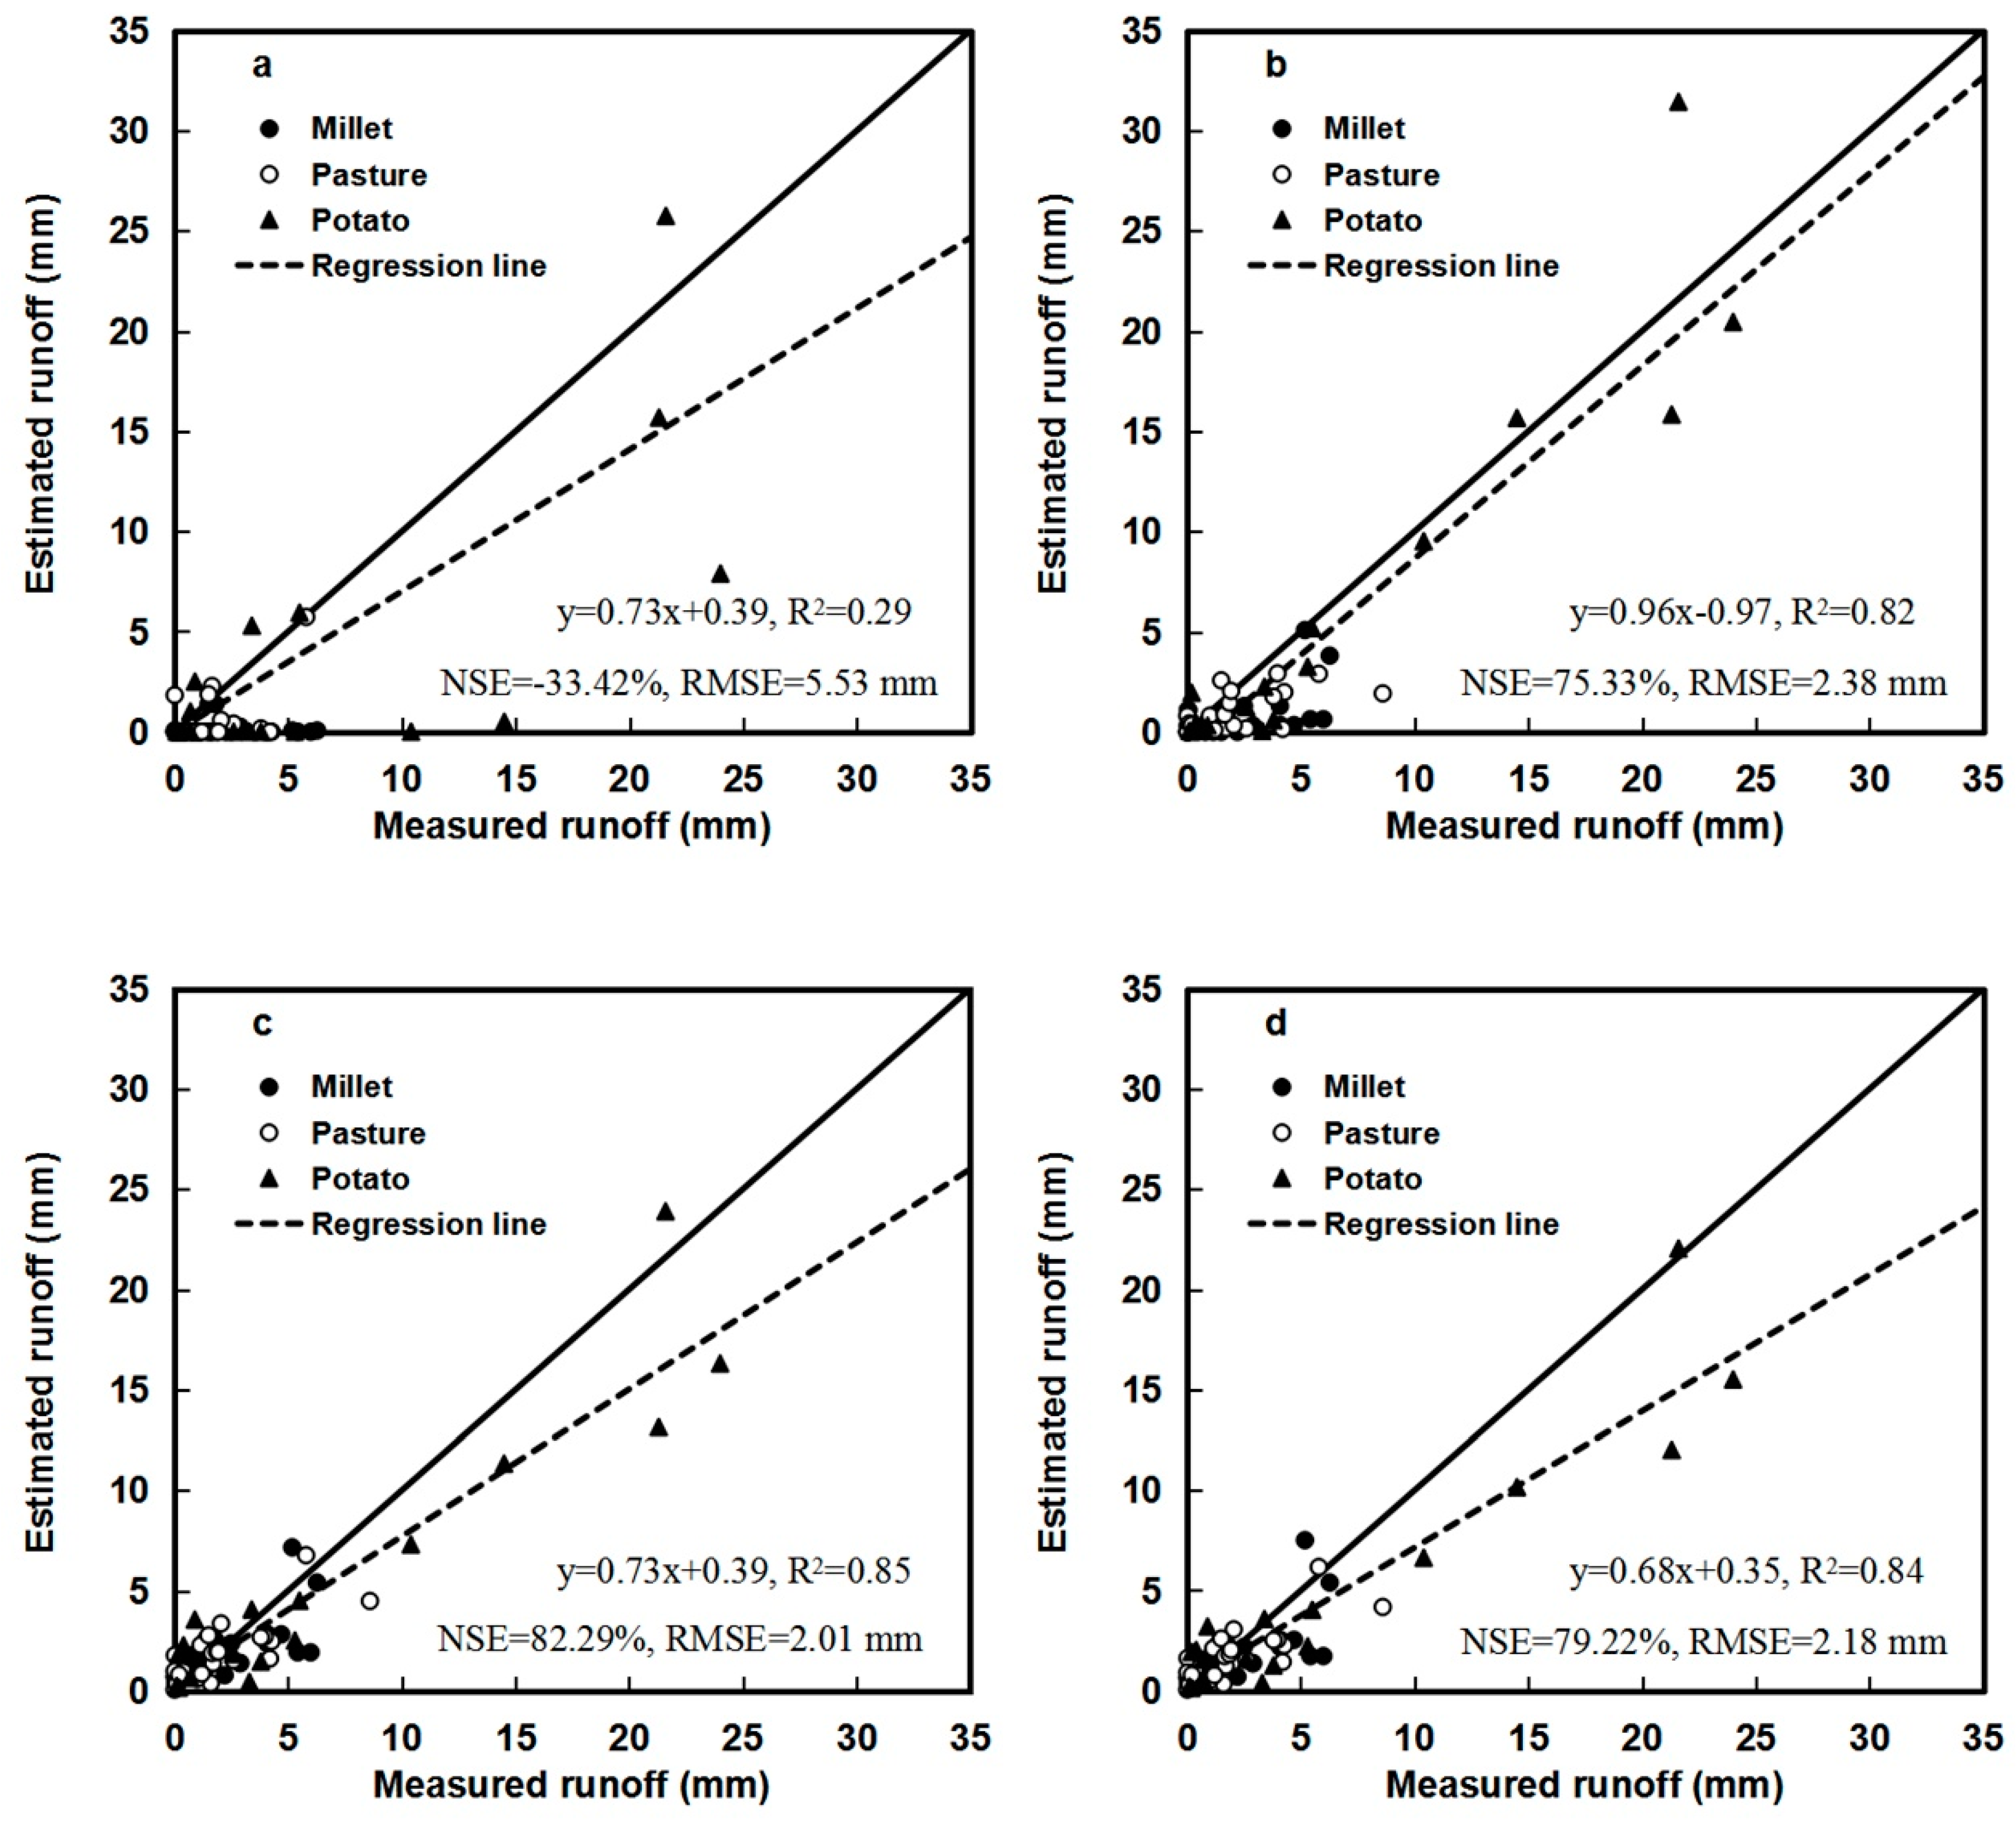
4.2. Model Application
The tested standard SCS-CN and the proposed method (Methods 1–3) using the parameters calibrated and validated by the dataset of the three plots in XDG watershed were applied to estimate runoff of the remaining three plots in the CBG watershed.
Figure 6 shows the measured versus estimated runoff values for the conventional SCS-CN and proposed method with the dataset in plots of the CBG watershed. The original SCS-CN method continued to underpredict most of the large as well as small storm-runoff events, whereas Method 1 performed better than the original SCS-CN method, with the former yielding a higher NSE (75.33%) and a smaller RMSE value (2.38 mm) (Figure 6). However, Method 1 with λ = 0.2 still underestimated some small storm-runoff events as compared with Method 2 (λ = 0.001), which achieved a higher NSE value of 82.29% and had most of its data points visibly closer to the perfect line. Moreover, Method 2, using the parameters obtained from Huang et al. [15], with data from slopes ranging from 14% to 140%, performed better than Method 3 (NSE = 79.22%), which used optimized parameters with a narrow range of slope (26.7% and 70%). Therefore, from the results of the experimental sites, Method 2 is the most suitable SCS-CN method for surface runoff estimation in the plots of the two watersheds, which may also be applicable in the Loess Plateau.
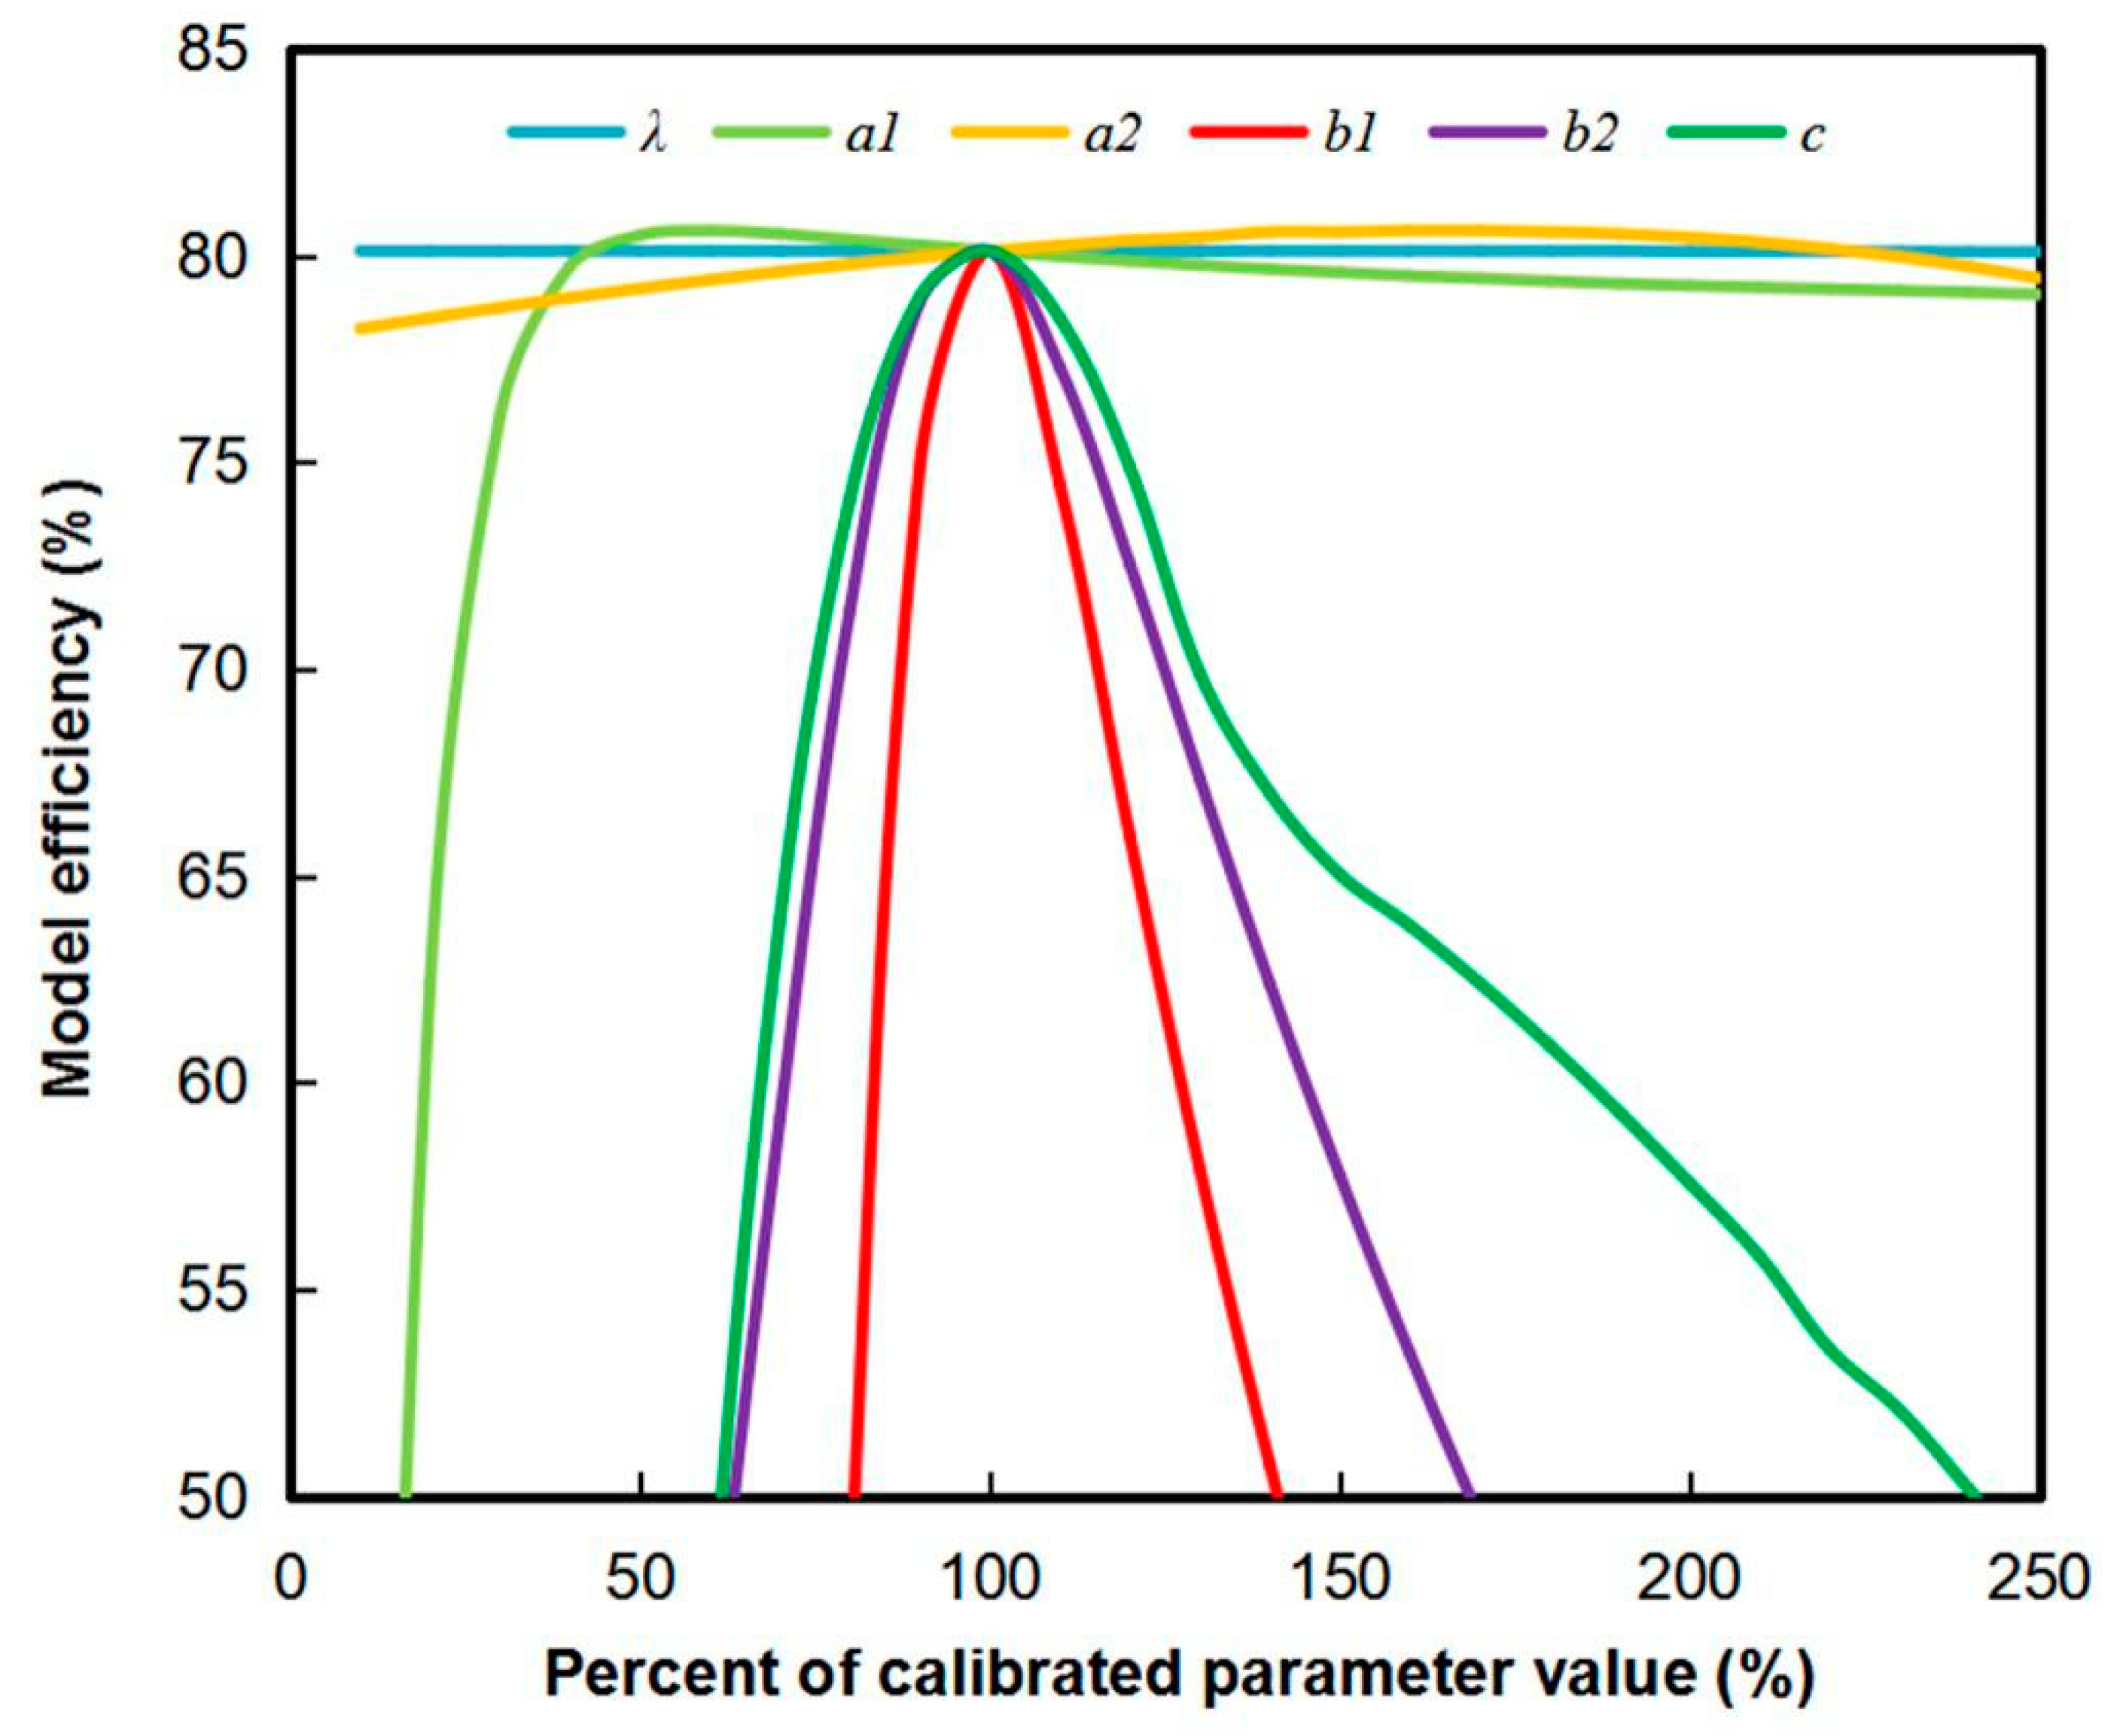
4.3. Sensitivity Analyses
The above results indicate that Method 2 predicts runoff with greater accuracy than the other SCS-CN methods. A sensitivity analysis can identify the primary parameters that affect the performance of the model. In this study, sensitivity analyses were conducted by observing the effect of a variation in the calibrated parameter on the runoff prediction in terms of NSE, using the datasets of the plots in XDG watershed.
Figure 7 presents the sensitivity of the runoff estimations to each parameter of Method 2. A sensitive variable is a parameter for which NSE changes dramatically as the parameter increases or decreases from the calibrated value. The most sensitive variable is apparently parameter b1, where the value of NSE sharply decreases from 80.58% to 47.83% as the b1 value changes in a small range of 130–80% of the calibrated value. However, the initial ratio λ appears to be the least sensitive. In general, the parameters of soil moisture (b1 and b2) are the most sensitive, followed by parameters in storm duration (c) and slope equations (a1 and a2), and the least sensitive parameter is the initial abstraction ratio λ.
5. Discussion
From the above results, the original SCS-CN method had no good performance for the three plots of the XDG watersheds in both calibration and validation cases; it still underpredicted numerous rainfall-runoff events, and it also performed poorly when applied to the plots of the CBG watershed. The poor quality of the SCS-CN method might be due to the CN value that was taken from the USDA tables [42], which need improvement either by accounting for different factors that influence runoff or rebuilding the CN values based on different climate, soil, land use, and slope conditions from a large set of monitored rainfall-runoff data. In this study, several factors that influence runoff are considered to improve the CN value. Although the Huang et al. [15] and Huang et al. [34] methods, in which single factors of slope gradient and soil moisture were considered, respectively, could enhance the performance to some extent, the improvement is limited. Overall, the above three methods did not perform as well as the proposed method. The better performance of the proposed method shows it can accurately estimate runoff in the six plots with different vegetation types in the XDG and CBG watersheds using the optimized parameters. The results are also given some understanding of the physical processes represented by incorporating the slope, soil moisture, and storm duration factors into the proposed method, which eliminated the main drawbacks of the conventional SCS-CN model.
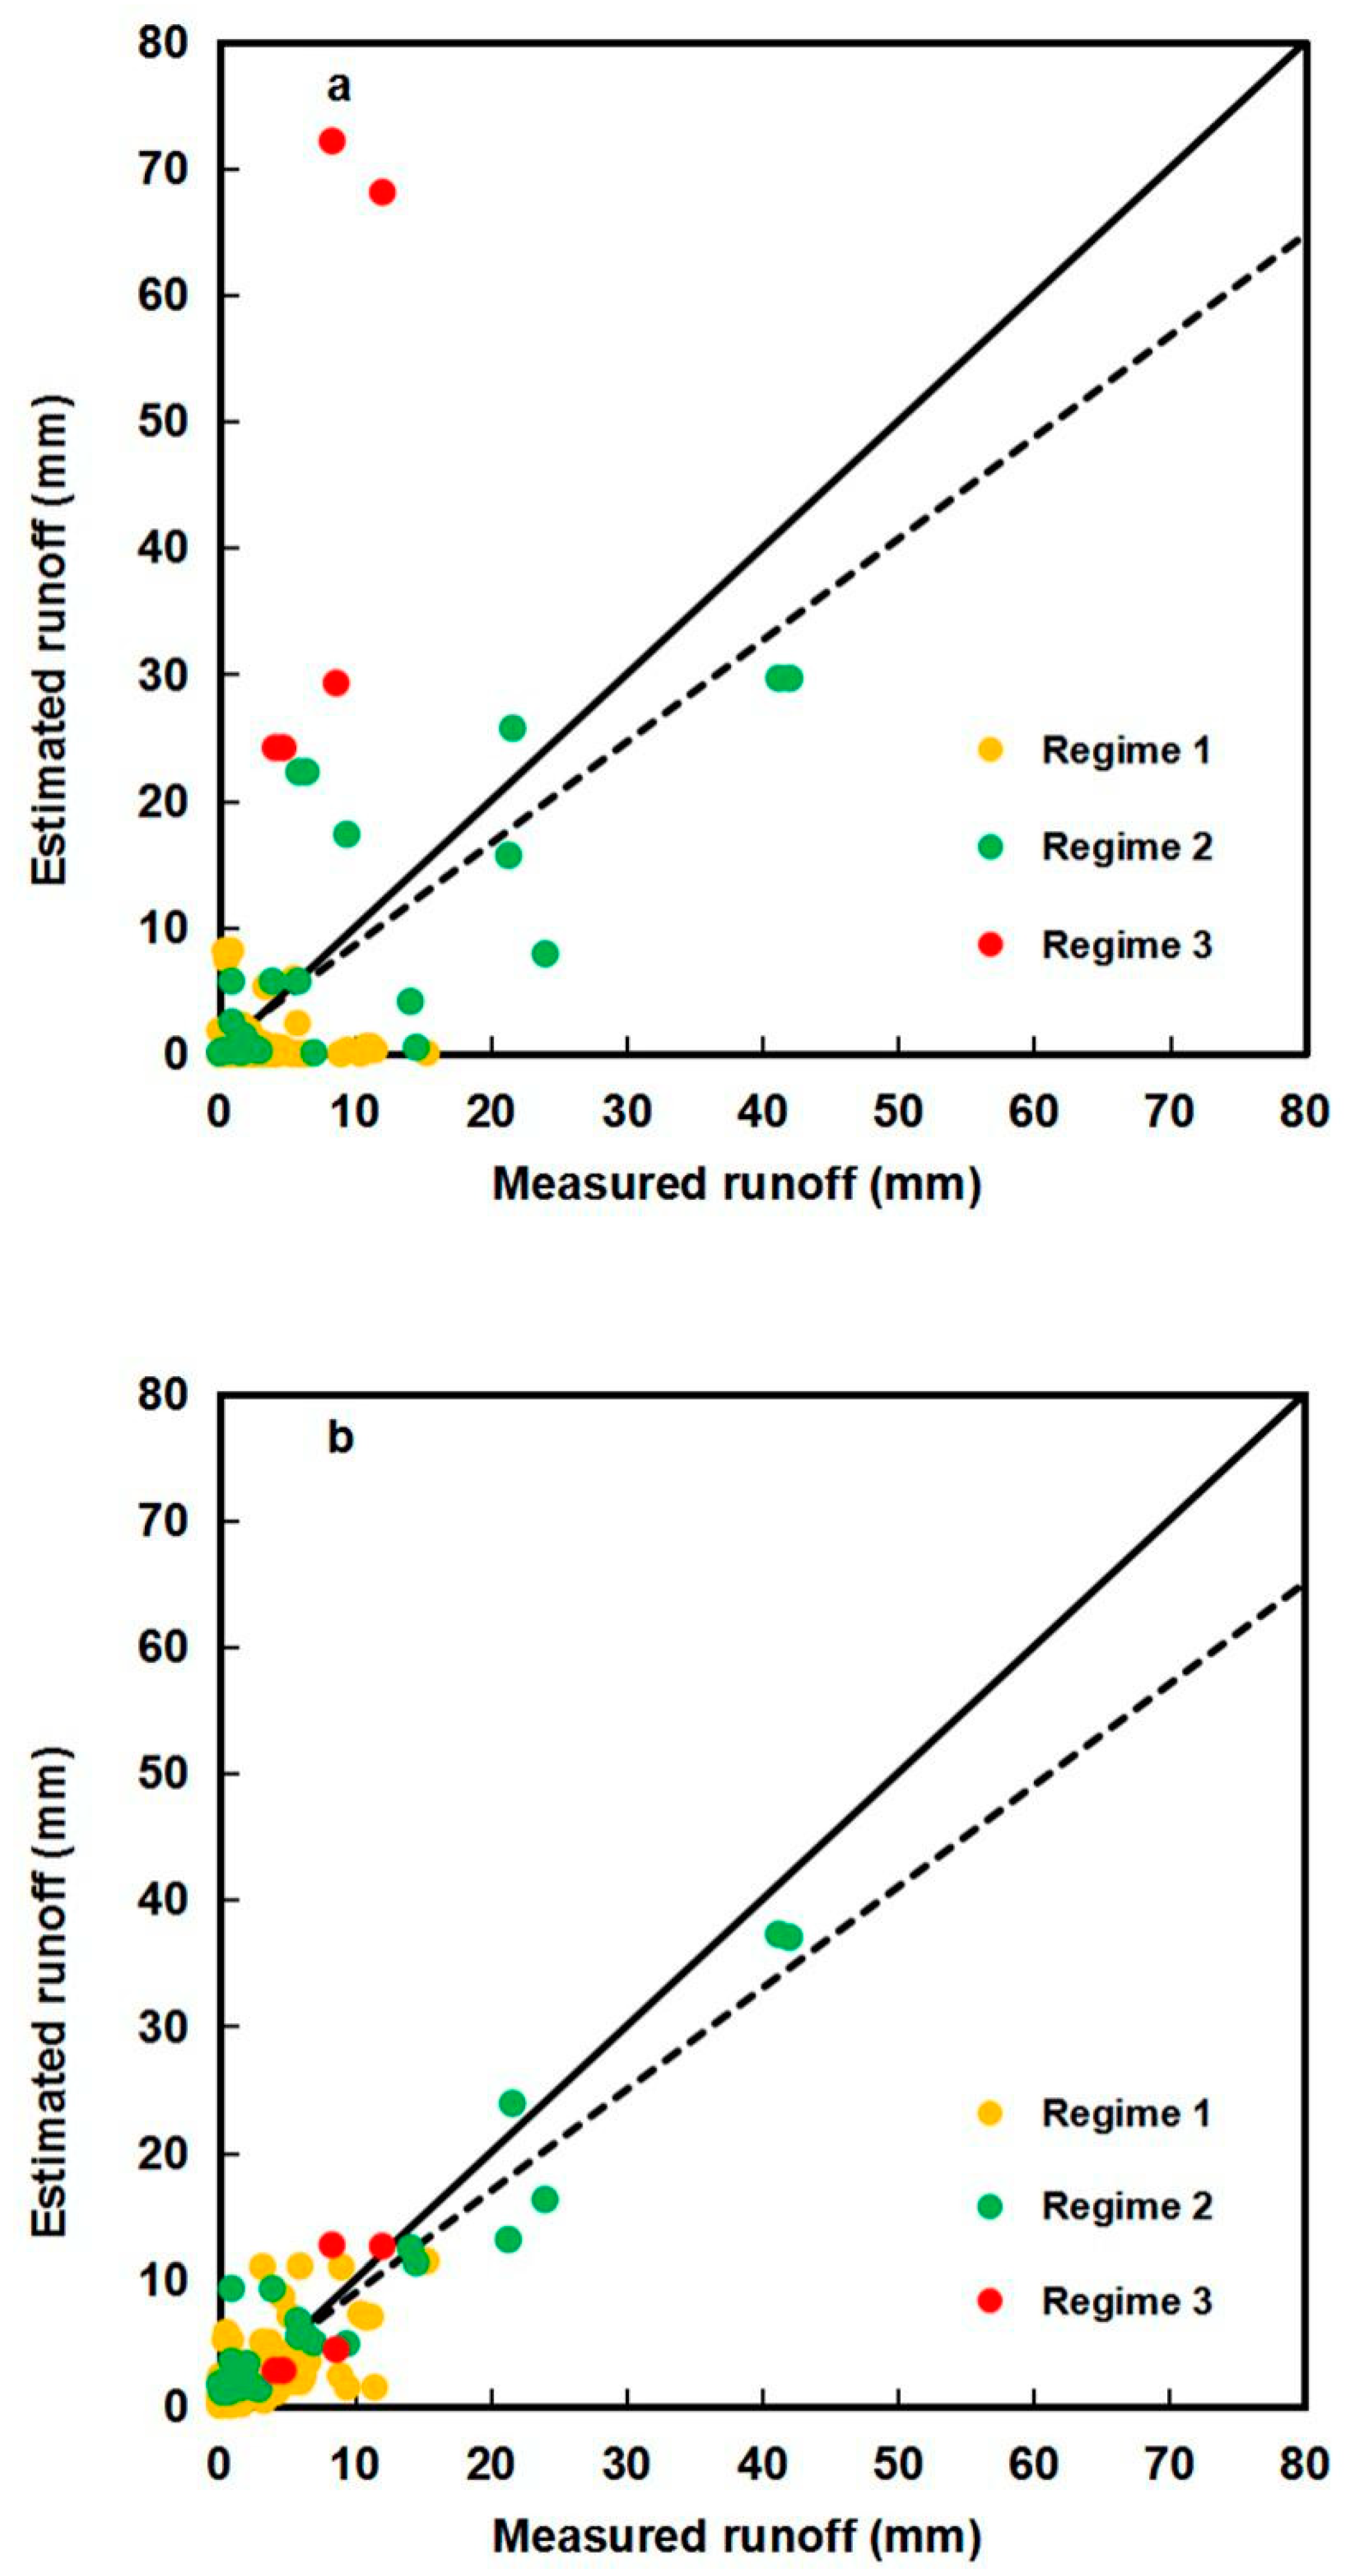
5.1. The Effect of Rainfall Duration
The characteristics of rainfall are the main driving force of runoff process, and different rainfall regimes will lead to different capacities of runoff production for each plot.
The 148 rainfall events of the six plots in the two watersheds (XDG and CBG) were divided into three categories using K-means clustering [43] based on rainfall depth and duration to test the performance of the SCS-CN method for different types of rainfall regimes (Table 4). The classification conformed to the ANOVA criterion of a significant level (*** p < 0.001). Rainfall regime 1 is a group of storm events with heavy intensity, short rainfall duration, and lower precipitation, and its occurrence frequency is the highest, accounting for 79.73% of the total events. Rainfall Regime 3 consists of storm events with low intensity, long-term duration, and low frequency (3.38%), while Rainfall Regime 2 is composed of storm events with moderate storm characteristics, i.e., shorter rainfall duration and lower precipitation than Rainfall Regime 3, but longer rainfall duration and higher precipitation than Rainfall Regime 1. In general, the descending order of average P and D is as follows: Rainfall Regime 3 > Rainfall Regime 2 > Rainfall Regime 1. This classification of rainfall regimes is consistent with Wei et al. [44] and Fang et al. [45], who also classified the rainfall into three rainfall regimes with 14 and 9 years of field measurements on the Loess Plateau, respectively.
Figure 8 shows the relationship between measured and estimated runoff values using the traditional SCS-CN and Method 2 under the three rainfall regimes. The original SCS-CN method underpredicted most storm-runoff events of the Rainfall Regime 1 and overpredicted the events of Rainfall Regime 3, while Rainfall Regime 2 performed better than Rainfall Regimes 1 and 3, but the points of Rainfall Regime 2 are still scattered around the 1:1 line (Figure 8a). This is because the SCS-CN method accounts for the rainfall amount but ignores the storm duration. The runoff predicted by the conventional SCS-CN method increased as the rainfall amount increased from Rainfall Regimes 1 to 3, while the storm duration also increased from Rainfall Regimes 1 to 3. Therefore, the measured runoff did not increase with the rainfall amount, which ultimately meant that the SCS-CN method performed poorly. However, when incorporating the storm duration in the proposed method with Equation (8), the underprediction of Rainfall Regime 1 and overprediction of Rainfall Regime 3 were removed and the performance of predicting Rainfall Regime 2 was improved, with most of its data points lying close to 1:1 as compared with the traditional SCS-CN method (Figure 8b). The better performance indicated that storm duration plays a vital role in rainfall-runoff generation and estimation, and the proposed method can account for different rainfall regime types of varying duration. Others have also confirmed that storm duration plays a significant role in both runoff production and prediction [45,46,47].
5.2. The Effect of Slope
As the slope increased, the initial abstraction, infiltration, and recession time of overland flow decreased, which resulted in less of an opportunity for infiltration and more surface runoff as compared with a horizontal surface. These drawbacks have been demonstrated by many researchers [48,49,50,51,52]. However, the CN2 of the standard SCS-CN method obtained from the handbook table [2] are based on 5% slope. Therefore, a slope equation (Equation (6)) was developed that incorporated the slope in the standard SCS-CN method for steep slope conditions.
In this study, the effect of slope is not reflected as the Huang et al. [15] method performed worse than the original SCS-CN method when accounting for the slope factor in the method. The reason is that the traditional SCS-CN has already overpredicted the storm events of Rainfall Regime 3, and the overprediction intensified when the slope factor was taken account in the Huang et al. [15] method because the runoff increased with slope gradient (Figure 4). However, when the overprediction was removed by the proposed method, the effect of slope could be found easily and as the slope increased the runoff increased.
5.3. The Effect of Soil Moisture
The antecedent moisture condition (AMC) plays a significant role in the progress of runoff. The conventional SCS-CN method divides the AMC into three levels based on the five-day antecedent rainfall amount. The measured values of CN should be continuous values for runoff prediction and are not limited to the three discrete AMC levels determined by the five-day AMC, which causes a sudden jump in runoff prediction [25]. Moreover, Koelliker [53] found that the probability of AMC2 occurring before a rainfall-runoff event was only 7%, rather than 50% [54], which indicated that the AMC value was underestimated and thereby resulted in runoff underprediction by the original SCS method. Huang et al. [34] indicated that there was no correlation between the CN value and the five-day AMC, and the tabulated CN values were less than the measured ones in most cases, which further confirmed the runoff underprediction. Therefore, the five-day AMC used in the original CN method is unreasonable.
An alternative to soil moisture for determining the AMC would be to use direct measured or predicted soil moisture prior to a storm event, instead of antecedent rainfall, which is a vital factor in determining the initial abstraction of the SCS method. The rainfall-runoff prediction will be greatly enhanced by improving knowledge of antecedent moisture [29,30]. The results of the Huang et al. [34] method performed better than Huang et al. [15] and the standard SCS-CN method (Figure 4), which indicated that the equation of soil moisture (Equation (7)) is more suitable for AMC than the antecedent five-day rainfall.
In the new CN value, three factors of slope, soil moisture, and storm event were introduced, which represented the land condition, antecedent moisture, and characteristics of the storm event, respectively; all three factors have a great influence on runoff. However, as compared with the Huang et al. [15] and Huang et al. [34] methods, the performance of Method 1 was significantly improved after accounting for the storm duration factor (Table 3). Thus, storm duration has a greater effect on the runoff prediction of the SCS-CN method, which has frequently been ignored in other modified SCS-CN methods, followed by soil moisture and slope. Moreover, λ = 0.001 is more appropriate for the initial abstraction coefficient in this study area according to the comparison between Method 1 and 2; the same conclusion was also obtained by Huang et al. [34] for four plots in the Loess Plateau. The slope parameters in Method 2, which is obtained from Huang et al. [15] with data from slopes ranging from 14% to 140%, are also more suitable for application as compared with Method 3. This inference can be further confirmed by the sensitivity analysis, which also suggested that the initial abstraction ratio λ and the slope parameters (a1 and a2) are less sensitive, so Method 2 can be applied to similar sub-humid, semi-arid, and arid regions with the optimized parameters, but may need adjustment for humid regions because the soil moisture and rainfall may differ from the tested results in this study.
6. Conclusions
In this study, an equation was developed to improve the SCS-CN method by combining the CN value with the tabulated CN2 value and three introduced factors (slope gradient, soil moisture, and storm duration). Six models including the original SCS-CN method, Huang et al. [15], Huang et al. [34], and the proposed method with different optimized parameters (Methods 1–3) were used to test the reliability of the data from three runoff plots in the XDG watersheds of Loess Plateau. Subsequently, using the parameters calibrated and validated by dataset of the initial three runoff plots, the proposed method was then applied to runoff estimation of the remaining three runoff plots in CBG watershed. High NSE and low RMSE values during the calibration, validation, and application period indicated the proposed method can estimate runoff accurately for six plots in two watersheds and had greater reliability than the standard SCS-CN, Huang et al. [15], and Huang et al. [34] methods. Moreover, Method 2 with an initial abstraction ratio of λ = 0.001 rather than the standard value of 0.2 and slope parameters obtained from Huang et al. [15] with data from slopes ranging from 14% to 140% seems to be the most promising SCS method for runoff estimation in the experimental plots of the Loess Plateau. Furthermore, the parameters of soil moisture (b1 and b2) are the most sensitive, followed by parameters in storm duration (c) and slope equations (a1 and a2), and the least parameter is the initial abstraction ratio λ on the basis of the proposed method sensitivity analysis.
Author Contributions
Conceptualization, N.W.; Data curation, N.W.; Methodology, W.S.; Writing—original draft, W.S. All authors have read and agreed to the published version of the manuscript.
Funding
This study was supported by the China Postdoctoral Science Foundation (2019M663917XB).
Acknowledgments
The authors thank the assistant editor and three anonymous referees for their useful advice and suggestions.
Conflicts of Interest
The authors declare no conflict of interest.
Data Availability Statement
The data that support the findings of this study are available on request from the corresponding author.
References
- Shi, Z.H.; Chen, L.D.; Fang, N.F.; Qin, D.F.; Cai, C.F. Research on the SCS-CN initial abstraction ratio using rainfall-runoff event analysis in the Three Gorges Area, China. Catena 2009, 77, 1–7. [Google Scholar] [CrossRef]
- SCS. National Engineering Handbook, Section 4; Soil Conservation Service USDA: Washington, DC, USA, 1972. [Google Scholar]
- Shi, W.H.; Huang, M.B.; Barbour, S.L. Storm-based CSLE that incorporates the estimated runoff for soil loss prediction on the Chinese Loess Plateau. Soil Tillage Res. 2018, 180, 137–147. [Google Scholar] [CrossRef]
- Shi, W.H.; Huang, M.B.; Wu, L.H. Prediction of storm-based nutrient loss incorporating the estimated runoff and soil loss at a slope scale on the Loess Plateau, China. Land Degrad. Dev. 2018, 29, 2899–2910. [Google Scholar] [CrossRef]
- Kaffas, K.; Hrissanthou, V. Estimate of continuous sediment graphs in a basin, using a composite mathematical model. Environ. Process. 2015, 2, 361–378. [Google Scholar] [CrossRef] [Green Version]
- Baginska, B.; Milne-Home, W.; Cornish, P.S. Modelling nutrient transport in Currency Creek, NSW with AnnAGNPS and PEST. Environ. Model. Softw. 2003, 18, 801–808. [Google Scholar] [CrossRef]
- Knisel, W.G. CREAMS: A field-scale model for chemical, runoff and erosion from agricultural management systems. In Conservation Research Report, Volume 26; South East Area, US Department of Agriculture: Washington, DC, USA, 1980. [Google Scholar]
- Sharpley, A.N.; Williams, J.R. EPIC-Erosion/Productivity Impact Calculator: 1. Model Documentation; U.S. Department of Agriculture Technical Bulletin No. 1768; U.S. Government Printing Office: Washington, DC, USA, 1990.
- Arnold, J.G.; Moriasi, D.N.; Gassman, P.W.; Abbaspour, K.C.; White, M.J.; Srinivasan, R.; Santhi, C.; Harmel, R.D.; Van Griensven, A.; Van Liew, M.W. SWAT: Model use, calibration and validation. Trans. ASABE 2012, 55, 1491–1508. [Google Scholar] [CrossRef]
- Petroselli, A.; Grimaldi, S. Design hydrograph estimation in small and fully ungauged basins: A preliminary assessment of the EBA4SUB framework. J. Flood Risk Manag. 2018, 11, S197–S210. [Google Scholar] [CrossRef]
- Vojtek, M.; Petroselli, A.; Vojteková, J.; Asgharinia, S. Flood inundation mapping in small and ungauged basins: Sensitivity analysis using the EBA4SUB and HEC-RAS modeling approach. Hydrol. Res. 2019, 50, 1002–1019. [Google Scholar] [CrossRef] [Green Version]
- Ponce, V.M.; Hawkins, R.H. Runoff curve number: Has it reached maturity? J. Hydrol. Eng. ASCE 1996, 1, 11–19. [Google Scholar] [CrossRef]
- Bhuyan, S.J.; Mankin, K.R.; Koelliker, J.K. Watershed-scale AMC selection for hydrologic modeling. Trans. ASABE 2003, 46, 237–244. [Google Scholar] [CrossRef]
- Babu, P.S.; Mishra, S.K. Improved SCS-CN–inspired model. J. Hydrol. Eng. 2012, 17, 1164–1172. [Google Scholar] [CrossRef]
- Huang, M.; Gallichand, J.; Wang, Z.; Goulet, M. A modification to the Soil Conservation Service curve number method for steep slopes in the Loess Plateau of China. Hydrol. Process. 2006, 20, 579–589. [Google Scholar] [CrossRef]
- Grimaldi, S.; Petroselli, A.; Romano, N. Green-Ampt Curve-Number mixed procedure as an empirical tool for rainfall-runoff modelling in small and ungauged basins. Hydrol. Process. 2013, 27, 1253–1264. [Google Scholar] [CrossRef]
- Jain, M.K.; Mishra, S.K.; Babu, P.S.; Venugopal, K.; Singh, V.P. Enhanced runoff curve number model incorporating storm duration and a nonlinear Ia‒S relation. J. Hydrol. Eng. 2006, 11, 631–635. [Google Scholar] [CrossRef]
- Mishra, S.K.; Jain, M.K.; Babu, P.S.; Venugopal, K.; Kaliappan, S. Comparison of AMC-dependent CN-conversion formulae. Water Resour. Manag. 2008, 22, 1409–1420. [Google Scholar] [CrossRef]
- Singh, P.K.; Mishra, S.K.; Berndtsson, R.; Jain, M.K.; Pandey, R.P. Development of a modified SMA based MSCS-CN model for runoff estimation. Water Resour. Manag. 2015, 29, 4111–4127. [Google Scholar] [CrossRef]
- Hawkins, R.H. The importance of accurate curve numbers in the estimation of storm runoff. Water Resour. Bull. 1975, 11, 887–891. [Google Scholar] [CrossRef]
- Hawkins, R.H. Asymptotic determination of runoff curve numbers from data. J. Irrig. Drain. Eng. ASCE 1993, 119, 334. [Google Scholar] [CrossRef]
- Jiao, P.; Xu, D.; Wang, S.; Yu, Y.; Han, S. Improved SCS-CN method based on storage and depletion of antecedent daily precipitation. Water Resour. Manag. 2015, 29, 4753–4765. [Google Scholar] [CrossRef]
- Michel, C.; Andréassian, V.; Perrin, C. Soil conservation service curve number method: How to mend a wrong soil moisture accounting procedure? Water Resour. Res. 2005, 41. [Google Scholar] [CrossRef]
- Sahu, R.K.; Mishra, S.K.; Eldho, T.I. An improved AMC-coupled runoff curve number model. Hydrol. Process. 2010, 24, 2834–2839. [Google Scholar] [CrossRef]
- Shi, W.H.; Huang, M.B.; Gongadze, K.; Wu, L.H. A modified SCS-CN method incorporating storm duration and antecedent soil moisture estimation for runoff prediction. Water Resour. Manag. 2017, 31, 1713–1727. [Google Scholar] [CrossRef]
- Petroselli, A.; Grimaldi, S.; Piscopia, R.; Tauro, F. Design hydrograph estimation in small and ungauged basins: A comparative assessment of event based (EBA4SUB) and continuous (COSMO4SUB) modelling approaches. Acta Sci. Pol. Form. Circumiectus 2019, 18, 113–124. [Google Scholar]
- Sahu, R.K.; Mishra, S.K.; Eldho, T.I. Improved storm duration and antecedent moisture condition coupled SCS-CN concept-based model. J. Hydrol. Eng. 2012, 17, 1173–1179. [Google Scholar] [CrossRef]
- Hawkins, R.H. Runoff curve numbers with varying site moisture. J. Irrig. Drain. Div. 1978, 104, 389–398. [Google Scholar] [CrossRef]
- Wood, E.F. An analysis of the effects of parameter uncertainty in deterministic hydrologic models. Water Resour. Res. 1976, 12, 925–932. [Google Scholar] [CrossRef]
- Michele, C.D.; Salvadori, G. On the flood frequency distribution: Analytical formulation and the influence of antecedent soil moisture condition. J. Hydrol. 2002, 262, 245–258. [Google Scholar] [CrossRef]
- Saxton, K.E. User’s Manual for SPAW: A Soil-Plant-Atmosphere Water Model; USDA-ARS: Pullman, WA, USA, 1992. [Google Scholar]
- Koelliker, J.K. User’s Manual of Potential Yield Model Revised (POTYLDR); Kansas State University, Department of Biological and Agricultural Engineering: Manhattan, KS, USA, 1994. [Google Scholar]
- Jacobs, J.M.; Myers, D.A.; Whitfield, B.M. Improved rainfall/runoff estimates using remotely sensed soil moisture. J. Am. Water. Resour. Assoc. 2003, 39, 313–324. [Google Scholar] [CrossRef]
- Huang, M.; Gallichand, J.; Dong, C.; Wang, Z.; Shao, M. Use of soil moisture data and curve number method for estimating runoff in the Loess Plateau of China. Hydrol. Process. 2007, 21, 1471–1481. [Google Scholar] [CrossRef]
- Nash, J.E.; Sutcliffe, J.E. River flow forecasting through conceptual models: Part I-A discussion of principles. J. Hydrol. 1970, 10, 282–290. [Google Scholar] [CrossRef]
- Risse, L.M.; Nearing, M.A.; Savabi, M.R. Determining the Green-Ampt effective hydraulic conductivity from rainfall-runoff data for the WEEP model. Trans. ASAE 1994, 37, 411–418. [Google Scholar] [CrossRef]
- Liu, B.Y.; Nearing, M.A.; Risse, L.M. Slope gradient effects on soil loss for steep slopes. Trans. ASAE 1994, 37, 1835–1840. [Google Scholar] [CrossRef]
- Kimura, R.; Liu, Y.; Takayama, N.; Zhang, X.; Kamichika, M.; Matsuoka, N. Heat and water balances of the bare soil surface and the potential distribution of vegetation in the Loess Plateau, China. J. Arid Environ. 2005, 63, 439–457. [Google Scholar] [CrossRef]
- Marquardt, D.W. An algorithm for least-squares estimation of nonlinear parameters. J. Soc. Ind. Appl. Math. 1963, 11, 431–441. [Google Scholar] [CrossRef]
- Ritter, A.; Muñoz-Carpena, R. Performance evaluation of hydrological models: Statistical significance for reducing subjectivity in goodness-of-fit assessments. J. Hydrol. 2013, 480, 33–45. [Google Scholar] [CrossRef]
- Baltas, E.A.; Dervos, N.A.; Mimikou, M.A. Technical Note: Determination of the SCS initial abstraction ratio in an experimental watershed in Greece. Hydrol. Earth Syst. Sci. 2007, 11, 1825–1829. [Google Scholar] [CrossRef] [Green Version]
- Walega, A.; Amatya, D.M.; Caldwell, P.; Marion, D.; Panda, S. Assessment of storm direct runoff and peak flow rates using improved SCS-CN models for selected forested watersheds in the Southeastern United States. J. Hydrol. Reg. Stud. 2020, 27, 100645. [Google Scholar] [CrossRef]
- Hong, N. Products and Servicing Solution Teaching Book for SPSS of Windows Statistical; Tsinghua University Press, and Beijing Communication University Press: Beijing, China, 2003; pp. 300–311. [Google Scholar]
- Wei, W.; Chen, L.L.; Fu, B.J.; Huang, Z.L.; Wu, D.P.; Gui, L.D. The effect of land uses and rainfall regimes on runoff and soil erosion in the semi-arid loess hilly area, China. J. Hydrol. 2007, 335, 247–258. [Google Scholar] [CrossRef]
- Fang, H.Y.; Cai, Q.G.; Chen, H.; Li, Q.Y. Effect of rainfall regime and slope on runoff in a gullied loess region on the Loess Plateau in China. Environ. Manag. 2008, 42, 402–411. [Google Scholar] [CrossRef]
- Mishra, S.K.; Pandey, R.P.; Jain, M.K.; Singh, V.P. A rain duration and modified AMC-dependent SCS-CN procedure for long duration rainfall-runoff events. Water Resour. Manag. 2008, 22, 861–876. [Google Scholar] [CrossRef]
- Reaney, S.M.; Bracken, L.J.; Kirkby, M.J. Use of the connectivity of runoff model (CRUM) to investigate the influence of storm characteristics on runoff generation and connectivity in semi-arid areas. Hydrol. Process. 2010, 21, 894–906. [Google Scholar] [CrossRef]
- Evett, S.R.; Dutt, G.R. Length and slope effects on runoff from sodium dispersed, compacted earth microcatchments. Soil Sci. Soc. Am. J. 1985, 49, 734–738. [Google Scholar] [CrossRef]
- Philip, J.R. Hillslope infiltration: Planar slopes. Water Resour. Res. 1991, 27, 109–117. [Google Scholar] [CrossRef]
- Huang, C.H. Empirical analysis of slope and runoff for sediment delivery from interrill areas. Soil Sci. Soc. Am. J. 1995, 59, 982–990. [Google Scholar] [CrossRef]
- Fox, D.M.; Bryan, R.B.; Price, A.G. The influence of slope angle on final infiltration rate for interrill conditions. Geoderma 1997, 80, 181–194. [Google Scholar] [CrossRef]
- Chaplot, V.A.M.; Bissonnais, Y.L. Runoff features for interrill erosion at different rainfall intensities, slope lengths, and gradients in an agricultural loessial hillslope. Soil Sci. Soc. Am. J. 2003, 67, 844–851. [Google Scholar] [CrossRef]
- Koelliker, J.K. Hydrologic design criteria for dams with equal reliability. In Irrigation Systems in the 21st Century; James, L.G., Ed.; ASCE: New York, NY, USA, 1987; pp. 100–107. [Google Scholar]
- Hjelmfelt, A.T.J.; Kramer, K.A.; Burwell, R.E. Curve numbers as random variables. In Proceeding, International Symposium on Rainfall-Runoff Modelling; Singh, V.P., Ed.; Water Resources Publication: Littleton, CO, USA, 1982; pp. 365–373. [Google Scholar]
Figure 1.
The flowchart of the whole methodology applied in this study.

Figure 2.
Location of the two experimental watersheds of Chabagou (CBG) and Xindiangou (XDG).

Figure 3.
The layout of field plots in XDG watershed.

Figure 4.
Measured versus estimated runoff depths for (a) the original Soil Conservation Service Curve Number (SCS-CN) method, (b) Huang et al. [15] method, and (c) Huang et al. [34] method for the calibration and validation of the three runoff plots located in the XDG watersheds.

Figure 5.
Measured versus estimated runoff depths for (a) Method 1, (b) Method 2, and (c) Method 3 for calibration and validation for three runoff plots of the XDG watersheds.
Figure 5.
Measured versus estimated runoff depths for (a) Method 1, (b) Method 2, and (c) Method 3 for calibration and validation for three runoff plots of the XDG watersheds.

Figure 6.
Measured versus estimated runoff depths for (a) original SCS-CN method, (b) Method 1, (c) Method 2, and (d) Method 3 for the three experimental plots located in the CBG watershed.
Figure 6.
Measured versus estimated runoff depths for (a) original SCS-CN method, (b) Method 1, (c) Method 2, and (d) Method 3 for the three experimental plots located in the CBG watershed.

Figure 7.
Sensitivity analysis of the empirical parameters of Method 2.

Figure 8.
Measured versus estimated runoff depths for (a) the original SCS-CN method and (b) Method 2 of the three rainfall regimes.
Figure 8.
Measured versus estimated runoff depths for (a) the original SCS-CN method and (b) Method 2 of the three rainfall regimes.


Table 1.
Main characteristics of experimental plots in the XDG and CBG watersheds.
| Watershed | XDG | CBG | ||||
|---|---|---|---|---|---|---|
| Plot | 1 | 2 | 3 | 1 | 2 | 3 |
| Land use | Grassland | Grassland | Cropland | Grassland | Cropland | Cropland |
| Vegetation | Alfalfa | Sweet clover | Millet | Pasture | Millet | Potato |
| Length (m) | 20 | 20 | 20 | 40 | 20 | 20 |
| Width (m) | 5 | 5 | 5 | 10 | 10 | 10 |
| Slope gradient (°) | 35 | 33 | 15 | 30 | 25 | 22 |
| Soil moisture (%) | 18.54 ± 5.93 | 18.08 ± 5.92 | 19.68 ± 5.89 | 15.82 ± 4.50 | 16.80 ± 5.64 | 16.79 ± 4.30 |
| Rainfall (mm) | 23.59 ± 14.43 | 23.90 ± 22.76 | 25.97 ± 22.08 | 22.31 ± 24.31 | 24.81 ± 28.24 | 23.93 ± 17.88 |
| Runoff (mm) | 4.52 ± 8.54 # | 4.60 ± 7.97 | 4.09 ± 4.52 | 2.07 ± 2.12 | 2.02 ± 1.95 | 6.61 ± 8.16 |
| Strom duration (h) | 4.53 ± 6.08 | 4.88 ± 6.53 | 5.84 ± 6.95 | 4.65 ± 6.74 | 5.82 ± 7.75 | 2.46 ± 2.59 |
| Observation period | 1956–1959 | 1956–1959 | 1954–1959 | 1959–1961 | 1959–1962 | 1964–1965 |
#: Mean ± standard deviation.
Table 2.
The optimized parameters of the tested methods for the plots in XDG watershed.
| Model | Parameter | |||||
|---|---|---|---|---|---|---|
| λ | a1 | a2 | b1 | b2 | c | |
| Original SCS-CN | 0.2 | - | - | - | - | - |
| Huang et al. [15] | 0.2 | 323.57 | 15.63 | - | - | - |
| Huang et al. [34] | 0.2 | - | - | 0.01 | 1.12 | - |
| Method 1 | 0.2 | 323.57 | 15.63 | 0.05 | 0.61 | 0.020 |
| Method 2 | 0.001 | 323.57 | 15.63 | 0.13 | 0.31 | 0.035 |
| Method 3 | 0.001 | 213.99 | 25.38 | 0.15 | 0.24 | 0.035 |
Method 1: the proposed method with λ and slope parameters fixed. Method 2: the proposed method with slope parameters fixed. Method 3: the proposed method with all parameters optimized.
Table 3.
The performance of the tested method for the calibration and validation datasets.
| Model | Linear Regression | NSE | RMSE | Performance Rating [40] | ||
|---|---|---|---|---|---|---|
| Slope | Interception | R2 | (%) | (mm) | ||
| Calibration | ||||||
| Original SCS-CN | 0.83 | 0.07 | 0.24 | −118.64 | 9.83 | Unsatisfactory |
| Huang et al. [15] | 0.92 | 0.10 | 0.27 | −133.00 | 10.14 | Unsatisfactory |
| Huang et al. [34] | 0.27 | 0.41 | 0.15 | −9.80 | 6.96 | Unsatisfactory |
| Method 1 | 0.88 | −0.48 | 0.79 | 75.84 | 3.26 | Acceptable |
| Method 2 | 0.80 | 0.95 | 0.80 | 80.58 | 2.94 | Good |
| Method 3 | 0.82 | 0.72 | 0.81 | 80.73 | 2.91 | Good |
| Validation | ||||||
| Original SCS-CN | 0.77 | 1.33 | 0.18 | −182.60 | 13.18 | Unsatisfactory |
| Huang et al. [15] | 0.87 | 1.58 | 0.19 | −229.67 | 14.23 | Unsatisfactory |
| Huang et al. [34] | 0.21 | 1.14 | 0.07 | −32.27 | 9.02 | Unsatisfactory |
| Method 1 | 0.92 | 0.04 | 0.80 | 77.45 | 3.72 | Acceptable |
| Method 2 | 0.81 | 0.87 | 0.81 | 80.44 | 3.46 | Good |
| Method 3 | 0.84 | 0.71 | 0.81 | 81.21 | 3.40 | Good |
| Full data | ||||||
| Original SCS-CN | 0.80 | 0.56 | 0.21 | −148.17 | 11.23 | Unsatisfactory |
| Huang et al. [15] | 0.90 | 0.67 | 0.23 | −177.64 | 11.87 | Unsatisfactory |
| Huang et al. [34] | 0.24 | 0.70 | 0.11 | −20.18 | 7.81 | Unsatisfactory |
| Method 1 | 0.90 | −0.30 | 0.79 | 76.58 | 3.45 | Acceptable |
| Method 2 | 0.80 | 0.92 | 0.81 | 80.50 | 3.15 | Good |
| Method 3 | 0.83 | 0.71 | 0.81 | 80.95 | 3.11 | Good |
R2: coefficient of determination; NSE: model efficiency; RMSE: root-mean-square error; Performance rating: very good (NSE > 90%), good (80% < NSE < 90%), acceptable (65% < NSE < 80%), and unsatisfactory (NSE < 65%).
Table 4.
Statistical features of the rainfall regimes in XDG and CBG watersheds.
| Rainfall Regime | Eigenvalue | Mean | Standard Deviation | Variation Coefficient | Frequency (%) |
|---|---|---|---|---|---|
| Regime 1 | P (mm) | 14.92 | 6.95 | 0.47 | 79.73 |
| D (h) | 2.43 | 2.55 | 1.05 | ||
| Regime 2 | P (mm) | 50.49 | 11.06 | 0.22 | 16.89 |
| D (h) | 12.61 | 7.94 | 0.63 | ||
| Regime 3 | P (mm) | 109.36 | 7.68 | 0.07 | 3.38 |
| D (h) | 22.93 | 1.31 | 0.06 |
P: precipitation depth; D: storm duration.
© 2020 by the authors. Licensee MDPI, Basel, Switzerland. This article is an open access article distributed under the terms and conditions of the Creative Commons Attribution (CC BY) license (http://creativecommons.org/licenses/by/4.0/).
Share and Cite
MDPI and ACS Style
Shi, W.; Wang, N. An Improved SCS-CN Method Incorporating Slope, Soil Moisture, and Storm Duration Factors for Runoff Prediction. Water 2020, 12, 1335. https://doi.org/10.3390/w12051335
AMA Style
Shi W, Wang N. An Improved SCS-CN Method Incorporating Slope, Soil Moisture, and Storm Duration Factors for Runoff Prediction. Water. 2020; 12(5):1335. https://doi.org/10.3390/w12051335
Chicago/Turabian StyleShi, Wenhai, and Ni Wang. 2020. "An Improved SCS-CN Method Incorporating Slope, Soil Moisture, and Storm Duration Factors for Runoff Prediction" Water 12, no. 5: 1335. https://doi.org/10.3390/w12051335
Note that from the first issue of 2016, this journal uses article numbers instead of page numbers. See further details here.