Impacts of Filled Check Dams with Different Deployment Strategies on the Flood and Sediment Transport Processes in a Loess Plateau Catchment

Institute of Hydrology and Water Resources, Zhejiang University; Hangzhou 310058, China
*
Author to whom correspondence should be addressed.
Water 2020, 12(5), 1319; https://doi.org/10.3390/w12051319
Submission received: 2 April 2020
/
Revised: 1 May 2020
/
Accepted: 3 May 2020
/
Published: 7 May 2020
(This article belongs to the Special Issue Advances in Modelling and Prediction on the Impact of Human Activities and Extreme Events on Environments)
Abstract
:As one of the most widespread engineering structures for conserving water and soil, check dams have significantly modified the local landform and hydrologic responses. However, the influences of sedimentary lands caused by filled up check dams on the runoff and sediment transport processes were seldom studied. Employing an integrated hydrologic-response and sediment transport model, this study investigated the influences of filled check dams with different deployment strategies in a Loess Plateau catchment. Six hypothetical deployment strategies of check dams were compared with no-dam scenario and the reality scenario. Results showed that filled check dams were still able to reduce Flood peak (Qp) by 31% to 93% under different deployment strategies. Considerable delays of peak time and decreases were also found in scenarios, which were characterized as having larger and more connective sedimentary lands on the main channel. Reduction rates of Sediment yield (SY) and the total mass of Eroded sediment (ES) ranged from 4% to 52% and 2% to 16%, respectively, indicating that proper distributions of check dams can promote sediment deposition in the channel and reduce soil erosion. The results of this study indicate that (1) check dam systems could still be useful in flood attenuation and sediment control even when they were filled, and (2) optimizing the deployment strategies of check dams can help reduce erosion.
1. Introduction
Building check dams is an effective engineering measure for flood attenuation in mountainous streams that experience torrents [1,2] and soil erosion control in arid and semiarid regions with large sediment yields [3,4,5]. Because of their high efficiency in sediment reduction and relatively low building investment, check dams are constructed in many countries, such as Mexico [6], Spain [7], Italy [8], Iran [9], and China [10]. The Loess Plateau in Northwest China has suffered severe soil erosion due to its combination of highly-erodible soil layers and considerable human activities [11]. The erosion rate in the region ranged from 2000 to 20,000 t km−2 yr−1 in the 1950s, resulting in the riverbed uplift of the downstream Yellow River [12]. To reduce the large catchment sediment yield caused by soil erosion, more than 110,000 check dams have been constructed in the Loess Plateau catchments over the past 50 years (especially in the 1970s) to prevent sediment from being transported to the Yellow River [13]. Significant decreases in annual runoff and sediment yields of different catchments due to the construction of check dams have been widely observed and investigated in the Loess Plateau [14,15,16]. However, most of the check dams have been filled quickly due to the large amount of sediment discharge during floods, and a large number of check dams were destroyed due to low design criteria and unscientific site location [17].
As an engineering structure chronically changing the landforms of a natural channel, the influences of filled check dams on the flood and sediment transport processes have seldom been quantitatively studied. In the early stage of a check dam (i.e., the design storage capacity has not been consumed), channel flow and sediment can be easily blocked by the dam body. When a check dam is filled, the block effect of dam body no longer exists, but a large sedimentary land is formed behind the check dam. The sedimentary land is normally a flat platform with relatively higher soil water content and much lower slope gradient, which is widely used as farmlands in the Loess Plateau. The hydrological impacts of sedimentary land, such as infiltration promotion [18], evaporation increase [19], and enhancement of groundwater recharge [20], have been reported. According to the low slope gradient of sedimentary land and its impacts on hydrologic response, it may influence the flood and sediment transport processes in the long term [21], even as the check dam is filled. In fact, approximately 320,000 ha of sedimentary lands behind check dams were formed during the 1950s to 2000s in the Loess Plateau [13], and the area of sedimentary lands are expected to continue increasing as more and more check dams are about to be fully filled. Considering that all check dams are going to be filled one day and the sedimentary lands formed behind check dams will exist in a long term, it is necessary to quantitatively study their influences on the flood and sediment transport processes.
On the other hand, improving the performance of check dams in flood attenuation and sediment control by optimizing the deployment strategies for treated catchments is still a challenge, given the fact that many of the check dams built in the past 50 years were prone to dam break [17]. A recent study has paid attention to the optimization of check dams in a Loess Plateau catchment [22]. Employing a distributed erosion model (WaTEM/SEDEM) based on the Revised Universal Soil Loss Equation, the life expectancy of check dams under different deployment strategies and their impacts on sediment delivery ratio of the Shejiagou catchment were compared in [22]. Several insights on extending the life expectancy of check dams and simultaneously keeping the system effective in sediment reduction were obtained in this simulation-based study. However, limited by the deficiency of WaTEM/SEDEM, which does not simulate the flow and sediment movement on the sedimentary land, the hydrologic responses of sedimentary land such as infiltration improvement and flow-velocity decrease were not considered in this study. Besides, including the studies introduced above, most of the studies on the optimization of check dam systems focused on improving the sediment trapping efficiency of the system during its lifespan [22,23,24]. Few studies considered how to optimize the system in advance so as to achieve a better performance of sedimentary lands in flood and sediment control when all the check dams are filled.
Driven by these twofold challenges, the study reported herein investigated the influences of filled check dams with different deployment strategies on the flood and sediment transport processes. Following the work in [22], the Integrated Hydrology Model (InHM), which is fully physics-based, was employed to the 4.26 km2 Shejiagou catchment. The objectives were (1) to quantitatively understand whether and how much filled check dams with their sedimentary lands could attenuate flood processes and reduce sediment output, and (2) to compare the influences caused by filled check dams under different deployment strategies on the flood and sediment transport processes.
2. Data and Methods
2.1. Study Site and Data Sources
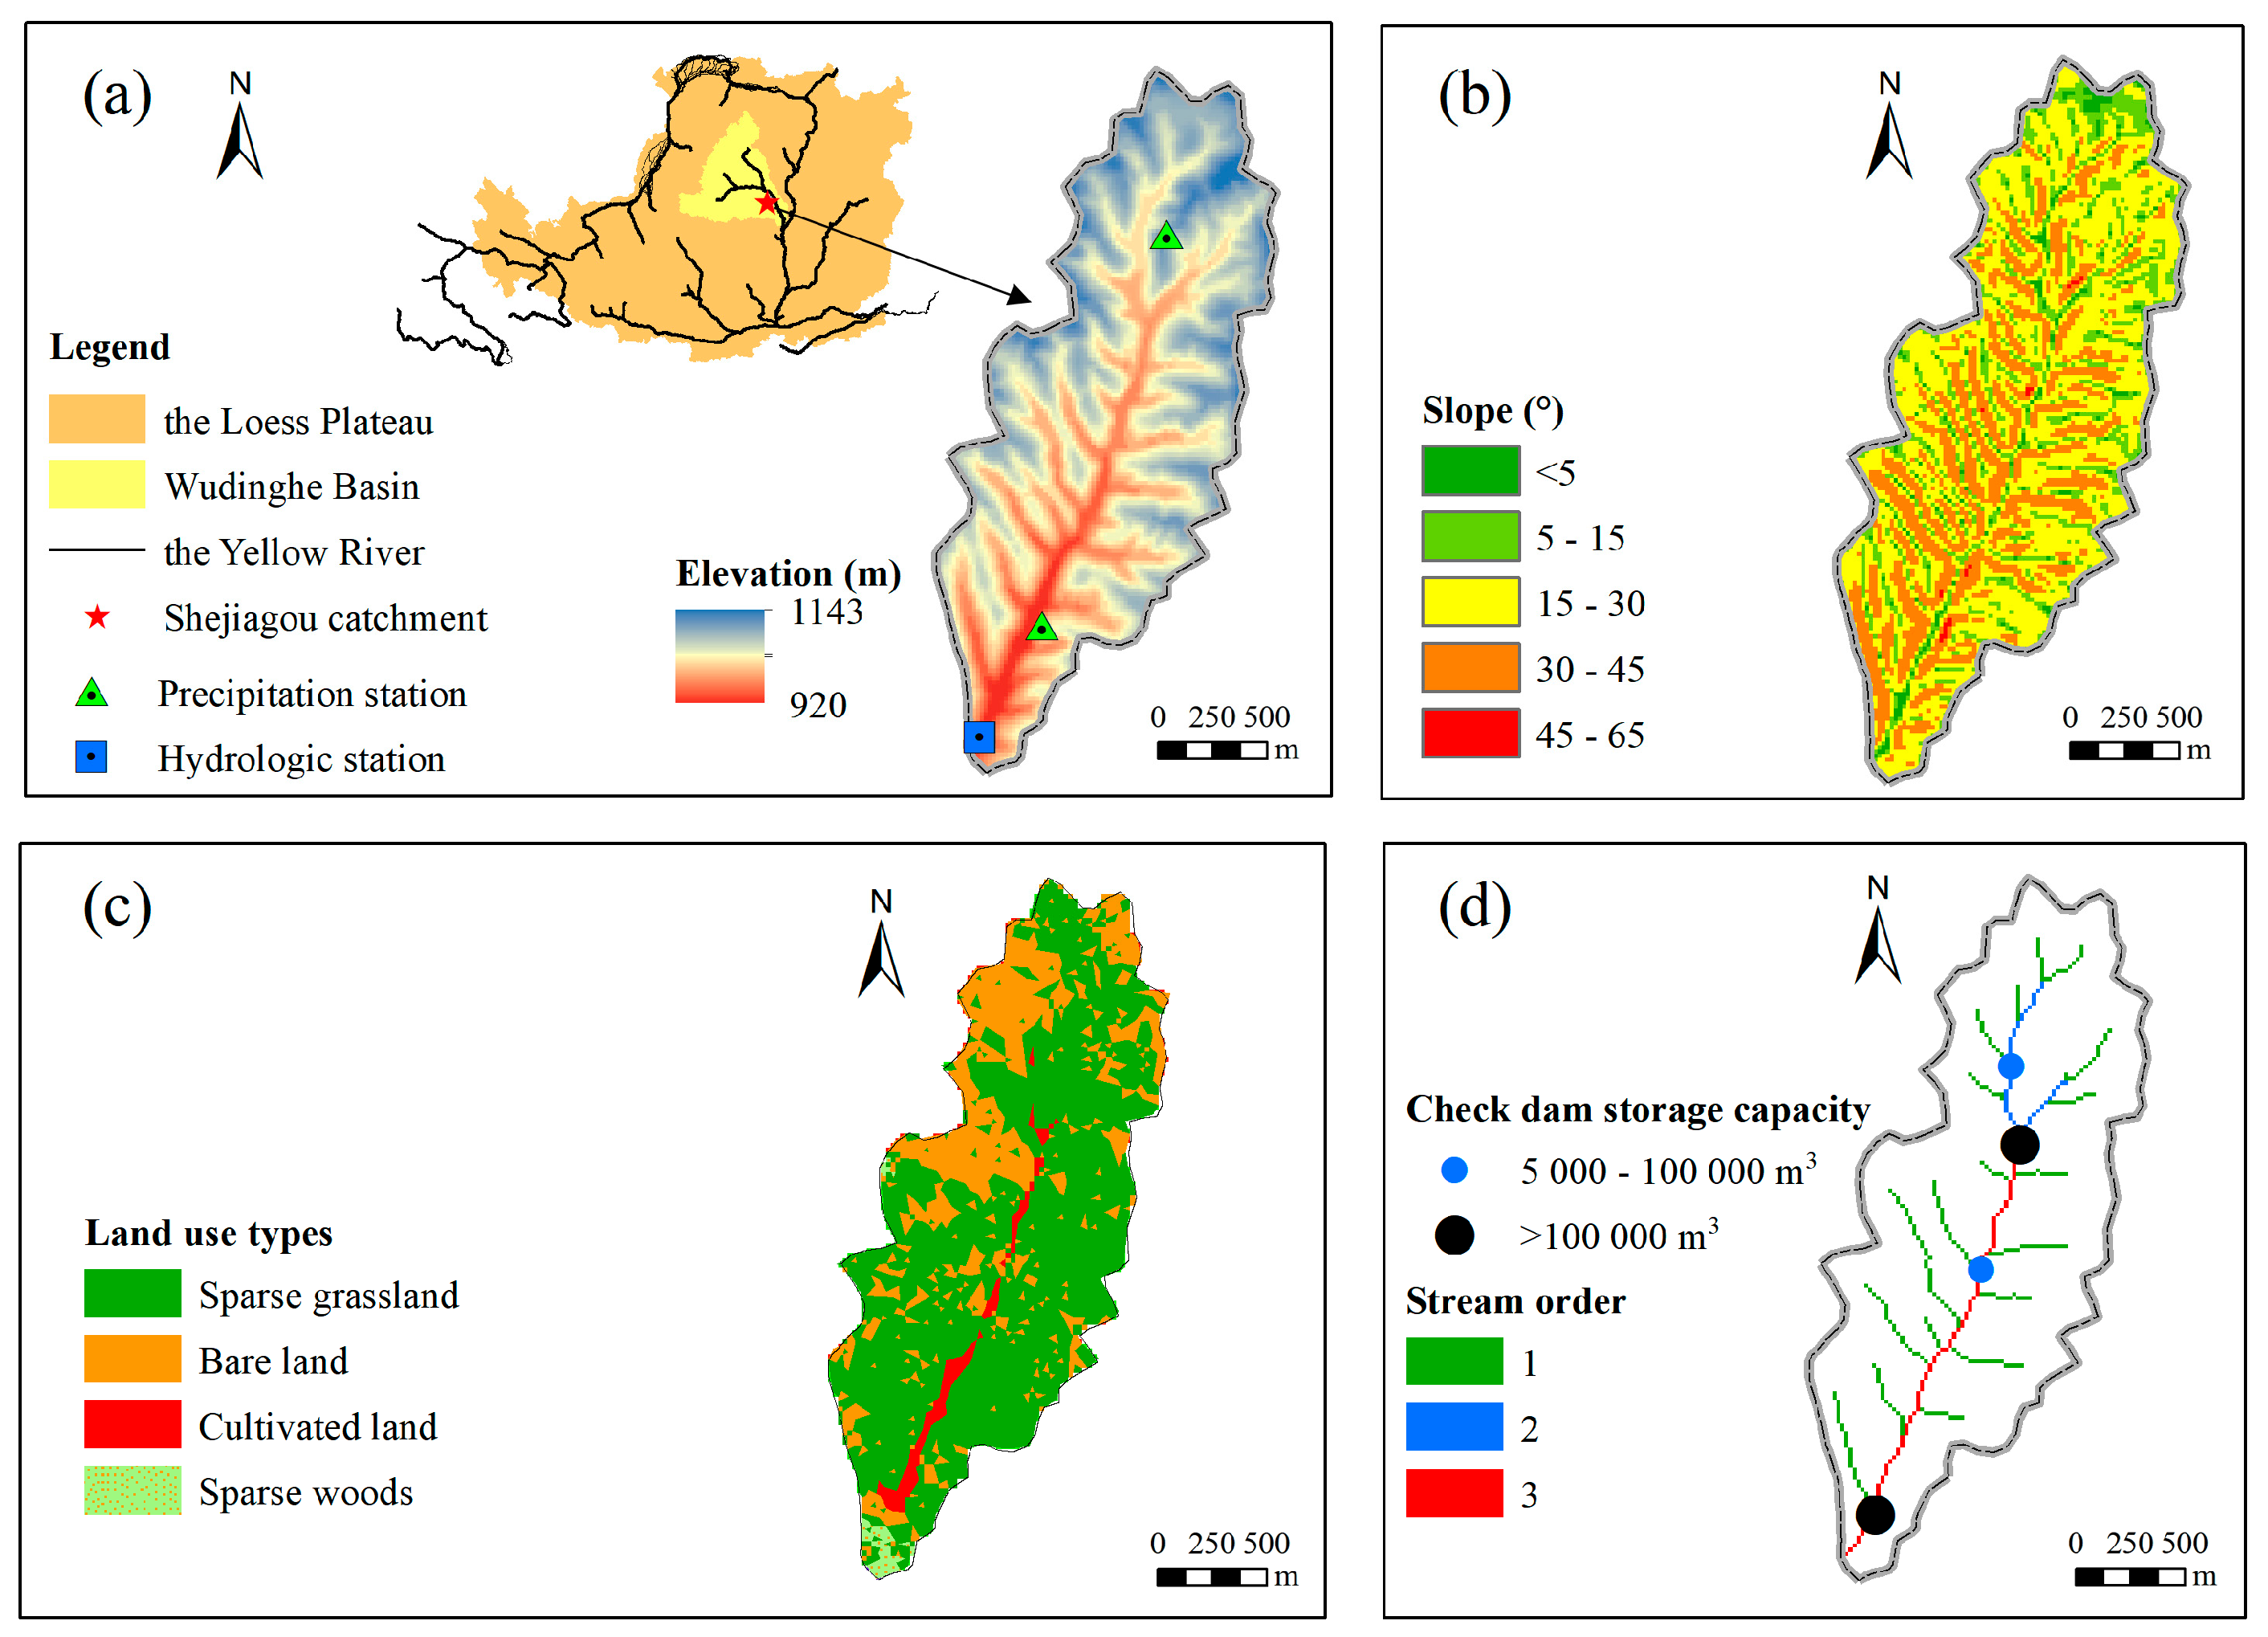
The Shejiagou catchment (109°58′ E, 37°42′ N) is a small catchment belonging to Wudinghe Basin in the Loess Plateau, China (Figure 1a). The catchment is 4.26 km2 with an elevation ranging from 920 m to 1143 m (22.8° mean slope, Figure 1b). The catchment is covered by a thick loess layer with an average depth of over 100 m. Being highly eroded, the hillslopes of the catchment are deeply incised by gullies. The land cover of the catchment was mainly sparse grassland, bare land, and cultivated land in the 1960s (Figure 1c) [25,26]. The Shejiagou catchment has a semiarid continental climate with a mean annual precipitation of 500 mm and a mean annual potential evaporation of 1570 mm [27]. Seventy percent of the precipitation falls in the wet seasons from June to September. Infiltration-excess surface flow dominates runoff generation during floods in the catchment, and most eroded sediment is carried downstream by surface flow in heavy storms. There is normally no flow in the stream channels and gullies during inter-storm periods. The mean annual specified sediment yield was 12,800 t km−2 yr−1 based on records from 1959 to 1969 (2100 t km−2 yr−1 to 24,400 t km−2 yr−1). According to the Strahler stream order, the river network is relatively simple and mainly consists of one third-order stream (i.e., the main channel) and several first-order streams (i.e., gullies), which symmetrically located in the two sides of the main channel (Figure 1d). Because the left-side gullies were more incised, the left side of the catchment has a steeper slope distribution and contributes more sediment than the right side. According to the model simulation in [22], major erosion areas distributed on hillslopes with slope gradients greater than 30° (Figure 1b), and the headwater areas of the catchment and the fifth gully on the right side of the main channel (Figure 1d) contribute the largest amount of sediment (see the Supplementary Materials).
Table 1 summarizes the data set used in this study. The 20-m resolution Digital Elevation Model (DEM) of Shejiagou catchment was obtained from the State Bureau of Surveying and Mapping. Infiltration experiments and soil sampling were conducted by the Zizhou Experimental Station in Tuanshangou, a sub-catchment of Shejiagou, to obtain data of soil water characteristics during 1960–1962. By using these soil data, the parameters of van Genuchten Model [28], which was used to describe the soil-water retention and permeability functions, were determined. Runoff, sediment, and precipitation data during floods were obtained from the Experimental Station of Soil and Water Conservation of Zizhou County, which belongs to the Yellow River Conservancy Commission of the Ministry of Water Resources (YRCC). The Shejiagou hydrologic station was set at the outlet of Shejiagou catchment to monitor the runoff and sediment data including water level (m), discharge (m3 s−1), sediment concentration (kg m−3), and sediment discharge (kg s−1) during 1959–1969. During this monitoring period, the hydrographs and sedigraphs of 31 rainfall-runoff events were recorded. The time intervals of the flow and sediment discharge data ranged from 5 min around flow peaks to 1 h for low-flow periods. According to three field surveys of check dams, four check dams were constructed sequentially from 1957 to 1973, holding a total storage capacity of 465,100 m3 (Figure 1d). The Shejiagou catchment was chosen in this study mainly because (1) the data and information of the catchment were sufficient for model construction and (2) the land cover of the Shejiagou catchment was relatively simple in the 1960s, which was beneficial to model parameterization.
2.2. The Integrated Hydrology Model (InHM)
Based on the blueprint of the distributed physics-based hydrological model proposed by Freeze and Harlan [31], InHM was developed to quantitatively simulate, via a fully coupled approach, 3-D variably saturated flow in soil and 2-D flow and sediment transport across the land surface [32,33,34]. The 3-D Richards’ equation was implemented to describe variably saturated flow in soil, while the 2-D diffusion-wave equation coupled with depth-integrated multiple-species sediment transport was applied to describe surface flow movement and sediment transportation. They were discretized in space using the control-volume finite element method and coupled in one coherent framework using a physics-based first-order flux relationship driven by pressure head gradients [35]. Newton iteration was used to implicitly solve each coupled system of nonlinear equations. More details of InHM can be found in the Appendix A.
As a research tool with robust, general and efficient solution methods [36], InHM can run event-based or continuous simulations in various catchments with different types of topography and climate [37]. Compared to many process-based models [38,39,40,41], InHM has the following advantages in this study. (1) The time step is adaptive, and the output information is spatially distributed. This feature enables the model to represent vital variables (e.g., flow velocity, water depth, and sediment concentration) in a certain area (e.g., the sedimentary land) and at a specified time step. (2) The triangle spatial elements used in InHM are flexible and accurate to construct different shapes of sedimentary lands under various check dam deployment strategies. Hydrologically active areas such as gully mouths and tail-end areas can be refined to capture small variations in flow and sediment. The model is more dynamic compared to the methods in which the check dam is generalized as a sediment-trapping function [22] and more physics-based compared to the approaches that calculate flow and sediment output of a check dam by a simple water depth-discharge relationship [42].
The model has been utilized to examine the environmental impacts of many engineering structures, such as dam removal [43] and forest roads [44]. In the Loess Plateau catchment of Shejiagou, InHM is capable of simulating rainfall-runoff processes dominated by the infiltration-excess overland flow mechanism and rainsplash erosion as well as hydraulic erosion processes in flood events [26]. These successful applications indicated that InHM is a competent tool to study the impacts of filled check dams under different deployment strategies in the Shejiagou catchment.
2.3. Modelling Scenario
Three variables, namely, number, size, and site location of check dams, were usually considered to compare the runoff-sediment reduction efficiencies of different deployment strategies [23]. Apart from increasing number and/or size of check dams, which inevitably increases the deployment costs, appropriate choice of site locations may also improve the sediment reduction rate of a check dam system [22]. To study the impacts on runoff and sediment processes of filled check dam systems under different deployment strategies, three steps were conducted to set up modelling scenarios: (1) add different check dam systems into the model, (2) fill the check dams via rising the elevations of the channels influenced by each check dam to represent a filled check dam, and (3) conduct rainfall-runoff events in each modelling scenarios.
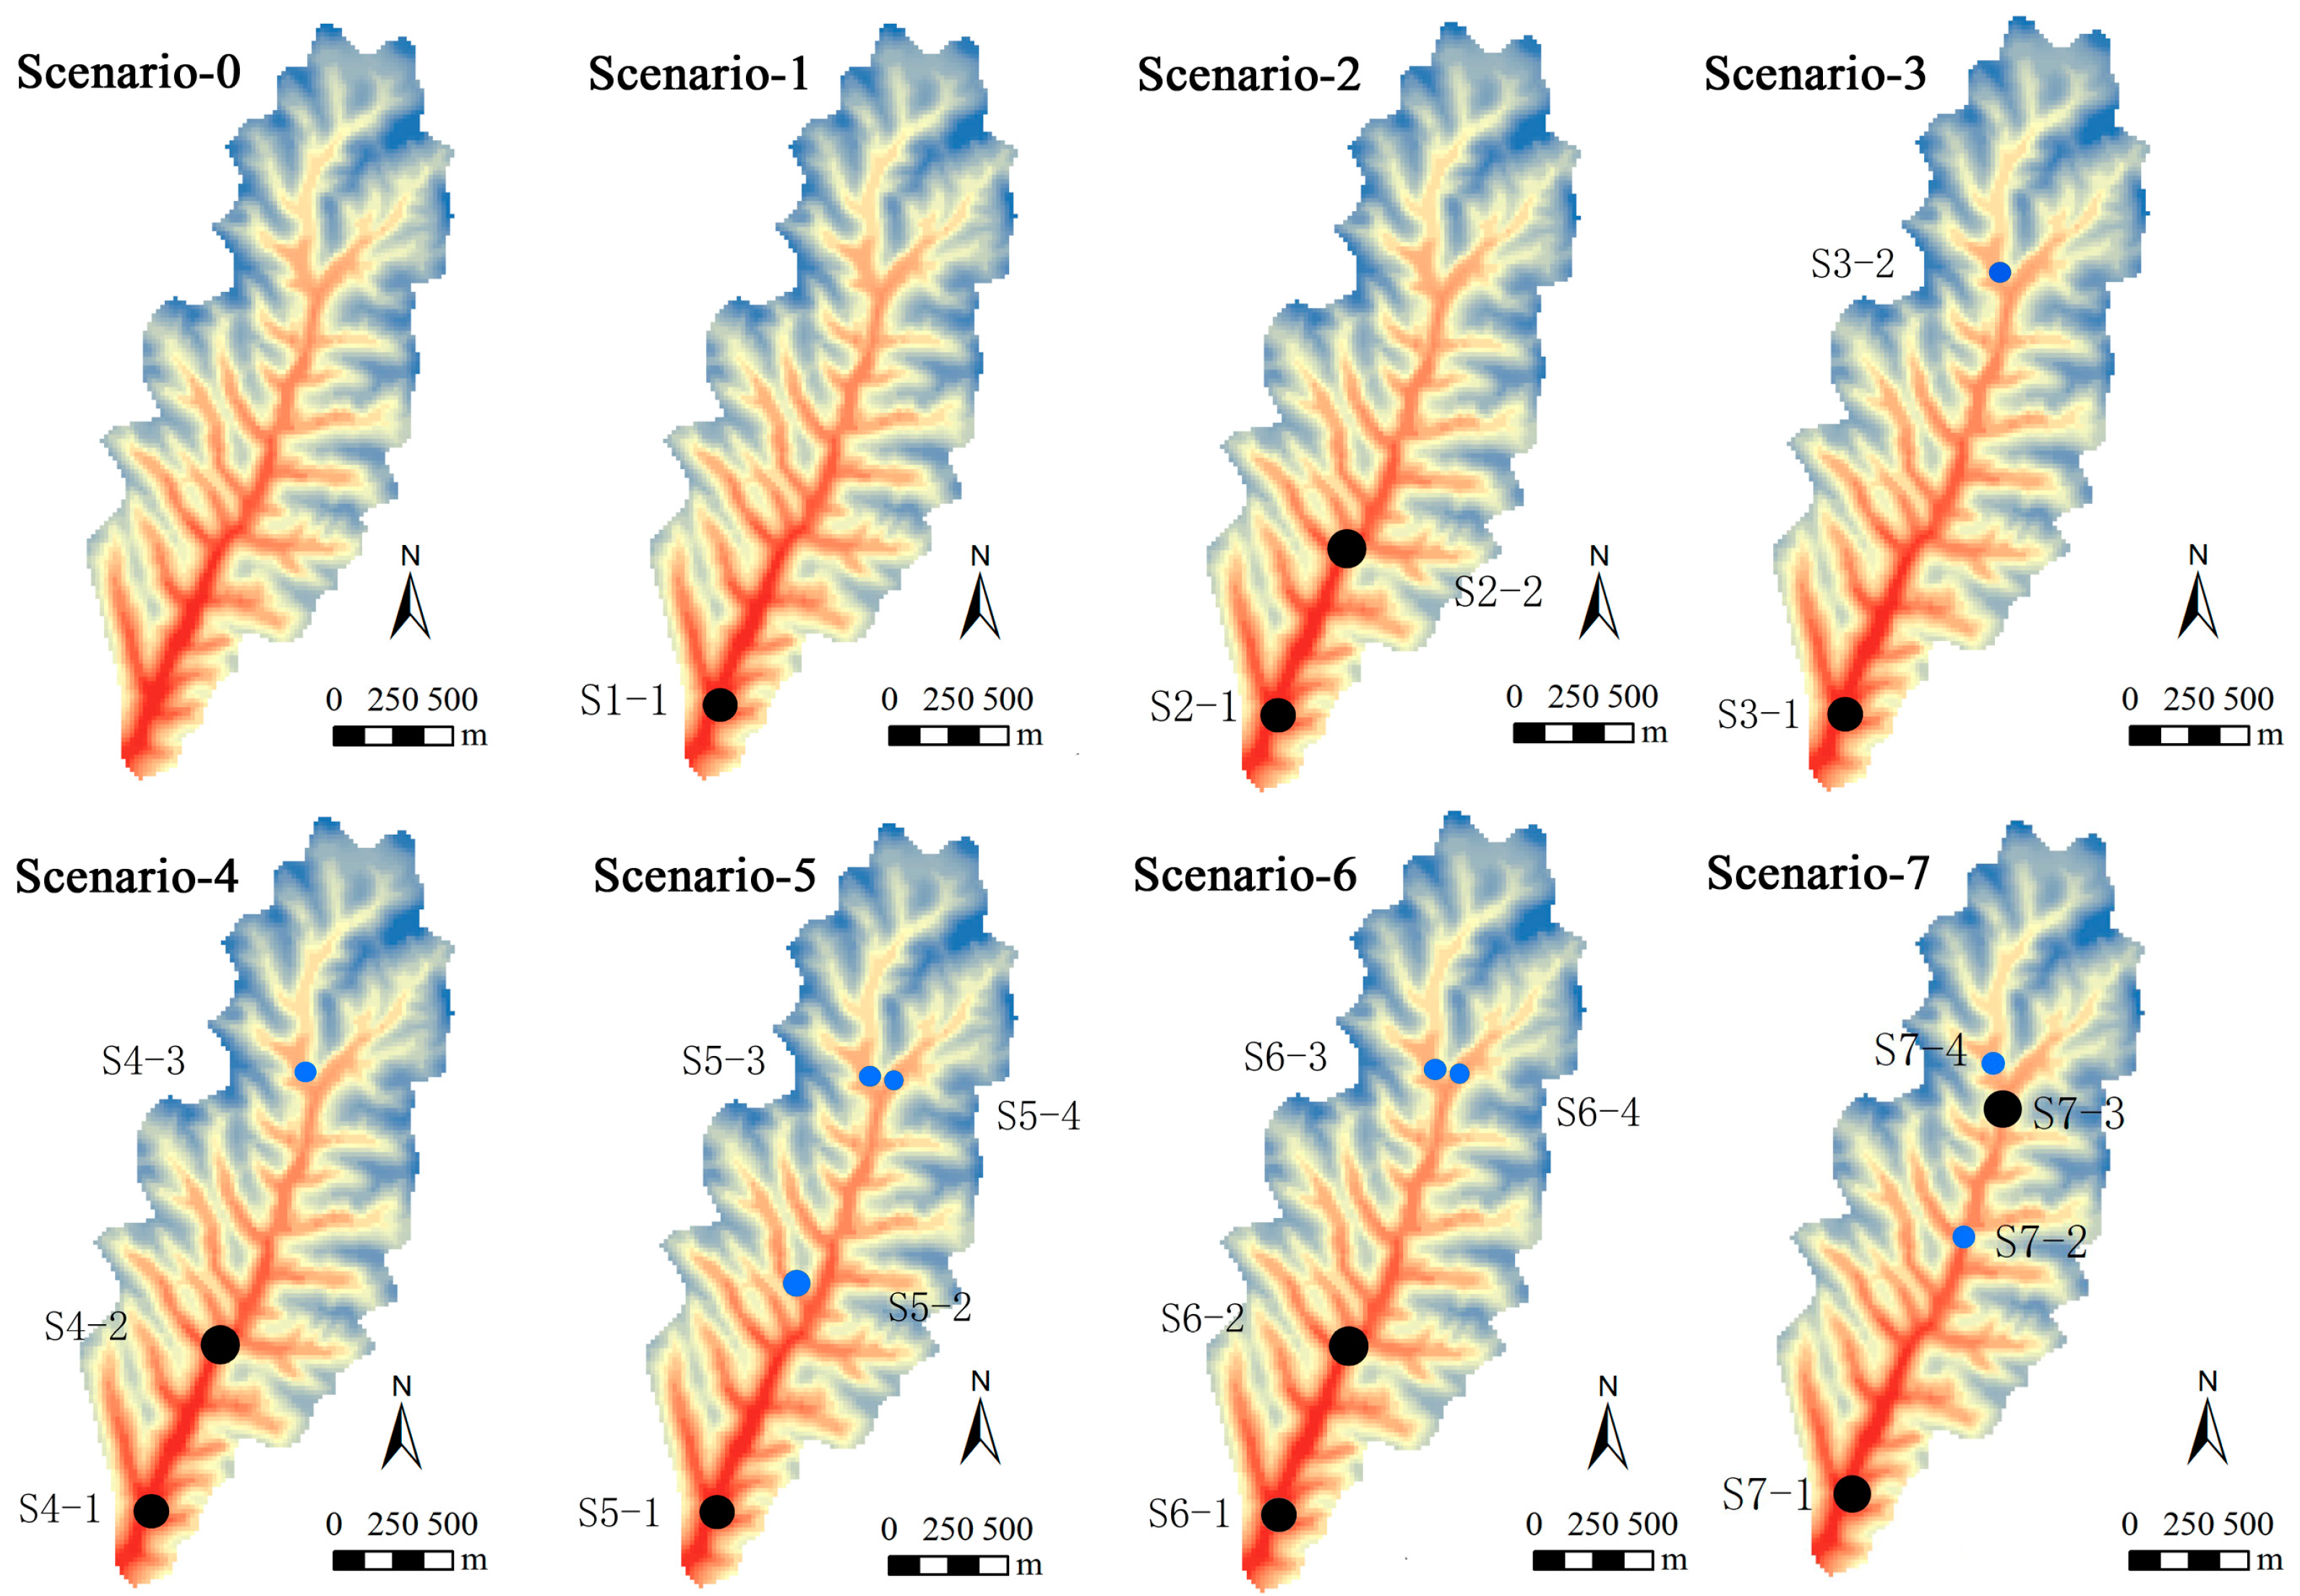
In this study, eight scenarios were designed (Figure 2, Table 2). Scenario-0 and Scenario-7 were cases which represent the no-check dam situation and the current situation of Shejiagou catchment, respectively. Scenarios 1-6 were cases considering different numbers, sizes and site locations of check dams. Although in all scenarios check dams were all filled (i.e., the design storage capacity was used up), the sizes still mattered because the sedimentary land formed by the check dam was different between small check dams and large check dams. For example, the total areas of sedimentary lands in scenario-2 and scenario-3 were 11.21 × 10⁴ m2 and 5.93 × 10⁴ m2, respectively. As for the determination of site locations, whether the check dams were constructed on gullies (the first or second order streams) or on the main channel (i.e., the third order stream) was considered in this study. For example, the second check dam was constructed on a first-order stream, which receives a high sediment load (2000–3600 t yr−1, see the Supplementary Materials) in scenario-5, while the second check dam was on the main channel which receives a much higher cumulative sediment load (9000–37,521 t yr−1) in scenario-6. The six scenarios (i.e., scenarios 1–6) were conceived to compare the effects of deployment strategies with different number (e.g., scenarios 1, 2, 4), size (e.g., scenarios 5, 6), and site location (e.g., scenarios 2, 3) of check dams. The six scenarios were also compared with scenario-0 and scenario-7, which provides indications of how the performance of a filled check dam system could be improved.
2.4. Model Settings and Parameters
2.4.1. Finite-Element Mesh
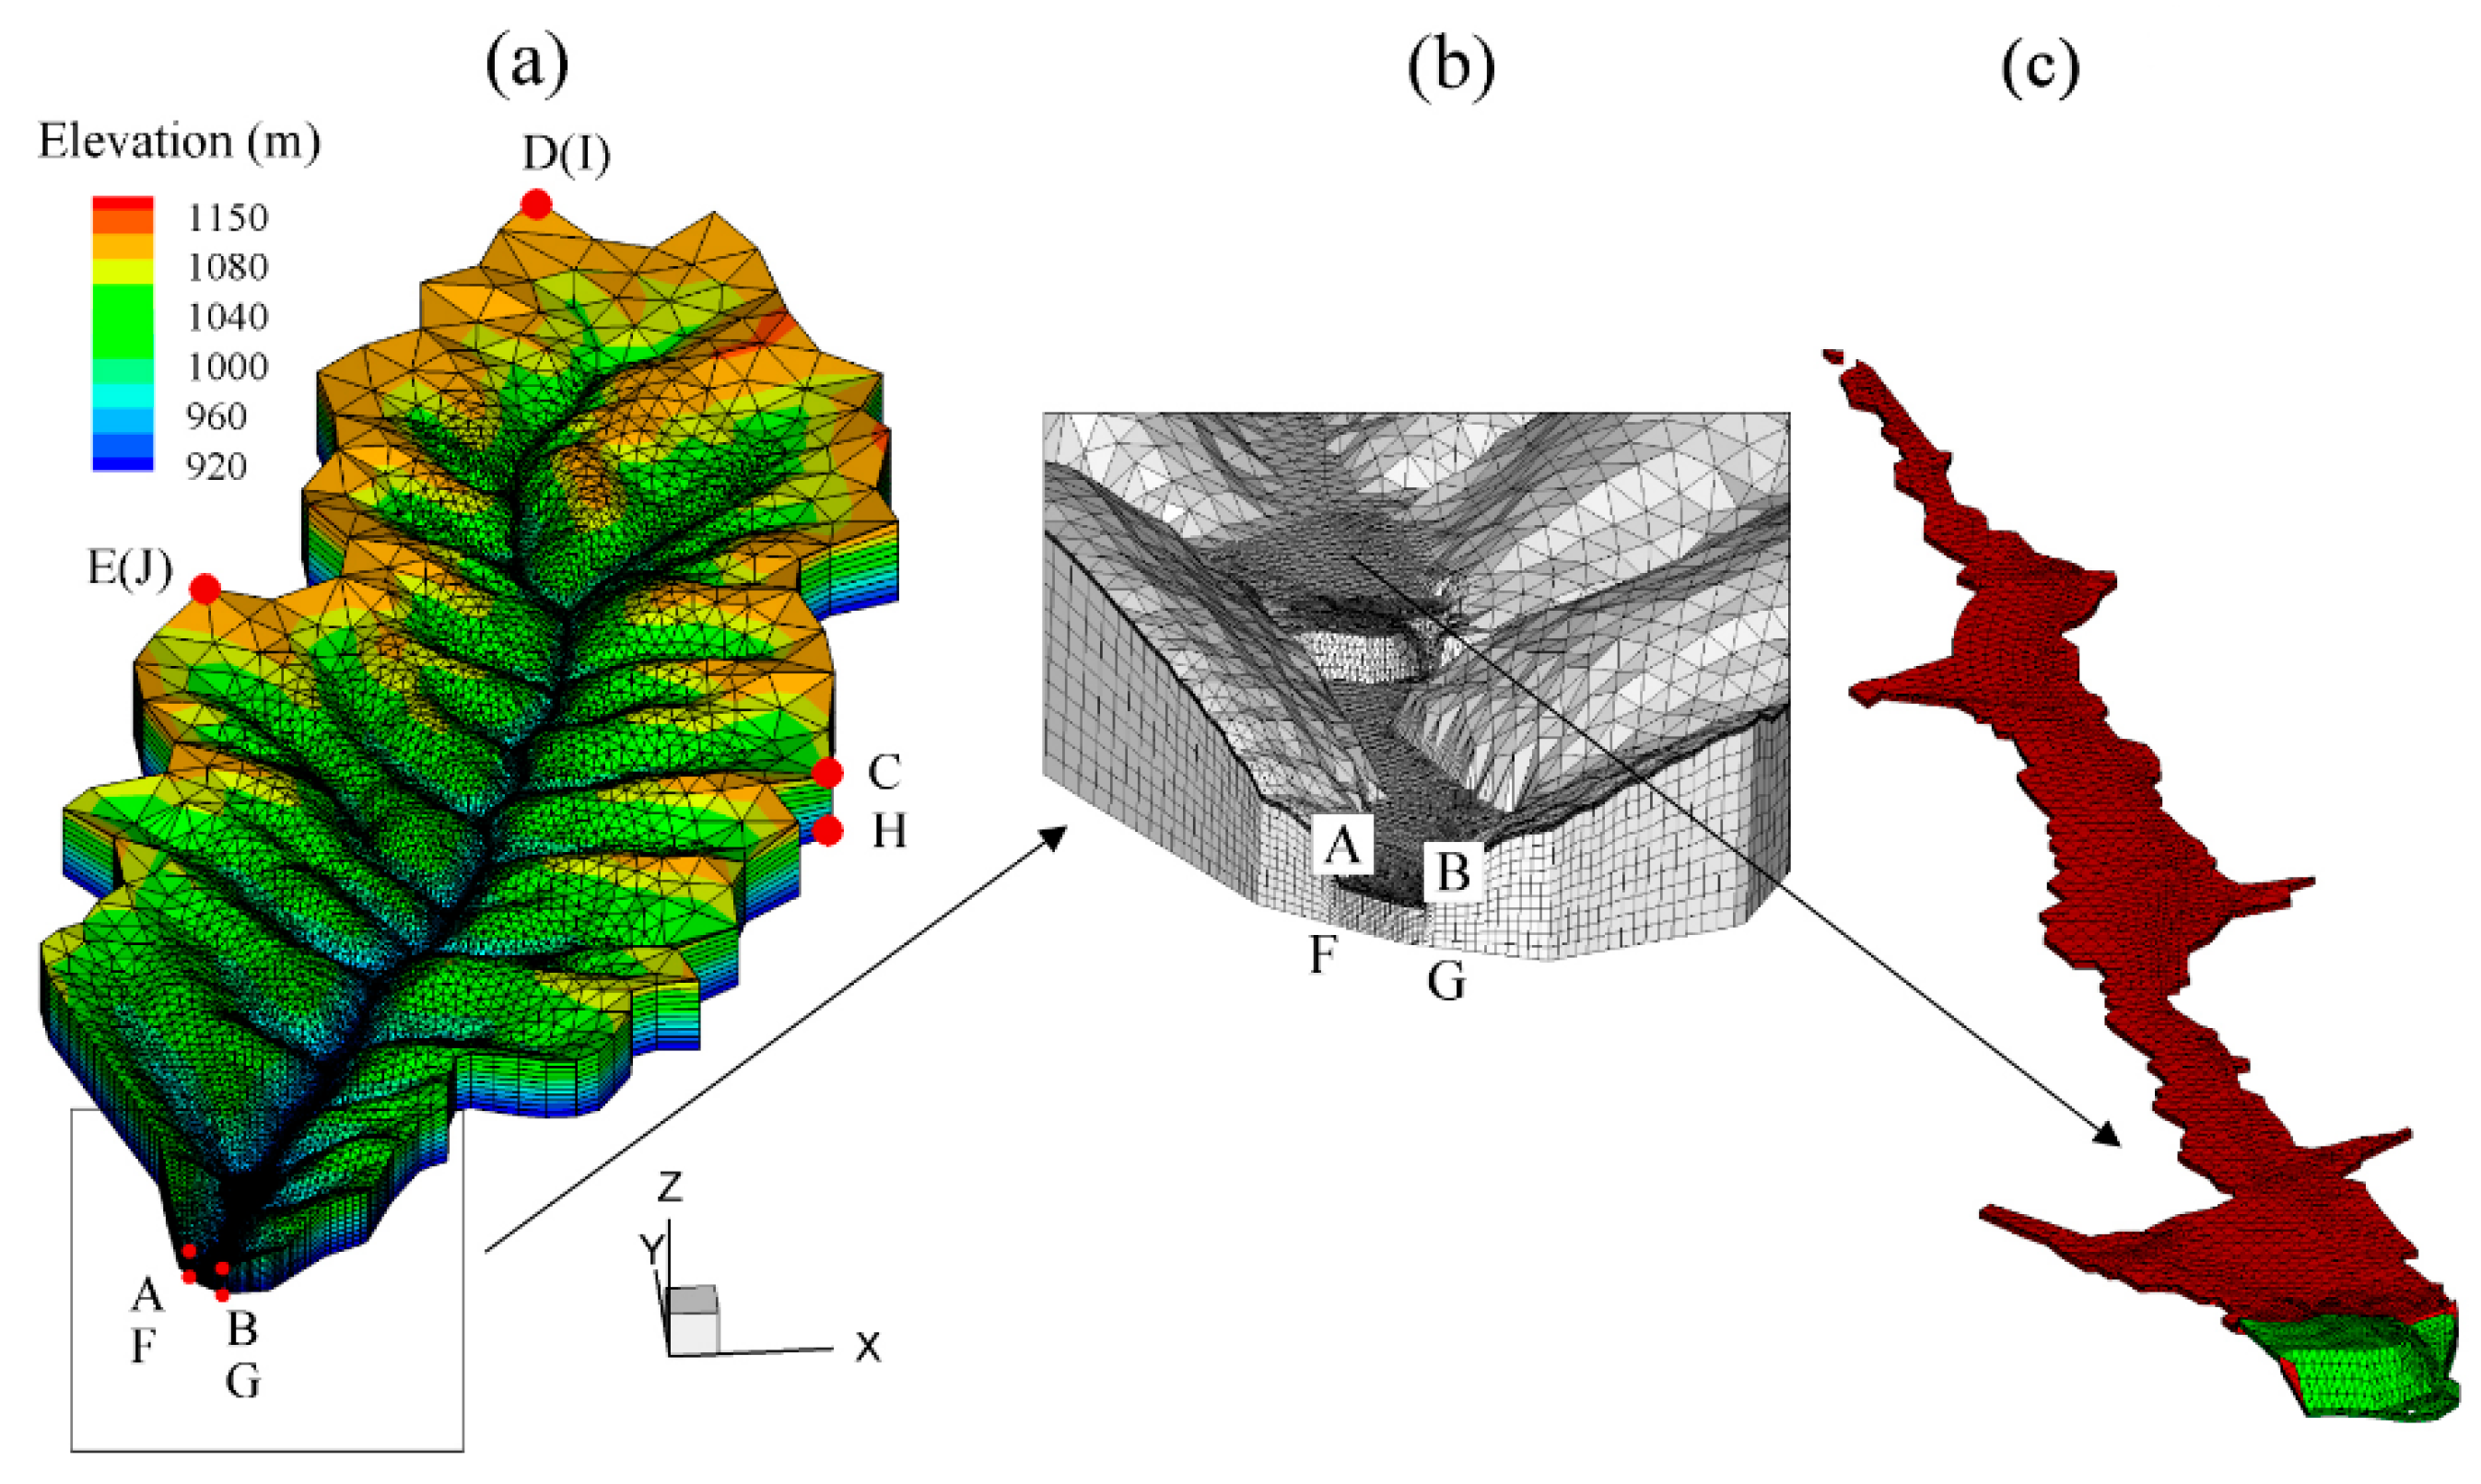
Eight 3-D meshes for the scenarios were constructed by adding subsurface layers to 2-D triangular surface meshes. The major differences of the eight 3-D meshes were the different combination of check dams and the sedimentary lands formed behind check dams. Figure 3a shows the 3-D mesh that contained 10,062 nodes and 19,918 triangular elements in scenario-1, in which only one filled check dam was considered. The cell dimensions of all the surface meshes varied from 180 m near the headwater boundary to 20 m along the gullies, and the meshes of the check dam were refined to 3 to 10 m. Sixteen subsurface meshes were added under the surface mesh with varying thickness from 0.10 m near the surface to 39.30 m near the bedrock with a constant basal elevation of 900 m (see Figure 3b). This setting of mesh size ensured a fine resolution in the hydrologically active areas (i.e., the channel, sedimentary land, and the near-surface soil) and simultaneously saved computation resources in the relatively inactive areas (i.e., the headwater regions and deep spaces). Figure 3c shows the check dam (i.e., S1-1) and its sedimentary land in the finite-element mesh. To model a filled check dam, the sedimentary land was elevated to the same elevation of the spillway, indicating that the dam body can no longer block surface flow. Based on the fact that the sedimentary lands normally have low slope gradients (usually less than 2%) when compared to the original channel [45,46], it was assumed that, for each filled check dam, the nodes on the sedimentary land have the same elevations to simplify the model construction.
2.4.2. Boundary Conditions and Initial Conditions
Two subsurface boundary conditions were assigned to each 3D mesh: (1) impermeable for each lateral face and the bottom face (A-E-D-C-B and F-J-I-H-G in Figure 3a); and (2) a local sink (i.e., head-dependent flux) at the down-gradient face [47], subsurface flowing out through A-B-G-F in Figure 3b. The surface boundary conditions were driven by the given precipitation to the whole catchment and constrained by a critical water depth boundary condition (no dam at the outlet, so the critical water depth = 0 m) at the catchment outlet (A–B in Figure 3b). A one-hour uniform rainfall with an intensity of 90 mm hr−1 was chosen to conduct the rainfall-runoff simulations in this study because this rainfall intensity was common in the Shejiagou catchment to induce floods, according to the 31 recorded rainfall-runoff events during 1959–1969. The evapotranspiration process was not considered in these storm event simulations.
Before all the scenario runs, a drainage run with no rainfall input was started to drive the whole catchment from a fully saturated state to a realistic state, and it stopped when the simulated discharge at the catchment outlet became stable and matched the average no-rainfall discharge of the catchment at the beginning of wet seasons (i.e., 0.006 m s−1). This drainage simulation was performed to obtain a continuous initial distribution of the hydraulic head that was close to the reality of the catchment. Using this initial condition, a one-week warming-up stage with 0.75 mm hr−1 rainfall was conducted at the beginning of each scenario run, and then the one-hour 90 mm hr−1 rainfall for the scenario run was input to the model. Each simulation ended 42 h after the rainfall, lasting for 2 days total.
2.4.3. Model Parameters
A near-surface loess layer (0–0.5 m) and a deep loess layer (0.5 m to the bedrock) constituted the soil profile in the model. The near-surface soil layer was classified into three types, i.e., the normal surface loess soil (labeled as “SJG-soil (0–0.5 m)”), the silted soil of the sedimentary land (labeled as “Sedimentary land”), and the compacted soil of the check dam (labeled as “Check dam”).
Table 3 summarizes the values of parameters that represent the soil hydraulic characteristics. The saturated hydraulic conductivities (Ksat) of soils were calibrated (see Section 2.4.4), while the porosity values and van Genuchten parameters of the soils were derived from the experiment data by the Zizhou Experimental Station. Table 4 summarizes the land surface parameters representing the hydraulic characteristics and erosion/deposition capabilities. For the hydrologic-response module in InHM, Manning’s roughness coefficients (n) were obtained by calibration (see Section 2.4.4). For the sediment-transport module, the rainsplash coefficient (cf) and surface erodibility coefficient (φ), the two important parameters in InHM to describe the rainsplash erosion and hydraulic erosion processes, were determined by model calibration (see Section 2.4.4). Derived from previous studies based on soil texture [48,49], the damping coefficient (cd), rainfall intensity exponent (b), and raindrop turbulence factor (ξ) were set to 600 m−1, 1.6, and 0.25, respectively. According to the soil sample data in the Shejiagou catchment, the median diameter of the soil was set to 0.05 mm to represent the uppermost homogeneous loess soil for the sediment transport simulation. The soil cohesion coefficient was 0.30 [43] for all surface soils except that of the check dam body, which was assigned a larger cohesion coefficient (i.e., 0.60) due to compaction.
2.4.4. Model Calibration and Validation
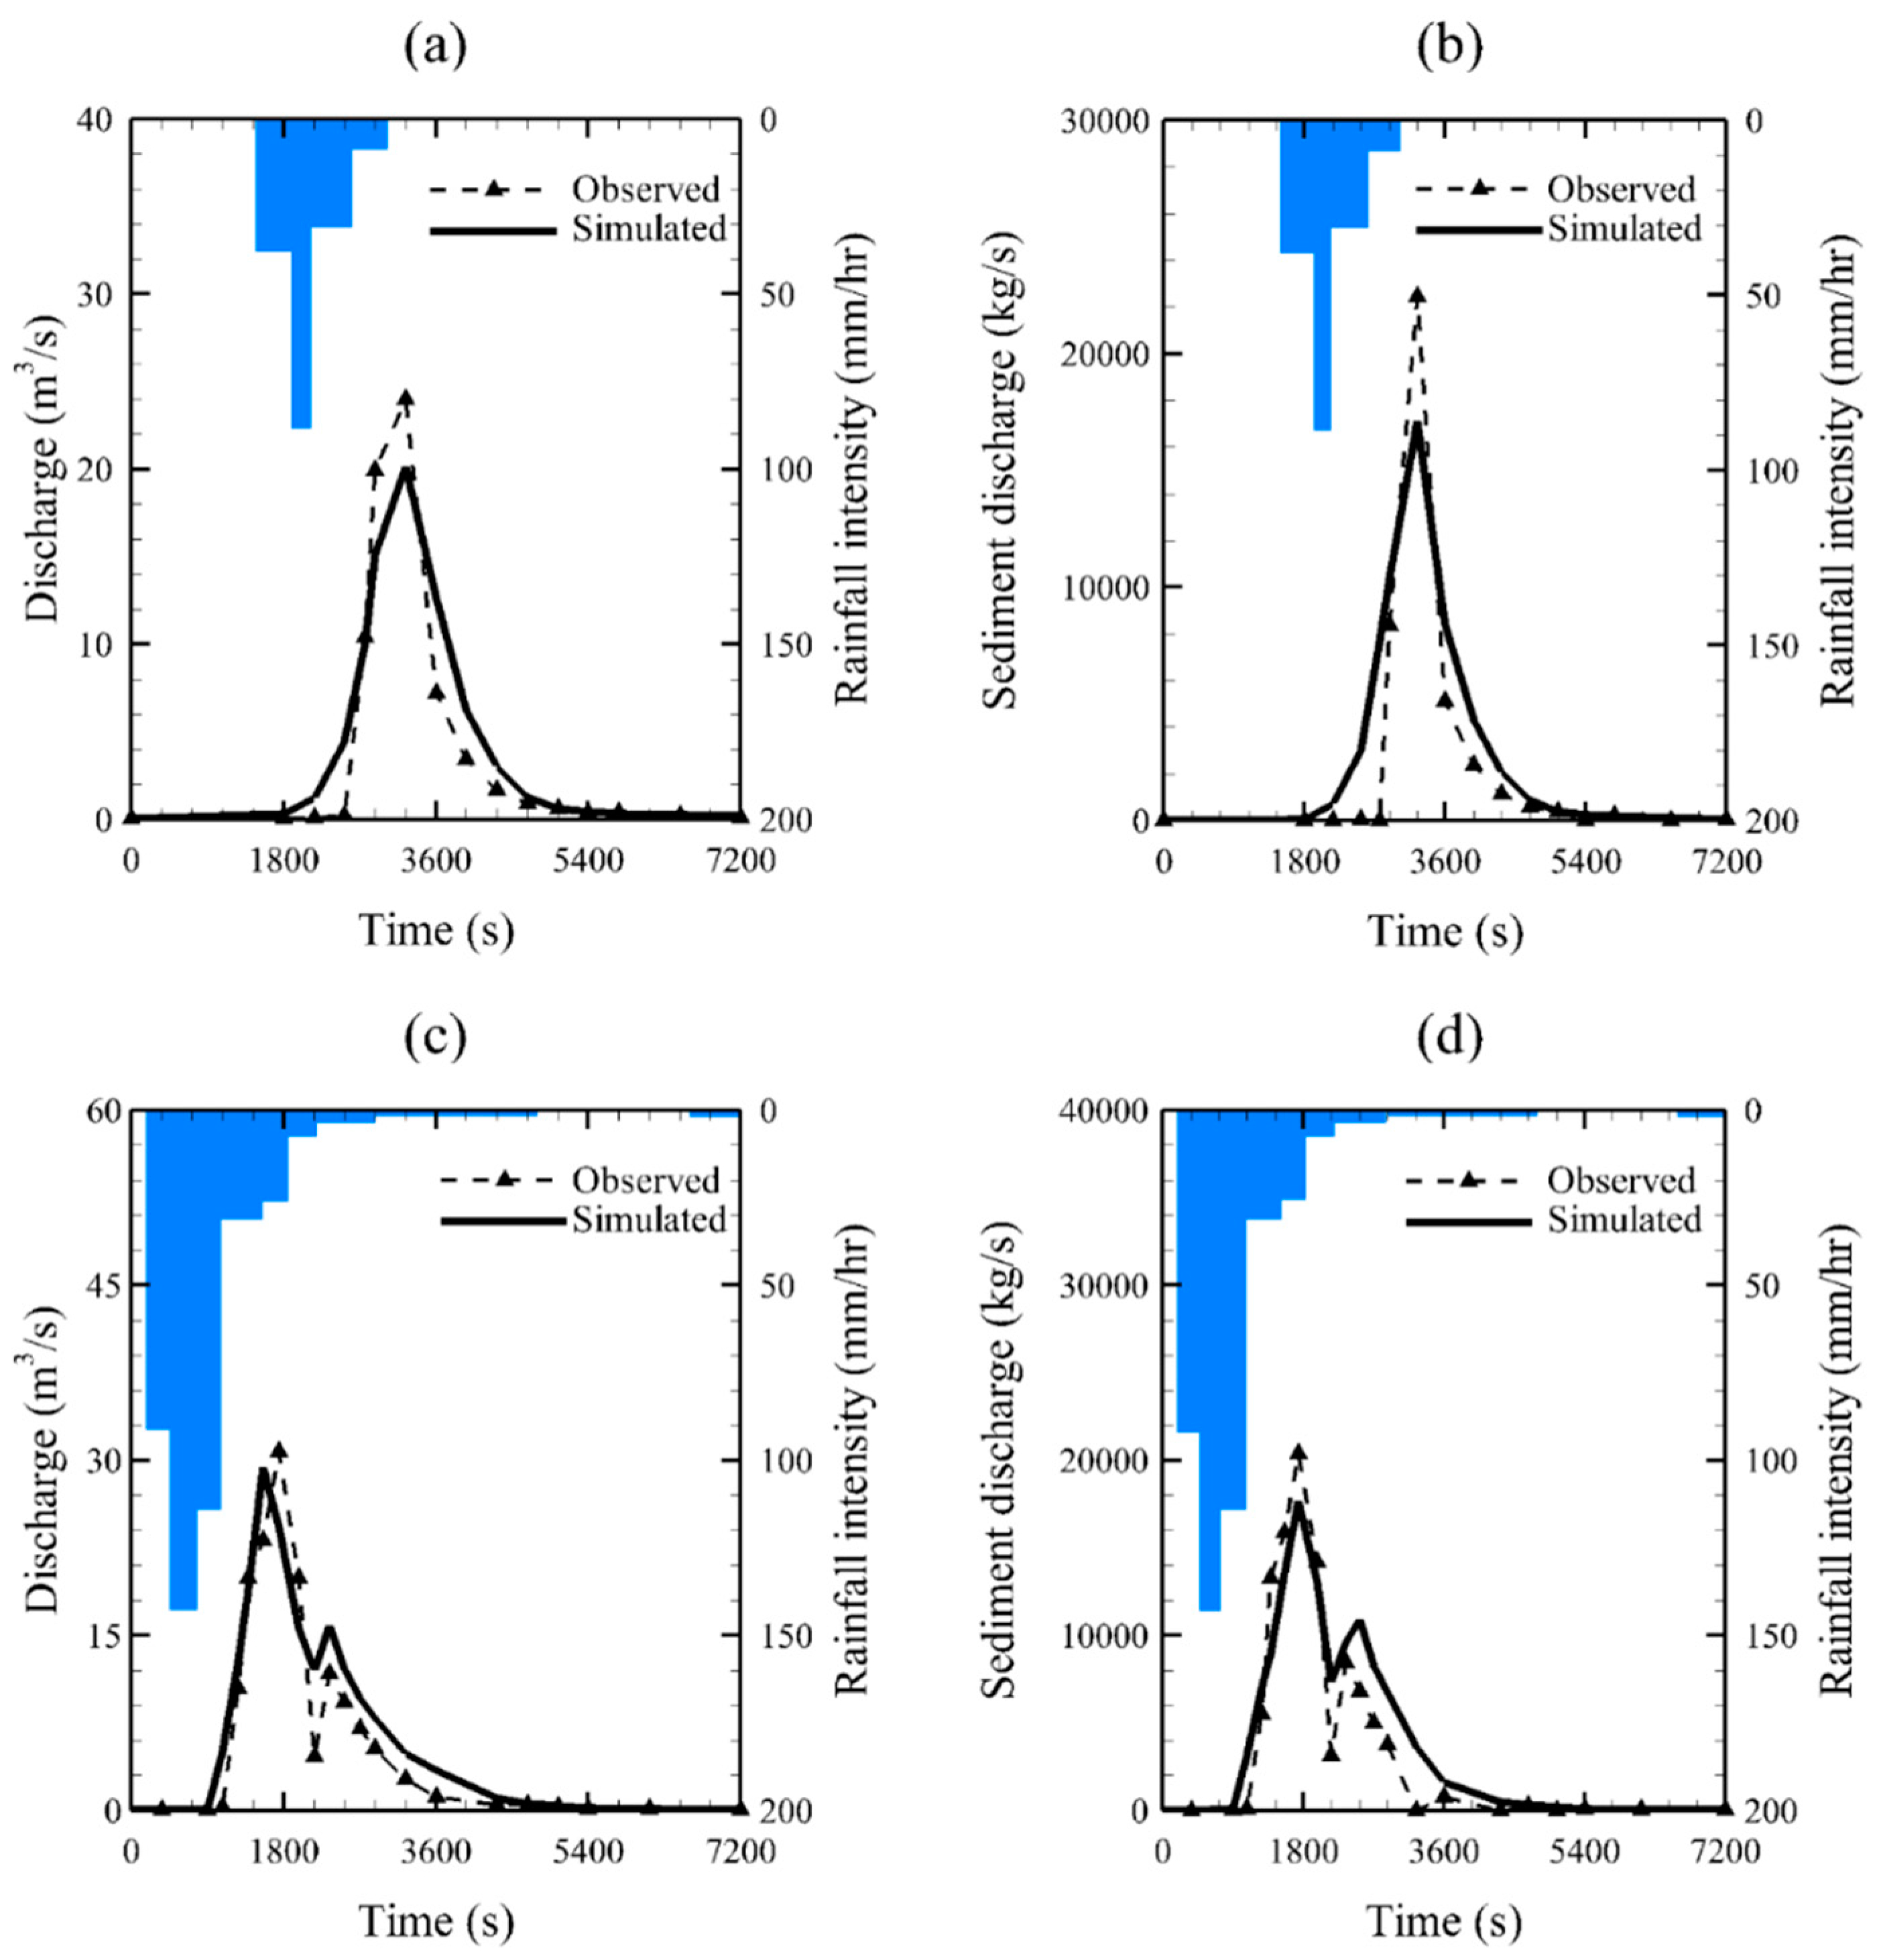
Two rainfall-runoff events were selected for the model calibration (event of 1964/7/14) and validation (event of 1964/8/2). The two events were chosen among the 31 recorded events because they were two of the largest events with the most detailed (i.e., complete and fine in temporal resolution) precipitation data. The saturated hydraulic conductivity and Manning’s roughness coefficient were calibrated to fit the observed discharge at the Shejiagou hydrologic station. After that, the rainsplash coefficient and the surface erodibility coefficient were calibrated to fit the observed sediment discharge. The Nash-Sutcliffe efficiency [50] was used as the criterion to evaluate the model performance:
where Oi was the observed value (water discharge or sediment discharge), was the average value of the observed values, and Si was the simulated value and n was the number of samples. The Nash-Sutcliffe coefficients of the calibration were 0.763 and 0.738 for river flow and sediment discharge, and those of the validation were 0.781 and 0.732, respectively (Figure 4). These results showed good performance of the InHM with the optimized parameter set in the Shejiagou catchment. This parameter set (Table 3 and Table 4) was then used in the scenario modelling runs.
The Manning’s roughness coefficient values were calibrated to be 0.010 s m−1/3 for the hillslopes and 0.008 s m−1/3 for the gullies (including the main channel and sedimentary land) and 0.004 s m−1/3 for the dam body in the catchment (Table 4). The calibrated Manning’s roughness coefficient values were small but reasonable due to the low vegetation coverage and the large area of bare land and cultivated land in the Shejiagou catchment during the simulation period (i.e., 1964) [25,27]. Similar values have been measured on bare land and cultivated land through field experiments in the Loess Plateau in a few studies e.g., [51,52].
2.4.5. Evaluation Criteria
To evaluate the influences on flood processes under different deployment strategies, the hydrograph and sedigraph at the catchment outlet were compared among the eight scenarios. Flood peak discharge (Qp), peak time (Tp), and flood volume (Qv) of each scenario were derived from the hydrographs. The runoff ratio (RR), which reflected the influences of check dams on the runoff-precipitation relationship in this study, was also calculated through dividing the runoff depth by the rainfall depth. To compare the efficiencies of sediment reduction under different deployment strategies, indicators such as Qs,p (sediment discharge peak), SY (sediment yield observed at the catchment outlet), and ES (the total mass of eroded sediment in the catchment) were derived from the modelling results. Besides, the sediment delivery ratio (SDR) was calculated as follows:
SDR has multi-fold environmental implications both in evaluating the soil erosion processes of a catchment and the effectiveness of soil and water conservation measures conducted in a catchment [53]. Variations of SDR of a specified catchment can be induced either by changes in SY or in ES. A comprehensively analysis of the changes in SDR, SY, and ES under different scenarios led to a more complete understanding of the changes in sediment transport processes caused by filled check dams. Moreover, the final distribution of eroded or deposited sediment in the catchment was also analyzed to furtherly understand the influences of filled check dams on sediment transport processes.
3. Results
3.1. Variation Characteristics of Flood Processes under Different Deployment Strategies
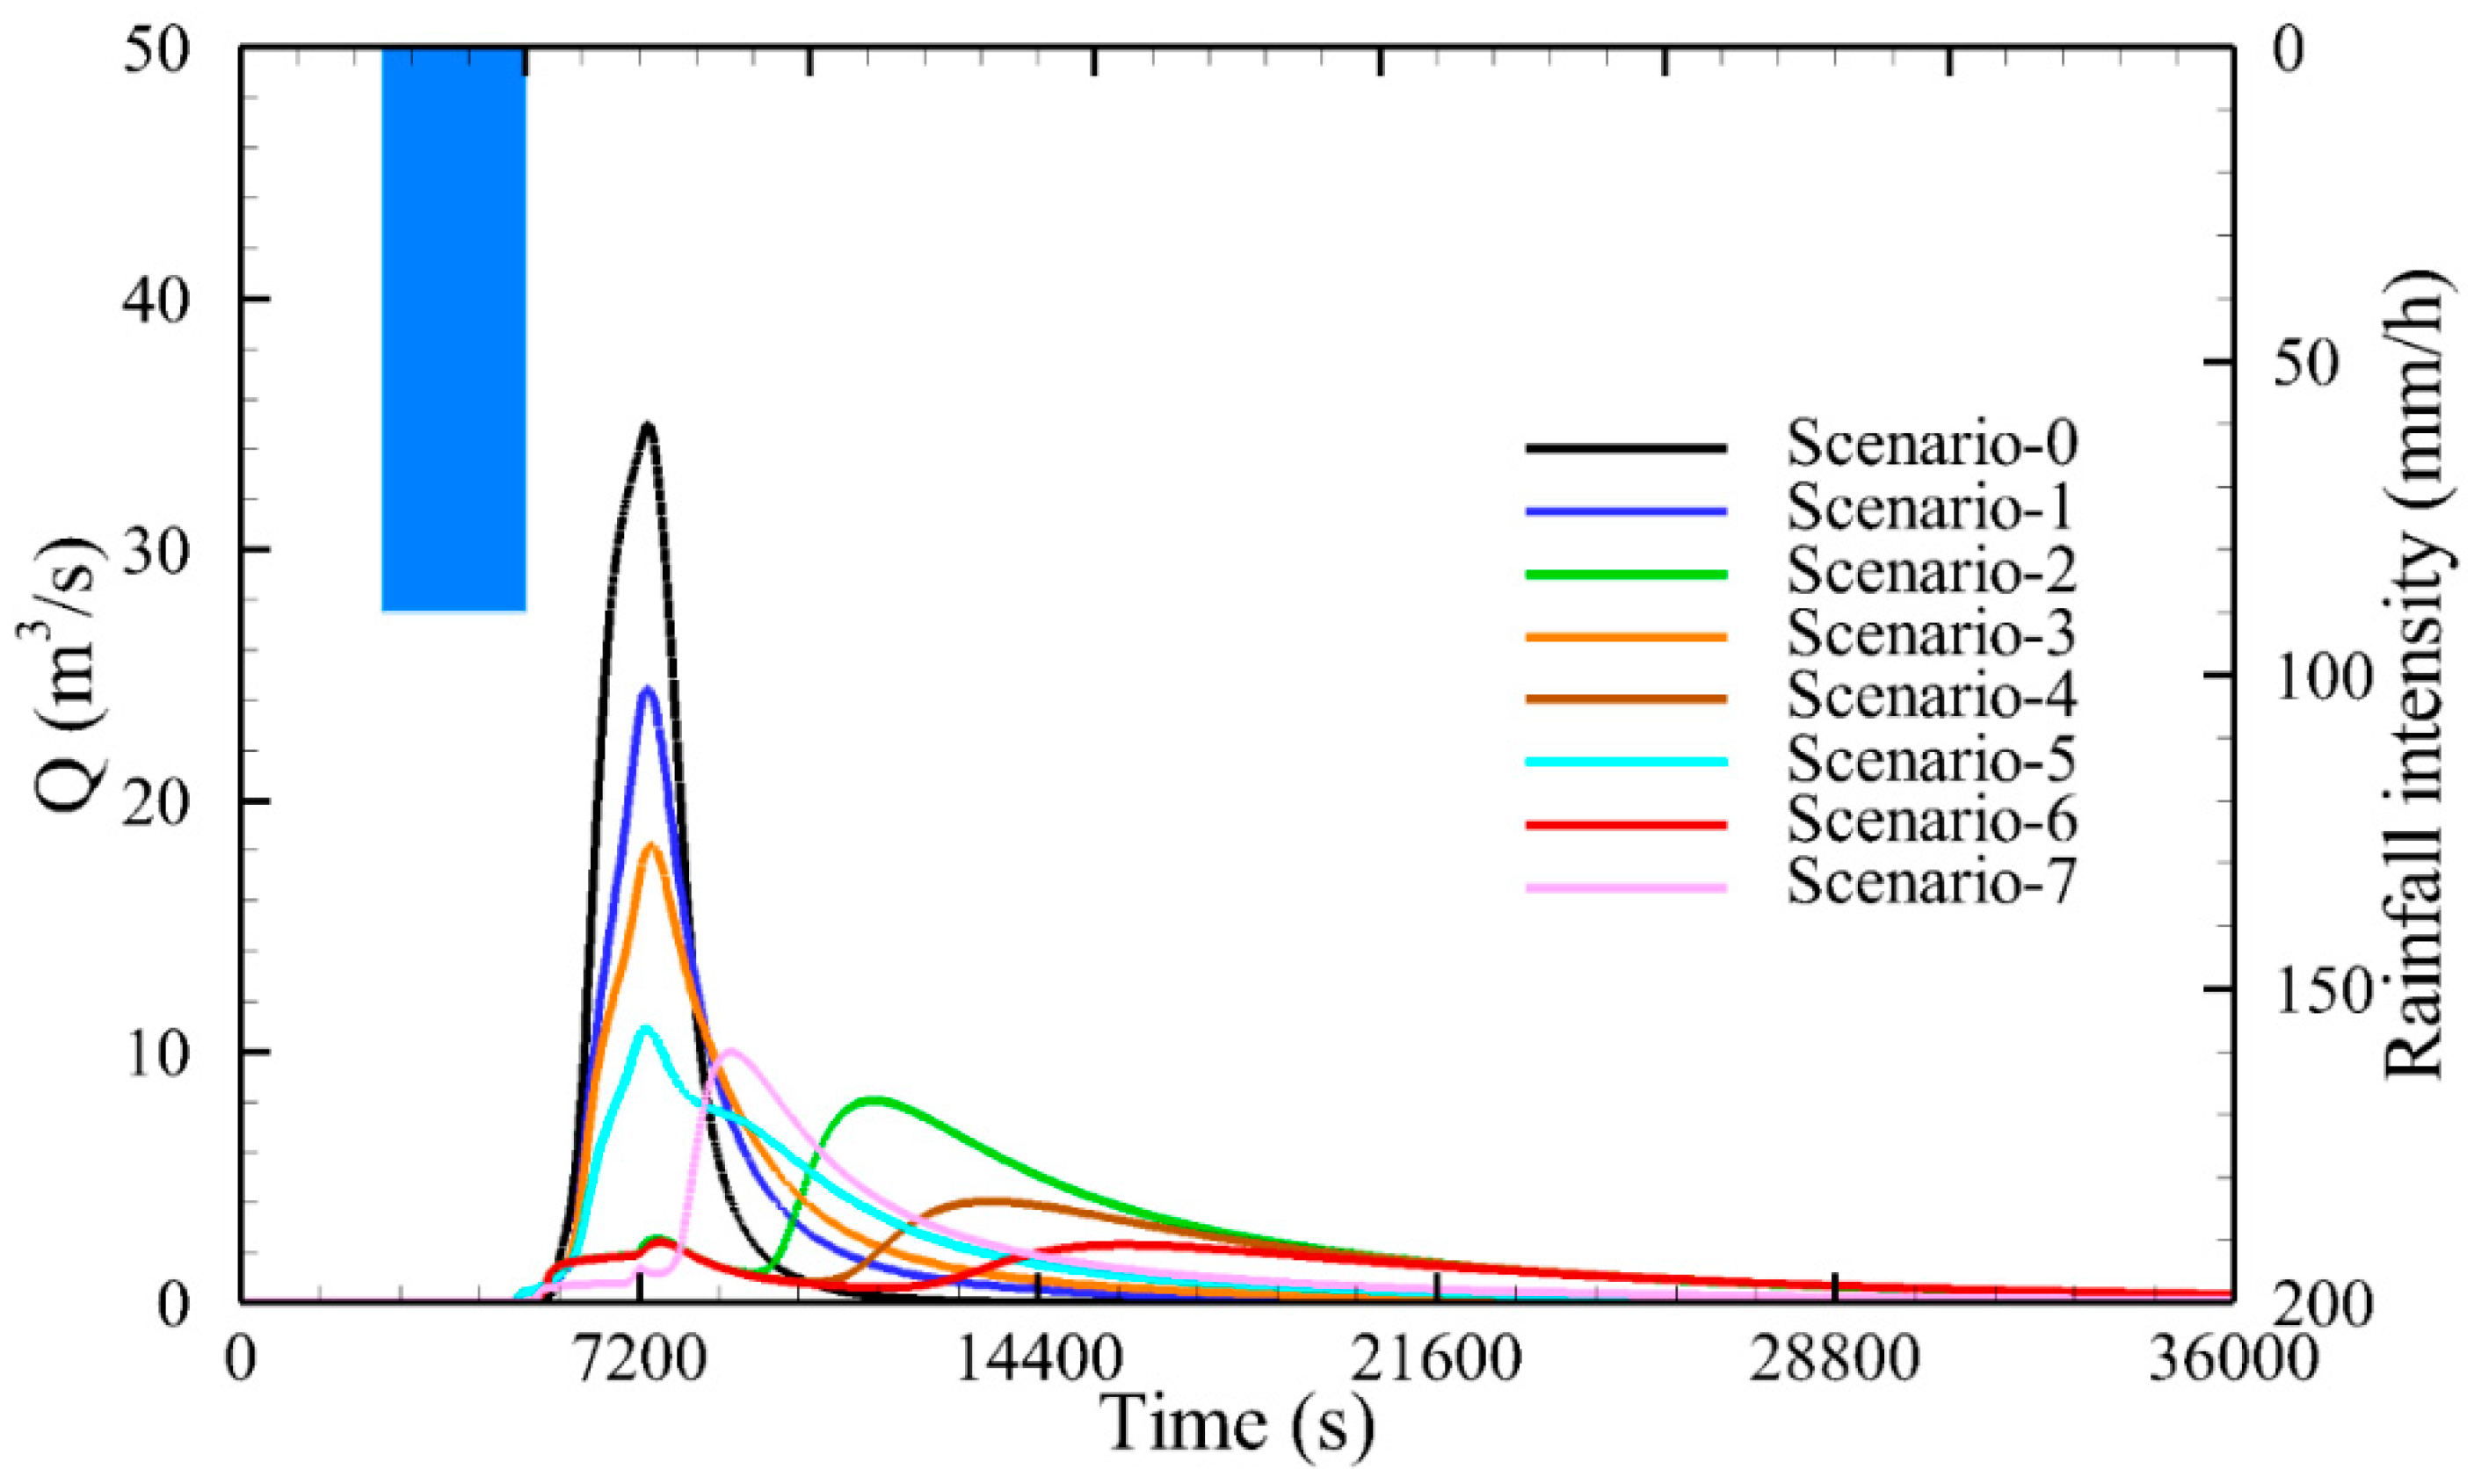
The flood processes were significantly changed by filled check dams under different deployment strategies (Table 5, Figure 5). Compared to scenario-0 (i.e., no check dams), the existence of check dams and their sedimentary lands reduced and delayed the flood peak. The efficiencies of flood-peak reduction and delay under the 7 deployment strategies were scenario-6 > scenario-4 > scenario-2 > scenario-7 > scenario-5 > scenario-3 > scenario-1. The hydrographs at the catchment outlet showed two different patterns: (1) the flood discharge rose and dropped sharply with a large peak discharge in scenario-0, scenario-1, scenario-3 and scenario-5; (2) the rising limb of hydrographs were delayed and more gentle, and the recession limb of hydrographs were longer in scenario-2, scenario-4, scenario-6, and scenario-7. The major difference between scenarios 2,4,6 and scenarios 1,3,5 was the existence of the large check dam (e.g., S2-2) on the middle reach of the main channel (Figure 2), which indicated that two large check dams constructed in series on the main channel could be more beneficial in flood peak attenuation than scenarios with only one large check dam. For scenarios with only one large check dam (i.e., scenarios 1,3,5), increasing the number of small check dams on the gullies led to significant reduction of flood peak and insignificant delay of peak time. For scenarios with two large check dams (e.g., scenarios 2,4,6), the delay of flood peak was longer when adding more small check dams in the catchment. Besides, proper site selection of large check dams on the main channel also made a difference in flood peak attenuation (e.g., scenario-6 versus scenario-7).
Different from unfilled check dam systems, which not only reduce flood peak but also reduce flood volume significantly [24], the reductions of flood volume by filled check dam systems were smaller (Table 5). For unfilled check dams, surface flow is intercepted by the dam body until the water depth is higher than the inlet of spillway, which forces a large amount of water to retain behind the check dam. For filled check dams, the elevation superiority of the spillway over the upstream channel no longer existed, and the flood volumes were mainly reduced by the promoted infiltration processes and the slowdown of flood velocity on the wider channel (i.e., sedimentary lands). Even so, the flood reduction rate can still be as much as 34.10% in scenario-6, in which the size combination was two large check dams and two small check dams. The efficiencies of flood-volume reduction under the 7 deployment strategies were scenario-6 > scenario-7 > scenario-4 > scenario-2 > scenario-5 > scenario-3 > scenario-1. Different from the flood peak, the flood-volume reduction rate of scenario-7 was larger than scenario-3 and scenario-4. A possible explanation for this result may be that there were more check dams and sedimentary lands in scenario-7 in the headwater areas, where more runoff was generated compared to other areas [22]. In scenario-7, the sedimentary lands of the three upstream check dams were connected and became a larger infiltration zone for the upstream runoff than those in scenario-2 and scenario-4. Under the same rainfall condition (i.e., 90 mm), changes of the runoff coefficient under different deployment strategies were consistent with those of the flood volume observed at the catchment outlet.
3.2. Variation Characteristics of Sediment Transport Processes under Different Deployment Strategies
The changes of sediment transport processes at the catchment outlet were generally consistent with the variation characteristics of flood processes under different deployment strategies (see Figure 5 and Figure 6). Along with the reduction and delay in flood peaks, the sediment discharge peaks (i.e., Qs,p) were also reduced and delayed. The efficiencies of Qs,p reduction under the 7 deployment strategies were scenario-6 > scenario-4 > scenario-2 > scenario-5 > scenario-7 > scenario-3 > scenario-1 (Table 6). This result highlighted the importance of adding a large check dam on the middle reach because there was a large check dam on the middle reach of the catchment in scenarios 6,4,2 and no large check dam on the same position in scenarios 5,7,3,1 (see Figure 2). Differently, the reduction rate of Qs,p in scenario-5 (i.e., 67.43%) was larger than that in scenario-7 (i.e., 59.02%), while the reduction rate of Qp in scenario-5 (i.e., 69.12%) was slightly smaller than that in scenario-7 (i.e., 71.45%). This was because that the gully controlled by check dam S5-2 contributed a large amount of eroded sediment into the main channel (see Figure 6 in [22]), and there was no check dam on the heavily eroded gully in scenario-7, indicating that targeted treatment to heavily eroded gullies could lead to a better performance of the check dam system in sediment reduction.
The reduction rates of sediment yield at the catchment outlet were basically higher than those of flood volume except for scenario-2 and scenario-7 (Table 5 and Table 6), indicating that the deposition-promotion performance of sedimentary lands was normally better than their infiltration-promotion performance under most of the deployment strategies. The efficiencies of sediment-yield reduction under the 7 deployment strategies were scenario-6 > scenario-4 > scenario-5 > scenario-7 > scenario-2 > scenario-3 > scenario-1, implying that an increase in the number of check dams and targeted treatment to heavily eroded gullies could lead to a better performance in reducing sediment output of the catchment. Table 6 also showed that the total amount of eroded sediment in the catchment after a flood decreased due to the existence of filled check dams, and the reduction efficiencies were scenario-6 > scenario-4 > scenario-7 > scenario-2 > scenario-5 > scenario-3 > scenario-1. The reduction of total eroded sediment might be attributed to the lifting of erosion base of channels and hillslopes around the sedimentary lands, which led to decrease of runoff erosion power [24,54]. Large decreases of the sediment delivery ratio (SDR) were found in scenario-6 and scenario-4, which were consistent with the results of sediment yield at the catchment outlet. However, for scenarios with both small decreases of sediment yield and eroded sediment mass (e.g., scenario-1, scenario-2, scenario-7), their benefits for sediment reduction were hard to distinguish from SDR.
3.3. Erosion/Deposition Distribution in the Catchment under Different Deployment Strategies
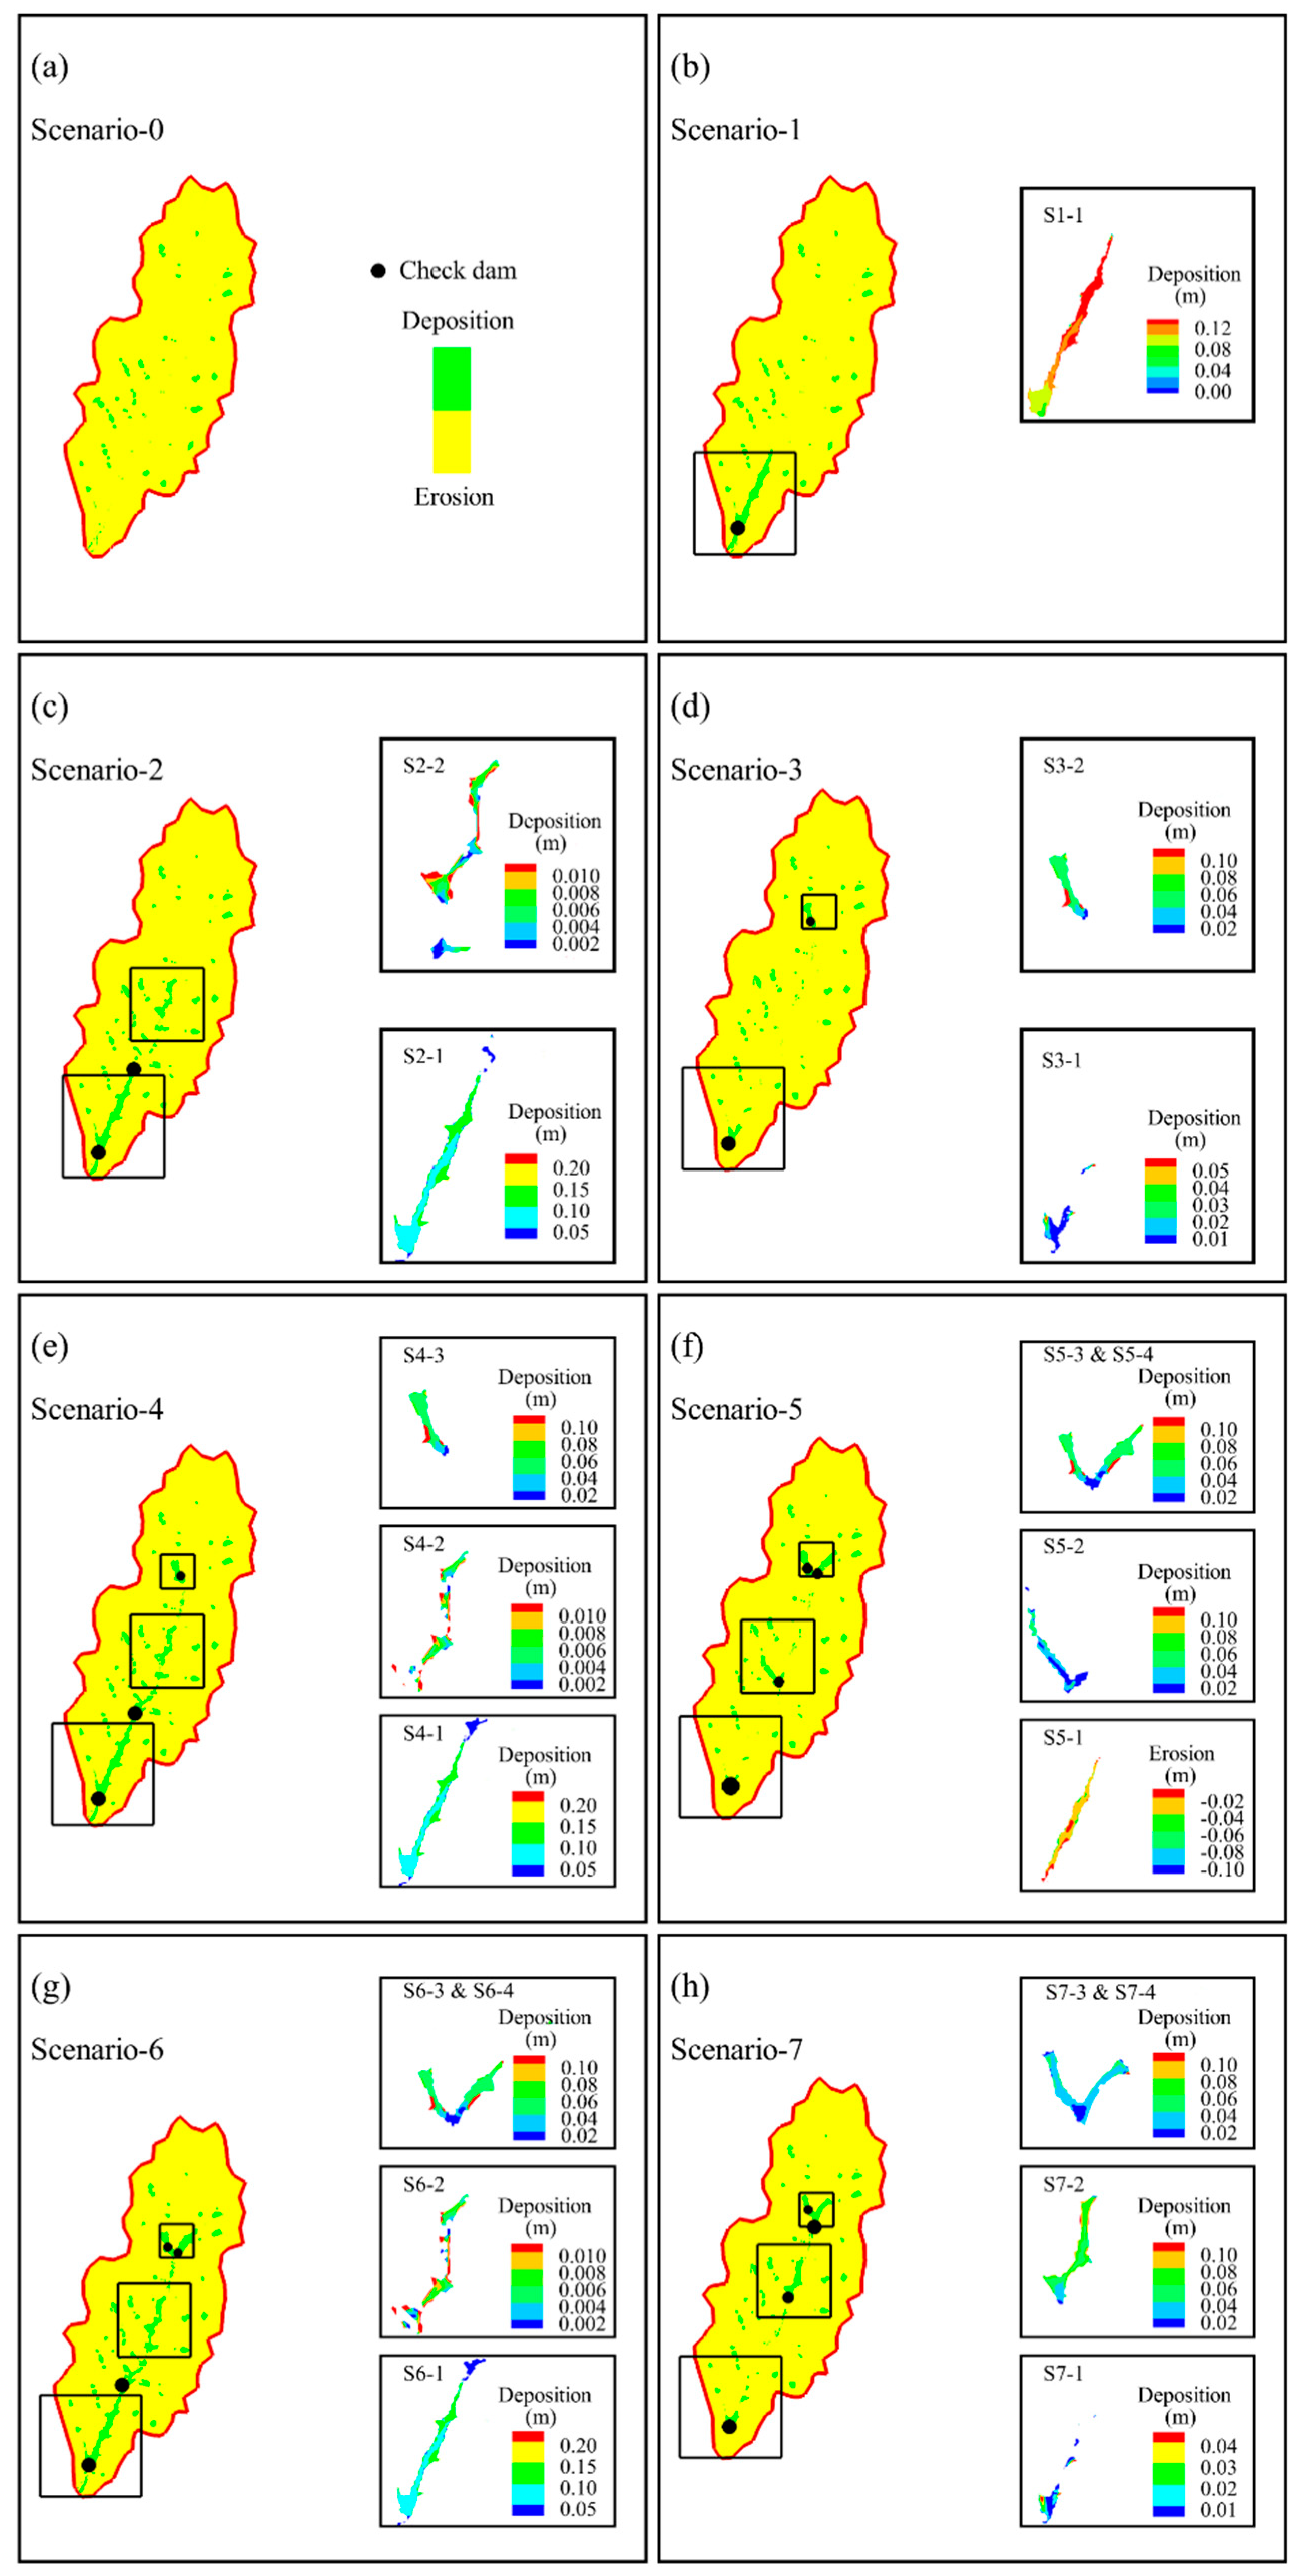
The final distributions of erosion and deposition areas under the eight scenarios were shown in Figure 7. When there was no check dam in the catchment (i.e., scenario-0), erosion processes occurred both on hillslopes and in channels, while deposition areas were sparsely scattered in gully-head areas (Figure 7a). However, the existence of check dams, even when they were filled, could transform a large area of channels and gullies into deposition sinks (Figure 7b–h). By comparing the deposition depths behind each check dam (i.e., in the sedimentary land), we found that more sediment was deposited on the upstream sedimentary lands (i.e., the tail-end areas of the sedimentary land) than on the areas that were close to the check dams (e.g., Figure 7b). This deposition pattern was different from that of an unfilled check dam. For an unfilled check dam, flood processes were stopped at the near-dam area, and consequently, deposition processes occurred there. Therefore, the thickness of the deposition layer was thicker at the near-dam area than at the upstream area [55]. For a filled check dam with a large and flat sedimentary land, which was considered in this study, flood processes were weakened as soon as the surface flow entered the tail-end areas of sedimentary lands due to the decrease of slope gradient [21], consequently promoting sediment to deposit on these areas.
Perusal of the deposition distributions under different deployment strategies led to the following implications:
- Increasing the number of check dams, especially large check dams, can significantly promote sediment deposition in the channel (e.g., Figure 7a–c,e,g). More check dams mean more elevated sedimentary lands with low channel gradients, creating a larger buffer zone for flood attenuation.
- The location and size of check dams do matter in sediment deposition. A large check dam on the main channel will create a larger deposition area than a small check dam (e.g., comparison of scenario-4 and scenario-5 in Figure 7e,f).
- Deployment strategies that can connect the sedimentary lands formed by different check dams lead to a better performance in flood attenuation and sediment reduction. For example, the performances of scenarios 6, 4, and 2 in the reduction of flood peak, sediment yield and eroded sediment were generally better than the performances of scenarios 3, 5, 7.
Deducing from those implications, in the situation where all check dams were filled, the best deployment strategies of check dams were those with large and connective sedimentary lands on the main channel and targeted treatments to heavily eroded gullies (e.g., scenario-6 in this study).
4. Discussion
4.1. Potential Benefits of Filled Check Dams in Flood and Erosion Control
Unlike check dams with large remaining storage capacity (i.e., low fill rate), filled check dams influence the flood processes mainly by the sedimentary land formed behind the check dams. Characterized as having a relatively high permeability [20] and a low slope gradient [46], the sedimentary land is able to attenuate flood velocity, and locally promote water infiltration and sediment deposition, consequently reducing and delaying the flood processes (Figure 5). Compared to the original channel, the sedimentary land is less susceptible to hydraulic erosion due to the attenuation of flood and the relatively large size of surface particles on the sedimentary land [56]. Therefore, the upstream expansion of sedimentary land will protect the soils of some channel areas and slope areas from being eroded, indirectly reducing the erodible area of the catchment. For example, the sedimentary land of S1-1 (i.e., the large check dam in scenario-1) protected approximate 950 m of the original channel reach and covered around 2.33 × 10⁴ m2 of hillslopes around the channel, indirectly reducing by 900 t (2.18%) eroded sediment. This indirect benefit of a filled check dam, which has not been quantitatively analyzed by previous studies, was termed as the lifting of erosion base by [54].
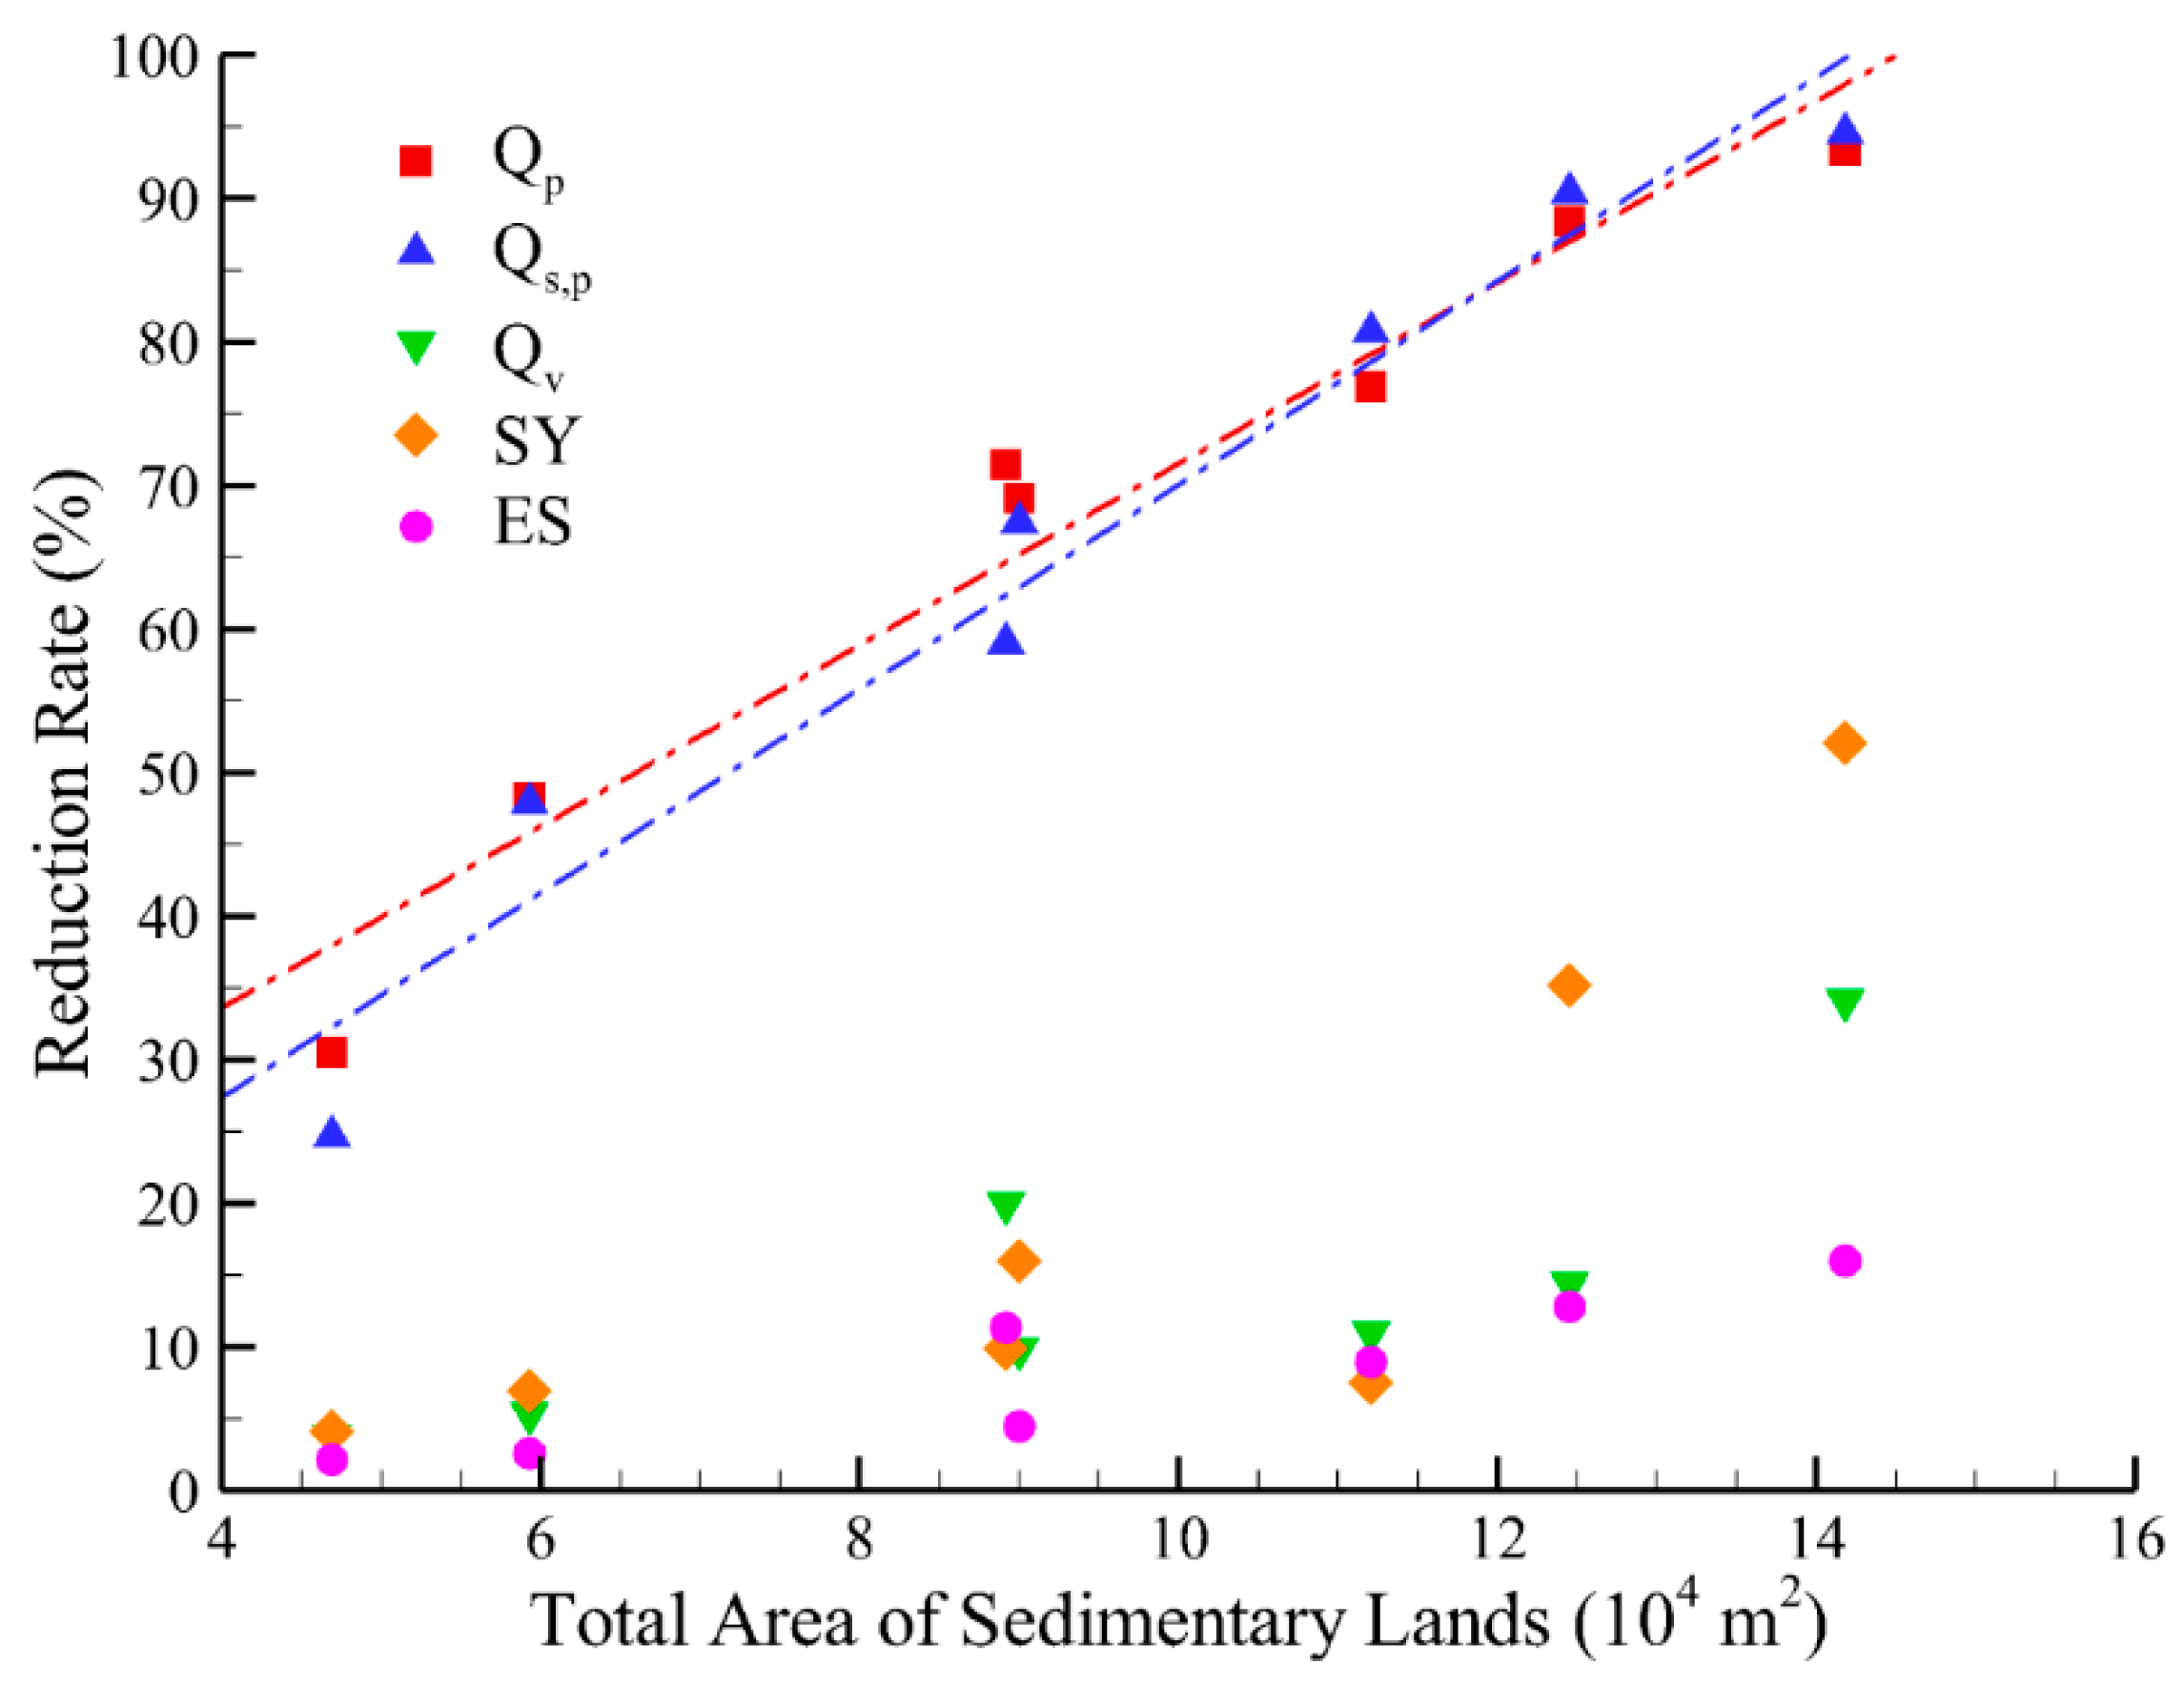
The increase of sedimentary lands resulted in considerable reductions in flood peak discharge (Qp) and sediment peak discharge (Qs,p), and the reduction rates responded linearly to the area of sedimentary land (Figure 8), which implies the long-term potential benefits of the large amount of check dams in the Loess Plateau. Although the remaining storage capacity of them will be totally consumed in the future, the sedimentary lands behind check dams will still be effective in flood control. As the area of sedimentary land increases, the reduction rates of flood volume (Qv), sediment yield (SY), and eroded sediment (ES) were smaller than those of Qp and Qs,p (Figure 8), because these indicators were also sensitive to the size combination and site selection of check dams (Table 5 and Table 6).
Check dams, especially small check dams, are filled quickly in the catchment with severe erosion problems (e.g., in the Loess Plateau). For example, 444 check dams (including 39 large check dams) were constructed during 1953–1977 in the 200 km2 Chabagou watershed and more than 60% of them were filled according to the check dam survey in 1978 (Figure 9). Several studies have reported that the flood processes were obviously attenuated and the runoff and sediment yield out of the Chabagou watershed were largely decreased due to check dam construction and hillslope treatments (e.g., terrace farming, afforestation) [57,58,59]. Based on the results of this study, it can be inferred that these filled check dams and their sedimentary lands also had a nonnegligible contribution to the reduction of runoff and sediment yield. Quantitatively modelling the cumulative effect of flood attenuation by the large number of filled check dams will help to obtain a more comprehensive understanding of the potential benefits of check dams in the long-term.
4.2. Implications of Future Check Dam Deployment
The quick-fill of check dams due to the large sediment yields during wet seasons and frequent dam breaks caused by flood overtopping often shorten the lifespan of check dams in the Loess Plateau [17]. For example, the two upstream check dams in the Shejiagou catchment (i.e., S7-3 and S7-4 in scenario-7) were totally filled after ten year’s operation according to the check dam survey in 1978 [22]. There were technically two possible solutions to this problem: (1) dam maintenance such as regular sediment removal behind check dams can create new sediment storage capacities for filled check dams; (2) construction of open check dams, which have a permanent outlet and can let more sediment be transported downstream [60]. However, the first solution seems to be unfeasible in most of the Loess Plateau catchments due to the large amount of check dams on the Loess Plateau and the high expense for large excavators to transport and work in the gullies. On the other hand, the sediment reduction rate of open check dams is much lower than the check dam studied in this study, which cannot meet the urgent needs of sediment reduction for the heavily eroded Loess Plateau catchment. Besides, the construction materials of the dam body for open check dams are usually stone or concrete, which increase the construction expense in the hilly-gullied Loess Plateau catchment. Instead, check dams in the Loess Plateau catchment are usually gravity dams constructed by the local earth using materials from the nearby hillslopes, which largely reduces the construction expenses (see the Supplementary Materials).
Therefore, a scientific deployment strategy of check dams is necessary in order to obtain the largest benefits of flood attenuation and sediment interception when the storage capacities of check dams are consumed in the future. According to Table 7, scenarios with two large check dams (e.g., scenarios 2,4,6,7) performed better than scenarios with only one check dam (e.g., scenarios 1,3,5) in the reduction of Qp and Qv. Except for scenario-5, scenarios with two large check dams (i.e., scenarios 2,4,6,7) also performed better than scenarios with only one large check dam (i.e., scenarios 1,3) in the reduction of Qs,p, SY, and ES. Apart from the number of large check dams in the system, the locations and number of small check dams also made a difference in the reduction performance. For example, scenario-5 performed better than scenario-7 in the reduction of Qs,p and SY because there was targeted treatment (i.e., check dam S5-2) to a heavily eroded gully in scenario-5. In the aspect of flood control, constructing large check dams on the main channel and making the sedimentary lands of the large check dams as connective as possible will obtain the best performance in the reduction and delay of flood peak (Table 7). Similar results were reported in [20], which showed that the combination of more than one large check dams on the main channel led to a considerable increase of groundwater recharge. In the aspect of sediment control, targeted treatment to specified gullies combined with large and connective sediment sinks in the main channel will largely promote sediment deposition in the channel and reduce soil erosion of hillslopes and channels (Table 7). Compared the current deployment strategy (i.e., scenario-7), the deployment strategy in the hypothetical scenario-6 which was more in line with the description above indeed performed better both in flood and sediment control.
4.3. Limitations and Future Work
There were two simplifications in the parameterization of sedimentary land to simplify the problem in this study: (1) the elevations of surface nodes on the same sedimentary land were the same (i.e., the slope gradient of sedimentary land was zero) and (2) no croplands were planted on the sedimentary land. In reality, the slope of a sedimentary land in a check dam system is normally less than 2%. The first simplification might lead to a slight overestimation of the flood attenuation effects of sedimentary lands. However, most sedimentary lands in the Loess Plateau are planted with crops (e.g., corn), which increase surface roughness and local infiltration. This led to a small underestimation of the decrease in flow velocity and the sediment deposition. The two simplifications only had small influences on the flood processes, and their influences might offset each other [61].
While the implications on deployment strategies of check dams were specified to Shejiagou catchment, we believe that similar findings may be obtained for larger catchments with more complex check dam systems (e.g., other sub-catchments of Chabagou watershed in Figure 9). For this reason, future research will focus on larger sites with more complicated stream networks and check dam systems, to validate the implications and to provide a more comprehensive guidelines for the optimization of check dam deployment strategies. Besides, the influence of sedimentary land on catchment hydrologic responses and sediment transport processes in a larger time scale instead of event-scale need to be studied in order to aid the prediction of future changes in runoff and sediment yield in the Loess Plateau.
5. Conclusions
Employing the InHM, this study investigated the influences of filled check dams with different deployment strategies on the flood and sediment transport processes in a Loess Plateau catchment, which is a 4.26 km2 erosion-prone area and currently has four check dams. Six hypothetical scenarios representing different deployment strategies were compared with no-dam scenario and the scenario that is currently applied in this catchment. Event-scale rainfall-runoff simulations were conducted with a 90 mm hr−1 rainfall intensity for the eight scenarios. Indicators such as flood peak discharge (Qp), peak time (Tp), flood volume (Qv), sediment peak discharge (Qs,p), sediment yield (SY), and eroded sediment (ES) were used to compare the performances of different deployment strategies in flood and sediment control.
Filled check dams were still able to reduce flood peak by 31% to 93% under different deployment strategies. Considerable delays of peak time and decreases were also found in scenarios 2,4,6, which were characterized as having larger and more connective sedimentary lands on the main channel. Reduction rates of sediment yield and eroded sediment ranged from 4% to 52% and 2% to 16%, respectively, indicating that a proper distribution of check dams was beneficial to promote sediment deposition in the channel and reduce soil erosion of hillslopes and channels.
Apart from showing the potential benefits of filled check dams, this modelling exercise provided the following insights on the deployment strategy of check dams, which led to a better performance in flood and sediment control when check dams are filled:
- The number of large check dams on the main channel appears to be the most important factor influencing the flood and sediment transport processes.
- Connecting the sedimentary lands of large check dams via proper site selection is helpful for flood attenuation and sediment reduction.
- The area of sedimentary lands dominates the reduction rates of water/sediment peak discharge, while the size combination and site location can make a difference in the reduction of flood volume, sediment yield, and the total eroded sediment.
- Targeted treatment to heavily eroded gullies (e.g., scenario-5) will improve the sediment-reduction performance of the system, which requires a sediment-contribution analysis of each gullies via modelling practices or field observation to aid the site selection.
Compared to the current deployment strategy (i.e., scenario-7), a more scientific deployment strategy for the selected catchment, which is more in line with the insights above, was proposed (i.e., scenario-6).
The simulations reported herein took a first step to explore the potential benefits of filled check dams and demonstrated that check dams could have a long-term influence on the flood and sediment transport processes via forming sedimentary lands that changes the catchment landforms permanently.
Supplementary Materials
The following are available online at https://www.mdpi.com/2073-4441/12/5/1319/s1, Figure S1: (a) Sediment erosion (negative value) and deposition (positive value) rates for Shejiagou catchment; (b) Sediment inflow to stream segments; (c) Cumulative flow without check dams (Debasish et al., 2018), Figure S2. Open check dams. Beam dam (left), silt dam (right). Derived from Armanini and Larcher (2001), Figure S3. Characteristic components of a sediment trap with an open check dam: (a) inlet structure: solid body dam; (b) scour protection; (c) basin; (d) lateral dikes; (e) maintenance access; (f) open check dam; (g) counter dam. Derived from Piton and Recking (2015), Figure S4. Examples of check dams in the Loess Plateau. (a) check dam LDG-1 in Liudaogou catchment; (b) check dam MDZ-1 in Wangmaogou catchment; (c) check dam NYG-2 in Nianyangou catchment; (d) check dams system in Shejiagou catchment.
Author Contributions
Conceptualization, H.T.; methodology, H.T.; software, Q.R.; validation, H.T.; formal analysis, H.T.; investigation, H.P.; writing—original draft preparation, H.T.; writing—review and editing, Q.R.; supervision, Q.R.; funding acquisition, Q.R. All authors have read and agreed to the published version of the manuscript.
Funding
This study was funded by the China Major Science and Technology Program for Water Pollution Control and Treatment (2017ZX07206-001) and the National Natural Science Foundation of PR China (Grant no. 51379184 and no. 51328901).
Acknowledgments
We thank the Zizhou Experimental Station of YRCC and the National Earth System Science Data Center, National Science & Technology Infrastructure of China (http://www.geodata.cn) for providing essential observation data. We also thank the two anonymous reviewers for providing constructive suggestions. Special thanks to Amplin for helping improve the language of the manuscript.
Conflicts of Interest
The authors declare no conflict of interest.
Appendix A. The Integrated Hydrologic Model (InHM)
Appendix A.1. Hydrologic-Response Module
The 3D subsurface flow in variably saturated porous medium is estimated in InHM by:
where [-] is the area fraction related to each continuum, [LT−1] is the Darcy flux, [T−1] is a specified rate source/sink, [T−1] (equal to ) is the rate of water exchange between the porous medium and surface continua, [-] is the volume fraction associated with each continuum, [L3L−3] is porosity, [L3L−3] is the water saturation, [T] is time, [-] is the relative permeability, [ML−3] is the density of water, [LT−2] is the gravitational acceleration, [ML−1T−1] is the dynamic viscosity of water, [L2] is the intrinsic permeability vector, [L] is the pressure head, and [L] is the elevation head.
The diffusion wave approximation to the depth-integrated shallow wave equations is employed in InHM to estimate the 2D transient surface flow on the land surface (both overland and open channel), with the conservation of water on the land surface expressed by:
where [L] is the surface water depth, [LT−1] is the surface water velocity calculated by a two-dimensional form of the Manning’s equation, as[L] is the surface coupling length scale, qb[T−1] is the source/sink rate (i.e., rainfall/evaporation), [T−1] is the rate of water exchange between the surface continua and porous medium, [L] is the average height of non-discretized surface microtopography, [TL−1/3] is the Manning’s surface roughness tensor, and [-] is the friction (or energy) slope; [L] and [L] refer to the water depth exceeding and held in depression storage, respectively.
The calculated daily potential evapotranspiration was then incorporated into InHM as actual evapotranspiration (ET) using a set of sink functions:
where [L3T−1] represents the volumetric evapotranspiration rate, [-] is a response function of the saturation of the porous medium and the degree of ponding at the land surface, [LT−1] is the potential evapotranspiration rate per unit area estimated by the revised Penman–Monteith method, [L] is the pressure head of the subsurface nodes or water depth of the surface nodes, and [L2] is the area associated with the surface water equation
The first-order coupling between the surface and subsurface continua, driven by pressure head gradients, occurs via a thin soil layer of thickness, in Equation (A3). The control volume finite-element method is employed to discretize the equations in space. Each coupled system of nonlinear equations is solved implicitly using Newton iteration.
Appendix A.2. Sediment-Transport Module
Depth-integrated multiple-species sediment transport, restricted to the surface continuum, is calculated for each sediment species by:
where [L3L−3] is volumetric sediment concentration, [LT−1] is the depth-averaged surface water velocity, [L3] is the volume of water at the node, [L3T−1] is the volumetric rate of soil erosion and/or deposition, [L3T−1] is the rate of water added/removed via the jth boundary condition, [L3L−3] is the sediment concentration of the water added/removed via the jth boundary condition, BC is the total number of boundary conditions. The net erosion rate is the sum of the rainsplash erosion rate [L3T−1] and the hydraulic erosion rate [L3T−1]. The rainsplash erosion rate of each species in Equation (A7) is calculated as:
where [-] is the source fraction of species i, [(TL−1)b−1] is the rainsplash coefficient, b [-] is the rainfall intensity exponent, [-] is the angle of the element from horizontal, [LT−1] is the rainfall intensity, [L2] is the three-dimensional area associated with the node, and [LT−1] is the sum of rainfall intensity and infiltration intensity; [-] is a damping function, related to surface water depth [L] and the surface water damping-effectiveness coefficient [L−1], to represent the reduction in splash erosion with increasing surface water depth. The hydraulic erosion rate in Equation (A7) is estimated as:
where [L3T−1] is the hydraulic erosion transfer coefficient for species i, [L3L−3] is the concentration at equilibrium transport capacity for species i, [LT−1] is the local shear velocity, [L] and [-] are the particle diameter and specific gravity, respectively; [L2] is the area associated with the node in Equation (A12), [LT−1] is the particle settling velocity, [-] is a coefficient related to turbulence in the surface water due to raindrop impact, [L−1] is an erodibility coefficient related to surface properties and texture, and [-] is the particle erodibility factor (ranging from zero to one).
References
- Conesa-García, C.; López-Bermúdez, F.; García-Lorenzo, R. Bed stability variations after check dam construction in torrential channels (South-East Spain). Earth Surf. Process. Landf. 2007, 32, 2165–2184. [Google Scholar] [CrossRef]
- Garcia, C.; Mario, M. Check Dams, Morphological Adjustments and Erosion Control in Torrential Streams; Nova Science Publishers: New York, NY, USA, 2010; pp. 8–15. [Google Scholar]
- Abbasi, N.A.; Xu, X.Z.; Lucas-Borja, M.E.; Dang, W.Q.; Liu, B. The use of check dams in watershed management projects: Examples from around the world. Sci. Total Environ. 2019, 676, 683–691. [Google Scholar] [CrossRef] [PubMed]
- Lucas-Borja, M.E.; Piton, G.; Nichols, M.; Castillo, C.; Yang, Y.; Zema, D.A. The use of check dams for soil restoration at watershed level: A century of history and perspectives. Sci. Total Environ. 2019, 692, 37–38. [Google Scholar] [CrossRef] [PubMed] [Green Version]
- Piton, G.; Recking, A. Design of Sediment Traps with Open Check Dams. I: Hydraulic and Deposition Processes. J. Hydraul. Eng. 2016, 142, 16. [Google Scholar] [CrossRef]
- Lucas-Borja, M.E.; Zema, D.A.; Hinojosa Guzman, M.D.; Yang, Y.; Hernández, A.C.; Xiangzhou, X.; Carrà, B.G.; Nichols, M.; Cerdá, A. Exploring the influence of vegetation cover, sediment storage capacity and channel dimensions on stone check dam conditions and effectiveness in a large regulated river in México. Ecol. Eng. 2018, 122, 39–47. [Google Scholar] [CrossRef] [Green Version]
- Díaz-Gutiérrez, V.; Mongil-Manso, J.; Navarro-Hevia, J.; Ramos-Díez, I. Check dams and sediment control: Final results of a case study in the upper Corneja River (Central Spain). J. Soils Sediments 2019, 19, 16. [Google Scholar] [CrossRef]
- Catella, M.; Paris, E.; Solari, L. Case study: Efficiency of slit-check dams in the mountain region of Versilia Basin. J. Hydraul. Eng. 2005, 131, 145–152. [Google Scholar] [CrossRef]
- Hassanli, A.M.; Nameghi, A.E.; Beecham, S. Evaluation of the effect of porous check dam location on fine sediment retention (a case study). Environ. Monit. Assess. 2009, 152, 319. [Google Scholar] [CrossRef]
- Xu, X.Z.; Zhang, H.W.; Zhang, O.Y. Development of check-dam systems in gullies on the Loess Plateau, China. Environ. Sci. Policy 2004, 7, 79–86. [Google Scholar]
- Chen, Y.; Wang, K.; Lin, Y.; Shi, W.; Song, Y.; He, X. Balancing green and grain trade. Nat. Geosci. 2015, 8, 739–741. [Google Scholar] [CrossRef]
- Xin, Z.B.; Yu, B.F.; Han, Y.G. Spatiotemporal Variations in Annual Sediment Yield from the Middle Yellow River, China, 1950–2010. J. Hydrol. Eng. 2015, 20, 15. [Google Scholar]
- Jin, Z.; Cui, B.L.; Song, Y.; Shi, W.Y.; Wang, K.B.; Wang, Y.; Liang, J. How Many Check Dams Do We Need To Build on the Loess Plateau? Environ. Sci. Technol. 2012, 46, 8527–8528. [Google Scholar] [CrossRef] [PubMed]
- Ran, D.; Luo, Q.; Zhou, Z.; Wang, G.; Zhang, X. Sediment retention by check dams in the Hekouzhen-Longmen Section of the Yellow River. Int. J. Sediment Res. 2008, 23, 159–166. [Google Scholar] [CrossRef]
- Rustomji, P.; Zhang, X.P.; Hairsine, P.B.; Zhang, L.; Zhao, J. River sediment load and concentration responses to changes in hydrology and catchment management in the Loess Plateau region of China. Water Resour. Res. 2008, 44, 17. [Google Scholar] [CrossRef]
- Shi, H.; Wang, G. Impacts of climate change and hydraulic structures on runoff and sediment discharge in the middle Yellow River. Hydrol. Process. 2015, 29, 3236–3246. [Google Scholar] [CrossRef] [Green Version]
- Xu, Y.; Fu, B.; He, C. Assessing the hydrological effect of the check dams in the Loess Plateau, China, by model simulations. Hydrol. Earth Syst. Sci. 2013, 17, 2185–2193. [Google Scholar] [CrossRef] [Green Version]
- Zhao, P.; Shao, M.; Wang, T. Spatial Distributions of Soil Surface-Layer Saturated Hydraulic Conductivity and Controlling Factors on Dam Farmlands. Water Resour. Manag. 2010, 24, 2247–2266. [Google Scholar] [CrossRef]
- Huang, J.; Hinokidani, O.; Yasuda, H.; Ojha, C.S.P.; Kajikawa, Y.; Li, S. Effects of the Check Dam System on Water Redistribution in the Chinese Loess Plateau. J. Hydrol. Eng. 2013, 18, 929–940. [Google Scholar] [CrossRef]
- Tang, H.; Ran, Q.; Gao, J. Physics-Based Simulation of Hydrologic Response and Sediment Transport in a Hilly-Gully Catchment with a Check Dam System on the Loess Plateau. Water 2019, 11, 1161. [Google Scholar] [CrossRef] [Green Version]
- Guyassa, E.; Frankl, A.; Zenebe, A.; Poesen, J.; Nyssen, J. Effects of check dams on runoff characteristics along gully reaches, the case of Northern Ethiopia. J. Hydrol. 2017, 545, 299–309. [Google Scholar] [CrossRef] [Green Version]
- Pal, D.; Galelli, S.; Tang, H.; Ran, Q. Toward improved design of check dam systems: A case study in the Loess Plateau, China. J. Hydrol. 2018, 559, 762–773. [Google Scholar] [CrossRef]
- Pal, D.; Galelli, S. A numerical framework for the multi-objective optimal design of check dam systems in erosion-prone areas. Environ. Model. Softw. 2019, 119, 21–31. [Google Scholar] [CrossRef]
- Yuan, S.; Li, Z.; Li, P.; Xu, G.; Gao, H.; Xiao, L.; Wang, F.; Wang, T. Influence of Check Dams on Flood and Erosion Dynamic Processes of a Small Watershed in the Loss Plateau. Water 2019, 11, 834. [Google Scholar] [CrossRef] [Green Version]
- Fang, H.; Li, Q.; Cai, Q.; Liao, Y. Spatial scale dependence of sediment dynamics in a gullied rolling loess region on the Loess Plateau in China. Environ. Earth Sci. 2011, 64, 13. [Google Scholar] [CrossRef]
- Ran, Q.; Hong, Y.; Chen, X.; Gao, J.; Ye, S. Impact of soil properties on water and sediment transport: A case study at a small catchment in the Loess Plateau. J. Hydrol. 2019, 574, 211–225. [Google Scholar] [CrossRef]
- Zhang, L.; Li, Z.; Wang, H.; Xiao, J. Influence of intra-event-based flood regime on sediment flow behavior from a typical agro-catchment of the Chinese Loess Plateau. J. Hydrol. 2016, 538, 71–81. [Google Scholar] [CrossRef]
- van Genuchten, M.T. A closed-form equation for predicting the hydraulic conductivity of unsaturated soils. Soil Sci. Soc. Am. J. 1980, 44, 892–898. [Google Scholar] [CrossRef] [Green Version]
- YRCC. Dataset of Hydrological Experiments at Zizhou Station in the Yellow River Basin (1959–1969); Data Sharing Infrastructure of Earth System Science_Data Sharing Infrastructure of Loess Plateau; YRCC. 2012. Available online: http://www.geodata.cn/data/datadetails.html?dataguid=190520812859307&docId=9284 (accessed on 7 May 2020).
- Yang, Q. Land Use Map (30 m Resolution) of the Area with Abundant and Coarse Sediment of the Loess Plateau; Data Sharing Infrastructure of Earth System Science_Data Sharing Infrastructure of Loess Plateau. 2011. Available online: http://www.geodata.cn/data/datadetails.html?dataguid=69574164479925&docId=9166 (accessed on 7 May 2020).
- Freeze, R.A.; Harlan, R.L. Blueprint for a physically-based, digitally-simulated hydrologic response model. J. Hydrol. 1969, 9, 237–258. [Google Scholar] [CrossRef]
- VanderKwaak, J.E. Numerical Simulation of Flow and Chemical Transport in Integrated Surface-Subsurface Hydrologic Systems. Ph.D. Thesis, University of Waterloo, Waterloo, ON, Canada, 1999. [Google Scholar]
- Heppner, C.S.; Ran, Q.H.; VanderKwaak, J.E.; Loague, K. Adding sediment transport to the integrated hydrology model (InHM): Development and testing. Adv. Water Resour. 2006, 29, 930–943. [Google Scholar] [CrossRef]
- Ran, Q.; Heppner, C.S.; VanderKwaak, J.E.; Loague, K. Further testing of the integrated hydrotogy modet (InHM): Multipte-species sediment transport. Hydrol. Process. 2007, 21, 1522–1531. [Google Scholar] [CrossRef]
- Ebel, B.A.; Mirus, B.B.; Heppner, C.S.; VanderKwaak, J.E.; Loague, K. First-order exchange coefficient coupling for simulating surface water–groundwater interactions: Parameter sensitivity and consistency with a physics-based approach. Hydrol. Process. 2009, 23, 1949–1959. [Google Scholar] [CrossRef]
- VanderKwaak, J.E.; Loague, K. Hydrologic-response simulations for the R-5 catchment with a comprehensive physics-based model. Water Resour. Res. 2001, 37, 999–1013. [Google Scholar] [CrossRef]
- Mirus, B.B.; Loague, K. How runoff begins (and ends): Characterizing hydrologic response at the catchment scale. Water Resour. Res. 2013, 49, 2987–3006. [Google Scholar] [CrossRef]
- Fatichi, S.; Vivoni, E.R.; Ogden, F.L.; Ivanov, V.Y.; Mirus, B.; Gochis, D.; Downer, C.W.; Camporese, M.; Davison, J.H.; Ebel, B.; et al. An overview of current applications, challenges, and future trends in distributed process-based models in hydrology. J. Hydrol. 2016, 537, 45–60. [Google Scholar] [CrossRef] [Green Version]
- Li, P.; Mu, X.; Holden, J.; Wu, Y.; Irvine, B.; Wang, F.; Gao, P.; Zhao, G.; Sun, W. Comparison of soil erosion models used to study the Chinese Loess Plateau. Earth-Sci. Rev. 2017, 170, 17–30. [Google Scholar] [CrossRef] [Green Version]
- Ran, Q.; Tong, J.; Shao, S.; Fu, X.; Xu, Y. Incompressible SPH scour model for movable bed dam break flows. Adv. Water Resour. 2015, 82, 39–50. [Google Scholar] [CrossRef] [Green Version]
- Zheng, X.; Shao, S.; Khayyer, A.; Duan, W.; Ma, Q.; Liao, K. Corrected First-Order Derivative ISPH in Water Wave Simulations. Coast. Eng. J. 2017, 59, 1750010. [Google Scholar] [CrossRef]
- Ni, G.; Liu, Z.; Lei, Z.; Yang, D.; Wang, L. Continuous simulation of water and soil erosion in a small watershed of the Loess Plateau with a distributed model. J. Hydrol. Eng. 2008, 13, 392–399. [Google Scholar] [CrossRef]
- Heppner, C.S.; Loague, K. A dam problem: Simulated upstream impacts for a Searsville-like watershed. Ecohydrology 2008, 1, 408–424. [Google Scholar] [CrossRef]
- Mirus, B.B.; Ebel, B.A.; Loague, K.; Wemple, B.C. Simulated effect of a forest road on near-surface hydrologic response: Redux. Earth Surf. Process. Landf. 2007, 32, 126–142. [Google Scholar] [CrossRef]
- Wang, Y.; Fu, B.; Chen, L.; Lu, Y.; Gao, Y. Check Dam in the Loess Plateau of China: Engineering for Environmental Services and Food Security. Environ. Sci. Technol. 2011, 45, 10298–10299. [Google Scholar] [CrossRef] [PubMed]
- Porto, P.; Gessler, J. Ultimate bed slope in calabrian streams upstream of check dams: Field study. J. Hydraul. Eng. 1999, 125, 1231–1242. [Google Scholar] [CrossRef]
- Heppner, C.S.; Loague, K.; VanderKwaak, J.E. Long-term InHM simulations of hydrologic response and sediment transport for the R-5 catchment. Earth Surf. Process. Landf. 2007, 32, 1273–1292. [Google Scholar] [CrossRef]
- Ran, Q.; Loague, K.; VanderKwaak, J.E. Hydrologic-response-driven sediment transport at a regional scale, process-based simulation. Hydrol. Process. 2012, 26, 159–167. [Google Scholar] [CrossRef]
- Gabet, E.J.; Dunne, T. Sediment detachment by rain power. Water Resour. Res. 2003, 39, 1002. [Google Scholar] [CrossRef]
- Nash, J.E.; Sutcliffe, J.V. River flow forecasting through conceptual models part I—A discussion of principles. J. Hydrol. 1970, 10, 282–290. [Google Scholar] [CrossRef]
- Wu, B.; Wang, Z.L.; Zhang, Q.W.; Shen, N.; Liu, J. Modelling sheet erosion on steep slopes in the loess region of China. J. Hydrol. 2017, 553, 549–558. [Google Scholar] [CrossRef]
- Xia, L.; Song, X.; Fu, N.; Cui, S.; Li, L.; Li, H.; Li, Y. Effects of rock fragment cover on hydrological processes under rainfall simulation in a semi-arid region of China. Hydrol. Process. 2018, 32, 792–804. [Google Scholar] [CrossRef]
- Wang, L.; Yao, W.; Tang, J.; Wang, W.; Hou, X. Identifying the driving factors of sediment delivery ratio on individual flood events in a long-term monitoring headwater basin. J. Mt. Sci. 2018, 15, 1825–1835. [Google Scholar] [CrossRef]
- Hu, C.; Zhang, X. Loess Plateau soil erosion governance and runoff-sediment variation of Yellow River. Water Resour. Hydropower Eng. 2020, 51, 1–11. (In Chinese) [Google Scholar]
- Kang, R.S.; Chacko, E.; Kaur, D.; Viadero, R. Silting patterns in the reservoirs of small-and medium-sized earthen check dams in humid subtropical monsoon regions. Earth Surf. Process. Landf. 2019, 44, 2638–2648. [Google Scholar] [CrossRef]
- Li, X.; Wei, X.; Wei, N. Correlating check dam sedimentation and rainstorm characteristics on the Loess Plateau, China. Geomorphology 2016, 265, 84–97. [Google Scholar] [CrossRef]
- Fang, H.Y.; Cai, Q.G.; Chen, H.; Li, Q.Y. Temporal changes in suspended sediment transport in a gullied loess basin: The lower Chabagou Creek on the Loess Plateau in China. Earth Surf. Process. Landf. 2008, 33, 1977–1992. [Google Scholar] [CrossRef]
- Yu, G.Q.; Zhang, M.S.; Li, Z.B.; Li, P.; Zhang, X.; Cheng, S.D. Piecewise prediction model for watershed-scale erosion and sediment yield of individual rainfall events on the Loess Plateau, China. Hydrol. Process. 2014, 28, 5322–5336. [Google Scholar]
- Fu, S.; Yang, Y.; Liu, B.; Liu, H.; Liu, J.; Liu, L.; Li, P. Peak flow rate response to vegetation and terraces under extreme rainstorms. Agric. Ecosyst. Environ. 2020, 288, 106714. [Google Scholar] [CrossRef]
- Armanini, A.; Larcher, M. Rational criterion for designing opening of slit-check dam. J. Hydraul. Eng. 2001, 127, 94–104. [Google Scholar] [CrossRef]
- Tang, H. Analysis of Runoff/Sediment Reduction Efficiency of Check-Dam in Its Lifespan. Ph.D. Thesis, Zhejiang University, Hangzhou, China, 2019. [Google Scholar]
Figure 1.
Information of the Shejiagou catchment: (a) location and Digital Elevation Model (DEM); (b) slope distribution; (c) land use types; (d) stream network classification and check dam distribution.
Figure 1.
Information of the Shejiagou catchment: (a) location and Digital Elevation Model (DEM); (b) slope distribution; (c) land use types; (d) stream network classification and check dam distribution.

Figure 2.
Check dam systems under different deployment strategies. Note that scenario-7 is the current deployment strategy of Shejiagou catchment.
Figure 2.
Check dam systems under different deployment strategies. Note that scenario-7 is the current deployment strategy of Shejiagou catchment.

Figure 3.
3D mesh used in scenario-1: (a) the whole catchment and boundary conditions; (b) the outlet area and the outflow boundary; (c) the surface mesh representing the filled check dam (S1-1) and its sedimentary land. Note that the elevation of sedimentary land was the same as that of the spillway on the right side of the check dam, indicating the check dam was filled.

Figure 4.
Hydrographs and sedigraphs of the model calibration ((a) and (b), event of 14 July 1964) and validation ((c) and (d), event of 2 August 1964). Note that the blue bars represent the rainfall intensity.
Figure 4.
Hydrographs and sedigraphs of the model calibration ((a) and (b), event of 14 July 1964) and validation ((c) and (d), event of 2 August 1964). Note that the blue bars represent the rainfall intensity.

Figure 5.
Hydrographs at the catchment outlet under different scenarios (Q: discharge).

Figure 6.
Sedigraphs at the catchment outlet under different scenarios (Qs: sediment discharge).

Figure 7.
The final distributions of erosion and deposition areas in scenario-0 (a); scenario-1 (b); scenario-2 (c); scenario-3 (d); scenario-4 (e); scenario-5 (f); scenario-6 (g); and scenario-7 (h). Note that the inset pictures in each figure show the deposition depths on the sedimentary lands, and the areas with deposition depth below zero (i.e., erosion) were blanked for the consideration of readability.

Figure 8.
Relationship of the total area of sedimentary lands and reduction rate of flood processes and sediment transport processes.
Figure 8.
Relationship of the total area of sedimentary lands and reduction rate of flood processes and sediment transport processes.

Figure 9.
Fill rate of check dams in the Chabagou watershed. Note that when the check dam is filled, its fill rate equals to 1.
Figure 9.
Fill rate of check dams in the Chabagou watershed. Note that when the check dam is filled, its fill rate equals to 1.


Table 1.
Data set used in this study.
| Data Type | Year | Resoloution | Data Source | Used in This Study |
|---|---|---|---|---|
| Topography data | 1975 | 20 m | The State Bureau of Surveying and Mapping | Finite-element mesh generation |
| Soil data | 1960–1962 | Plot scale | Data Sharing Infrastructure of Loess Plateau [29] | Model parameterization |
| Flood events | 1959–1969 | 5 min to 1 h | Data Sharing Infrastructure of Loess Plateau [29] | Model calibration |
| Precipitation | 1959–1969 | 5 min to 1 h | Data Sharing Infrastructure of Loess Plateau [29] | Model calibration |
| Land use types | 1975, 1986, 2006 | 30 m | Data Sharing Infrastructure of Loess Plateau [30] | Model parameterization |
| Check dam information | 1978, 1993, 2001 | Check dam survey of Chabagou watershed | Model parameterization |
Table 2.
Description of the eight scenarios in the study.
| Scenario Number | Number of Filled Check Dams | Size Combination | Total Area of Sedimentary Lands (×104 m2) | Main Feature of the Scenario |
|---|---|---|---|---|
| 0 | 0 | (0,0) | 0 | No check dam in the catchment |
| 1 | 1 | (1,0) | 4.69 | One large check dam downstream |
| 2 | 2 | (2,0) | 11.21 | Two large check dams connected |
| 3 | 2 | (1,1) | 5.93 | Two check dams with different sizes |
| 4 | 3 | (2,1) | 12.45 | Three check dams with different sizes |
| 5 | 4 | (1,3) | 9.00 | One large check dam on main the channel and targeted treatment to erosion-prone gully |
| 6 | 4 | (2,2) | 14.18 | Two large check dams on main the channel and targeted treatment to erosion-prone gullies |
| 7 | 4 | (2,2) | 8.92 | Current deployment strategy |
Table 3.
Soil parameters used in InHM for the eight scenarios.
| Soil Types | Ksat a (m s−1) | Porosity (-) | α b (m−1) | n c (-) | Sr d (-) |
|---|---|---|---|---|---|
| SJG-soil (0–0.5 m) | 2.90 × 10⁻⁶ | 0.42 | 1.38 | 1.74 | 0.08 |
| SJG-soil (below 0.5 m) | 2.70 × 10⁻⁶ | 0.40 | 1.35 | 1.83 | 0.11 |
| Check dam | 4.00 × 10⁻¹⁰ | 0.35 | 1.52 | 1.29 | 0.04 |
| Sedimentary land | 4.00 × 10⁻⁶ | 0.45 | 0.37 | 1.19 | 0.13 |
| Bedrock | 1.00 × 10⁻⁹ | 0.20 | 4.30 | 1.25 | 0.08 |
| Parameter source | Calibration | The Zizhou Experimental Station | |||
a Saturated hydraulic conductivity.; b Parameter related to the inverse of the air-entry pressure.; c Parameter related to the pore-size distribution.; d Residual soil-water content [28].
Table 4.
Surface parameters used in InHM for the four scenarios.
| Surface Zone a | Hydrologic Response | Sediment Transport | |||||||
|---|---|---|---|---|---|---|---|---|---|
| n a (s m−1/3) | ψimb (m) | Ssr c (-) | Ht d (m) | cd e (m−1) | b f (-) | ξ g (-) | cf h (s m−1)0.6 | φ i (m−1) | |
| Hillslope | 0.010 | 0.0015 | 0.01 | 0.0015 | 600 | 1.6 | 0.25 | 50.00 | 0.005 |
| Gully and Channel | 0.008 | 50.00 | 0.005 | ||||||
| Sedimentary Land | 0.008 | 0.05 | 0.001 | ||||||
| Check Dam | 0.004 | 5.00 | 0.001 | ||||||
| Parameter Source | Calibration | Literature | Calibration | ||||||
a Manning’s roughness coefficient. b Immobile water depth, identical for all surface zones. c Surface residual saturation, identical for all surface zones. d Average height of non-discretized micro-topography, identical for all surface zones. e Rainsplash depth dampening factor, identical for all surface zones. f Rain intensity exponent, identical for all surface zones. g Rain-induced turbulence coefficient, identical for all surface zones. h Rainsplash coefficient. i Surface erodibility coefficient.
Table 5.
Flood characteristics under different scenarios.
| Scenario | Qp (m3 s−1) | Reduction of Qp (%) | Tp (s) | Qv (m3) | Reduction of Qv (%) | Runoff Coefficient (%) |
|---|---|---|---|---|---|---|
| Scenario-0 | 34.85 | - | 7300 | 58,984.10 | - | 15.38 |
| Scenario-1 | 24.21 | 30.53 | 7512 | 56,768.51 | 3.76 | 14.81 |
| Scenario-2 | 8.06 | 76.87 | 11,300 | 52,481.28 | 11.02 | 13.69 |
| Scenario-3 | 18.04 | 48.24 | 7548 | 55,854.77 | 5.31 | 14.57 |
| Scenario-4 | 4.04 | 88.41 | 13,300 | 50,505.12 | 14.38 | 13.17 |
| Scenario-5 | 10.76 | 69.12 | 7520 | 53,163.99 | 9.87 | 13.87 |
| Scenario-6 | 2.32 | 93.34 | 15,800 | 38,871.10 | 34.10 | 10.14 |
| Scenario-7 | 9.95 | 71.45 | 8950 | 47,187.28 | 20.00 | 12.31 |
Table 6.
Sediment transport characteristics under different scenarios.
| Scenario | Qs,p (kg s−1) | Reduction of Qs,p (%) | SY (×104 t) | Reduction of SY (%) | ES (×104 t) | Reduction of ES (%) | SDR (%) |
|---|---|---|---|---|---|---|---|
| Scenario-0 | 21,932.03 | - | 3.82 | - | 4.08 | - | 93.56 |
| Scenario-1 | 16,508.84 | 24.73 | 3.66 | 4.14 | 3.99 | 2.18 | 91.78 |
| Scenario-2 | 4232.80 | 80.70 | 3.53 | 7.55 | 3.71 | 8.98 | 95.12 |
| Scenario-3 | 11,432.89 | 47.87 | 3.55 | 6.96 | 3.97 | 2.60 | 89.45 |
| Scenario-4 | 2103.80 | 90.41 | 2.47 | 35.23 | 3.56 | 12.78 | 69.54 |
| Scenario-5 | 7144.15 | 67.43 | 3.21 | 16.03 | 3.90 | 4.48 | 82.32 |
| Scenario-6 | 1184.30 | 94.60 | 1.83 | 52.09 | 3.43 | 15.98 | 53.41 |
| Scenario-7 | 8986.66 | 59.02 | 3.44 | 9.90 | 3.61 | 11.38 | 95.21 |
Table 7.
Performance ranking in flood and sediment control among different scenarios.
| Scenario Number a | Performance Ranking | ||||||
|---|---|---|---|---|---|---|---|
| (1) b | (2) | (3) | (4) | (5) | (6) | (7) b | |
| Reduction of Qp | 6 | 4 | 2 | 7 | 5 | 3 | 1 |
| Reduction of Qv | 6 | 7 | 4 | 2 | 5 | 3 | 1 |
| Reduction of Qs,p | 6 | 4 | 2 | 5 | 7 | 3 | 1 |
| Reduction of SY | 6 | 4 | 5 | 7 | 2 | 3 | 1 |
| Reduction of ES | 6 | 4 | 7 | 2 | 5 | 3 | 1 |
a Scenarios with different check dam systems (i.e., scenarios 1–7) were compared; b (1) represents the best reduction performance among all scenarios, (7) represents the worst reduction performance among all scenarios. For example, the best performance in the reduction of Qp was scenario-6.
© 2020 by the authors. Licensee MDPI, Basel, Switzerland. This article is an open access article distributed under the terms and conditions of the Creative Commons Attribution (CC BY) license (http://creativecommons.org/licenses/by/4.0/).
Share and Cite
MDPI and ACS Style
Tang, H.; Pan, H.; Ran, Q. Impacts of Filled Check Dams with Different Deployment Strategies on the Flood and Sediment Transport Processes in a Loess Plateau Catchment. Water 2020, 12, 1319. https://doi.org/10.3390/w12051319
AMA Style
Tang H, Pan H, Ran Q. Impacts of Filled Check Dams with Different Deployment Strategies on the Flood and Sediment Transport Processes in a Loess Plateau Catchment. Water. 2020; 12(5):1319. https://doi.org/10.3390/w12051319
Chicago/Turabian StyleTang, Honglei, Hailong Pan, and Qihua Ran. 2020. "Impacts of Filled Check Dams with Different Deployment Strategies on the Flood and Sediment Transport Processes in a Loess Plateau Catchment" Water 12, no. 5: 1319. https://doi.org/10.3390/w12051319
Note that from the first issue of 2016, this journal uses article numbers instead of page numbers. See further details here.