How to Account for the Human Motion to Improve Flood Risk Assessment in Urban Areas


Department of Construction, Civil Engineering and Architecture, Università Politecnica delle Marche, via Brecce Bianche, 60131 Ancona, Italy
*
Author to whom correspondence should be addressed.
Water 2020, 12(5), 1316; https://doi.org/10.3390/w12051316
Submission received: 23 March 2020
/
Revised: 26 April 2020
/
Accepted: 1 May 2020
/
Published: 7 May 2020
(This article belongs to the Special Issue Recent Advances in the Assessment of Flood Risk in Urban Areas)
Abstract
:Floods are critical disasters affecting urban areas and their users. Interactions with floodwater spreading and built environment features influence the users’ reaction to the emergency, especially during immediate disaster phases (i.e., evacuation). Recent studies tried to define simulation models to evaluate such exposure-related criticalities, assess individuals’ flood risk, and propose risk-mitigation strategies aimed at supporting the community’s proper response. Although they generally include safety issues (e.g., human body stability), such tools usually adopt a simplified approach to individuals’ motion representation in floodwaters, i.e., using input from non-specialized databases and models. This study provides general modelling approaches to estimate evacuation speed variations depending on individual’s excitement (walking, running), floodwaters depths and individuals’ features (age, gender, height, average speed on dry surfaces). The proposed models prefer a normalized evacuation speeds approach in respect of minimum motion constraint conditions to extend their applicability depending on the individuals’ characteristics. Speed data from previous experiments are organized using linear regression models. Results confirm how individuals’ speed reduces when depth and age increase. The most significant models are discussed to be implemented in evacuation simulation models to describe the evacuees’ motion in floodwaters with different confidence degree levels and then assess the community’s flood risk and risk-reduction strategies effectiveness.
1. Introduction
Floods have been provoked over 93,000 victims worldwide in the years 2000–2018, being the second most disruptive natural disaster (after earthquakes) affecting our communities’ safety (Source: EMDAT (2019): OFDA/CRED International Disaster Database, Université catholique de Louvain, Brussels, Belgium, https://www.emdat.be/, last access: 16 December 2019). Only in Italy, in the years 2014–2018, there were over 70 dead or missing persons, over 30 wounded, and over 21,000 individuals who had to evacuate and were homeless because of such kind of events (Source: http://polaris.irpi.cnr.it/report/last-report/, last access: 16 December 2019). In this general context, urban areas are the riskiest scenarios because of the combination between the built environment (in the following, BE) features (defined as a network of buildings, infrastructures and open spaces) and the high density of hosted exposed inhabitants [1,2,3]. Previous works demonstrated the significant importance of the interactions between the individuals and the flood-affected BE during the immediate response phases, and in particular during the emergency evacuation process [4,5,6]. In such conditions, the hosted population can attempt to move (drive or walk) in floodwaters-affected scenarios towards “safer” areas, with the aim to reduce threats [7,8,9,10,11,12]. Most of the flood-related fatalities occur in outdoor spaces during such activities and so it is essential to understand the underlying phenomena [13].
- Pre-emergency evacuation strategies cannot be implemented because of lack of early warnings or Civil Body Protection/First Responders management activities, thus making ineffective coordinated motor vehicles and public transport-based solutions (including, e.g., scenarios in underdeveloped countries);
- Flash flood conditions can exist;
- Flood-affected areas are pedestrian areas and/or the majority of the exposed population is placed outdoors, e.g., along the streets and the public squares;
- The motor vehicle evacuation cannot be performed because of specific conditions, e.g., (a) the urban space configuration (e.g., see compact urban fabric in historical scenarios); (b) critical effects in vehicle use along the evacuation roads, essentially due to vehicle-density related issues, such as traffic jams; (c) prevalence of pedestrian evacuees in respect to motorized ones (e.g., because of socio-economic factors, as for example, in underdeveloped countries);
- Distances to the evacuation areas (or the flood-affected area dimensions) are quite limited, such as in case of shelters in urban areas or “invacuation” strategies (According to PD 25111:2010, this evacuation solution concerns “the movement of people to pre-identified areas inside the building/site in order to protect them from external dangers during an incident”. In flood evacuation, building occupants can remain inside and move towards the higher stories, while individuals placed in the building surrounding try to reach the nearest one and then move upstairs), and they should be reached on foot;
- Disruption of the mobility system can appear as leading people to move on foot;
- The real emergency scenario is quite different from what is expected, thus affecting one of the previous elements;
- Some First Responders activities can imply the movement on foot to support the population in the emergency scenarios.
The following cases can be combined and represent only an exemplification of the main conditions based on the literature review.
In this way, a brief overview on the current topics concerning a better risk assessment, counting for people moving in floodwaters and a proper effectiveness analysis of risk mitigation strategies, is reported in the next sub-sections, to have a general reference framework:
- Which are the risk-affecting factors in BE, by underlining the population-related contribute (Section 1.1);
- Which tools can be used to merge such two aspects to evaluate the effectiveness of the evacuation (Section 1.2);
- Which models can be used to evaluate man-floodwaters interactions in pedestrian evacuation (Section 1.3).
In particular, this study deals with this last issue, to improve the development of pedestrians’ evacuation simulators in the context of flood disasters.
1.1. BE Risk-Affecting Factors and the Population-Related Contribute
Risk-increasing factors concerning the urban areas can be distinguished between those related to the BE itself (by including physical and management-related issues) and those related to the hosted population.
- Location of settlement on floodplains;
- Land use-related issues, by including a lower capacity of absorbing rain by urban surfaces (e.g., low porosity of urban surfaces, especially in high-built up areas) in respect to the ones in rural areas;
- Compact urban areas layout which can increase open-channel related effects in floodwater spreading;
- Insufficient sewer systems, because, e.g., of poor maintenance plans and actions as well as of the variations in functioning conditions (e.g., severity of floods different from the one used in their design) also due to climate-change effects;
- Vulnerability of buildings, suffering damage because of a low resistance level in respect to floodwater strains (e.g., elevations, foundations);
- Low level of control of possible hazard conditions, also in relation to poor flood sensor systems; inadequate management of immediate pre-disaster and disaster conditions, with the possible lack of early warning systems, which can provoke a delay in emergency action starting.
From the inhabitants’ perspective, the general high population density in urban BE (in terms of inhabitants’ number and localization on the urban layout) is matched with additional exposure-related factors such as social-economic factors, individuals’ risk perception and awareness/preparedness and behavioral issues, which can lead people to additional dangers in emergency scenarios [5,10,19,28,29,30].
In such a framework, the two main elements characterizing the floodwaters and their direct effects on evacuees are their depth D (m) and speed Vf (m/s) [7,8,9,10,11]. In critical D-Vf conditions, fatalities can be mainly due to: (a) interaction with debris dragged by floodwaters, with the possibility of minor injuries; (b) stability loss (e.g., for pedestrians, they can be due to possible buoyancy or body failure/dragging phenomena), with the consequent possibility of drowning and death. Similar problems can be related to both people moving on foot or by (motor) vehicles [7,8].
Besides, some human behavior in floods could increase risks during the evacuation process [4,6,10,13,17,29,31,32,33]:
- Emergency planning elements: poor awareness/preparedness levels of the population can bring people to adopt risky behaviors, underestimate the impact of disasters conditions, and delay the starting of safety procedures. Meanwhile, a similar result can be provoked by ineffective early warning systems. Emergency plans can be not well known by the population, hence making impossible to properly identify “safe” areas and gathering points, as well as evacuation paths;
- Surrounding BE elements: people generally try to move towards the nearest areas with lower floodwaters depth and speed (e.g., ground elevations), by looking for direct support of unmovable obstacles to move in floodwaters (e.g., fences, street furniture). Meanwhile, they try to modify their motion direction to avoid all the obstacles dragged by the flood (e.g., cars, debris);
- Other individuals and belongings: social share identity (including phenomena connected to information exchange) and attachment-to-things effects are time-wasting behaviors that can delay or slow down the evacuation process. Such elements can also bring people to move towards “unsafe” areas (e.g., to rescue other individuals, to retrieve some personal belongings, or to guard the properties). People can also prefer to move in a group by sharing evacuation direction and motion speed;
- Floodwaters: “curiosity” effects lead individuals to delay the evacuation starting to observe floodwaters conditions or event recording with smartphones or cameras. Meanwhile, when floodwaters depth and speed increase, the possibility to freely move is reduced and the evacuees’ motion process is slowed down, hence increasing the overall evacuation time.
All these behaviors could lead people to interact with critical floodwater levels, by leading people to be exposed to more critical floodwater conditions because of, e.g., not being able to choose the proper evacuation direction or spend time in dangerous areas.
1.2. Simulation Tools to Risk-Assessment and Risk-Mitigation Strategies Evaluation
Simulation models are effective evaluation tools for safety planners and designers for coordinating preparedness-oriented and response-oriented efforts of local Authorities and First Responders. Anyway, they should be developed by pursuing a behavioral point of view, to include the man-floodwater and the man-BE interactions as focus assessment elements [1,5,13,21,34].
As for other kinds of disasters [35,36,37], evacuation simulators could support this process by jointly representing behavioral issues, floodwater spreading and BE modifications over time and space. Most of the current simulators generally deal with a territorial/full urban scale, by mainly using motor vehicles or public transportation as evacuation means [5,15,26,38,39,40]. Such kind of model could introduce simplifications in the evacuation rules by adopting “macroscopic” models (e.g., density-related models for motion estimation). This choice is reasonable if considering the widescale application but can limit the simulator effectiveness while it locally evaluates threats for the population, especially in case of local interactions with the floodwaters (i.e., for pedestrian evacuation). Meanwhile, the number of simulators dealing with pedestrian evacuation seems to be still limited [13,21,34]. In view of the above, “microscopic” approaches should be preferred [10,34,41]. These approaches assign motion rules to each of the simulated individuals to derive the overall evacuation phenomena and then estimate the safety level for the population [21]. Hence, they allow evaluating risks at the typical scale (dimension and configuration) of each element composing the BE (i.e., streets and other open spaces, buildings) [13].
1.3. Modelling Pedestrians’ Evacuation in Floodwater: Current Approaches and Limitations
The “microscopic” approach defines the overall motion phenomena by overlapping the effects of different behavioral rules assigned to each simulated evacuee [10,41]. To this aim, it is important to analyze the behavioral rules of an “isolated” pedestrian, that is, an individual moving into the floodwater by himself/herself (free-flowing movement conditions). Additional interaction behaviors could be then overlapped to this, to define the overall motion rules. Furthermore, individuals’ variations in behavior could be randomly assigned, by allowing to describe different evacuees’ attitude in the evacuation process. In this view, besides the definition of qualitative behavioral rules in flood evacuation [6,10,17], the determination of motion quantities plays a pivotal role for the following reasons.
Previous studies demonstrate how differences between general-purpose and flood-related motion quantities exist, especially about the evacuation speed, which is affected by the levels of the floodwaters [10,33,42,43]. Efforts to assess the individual’s evacuation speed vi (m/s) have been recently performed through real-world event analysis [10] or laboratory experiments in open channels [33,44] or pools [42]. Nevertheless, only a limited number of works succeeds in overlaying the main constraints due to [33,36,42]: (a) the limited number of individuals, also in relation to the different age classes; (b) the effects of individuals’ excitement conditions (i.e., walking versus running).
This is the object of the present paper: D is here considered as the main floodwater evacuation affecting parameter in both walking and running conditions, as well as, its correlations with individuals’ gender and age.
2. Phases, Materials, and Methods
This work is organized into three main phases:
- General characterization of the selected database, according to Section 2.2 methods. The motion speeds in walking and running conditions are compared depending on D and on the individuals’ gender. In this way, it can be possible to respectively trace general relationships depending on floodwater-characterization constraints to motion and to individuals’ main features;
- Modelling of the speed variation (normalized speed and dimensional speed variations) depending on D and in respect of the dry surface motion, according to Section 2.3 methods. In particular, dry surface motion speeds are retrieved according to average literature values depending on the age [43]. The individuals’ height (i.e., the knee height from the ground) is considered in the model because of the related influence assessed by preliminary works on motion and human body stability conditions in floodwaters [9,44];
- Modelling of the normalized speed variation depending on D in respect to the minimum constraint and maximum excitement conditions for the considered database, according to methods in Section 2.4. Such model delves into specific experimental conditions and sample features, to generalize speed estimation data regardless of dry surface motion conditions data.
2.1. Materials: Original Input Database Characterization
The database by Bernardini et al. [44] is used as the input reference for the model definition (Raw data are available as supplementary files). More than 200 individuals were involved in laboratory experiments by moving in walking and running excitement conditions along a 24-m-long path into an open channel (rectangular section of 1 × 1 m; concrete horizontal bottom surface; individuals wearing fishermen’s suits). A total of 555 samples compose the overall database.
The volunteers’ sample was defined according to the Italian National age statistics and included individuals from 8 to 83 years old (males: 56%, females: 44%). Tested floodwaters D were equal to 0.2, 0.3, 0.4, 0.5, 0.6 and 0.7 m, by considering still water (Vf = 0 m/s) to better focus on the effects of depth on vi. For each individual involved in the test, the original database includes: (a) the motion speeds vi (m/s) referred to the specific tested floodwaters and excitement conditions; (b) the individuals’ features (i.e., sex, gender, height, mass, body mass index); (c) the number of performed tests. Each individual performed the test once in walking and running conditions, for a given D, and 31 individuals performed the test for all the D values.
2.2. General Methods for Model Definition and Characterization of the Selected Database
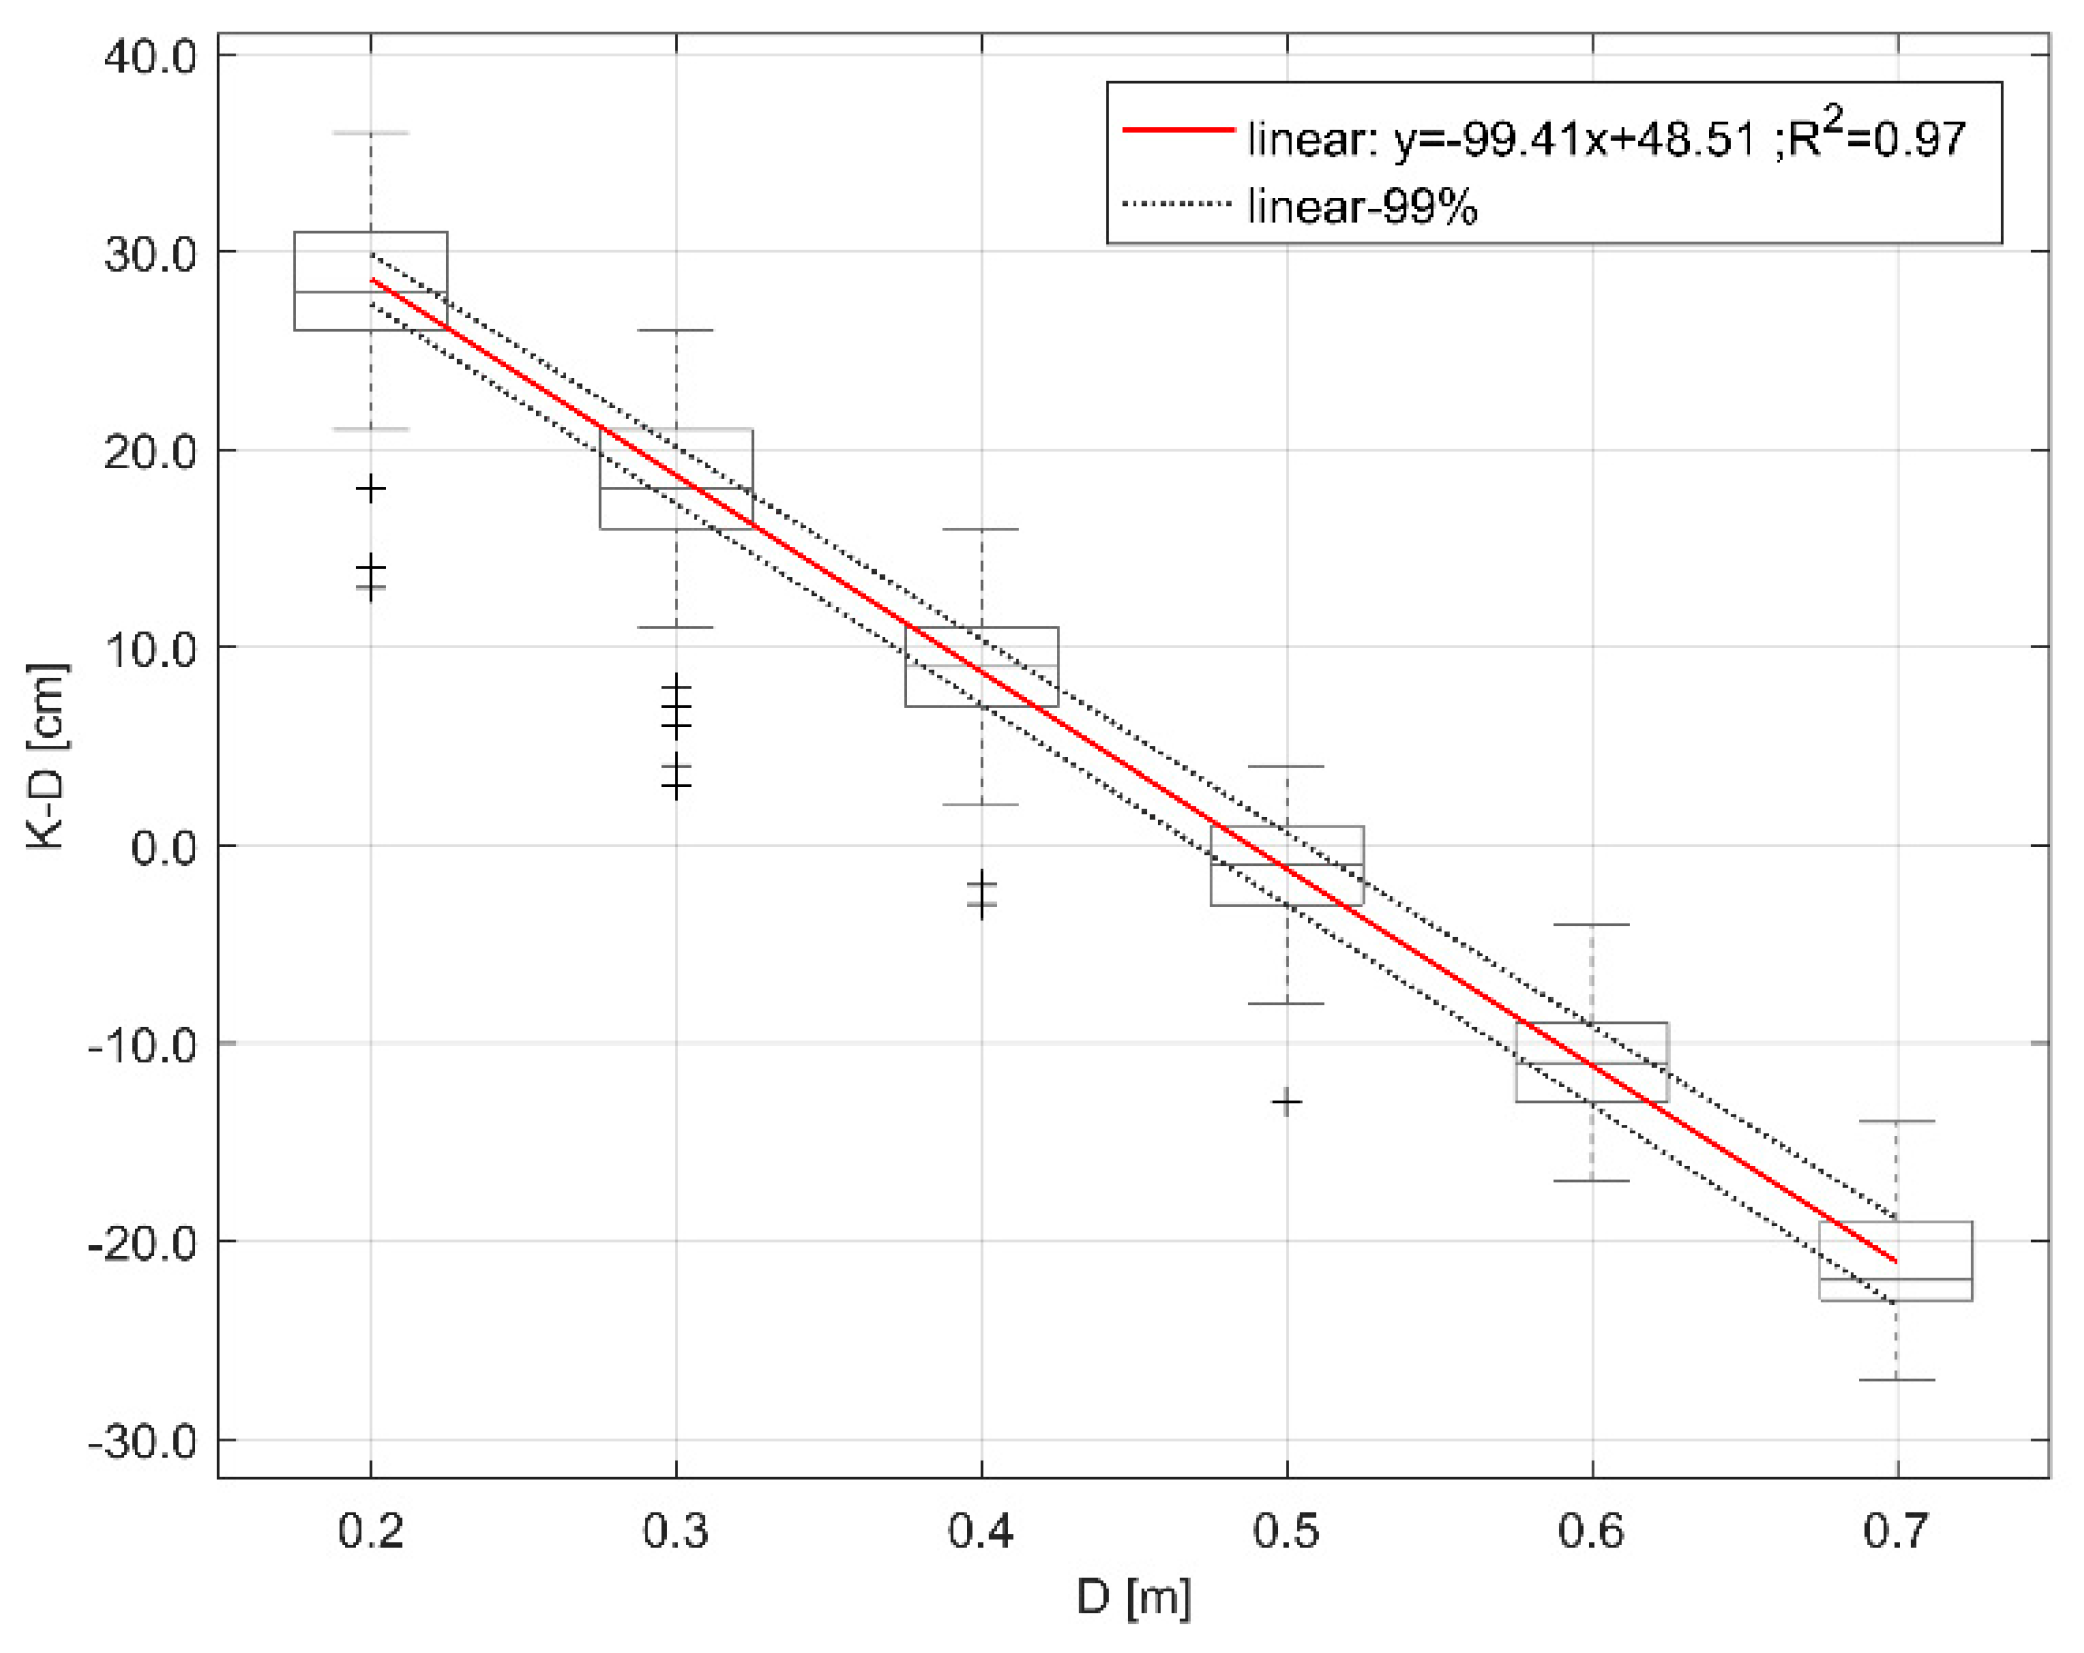
A preliminary analysis to assess the relative position of the knee height in respect of the floodwater depth has been performed, to evidence if the original database could be affected by the individuals’ height H (m). In fact, previous works on human body kinematics suggest that differences in individuals’ motion could exist for intermediate D values (e.g., 0.4 to 0.6 cm) in case the knee is outside or inside the water level. In particular, a physiological constraint (i.e., “the difficulty to articulate the motion of the legs”) can be induced while moving the knee and the part of the above leg inside the floodwaters [44]. In general terms, the knee height K (m) can be calculated as 0.285 × H [44,45]. The distribution of K-D ((cm) or (m)) in respect to D tested values is assessed and shown by a boxplot comparison, while linear regression is provided to evidence the general trend of the sample.
Then, the database has been mainly characterized by the comparison between walking and running conditions through vw,exp-vr,exp (m/s) pairs analysis depending on:
- Gender, to evaluate difference among the two excitement conditions and compare them with previous works outcomes (i.e., males generally moves faster than females) [43].
Linear regression models are tested by reporting the R2 values to focus on the direct correlation between the two assessed variables. Then, simple models to be integrated into simulators can be traced. According to previous works on the original database [44], all the models have been evaluated through the Bisquare regression method, which allows finding the regression that fits the bulk of the data and minimizes the effect of outliers.
For each of this analysis, the vw,ex = vr,exp line (no differences between walking and running conditions) is shown to confirm if the above regressions are over this ratio.
2.3. Methods for Speed Variation Modelling Depending on D and Dry Surface Motion Conditions
The analysis methods described in this section are applied to the whole original sample, regardless of the number of tests performed by the volunteers. The database significant dimension is similar to those of previous experimental activities chosen as reference works [43,46].
Previous studies tried to derive correlations between the individuals’ speeds vi (m/s) and D in absolute terms (m/s) [33,34,44], but only a limited number of works tried to define such correlations in respect of free-flowing and dry surface motion conditions [33], that is, the no-constraint conditions for human body motion also in evacuation conditions. The use of such normalized speed could instead improve the generalization of simulation models by allowing to overlap normalized speed variations and the main motion-affecting individuals’ parameters (e.g., age, gender) [43,46]. Thus, this second approach has been followed, and the individuals’ speeds vi (m/s) have been expressed in relation to maximum or ideal evacuation speeds and so in non-dimensional terms (-).
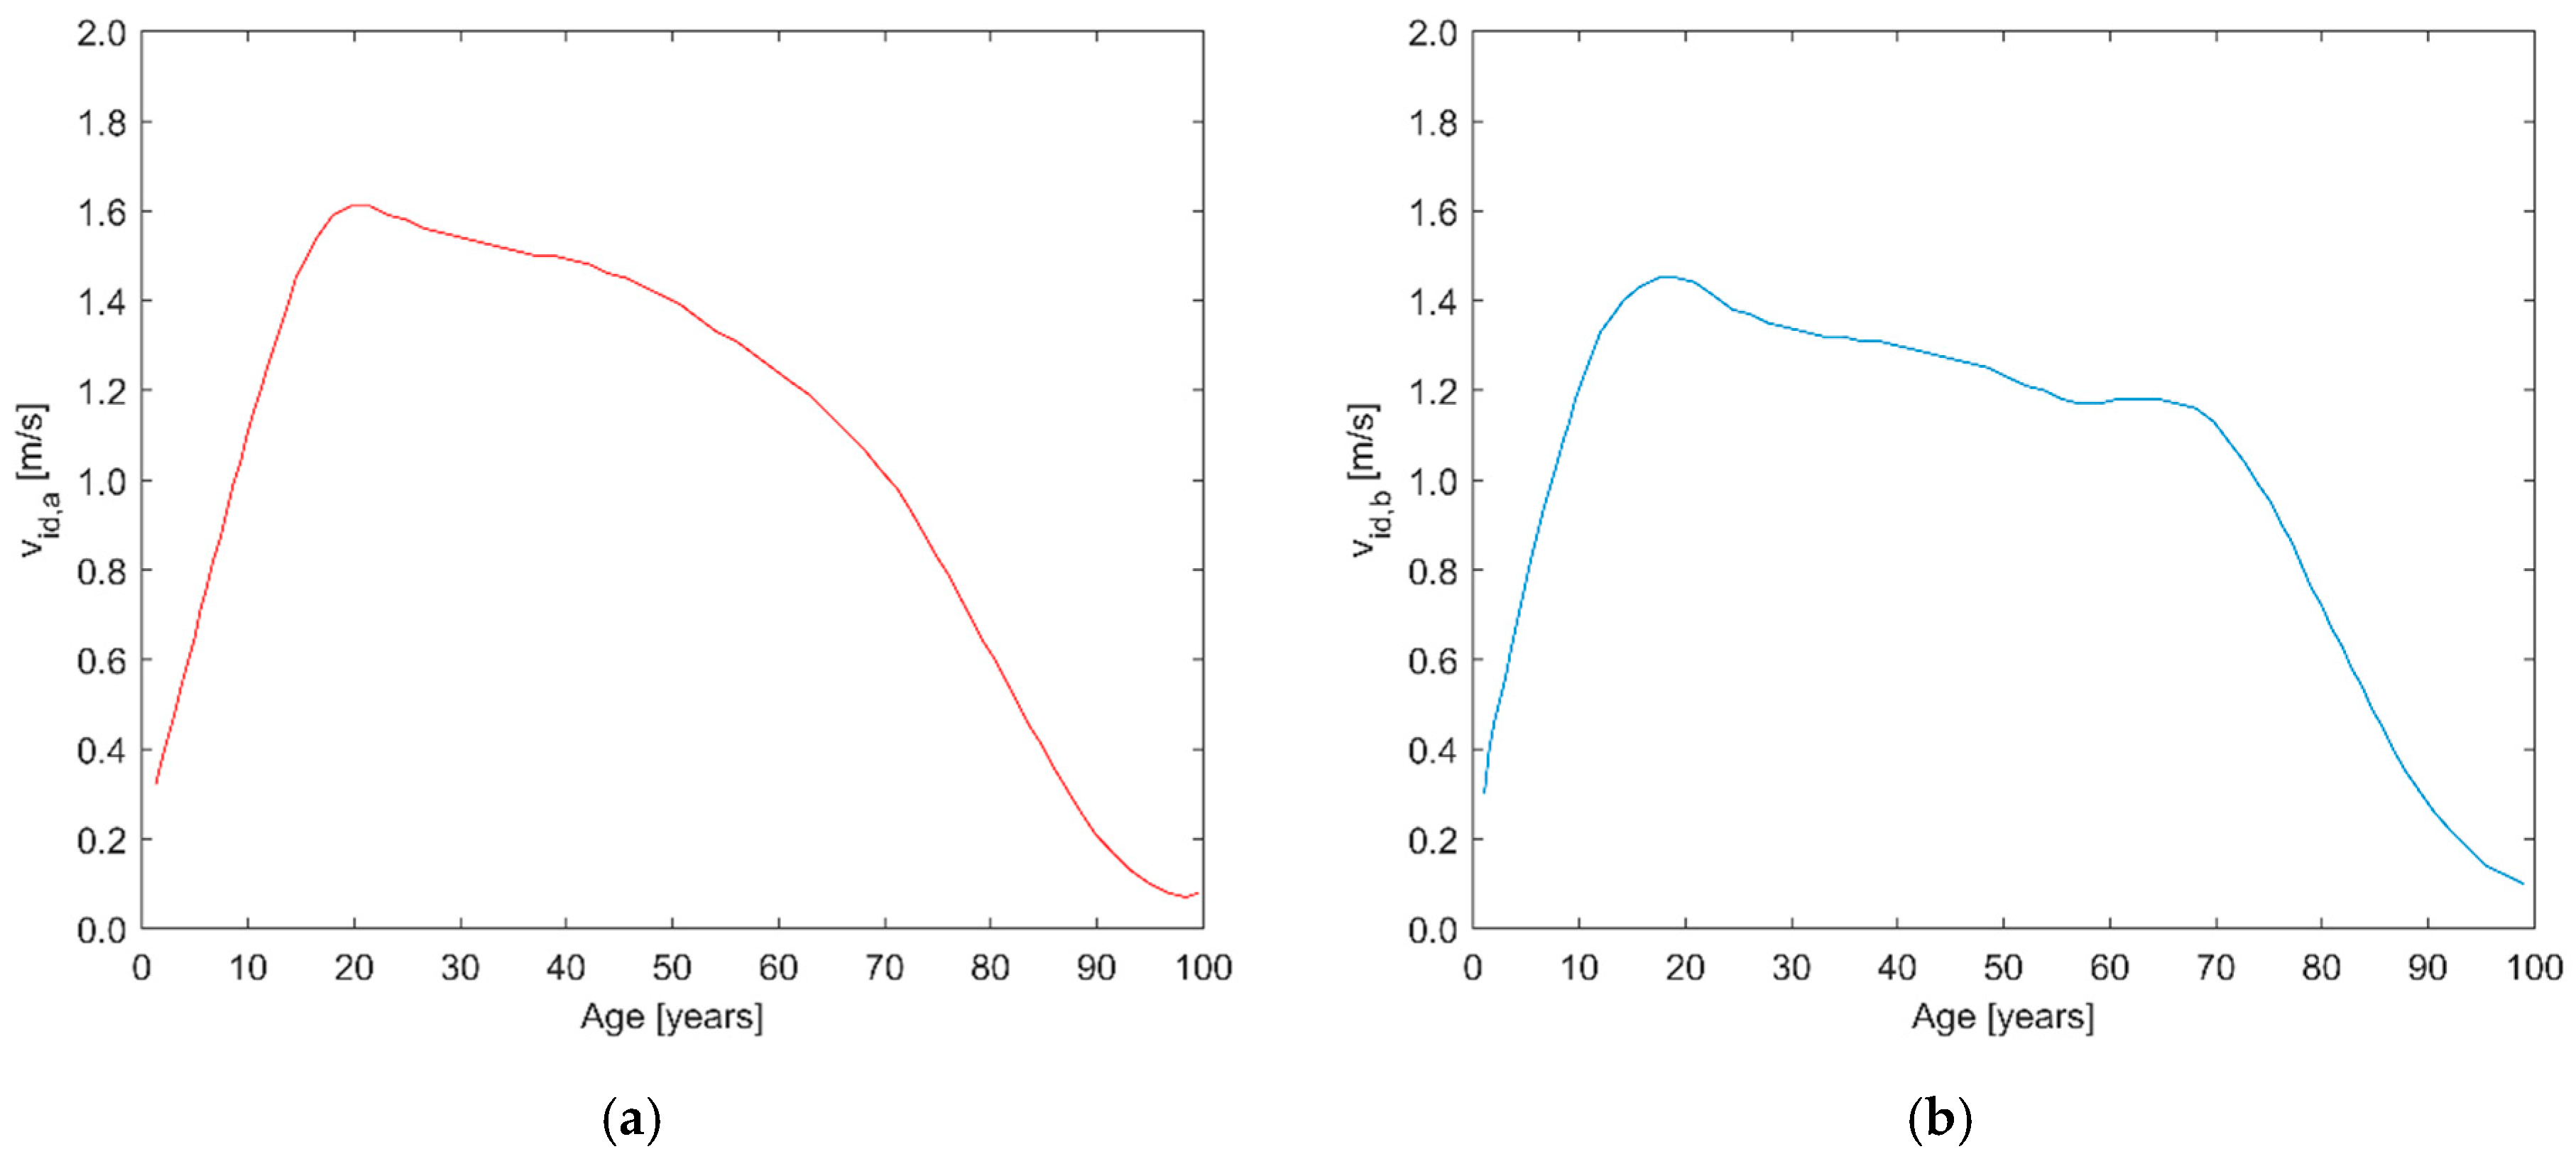
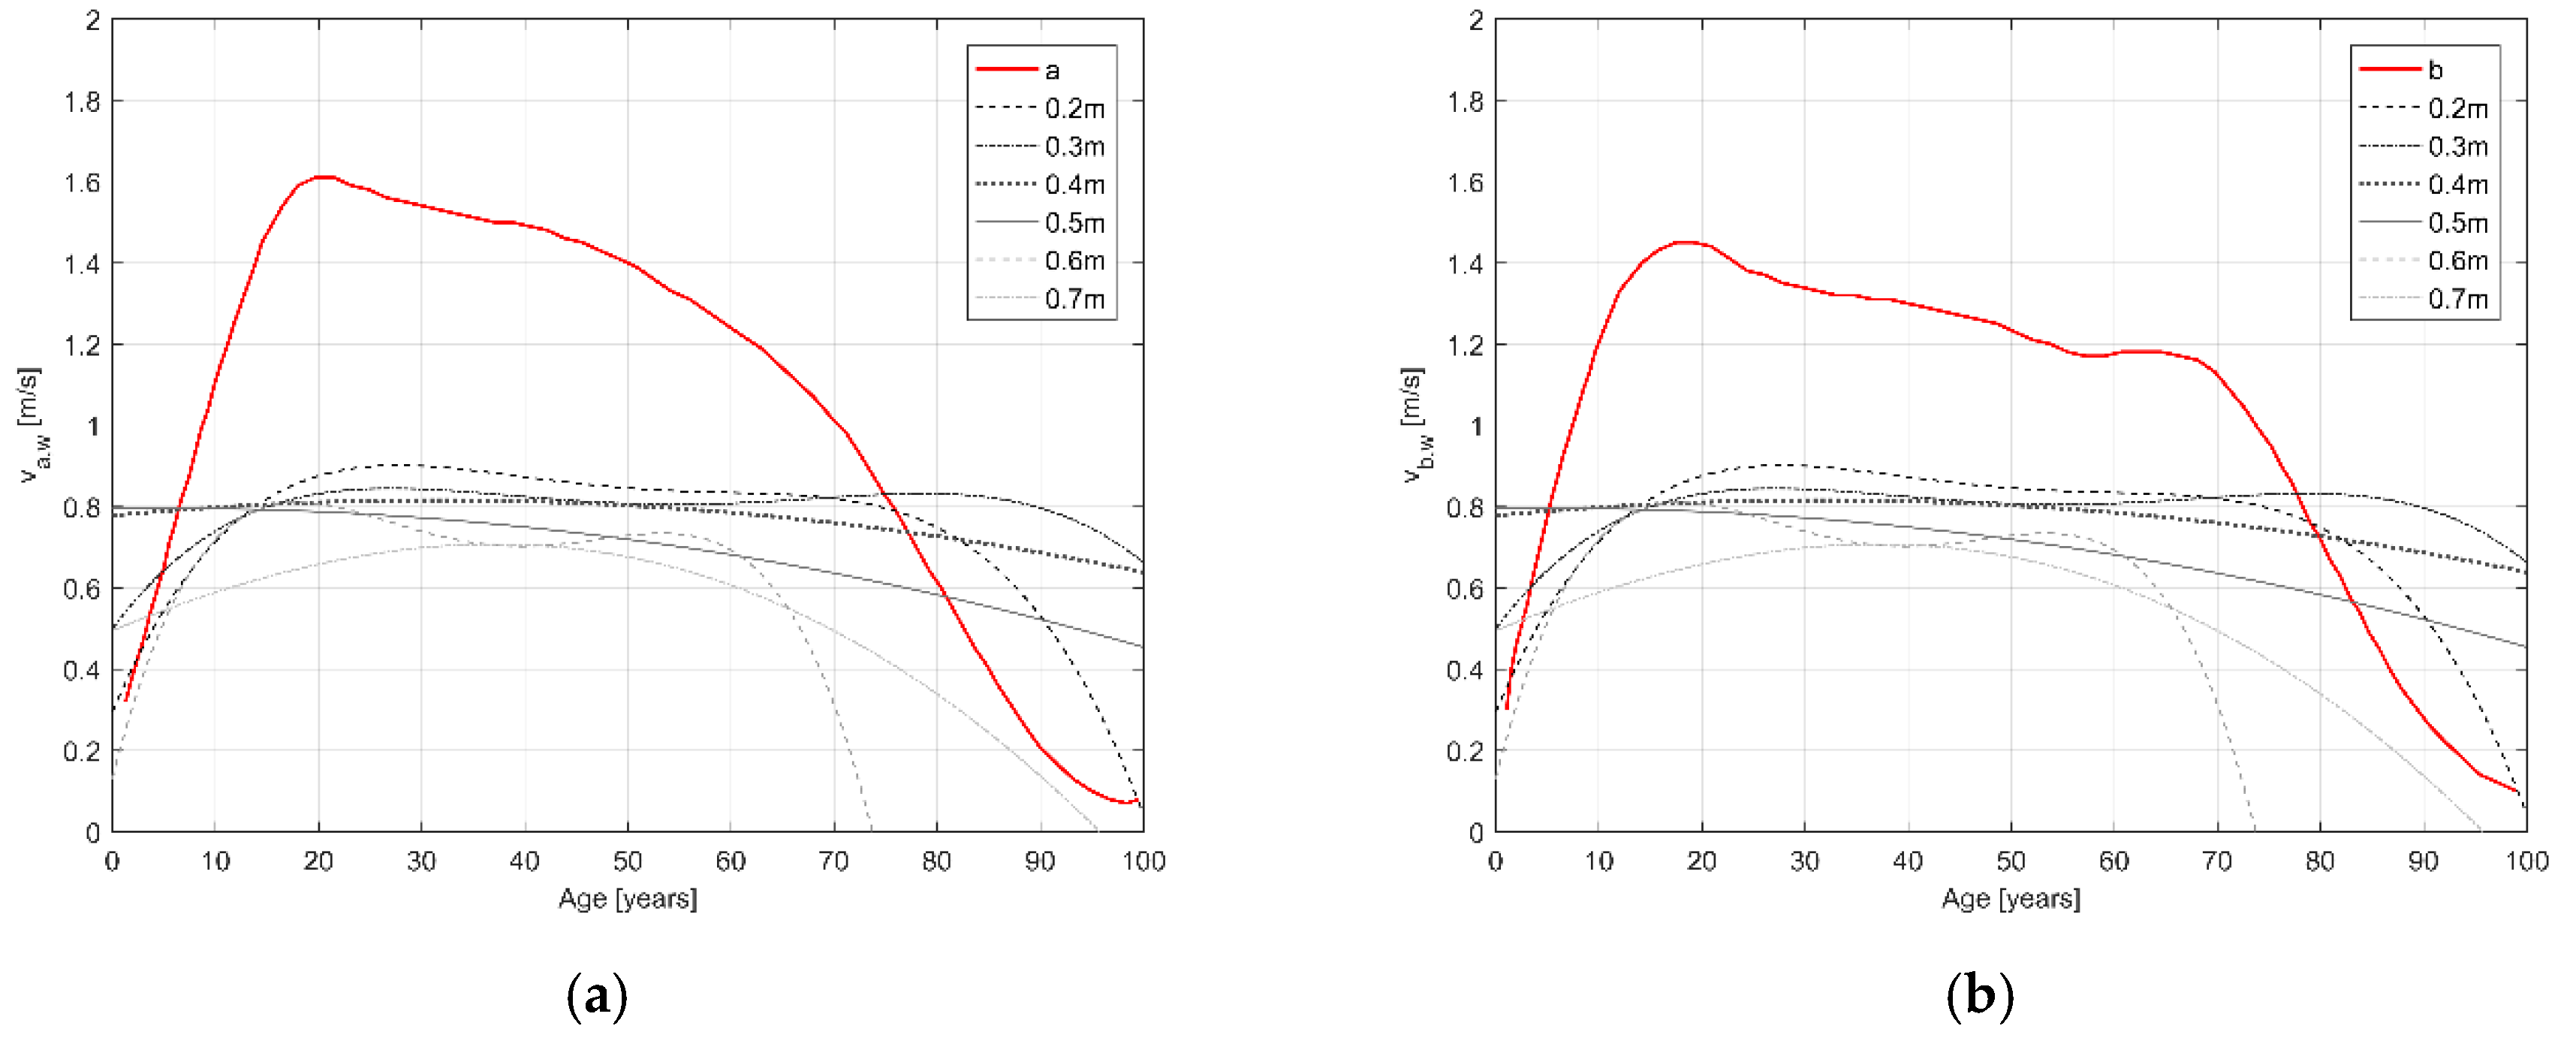
The input data are then organized to trace the variation of speed in walking and running conditions depending on the dry surface motion conditions according to literature values [43]. For each database element, the average motion speed on dry surfaces (m/s) is calculated as a function of the related individuals’ age, according to the correlation curves given by previous studies on wide databases (see the curves in Figure 1). Hence, two values of dry surfaces average motion speed depending on age are provided for each individual: vid,a, according to the curve a [46] (see Figure 1a) and vid,b, according to the curve b [43] (see Figure 1b). These two curves offer different age-related values, and in particular, the curve b [43] can be selected to consider precautionary conditions in normal motion since it generally offers speed values lower than the one of the curve a [46].
Then, Equation (1) is applied to derive the individual’s normalized speed v* (-) according to the two considered curves, in running (v*a,r and v*b,r) and walking (v*a,w and v*b,w) conditions:
v*a,r = vr,exp/vid,a, v*b,r = vr,exp/vid,b, v*a,w = vw,exp/vid,a, v*b,w = vw,exp/vid,b
These values are then organized according to the following modelling approaches, to retrieve according to linear regression models for the prediction of the output in both walking and running conditions:
- Variation of the normalized speed v* in respect of D experimental classes: the distribution of v* in respect of D experimental classes takes advantages of boxplot analysis and graph to evidence if and how the input data are widespread and if outliers are present. Input data involve the whole sample and male (outlined by subscript M) and female (outlined by subscript F) separate samples to highlight the differences due to gender. In general terms, it is expected that running regression model should involve higher v* values, especially for lower D-related input data;
- Variation of the normalized speed v* in respect of K-D: linear regression models are tested. Such modelling approach allows detecting the effects of the reciprocal position of knee and floodwater levels. Male and female samples are shown in the regression model but considered together in the regression model to focus on the main factor influencing human behavior, which is the individuals’ height. It is expected that v* should be equal to or higher than 1 when the knee is placed outside the floodwaters, especially in running conditions.
In addition, a dimensional age-evacuation speed (m/s) model has been tested for the different D values according to a polynomial (4th degree) regression model, which considered the general literature reference curves trend [43,46]. This model allows tracing the differences between the motion curves in no-constraint conditions versus D-constraints conditions. Male and female samples are considered together in the regression model. This choice allows: (a) focusing on the main factor influencing the human behavior, which is the individuals’ age and (b) comparing this study curves with the ones of reference works. The regression models are tested for the whole sample (average behavior of the tested population) and for the maximum values of the experimental pairs (maximum limit behavior). Meanwhile, minimum values are not considered due to their similarities regardless of the specific D values, as demonstrated in the original input database assessment [44]. It is assumed that lower D curves could produce speed values higher than the references curves, especially for running conditions.
2.4. Methods for Normalized Speed Variation Modelling Depending on D, Minimum Constraint, and Maximum Excitement Conditions for the Considered Database
The analysis reported in this section concerns the database subsample including the individuals who performed all the experiments for each D. It includes 186 tests performed by 31 individuals (age characterization: mean age of 32 years, standard deviation of 9 years, range from 21 to 66 years; height characterization: mean height of 1.71 m, standard deviation of 0.07 m, range from 1.55 m to 1.83 m; 16 females and 15 males). The analysis of such data is considered to trace the variation of speed in walking and running conditions depending on the maximum excitement conditions (running) with minimum floodwater experimental constraint (D = 0.2 m). In fact, it is possible to compare the motion behaviors of considered volunteers for each of the tested conditions.
For each individual, the ideal normalized speed with respect to the maximum excitement-minimum experimental constraint conditions (-) is calculated as in Equation (2):
where vr,0.2 (m/s) is the individuals’ running speed for D = 0.2 m. For this reason, all the vi,r,0.2 for D = 0.2 m will be equal to 1. The distribution of vi,r,0.2 (cm) in respect to D tested values is assessed and shown by a boxplot comparison. Linear regression is provided to evidence the general trend of the sample for separated running and walking excitement conditions. Due to the smaller sample dimension, it is assumed that the regressions are evaluated by collecting males and females in a unique sample.
vi,r,0.2 = vr,exp/vr,0.2, vi,w,0.2 = vw,exp/vr,0.2
In addition, the linear regressions are also tested for the sub-sample of individuals who moved with the knee inside and outside the floodwater, according to the same procedure. To this end, Equation (3) has been applied to separately retrieve the normalized speed value in running vi,r,max and walking vi,w,max excitement conditions:
where vr,max and vw,max are respectively the maximum running and maximum walking speed. This normalization procedure allows to consider the effective D value for which the individual had the maximum motion speed. Hence, the boxplot distribution representation can have vi,r,max and vi,w,max values equal to 1 also for D > 0.2 m.
vi,r,max = vr,exp/vr,ma, vi,w,max = vw,exp/vw,max
3. Results
3.1. Characterization of the Selected Database
Figure 2 demonstrates that the overall sample can be characterized by a significant linear trend in K-D (cm) values. The main classes affected by the possibility to have the knee inside or outside of the floodwater levels are D = 0.4 m and 0.5 m. Hence, the results for these classes can be effectively affected by the relative position between the knee and the floodwater surface. Lower D classes have many outliers with respect to the others because of the values connected to the child, which have a lower height.
Figure 3 confirms how the male sample individuals seem to move faster in running conditions than the female sample individuals [43]. Anyway, differences between the two linear regression models are slight (about 10% in respect of the male regression coefficient). R2 values show a moderate correlation trend for both the gender-related sample.
Figure 4 confirms how the increase of D implies a slighter difference between running and walking excitement conditions, with a general moderate correlation trend (compare R2 values for the regression models). D equal to 0.4 m and 0.5 m evidences small differences in regression trends (5% in respect of D = 0.5 m) because the related sample is composed by individuals with knees outside and inside the floodwater level, also according to Figure 2 results. Meanwhile, D equal to 0.5 m and 0.6 m seems to additionally provoke the same conditions in vw,exp and vr,exp pairs, confirming previous works outcomes [44]. In such conditions, the knee and a part of the above leg are generally placed inside the water, by involving a similar physiological and kinematic constraint in human body motion.
3.2. Speed Variation Modelling Depending on D and Dry Surface Motion Conditions
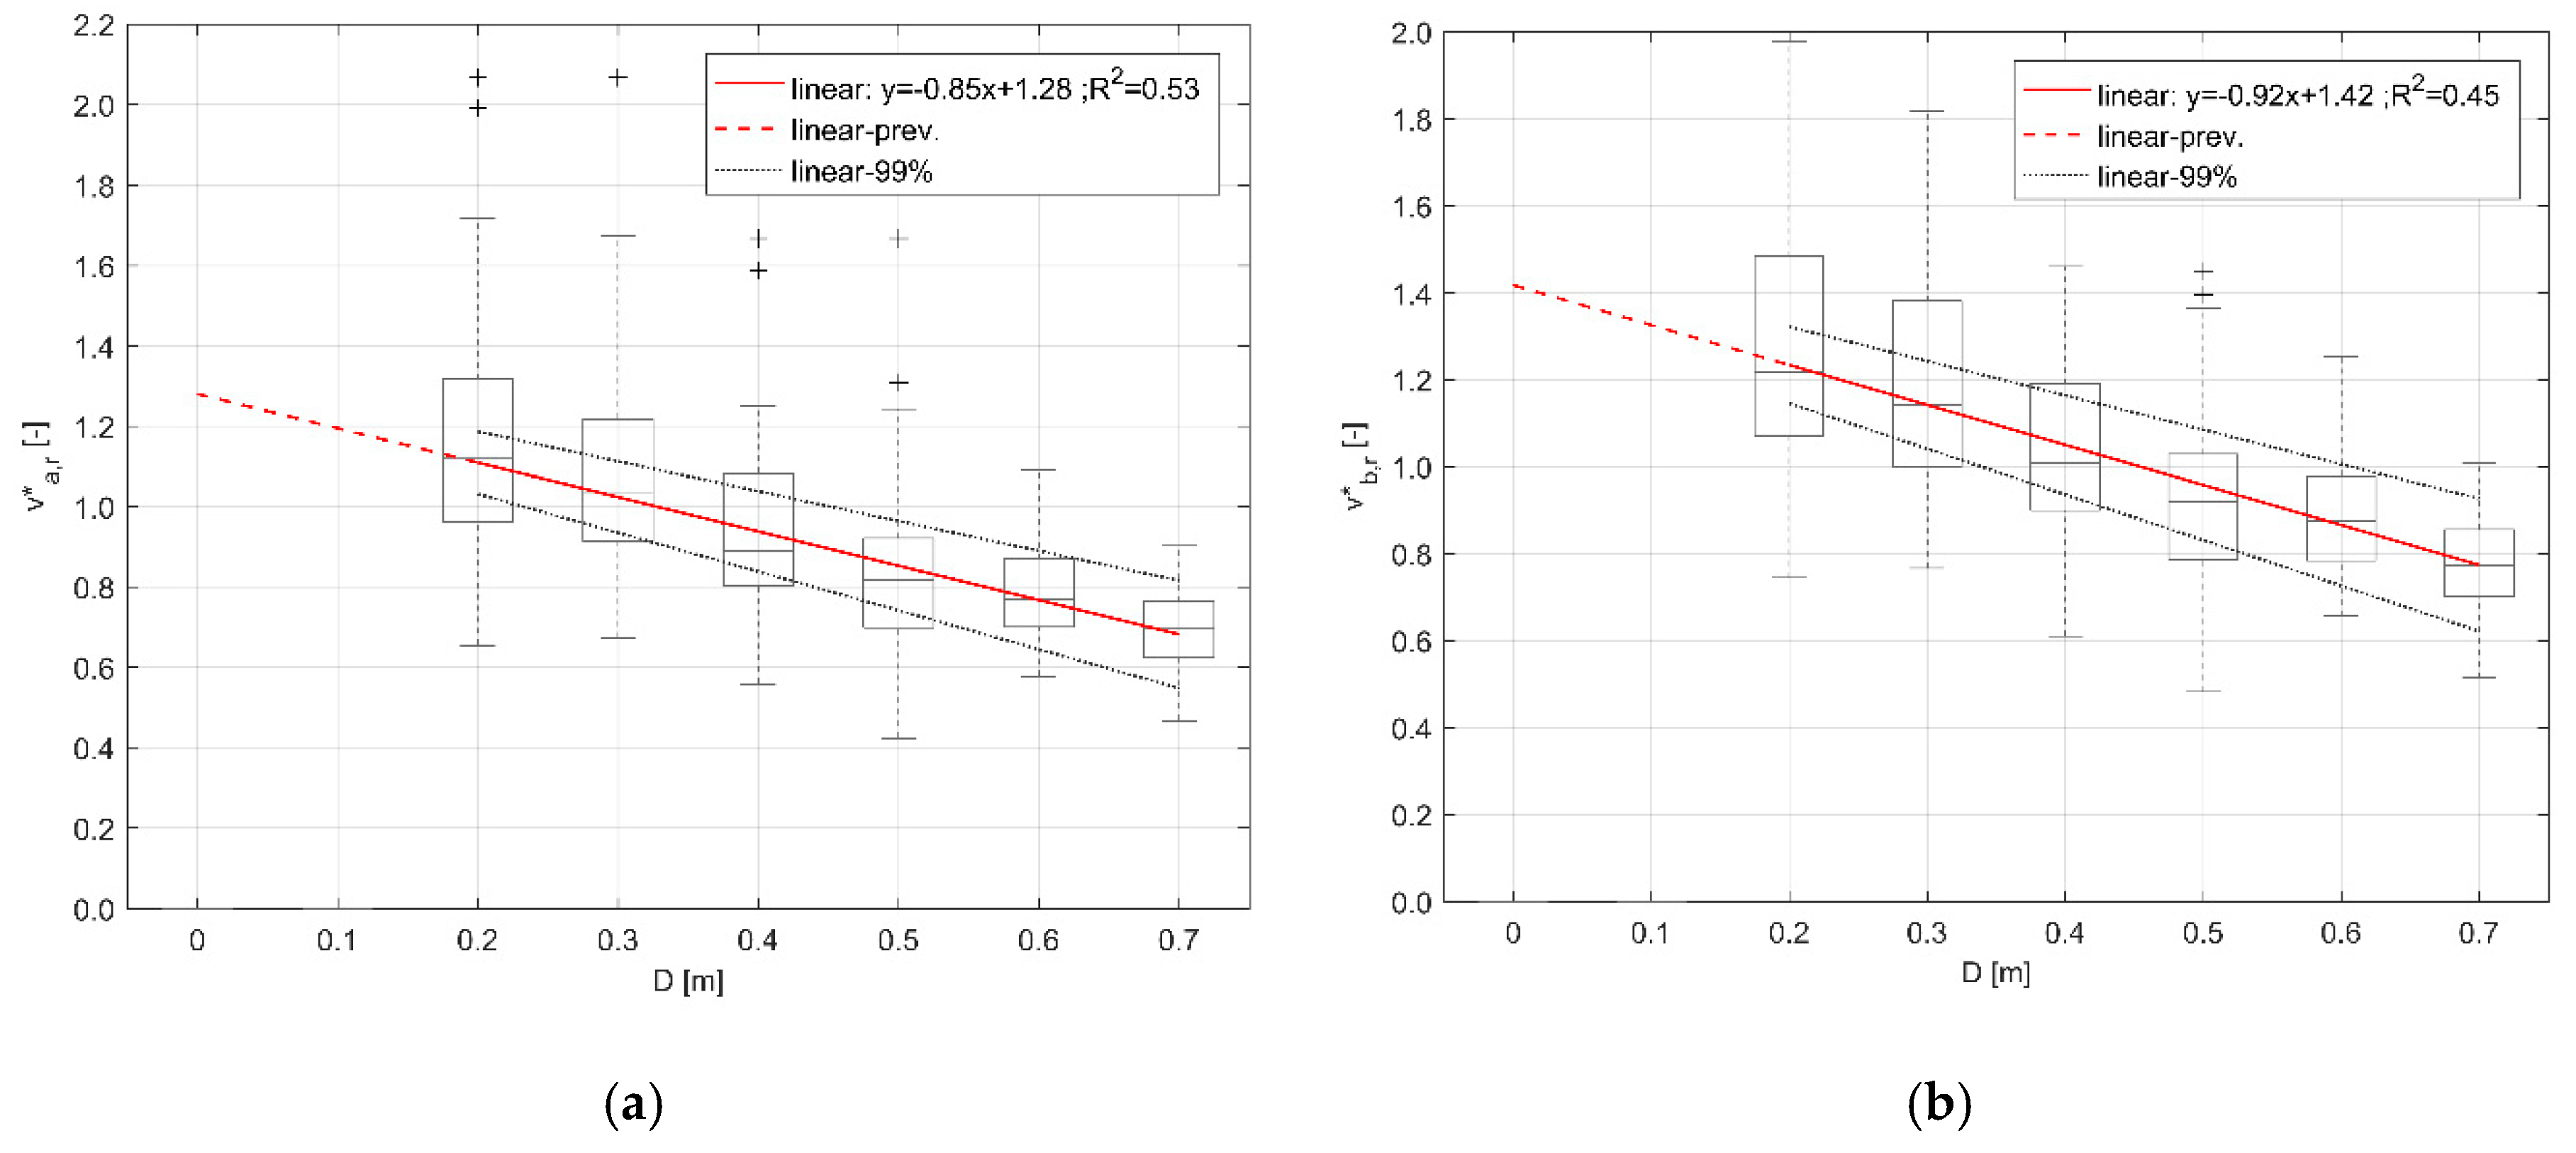
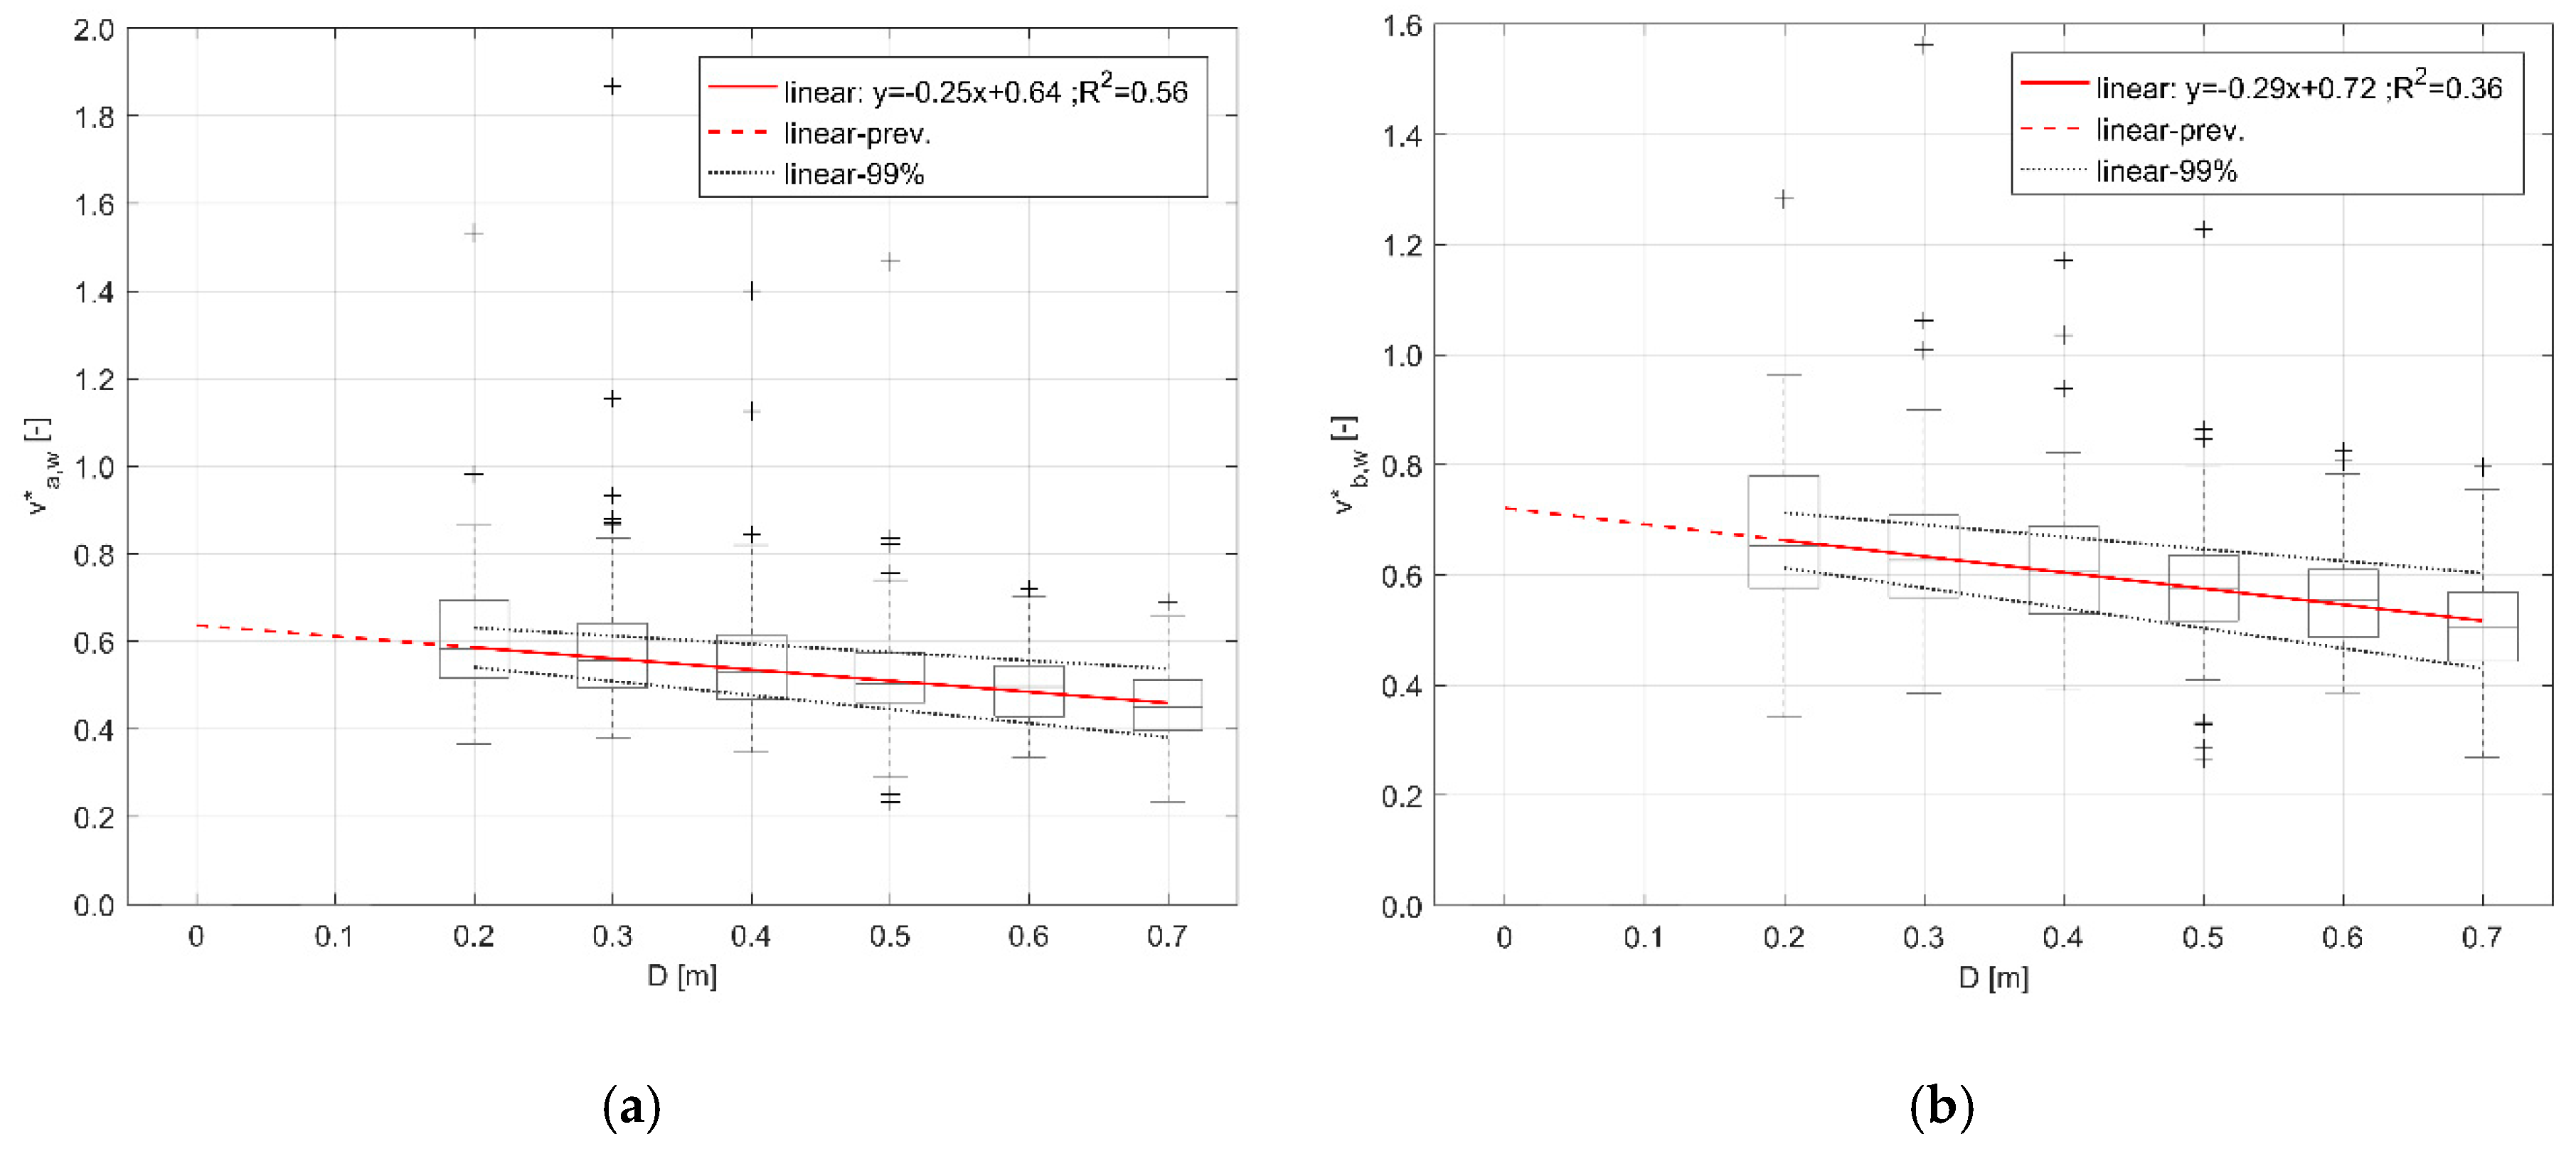
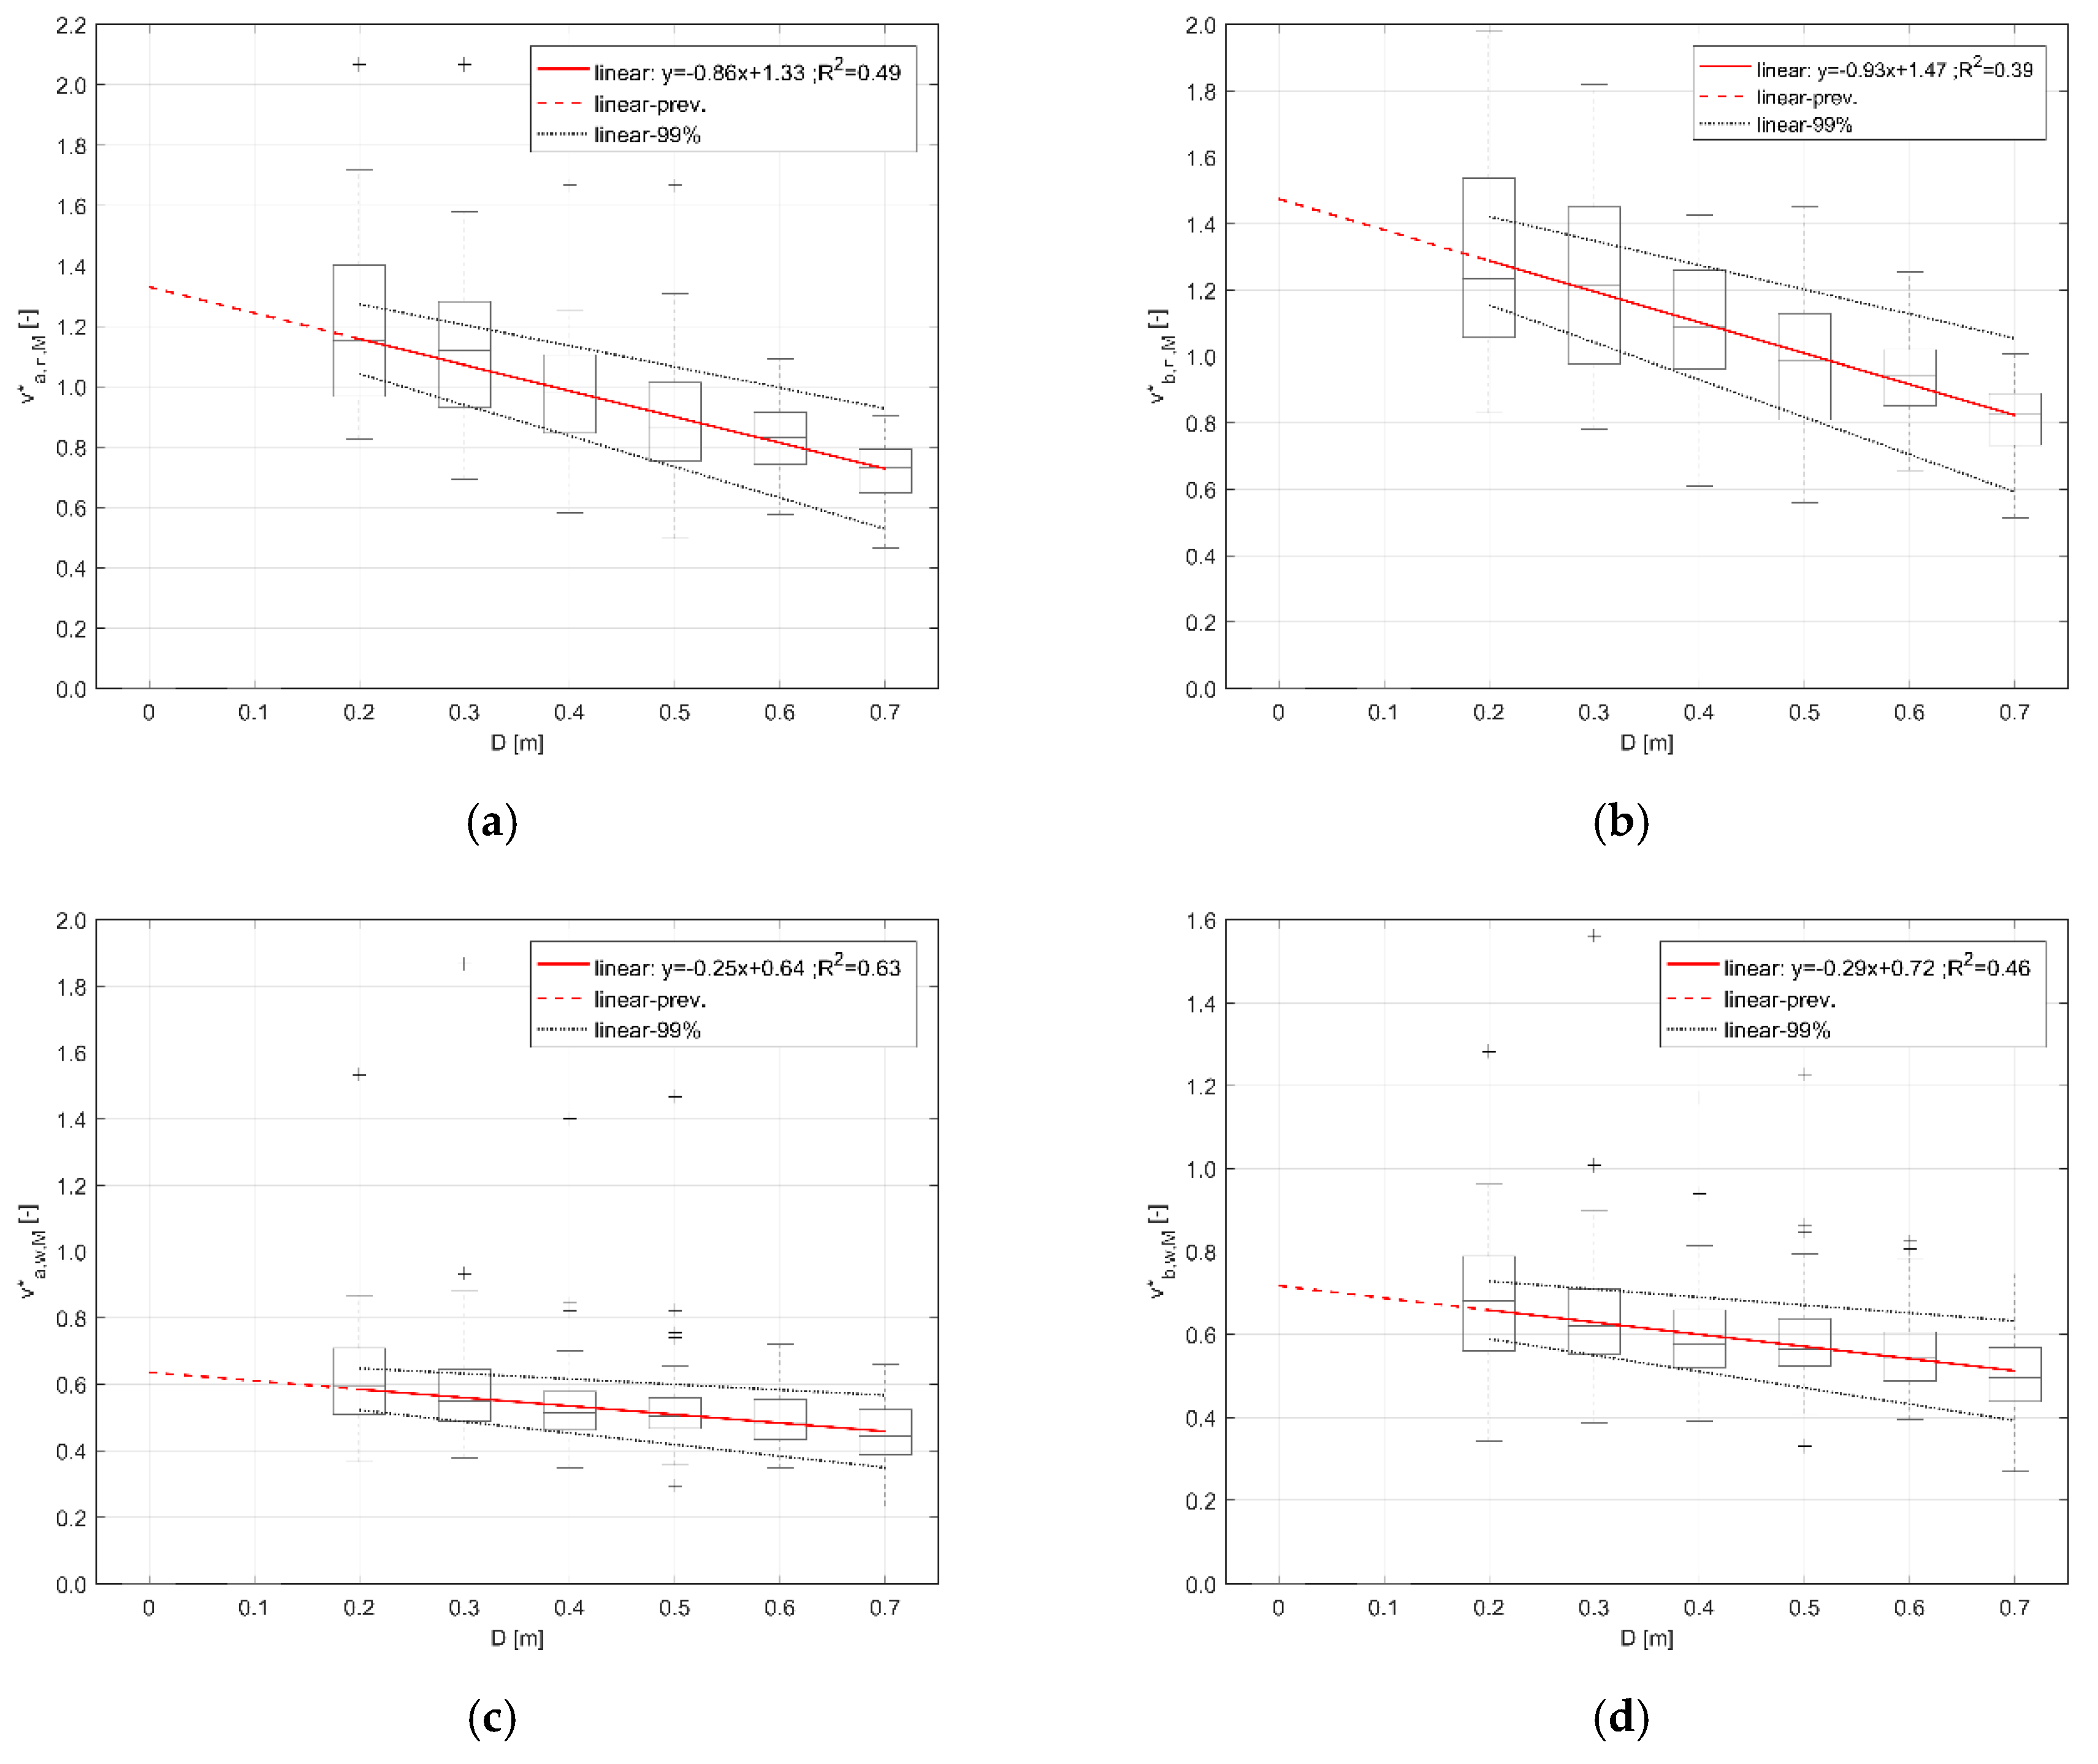
Figure 5 resumes the normalized speed variation models according to the two reference curves, for running conditions, while Figure 6 evidences the same model in walking conditions. In general terms, all the provided models confirm how [33,41,43,44]:
- Motion speed (and so v*) decreases while D increases. Regressions on the curve a-based model show a slighter regression slope, according to the first term in the regression equation (−8% for running conditions and −16% for walking conditions in respect to the curve a-based model). Hence, curve b-based models seem to amplify the v* reduction;
- The speed-D relationship in both the excitement conditions can be properly represented by using speed normalization. In particular, regressions on the curve a [46]-based model show a moderate relationship, according to the R2 value, for both walking and running conditions. R2 values for the curve b [43]-based model are lower than these, suggesting that this model more limitedly represents the effects of D in v* variation. Hence, the adoption of curve a-based model could improve the prediction model capabilities in evacuation simulators;
- In view of the above, differences between running and walking excitement conditions exist. In particular, the effects of D on the variation of speed in walking conditions seem to be less relevant than the ones of running conditions. This result is evidenced by the more significant presence of possible outliers (see Figure 6) and by the lower value of the first coefficient of the linear regression (about −70% in respect to running conditions model). This result confirms the original work outcomes [44] and the outcomes of studies concerning other evacuation typologies [47]. In fact, issues related to the individual’s motion effort and the distance between individual and motion goals seem to be more relevant while people are running towards the motion goal (as in evacuation conditions). In addition, it is worth noting that the assessed v* value in the dry surface for running conditions is about 2 times greater than the one for walking conditions, regardless of the adopted model. Besides, v* in running conditions seems to be equal to about 1 when D is about 0.3 to 0.5m, which corresponds to the D classes for which the individuals’ knee is generally closer to the floodwater level, according to Figure 2 statistics;
- Differences between dry surface motion in literature reference works [43,46] and the adopted database [44] exist (compare the second linear regression coefficient in all the models), by underlining how specific database should be adopted to represent the flood evacuation. Forecasted v* for D < 0.2 m are beyond the lower limit of the tested D conditions and so they could be affected by additional non-linear speed-D interferences [33]. Nevertheless, the importance of this result is shown by the v* values for the minimum tested constraint conditions (D = 0.2 m) in both walking and running conditions.
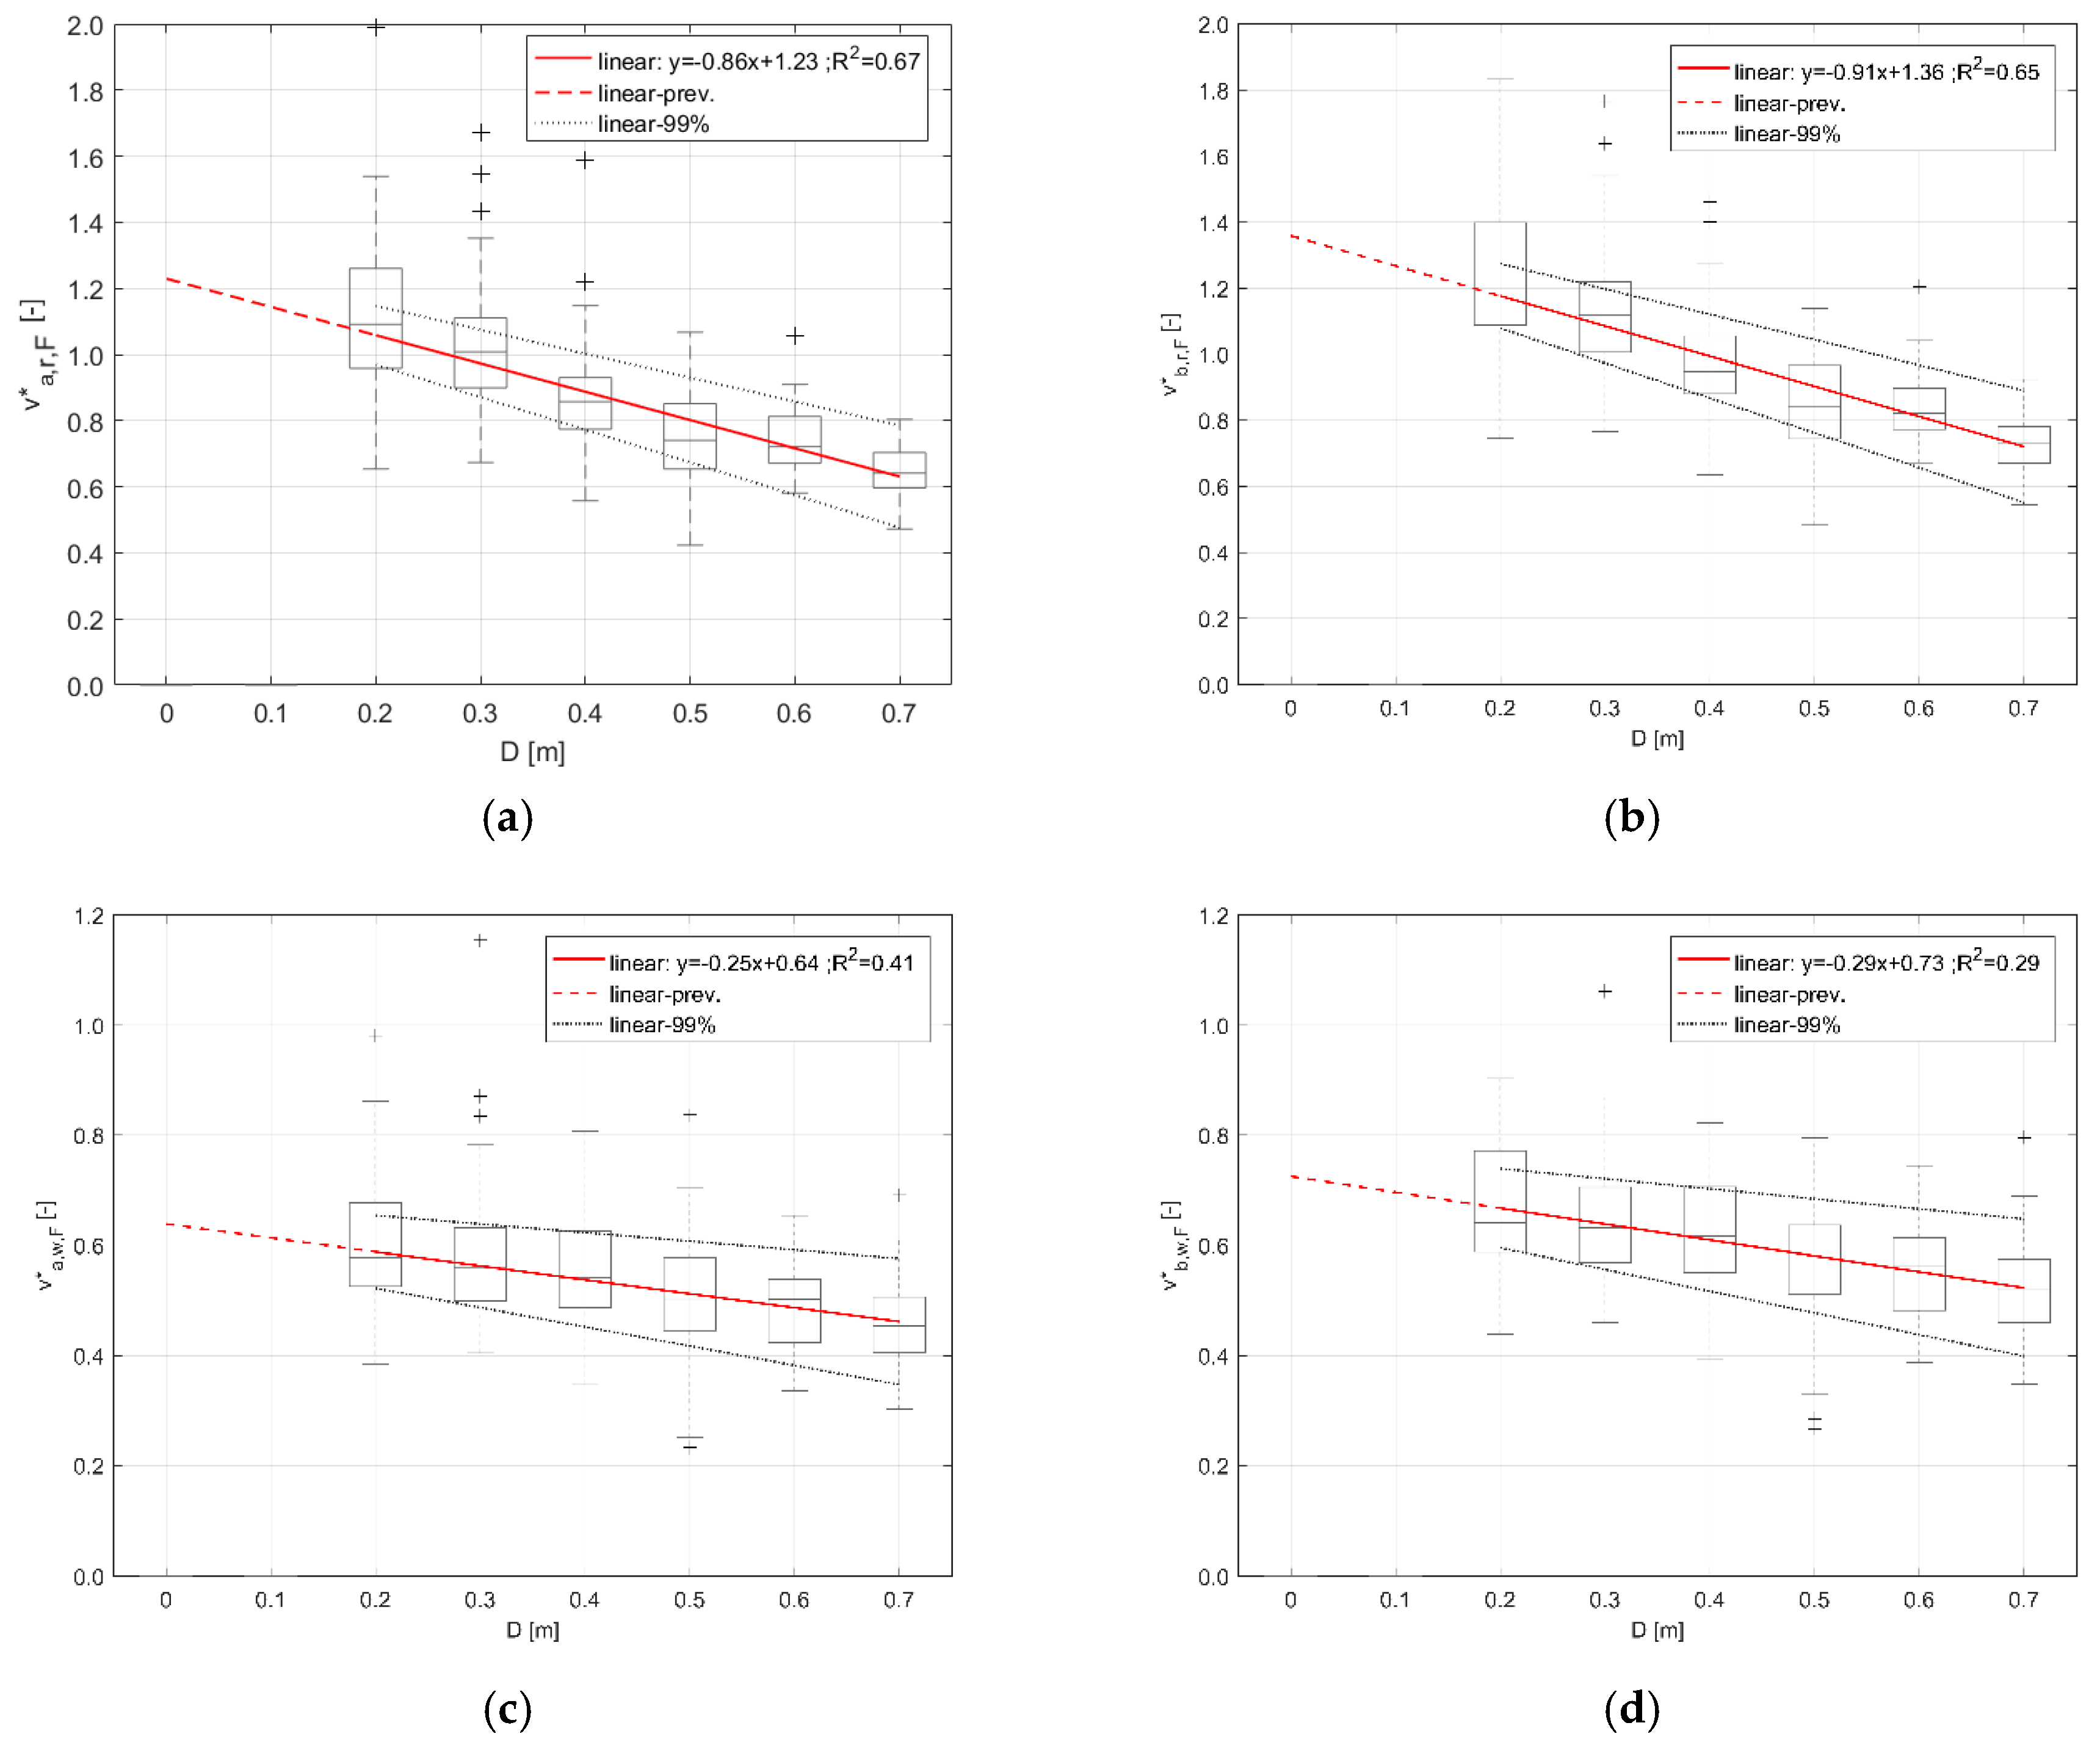
The same results are highlighted by the running and walking models related to male and female separated samples, as shown by Figure 7 and Figure 8. Besides the higher accuracy of the curve a-based model in prediction v* variation depending on D, the comparison between running and walking conditions for male and female subsamples underlines how:
- Males seem to move faster than females in running conditions, confirming previous works outcomes [33,43] and Section 3.1 (i.e., compare with Figure 3) outcomes. This result is evidenced by the second linear regression coefficient in both the models (in curve a-based model: 1.33 for males versus 1.23 for females; in curve b-based model: 1.47 for males versus 1.36 for females). In particular, males seem to move +8% faster (in normalized terms) in dry surface conditions, in both models;
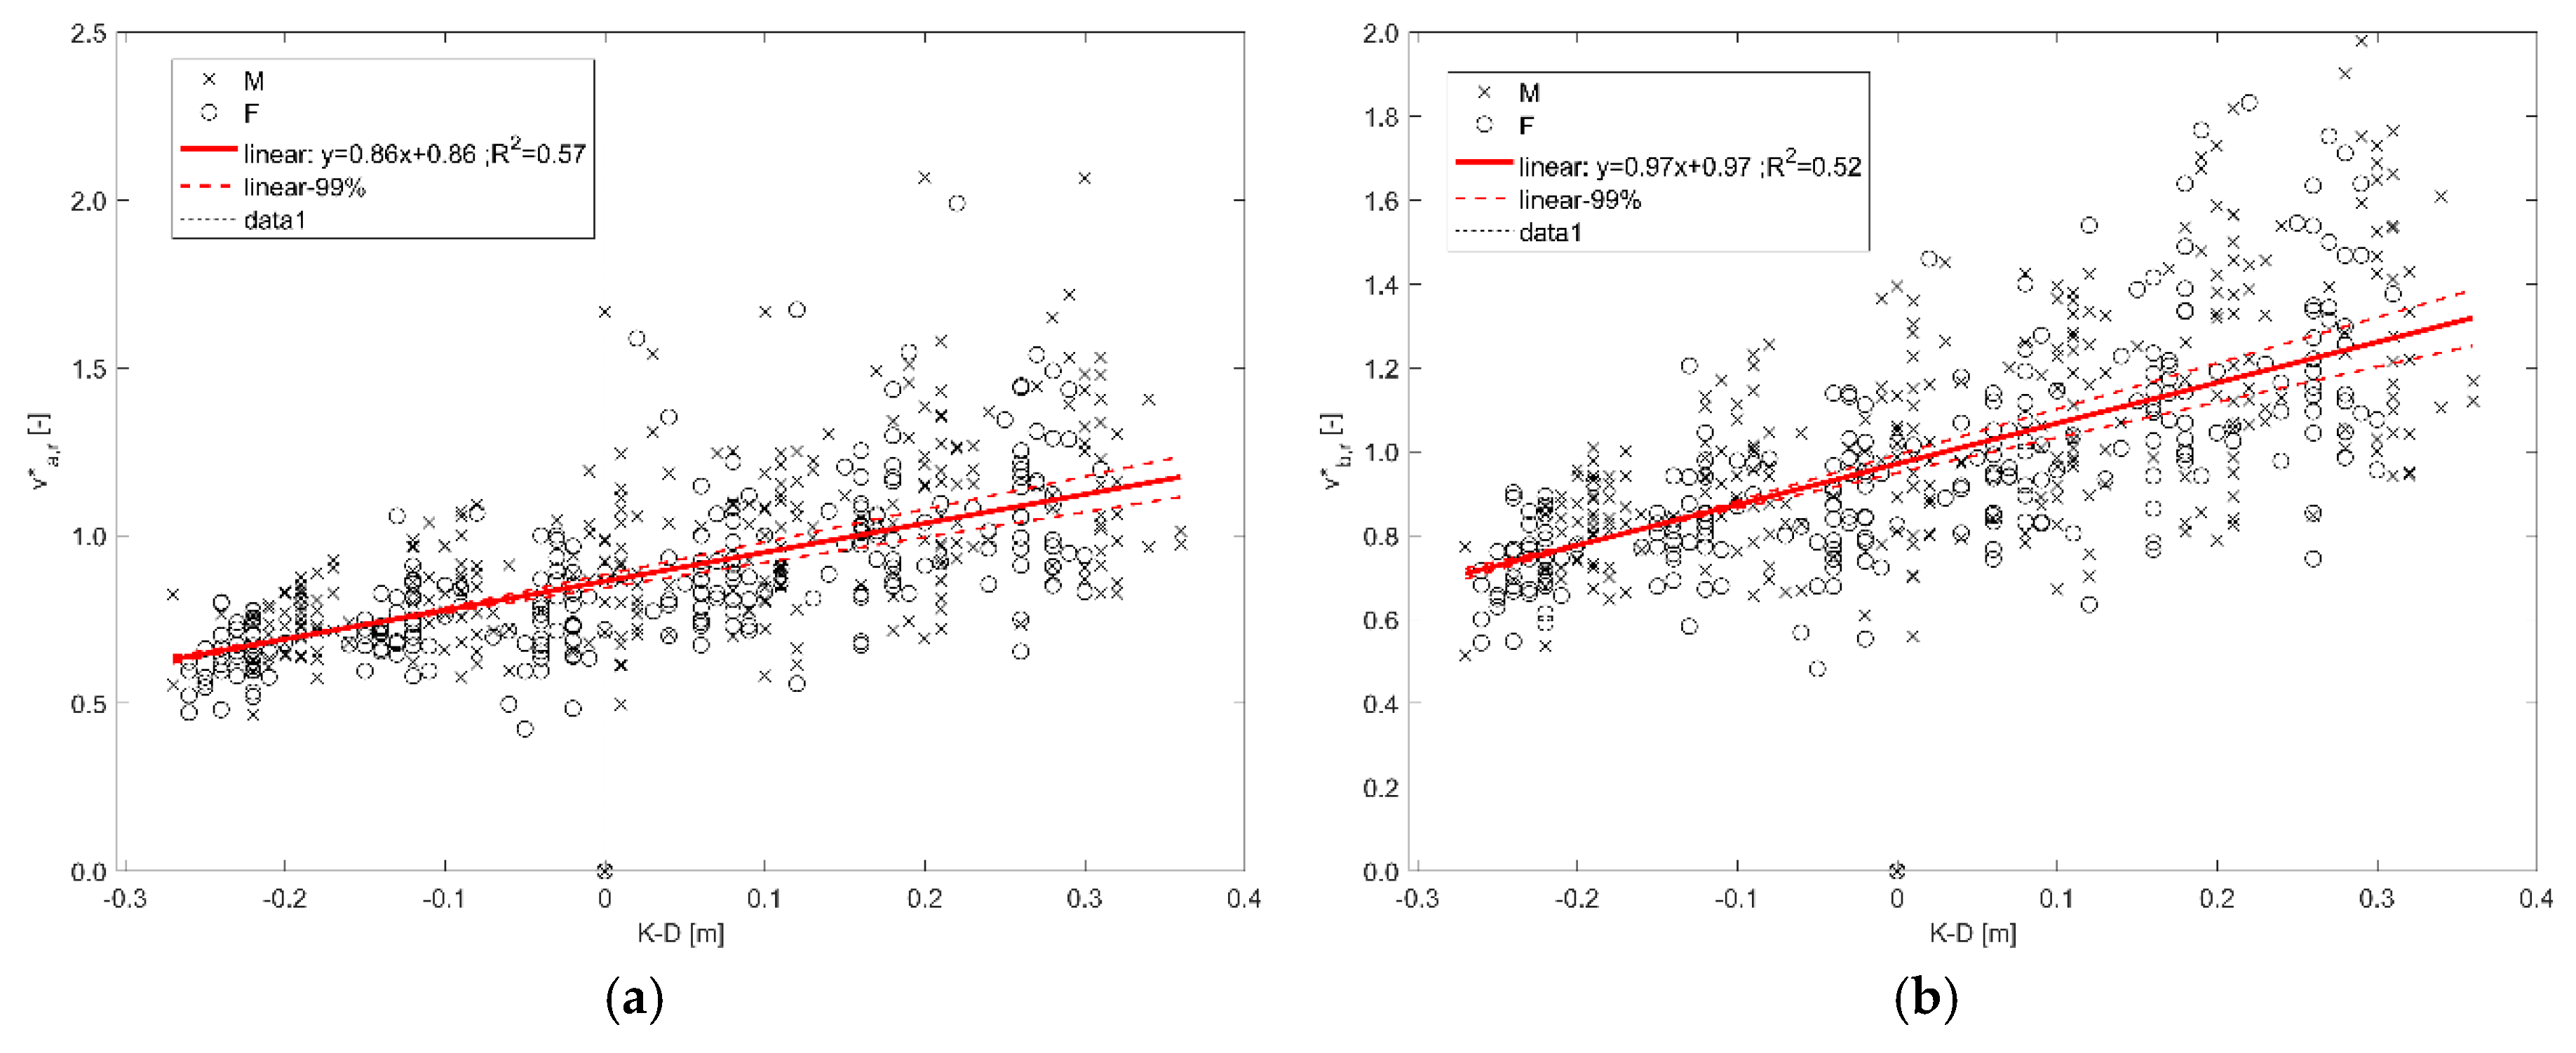
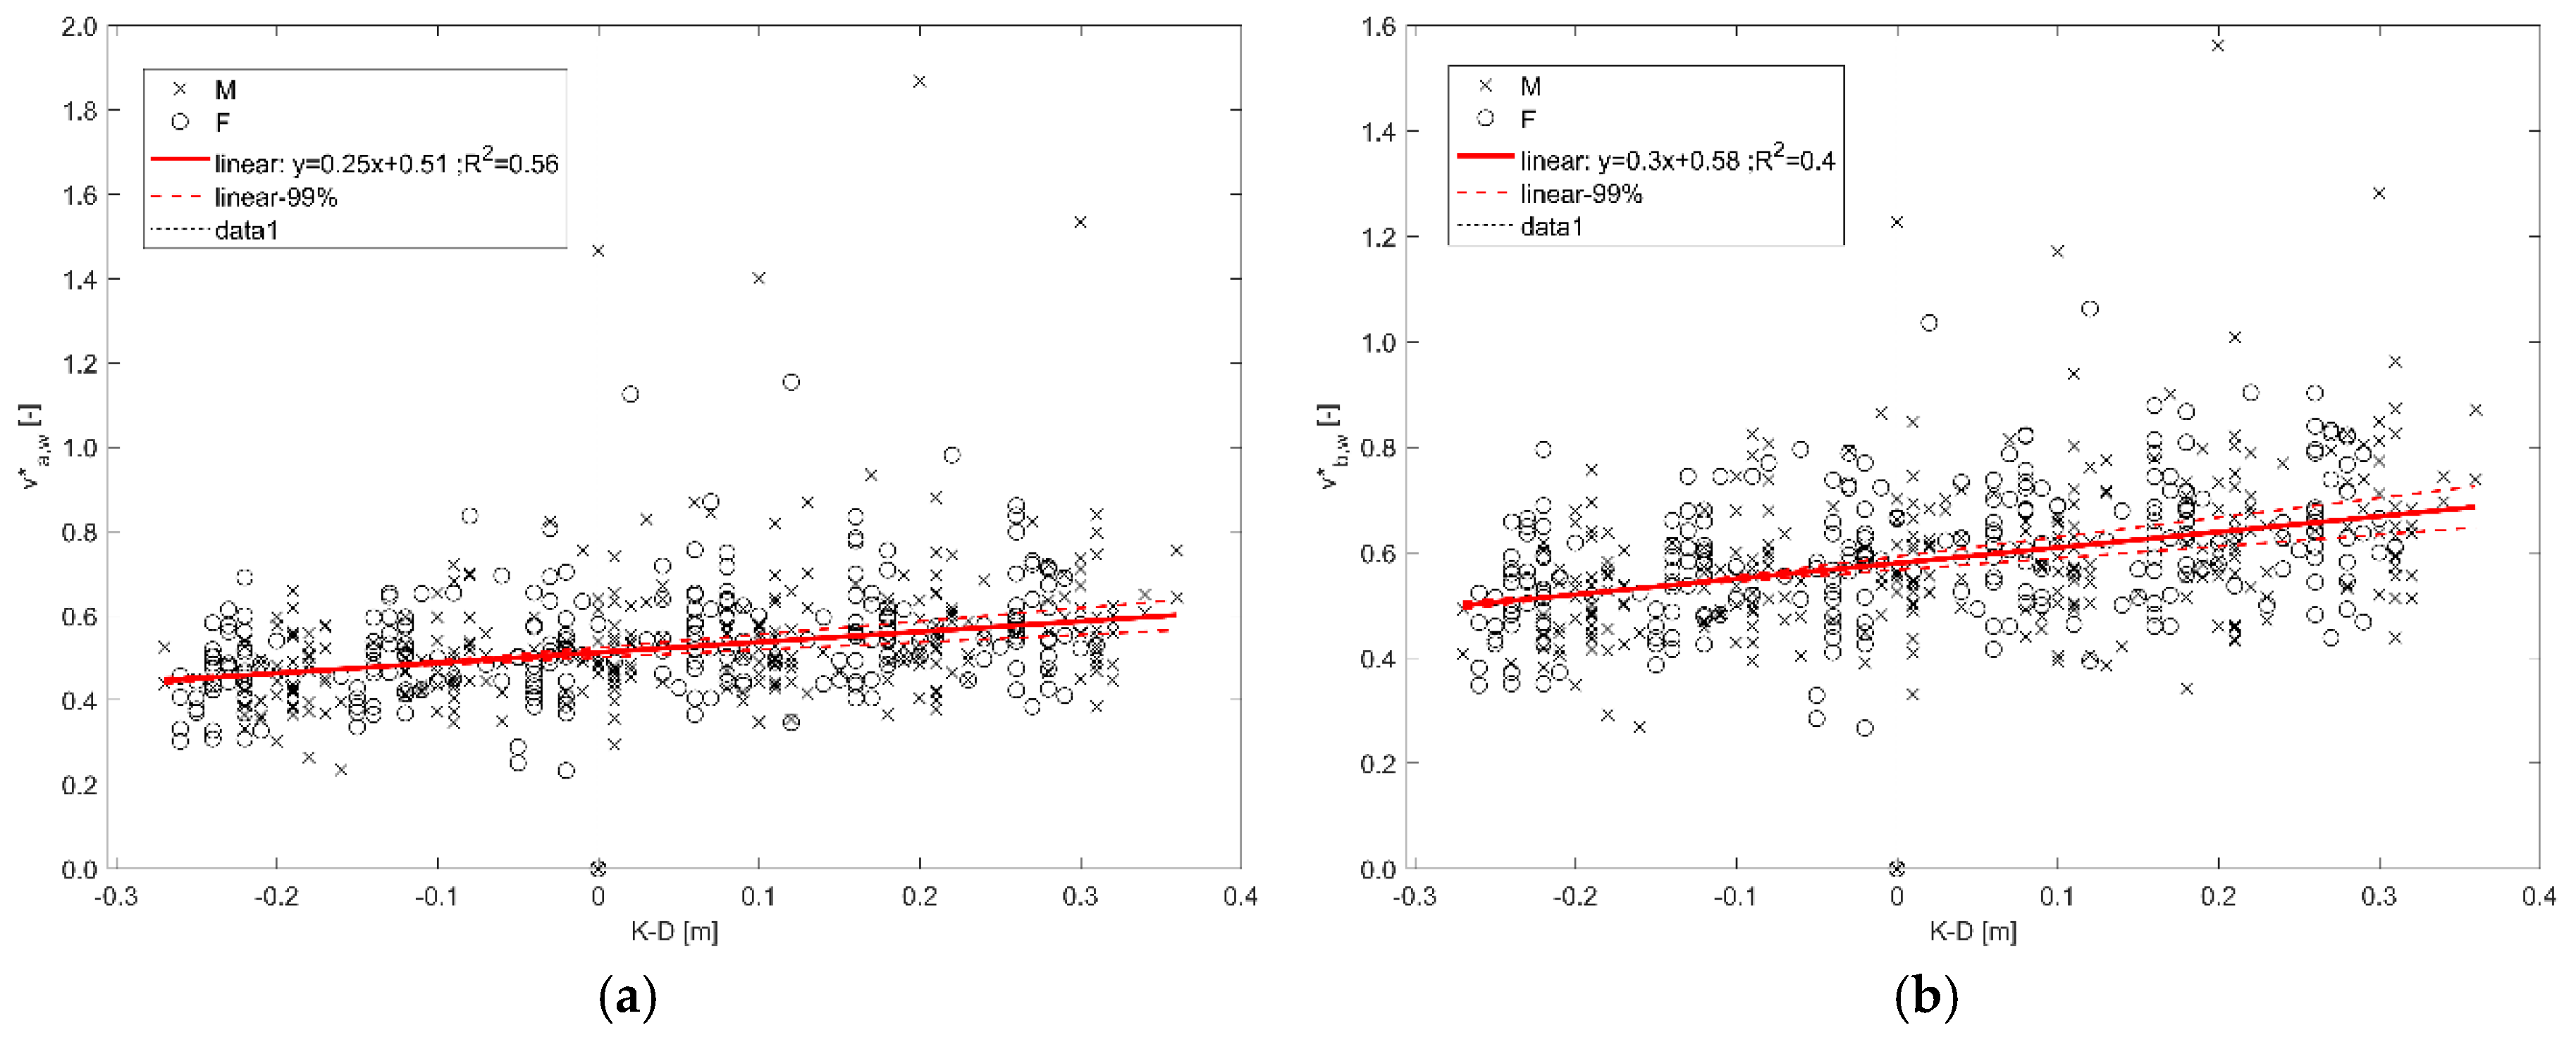
Figure 9 and Figure 10 confirm the previous results by focusing on the knee-floodwater depth interaction and by representing the normalized speed variation according to the reciprocal knee-D position. The database characterization according to K-D values is offered by previous Figure 2. The male and female samples are jointly considered to focus the regression model on the individuals’ height-related behavioral driver. Firstly, according to Figure 6 and Figure 7 outcomes, the effect of D on the human motion is more relevant in running conditions (see the first regression coefficient in all the models). Secondly, v* is quite equal to 1 for K-D values close to 0 in both running conditions related models. Finally, all the regression models (both using curve a and curve b) seem to have a more relevant statistical significance in respect of the v*-D ones (R2 generally higher also for curve b-based model). All these results confirm the importance of floodwater-knee interaction as the main behavioral driver for the whole sample [44].
It is also worth noting that the general dispersion of forecaster v* data is quite small and increases for individuals moving with the knee outside of the water (i.e., K-D > 0 m). This result is shown by the reciprocal position of the linear boundary conditions (99%) in respect of the linear regression line (which refers to forecasted median values).
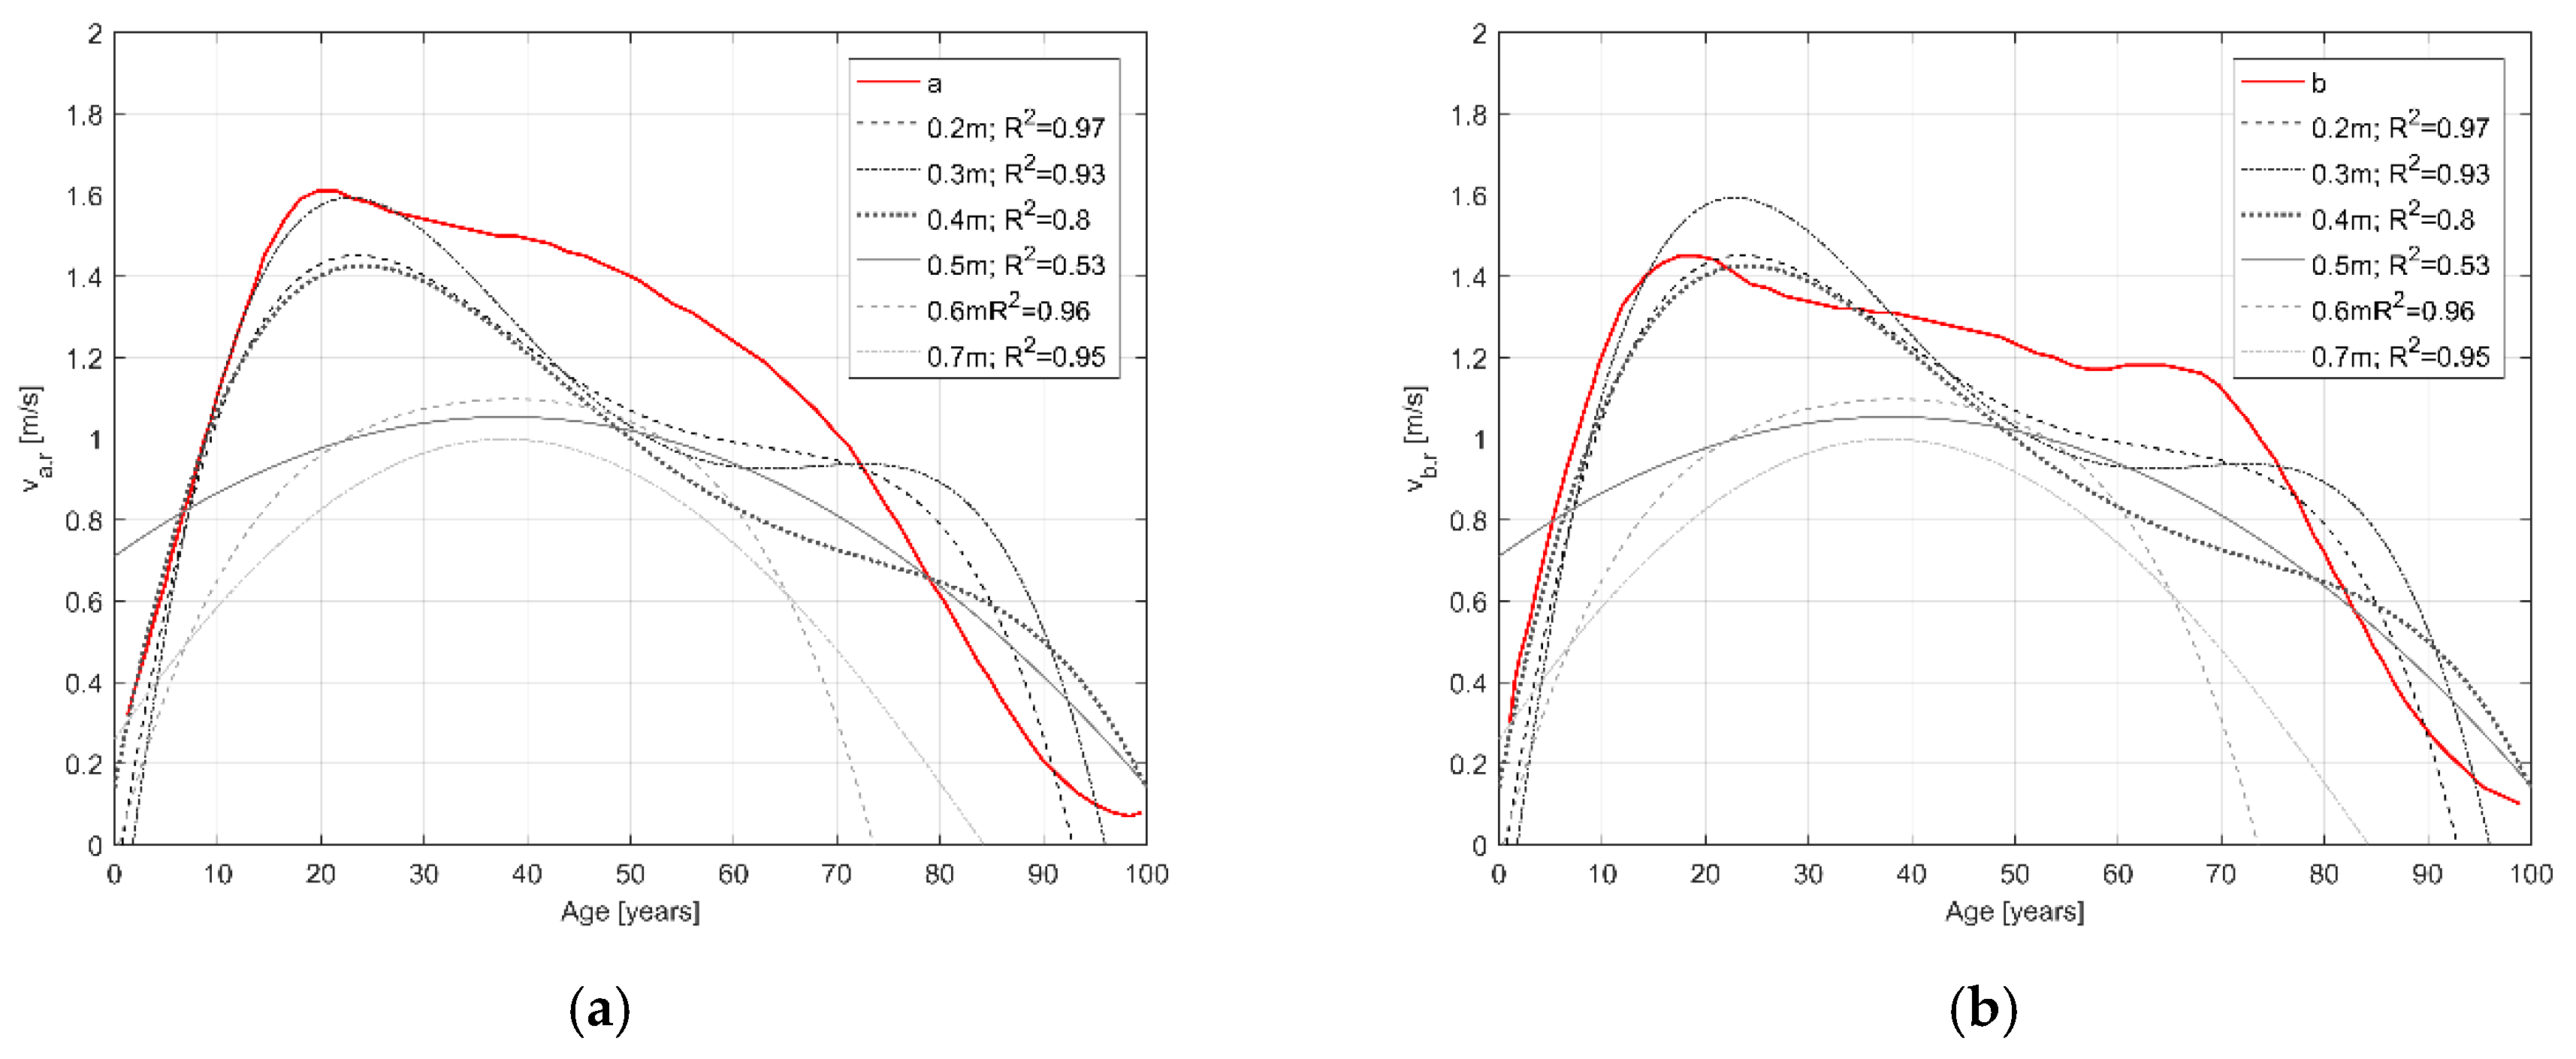
The age-evacuation speed v (m/s) models are assessed at the different tested D values for the whole sample (average regression) and maximum age-v pairs, by using a 4th-degree polynomial regression which has a similar form in respect of the reference curves. Figure 11 and Figure 12 respectively show the results for the overall sample in running and walking conditions, and by considering the comparison between the curve a and the curve b. Figure 13 and Figure 14 show the regression for the maximum age-v pairs. In each excitement condition, considered age being equal, the increase of D corresponds to a decrease in predicted motion speed. Differences are more relevant in running tests. The regression models could be affected by the original database characterization in terms of age classes and overall age range [44], as outlined by low R2 values (<0.25) for “average” age-v regression line (due to the original database pairs dispersion). Nevertheless, they generally confirm the previous modelling outcomes as well as the results of previous works. Firstly, the general trend of 4th polynomial regression is confirmed in each excitement conditions, by underlining that elderly’s speeds are lower than the one of adult individuals. In addition, it could be evidenced that:
- Considering running conditions, the age-v regression for the overall sample is over the references curves when D ranges from 0.2 m to 0.4 m, regardless of the considered curve in the model; this result confirms the “average” results of Figure 9. Meanwhile, the regression curves on the maximum age-v pairs seem to be always over the reference curves or, at least, equal (i.e., if considering the curve b data);
- On the contrary, walking conditions-related regression on maximum age-v pairs are generally under the reference curves, with similar predicted values for the age range 10 to 30 years. This seems to evidence that younger individuals can generally be less affected in their motion by D conditions, confirming previous results on age-related impact on motion speed [42,43,44]. Average age-v pairs regression in walking speeds seems to evidence no substantial differences, especially for intermediate ranges, confirming the interpretation of outcomes in Figure 6 and Figure 10.
3.3. Normalized Speed Variation Modelling Depending on D, Minimum Constraint, and Maximum Excitement Conditions for the Considered Database
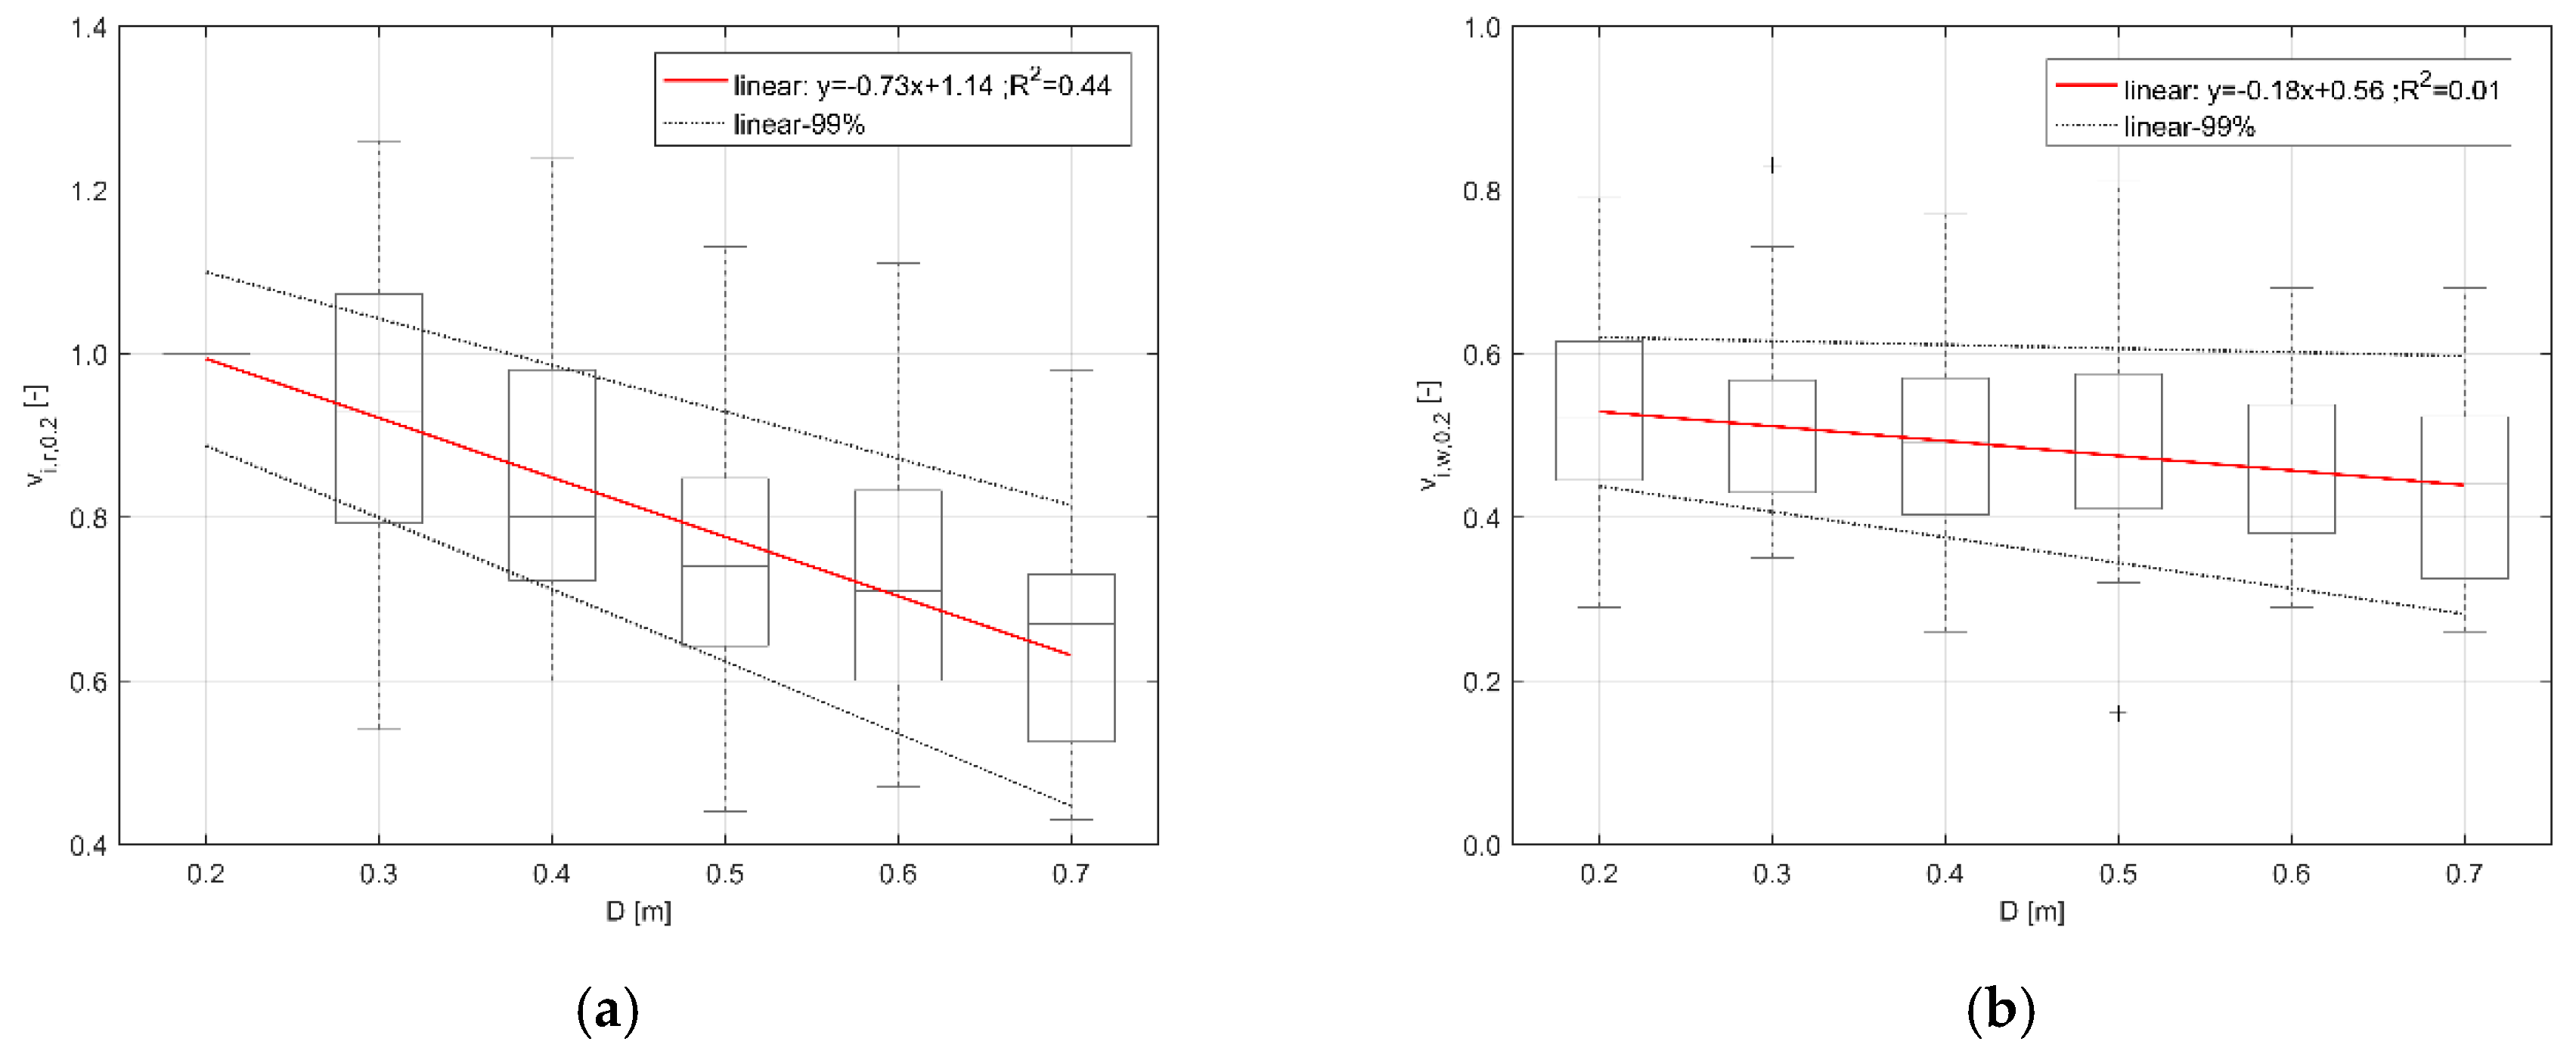
Figure 15 traces the normalized speed trends in respect to the minimum constraint-maximum excitement conditions (D = 0.2 m; running experiments), depending on D, for data concerning running (Figure 15a) and walking (Figure 15b) tests. Although the sample dimension is quite limited (31 individuals for 186 considered tests), the results confirm previous trends discussed in Section 3.2 concerning the speed reduction as a function of D increase.
In particular, Figure 15a evidences how the maximum motion speed is higher for lower D values in running conditions. Boxplot distribution data for D = 0.2 m are connected to the normalization of experimental speed by vr,0.2 (hence, all the values are equal to 1), but the maximum vi,r,0.2 values decrease while D increases. In addition, the median linear regression denotes a moderate relationship between D and vi,r,0.2, as shown by the R2 value. On the contrary, walking conditions-related speeds vi,w,0.2 seems to be less influenced by D, as demonstrated by the scattered boxplot values distribution and by the inconsistent R2 value.
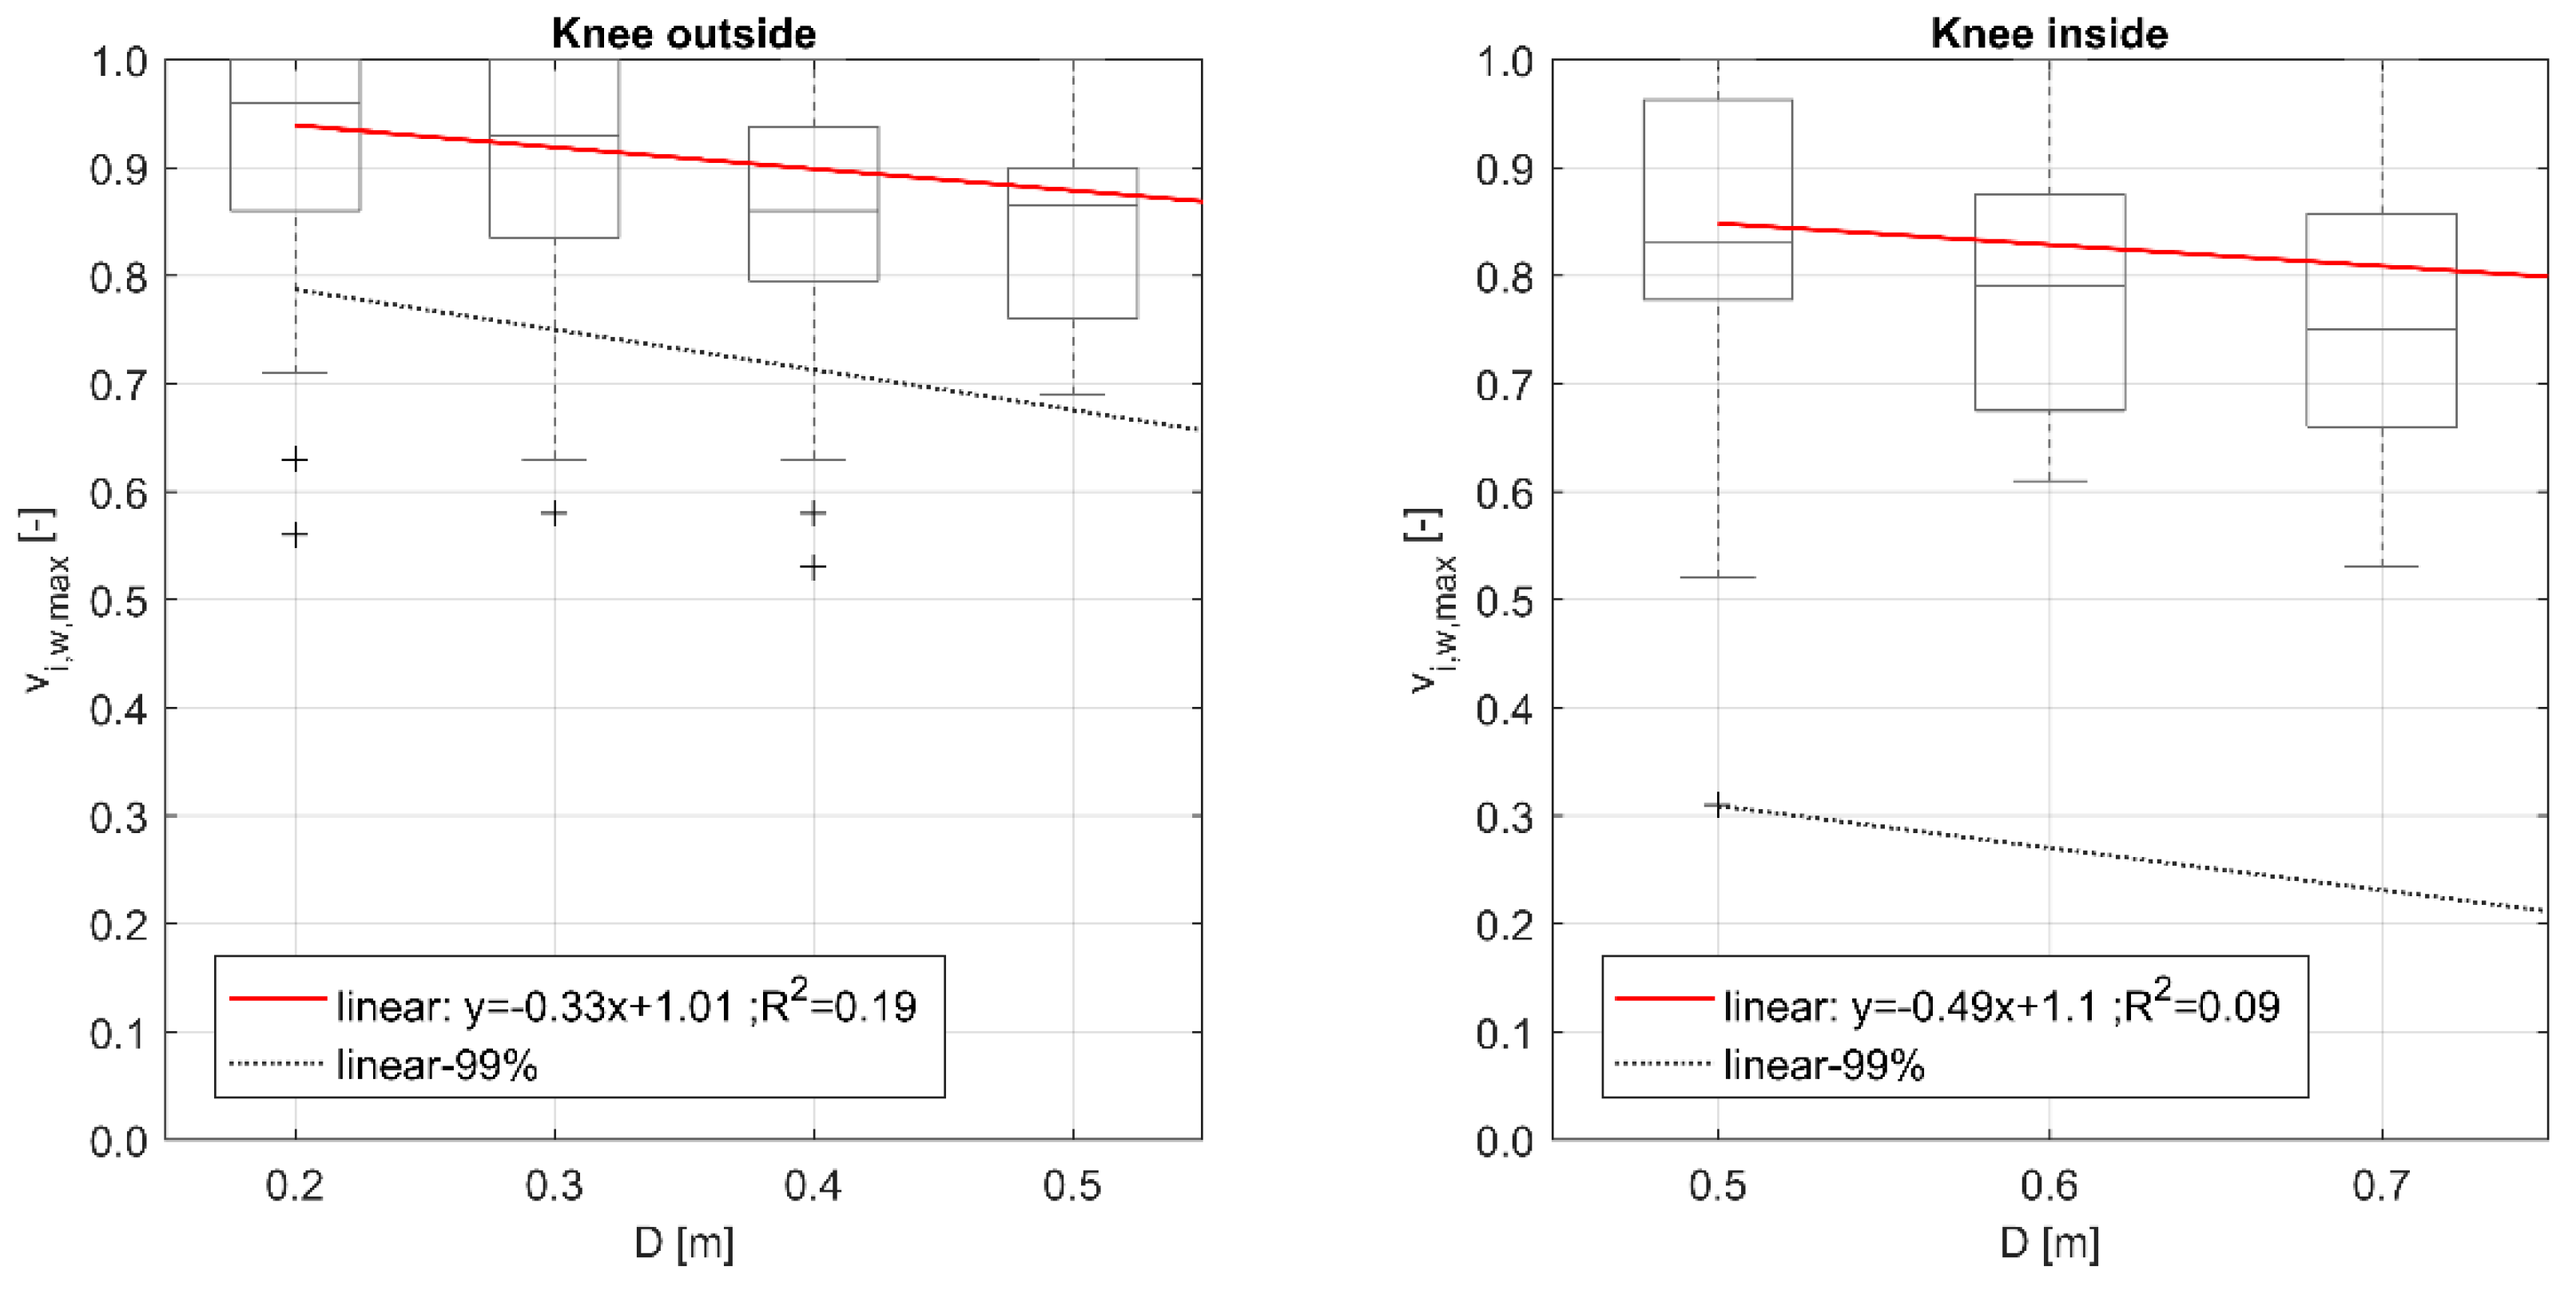
Finally, Figure 16 and Figure 17 examine the effect of Knee position in respect to the floodwater depth, respectively in running and walking conditions, by considering the normalization according to the individuals’ effective maximum speed within the tested D range. Although the regressions generally show a lower statistical significance according to poorer R2 values, it is demonstrated that:
In running conditions, most of vi,r,max values are linked to the lowest D values, while walking conditions see a more widespread vi,w,max distribution. This outcome evidences the existence of excitement-related issues (i.e., motion effort increasing with constraints increase) in pseudo-evacuation excitement conditions, in respect to normal excitement conditions (pseudo-evacuation conditions can be approximated by running test, while normal conditions by walking tests) [44,47].
- The effect of D on an individual’s speed is higher while the pedestrian is moving with the knee outside of the floodwater level, especially in running conditions as shown for the sub-sample with the knee inside the floodwater by: (a) the lower R2 value, (b) the wider range for boundary conditions (99%) regression lines, and (c) the lower first regression coefficient value (only for running conditions of Figure 16).
Such outcomes verify the results reported in Section 3.2 about the normalized speed variation modelling depending on D and the dry surface motion condition. Meanwhile, they use data on the experimental D range from individuals who performed all the tests (possibility to trace the individuals’ response in all the considered scenarios).
4. Results Discussion in View of Model Implementation in Flood Evacuation Simulators
The modelling approaches offered by this work represent different solutions for the implementation of quantitative behavioral response aspects (i.e., individuals’ speed) in flood evacuation simulators.
Firstly, all of them are based on a microscopic point of view and so they can be applied in such kind of simulation models [10,34,39,48]. According to this microscopic standpoint, they trace the “isolated” pedestrian speed by considering a single environmental driver, which is the floodwater depth and his/her specific features (mainly age, gender, and excitement level). In some terms, it could be defined as the ideal speed at which the evacuees try to tend. Anyway, in a real environment, this ideal speed could be affected by some other behavioral drivers [10,41], such as those described in Section 1.1. Hence, the final motion velocity (considering the speed (that is, the velocity magnitude), its direction, and its verse) of each individual should be calculated by overlapping all these phenomena. In this context, it is important to underline that some specific effects can provide consistent modifications to the effective motion velocity:
- Effects due to the presence of other pedestrians: crowd-density effects could reduce the speeds in compact groups; social shared identity factors could lead people to share the same direction and to adjust their individual speeds to remain in group (e.g., waiting for more vulnerable and slow group members);
- Guidance and support elements: they can speed up the process by giving continuous support to the evacuee in terms of direction to be followed and in terms of physical aid (e.g., handrails along the paths);
- Other flood-related phenomena like the attraction towards unmovable obstacles, according to the aforementioned support needs of the evacuees.
In view of the above, the proposed microscopic standpoint allows increasing the possibility of applying the proposed model to different modelling techniques (e.g., force-driven, velocity-driven, agent-based).
Secondly, most of the proposed modelling approaches also include specific individuals’ features, like age, gender and height. Such choice allows considering the possible variation in such parameters within the simulated population, especially while adopting agent-based modelling techniques [21,34].
Thirdly, the modelling approaches focus on the two different excitement conditions for pedestrians [41,43,44]:
- Input running conditions used in this study are similar to the one of excited individual, who, for instance, participate to an evacuation process with a high engagement level (e.g., because of rising floodwater levels or other hazard-increasing evacuation drivers perceived by the individuals);
- Input walking conditions used in this study are similar to the one of normal motion individual, who for instance, participate in an evacuation process in still waters, or under organized circumstances.
In this way, simulators could adopt the related models depending on the assumed excitement conditions (e.g., walking conditions imply the maximization of motion time, moving towards conservative evaluations). At the same time, simulations under different excitement levels could be performed to assess the alterations among them [41].
Finally, in view of the above, Table 1 and Table 2 summarize the selected modelling approaches (according to the model significance in terms of fitting performance and description of evacuation phenomena) that can be included in flood evacuation simulators, by distinguishing between:
- Dimensional models, which are the ones in which the dependent variables are directly expressed in dimensional terms (i.e., the dependent variable is a speed (m/s) (Table 1). These models allow tracing the simplest solutions to predict motion speed in flood evacuation according to a microscopic approach, by directly retrieving evacuation speed values in dimensional terms (m/s) only according to a single motion driver [41,43];
- Normalized models, which are the ones in which the dependent variables are a non-dimensional parameter vnorm (-) (Table 2). To calculate the effective motion speed, vnorm should be multiplied by the isolated individuals’ speed, which can be the one in (a) minimum constraint-maximum excitement conditions in the tested database (vr,0.2) or (b) dry surface motion (vid). Although the validity of the model application can be extended to different isolated pedestrians’ speed databases, the use of reference curves by this work for models development is encouraged especially in the second aforementioned case (i.e., [46], and so to vid,a, due to the higher statistical significance of results).
Finally, the proposed models focus on different drivers of human behaviors by confirming the existence of the main driver in individuals’ response while moving in floodwaters [6,9,10,33,44]. Nevertheless, it is worth noting that their statistical significance is strictly connected to the original database adopted by this work.
5. Conclusions and Future Research Remarks
The flood risk assessments in urban areas should consider the evaluation of hosted community’s exposure to possible emergency conditions, especially if considering the possible man-floodwaters interactions that play a pivotal role in immediate emergency scenarios, i.e., in the evacuation process. The effectiveness verification of emergency planning and other risk-mitigation strategies implemented in the built environment (BE) and oriented at direct support of the involved population should take advantage of simulation-based analysis.
This work offers a fundamental step toward this goal by providing general and unified modelling approaches to represent the individuals’ evacuation speed (m/s) depending on (a) his/her walking speeds (m/s) and gender, (b) the floodwater depth (m), (c) his/her age (years), and (d) the relative position between the knee height and the floodwater level (m). According to previous research outcomes, these models confirm how the individuals’ speed decreases when age and floodwater depths increase, while males generally seem to move faster than females. Moreover, they are generally characterized by moderate or strong relationship confidence degree, guaranteeing their applicability to modelling purposes. Finally, walking speeds can be evaluated by using inverse correlation modelling based on the proposed ones concerning running speed tests.
Although the used database is significant, different databases could be selected to collect input data and extend the validity of proposed regression models or compare/validate them. The considered original database describes characterization only in terms of floodwater depth. Hence, future research should try including additional significant variables, such as floodwater speed, sediment transport/mud presence. Additional experimental activities are needed to provide significant data to this end.
Besides, the current work is structured by defining regression models by preferring a continuous data existence field (for input and outputs). Nevertheless, widest databases could support the development of multiple linear models to derive the relationship between the moving speed and other factors (e.g., age, flood depth) one by one. Coherence models (e.g., regression tree-based) could be provided to have complete modelling result in a microscopic approach.
The proposed modelling approaches could be introduced in flood evacuation simulators by providing input data, which are more accurate than one of the general-purpose existing databases. Microscopic-based simulation tools can take advantage of this work’s outcomes since they assign evacuation quantities to each simulated individual and allow considering specific individuals’ features (i.e., age, gender, excitement level). The combination of behavioral simulation with flood spreading simulation in the BE could allow assessing the evacuation timing and so if/how many individuals could be exposed to significant risk depending on the floodwater hazard evaluation over space. Such simulators could additionally include rules for motor vehicle and public transport-based evacuation over time, to evidence which dependencies among effects could emerge about evacuation typologies and pedestrian-vehicle interactions. Finally, they could also support the analysis of First Responders’ motion in flood-affected scenarios during the emergency response phases.
From this point of view, risk assessment analyses for different flood events and in different BE layouts will be achieved to trace the effectiveness of risk-reduction interventions. Proposed risk reduction strategies could involve, e.g., early warning systems, interventions on buildings and architectural components in public spaces, emergency planning and management including the possibility to schedule (delay, anticipate, divide per areas) the evacuation starting, interventions for controlling floodwater spreading, and evacuees’ wayfinding systems. Furthermore, they could be combined with each other. Simulation-based approaches including the evacuation process will allow evaluating how such public efforts could effectively support efficiency gains also in case of risky conditions directly affecting the population and provoking the necessity to evacuate. The positioning over space of some solutions could be also evaluated.
Meanwhile, they will evaluate which are the minimum strategies that could be introduced in the BE, e.g., by moving towards minimum conditions in: (a) implementation costs (to reduce public efforts by local authorities), (b) management of complexity (to reduce the organizational efforts requested by the First Responders); (c) impact on the BE features (i.e., if considering historical urban heritage). In this sense, such kind of evaluation could be of interest especially in those urban scenarios where pedestrians could be caught in the middle of the flood “by surprise” (e.g., due to possible limitations in warning and communication with the population) as well as where difficulties due to social and economic factors could increase the overall urban risk (e.g., in underdeveloped countries).
Supplementary Materials
The following are available online at https://www.mdpi.com/2073-4441/12/5/1316/s1, manuscript-supplementary.xlsx: raw data (Excel file) used as the input reference for the model definition [44].
Author Contributions
Conceptualization, E.Q.; methodology, G.B. and E.Q.; validation, G.B. and E.Q.; formal analysis, G.B.; investigation, G.B.; resources, E.Q. and G.B.; data curation, G.B.; writing—original draft preparation, G.B.; writing—review and editing, E.Q. and G.B.; visualization, G.B.; supervision, E.Q.; project administration, E.Q.; funding acquisition, E.Q. All authors have read and agreed to the published version of the manuscript.
Funding
This research was funded by the scientific project “Building Resilience to Flood Impact Deriving from Global Warming in Europe (BRIDGE)” funded by the Polytechnic University of Marche internal program 2017/2018.
Conflicts of Interest
The authors declare no conflict of interest.
References
- Paquier, A.; Mignot, E.; Bazin, P.-H. From Hydraulic Modelling to Urban Flood Risk. Procedia Eng. 2015, 115, 37–44. [Google Scholar] [CrossRef]
- Kontokosta, C.E.; Malik, A. The Resilience to Emergencies and Disasters Index: Applying big data to benchmark and validate neighborhood resilience capacity. Sustainable Cities Soc. 2018, 36, 272–285. [Google Scholar] [CrossRef]
- Chen, K.F.; Leandro, J. A Conceptual Time-Varying Flood Resilience Index for Urban Areas: Munich City. Water 2019, 11, 830. [Google Scholar] [CrossRef] [Green Version]
- Hamilton, K.; Peden, A.E.; Pearson, M.; Hagger, M.S. Stop there’s water on the road! Identifying key beliefs guiding people’s willingness to drive through flooded waterways. Saf. Sci. 2016, 89, 308–314. [Google Scholar] [CrossRef] [Green Version]
- Jamrussri, S.; Toda, Y. Available Flood Evacuation Time for High-Risk Areas in the Middle Reach of Chao Phraya River Basin. Water 2018, 10, 1871. [Google Scholar] [CrossRef] [Green Version]
- Chanson, H.; Brown, R.; McIntosh, D. Human body stability in floodwaters: The 2011 flood in Brisbane CBD. In Proceedings of the Hydraulic Structures and Society—Engineering Challenges and Extremes: Proceedings of the 5th IAHR International Symposium on Hydraulic Structures (ISHS2014), Brisbane, Australia, 25–27 June 2014; The University of Queensland: Australia; pp. 1–9. [Google Scholar]
- Xia, J.; Falconer, R.A.; Lin, B.; Tan, G. Numerical assessment of flood hazard risk to people and vehicles in flash floods. Environ. Modell. Softw. 2011, 26, 987–998. [Google Scholar] [CrossRef]
- Milanesi, L.; Pilotti, M.; Ranzi, R. A conceptual model of people’s vulnerability to floods. Water Resour. Res. 2015, 51, 182–197. [Google Scholar] [CrossRef]
- Cox, R.J.; Shand, T.D.; Blacka, M.J. Australian Rainfall and Runoff Revision Project 10: Appropriate Safety Criteria for People; Engineers Australia—Water Engineering: Barton, ATC, Australia, 2010; ISBN 9780858259454. Available online: http://arr.ga.gov.au/__data/assets/pdf_file/0006/40578/ARR_Project_10_Stage1_report_Final.pdf (accessed on 4 May 2020).
- Bernardini, G.; Camilli, S.; Quagliarini, E.; D’Orazio, M. Flooding risk in existing urban environment: From human behavioral patterns to a microscopic simulation model. Energy Procedia 2017, 134, 131–140. [Google Scholar] [CrossRef]
- Hu, P.; Zhang, Q.; Shi, P.; Chen, B.; Fang, J. Flood-induced mortality across the globe: Spatiotemporal pattern and influencing factors. Sci. Total Environ. 2018, 643, 171–182. [Google Scholar] [CrossRef]
- Confederation of Fire Protection Associations Europe. European Guideline—CFPA-E No 1:2012 N Protection against Flood Damage; CFPA Europe: Copehangen, Denmark, 2012; Available online: http://www.cfpa-e.eu/wp-content/uploads/files/guidelines/CFPA_E_Guideline_No_1_2012_N.pdf (accessed on 4 May 2020).
- Arrighi, C.; Pregnolato, M.; Dawson, R.J.; Castelli, F. Preparedness against mobility disruption by floods. Sci. Total Environ. 2019, 654, 1010–1022. [Google Scholar] [CrossRef]
- Melo, R.; Zêzere, J.L.; Oliveira, S.C.; Garcia, R.A.C.; Oliveira, S.; Pereira, S.; Piedade, A.; Santos, P.P.; van Asch, T.W.J. Defining evacuation travel times and safety areas in a debris flow hazard scenario. Sci. Total Environ. 2020, 712, 136452. [Google Scholar] [CrossRef] [PubMed]
- Wood, N.; Jones, J.; Peters, J.; Richards, K. Pedestrian evacuation modeling to reduce vehicle use for distant tsunami evacuations in Hawai‘i. Int. J. Disaster Risk Reduction 2018, 28, 271–283. [Google Scholar] [CrossRef]
- Lin, J.; Zhu, R.; Li, N.; Becerik-Gerber, B. How occupants respond to building emergencies: A systematic review of behavioral characteristics and behavioral theories. Saf. Sci. 2020, 122, 104540. [Google Scholar] [CrossRef]
- Takagi, H.; Li, S.; de Leon, M.; Esteban, M.; Mikami, T.; Matsumaru, R.; Shibayama, T.; Nakamura, R. Storm surge and evacuation in urban areas during the peak of a storm. Coastal Eng. 2016, 108, 1–9. [Google Scholar] [CrossRef] [Green Version]
- Kolen, B.; van Gelder, P.H.A.J.M. Risk-Based Decision-Making for Evacuation in Case of Imminent Threat of Flooding. Water 2018, 10, 1429. [Google Scholar] [CrossRef] [Green Version]
- Kawasaki, A.; Kawamura, G.; Zin, W.W. A local level relationship between floods and poverty: A case in Myanmar. Int. J. Disaster Risk Reduction 2020, 42, 101348. [Google Scholar] [CrossRef]
- Fan, Q.; Tian, Z.; Wang, W. Study on Risk Assessment and Early Warning of Flood-Affected Areas when a Dam Break Occurs in a Mountain River. Water 2018, 10, 1369. [Google Scholar] [CrossRef] [Green Version]
- Bernardini, G.; Postacchini, M.; Quagliarini, E.; Brocchini, M.; Cianca, C.; D’Orazio, M. A preliminary combined simulation tool for the risk assessment of pedestrians’ flood-induced evacuation. Environ. Modell. Softw. 2017, 96, 14–29. [Google Scholar] [CrossRef]
- Ishigaki, T.; Toda, K.; Baba, Y.; Inoue, K.; Nakagawa, H.; Yoshida, Y.; Tagawa, H. Experimental study on evacuation from underground space by using real size models. Proc. Hydraul. Eng. 2006, 50, 583–588. [Google Scholar] [CrossRef]
- Wu, J.; Ye, M.; Wang, X.; Koks, E. Building Asset Value Mapping in Support of Flood Risk Assessments: A Case Study of Shanghai, China. Sustainability 2019, 11, 971. [Google Scholar] [CrossRef] [Green Version]
- Morelli, S.; Segoni, S.; Manzo, G.; Ermini, L.; Catani, F. Urban planning, flood risk and public policy: The case of the Arno River, Firenze, Italy. Appl. Geogr. 2012, 34, 205–218. [Google Scholar] [CrossRef]
- Milman, A.; Warner, B.P. The interfaces of public and private adaptation: Lessons from flooding in the Deerfield River Watershed. Glob. Environ. Chang. 2016, 36, 46–55. [Google Scholar] [CrossRef]
- Hissel, F.; Morel, G.; Pescaroli, G.; Graaff, H.; Felts, D.; Pietrantoni, L. Early warning and mass evacuation in coastal cities. Coastal Eng. 2014, 87, 193–204. [Google Scholar] [CrossRef]
- Wang, Y. Advances in Remote Sensing of Flooding. Water 2015, 7, 6404–6410. [Google Scholar] [CrossRef]
- Bodoque, J.M.; Amérigo, M.; Díez-Herrero, A.; García, J.A.; Cortés, B.; Ballesteros-Cánovas, J.A.; Olcina, J. Improvement of resilience of urban areas by integrating social perception in flash-flood risk management. J. Hydrol. 2016. [Google Scholar] [CrossRef] [Green Version]
- Birkholz, S.; Muro, M.; Jeffrey, P.; Smith, H.M. Rethinking the relationship between flood risk perception and flood management. Sci. Total Environ. 2014, 478, 12–20. [Google Scholar] [CrossRef]
- Haer, T.; Botzen, W.J.W.; Aerts, J.C.J.H. The effectiveness of flood risk communication strategies and the influence of social networks—Insights from an agent-based model. Environ. Sci. Policy 2016, 60, 44–52. [Google Scholar] [CrossRef]
- Opper, S.; Cinque, P.; Davies, B. Timeline modelling of flood evacuation operations. Procedia Eng. 2010, 3, 175–187. [Google Scholar] [CrossRef] [Green Version]
- Jonkman, S.N.; Maaskant, B.; Boyd, E.; Levitan, M.L. Loss of life caused by the flooding of New Orleans after Hurricane Katrina: Analysis of the relationship between flood characteristics and mortality. Risk Anal. 2009, 29, 676–698. [Google Scholar] [CrossRef]
- Ishigaki, T.; Onishi, Y.; Asai, Y.; Toda, K.; Shimada, H. Evacuation criteria during urban flooding in underground space. In Proceedings of the 11th International Conference on Urban Drainage, Scotland, UK, 31 August–5 September 2008; p. 7. [Google Scholar]
- Matsuo, K.; Natainia, L.; Yamada, F. Flood and Evacuation Simulations for Urban Flooding. In Proceedings of the 5th International Conference on Flood Management, Tokyo, Japan, 27–29 September 2011; pp. 391–398. [Google Scholar]
- Veeraswamy, A.; Galea, E.R.; Filippidis, L.; Lawrence, P.J.; Haasanen, S.; Gazzard, R.J.; Smith, T.E.L. The simulation of urban-scale evacuation scenarios with application to the Swinley forest fire. Saf. Sci. 2018, 102, 178–193. [Google Scholar] [CrossRef]
- Zlateski, A.; Lucesoli, M.; Bernardini, G.; Ferreira, T.M. Integrating human behaviour and building vulnerability for the assessment and mitigation of seismic risk in historic centres: Proposal of a holistic human-centred simulation-based approach. Int. J. Disaster Risk Reduction 2020, 43, 101392. [Google Scholar] [CrossRef]
- Ronchi, E.; Uriz, F.N.; Criel, X.; Reilly, P. Modelling large-scale evacuation of music festivals. Case Stud. Fire Saf. 2015, 5, 11–19. [Google Scholar] [CrossRef] [Green Version]
- Kim, K.; Pant, P.; Yamashita, E. Integrating travel demand modeling and flood hazard risk analysis for evacuation and sheltering. Int. J. Disaster Risk Reduction 2018, 31, 1177–1186. [Google Scholar] [CrossRef]
- Lämmel, G.; Grether, D.; Nagel, K. The representation and implementation of time-dependent inundation in large-scale microscopic evacuation simulations. Transp. Res. Part C Emerg. Technol. 2010, 18, 84–98. [Google Scholar] [CrossRef] [Green Version]
- Bolia; Lakshay, N.B. Operating strategies of buses for mass evacuation. Saf. Sci. 2019, 111, 167–178. [Google Scholar] [CrossRef]
- Lakoba, T.I.; Kaup, D.J.; Finkelstein, N.M. Modifications of the Helbing-Molnar-Farkas-Vicsek Social Force Model for Pedestrian Evolution. Simulation 2005, 81, 339–352. [Google Scholar] [CrossRef]
- Lee, H.-K.; Hong, W.-H.; Lee, Y.-H. Experimental study on the influence of water depth on the evacuation speed of elderly people in flood conditions. Int. J. Disaster Risk Reduction 2019, 39, 101198. [Google Scholar] [CrossRef]
- Bosina, E.; Weidmann, U. Estimating pedestrian speed using aggregated literature data. Physica A: Stat. Mech. Its Appl. 2017, 468, 1–29. [Google Scholar] [CrossRef]
- Bernardini, G.; Quagliarini, E.; D’Orazio, M.; Brocchini, M. Towards the simulation of flood evacuation in urban scenarios: Experiments to estimate human motion speed in floodwaters. Saf. Sci. 2020, 123, 104563. [Google Scholar] [CrossRef]
- Herman, I.P. Physics of the Human Body. In Biological and Medical Physics, Biomedical Engineering; Springer International Publishing: Cham, Switzerland, 2016; ISBN 978-3-319-23930-9. [Google Scholar]
- Weidmann, U. Transporttechnik der Fußgänger—Transporttechnische Eigenschaften des Fussgängerverkehrs (Literaturauswertung); Zweite ergänzte Auflage. Schriftenreihe des IVT 90, Institut für Verkehrsplanung, Transporttechnik, Strassen-und Eisenbahnbau, ETH Zürich: Zürich, Switzerland, 1993. [Google Scholar] [CrossRef]
- Lu, X.; Yang, Z.; Cimellaro, G.P.; Xu, Z. Pedestrian evacuation simulation under the scenario with earthquake-induced falling debris. Saf. Sci. 2019, 114, 61–71. [Google Scholar] [CrossRef]
- Parisi, D.R.; Dorso, C.O. Microscopic dynamics of pedestrian evacuation. Phys. A Stat. Mech. Its Appl. 2005, 354, 606–618. [Google Scholar] [CrossRef]
Figure 1.
Reference curves for speed normalization depending on the individuals’ age according to: (a) the curve a, to derive vid,a [46] and (b) to the curve b, to derive vid,b [43].

Figure 2.
Database characterization depending on K-D versus the tested D values. The boxplot graph includes possible outliers (shown by “+”). The linear regression and the 99% boundaries are shown.
Figure 2.
Database characterization depending on K-D versus the tested D values. The boxplot graph includes possible outliers (shown by “+”). The linear regression and the 99% boundaries are shown.

Figure 3.
Database characterization depending on vw,exp and vr,exp pairs, for each individual, by distinguishing females (continuous red line) and males (dashed blue line) linear regressions and related samples.
Figure 3.
Database characterization depending on vw,exp and vr,exp pairs, for each individual, by distinguishing females (continuous red line) and males (dashed blue line) linear regressions and related samples.

Figure 4.
Database characterization depending on vw,exp and vr,exp pairs, for each individual, by distinguishing the linear regressions for each of the tested D. The regression equations are shown as a function of the respective vw,exp for the considered D value (subscript expressed in (cm)).
Figure 4.
Database characterization depending on vw,exp and vr,exp pairs, for each individual, by distinguishing the linear regressions for each of the tested D. The regression equations are shown as a function of the respective vw,exp for the considered D value (subscript expressed in (cm)).

Figure 5.
Normalized speed variation for running conditions depending on D in respect to dry surface motion conditions, for the whole sample (male and female together): (a) according to the curve a [46]; (b) according to the curve b [43]. Linear regressions (dashed lines refer to prevised values outside of the tested D range) and boundary conditions (99%) are shown. Outliers are shown in the boxplot representation (marked by “+”).

Figure 6.
Normalized speed variation for walking conditions depending on D in respect to dry surface motion conditions, for the whole sample (male and female together): (a) according to the curve a [46]; (b) according to the curve b [43]. Linear regressions (dashed lines refer to prevised values outside of the tested D range) and boundary conditions (99%) are shown. Outliers are shown in the boxplot representation (marked by “+”).

Figure 7.
Normalized speed variation depending on D in respect to dry surface motion conditions, for the male sample: (a) for running conditions, according to the curve a [46]; (b) for running conditions, according to the curve b [43]; (c) for walking conditions, according to the curve a [46]; (d) for walking conditions, according to the curve b [43]. Linear regressions (dashed lines refer to expected values outside of the tested D range) and boundary conditions (99%) are shown. Outliers are shown in the boxplot representation (marked by “+”).

Figure 8.
Normalized speed variation depending on D in respect to dry surface motion conditions, for the female sample: (a) for running conditions, according to the curve a [46]; (b) for running conditions, according to the curve b [43]; (c) for walking conditions, according to the curve a [46]; (d) for walking conditions, according to the curve b [43]. Linear regressions (dashed lines refer to expected values outside of the tested D range) and boundary conditions (99%) are shown. Outliers are shown in the boxplot representation (marked by “+”).

Figure 9.
Normalized speed variation for running conditions depending on K-D in respect to dry surface motion conditions, for the whole sample (male and female together): (a) according to the curve a [46]; (b) according to the curve b [43]. Linear regressions (dashed lines refer to expected values outside of the tested D range) and boundary conditions (99%) are shown. Male and female samples experimental pairs are shown.

Figure 10.
Normalized speed variation for walking conditions depending on K-D in respect to dry surface motion conditions, for the whole sample (male and female together): (a) according to the curve a [46]; (b) according to the curve b [43]. Linear regressions (dashed lines refer to expected values outside of the tested D range) and boundary conditions (99%) are shown. Male and female samples experimental pairs are shown.

Figure 11.
Average dimensional age-evacuation speed (m/s) model in running conditions, for the different D values according to a polynomial (4th degree) regression model, performed on all the experimental pairs (male and female together): (a) compared to the curve a [46]; (b) compared to the curve b [43].

Figure 12.
Average dimensional age-evacuation speed (m/s) model in walking conditions, for the different D values according to a polynomial (4th degree) regression model, performed on all the experimental pairs (male and female together): (a) compared to the curve a [46]; (b) compared to the curve b [43].

Figure 13.
Maximum dimensional age-evacuation speed (m/s) model in running conditions, for the different D values according to a polynomial (4th degree) regression model, performed on all the experimental pairs (male and female together): (a) compared to the curve a [46]; (b) compared to the curve b [43].

Figure 14.
Average dimensional age-evacuation speed (m/s) model in walking conditions, for the different D values according to a polynomial (4th degree) regression model, performed on all the experimental pairs (male and female together): (a) compared to the curve a [46]; (b) compared to the curve b [43].

Figure 15.
Normalized speed variation depending on D, by normalizing the speed values by vr,0.2 (speed of the individual in minimum constraint and maximum excitement conditions within the tested D range): (a) for running conditions; (b) for walking conditions. Linear regressions (dashed lines refer to prevised values outside of the tested D range) and boundary conditions (99%) are shown.

Figure 16.
Effects of knee position (outside and inside the floodwater level) on the normalized speed variation depending on D, by normalizing the speed values by vr,max. The regressions are shown for running conditions. Linear regressions (dashed lines refer to prevised values outside of the tested D range) and boundary conditions (99%) are shown.

Figure 17.
Effects of knee position (outside and inside the floodwater level) on the normalized speed variation depending on D, by normalizing the speed values by vw,max. The regressions are shown for walking conditions. Linear regressions (dashed lines refer to prevised values outside of the tested D range) and boundary conditions (99%) are shown.


Table 1.
Selected modelling approaches based on dimensional dependent variables.
| Independent Variables (unit of measure) | Dependent Variable (unit of measure) | Regression Model (sample) 1,2 | R2 1 | Specific Discussion |
|---|---|---|---|---|
| walking speed vw,exp (m/s); gender (F or M) | running speed vr,exp (m/s) | vr,exp = 1.6vw,exp (F) vr,exp = 1.76vw,exp (M) | ≈0.5 | Figure 3, Section 3.1 |
| walking speed vw,exp (m/s); floodwater depth D (m) | running speed vr,exp (m/s) | D = 0.2 m: vr,exp = 1.89vw,exp (A) D = 0.3 m: vr,exp = 1.83vw,exp (A) D = 0.4 m: vr,exp = 1.67vw,exp (A) D = 0.5 m, 0.6 m: vr,exp = 1.56vw,exp (A) D = 0.7 m: vr,exp = 1.48vw,exp (A) | ≈0.5 | Figure 4, Section 3.1 |
| age (years) | “maximum” running speed vr,exp (m/s) | 4th polynomial regression model graphically traced in Figure 13 | >0.7 | Figure 13, Section 3.2 |
| age (years) | “maximum” walking speed vr,exp (m/s) | 4th polynomial regression model graphically traced in Figure 14 | >0.7 | Figure 14, Section 3.2 |
1 Coefficients are valid for the considered sample; further activities should be performed to check their validity. 2 F refers to female sample, M refers to male sample, A refers to both male and female samples together.
Table 2.
Selected modelling approaches based on non-dimensional dependent variables. In the regression model column, the expression inside round brackets is vnorm.
Table 2.
Selected modelling approaches based on non-dimensional dependent variables. In the regression model column, the expression inside round brackets is vnorm.
| Independent Variables (Unit of Measure) | Dependent Variable (Unit of Measure) | vnorm Regression Model (Sample) 1,2 | R2 1 | Specific Discussion |
|---|---|---|---|---|
| floodwater depth D (m) | running speed vr (m/s) | vr = (−0.85D + 1.28)vid,a (A) | ≈0.5 | Figure 5a, Section 3.2 |
| floodwater depth D (m) | walking speed vw (m/s) | vw = (−0.25D + 0.64)vid,a (A) | ≈0.6 | Figure 6a, Section 3.2 |
| floodwater depth D (m); gender (F or M) | running speed vr (m/s) | vr = (−0.86D + 1.23)vid,a (F) vr = (−0.86D + 1.33)vid,a (F) | >0.5 | Figure 7a and Figure 8a, Section 3.2 |
| relative position between the knee height and the floodwater level K-D (m) | running speed vr (m/s) | vr = (−0.86D + 0.86)vid,a (A) | ≈0.6 | Figure 9a, Section 3.2 |
| relative position between the knee height and the floodwater level K-D (m) | walking speed vw (m/s) | vw = (−0.25D + 0.51)vid,a (A) | ≈0.6 | Figure 10a, Section 3.2 |
| floodwater depth D (m) | running speed 3 vr (m/s) | vr = (−0.73D + 1.14)vr,0.2 (A) | ≈0.4 | Figure 15a, Section 3.3 |
1 Coefficients are valid for the considered sample; further activities should be performed to check their validity. 2 F refers to female sample, M refers to male sample, A refers to both male and female samples together. 3 This model considers the original database-related speed and not the reference curve as the multiplication value of vnorm.
© 2020 by the authors. Licensee MDPI, Basel, Switzerland. This article is an open access article distributed under the terms and conditions of the Creative Commons Attribution (CC BY) license (http://creativecommons.org/licenses/by/4.0/).
Share and Cite
MDPI and ACS Style
Bernardini, G.; Quagliarini, E. How to Account for the Human Motion to Improve Flood Risk Assessment in Urban Areas. Water 2020, 12, 1316. https://doi.org/10.3390/w12051316
AMA Style
Bernardini G, Quagliarini E. How to Account for the Human Motion to Improve Flood Risk Assessment in Urban Areas. Water. 2020; 12(5):1316. https://doi.org/10.3390/w12051316
Chicago/Turabian StyleBernardini, Gabriele, and Enrico Quagliarini. 2020. "How to Account for the Human Motion to Improve Flood Risk Assessment in Urban Areas" Water 12, no. 5: 1316. https://doi.org/10.3390/w12051316
Note that from the first issue of 2016, this journal uses article numbers instead of page numbers. See further details here.