Assessing Impact of Climate Change on Hydrology of Melka Kuntrie Subbasin, Ethiopia with Ar4 and Ar5 Projections


1
Taiwan International Graduate Program (TIGP), Earth System Science Program, Academia Sinica, Taipei 115, Taiwan
2
Graduate Institute of Hydrological and Oceanic Sciences, National Central University, Taoyuan 320, Taiwan
3
College of Agriculture and Natural Resource Sciences, Debre Berhan University, Debre Berhan P.O. Box 445, Ethiopia
*
Author to whom correspondence should be addressed.
Water 2020, 12(5), 1308; https://doi.org/10.3390/w12051308
Submission received: 16 March 2020
/
Revised: 23 April 2020
/
Accepted: 1 May 2020
/
Published: 5 May 2020
(This article belongs to the Section Hydrology)
Abstract
:Assessing future challenges in water resources management is crucial to the Melka Kuntrie (MK) subbasin suffering water shortage. Impact assessments are evaluated by the HBV hydrological model with six scenarios, including two GCMs of AR4-A2 and two GCMs of AR5-RCP4.5 and RCP8.5, for the time periods 2021–2050 and 2071–2100. Evapotranspiration is expected to increase under all scenarios—due to rising temperature—and induce more water stress on rainfed agriculture of the area. However, the increase in the monthly minimum temperature is beneficial to crops against chilling damages. Five out of six projections show significant increases of rainfall and streamflow in both annual and major rainy seasons, except ECHAM-A2. Annual rainfall (streamflow) is expected to increase by 38% (23%) and 57% (49%) during 2021–2050 and 2071–2100, respectively, under RCP8.5 scenarios. Greater flashflood risk is a concern because of the projected increase in streamflow. The projection of decreased streamflow with ECHAM-A2 will exacerbate the existing water shortage, especially in the minor rainy season. Water harvesting during the major rainy season would be vital to enhance water management capacities and reduce flashflood risks. Lacking sufficient hydraulic and irrigation infrastructures, the MK subbasin will be more vulnerable to the impacts of climate change.
1. Introduction
The agricultural sectors mostly reliant on seasonal rainfalls are very vulnerable to climate change [1,2,3,4]. For example, the community’s livelihood in the Melka Kuntrie (MK) subbasin, located in the upper Awash river basin in Ethiopia, is highly dependent on seasonal rainfed agriculture [5,6]. Climate change affecting the rainfall distribution pattern and influencing the hydrological cycle has been a huge challenge to the region [7,8,9,10]. Based on the paleoclimate record from the last 2000 years, the Horn of Africa was drier when there were warmer conditions on Earth, and wetter when it was colder [11]. Global assessment of trends in wetting and drying over land showed the aridity changes in most regions were not following a simplified intensification of existing dryness trends based on the 1948 to 2005 records [12] and 1979–2013 records [13], showing an inconsistent drying trend over the Horn of Africa. It was also reported that the present dryness in the region might be attributed to the influence of recurrent El Niño-Southern Oscillation (ENSO) [14]. The observed inconsistency between the historical rainfall decreasing trend and the General Circulation Models (GCMs) projection over the region is still highly debatable [14,15,16]. Nevertheless, the changing climate and variability are making the East African region more vulnerable to frequent droughts and flash floods in the present decades [17,18,19].
Temperature is expected to rise at different speeds everywhere, but the increased moisture due to the rising temperature does not necessarily fall evenly. Some areas are expected to havean increase in precipitation, while other areas will have less [20,21]. Similarly, the hydrological cycle of a basin is also sensitive to climate change. Some river basins exhibit excess flow, while others are having low flow [22,23,24]. Rainfall projections from different GCMs scenarios in the East Africa are uncertain on trends and magnitudes. For example, the streamflow of the Nile basin is expected to decrease in the upcoming years [25,26,27,28,29,30]; while the other studies show the streamflow of the Nile basin is estimated to increase for the coming decades [31,32,33]. Rapid population growth and different purposes of water usage have further exacerbated the water scarcity problem in the East Africa [34,35].
There were only a few climate change impact studies conducted for the upper Awash river basin, even more less for the MK subbasin. Increased streamflow due to excess rainfall is expected for the Hombole subbasin, also located in the upper Awash [36]. However, the decreased trends in historical rainfall were observed for the entire Awash river basin, showing high climate variability and raising concerns of food insecurity and intensifying current water shortage [37,38]. For better planning of adaption measures for the future, it is crucial to assess the impact of climate change on the hydrology of the MK subbasin.
Recent developments of the Regional Climate Models (RCMs) provide information with better spatial resolutions to support more detailed impact assessment in climate studies. For example, the CORDEX (https://cordex.org) database contains several bias-corrected RCMs downscaled data, driven by GCMs projections, with different spatial resolutions much finer than those of the GCMs. In some cases, such a GCM_RCM strategy is beneficial to systematically reducing the biases and modifying climate change signals of the driving GCMs [39]. However, the downscaled climate signals of different RCMs can vary substantially even when the same GCM are adopted, especially in tropical domains (e.g., Africa) [40,41]. Before applying the RCM-based or the GCM-based information to impact assessment, regional climate signals captured by GCMs or RCMs baseline should be carefully examined with sufficient observations of the study area.
The Special Report on Emissions Scenarios (SRES) of the Fourth Assessment Report (AR4), referred to as the Coupled Model Intercomparison Project Phase 3 (CMIP3), was released in 2007 [42]; and the updated Representative Concentration Pathways (RCPs) of the Fifth Assessment Report (AR5), known as the Coupled Model Intercomparison Project Phase 5 (CMIP5), was released in 2013 [43]. A wide range of scientific and socioeconomic data, such as population growth, GDP, air pollution, land use and energy sources, were revised and synthesized in CMIP5 [44,45]. The AR5 findings were compared for similarities in climate projections with those from the AR4 for global and regional aspects [46]. Assumptions of scenario drivers of the RCP8.5, such as socioeconomic trends and technological change, are revised based on the extended storyline of the A2 scenario, and both have a similar trajectory of reaching about 8 W/m2 by 2100 [42,43]. The likely range of global mean surface temperature will increase 3.8 °C–5.7 °C, 2.0 °C–2.9 °C, and 2.5 °C–5.9 °C under the RCP8.5, RCP4.5, and A2 scenarios, respectively, by 2100 [47]. Temperature projections of A2 is similar to those of RCP8.5 in terms of changes in global mean temperature. On the other hand, rainfall projections are more uncertain than temperature projections, commonly found under AR4 and AR5 scenarios. Precipitations over the East Africa are likely to increase under both AR4 and AR5 scenarios, but have distinct spatial and temporal variations among different models and scenarios [42,43].
The main objective of this study is to assess the expected changes in streamflow of the MK subbasin simulated by Hydrologiska Byråns Vattenbalansavdelning (HBV) hydrological model under six climate change scenarios. Four GCMs were adopted in this study: two GCMs from AR4 A2 scenario, and two GCMs from AR5 RCP8.5 and RCP4.5 scenarios (i.e., a total of six scenarios) for the projection periods of 2021–2050 and 2071–2100. GCMs information are bias-corrected and downscaled to a spatial resolution of 0.5° prior to performing impact assessments. Comparisons of our findings, including projected changes in rainfall, temperature and streamflow, with recent studies in the Awash basin and neighboring subbasins will be discussed to complement or extend current knowledge on climate change in Ethiopia. The rainfall anomalies associated with the changing climate has been making water resource management more challenging in the MK subbasin. Thus, it is necessary to carry out this kind of study in a regular manner to understand the impact of climate change on water resources. It will help improving water management practice, policy making and the planning of adaptation measures in the MK subbasin.
2. Materials and Methods
2.1. The Study Area
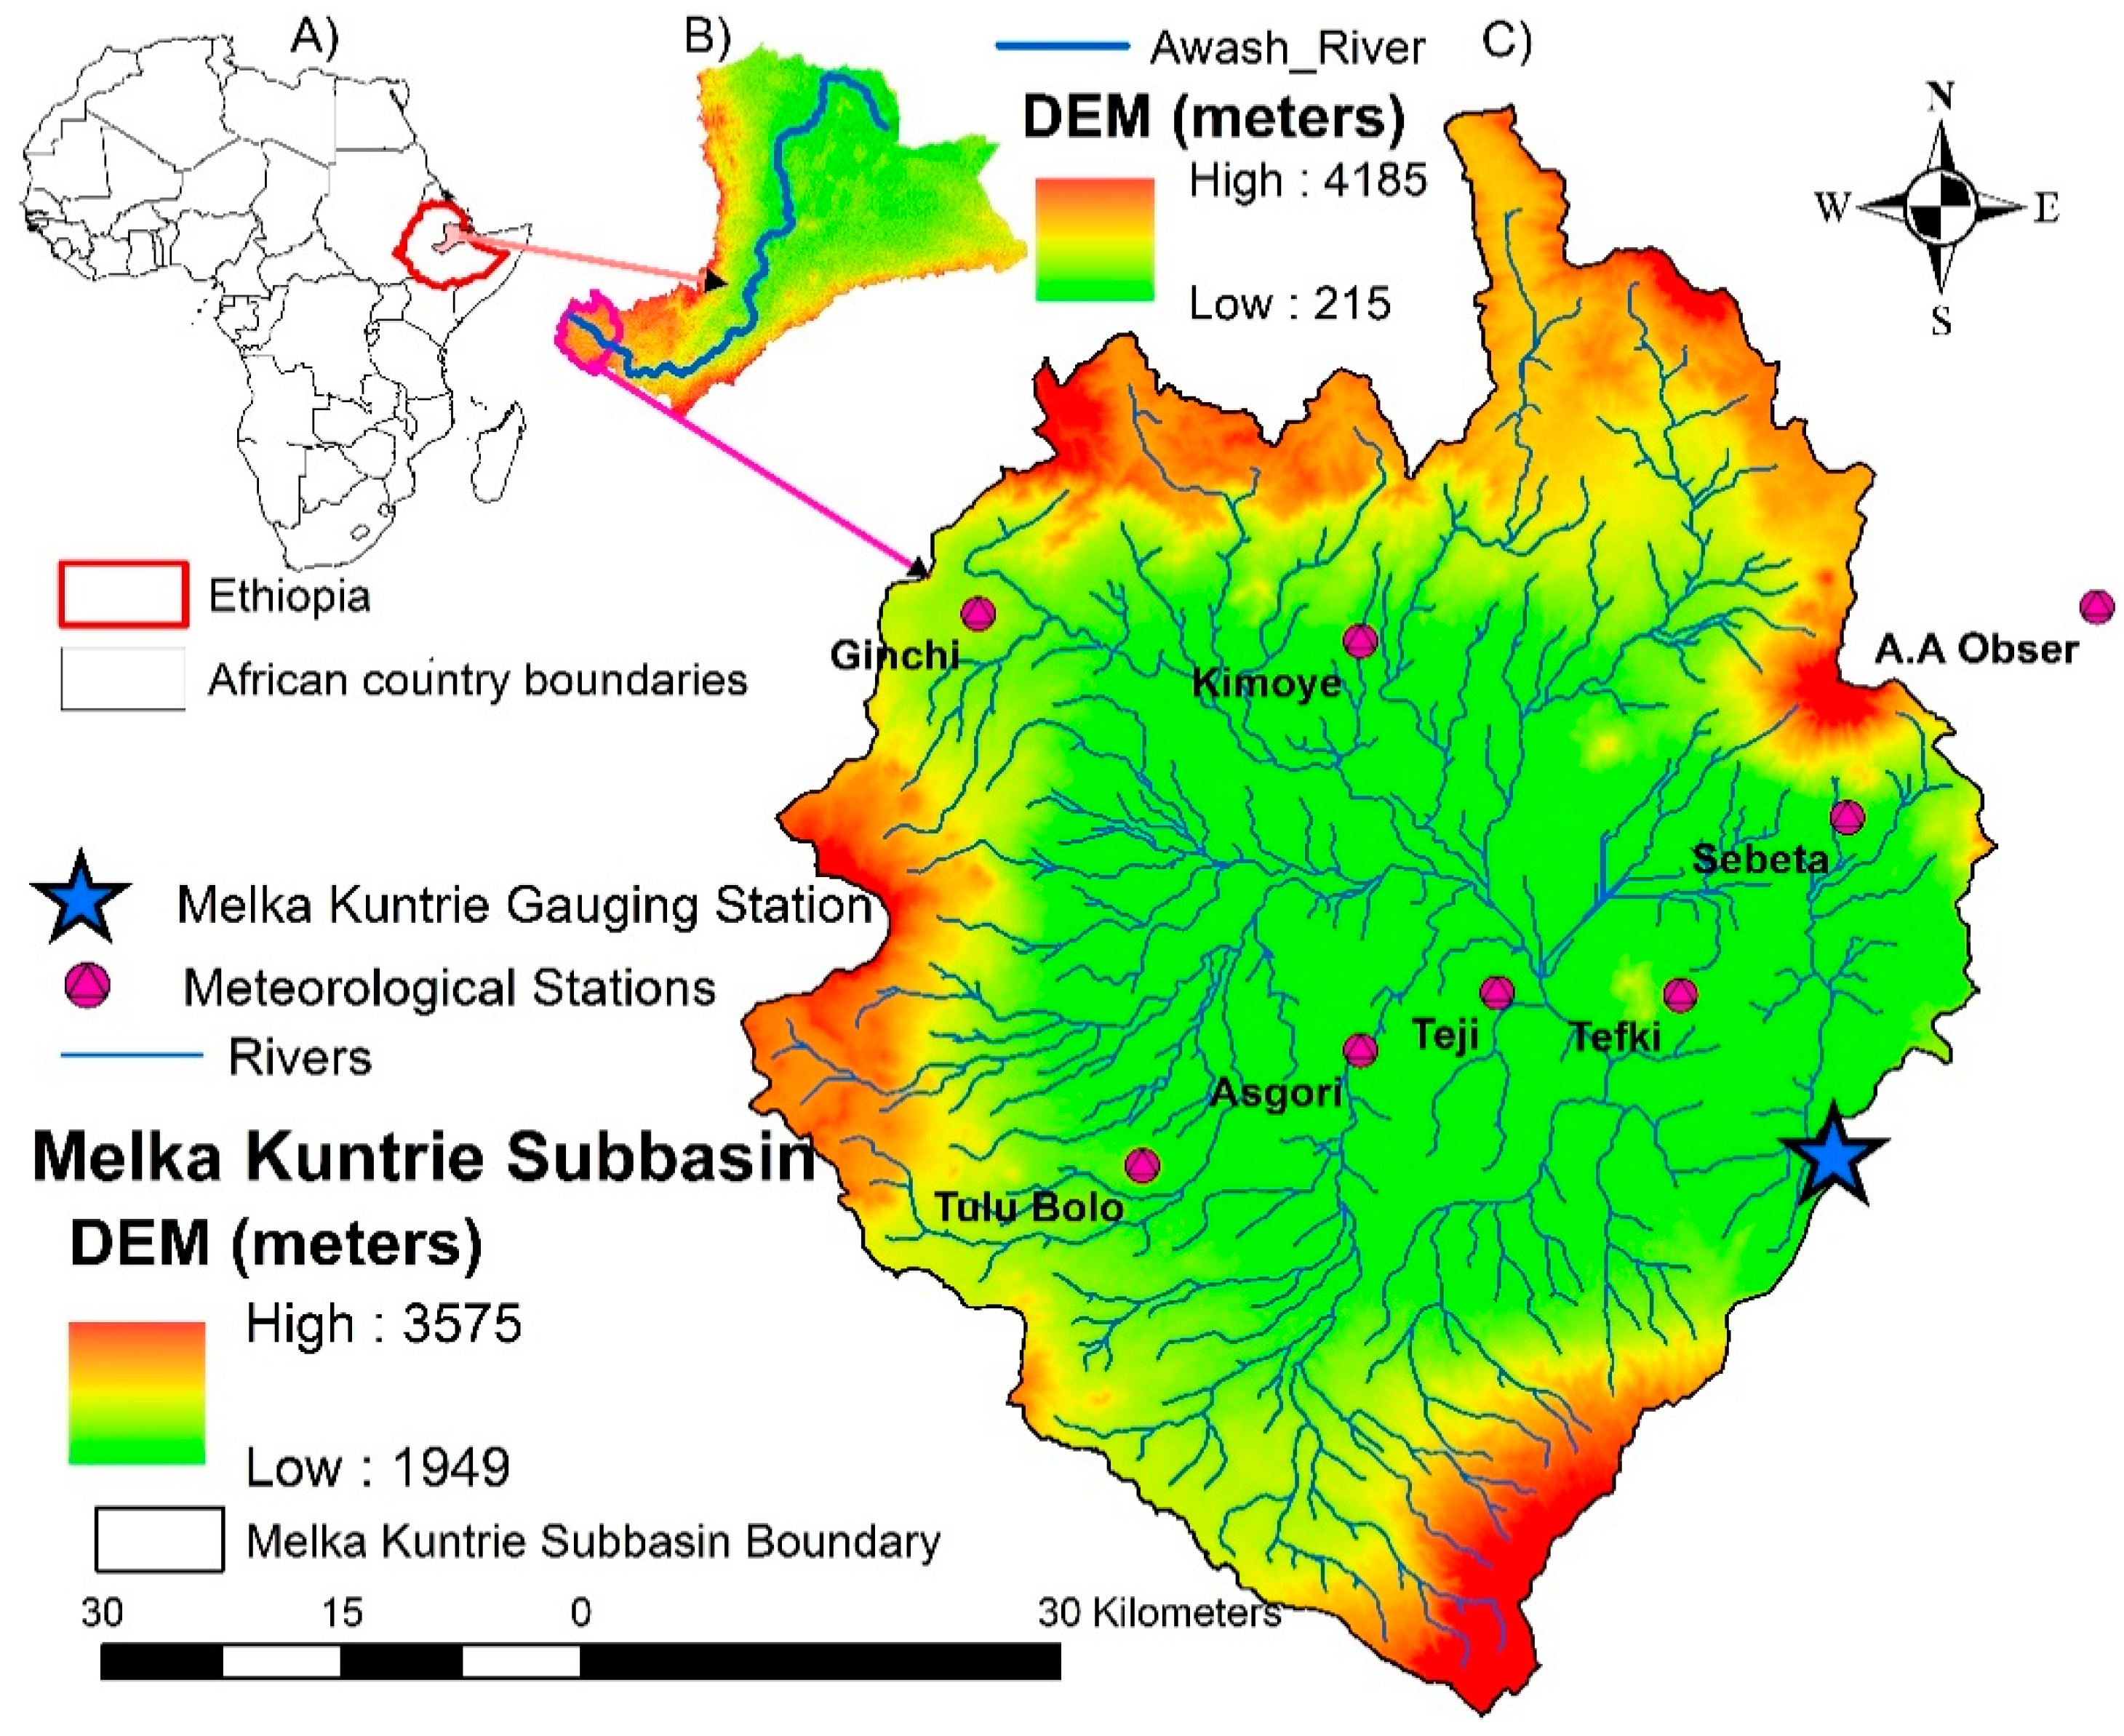
The Awash river basin is located between 7°52′–12° N and 37°57′–43°25′ E. The total Awash river has a length of 1200 km and a drainage area of 116,374 km2. The Awash river basin is the fourth largest basin in Ethiopia and the seventh in annual runoff of 4.6 billion m3 [48]. The river rises on the high plateau near Ginchi town and flows along the Rift Valley. It terminates in the Lake Abbe on the border with Djibouti [49]. The study area of Melka Kuntrie (MK) subbasin is located between 7°52′–9.3° N and 37°57′–38°7′ E, which is the most upstream part of the Awash river basin. The drainage area of MK subbasin is 4456 km2, with elevations ranging from 1949 m to 3575 m (Figure 1). The MK subbasin was selected for this study because of its high population density, diverse ecology and mainly rainfed agriculture, which is highly vulnerable to the changing climate [50]. The MK subbasin is the most urbanized and industrial area of the country, in which the capital city Addis Ababa is located. The availability of better (quality, dense stations) and long-term observed hydro-meteorological datasets were other reasons to select the MK subbasin for this study.
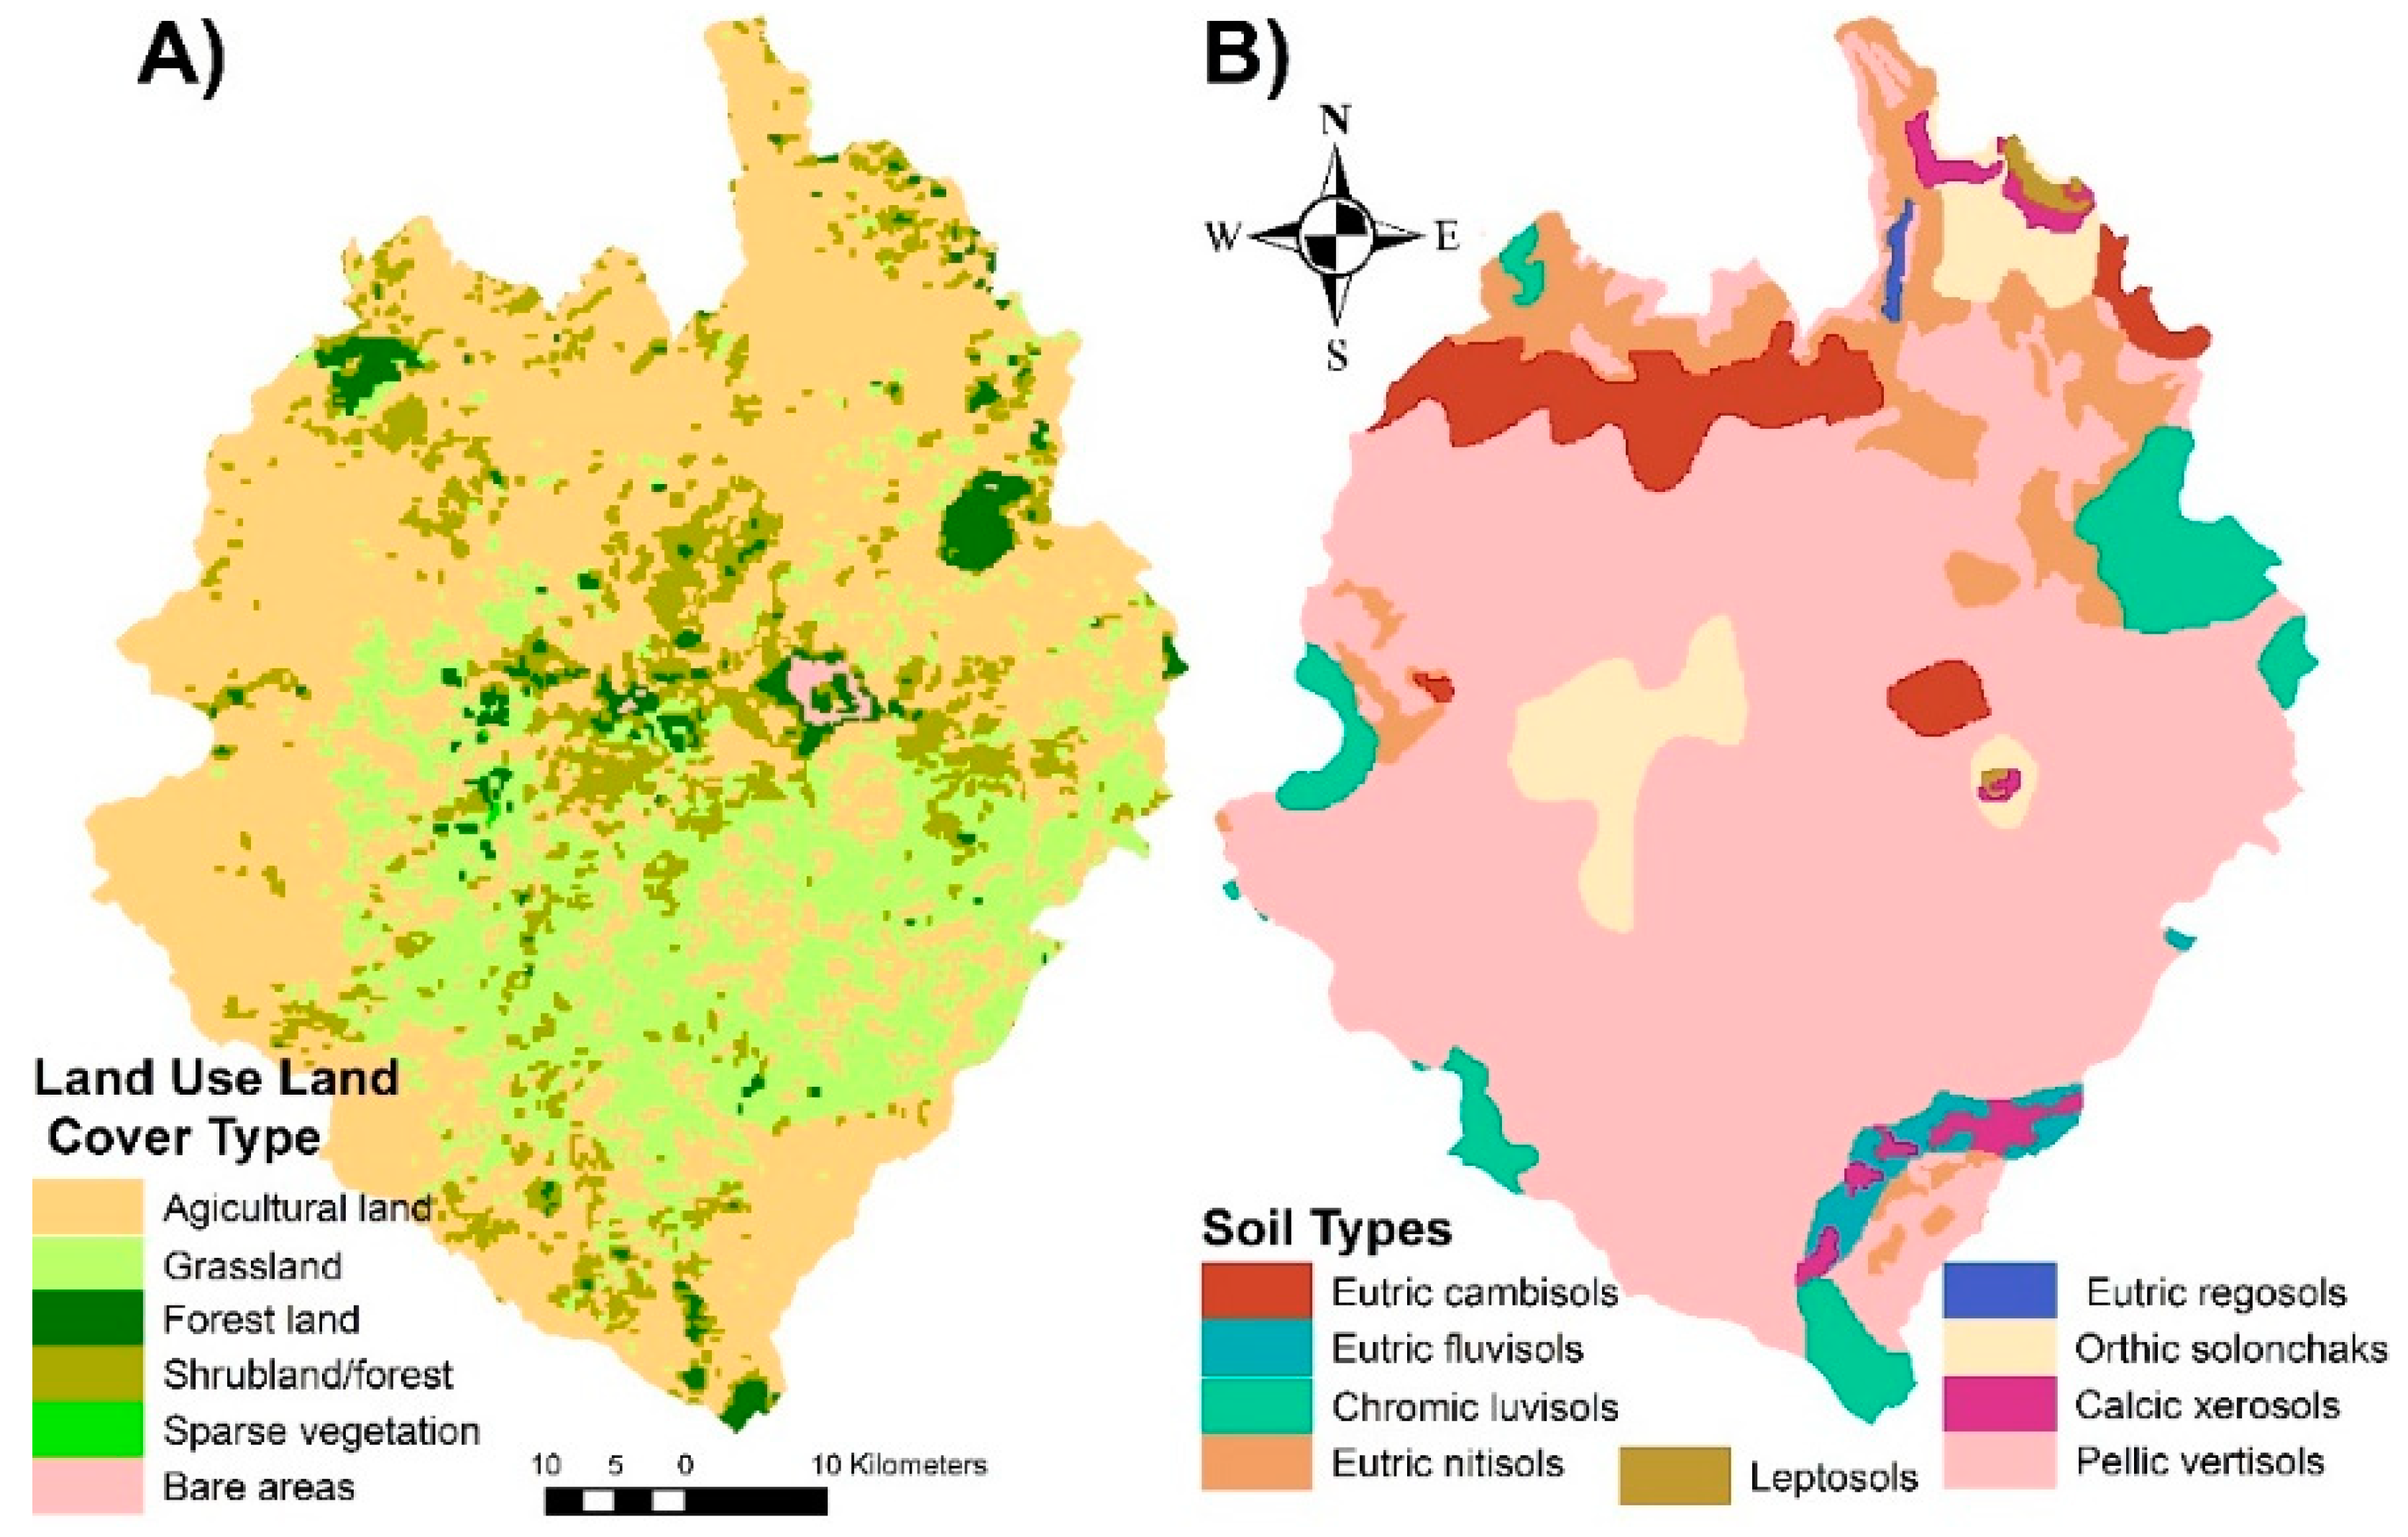
The upper Awash basin climate varies from humid to sub-humid with an annual mean temperature range of 15–20 °C. The mean annual rainfall varies from 800 to 1400 mm/year, depending on topographic variations [51]. There are three seasons in Awash basin: the major rainy season, locally called “Kiremt” from June to September (JJAS), the minor rainy season, locally called “Belg” from February to May (FMAM), and the dry season, also known as “Bega” from October to January [52,53]. The basis of these three seasons is the north or southward shift of the ITCZ (Inter Tropical Convergence Zone). When the ITCZ shifts toward the north during the northern hemisphere summer, the basin falls under the major rainy season, because the southwest trade winds bring warm moist air toward the basin. The basin falls under the dry season when the ITCZ shifts toward the south during the southern hemisphere summer. The rainfall that contributes to the basin when the ITCZ shifts toward the north along with other mechanisms is called the minor rainy season [52,53]. The most dominant land use of land cover type in the MK subbasin is agricultural land, which covers 86% of the subbasin, followed by rang land (9%), as shown in Figure 2A. The most dominant soil type that covers 44% of the subbasin is Pellic vertisols (i.e., sandy clay loam), followed by 10% of Eurtic nitisols (i.e., clay loam) as shown in Figure 2B.
2.2. Data
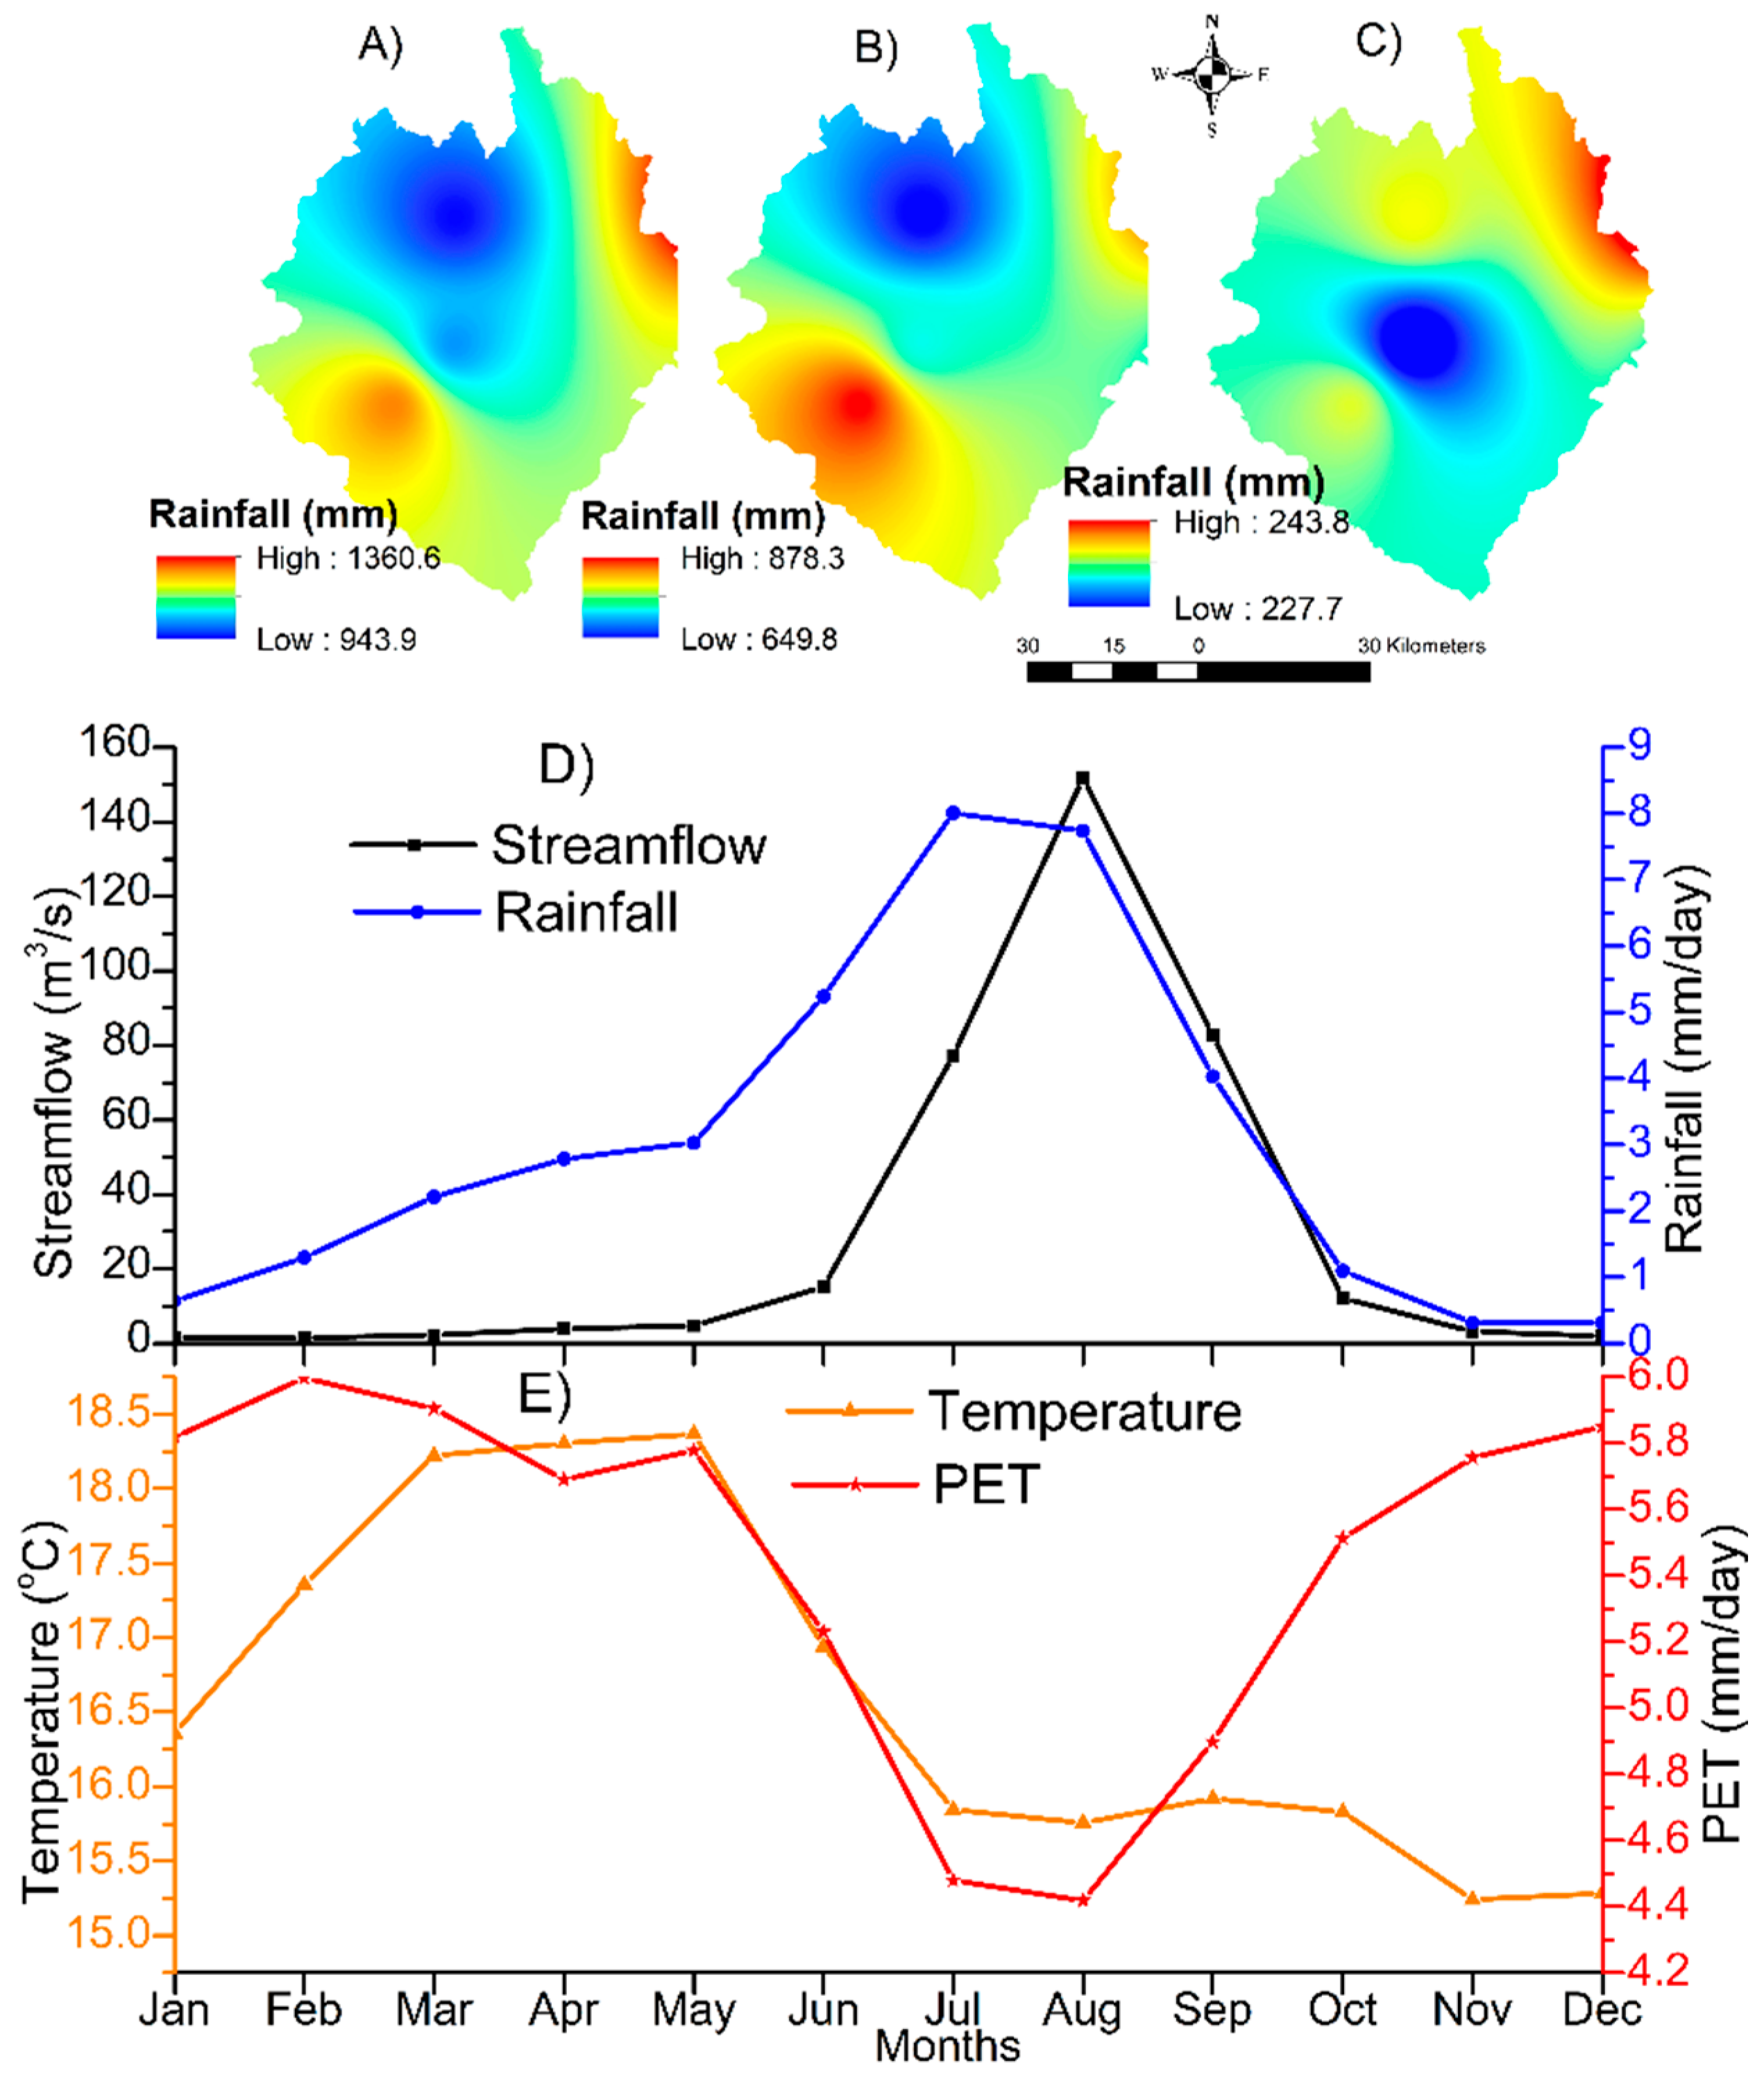
The daily observed temperature and rainfall datasets from 1990–2011 were collected from eight meteorological stations of the National Meteorological Agency. The annual average rainfall varies from 944 to 1169 mm. The daily streamflow data of Melka Kuntrie gauging station from 1985–2008 for 23 years, as well as different spatial data, including subbasin boundary, river network, DEM, land use and soil type, were collected from the Ministry of Water, Electricity and Irrigation of Ethiopia. The total mean annual flow of MK subbasin was estimated to be 942.43 million m3. The spatial interpolation from eight stations indicated that during the annual and the major rainy season, the entire south experienced a significant amount of rainfall, which was especially high in the southwest and low in the north (Figure 3A,B). The amount of rainfall during the minor rainy season was relatively lower in the central part of MK subbasin than that in the northeast (Figure 3C). Monthly streamflow and basin-averaged rainfall were shown in Figure 3D, showing significant temporal variations. About 92% of the annual streamflow was observed in the major rainy season, especially from July to September. The major rainy season rainfall is the main source of recharge to the subbasin.
One of the inputs for the HBV model, potential evapotranspiration, was estimated using the Hargreaves equation [54]. The daily potential evapotranspiration was calculated using extra-terrestrial radiation, minimum and maximum temperatures. Studies using the Hargreaves equation to estimate PET in Ethiopia found satisfactory results [55,56]. The Hargreaves equation is derived through regression of the temperature reduction coefficient and relative humidity factor, as in the following:
where PETHG is the potential evapotranspiration by the Hargreaves method (mm/day); Ra is the extra-terrestrial radiation (mm/day) that is dependent on latitude, sunshine hours and solar constant; λ is the latent heat of vaporization (MJ/Kg); Tmean is the average temperature (°C); Tmax and Tmin are the maximum and minimum temperature (°C), respectively. Based on the Hargreaves’s method the average monthly potential evapotranspiration (PET) of MK subbasin was estimated to be 162 mm. The high potential evapotranspiration, particularly from Oct.–Feb., may be attributed to high radiation and high diurnal temperature variation (especially from Oct.–Feb., when it is quite cold at night and warm at day), as shown in Figure 3E.
The Mann–Kendall (M–K) test was carried out to exam the trends of observed rainfall and temperature. The M–K test calculates the difference between every pair of data in a time series by given a positive or a negative sign, rather than the difference between data values [57]. The purpose is to identify the monotonic trend of the data, excluding the influence of extreme values. For most cases, a significance level of α = 0.05 (i.e., 95% confidence interval) is used to check statistical significance of the trend calculated by the M–K test. If the computed p value is less than 0.05, it indicates that there is a significant trend in the time series. Unlike insignificant trends in annual and seasonal rainfalls, temperature exhibits a significant increasing trend (i.e., the positive sign indicated in Table 1). However, the M–K test does not give estimations of trend magnitudes. In this study, the Sen’s slope estimator was used to calculate the linear rate of change. The Sen’s slope represents the median of the slopes calculated with all possible data pairs in a time series [58]. The Sen’s slope indicates that the rate of increase in the mean annual temperature for the MK subbasin was 0.57 °C/year over the last 21 years. The annual and major rainy seasonal rainfall of the Sen’s slope indicated an increasing rate of 0.11 and 0.14 mm/year, respectively, while the minor rainy season rainfall decreases at a rate of 0.082 mm/year, as indicated (Table 1). Overall, the M–K test indicates a significant increasing trend of temperature, whereas no trend was shown in rainfall.
Two GCMs of AR4 A2 scenarios (i.e., ECHAM-A2 and IPSL-A2) and two GCMs of AR5 RCP4.5/RCP8.5 scenarios were selected from the same older version of AR4. For instance, the MPI model is the new version of ECHAM developed at the Max Planck Institute for Meteorology (MPI-M) in Hamburg, Germany. The IPSL model was developed at the Institute Pierre Simon Laplace (IPSL), France. Both RCP4.5 and RCP8.5 scenarios from MPI and IPSL projections were used for HBV simulations. The downscaled and bias-corrected daily projections of GCMs scenarios for the study, area were collected from the Earth System Sciences group, Wageningen University [59,60,61]. The GCMs data are bias-corrected and downscaled with the WATer and global CHange (WATCH) Forcing Data (WFD), a reanalyzed global dataset containing daily meteorological data with half-degree resolution [60]. There is a high correlation of 0.95 between the WFD and observed historical data of the MK subbasin. The bias correction is calculated as the following [59],
where Vbc is the resulting bias-corrected variable (e.g., temperature or rainfall), is the variable projected by GCMs, is the corresponding variable of the WFD, and is the long-term monthly mean of the variable. The downscaling of GCMs outputs to the basin scale was performed, with the delta change approach of calculating the percentage changes in rainfall (or the differences in temperature) between GCMs baseline and GCMs projections [62]. The calculated delta change was then applied to adjust the WFD data to represent future projections of GCMs scenarios. A total of 6 GCMs projections, namely ECHAM-A2, IPSL-A2, MPI-RCP4.5, MPI-RCP8.5, IPSL-RCP4.5 and IPSL-RCP8.5, are used as input data for the HBV model.
2.3. Methodology
The HBV semi-distributed Swedish hydrological model was used because of its well-recognized performance of simulating streamflow in different climates, and in Ethiopia [32,63,64]. The model inputs require daily rainfall, daily air temperature and daily or monthly estimates of potential evapotranspiration. The general water balance of the model is expressed as,
where, P is precipitation (mm/day), E is evapotranspiration (mm/day), Q is runoff (mm/day), SP is snow pack (mm/day), SM is soil moisture (mm), UZ is upper groundwater zone (mm/day), LZ is lower groundwater zone (mm/day), Lakes is lake volume (mm).
Table 2 lists calibrated values of the most sensitive parameters affecting streamflow simulation, obtained in this study. These parameters include the maximum soil moisture storage (FC), soil moisture threshold above which actual evapotranspiration reaches its potential value (LP), the relative contribution to runoff from each millimeter of rain (BETA), the percolation rate from UZ to LZ (PERC), a measure for the nonlinearity of the flow in UZ (ALFA) and the recession coefficients of UZ (K0 and K1) and LZ (K2).
The Nash-Sutcliffe efficiency criterion (Reff) and Flow-Weighted efficiency (WReff) are often used to assess the skill of streamflow simulations [65]:
where is simulated flow (mm/day) of the i-th day, is observed flow (mm/day) of the i-th day, is the average observed flow (mm/day), w() is the weighted mean of observed high and low flow values, n is the number of data days. For most cases, Reff or WReff values between 0.6 and 0.8 indicate fair to good performance, and a model is often said to perform very well when values are between 0.8 and 0.9 [66].
The observed hydro-meteorological data of 1991–2004 and 2005–2008 were used for HBV calibration and validation, respectively, before performing impact assessment. The baseline hydrology is simulated by the HBV model with bias-corrected and downscaled GCMs data for 1971–2000, while the future hydrology is simulated with bias-corrected GCMs projections, with AR4/AR5 scenarios for 2021–2050 and 2071–2100. The impact of climate change on hydrology is thus evaluated by comparing the baseline streamflow with projected streamflow.
3. Results
3.1. HBV Model Calibration and Validation
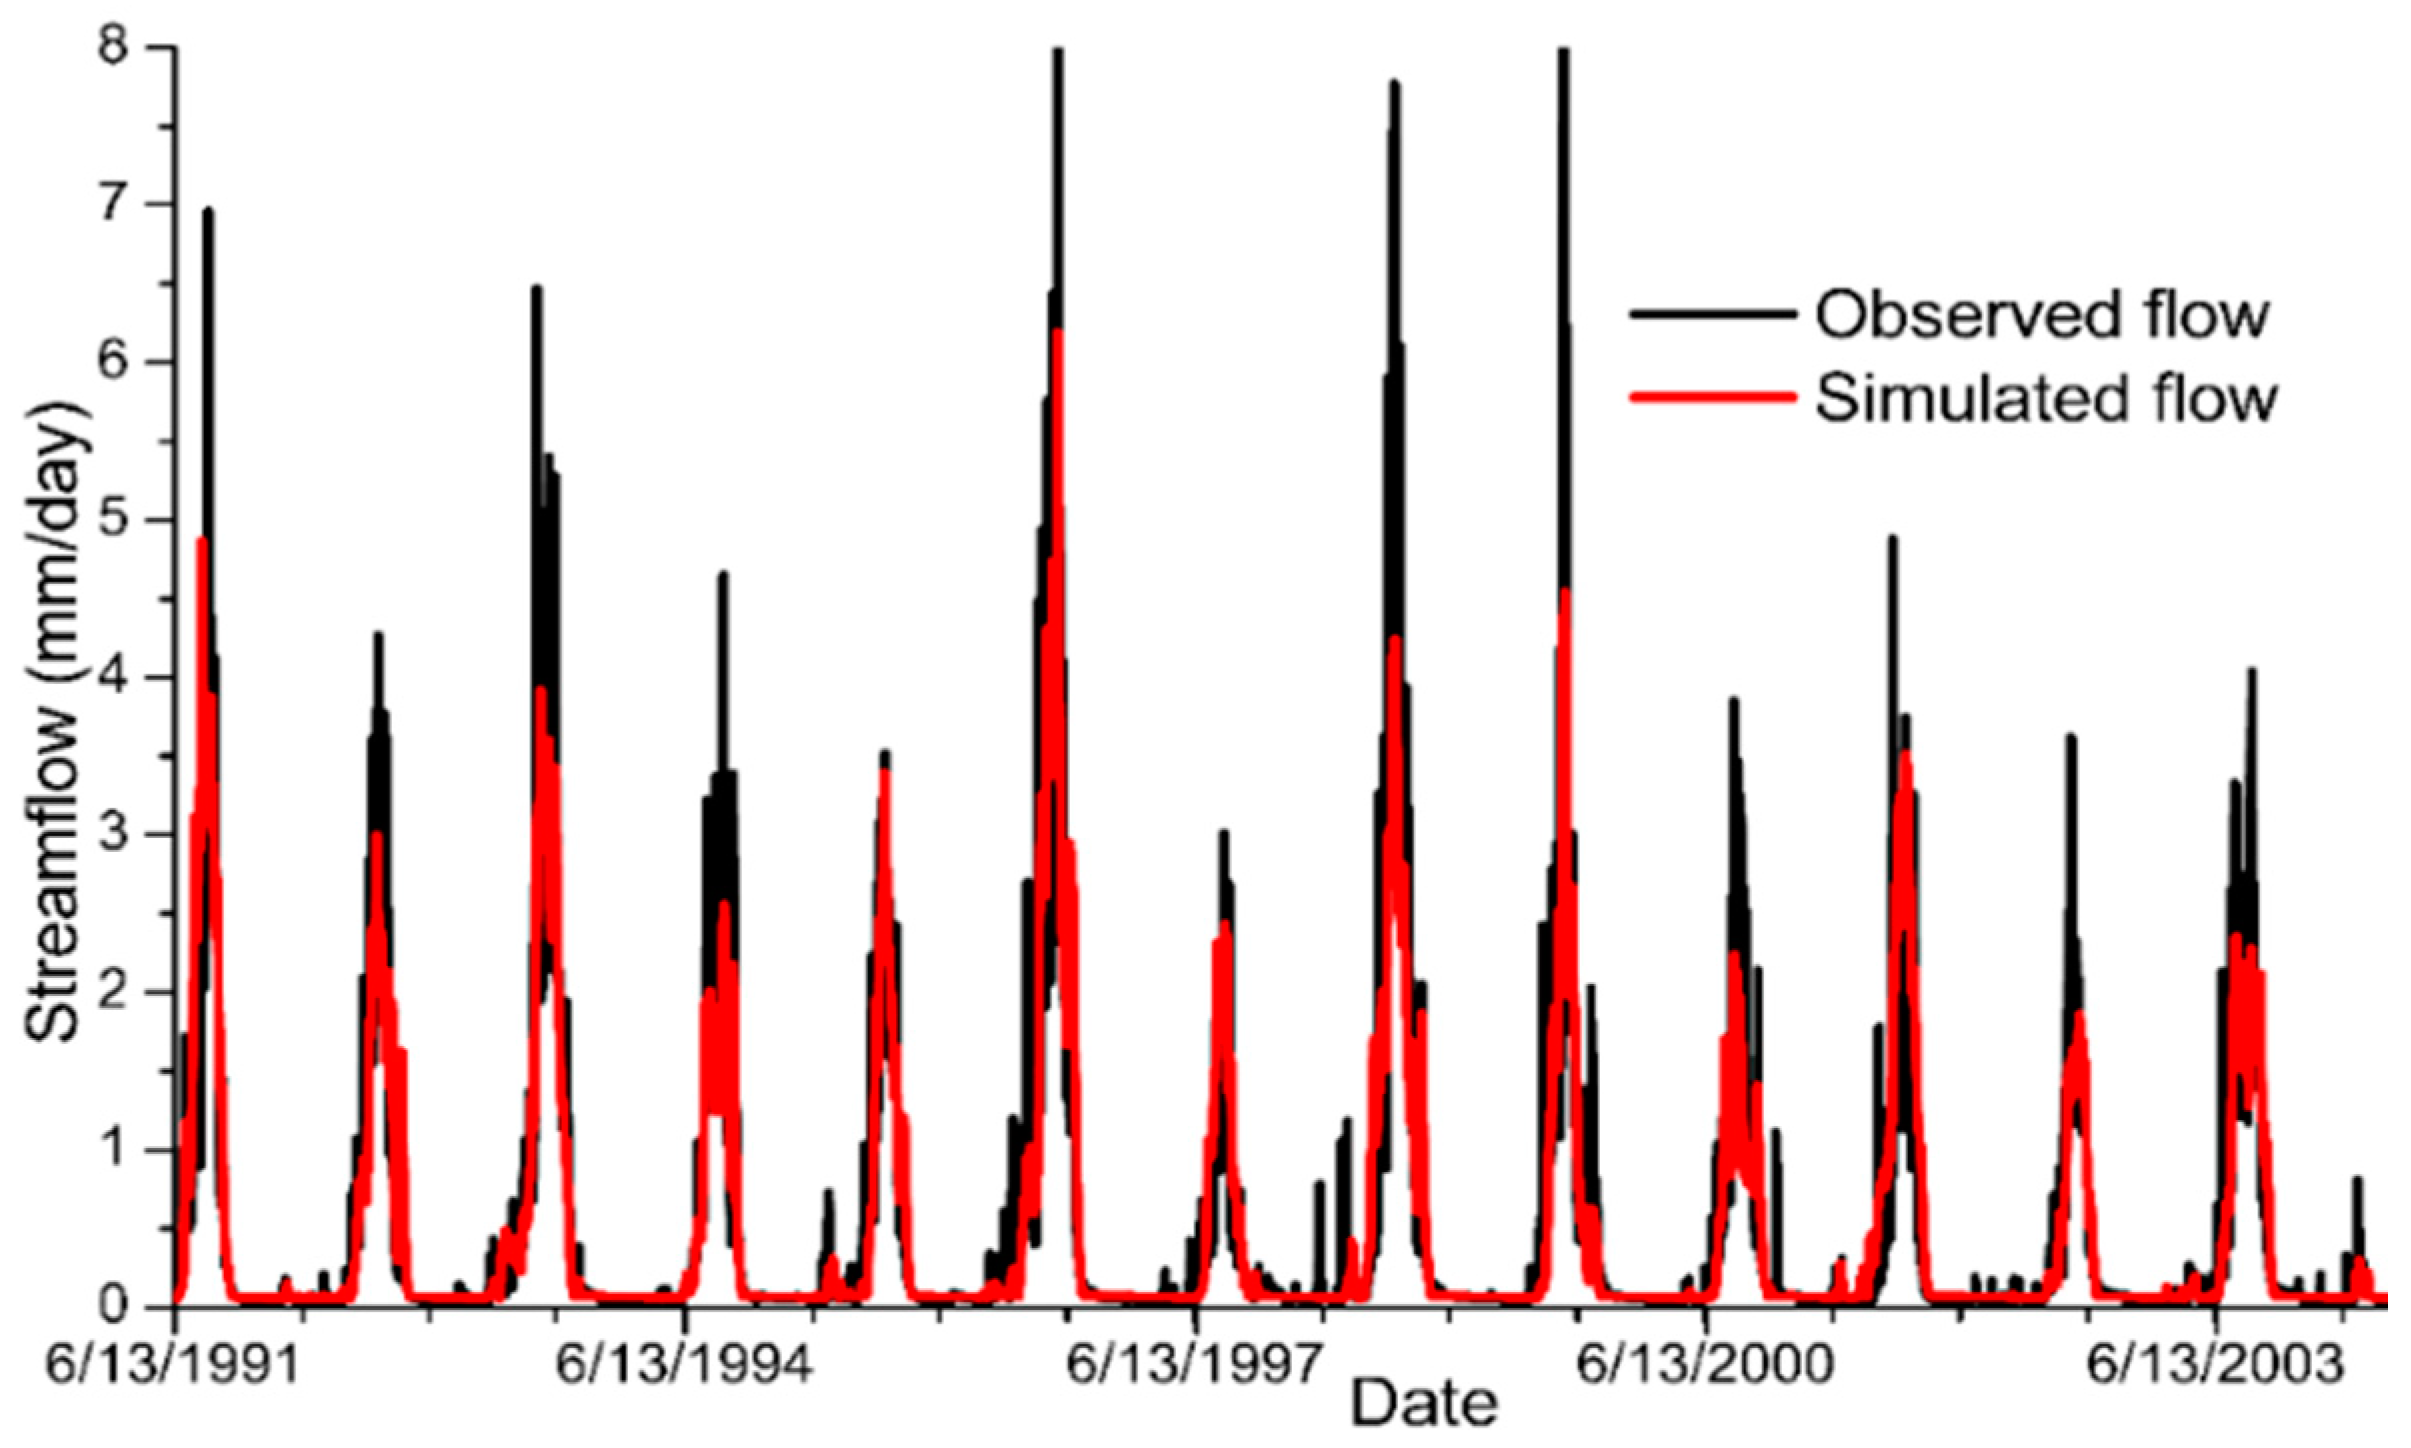
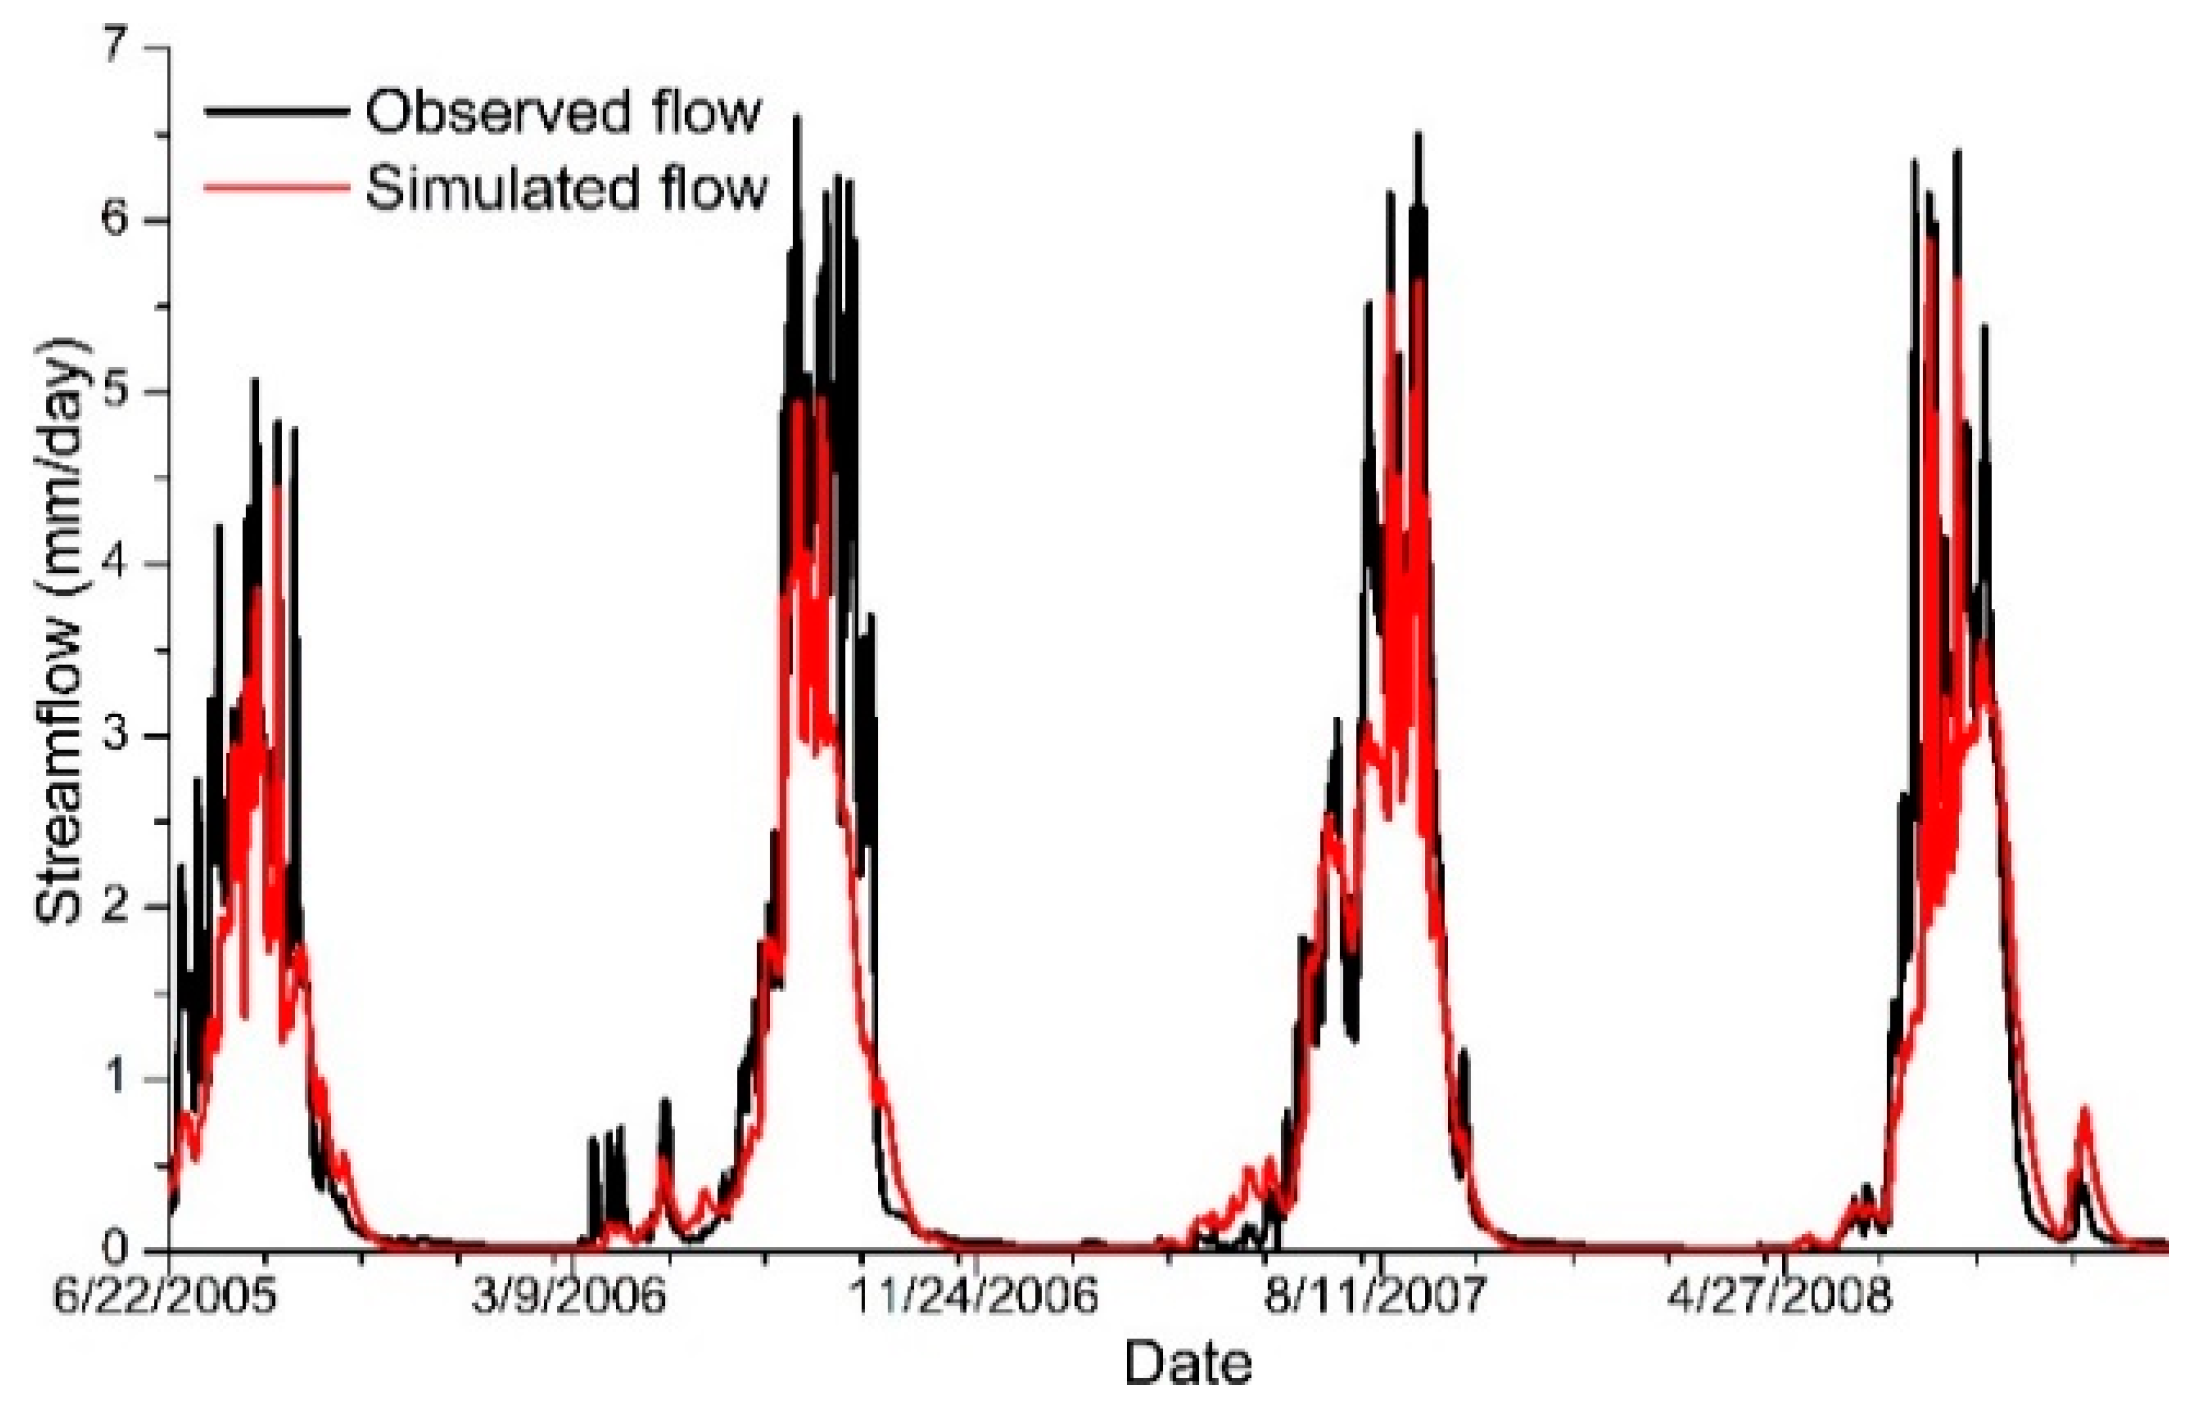
The HBV calibration was performed with observed data of 1991–2004 with the standard automatic Genetic Algorithm and Powell (GAP) optimization [67]. Comparisons of simulated and observed streamflow calibration are given in Figure 4, with Reff and WReff of 0.81 and 0.84, respectively. Values of Reff and WReff for validation period (i.e., 2005–2008), as shown in Figure 5, are 0.74 and 0.76, respectively, which are slightly lower than those of calibration period. This may be due to the large scatter of streamflow data for the validation period than those for the calibration period. It is noted that peak flows are not well captured for both periods. The underestimation of high flow may be attributed to the orographic effect, soil type and high spatial rainfall variability [68]. In addition, simulations with the daily time scale limited the HBV applicability on cases of extreme high rainfall events occurred less than a day [32].
3.2. Climate Change Impact Assessment
3.2.1. Baseline Temperature, Rainfall and Streamflow
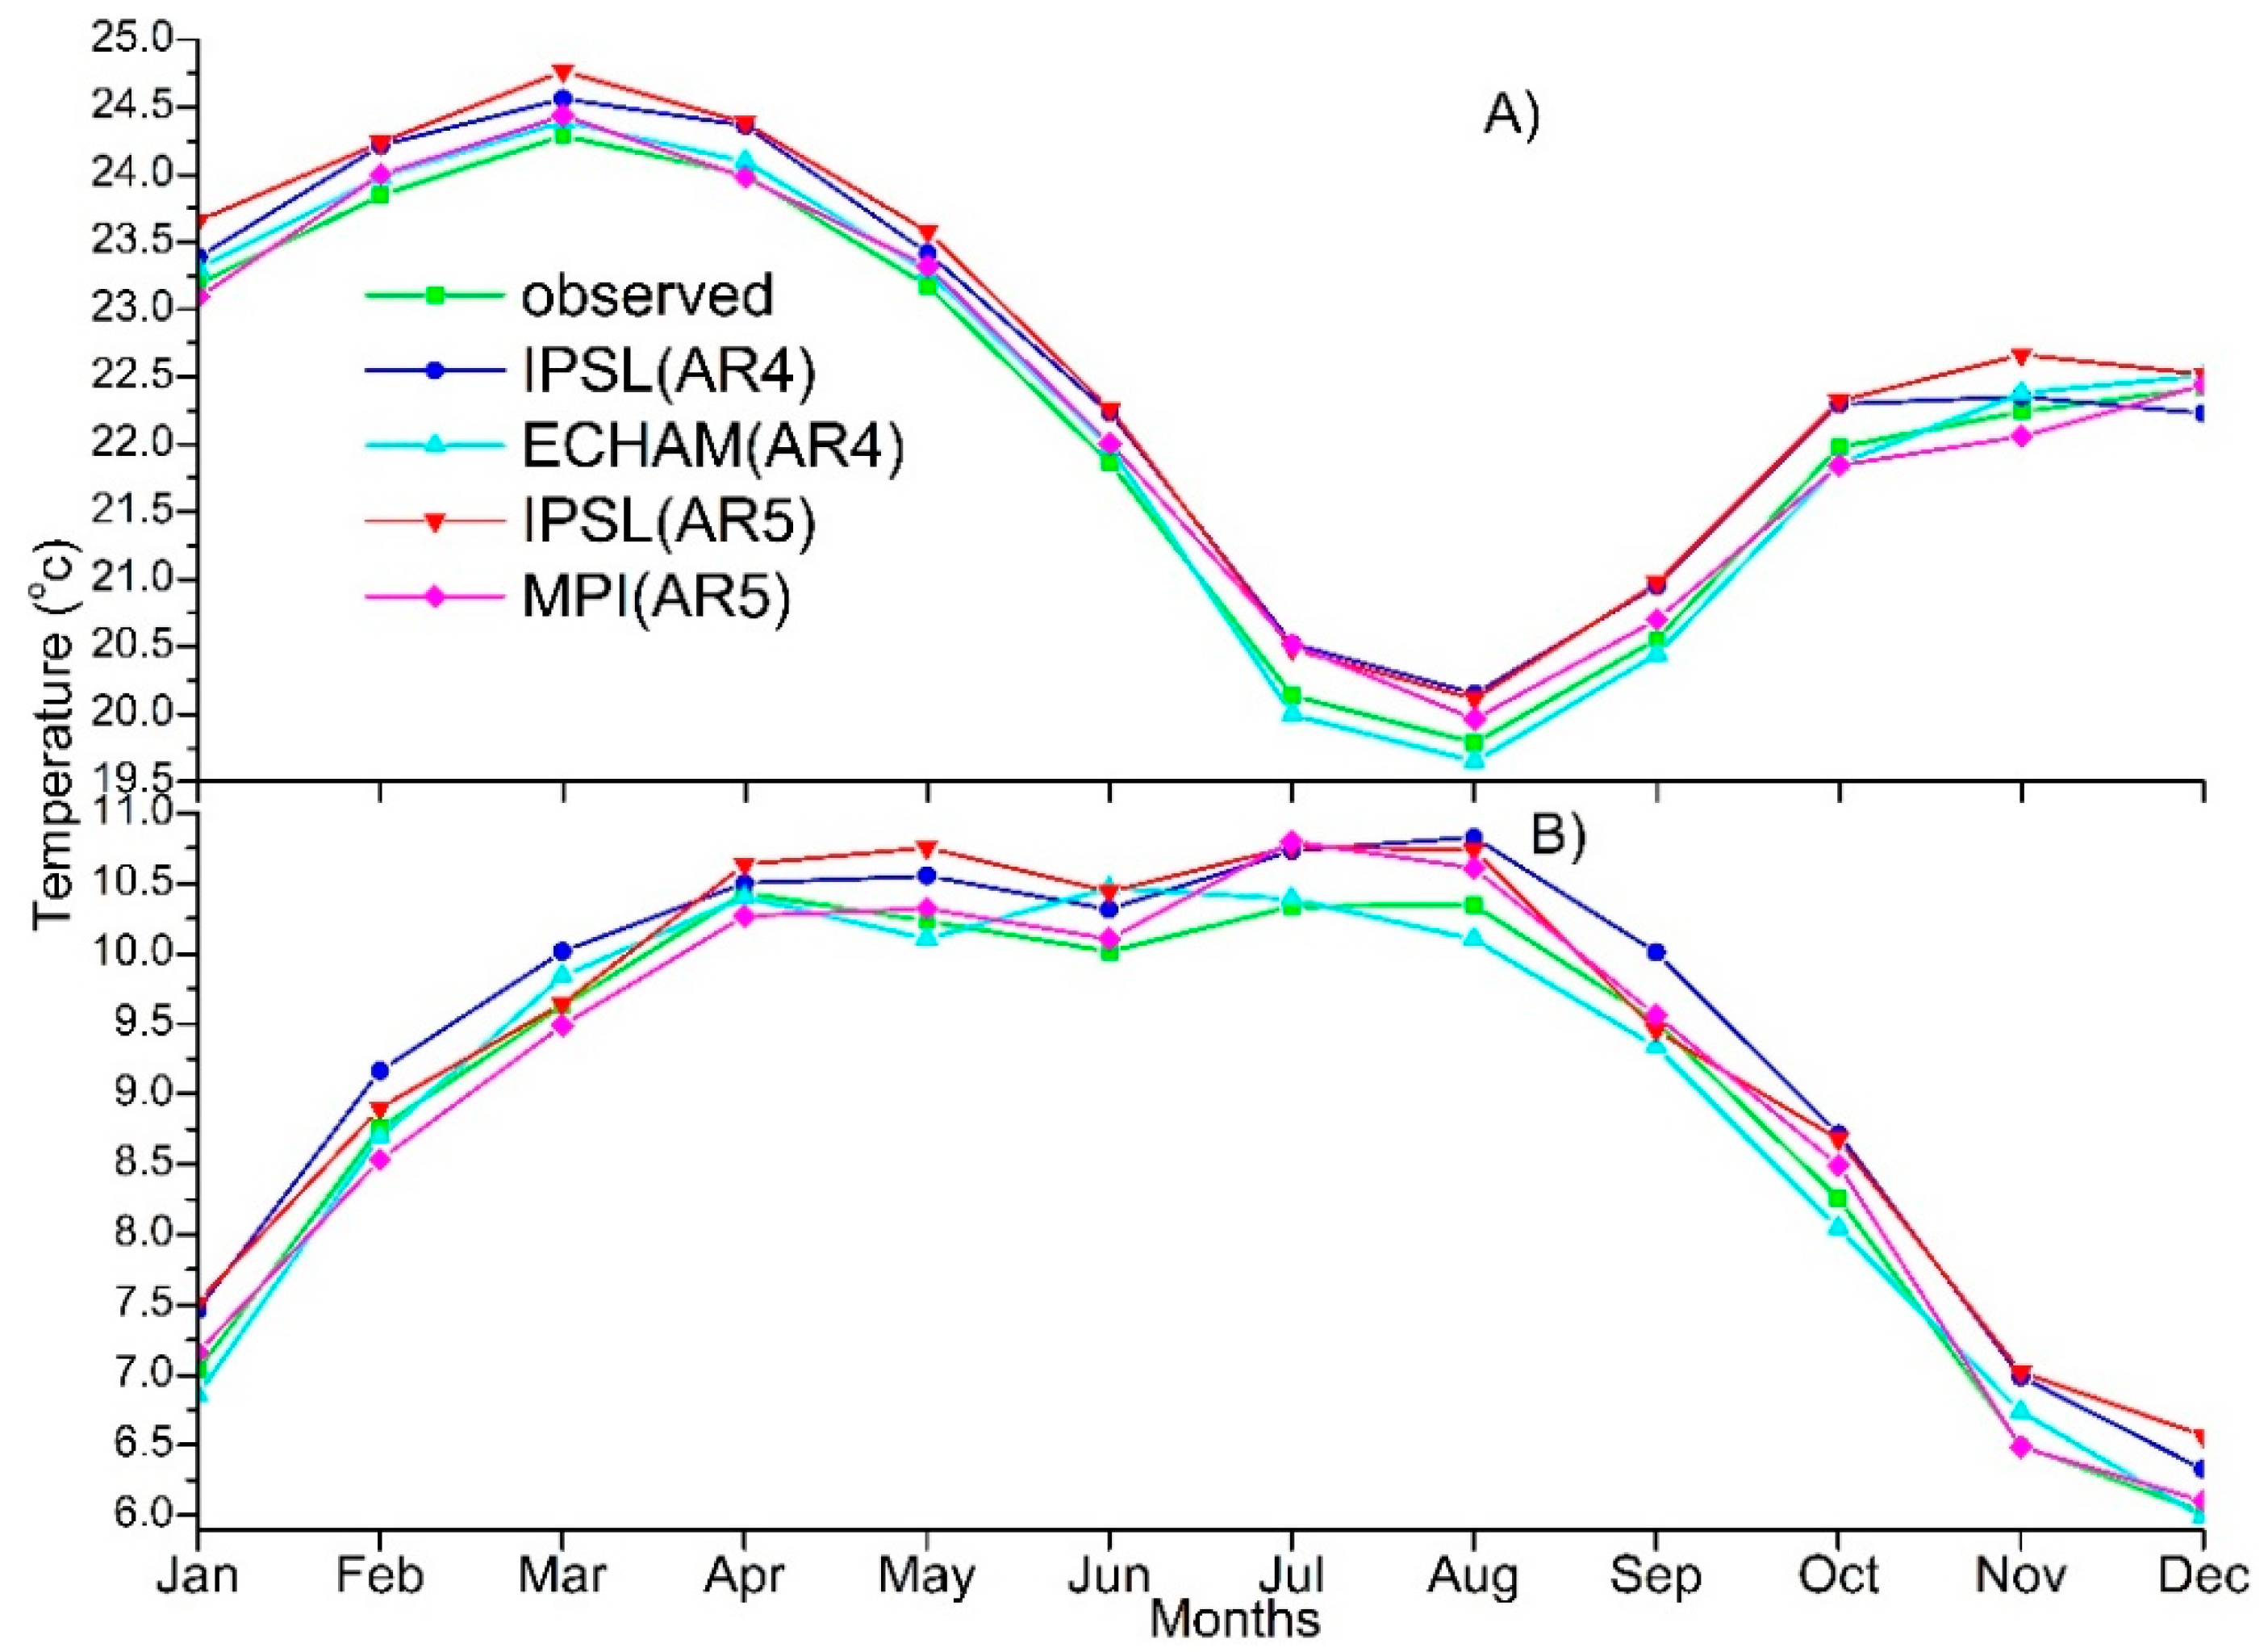
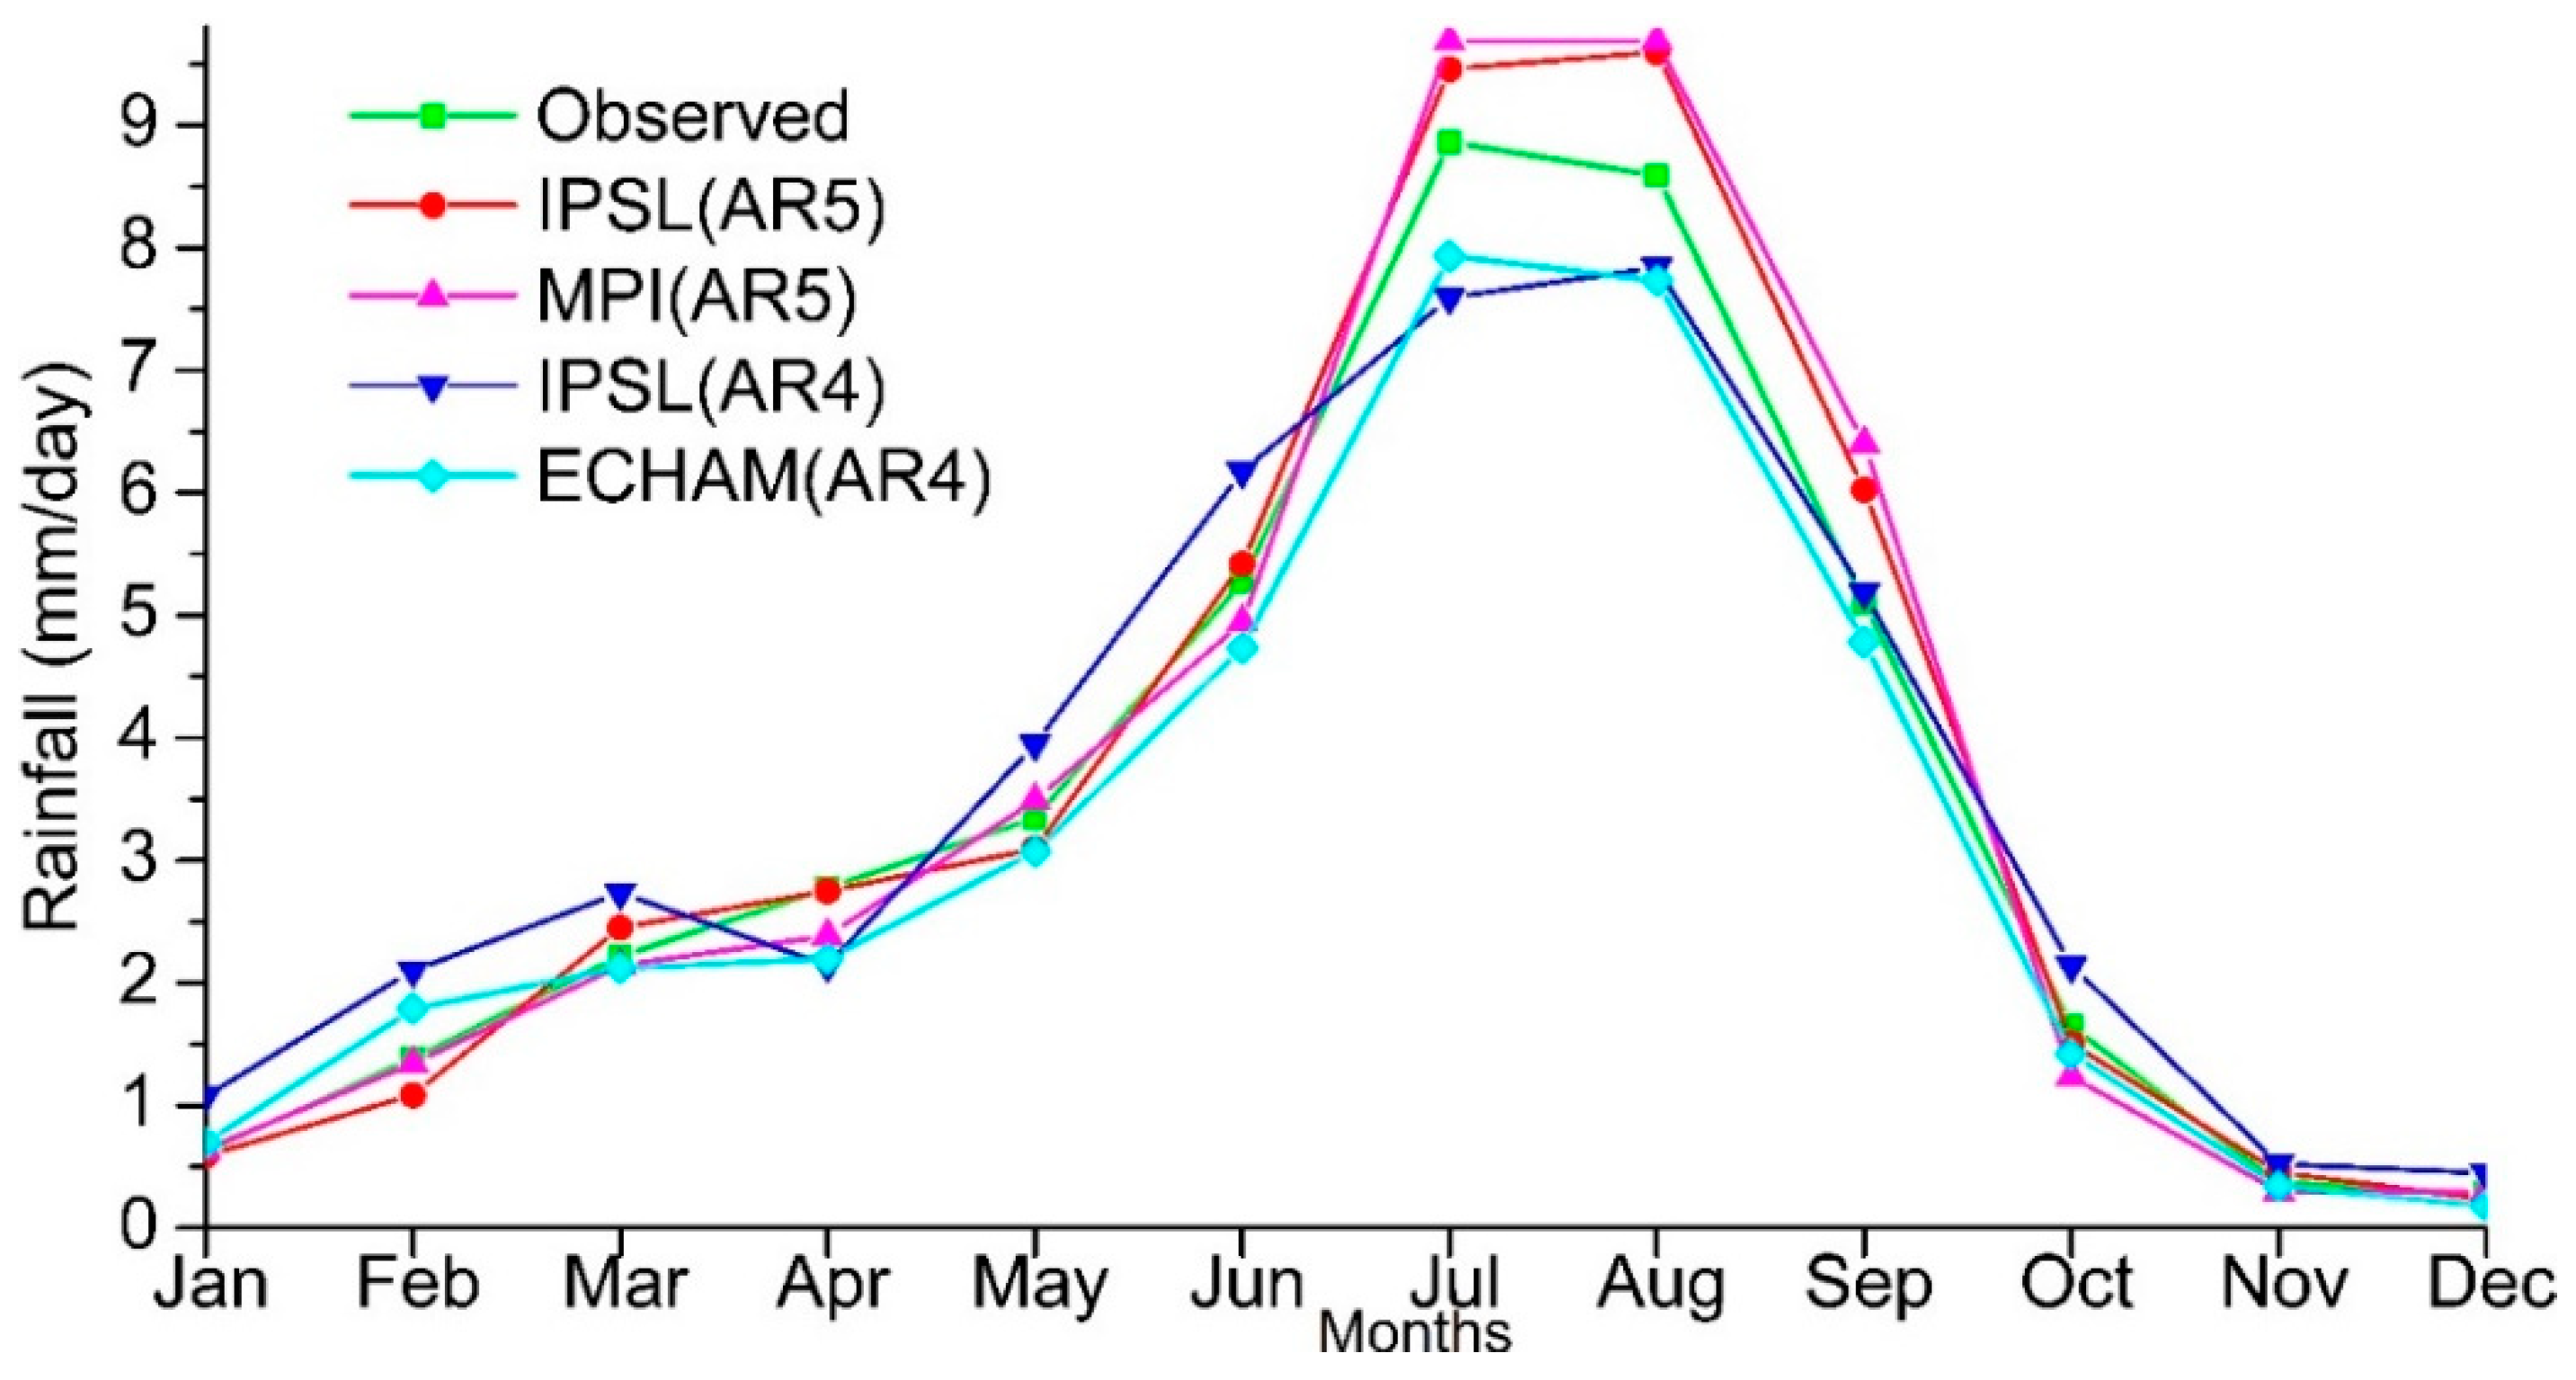
Monthly patterns of observed maximum and minimum temperatures are well captured by the GCMs baseline, with deviations mostly less than 0.5 °C, as shown in Figure 6. It is noted that the seasonal pattern of the maximum temperature is quite different than that of the minimum temperature. The highest maximum temperature is in March (Figure 6A), while the minimum temperature exhibits high values from March to September (Figure 6B). Observed rainfall and GCM baseline are also compared, as shown in Figure 7. Although observed monthly rainfalls are well captured by the GCMs adopted in this study, the baseline of IPSL-AR5 and MPI-AR5 is higher than observed rainfall in July–September of the major rainy season, while those of IPSL-AR4 and ECHAM-AR4 are lower. For example, the MPI-AR5 exhibits the largest rainfall discrepancy of 1.3 mm/day compared to the observed in September as shown in Figure 7. The IPSL-AR4 has the highest rainfall among all GCMs, and is higher than observed rainfall in both minor rainy and dry seasons, except in April.
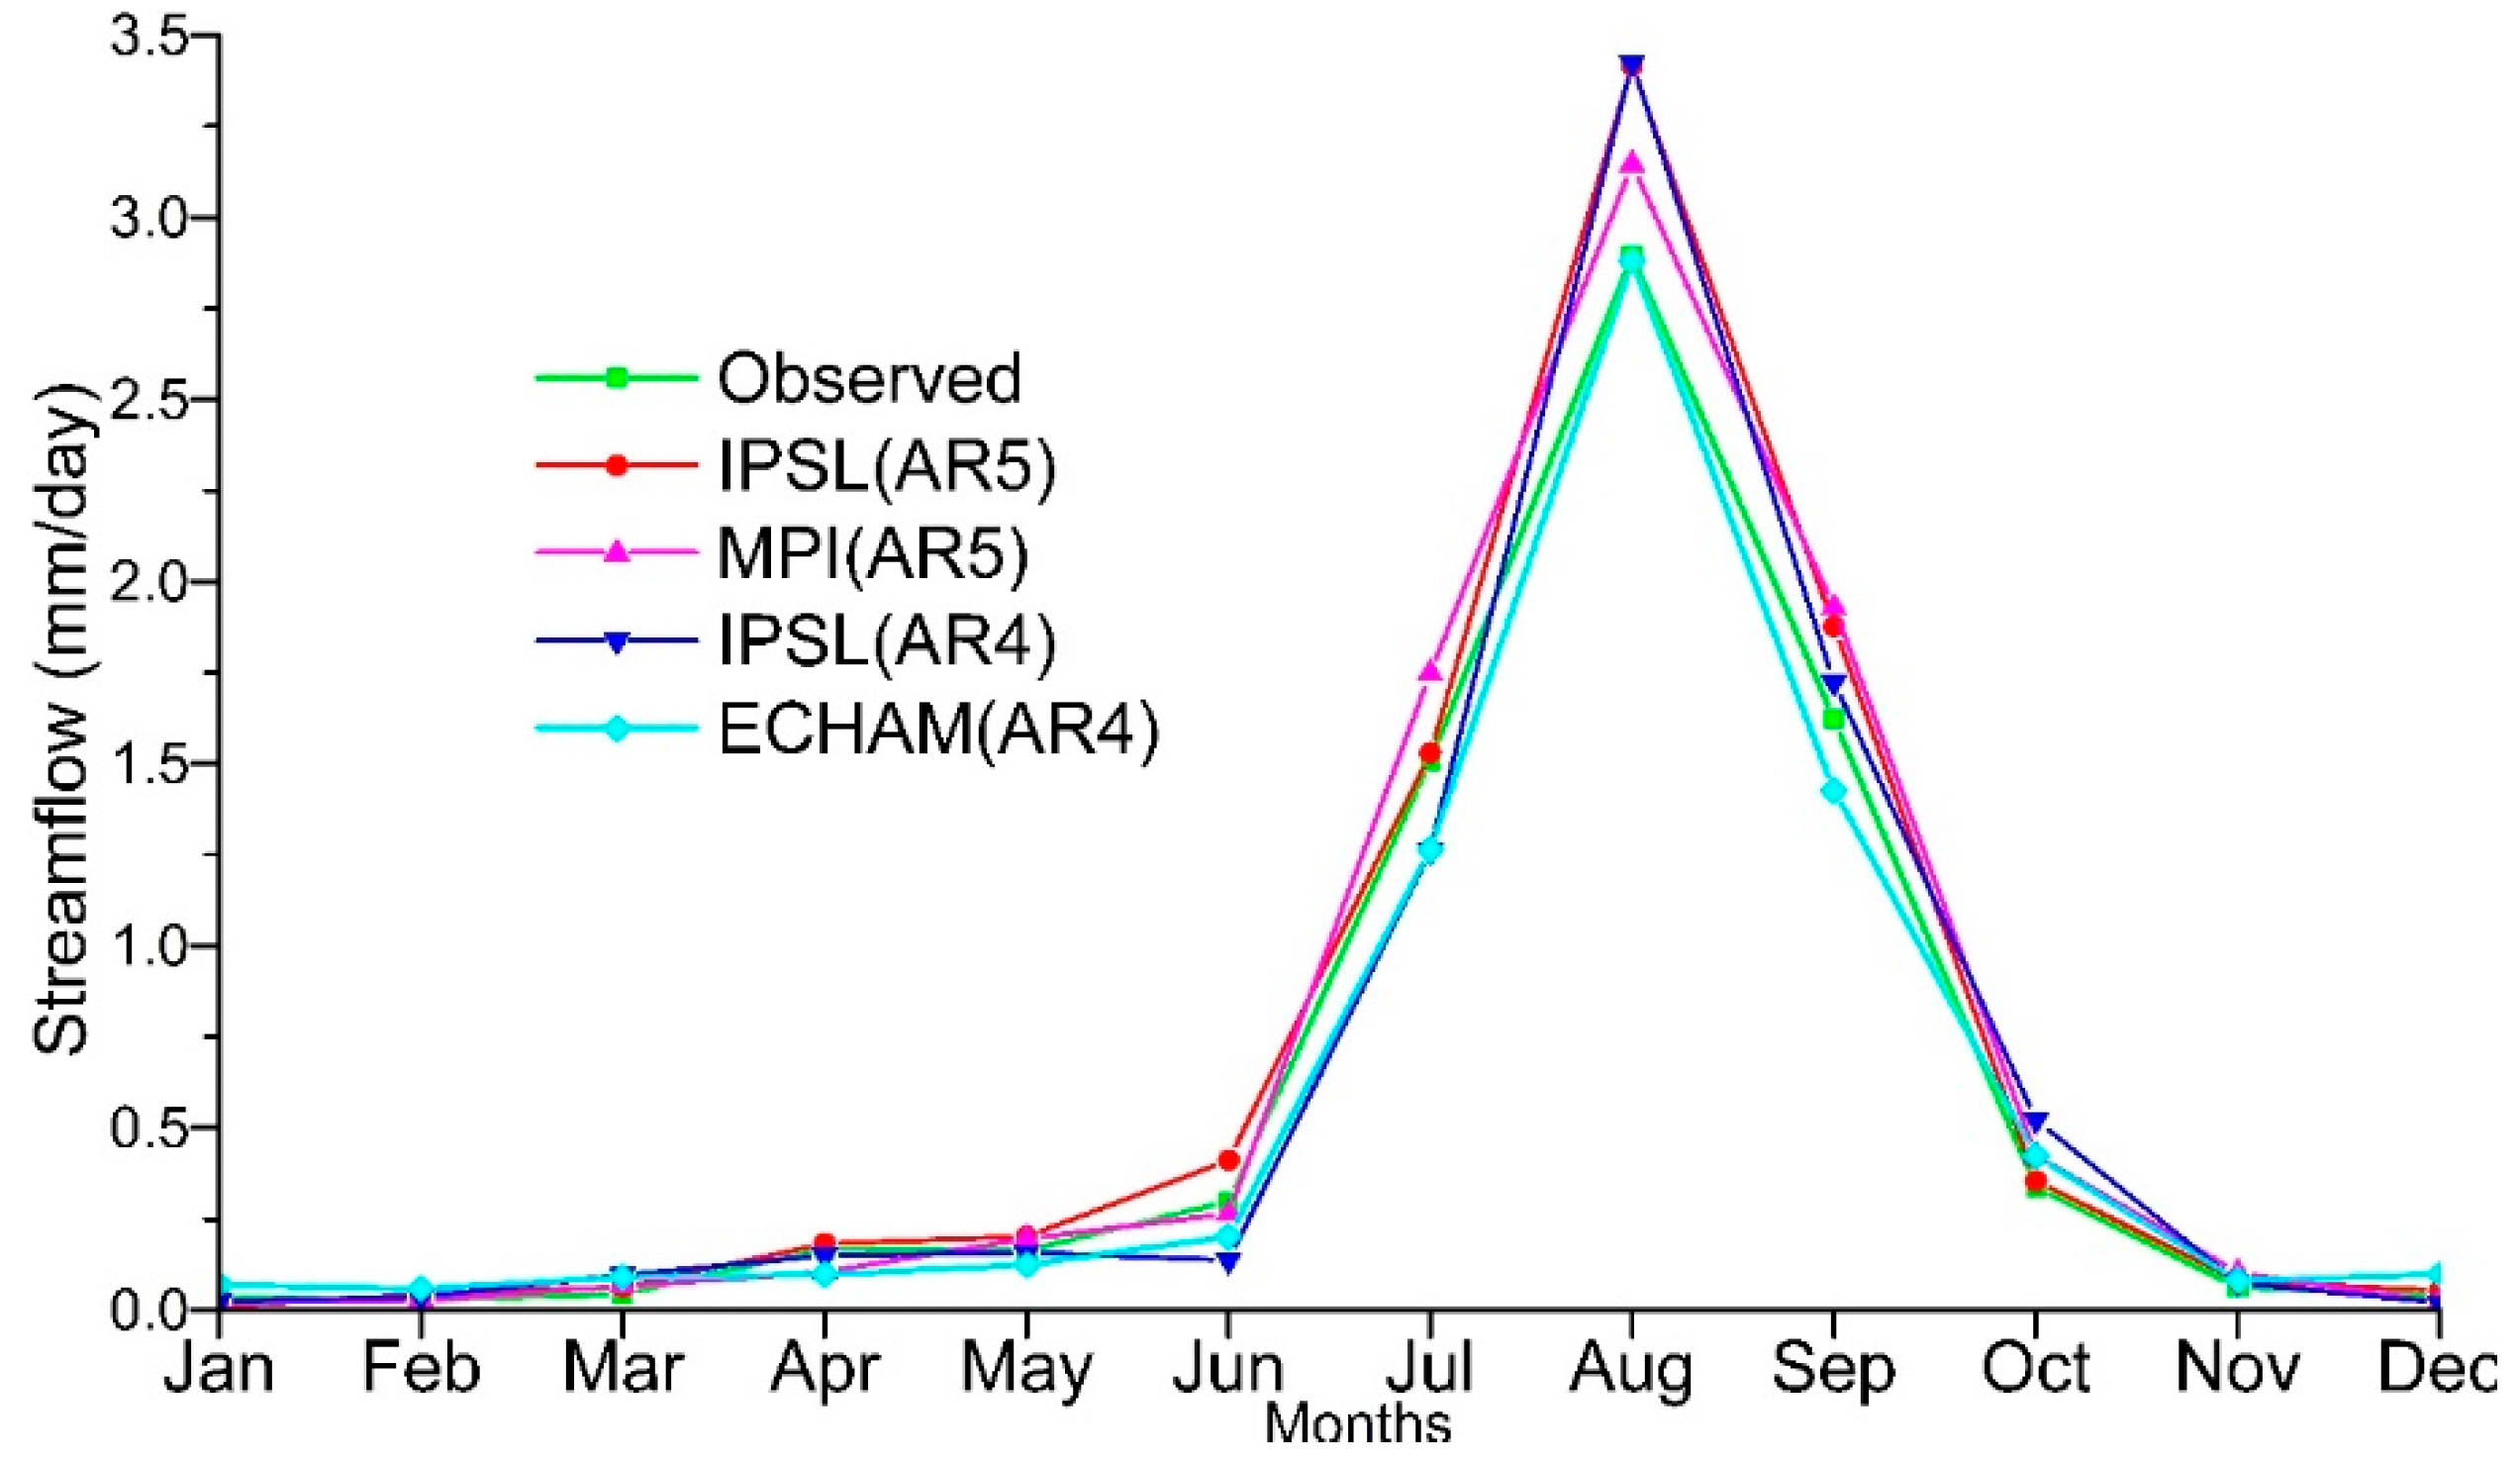
Monthly streamflow simulated with different GCMs baselines match well with observed streamflow, as shown in Figure 8. Due to higher rainfall of AR5 baseline than the observed in major rainy season (Figure 7), the streamflow simulated with both MPI and IPSL of AR5 baselines are larger than observed values. Most streamflow simulated with the ECHAM AR4 streamflow are smaller than the observed values. During both minor rainy and dry seasons, baseline streamflow simulated with both ECHAM and IPSL of AR4 are slightly larger than the observed. Higher rainfall given by the IPSL of AR4 than the observed in both minor rainy and dry seasons might explain why the simulated streamflow in August is larger than the observed as the result of wetter antecedent soil moistures. From the baseline results of simulated monthly temperature, rainfall and streamflow, the performance of AR4 GCMs is not necessarily worse than AR5. Impact assessments conducted in this study also included the projection from AR4 GCMs.
3.2.2. Projected Temperature, Evapotranspiration, Rainfall and Streamflow
Maximum and Minimum Temperatures
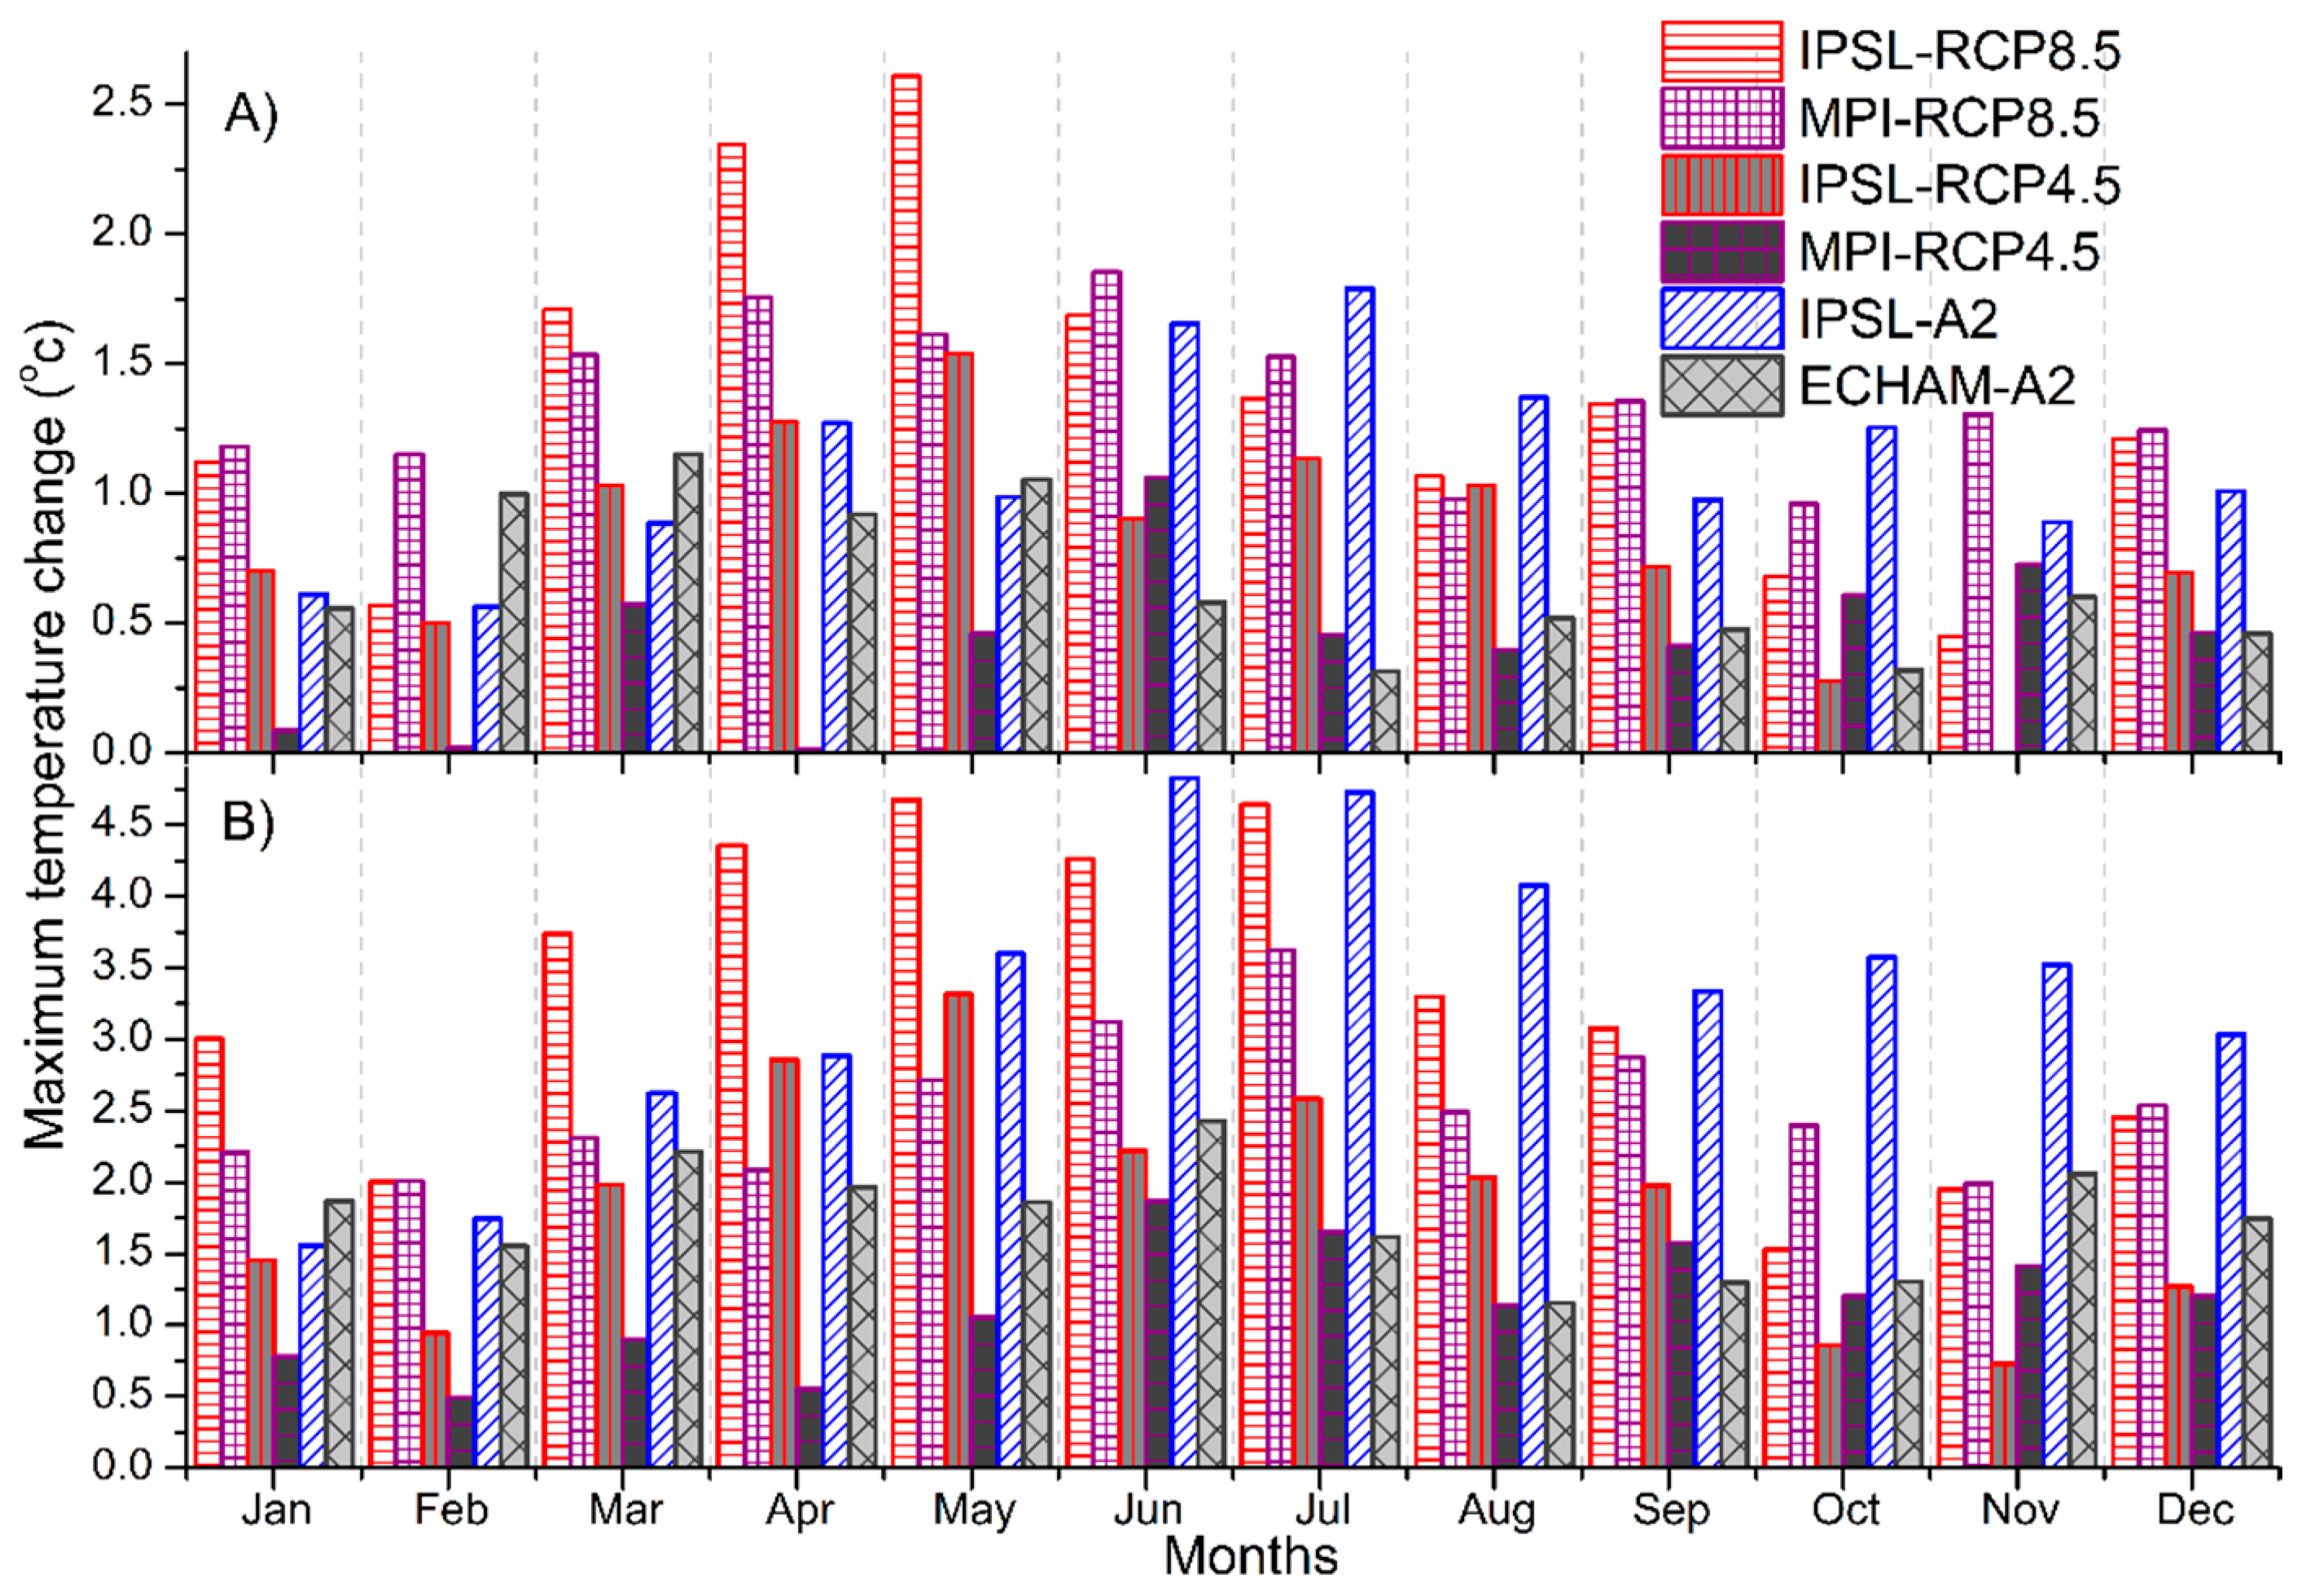
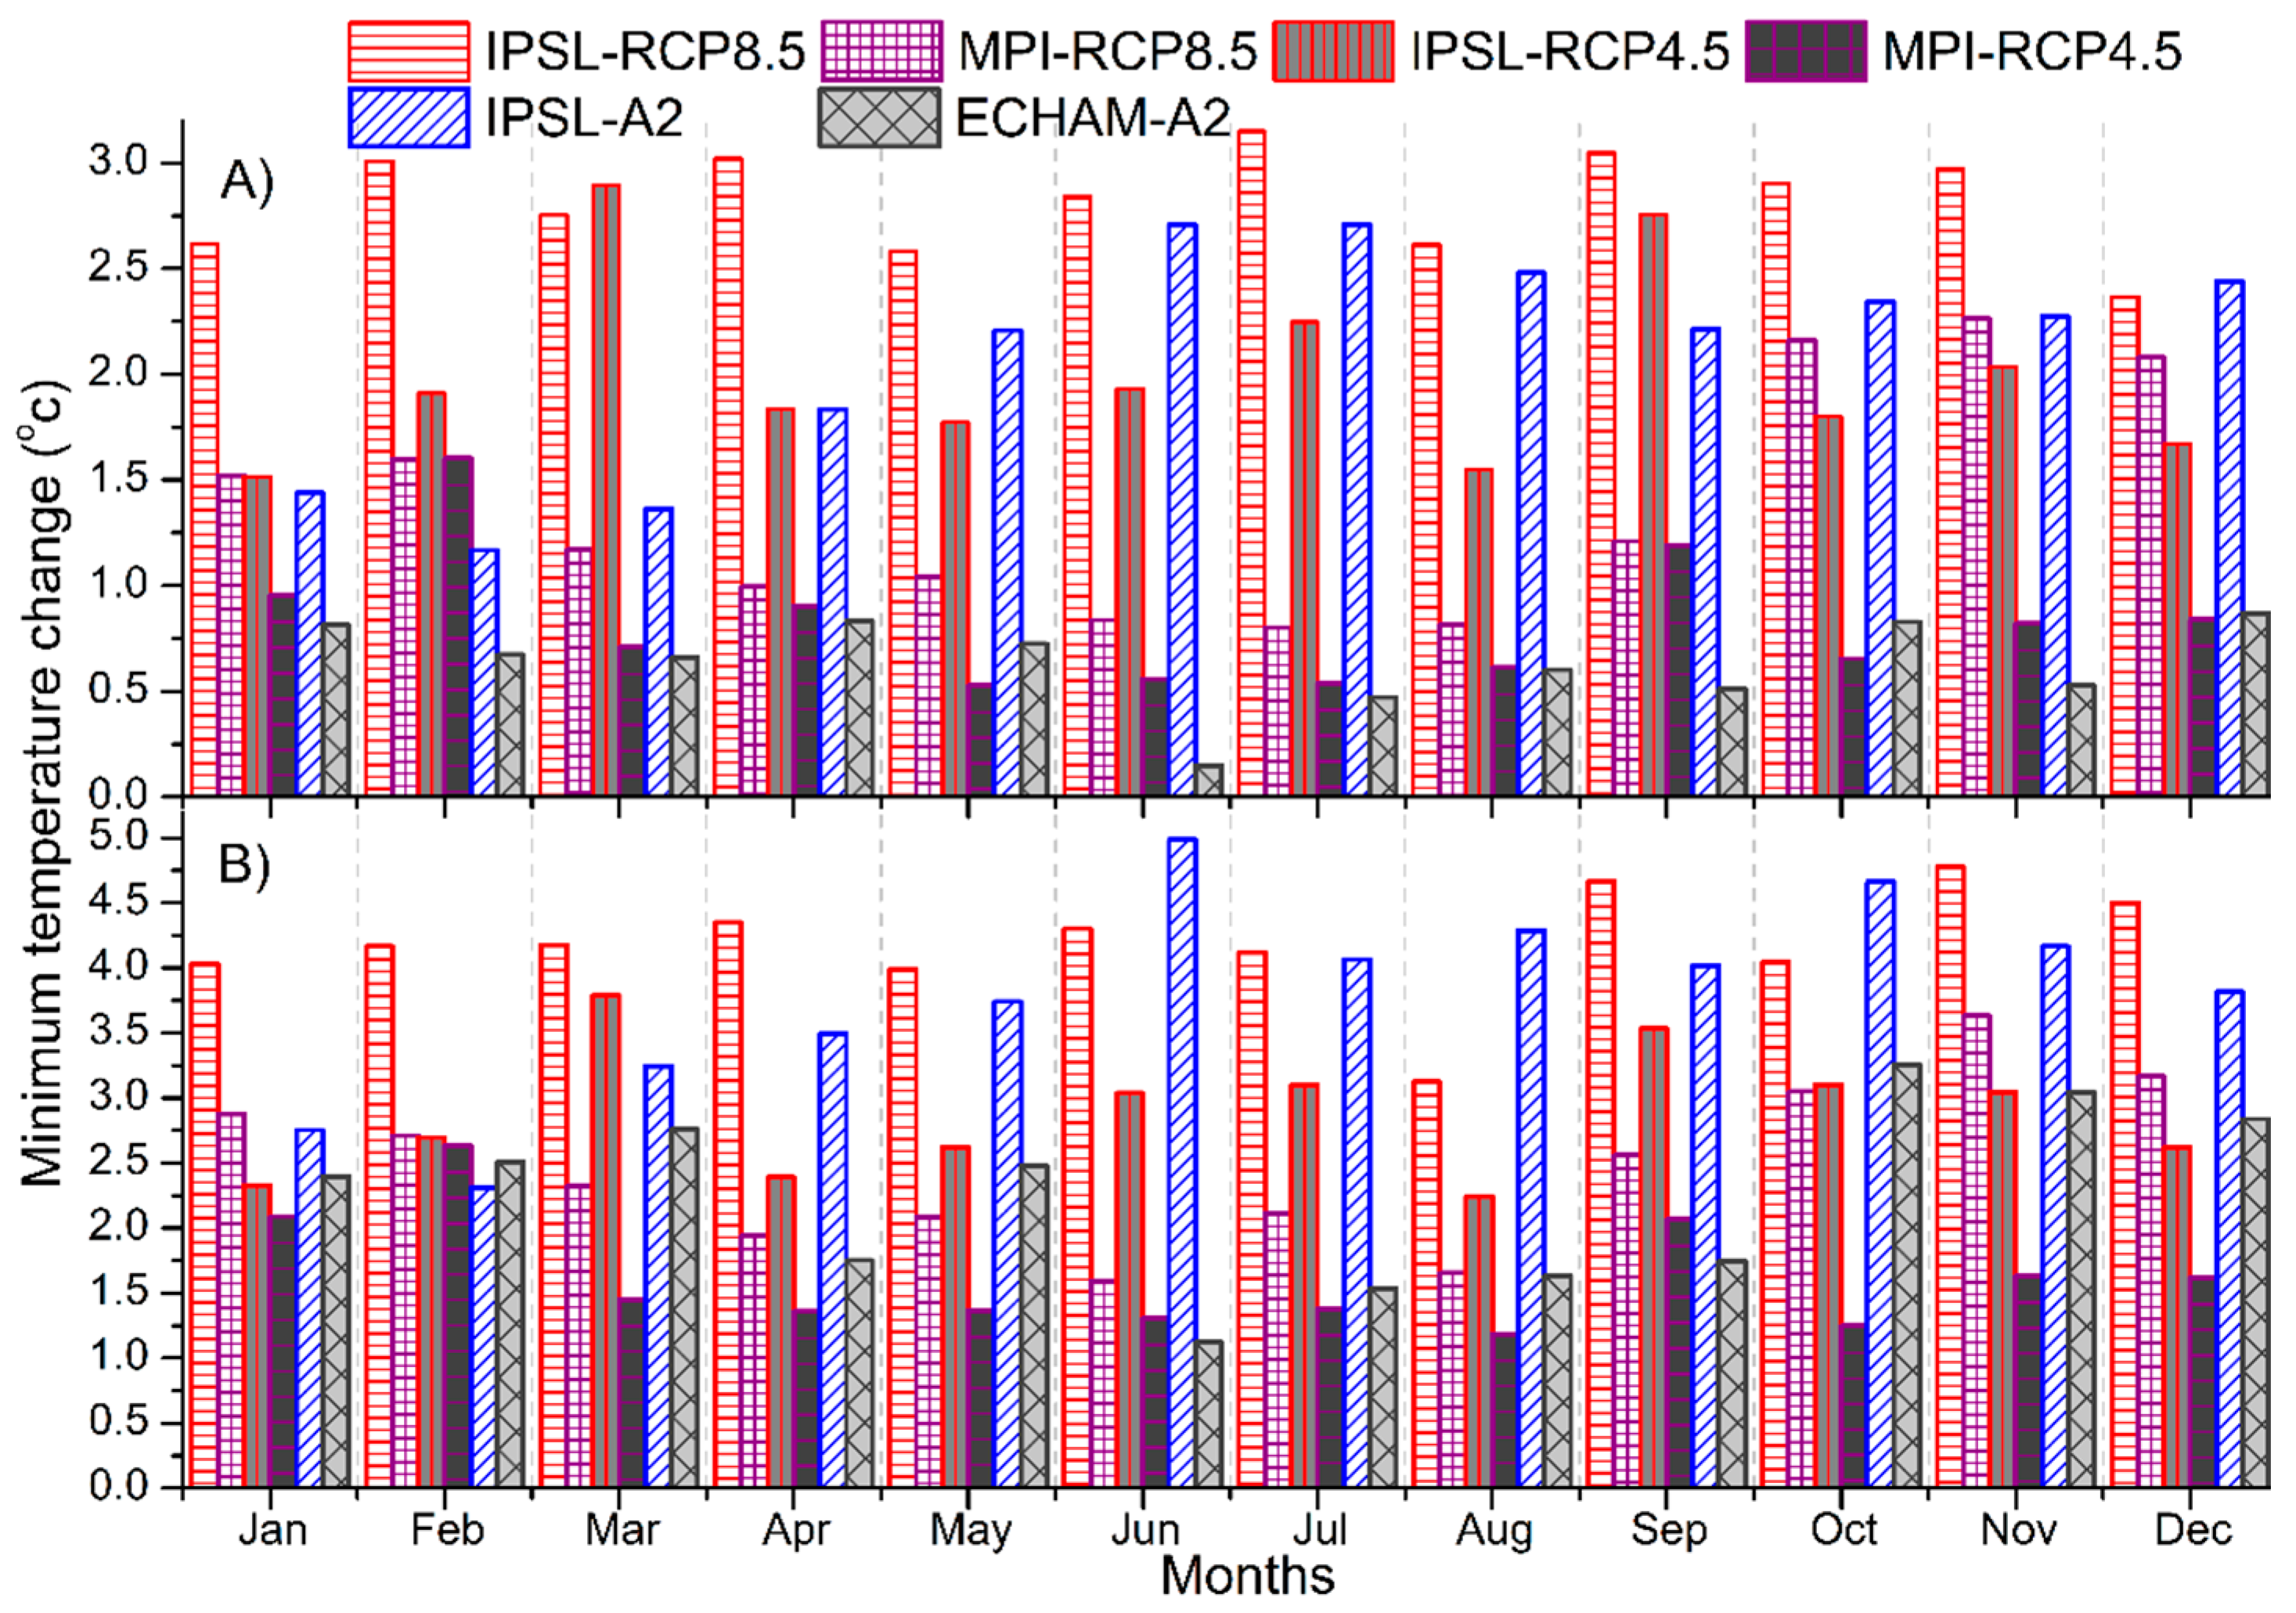
The monthly maximum and minimum temperatures are projected to increase by all GCMs, as shown in Figure 9 and Figure 10, respectively, for both periods of 2021–2050 and 2071–2100. Increases in temperatures projected by IPSL are higher than those by MPI (or ECHAM) for all scenarios. For both the maximum and minimum temperatures, increases in 2071–2100 are higher than those in 2021–2050 for all scenarios. For example, the IPSL-RCP8.5 has the largest increase of 2.9 °C (i.e., May) among others during the near future period. For the far future period, the IPSL projections also have the largest increases of 4.7 °C (i.e., May) and 4.6 °C (i.e., June) under RCP8.5 and A2, respectively, among others. The lowest monthly maximum and minimum temperature increases are given by ECHAM-A2 as compared to other GCMs and scenarios.
As shown in Figure 9, the temperature increases in April and May are higher than in March and have the peak observed temperature (Figure 3). The seasonal pattern of the maximum temperature will be quite different of having higher values from March to May. On the other hand, the increases in the minimum temperatures are generally larger than increases in the maximum temperatures for all GCMs in both periods, and the fluctuation of temperature in some months will be less than the observed patterns. Different patterns of increases between the maximum and minimum temperatures reflects observed temperature patterns, as given Figure 3. As a result, a greater chance of having extreme temperatures is expected, due to changes in the seasonal pattern of the maximum temperature. However, projected higher values in the minimum temperature will be beneficial to crops, which will have a lower chance of chilling damage.
Projections of rising temperature given by six scenarios adopted in this study are consistent with several previous studies. For instance, median changes in mean annual temperature projected with ten GCMs during the far future for the Awash basin under RCP4.5 and RCP 8.5 scenarios are 2.3 °C and 4.5 °C, respectively [36], similar to the projection 2.0 °C–2.4 °C for RCP4.5 and 3.7 °C–4.6 °C for RCP8.5 based on 20 GCMs of AR5 [69]. The change in the maximum (minimum) temperature for near and far future periods are projected to be 0.3 °C–1.0 °C (0.5 °C–1.1 °C) and 3.0 °C–5.0 °C (3.5 °C–4.5 °C), respectively, based on an average of three GCMs of AR5 [38].
Rainfall
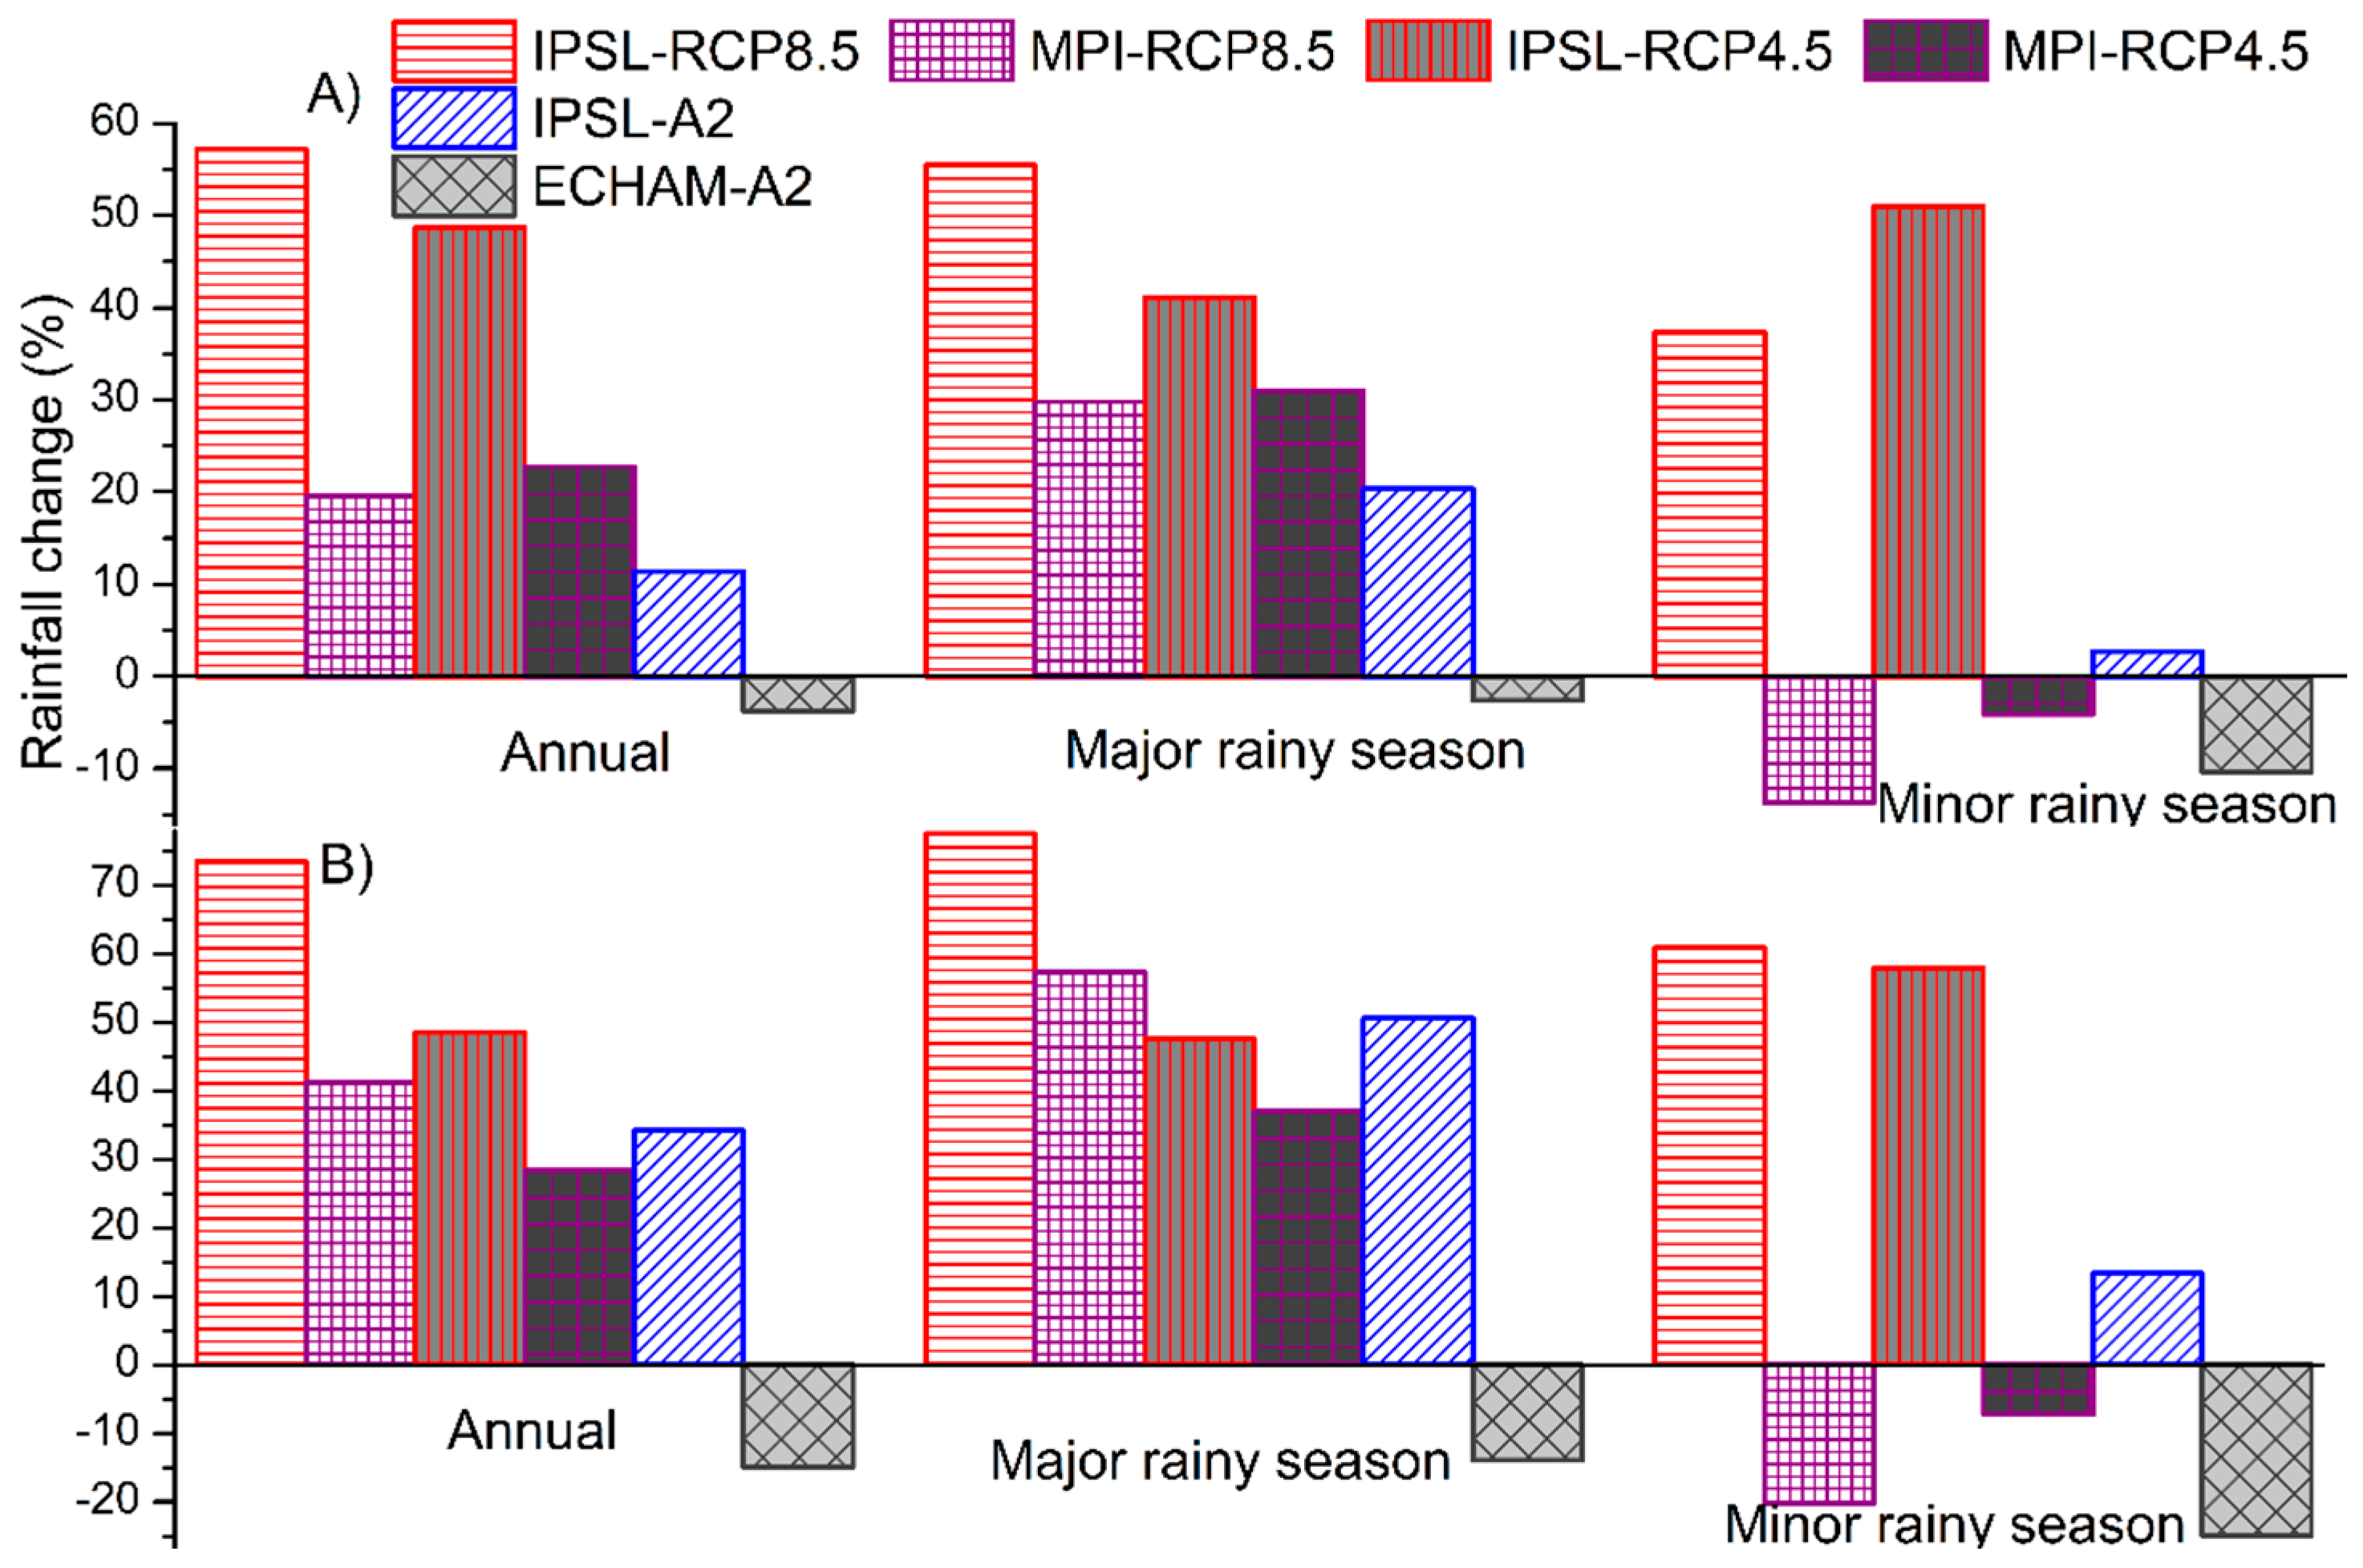
Rainfall projections are calculated as percentage changes with reference to the GCMs baseline and present separately for annual and seasonal scales as shown in Figure 11. All GCMs scenarios show larger rainfall percentage changes in the 2071–2100 period. Projections with the IPSL-RCP8.5 has the most significant increases in annual and major rainy season rainfall for both time periods. For example, the largest changes of 57% and 77% are projected by the IPSL-RCP8.5 for 2021–2050 and 2071–2100, respectively. Annual rainfall and the major rainy season are expected to increase, except the ECHAM-A2 scenario, but our values are higher than the projected change of 9% for the Awash basin, with 10 GCMs [36], and 17.2% (RCP4.5)–34.4% (RCP8.5) for the Keleta subbasin, with 20 GCMs [69]. The positive or negative percentage changes of rainfall in major rainy season are consistent with projected rainfall for all GCMs and both time periods. Changes in annual rainfall are mainly attributed to rainfall changes in the major rainy season. On the minor rainy season, there are three cases out of six projections having negative percentage changes of rainfalls, and the decrease in the far future period are larger than those in the near future period. Unlike positive percentage changes mostly observed in annual and major rainy season, only the rainfall projections by the ECHAM-A2 are all negative percentage changes for both time periods. The projected increase in rainfall and streamflow could lead to different situations. In one way, it would provide abundant water supply for a growing population near the subbasin. However, projections of large rainfall increase in the major rainy season will induce higher risks of flooding, but, on the contrary, rainfall decrease in the minor rainy season increases the possibilities of water stress. In order to minimize the possible negative impacts, it is suggested to study the likelihood of extreme weather events in future.
Evapotranspiration
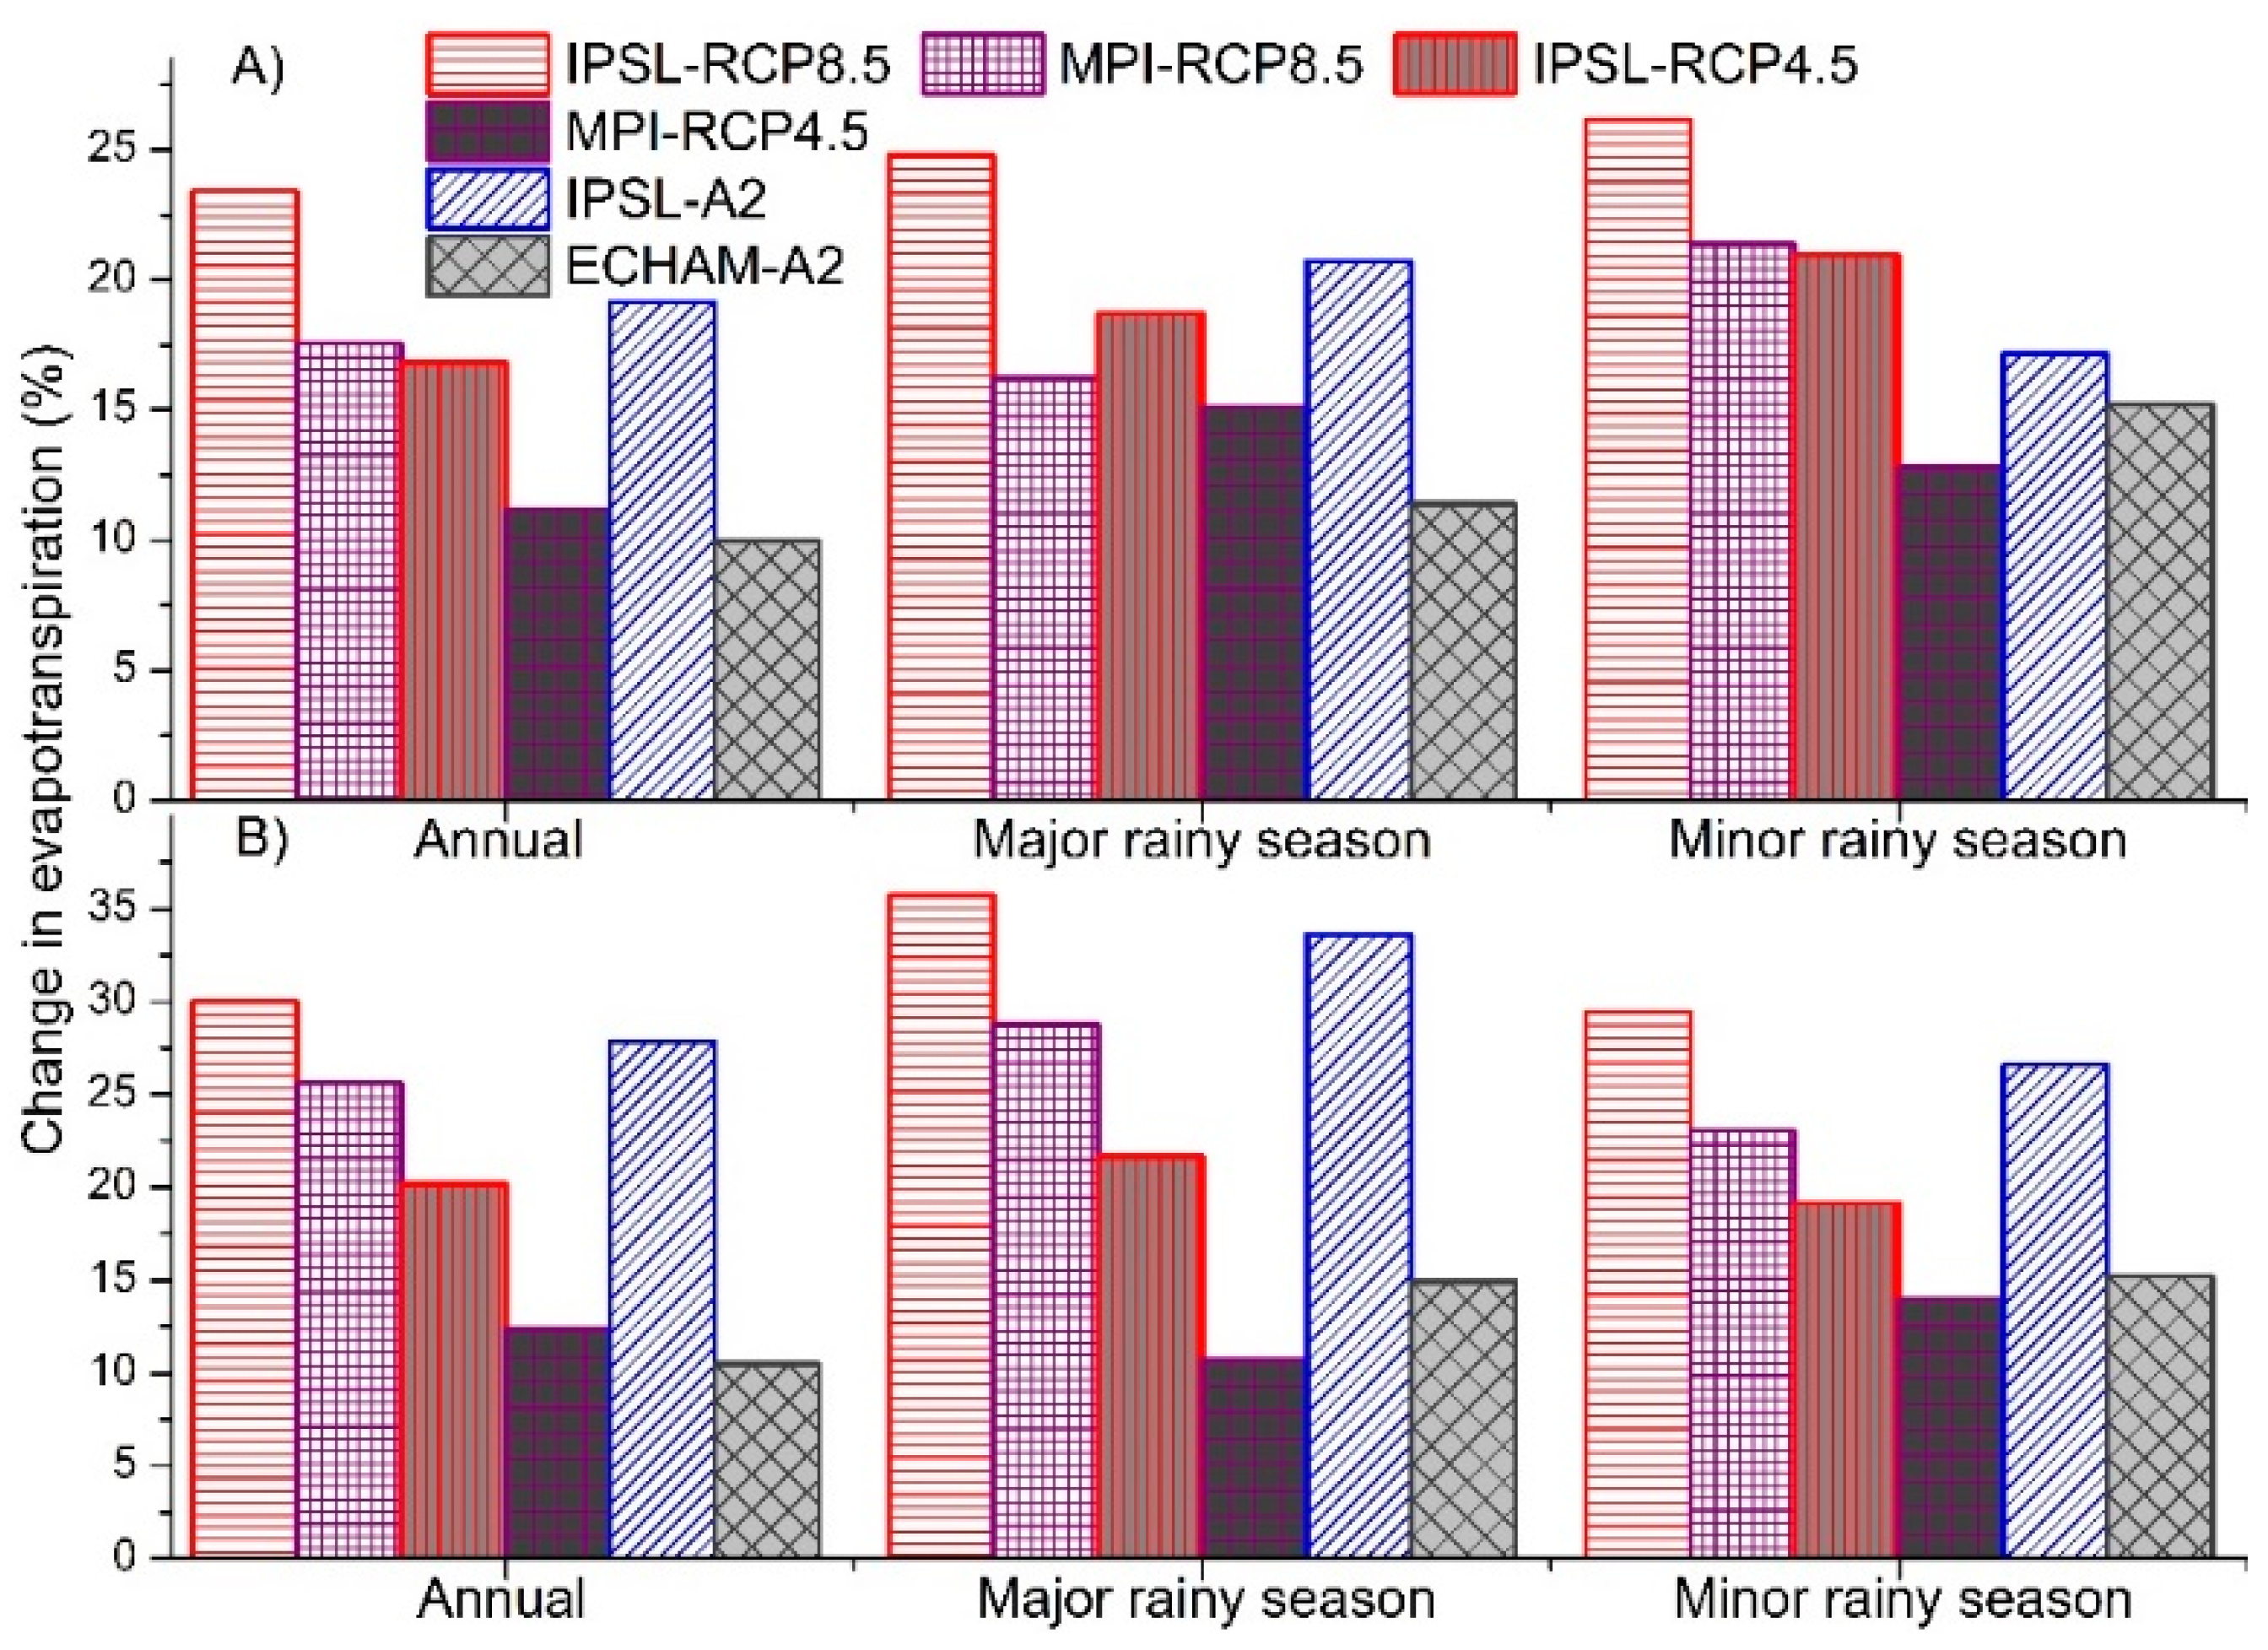
Figure 12 shows the percentage change in annual and seasonal evapotranspiration calculated by the HBV model with different GCMs for both time periods. The increase in evapotranspiration is mainly attributed to the rising temperature projections (i.e., Figure 9 and Figure 10). The increase in evapotranspiration in the far future period are larger than those in the near future period. Projections from the IPSL-RCP8.5 have the largest increase in evapotranspiration among six scenarios adopted in this study. For example, the annual evapotranspiration increases from the lowest of 10% (ECHAM-A2) to the highest 23% (IPSL-RCP8.5) in 2021–2050, and from the lowest of 11% (ECHAM-A2) to the highest of 30% (IPSL-RCP8.5) in 2071–2100. For the minor rainy season, evapotranspiration increases from the lowest of 12% (MPI-RCP4.5) to the highest of 26% (IPSL-RCP8.5) in 2021–2050, and from the lowest of 14% (MPI-RCP4.5) to the highest of 29% (IPSL-RCP8.5) in 2071–2100. In addition to projected decrease in rainfall in the minor rainy season, increased evapotranspiration will exaggerate the severity of water stress.
Streamflow
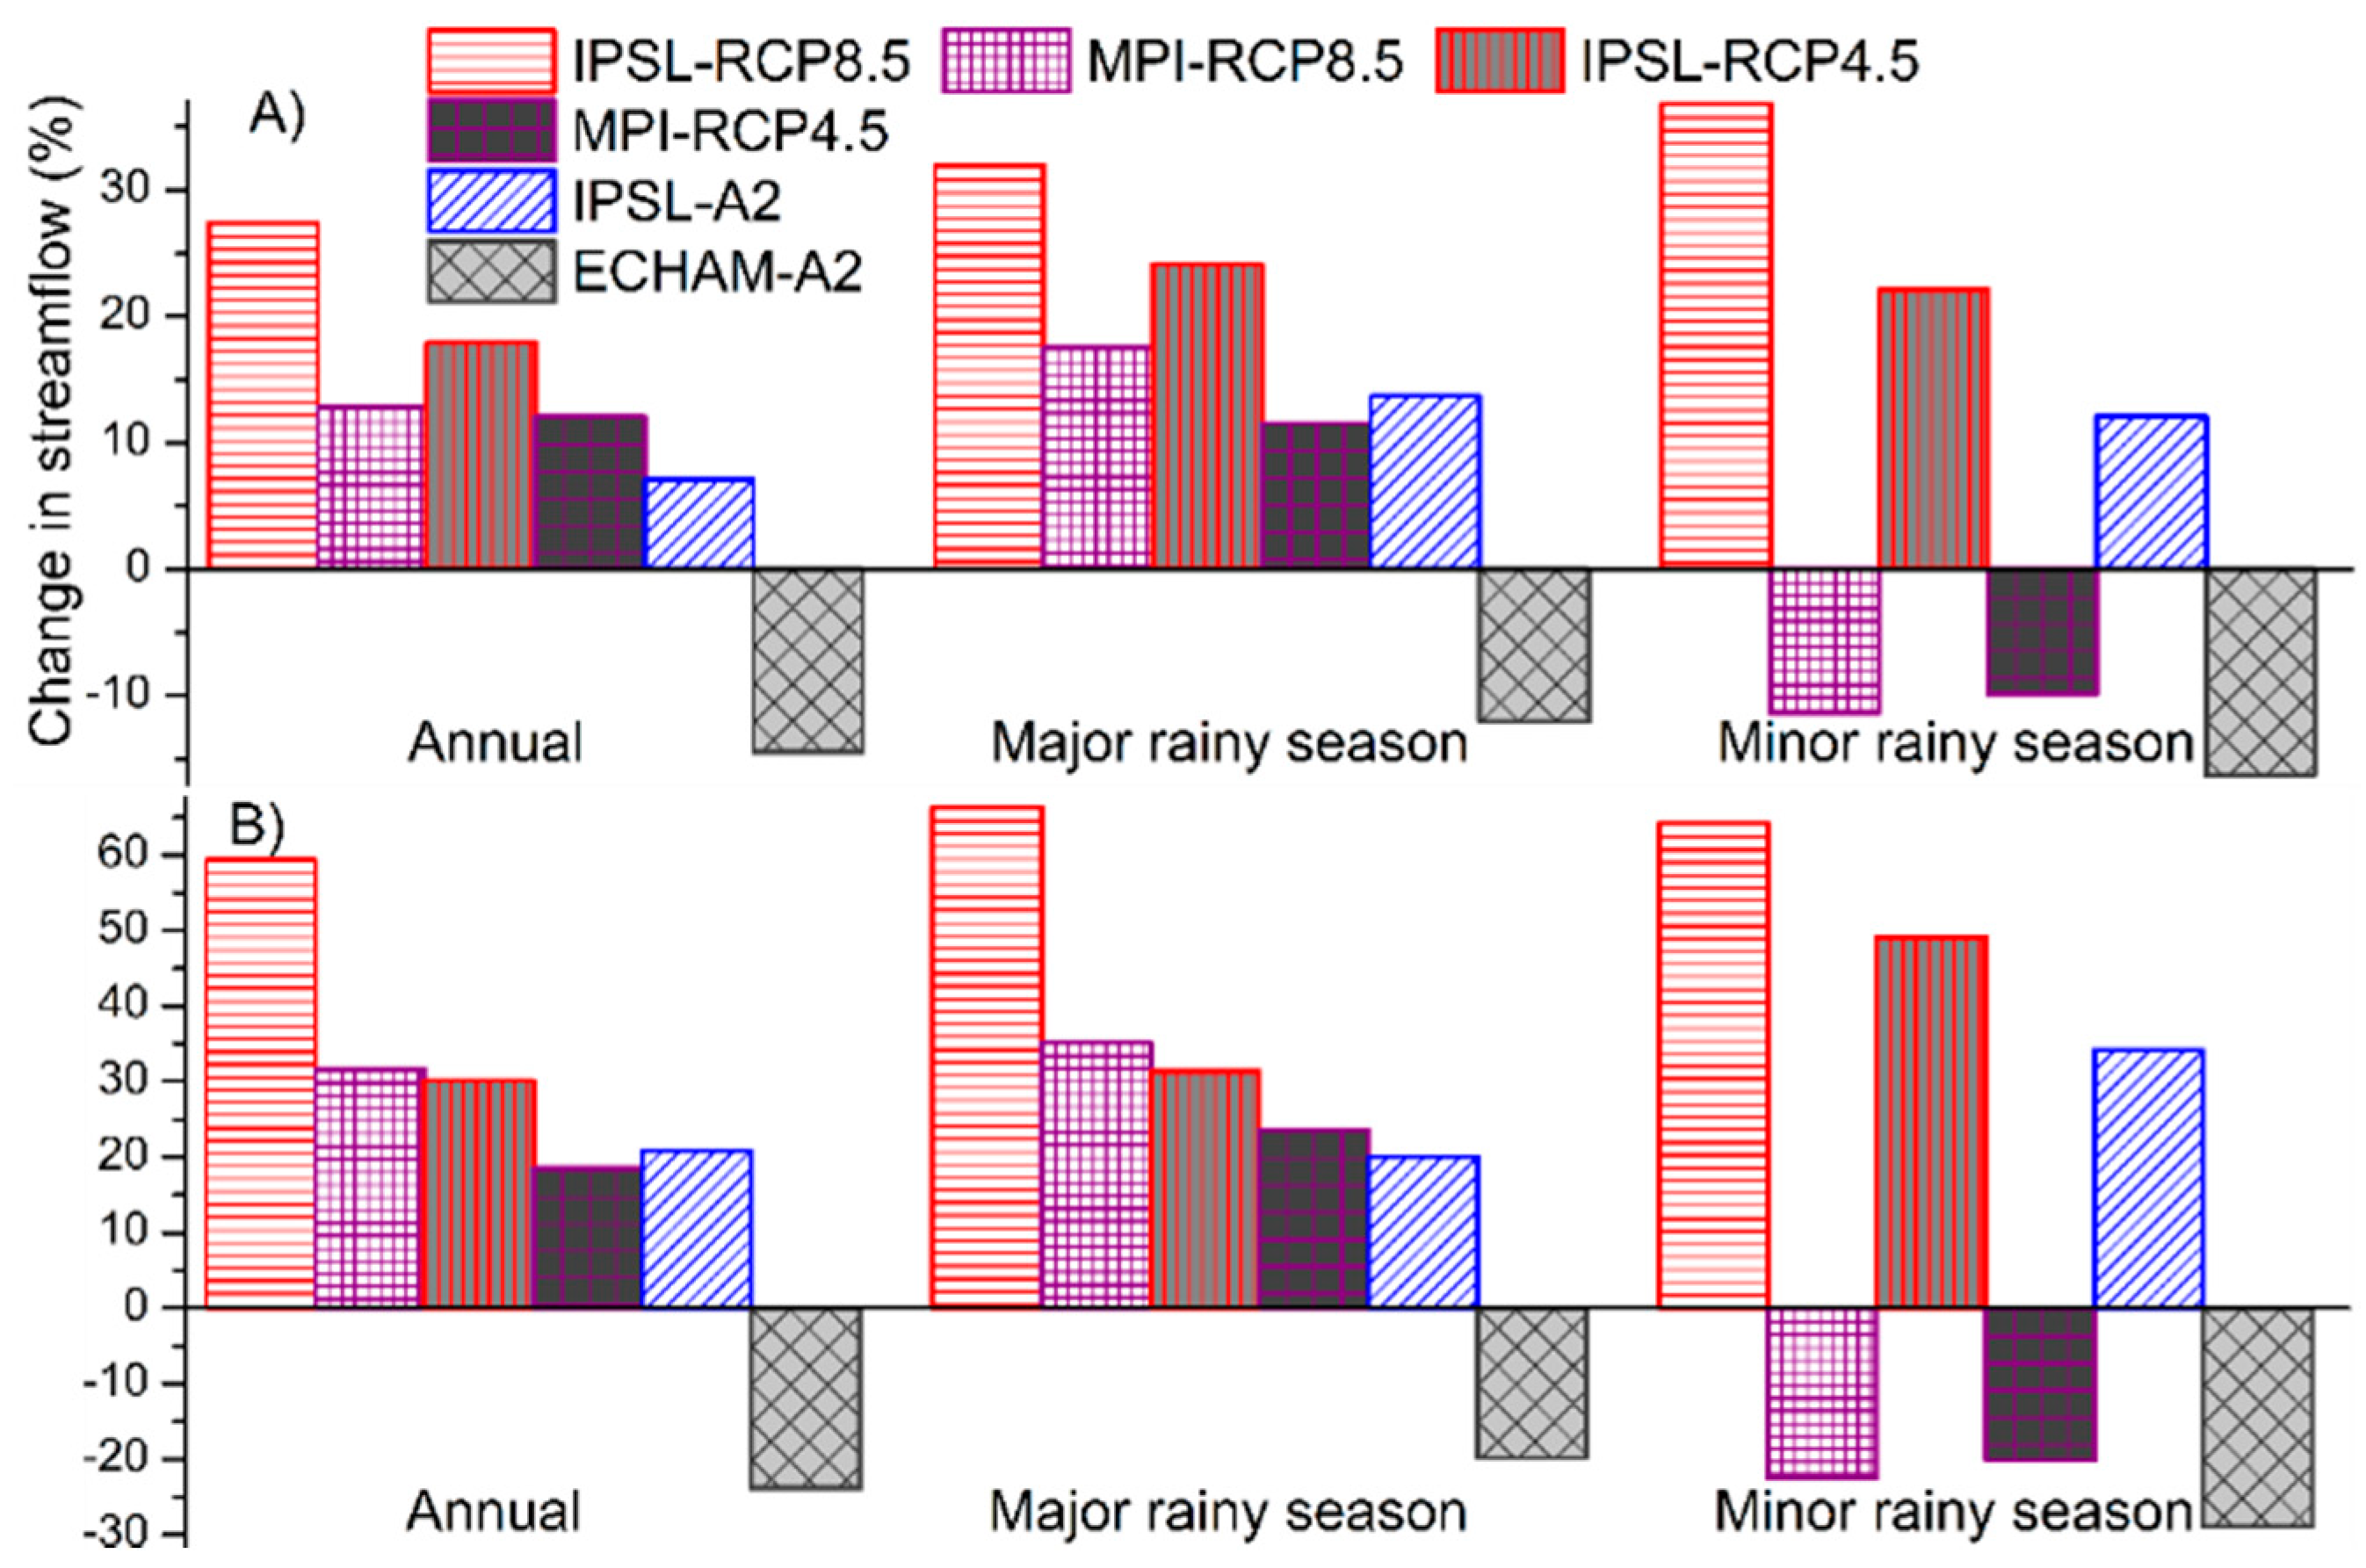
Projected streamflow is simulated by the HBV model under AR4 and AR5 scenarios and present as percentage changes, with reference to those simulated with the baseline, as shown in Figure 13. Similar to changes in annual rainfall, the IPSL with RCP8.5 has the largest increase in annual streamflow among the others, and the annual streamflow increase during the far future period is larger than those during the near future period for all GCMs. For example, the streamflow is projected to increase from 7% to 27% for the annual, and from 11% to 32% for the major rainy season during 2021–2050, except for those with ECHAM-A2. For the far future period, the annual streamflow is expected to increase from 18% to 59%, and from 19% to 66% for the major rainy season. The projected annual streamflow falls within the range found for the nearby region, e.g., 6% [36] to 70% [69]. The increase in annual stream flow is mainly contributed to the increase in streamflow in the major rainy season. For the minor rainy season, there are three cases out of six projections having negative percentage changes in streamflow, and the decreases in the far future period are larger than those in the near future period, which are similar to those observed in rainfall projections. Among all the GCMs scenarios adopted in this study, only the streamflow calculated with the ECHAM-A2 projections show all negative percentage changes for both time periods. Projections of large increases of streamflow in major rainy season will induce higher risks of flooding, but, on the contrary, the decrease in streamflow in the minor rainy season increases the possibilities of water stress. The projected decrease in streamflow under ECHAM_A2 shows the worst scenario of having a decrease in rainfall and an increase in evapotranspiration simultaneously in this study. The decrease in rainfall/streamflow does not only exacerbate the water scarcity issue, but will also increase the water demand of nearby subbasin, due to increased evapotranspiration.
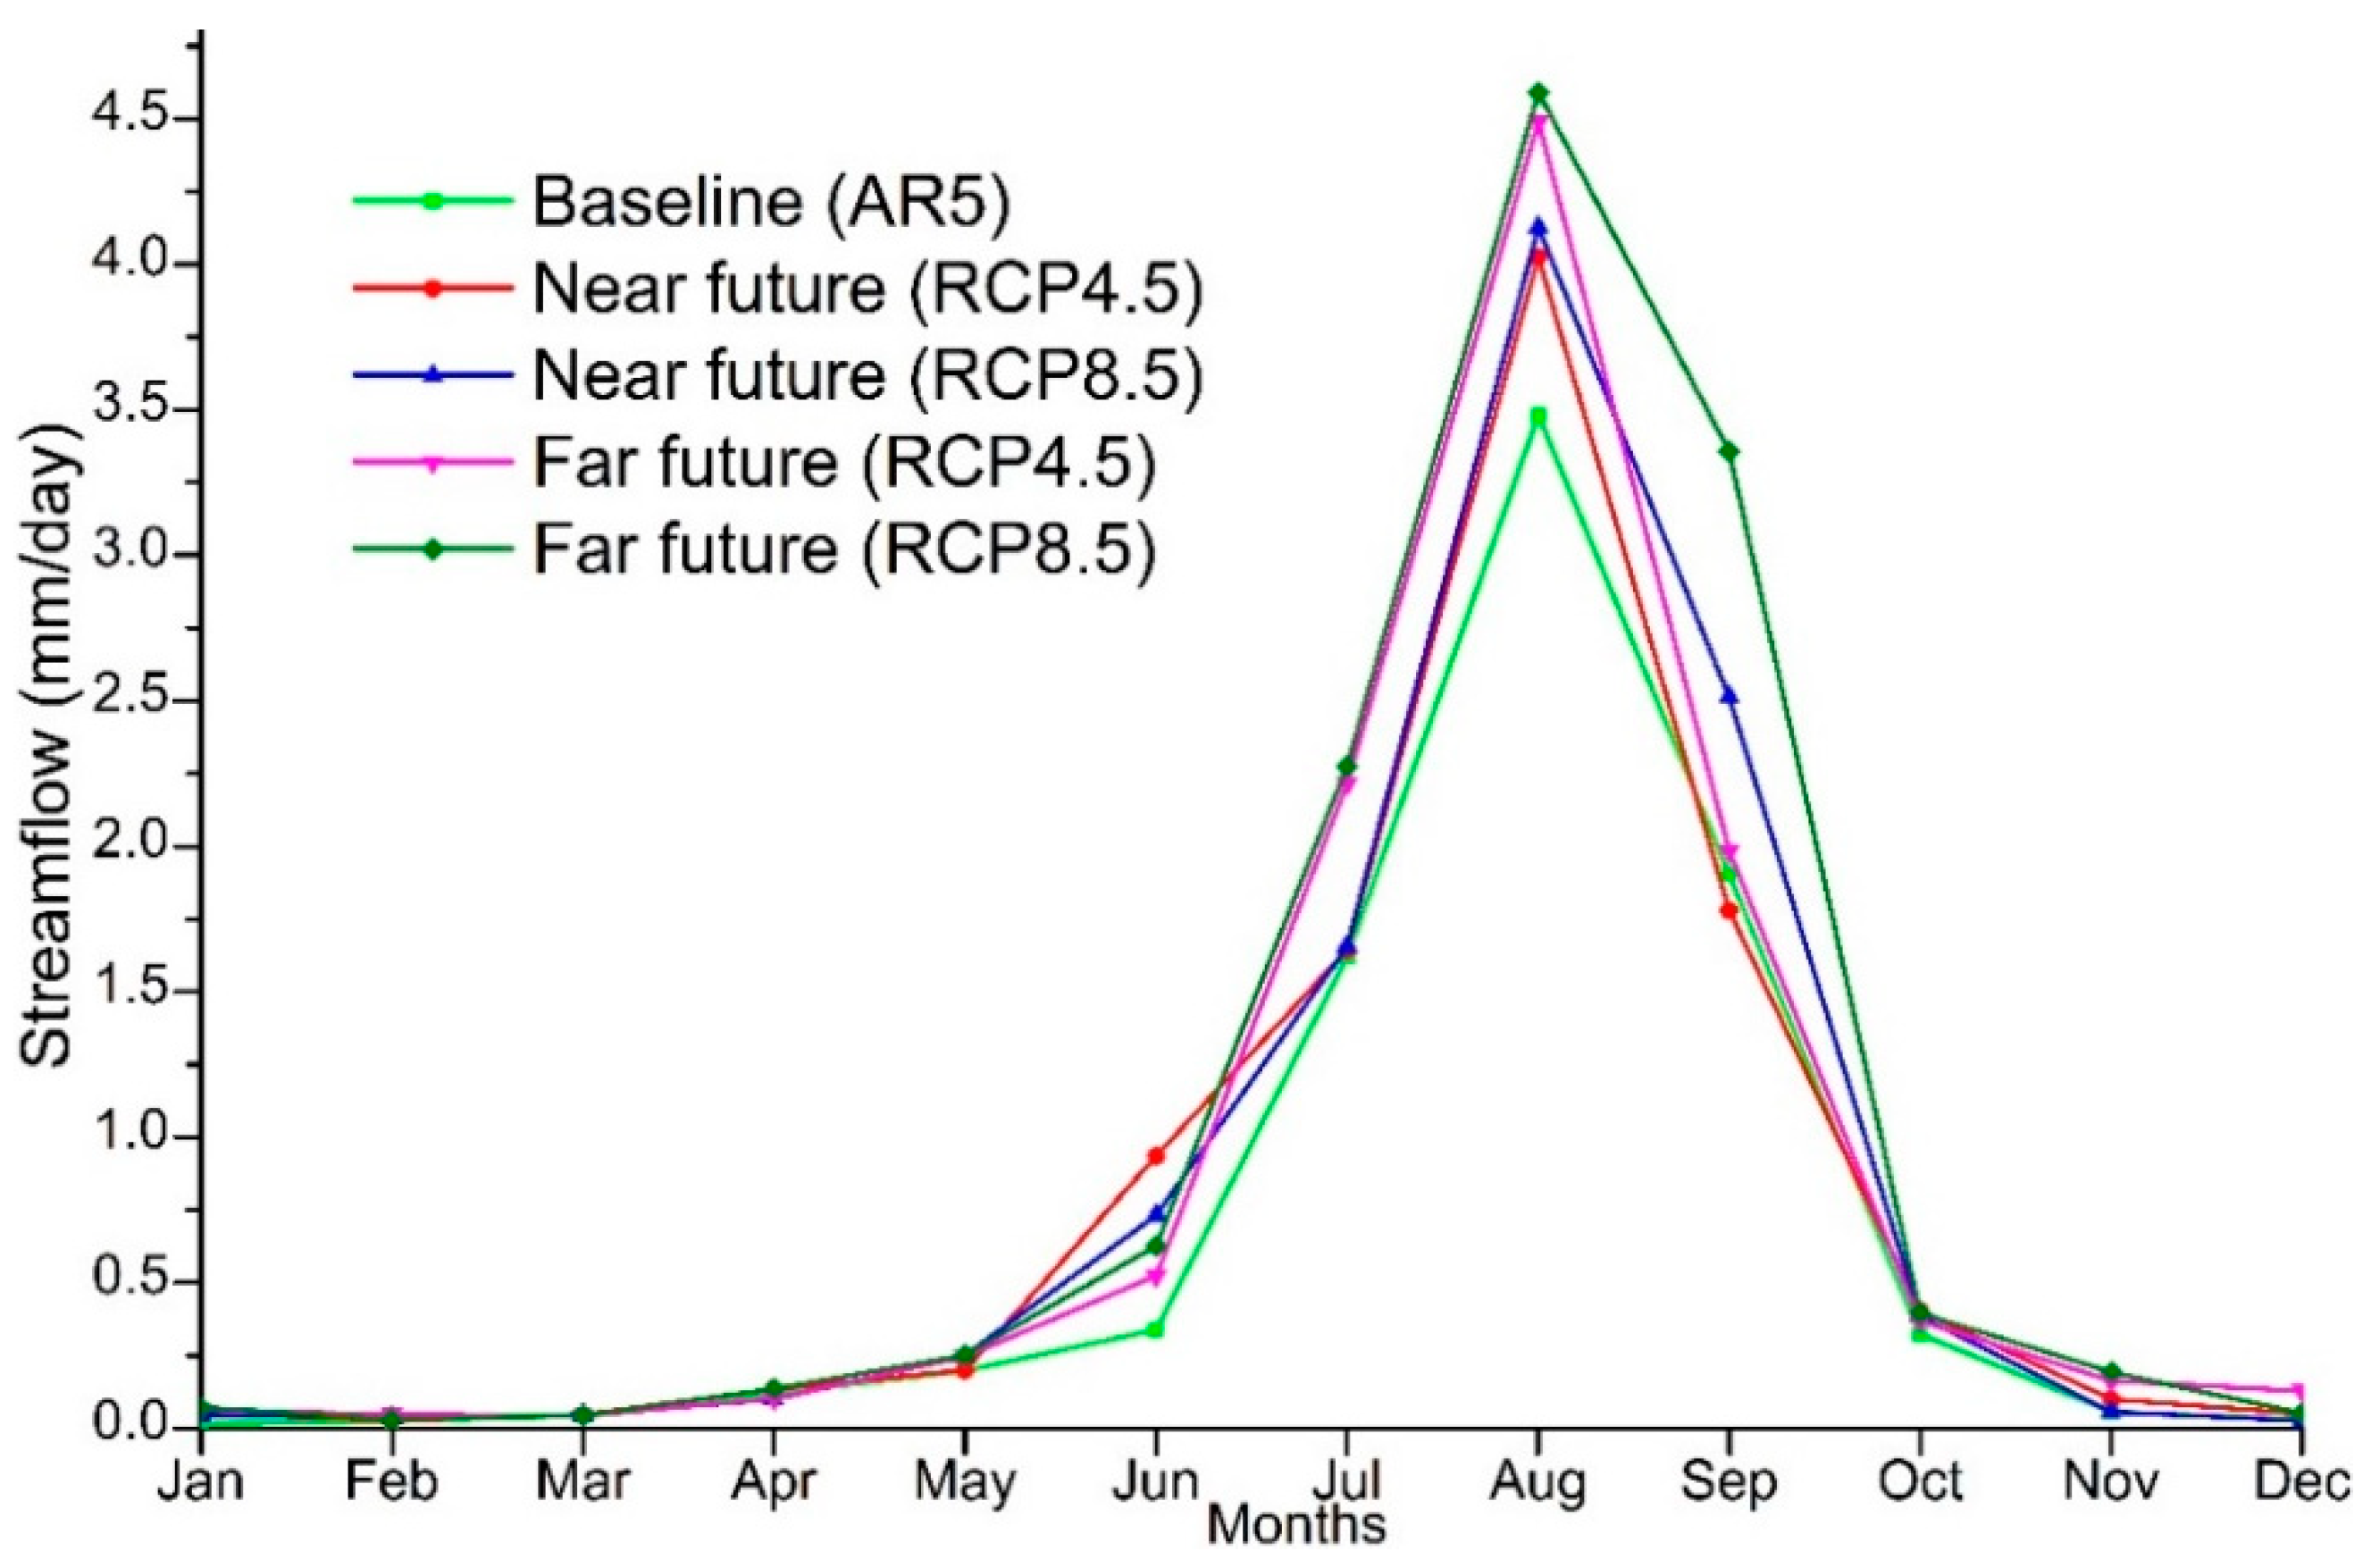
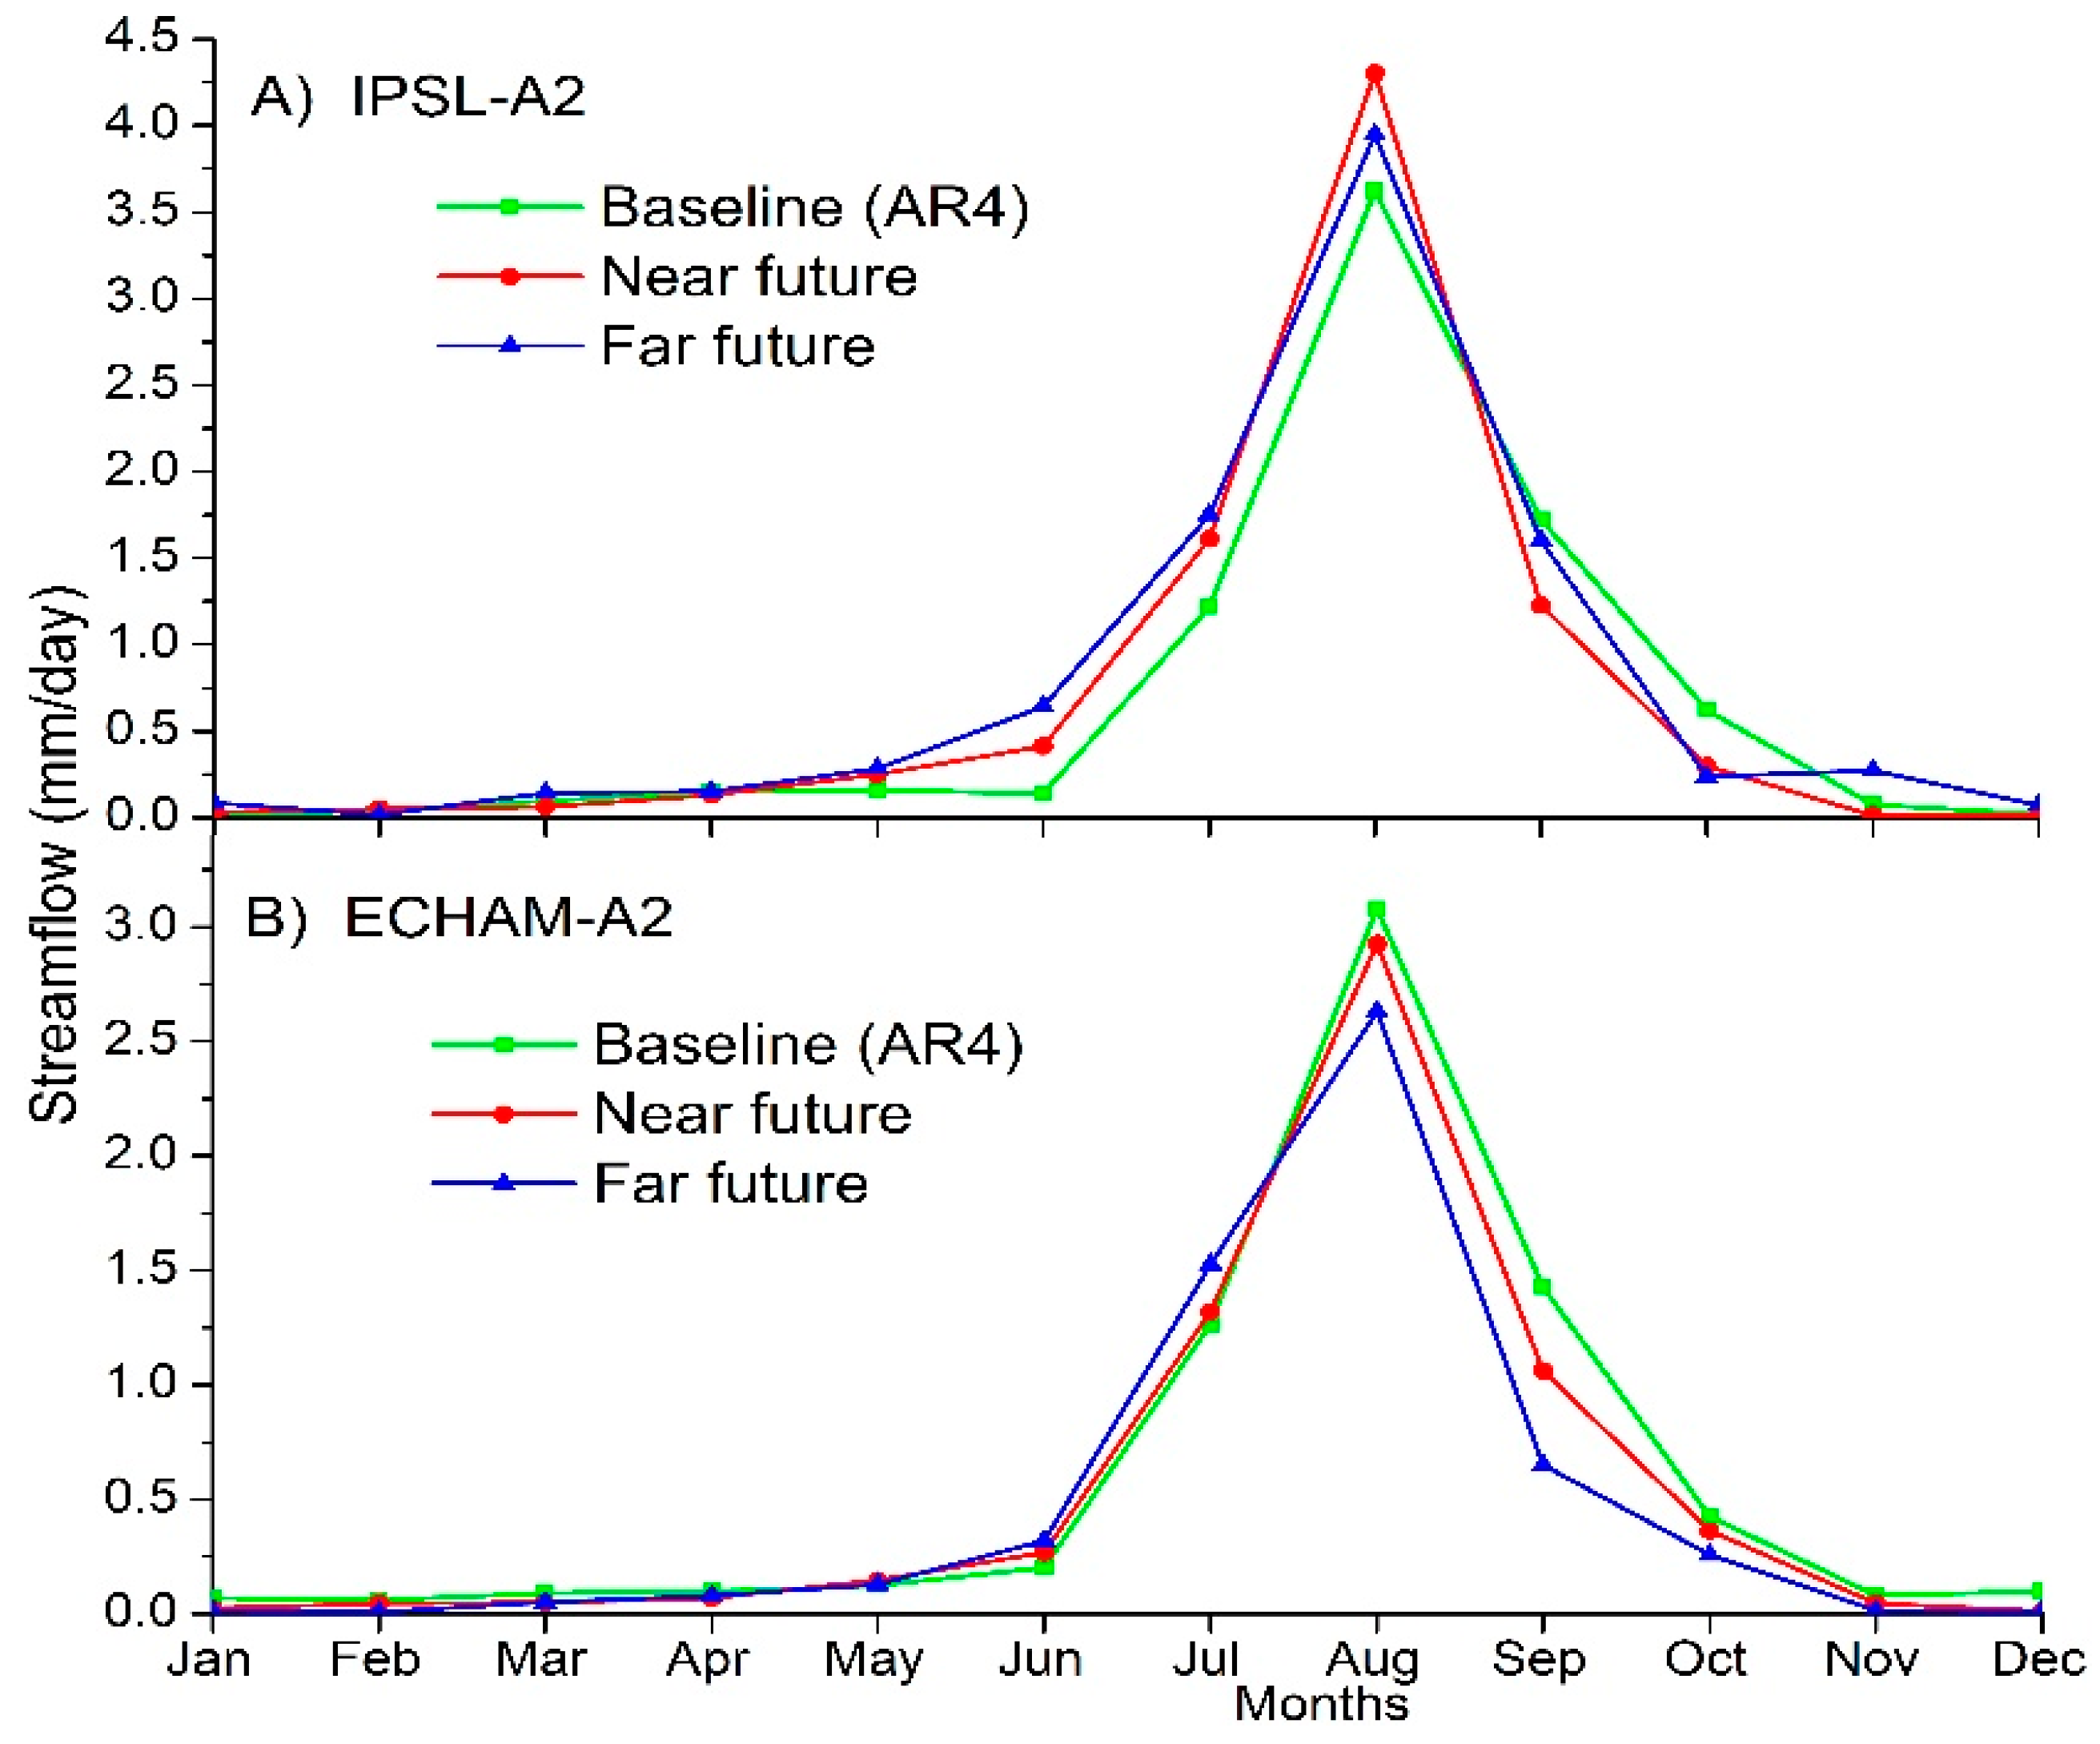
Figure 14 and Figure 15 presents comparisons of projected monthly streamflow with the baseline streamflow for AR5 and AR4 scenarios, respectively. Since projections of IPSL and MPI are quite consistent in terms of an increase or decrease in streamflow, the projected streamflow of both GCMs are averaged in association with RCP4.5 or RCP8.5 scenarios, as shown in Figure 14, for both time periods. An increase in streamflow under RCP8.5 is higher than those with RCP4.5, as well as those during the far future, which are higher than those during the near future. The most significant increase in the monthly streamflow is in August, while the September streamflow has the most notable differences between RCP4.5 and RCP8.5. Since the projected percentage changes in seasonal streamflow with ECHAM-A2 and IPSL-A2 are not consistent (Figure 13), projected monthly streamflow is presented separately, as shown in Figure 15A,B. Most monthly streamflow projected with the ECHAM-A2 are lower than the baseline, except in May, June and July. Projected streamflow with the ECHAM-A2 from August to December during the far future period is significantly lower than those during the near future period, which is the most inconsistent projection among the six scenarios adopted in this study. For the IPSL-A2, projected streamflow form May to August is much higher than the baseline, but lower than the baseline in September and October for both time periods.
Trends of projected streamflow are compared with findings of recent studies in Ethiopia. Increased runoffs in the wet season and inconsistent trends in the dry season for the Gilgel Abay basin using six AR4 GCMs and seven AR5 GCMs [9,10] are consistent with our findings. A projected increase in the mean annual streamflow of the Baro and Tekeze basins located in western and northern Ethiopia, respectively, using ten GCMs under the RCP4.5/RCP8.5 scenarios, is also consistent with our results l36]. Similarly, projections of increased annual runoff with the HadCM3 under A2 and B2 scenarios are expected for the Gilgel Abay basin, with percentage changes in seasonal streamflow up to 30% and 40% during the minor and major rainy seasons, respectively [25,70]. Runoff projections simulated with 17 GCMs under A1B and B1 scenarios show the likely increased trend by the 2050s for the Nyando River, and inconsistent trends, in terms of increasing or decreasing, for the Lake Tana catchments [32], which is similar to the MK subbasin under the A2 scenario. The streamflow from June to September simulated by the HEC-HMS model with the HadCM under the A2 scenario is also projected to decrease for the upper Beles River Basin (also nearby the Lake Tana) [71]. However, the streamflow simulated by the HBV for most of subbasins in the Upper Blue Nile Basin is likely to decrease during the near future under the RCP 4.5 scenario, which is the opposite of the findings of this study [30]. Changes in streamflow simulated by the HBV model with ECHAM, CNCM3 and IPSL under the A2 scenario for the Lake Tana catchments are similar to findings of this study. For example, streamflow in major rainy season under ECHAM-A2 scenario for both time periods is expected to decrease, while the other two GCMs exhibit the opposite trends [33]. The projection of decreased streamflow under the ECHAM-A2 scenario is opposite to the other projections found in our work and in recent studies under the AR4 and AR5 scenarios. As a matter of fact, more frequent droughts in the East Africa have been observed over the past 30 years [72]. Projections with the ECHAM-A2 scenarios should be considered an unlikely case, rather than an excluded case, as the impacts of droughts will be more devastating to regional socioeconomics and food security. How to enhance societal resilience with actionable adaptions is still a challenging issue.
The inconsistency in the rainfall and streamflow projections among GCMs can be attributed to the uncertainties of complex topography, physical processes, parameterization schemes and feedback mechanisms considered by different GCMs [73,74]. In addition, the inconsistency indicates the importance to re-analyze the possible variation of hydrological variables with new versions of GCMs under future scenarios. Under the influence of global warming, water scarcity is expected to intensify, as the rate of evapotranspiration increase. Although there are some uncertainties in the minor rainy season projections, the streamflow is more likely to increase, based on most of the GCMs. Therefore, advanced planning and effective implementation of water management strategies should be considered with the support of impact assessment. Based on projections under AR5 scenarios, flashfloods are likely to increase in the subbasin, particularly during the major rainy season. As a result, runoff (rainfall) water harvesting during the major rainy season could minimize the shortage in the minor rainy season or the impact of flash flooding in the major rainy season. Appropriate water conservation schemes are necessary for a wider range of climate conditions.
4. Discussions
There are 12 major rivers in Ethiopia, each having a different climate pattern, topography and land-use/land-cover distributions. Most studies of climate change in Ethiopia focus on the Upper Blue Nile basin instead of the Awash basin [9,10,25,29,30,31,33]. However, the Awash basin has suffered from water stress, and is highly vulnerable to climate change, because of large agricultural, industrial, and domestic water demands, as emphasized in the Ethiopia’s 2nd National Communication to the United Nations Framework Convention on Climate Change (UNFCCC) [75]. Regarding our finding of having higher maximum temperature from March to May (Figure 9), other studies on neighboring regions presented similar results that the projected increase in the maximum temperature in May is larger than that in March, including in the Finchaa subbasin of the Upper Blue Nile Basin [29], the Awash Basin [38], and the Upper Beles River Basin [71]. On the other hand, the fluctuation of temperature within some particular months will be less than observed patterns, due to the increases in the minimum temperature being higher than the increases in the maximum temperature (Figure 9 and Figure 10). Similar findings exhibit in studies of the nearby Finchaa sub-basin [29], the Jemma sub-basin [40] of Upper Blue Nile Basin, and the Hombole subbasin [36] and the Keleta subabasin [69] of the Awash basin. Although both findings of seasonal shift in the maximum temperature and higher increase in the minimum temperature can be observed from the numbers presented in these comparable studies, they overlook both findings and associated implications of such changes to the society in their presentations. For example, the precautions of heatwave seasons and the advantages of less chilling damage on crops at the MK subbasin can be considered an the implication of our findings.
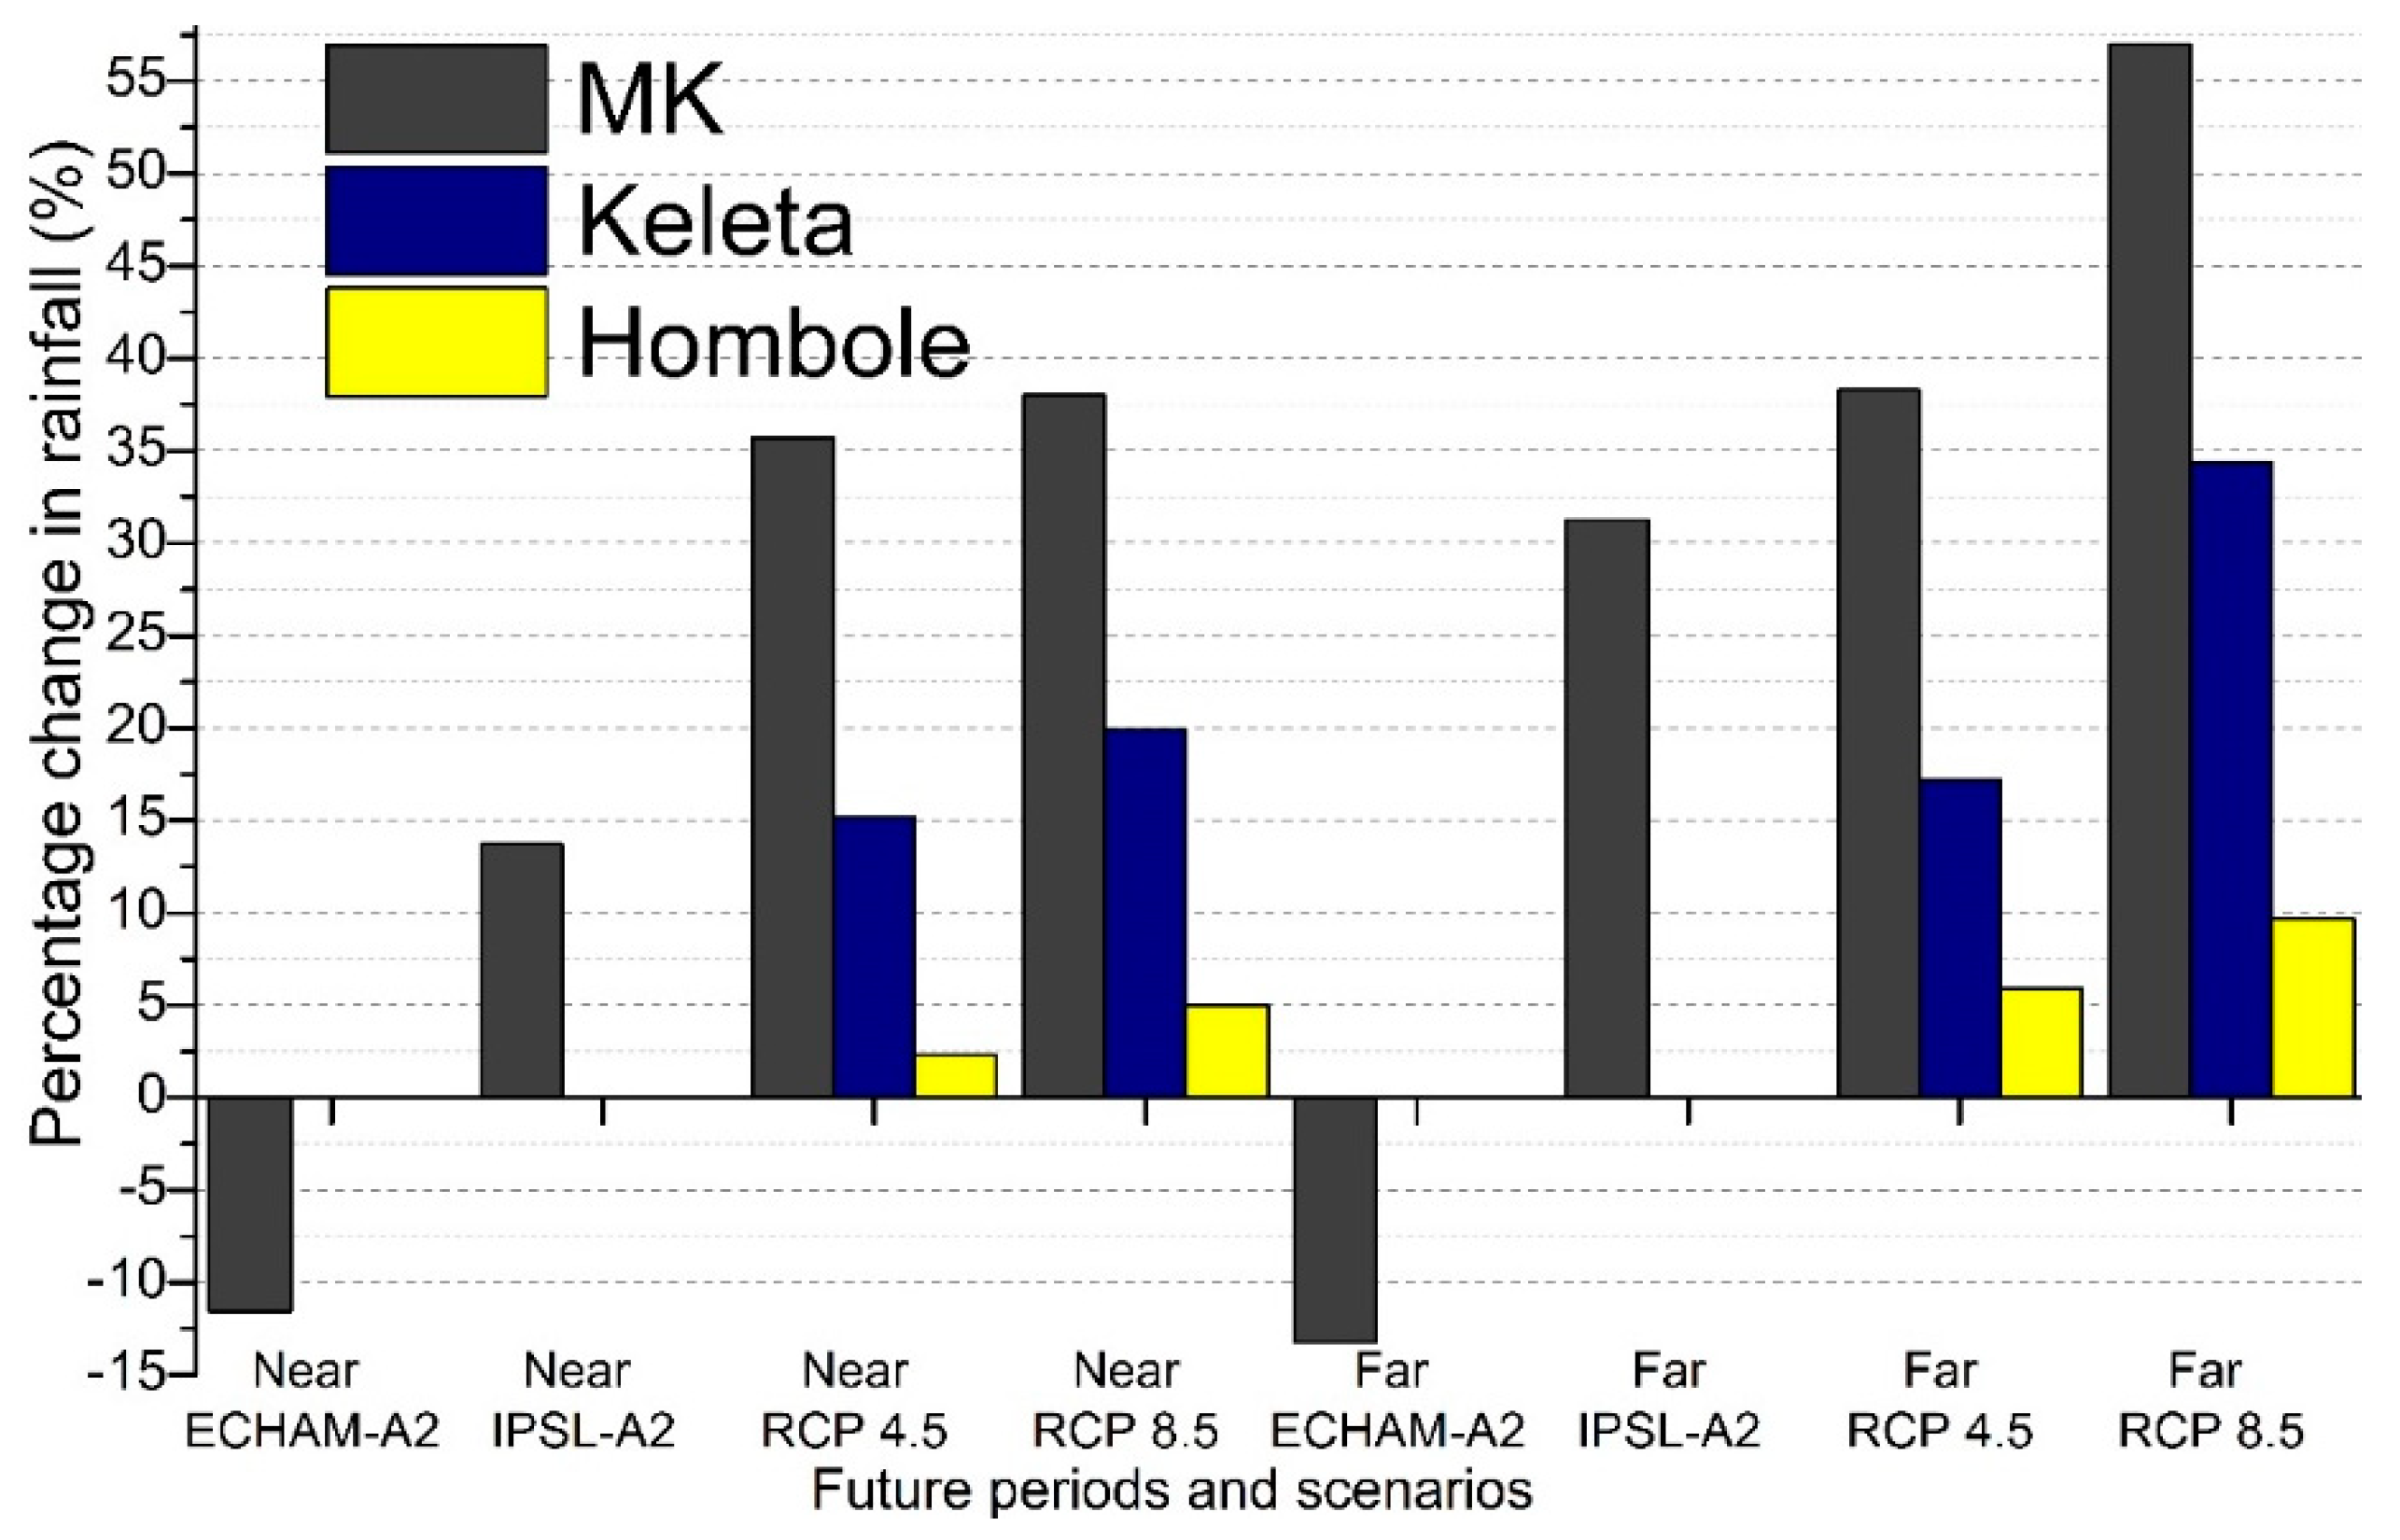
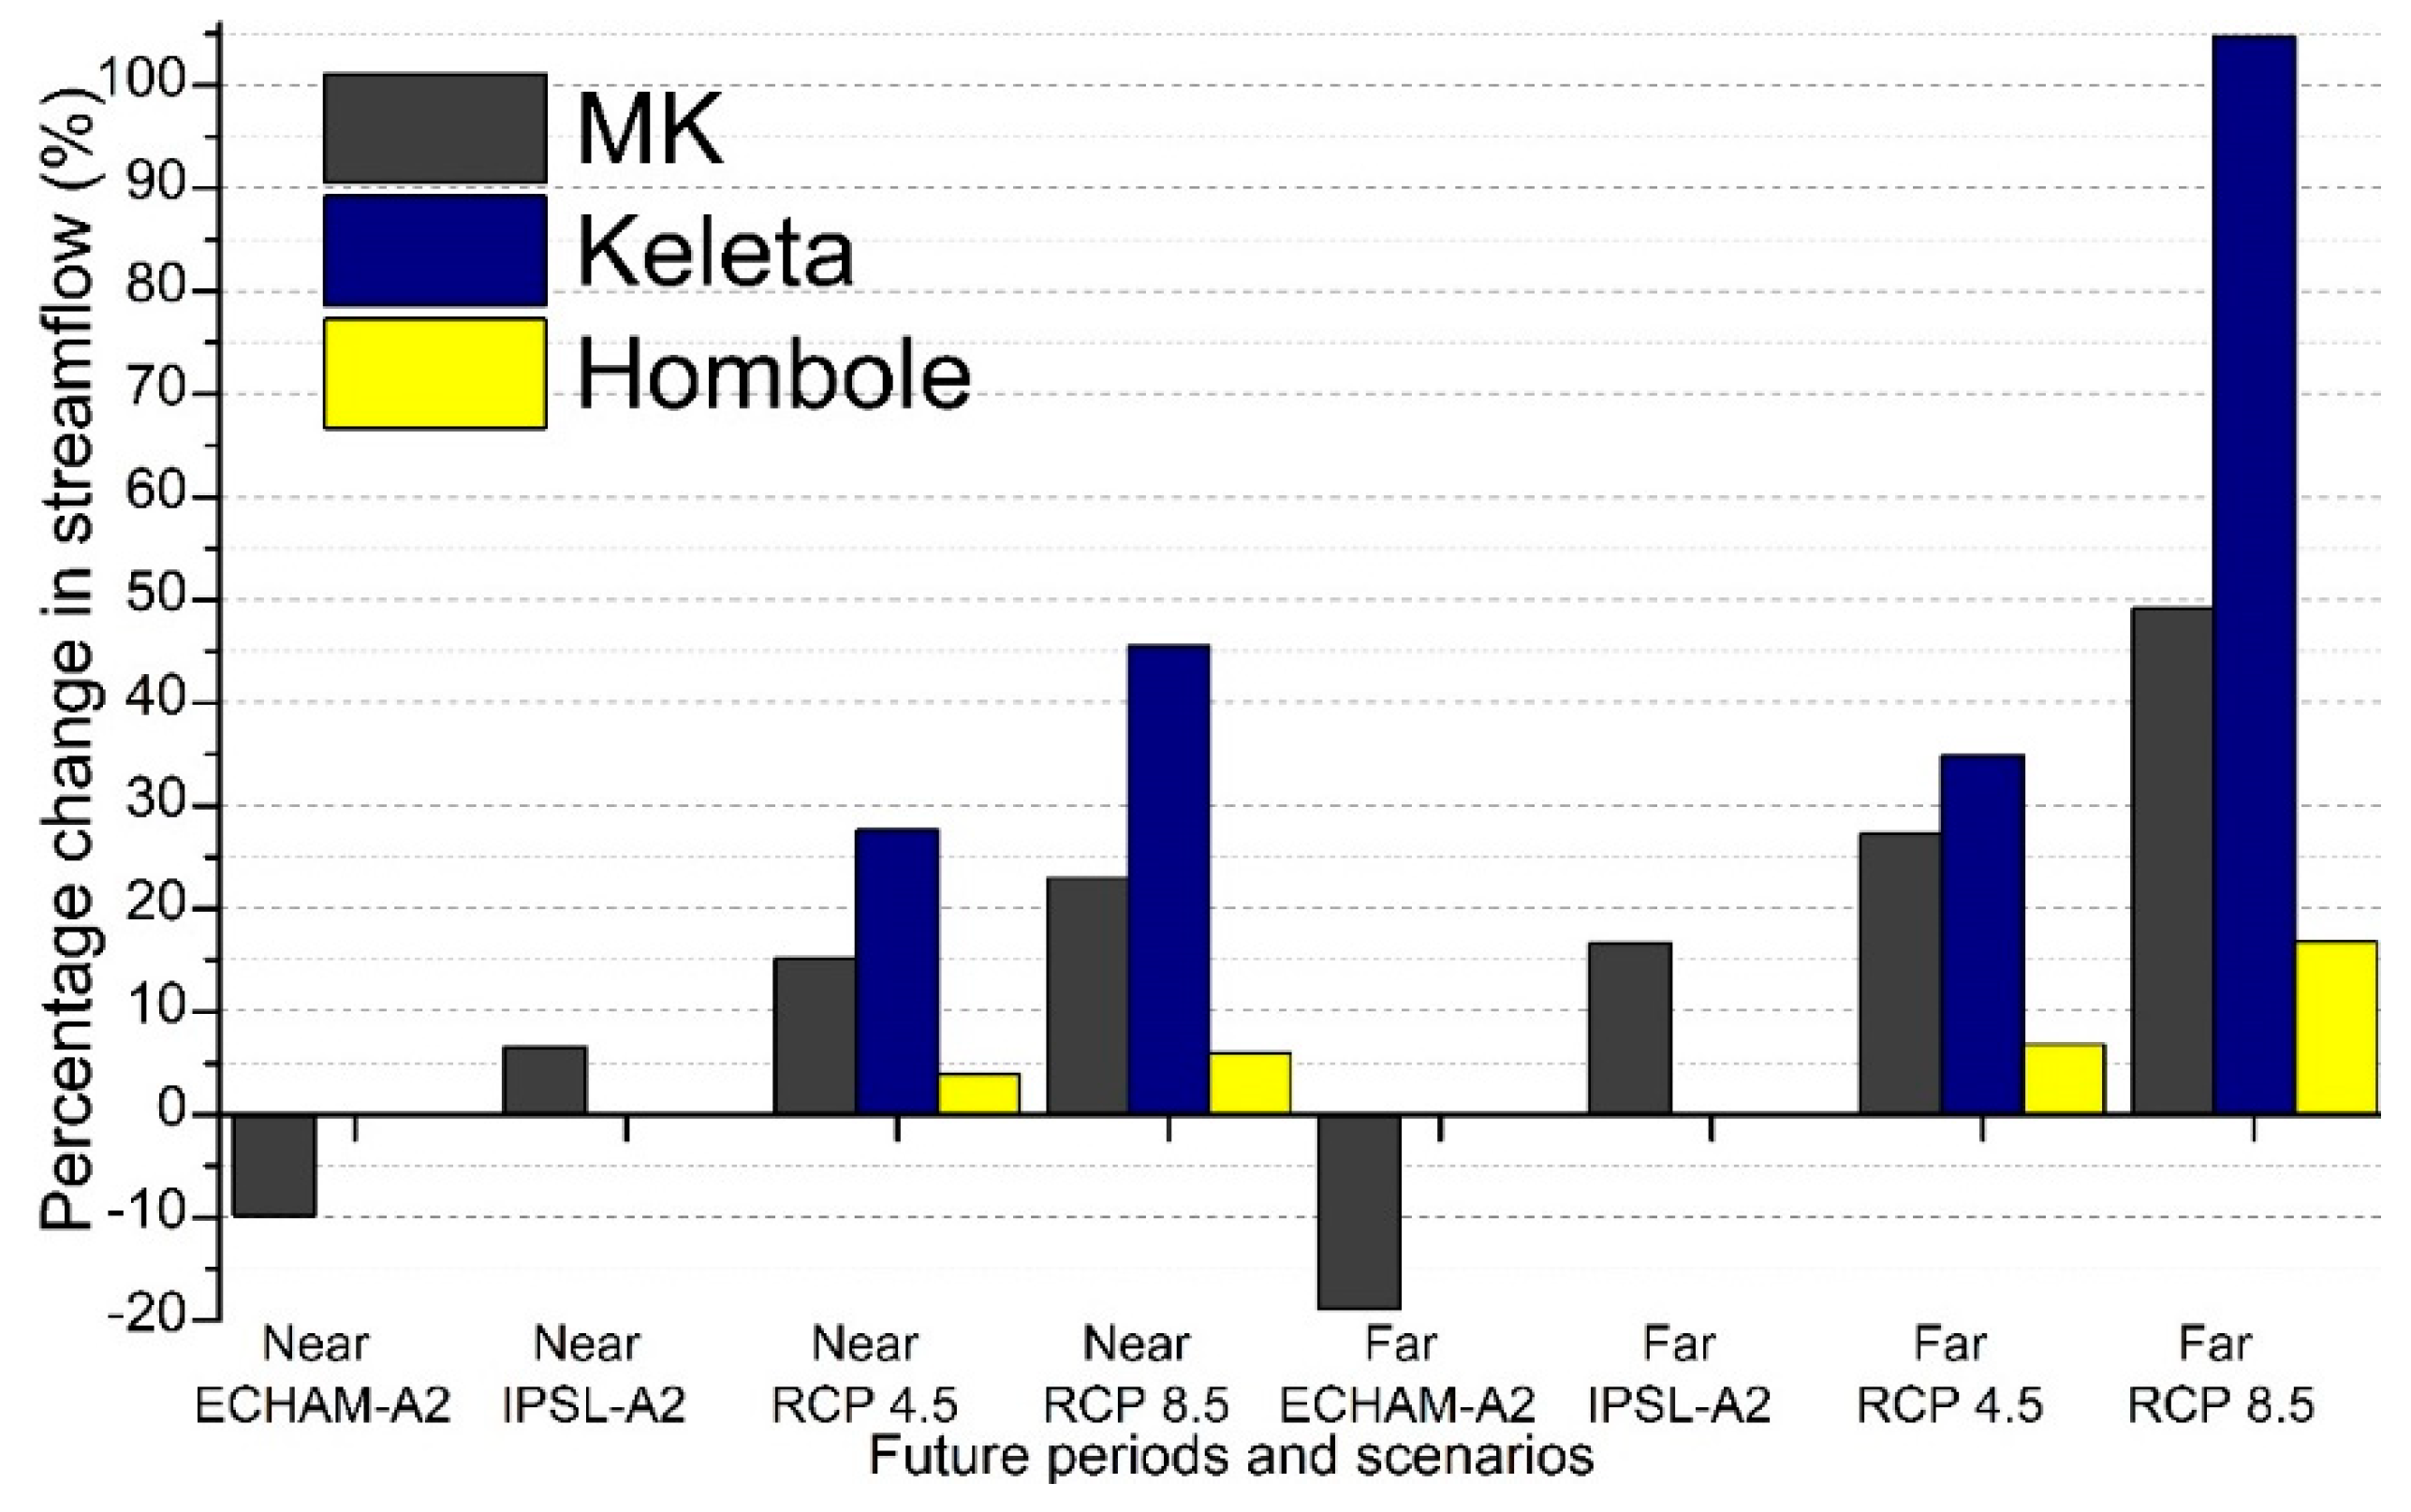
The Awash basin encompasses varied topography and climate patterns. Recent studies on the other two Awash subbasins, the Hombole [36] and the Keleta [69], using the RCP4.5 and RCP8.5 scenarios, were compared with our findings on projected changes in temperature differences (TD, Figure 16), rainfall percentages (RP, Figure 17), and streamflow percentages (SP, Figure 18). The drainage areas of the Keleta, the MK, and the Hombole subbasins are 850 km2, 4456 km2 and 7731 km2, respectively. The Hombole is a much larger subbasin contains the MK. The following discussions are based on numbers presented in Figure 16, Figure 17 and Figure 18 adopted from data presented in recent studies for the Keleta [69] and the Hombole [36]. Unlike the Hombole case, both the MK and the Keleta subbasins are categorized as highland basins. The Hombole has the largest increase in TD, compared to the other two highland subbasins (Figure 16). However, the increases in both RP and SP are higher for the two highland basins than in the Hombole subbasin. Downscaled projections indicate likely increases in rainfall and extreme rainfall in the regions of high or complex topography of the Ethiopian Highlands by the end of the 21st century, as concluded in AR5 [46]. The MK has a larger increase in RP, but a lower increase in SP, compared to the Keleta subbasin. It is noted that the projected changes in TD, RP and SP with the RCP8.5 for the near future are even more profound than those with the RCP4.5 for the far future in the Keleta, and only the TD in Hombole exhibits a similar trajectory on TD.
The trends of increased (or decreased) projections are mostly consistent among the three subbasins under all scenarios adopted in these studies, except those with the ECHAM-A2 in the MK. As mentioned in the Introduction of this study, the A2 storyline is similar to the RCP8.5 in terms of changes in global mean temperature and radiative forcing by the 2100. Although projected changes in TD with the ECHAM-A2 are comparable to those with the other scenarios used in this study, and the other two subbasins, its projected changes in RP and SP are considered to be the less likely case in the MK, due to inconsistent projected trends with respect to the others compared herein. In contrast, projected changes in TD with the IPSL-A2 are comparable to the other scenarios. It is noted that the projected changes in RP and SP with the IPSL-A2 are smaller than those with RCP4.5 and RCP8.5 for both time periods in the MK subbasin. Projected changes in RP with the IPSL-A2 in the MK are larger (smaller) than those with the RCP8.5 in the Hombole (the Keleta) for both time periods. It is suggested that projections with the IPSL-A2 should be considered one of the likely cases, due to its trends being consistent with the others. Projected changes in TD, RP and SP with the IPSL-A2 represents one possible trajectory of having less impact than those with RCP4.5 and RCP8.5 in the MK.
This study presents comparable changes in TD, RP and SP projections, as found in recent studies, which extend the current knowledge of climate change in the Ethiopia with a focus on the upper Awash subbasin. With only two models from AR4 and AR5, we understood the limitations of such combinations as many studies rely on the AR5 only. The planning of adaption measures should be informed by the impact assessment with different scenarios. It often takes time to adopt scientific findings into real actions for implementing adaption measures. For example, many materials on climate change impacts addressed in the most updated Ethiopia’s 2nd National Communication to the UNFCCC [75] were presented with the mixture of AR4 and AR5 scenarios. As discussed in the previous paragraph, projections with the IPSL-A2 adopted in this study should be considered one of the likely cases, which will provide values to policy makers to examine how significant differences in future hydrology with the AR5 scenario will manifest, if the early version of adaption plan were based on the AR4 scenario only.
It is often challenging to use GCMs data for impact assessment at a basin scale, such as the MK subbasin, due to the uncertainties and coarse resolutions of GCMs projections. Recent developments of downscaled RCMs products driven by the GCMs, such as the CORDEX database, demonstrate a beneficial GCM_RCM approach to capture regional climate signals with better spatial resolutions available up to 25 km. Alternatively, this study demonstrated the applications of downscaled and bias-corrected GCMs, with a half-degree spatial resolution, of the AR4 and AR5 scenarios and the HBV hydrological model, to assess impacts of climate changes on the MK subbasin. Major scientific findings contributing to the existing knowledge of the climate impact on the area include the following: the temporal shift of the monthly maximum temperature; the larger increase in the monthly minimum temperature than that of the monthly maximum temperature; significant increase in annual rainfall (streamflow), mainly attributed by increased rainfall (streamflow) in the major rainy season; similar seasonal patterns of projected streamflow; and inconsistent rainfall projections of the minor rainy season. The implications of these findings to the risk and opportunity of the area were discussed in previous subsections. The contributions of this study are necessary and complementary to the studies concerning large areas, such as the entire Awash River Basin.
5. Conclusions
The impacts of climate change on the hydrology of the MK subbasin are evaluated by the HBV hydrological model, with both AR4 and AR5 scenarios for the projection periods 2021–2050 and 2071–2100. Percentage changes in rainfall, evapotranspiration and streamflow are calculated as ratios of HBV simulations, under different GCMs scenarios, to their corresponding baseline. The basin is expected to be warmer in future, with notable increases of the minimum temperature larger than those of the maximum temperature. The peak of the monthly maximum temperature is projected to shift from March to April–May, which means high temperature months will be frequently experienced from March to May in the future. Evapotranspiration is expected to increase, along with rising temperature projection. With the warming temperature and enhanced evapotranspiration, surface water storage would be rapidly depleted.
Patterns of percentage changes in annual and seasonal simulated streamflow are similar to those in rainfall projections. Percentages of the increase in rainfall/streamflow under RCP8.5 scenarios are larger than those under RCP4.5 scenarios. Five out of six GCM projections, except ECHAM-A2, rainfall/streamflow in the major rainy season, are projected to increase in both time periods. Such consistent projections indicate that the basin is mostly likely to experience intensified flash floods in the future, especially the peak flow month of August. However, rainfall/streamflow projections in the minor rainy season found in this study should be handled with care, as their inconsistencies require further investigation.
The livelihood of communities near the MK subbasin are strongly dependent on surface water availability, such as ephemeral ponds, perennial springs and rivers and seasonal streams, which can be severely affected by even the slightest decrease in streamflow. The increased streamflow projected by most scenarios is the desirable projection, as it will supplement more water to sustain the growing population. It is then recommended to build sufficient infrastructures, such as reservoirs and retention ponds, to collect and store extra water for reducing the risk of flooding during the major rainy season. The increase in the minimum temperature may reduce the probability of chilling damage to crop products. However, the shift of the peak monthly maximum temperature may have impacts on the cropping seasons, and should inform the agricultural sectors. The study recommended that the findings presented herein should be considered for sound policymaking and to develop long-term adaptation strategies for better water management practice and agricultural productions. Results presented in current study are based on limited GCM scenarios. Uncertainties in GCMs and selection of scenarios remain great challenges of being able to provide reliable quantitative information to support decision making of adaption measures. Considering future socioeconomic development and population growth of the MK subbasin, effects of land use and vegetation changes and more GCMs scenarios should be included.
Author Contributions
Y.S.G. was responsible for data analysis, simulations, and writing the draft. M.-H.L. supervised and instructed results analyses and modified the manuscript. P.-Y.C. provided comments on results discussions with the other two authors. All authors have read and agreed to the published version of the manuscript.
Funding
This research received no external funding.
Acknowledgments
We would like to thank Henny Van and Fulco Ludwig from the Wageningen University and Niko Wanders from the Utrecht University for providing GCMs datasets, and Jan Seibert for allowing us to use the HBV-light model. The authors gratefully appreciate the Ethiopian Ministry of Water and Irrigation and Electricity, and the Ethiopian National Meteorology Agency for providing observed datasets of the study area. The authors sincerely appreciate valuable and constructive comments from two anonymous reviewers.
Conflicts of Interest
The authors declare no conflict of interest.
References
- Cheung, W.H.; Senay, G.B.; Singh, A. Trends and spatial distribution of annual and seasonal rainfall in Ethiopia. Int. J. Climatol. 2008, 28, 1723–1734. [Google Scholar] [CrossRef]
- Deressa, T.T.; Hassan, R.M.; Ringler, C. Perception of and adaptation to climate change by farmers in the Nile basin of Ethiopia. J. Agric. Sci. 2011, 149, 23–31. [Google Scholar] [CrossRef] [Green Version]
- Tilahun, H.; Erkossa, T.; Michael, M.; Hagos, F.; Awulachew, S. Comparative performance of irrigated and rainfed agriculture in Ethiopia. WASJ 2011, 14, 235–244. [Google Scholar]
- Worqlul, A.W.; Jeong, J.; Dile, Y.T.; Osorio, J.; Schmitter, P.; Gerik, T.; Srinivasan, R.; Clark, N. Assessing potential land suitable for surface irrigation using groundwater in Ethiopia. Appl. Geogr. 2017, 85, 1–13. [Google Scholar] [CrossRef]
- Belayneh, A.; Adamowski, J.; Khalil, B. Short-term SPI drought forecasting in the Awash River Basin in Ethiopia using wavelet transforms and machine learning methods. Sustain. Water Resour. Manag. 2016, 2, 87–101. [Google Scholar] [CrossRef]
- Borgomeo, E.; Vadheim, B.; Woldeyes, F.B.; Alamirew, T.; Tamru, S.; Charles, K.J.; Kebede, S.; Walker, O. The Distributional and Multi-Sectoral Impacts of Rainfall Shocks: Evidence from Computable General Equilibrium Modelling for the Awash Basin, Ethiopia. Ecol. Econ. 2018, 146, 621–632. [Google Scholar] [CrossRef]
- Hartman, D.L.; Klein Tank, A.M.G.; Rusicucci, M.; Alexander, L.V.; Broenniman, B.; Charabi, Y.; Dentener, F.J.; Dlugokencky, E.J.; Easterling, E.R.; Kaplan, A.; et al. Climate Change 2013: The Physical Science Basis. Contribution of Working Group I to the Fifth Assessment Report of the Intergovernmental Panel on Climate Change; Cambridge University Press: Cambridge, UK, 2013; pp. 159–254. Available online: https://eprints.soton.ac.uk/363409/ (accessed on 10 February 2019).
- Bian, H.; Lü, H.; Sadeghi, A.M.; Zhu, Y.; Yu, Z.; Ouyang, F.; Su, J.; Chen, R. Assessment on the Effect of Climate Change on Streamflow in the Source Region of the Yangtze River, China. Water 2017, 9, 70. [Google Scholar] [CrossRef] [Green Version]
- Ayele, H.S.; Li, M.-H.; Tung, C.-P.; Liu, T.-M. Impact of Climate Change on Runoff in the Gilgel Abbay Watershed, the Upper Blue Nile Basin, Ethiopia. Water 2016, 8, 380. [Google Scholar] [CrossRef] [Green Version]
- Ayele, H.S.; Li, M.-H.; Tung, C.-P.; Liu, T.-M. Assessing climate change impact on Gilgel Abbay and Gumara watershed hydrology, the upper Blue Nile basin, Ethiopia. Terr. Atmos. Ocean. Sci. 2016, 27, 1005–1018. [Google Scholar] [CrossRef] [Green Version]
- Rowling, M. Scientists Predict Drier Horn of Africa as the Climate Warms. 2015. Available online: https://www.reuters.com/article/us-africa-climatechange-aid/scientists-predict-drier-horn-of-africa-as-climate-warms-idUSKCN0S328K20151009 (accessed on 14 February 2019).
- Greve, P.; Orlowsky, B.; Mueller, B.; Sheffield, J.; Reichstein, M.; Seneviratne, S. Global assessment of trends in wetting and drying over land. Nat. Geosci. 2014, 7, 848. [Google Scholar] [CrossRef] [Green Version]
- Feng, H.; Zhang, M. Global land moisture trends: Drier in dry and wetter in wet over land. Sci. Rep. 2016, 5, 18018. [Google Scholar] [CrossRef] [PubMed]
- Lyon, B. Seasonal Drought in the Greater Horn of Africa and Its Recent Increase during the March–May Long Rains. J. Clim. 2014, 27, 7953–7975. [Google Scholar] [CrossRef]
- Lyon, B.; Vigaud, N. Unraveling East Africa’s Climate Paradox Ch. in Climate Extremes, Trends and Mechanisms. J. Geophys. Monograph. 2017, 226, 265–281. [Google Scholar]
- Souverijns, N.; Thiery, W.; Demuzere, M.; Van Lipzig, N.P.M. Drivers of future changes in East African precipitation. Environ. Res. Lett. 2016, 11, 114011. [Google Scholar] [CrossRef] [Green Version]
- Bryan, E.; Deressa, T.T.; Gbetibouo, G.A.; Ringler, C. Adaptation to climate change in Ethiopia and South Africa: Options and constraints. Environ. Sci. Policy 2009, 12, 413–426. [Google Scholar] [CrossRef]
- Falco, S.D.; Veronesi, M.; Yesuf, M. Does Adaptation to Climate Change Provide Food Security? A Micro-Perspective from Ethiopia. Am. J. Agric. Econ. 2011, 93, 829–846. [Google Scholar] [CrossRef] [Green Version]
- Wanders, N.; Wada, Y.; VanLanen, H.A.J. Global hydrological droughts in the 21st century under a changing hydrological regime. Earth Syst. Dynam. 2015, 6, 1–15. [Google Scholar] [CrossRef] [Green Version]
- Robinson, S.; Willenbockel, D.; Strzepek, K.A. Dynamic General Equilibrium Analysis of Adaptation to Climate Change in Ethiopia. Rev. Dev. Econ. 2012, 16, 489–502. [Google Scholar] [CrossRef] [Green Version]
- IPCC. Impacts, Adaptation, and Vulnerability. Part A: Global and Sectoral Aspects. Contribution of Working Group II to the Fifth Assessment Report of the Intergovernmental Panel on Climate Change; Field, C.B., Barros, V.R., Dokken, D.J., Mach, K.J., Mastrandrea, M.D., Bilir, T.E., Chatterjee, M., Ebi, K.L., Estrada, Y.O., Genova, R.C., et al., Eds.; Cambridge University Press: Cambridge, UK; New York, NY, USA, 2014; Available online: http://www.ipcc-wg2.org/AR5/report/full-report/ (accessed on 14 February 2019).
- Woo, M.K.; Thorne, R.; Szeto, K.; Yang, D. Streamflow hydrology in the boreal region under the influences of climate and human interference. Philos. Trans. Royal. Soc. B 2008, 363, 2251–2260. [Google Scholar] [CrossRef] [Green Version]
- Solander, K.C.; Bennett, K.E.; Middleton, R.S. Shifts in historical streamflow extremes in the Colorado River Basin. J. Hydrol. Reg. Stud. 2017, 12, 363–377. [Google Scholar] [CrossRef]
- Mohammed, R.; Scholz, M. Climate change and anthropogenic intervention impact on the hydrologic anomalies in a semi-arid area: Lower Zab River Basin, Iraq. Environ. Earth Sci. 2018, 77, 357. [Google Scholar] [CrossRef] [Green Version]
- Dile, Y.T.; Berndtsson, R.; Setegn, S.G. Hydrological Response to Climate Change for Gilgel Abay River, in the Lake Tana Basin-Upper Blue Nile Basin of Ethiopia. PLoS ONE 2013, 8, e79296. [Google Scholar] [CrossRef] [Green Version]
- Beyene, T.; Lettenmaier, D.P.; Kabat, P. Hydrologic impacts of climate change on the Nile River Basin: Implications of the 2007 IPCC scenarios. Clim. Chang. 2010, 100, 433–461. [Google Scholar] [CrossRef]
- Setegn, S.G.; Rayner, D.; Melesse, A.M.; Dargahi, B.; Srinivasan, R. Impact of climate change on the hydroclimatology of Lake Tana Basin, Ethiopia. Water Resour. Res. 2011, 47. [Google Scholar] [CrossRef]
- Taye, M.T.; Willems, P.; Scheltinga, T.V.C.; Kroeze, C. The Lived Experience of Climate Change: Water Case Study on the Nile and Rhine River Basins. KU Leuven and Wageningen University and Research Centre. 2012. Available online: https://repositorioaberto.uab.pt/handle/10400.2/2128 (accessed on 14 February 2019).
- Daba, M.; Rao, G.N. Evaluating Potential Impacts of Climate Change on Hydro-meteorological Variables in Upper Blue Nile Basin, Ethiopia a Case Study of Finchaa Sub-basin. JEES 2016, 6, 2224–3216. [Google Scholar]
- Haile, A.T.; Akawka, A.L.; Berhanu, B.; Rientjes, T. Changes in water availability in the Upper Blue Nile basin under the representative concentration pathways scenario. Hydrol. Sci. J. 2017, 62, 2139–2149. [Google Scholar] [CrossRef]
- Worqlul, A.; Dile, Y.T.; Ayana, E.; Jeong, J.; Adem, A.; Gerik, T.; Gerik, T. Impact of Climate Change on Streamflow Hydrology in Headwater Catchments of the Upper Blue Nile Basin, Ethiopia. Water 2018, 10, 120. [Google Scholar] [CrossRef] [Green Version]
- Taye, M.T.; Ntegeka, V.; Ogiramoi, N.P.; Willems, P. Assessment of climate change impact on hydrological extremes in two source regions of the Nile River Basin. Hydrol. Earth Syst. Sci. 2011, 15, 209–222. [Google Scholar] [CrossRef] [Green Version]
- Enyew, B.D.; Van Lanen, H.A.J.; Van Loon, A.F. Assessment of the Impact of Climate Change on Hydrological Drought in Lake Tana Catchment, Blue Nile Basin, Ethiopia. J. Geol. Geosci. 2014, 03, 1–17. [Google Scholar]
- Besada, H.; Werner, K. An assessment of the effects of Africa’s water crisis on food security and management. Int. J. Water Resour. Dev. 2015, 31, 120–133. [Google Scholar] [CrossRef] [Green Version]
- Parker, H.; Mosello, B.; Calow, R.; Quattri, M.; Kebede, S.; Alamirew, T.; Kume, A. A thirsty future? Water Strategies for Ethiopia’s New Development Era. 2016. Available online: https://www.odi.org/publications/10535-thirsty-future-water-strategies-ethiopias-new-development-era (accessed on 20 May 2019).
- Gizaw, S.M.; Biftu, G.F.; Gan, T.Y.; Moges, S.A.; Koivusalo, H. Potential impact of climate change on streamflow of major Ethiopian rivers. Clim. Chang. 2017, 143, 371–383. [Google Scholar] [CrossRef]
- Lewis, K. Understanding climate as a driver of food insecurity in Ethiopia. Clim. Chang. 2017, 144, 317–328. [Google Scholar] [CrossRef]
- Taye, M.T.; Dyer, E.; Hirpa, F.A.; Charles, K. Climate Change Impact on Water Resources in the Awash Basin, Ethiopia. Water 2018, 10, 1560. [Google Scholar] [CrossRef] [Green Version]
- Sørland, S.L.; Schar, C.; Luthi, D.; Kjellstromet, E. Bias patterns and climate change signals in GCM-RCM model chains. Environ. Res. Lett. 2018, 13, 074017. [Google Scholar] [CrossRef]
- Giorgi, F. Thirty years of regional climate modeling: Where are we and where are we going next? J. Geophys. Res.: Atmos. 2019, 124, 5696–5723. [Google Scholar] [CrossRef] [Green Version]
- Paeth, H.; Hall, N.M.J.; Gaertner, M.A.; Alonso, M.D.; Moumouni, S.; Polcher, J.; Ruti, P.M.; Fink, A.H.; Gosset, M.; Lebel, T.; et al. Progress in regional downscaling of West Africa precipitation. Atmos. Sci. Lett. 2011, 12, 75–82. [Google Scholar] [CrossRef]
- IPCC. Summary for Policymakers. In Climate Change 2007: The Physical Science Basis. Contribution of Working Group I to the Fourth Assessment Report of the Intergovernmental Panel on Climate Change; Solomon, S., Qin, D., Manning, M., Chen, Z., Marquis, M., Averyt, K.B., Tignor, M., Miller, H.L., Eds.; Cambridge University Press: Cambridge, UK; New York, NY, USA, 2007; Available online: https://www.ipcc.ch/pdf/assessment-report/ar4/wg1/ar4-wg1-spm.pdf (accessed on 2 March 2019).
- IPCC. Climate Change 2013: The Physical Science Basis. Contribution of Working Group I to the Fifth Assessment Report of the Intergovernmental Panel on Climate Change; Stocker, T.F., Qin, D., Plattner, G.K., Tignor, M., Allen, S.K., Boschung, J., Nauels, A., Xia, Y., Bex, V., Midgley, P.M., Eds.; Cambridge University Press: Cambridge, UK; New York, NY, USA, 2013; p. 1535. [Google Scholar] [CrossRef] [Green Version]
- van Vuuren, D.P.; Edmonds, J.; Kainuma, M.; Riahi, K.; Thomson, A.; Hibbard, K.; Rose, S.K. The representative concentration pathways: An overview. Clim. Chang. 2011, 109, 5–31. [Google Scholar] [CrossRef]
- Riahi, K.; van Vuuren, D.P.; Kriegler, E.; Edmonds, J.; O’Neill, B.C.; Fujimori, S.; Tavoni, M. The Shared Socioeconomic Pathways and their energy, land use, and greenhouse gas emissions implications: An overview. Global Environ. Chang. 2017, 42, 153–168. [Google Scholar] [CrossRef] [Green Version]
- IPCC. Climate Change 2014: Impacts, Adaptation, and Vulnerability. Part B: Regional Aspects. Contribution of Working Group II to the Fifth Assessment Report of the Intergovernmental Panel on Climate Change; Barros, V.R., Field, C.B., Dokken, D.J., Mastrandrea, M.D., Mach, K.J., Bilir, T.E., Chatterjee, M., Ebi, K.L., Estrada, Y.O., Genova, R.C., et al., Eds.; Cambridge University Press: Cambridge, UK; New York, NY, USA, 2014; p. 688. [Google Scholar]
- Rogelj, J.; Meinshausen, M.; Knutti, R. Global warming under old and new scenarios using IPCC climate sensitivity range estimates. Nat. Clim. Chang. 2012, 2, 248–253. [Google Scholar] [CrossRef]
- Koriche, S.A. Remote Sensing Based Hydrological Modeling for Flood Early Warning in Upper and Middle Awash Basin. M.Sc. ITC University of Twente, The Netherlands. 2012. Available online: https://webapps.itc.utwente.nl/librarywww/papers_2012/msc/wrem/koriche.pdf (accessed on 14 February 2019).
- Getahun, Y.S.; Gebre, S.L. Flood Hazard Assessment and Mapping of Flood Inundation Area of the Awash River Basin in Ethiopia using GIS and HEC-GeoRAS/HEC-RAS Model. J. Civil. Environ. Eng. 2015, 5, 179. [Google Scholar] [CrossRef]
- Asfaw, B.H.; Essen, P.V.; Tsige, Z.T. Integrated Water Resource Management Upper Awash River Basin, Central Ethiopia. 2014. Available online: http://www.waterethiopia.org/wp-content/uploads/2014/03/Background-Information-for-a-Program-Approach-Challenges-and-Possible-Cooperation-between-Dutch-and-Ethiopian-counterparts.pdf (accessed on 12 September 2019).
- Tolera, M.B.; Chung, I.M.; Chang, S.W. Evaluation of the Climate Forecast System Reanalysis Weather Data for Watershed Modeling in Upper Awash Basin, Ethiopia. Water 2018, 10, 725. [Google Scholar] [CrossRef] [Green Version]
- Degefu, M.A.; Rowell, D.P.; Bewket, W. Teleconnections between Ethiopian rainfall variability and global SSTs: Observations and methods for model evaluation. Meteorol. Atmos. Phys. 2017, 129, 173–186. [Google Scholar] [CrossRef] [Green Version]
- Seleshi, Y.; Zanke, U. Recent changes in rainfall and rainy days in Ethiopia. Int. J. Climatol. 2004, 24, 973–983. [Google Scholar] [CrossRef]
- Aguilar, C.; Polo, M.J. Generating reference evapotranspiration surfaces from the Hargreaves equation at watershed scale. Hydrol. Earth Syst. Sci. 2011, 15, 2495–2508. [Google Scholar] [CrossRef] [Green Version]
- Setegn, S.G.; Srinivasan, R.; Melesse, A.M.; Dargahi, B. SWAT model application and prediction uncertainty analysis in the Lake Tana Basin, Ethiopia. Hydrol. Process. 2009, 24. [Google Scholar] [CrossRef]
- Easton, Z.M.; Fuka, D.R.; White, E.D.; Collick, A.S.; Biruk Ashagre, B.; McCartney, M.; Steenhuis, T.S. A multi basin SWAT model analysis of runoff and sedimentation in the Blue Nile, Ethiopia. Hydrol. Earth Syst. Sci. 2010, 14, 1827–1841. [Google Scholar] [CrossRef] [Green Version]
- Asfaw, A.; Simane, B.; Hassen, A.; Bantider, A. Variability and time series trend analysis of rainfall and temperature in northcentral Ethiopia: A case study in Woleka sub-basin. Weather Clim. Extrem. 2018, 19, 29–41. [Google Scholar] [CrossRef]
- Mulugeta, S.; Fedler, C.; Ayana, M. Analysis of Long-Term Trends of Annual and Seasonal Rainfall in the Awash River Basin, Ethiopia. Water 2019, 11, 1498. [Google Scholar] [CrossRef] [Green Version]
- Piani, C.; Haerter, J.O.; Coppola, E. Statistical bias correction for daily precipitation in regional climate models over Europe. Theor. Appl. Climatol. 2010, 99, 187–192. [Google Scholar] [CrossRef] [Green Version]
- Haddeland, I.; Heinke, J.; Voß, F.; Eisner, S.; Chen, C.; Hagemann, S.; Ludwig, F. Effects of climate model radiation, humidity and wind estimates on hydrological simulations. Hydrol. Earth Syst. Sci. 2012, 16, 305–318. [Google Scholar] [CrossRef] [Green Version]
- Ludwig, F.; Supit, I.; Franssen, W.; Biemans, H. Climate Change Impacts on Hydrological and Meteorological Extremes. By the European Commission within the Seven Framework Program. 2013. Available online: http://www.combine-project.eu/fileadmin/user_upload/combine/dels/D8.2.pdf (accessed on 14 February 2019).
- Rientjes, T.H.M.; Perera, B.U.J.; Haile, A.T.; Reggiani, P.; Muthuwatta, L.P. Regionalisation for lake level simulation—The case of Lake Tana in the Upper Blue Nile, Ethiopia. Hydrol. Earth Syst. Sci. 2011, 15, 1167–1183. [Google Scholar] [CrossRef]
- Uhlenbrook, S.; Mohamed, Y.; Gragne, A.S. Analyzing catchment behavior through catchment modeling in the Gilgel Abay, Upper Blue Nile River Basin, Ethiopia. Hydrol. Earth Syst. Sci. 2010, 14, 2153–2165. [Google Scholar] [CrossRef] [Green Version]
- Abdo, K.S.; Fiseha, B.M.; Rientjes, T.H.M.; Gieske, A.S.M.; Haile, A.T. Assessment of climate change impacts on the hydrology of Gilgel Abay catchment in Lake Tana Basin, Ethiopia. Hydrol. Process. 2009, 23. [Google Scholar] [CrossRef]
- Seibert, J. HBV Light Version 2 User’s Manual. 2005. Available online: https://www.geo.uzh.ch/dam/jcr:c8afa73c-ac90-478e-a8c7-929eed7b1b62/HBV_manual_2005.pdf (accessed on 14 February 2019).
- Lindström, G.; Johansson, B.; Persson, M.; Gardelin, M.; Bergström, S. Development and test of the distributed HBV-96 hydrological model. J. Hydrol. 1997, 201, 272–288. [Google Scholar] [CrossRef]
- Seibert, J. Multi-criteria calibration of a conceptual runoff model using a genetic algorithm. Hydrol. Earth Syst. Sci. 2000, 4, 215–224. [Google Scholar] [CrossRef] [Green Version]
- Das, T.; Bárdossy, A.; Zehe, E. Influence of Spatial Variability of Precipitation in a Distributed Rainfall-Runoff Model; IAHS Publ: Foz do Iguaçu, Brazil, 2005; Available online: https://iahs.info/uploads/dms/13432.28-195-203-S7-20-Das.pdf (accessed on 4 July 2019).
- Bekele, D.; Alamirew, T.; Kebede, A.; Zeleke, G.M.; Melesse, A. Modeling Climate Change Impact on the Hydrology of Keleta Watershed in the Awash River Basin, Ethiopia. Environ. Model. Assess. 2018, 24, 95–107. [Google Scholar] [CrossRef]
- Adem, A.A.; Tilahun, S.A.; Ayana, E.K.; Worqlul, A.W.; Assefa, T.T.; Dessu, S.B.; Melesse, A.M. Climate change impact on stream flow in the upper Gilgel Abay Catchment, Blue Nile Basin, Ethiopia. In Landscape Dynamics, Soils and Hydrological Processes in Varied Climates; Springer: Cham, Switzerland, 2016; pp. 645–673. [Google Scholar]
- Ebrahim, G.Y.; Jonoski, A.; van Griensven, A.; Di Baldassarre, G. Downscaling technique uncertainty in assessing hydrological impact of climate change in the Upper Beles River Basin, Ethiopia. Hydrol. Res. 2013, 44, 377–398. [Google Scholar] [CrossRef]
- Williams, A.P.; Funk, C. A westward extension of the warm pool leads to a westward extension of the Walker circulation, drying eastern Africa. Clim. Dynam. 2011, 37, 2417–2435. [Google Scholar] [CrossRef] [Green Version]
- Mauritzen, C.; Zivkovic, T.; Veldore, V. On the relationship between climate sensitivity and modelling uncertainty. Tellus A Dyn. Meteorol. Oceanogr. 2017, 69, 1327765. [Google Scholar] [CrossRef] [Green Version]
- Tinker, J.; Lowe, J.; Pardaens, A.; Holt, J.; Barciela, R. Uncertainty in climate projections for the 21st century northwest European shelf seas. Prog. Oceanogr. 2016, 148, 56–73. [Google Scholar] [CrossRef] [Green Version]
- Ministry of Environment and Forest (MEF). ETHIOPIA’S Second National Communication to the United Nations Framework Convention on Climate Change (UNFCCC); MEF: Addis Ababa, Ethiopia, 2015.
Figure 1.
Map of the study area: (A) the continent of Africa; (B) the entire Awash river basin; (C) DEM and meteorological stations of the Melka Kuntrie subbasin.
Figure 1.
Map of the study area: (A) the continent of Africa; (B) the entire Awash river basin; (C) DEM and meteorological stations of the Melka Kuntrie subbasin.

Figure 2.
(A) Land use and (B) Soil types of the Melka Kuntrie subbasin.

Figure 3.
Observed rainfall, temperature, and streamflow and calculated potential evapotranspiration (PET) of Melka Kuntrie subbasin from 1990–2008: (A) annual rainfall; (B) major rain season rainfall; (C) minor rainy season rainfall; (D) average monthly streamflow and average areal rainfall; (E) average monthly temperature and average areal potential evapotranspiration (PET).

Figure 4.
Comparison of simulated and observed streamflow for the calibration period (1991–2004).

Figure 5.
Comparison of simulated and observed streamflow for the validation period (2005–2008).

Figure 6.
Observed monthly temperature (1990–2011) and General Circulation Models (GCMs) baseline (1971–2000): (A) the maximum temperature, and (B) the minimum temperature.
Figure 6.
Observed monthly temperature (1990–2011) and General Circulation Models (GCMs) baseline (1971–2000): (A) the maximum temperature, and (B) the minimum temperature.

Figure 7.
Observed monthly rainfall (1990–2011) and GCMs baseline (1971–2000).

Figure 8.
Observed monthly streamflow (1990–2011) and simulated streamflow with GCMs baseline (1971–2000).
Figure 8.
Observed monthly streamflow (1990–2011) and simulated streamflow with GCMs baseline (1971–2000).

Figure 9.
Changes of the monthly maximum temperature for (A) the near future period of 2021–2050 and (B) the far future period of 2071–2100, with respect to the baseline.
Figure 9.
Changes of the monthly maximum temperature for (A) the near future period of 2021–2050 and (B) the far future period of 2071–2100, with respect to the baseline.

Figure 10.
Changes of the monthly minimum temperature for (A) the near future period of 2021–2050 and (B) the far future period of 2071–2100, with respect to the baseline.
Figure 10.
Changes of the monthly minimum temperature for (A) the near future period of 2021–2050 and (B) the far future period of 2071–2100, with respect to the baseline.

Figure 11.
Percentage changes of annual and seasonal rainfalls for (A) the near future period of 2021–2050, and (B) the far future period of 2071–2100, with reference to the baseline.
Figure 11.
Percentage changes of annual and seasonal rainfalls for (A) the near future period of 2021–2050, and (B) the far future period of 2071–2100, with reference to the baseline.

Figure 12.
Percentage changes of annual and seasonal evapotranspiration for (A) the near future period of 2021–2050, and (B) the far future period of 2071–2100, with reference to the baseline.
Figure 12.
Percentage changes of annual and seasonal evapotranspiration for (A) the near future period of 2021–2050, and (B) the far future period of 2071–2100, with reference to the baseline.

Figure 13.
Percentage changes of annual and seasonal streamflow for (A) the near future period of 2021–2050 and (B) the far future period of 2071–2100, with reference to the baseline.
Figure 13.
Percentage changes of annual and seasonal streamflow for (A) the near future period of 2021–2050 and (B) the far future period of 2071–2100, with reference to the baseline.

Figure 14.
Projected monthly streamflow compared to the baseline: results of IPSL and MPI were averaged for RCP4.5 and RCP8.5 scenarios during the near and far future periods.
Figure 14.
Projected monthly streamflow compared to the baseline: results of IPSL and MPI were averaged for RCP4.5 and RCP8.5 scenarios during the near and far future periods.

Figure 15.
Projected monthly streamflow compared to the baseline: (A) results of ECHAM-A2 for both projection periods, and (B) results of IPSL-A2 for both periods.
Figure 15.
Projected monthly streamflow compared to the baseline: (A) results of ECHAM-A2 for both projection periods, and (B) results of IPSL-A2 for both periods.

Figure 16.
Comparison of projected changes in temperature (°C) in the MK, the Keleta and the Hombole subbasins.
Figure 16.
Comparison of projected changes in temperature (°C) in the MK, the Keleta and the Hombole subbasins.

Figure 17.
Comparison of projected percentages changes in rainfall (%) in the MK, the Keleta and the Hombole subbasins.
Figure 17.
Comparison of projected percentages changes in rainfall (%) in the MK, the Keleta and the Hombole subbasins.

Figure 18.
Comparison of projected percentages changes in streamflow (%) in the MK, the Keleta and the Hombole subbasins.
Figure 18.
Comparison of projected percentages changes in streamflow (%) in the MK, the Keleta and the Hombole subbasins.


Table 1.
Trend test of annual temperature, annual and seasonal rainfall for Melka Kuntrie subbasin.
| Rainfall and Temperature | Melka Kuntrie Subbasin | |||
|---|---|---|---|---|
| Sen’s Slope | p Value | Trend | ||
| Rainfall | Annual | 0.11 | 0.944 | No |
| Major | 0.14 | 0.834 | No | |
| Minor | −0.08 | 0.889 | No | |
| Annual temperature | 0.57 | 0.00078 | + | |
Table 2.
Optimized parameters for Melka Kuntrie subbasin found in Hydrologiska Byråns Vattenbalansavdelning (HBV) model calibration.
Table 2.
Optimized parameters for Melka Kuntrie subbasin found in Hydrologiska Byråns Vattenbalansavdelning (HBV) model calibration.
| Parameters | FC (mm) | LP (-) | BETA (-) | PERC (mm/day) | ALFA (-) | K0 (day−1) | K1 (day−1) | K2 (day−1) |
|---|---|---|---|---|---|---|---|---|
| Optimized values | 218.81 | 0.84 | 2.42 | 0.43 | 0.74 | 0.036 | 0.019 | 0.099 |
© 2020 by the authors. Licensee MDPI, Basel, Switzerland. This article is an open access article distributed under the terms and conditions of the Creative Commons Attribution (CC BY) license (http://creativecommons.org/licenses/by/4.0/).
Share and Cite
MDPI and ACS Style
Getahun, Y.S.; Li, M.-H.; Chen, P.-Y. Assessing Impact of Climate Change on Hydrology of Melka Kuntrie Subbasin, Ethiopia with Ar4 and Ar5 Projections. Water 2020, 12, 1308. https://doi.org/10.3390/w12051308
AMA Style
Getahun YS, Li M-H, Chen P-Y. Assessing Impact of Climate Change on Hydrology of Melka Kuntrie Subbasin, Ethiopia with Ar4 and Ar5 Projections. Water. 2020; 12(5):1308. https://doi.org/10.3390/w12051308
Chicago/Turabian StyleGetahun, Yitea Seneshaw, Ming-Hsu Li, and Pei-Yuan Chen. 2020. "Assessing Impact of Climate Change on Hydrology of Melka Kuntrie Subbasin, Ethiopia with Ar4 and Ar5 Projections" Water 12, no. 5: 1308. https://doi.org/10.3390/w12051308
Note that from the first issue of 2016, this journal uses article numbers instead of page numbers. See further details here.