Article

Treatment of Textile Wastewater by CAS, MBR, and MBBR: A Comparative Study from Technical, Economic, and Environmental Perspectives

Institute of Textile Research and Industrial Cooperation of Terrassa (INTEXTER), Universitat Politècnica de Catalunya, Carrer de Colom, 15, 08222-Terrasa, Spain
*
Author to whom correspondence should be addressed.
Water 2020, 12(5), 1306; https://doi.org/10.3390/w12051306
Submission received: 17 March 2020 / Revised: 30 April 2020 / Accepted: 2 May 2020 / Published: 5 May 2020
(This article belongs to the Special Issue Design, Operation and Economics of Wastewater Treatment Plant)

Abstract

:
In this study, three different biological methods—a conventional activated sludge (CAS) system, membrane bioreactor (MBR), and moving bed biofilm reactor (MBBR)—were investigated to treat textile wastewater from a local industry. The results showed that technically, MBR was the most efficient technology, of which the chemical oxygen demand (COD), total suspended solids (TSS), and color removal efficiency were 91%, 99.4%, and 80%, respectively, with a hydraulic retention time (HRT) of 1.3 days. MBBR, on the other hand, had a similar COD removal performance compared with CAS (82% vs. 83%) with halved HRT (1 day vs. 2 days) and 73% of TSS removed, while CAS had 66%. Economically, MBBR was a more attractive option for an industrial-scale plant since it saved 68.4% of the capital expenditures (CAPEX) and had the same operational expenditures (OPEX) as MBR. The MBBR system also had lower environmental impacts compared with CAS and MBR processes in the life cycle assessment (LCA) study, since it reduced the consumption of electricity and decolorizing agent with respect to CAS. According to the results of economic and LCA analyses, the water treated by the MBBR system was reused to make new dyeings because water reuse in the textile industry, which is a large water consumer, could achieve environmental and economic benefits. The quality of new dyed fabrics was within the acceptable limits of the textile industry.

1. Introduction

As one of the largest industries worldwide, the textile industry produces significant amounts of wastewater. Textile wastewater is generated in different steps during production, such as destarching, mercerization, dyeing, and washing [1], and is known to contain considerable amounts of organic compounds which provide color to the effluent [2]. In recent years, more strict regulations of effluent discharge have been applied in the textile industry, in order to reduce dye residues in the effluent before discharge into natural streams [3]. Consequently, finding suitable technologies to obtain an effective treatment of textile wastewater and to reuse its effluent in new production processes is essential for the industry’s sustainable development.
One of the most applied biological methods in treating textile wastewater is the conventional activated sludge (CAS) process [4,5]. The main objective of the CAS process is to remove organic compounds [6]. The CAS system has disadvantages such as high hydraulic retention time (HRT), problems with sludge settling, requirement of large space [7], and poor color removal efficiency due to the low biodegradability of dyes which can only be partially adsorbed on biomass [8,9,10]. Hence, a tertiary physicochemical method is usually required to give a better treatment performance [3,11], which will increase the cost of the process.
In the past two decades, noticeable progress has been achieved with membrane bioreactor (MBR) technology in industrial wastewater treatment. MBRs separate the sludge by filtration, which differs from conventional CAS treatment [12]. MBRs can reduce land space and sludge production with a high biomass concentration in the reactor and are able to treat influent with wide fluctuations of quality [13,14,15,16]. In the case study of MBR applied in textile wastewater treatment in Bangladesh, the performance of the MBR system was better than that of the CAS [17]. Another study reported that high removal efficiencies were achieved for chemical oxygen demand (COD), color, and total suspended solids (TSS), and the cytotoxicity was significantly reduced by MBR when operating at an HRT of 2 days [18].
Recently, biofilm systems have drawn much attention in treating different types of industrial wastewater due to their several advantages compared with conventional biological treatment, including saving space [19,20]. Among them, the moving bed biofilm reactor (MBBR) also has been applied in textile wastewater treatment in the last few years. One of the highlights of MBBR is a smaller volume of the biological plant or a larger treating capacity in the same reactor volume due to the biofilm being attached to carriers. Besides the great amount of biomass fixed on carriers, the concentration of biomass in suspension could be higher than that in the CAS process. In a previous study of textile effluent treatment [21], the pilot-scale plant of MBBR removed 86% of COD and 50% of color, respectively.
In addition to the selection of suitable wastewater treatment from a technical point of view, the increased demand for sustainability of industries has led to the use of life cycle assessment (LCA) as a tool to evaluate the feasibility of technologies [22]. Previous studies have estimated the environmental impacts generated by one or combined units of treatment plants for textile wastewater. Nakhate et al. evaluated the environmental footprints of a textile wastewater treatment plant and found out that consumption of electricity dominated in most of the environmental burden [23]. Cetinkaya and Bilgili compared, in another study, the environmental impacts caused by two desalination systems, and they found that using LCA could assess the environmentally friendlier treatment system for textile wastewater [24].
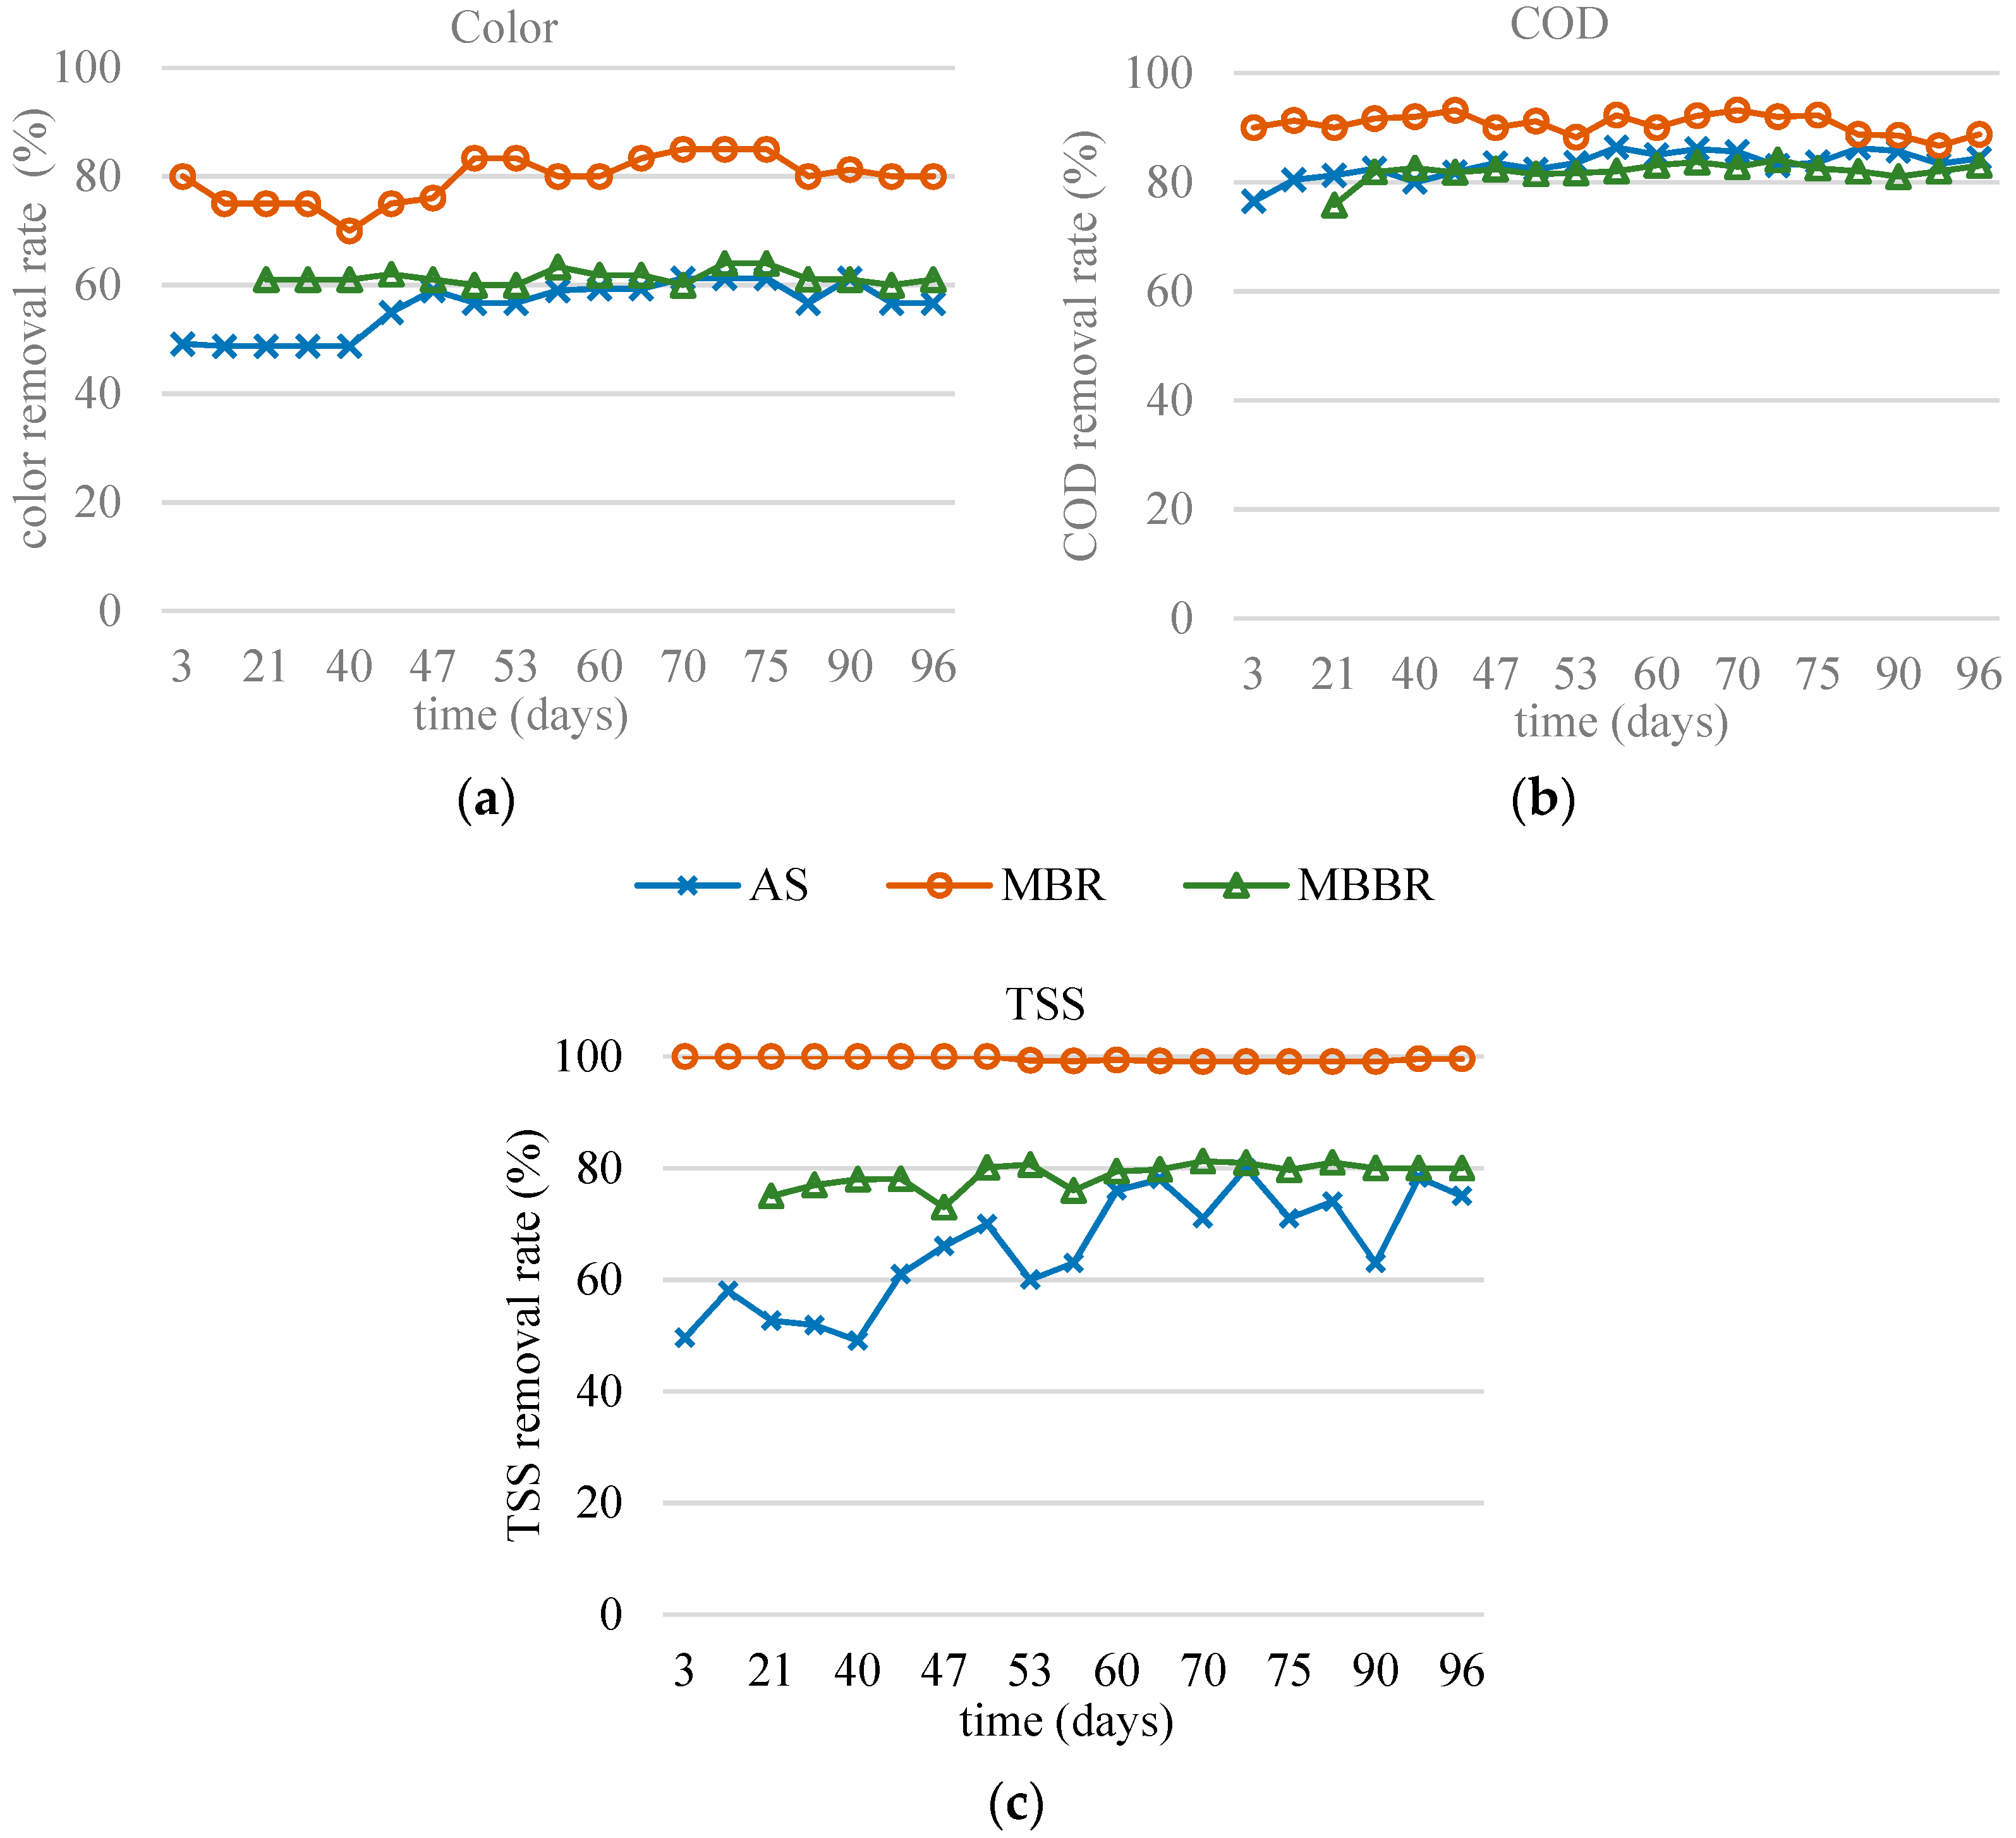
The aim of the current experimental study was to compare the efficiency of the CAS system, MBR process, and MBBR system in treating real textile wastewater. CAS is the current treatment process of the textile industry which provides the wastewater for our study. In order to improve the treating efficiency based on the existing CAS treatment, we have chosen MBBR and MBR to compare the technical, environmental, and economic feasibility. Parameters such as chemical oxygen demand (COD), total suspended solids (TSS), and color were determined to verify that MBR and MBBR have a better efficiency than CAS process. Special attention was paid to color removal, as color is one of the main problems in textile wastewater treatment.
Based on the experimental results in the pilot plant, an economic study and LCA were carried out to compare the economic and environmental feasibility of implementation of these technologies on an industrial scale and also to select the method of textile wastewater treatment with lower investment, operating costs, and environmental impact related to energy and materials consumption.
Water treated with the most viable method was reused to make new dyes because water reuse in the textile industry, a large water consumer, is one of the main factors to achieve sustainable development.

2. Methodology

2.1. Pilot Plant Description and Analysis

Three pilot plants (flow diagram shown in Figure 1) were investigated for textile wastewater treatment in this study. Among them, the plant for the CAS process and the plant for MBR were operated in parallel. The pilot plant for MBBR was the same as for the CAS operation, but without the recirculation of sludge. The three treatments were operated with a controlled temperature of 25 °C. The textile wastewater was obtained from a local textile industry, Acabats del Bages, S.A. (Monistrol de Montserrat, Spain). The characteristics of the wastewater are shown in Table 1, including pH, COD, color, biochemical oxygen demand (BOD), TSS, total nitrogen (TN), and total phosphorous (TP). The duration of experiments for three pilot plants was 96 days.
It should be noted that the pH of wastewater returned to 8.6 in the reactor due to the buffering effect caused by the presence of carbonates, usual in textile wastewater. It was unnecessary and unattainable on an industrial scale to adjust the pH. Therefore, in the economic and LCA study, we did not take into account the amount of acid on the industrial scale.
The CAS pilot plant was composed of an aerobic reactor (volume 4 L) connected to a decantation tank. The flow rate in the CAS plant was 2 L/d, and the HRT was set to 2 days as the HRT of the current CAS plant of the textile industry.
The MBR used in this study was a pilot plant, composed of an aerobic reactor with a submerged ultrafiltration membrane. A Polyvinylidene fluoride (PVDF) hollow fiber membrane module ZeeWeed-1 (ZW-1) (GE Power & Water, Canada) was used. The membrane characteristics are shown in Table 2. The aerobic reactor had a working volume of 20 L. The influent was pumped directly from a raw wastewater tank, mixed completely with aeration in the reactor. There was an air inlet in the membrane module to prevent membrane fouling. The period of filtration and backwashing was set at 15 min and 30 s for the laboratory-scale reactor according to previous study with the membrane module [25].
As mentioned before, the MBBR pilot plant was the same one as in the CAS process. The aerobic reactor was filled with the carriers at a filling ratio of 30% (v/v). The plastic BIOFILL C-2 carriers used in this study were provided by BIO-FIL (Barcelona, Spain). The main specifications and operation characteristics of carriers are shown in Table 3. MBBR operation was inoculated with aerobic sludge collected from the wastewater treatment plant of the same textile industry. The start-up period lasted 3 weeks so biofilm could grow on the carriers.
In the initial phase, both MBR and MBBR were operated with 2 days of HRT, as was the CAS system. In order to assess a larger treating capacity and efficiency, the flow rate was increased gradually during the experiments. The flow rate in the MBR plant was fixed at 15 L/d and the HRT was 1.3 days, whereas the flow rate in the MBBR plant was 4 L/d and the HRT was fixed at 1 day. In the phase after the flow rates were stable, the concentration of dissolved oxygen (DO) in CAS was 2.1 mg/L, similar to the DO level in the MBBR reactor of 2.2 mg/L. MBR had a lower DO concentration of 1.8 mg/L.

2.2. Economic Analysis

The economic assessment of capital expenditures (CAPEX) and operational expenditures (OPEX) for three treatment schemes is determined in the results section.

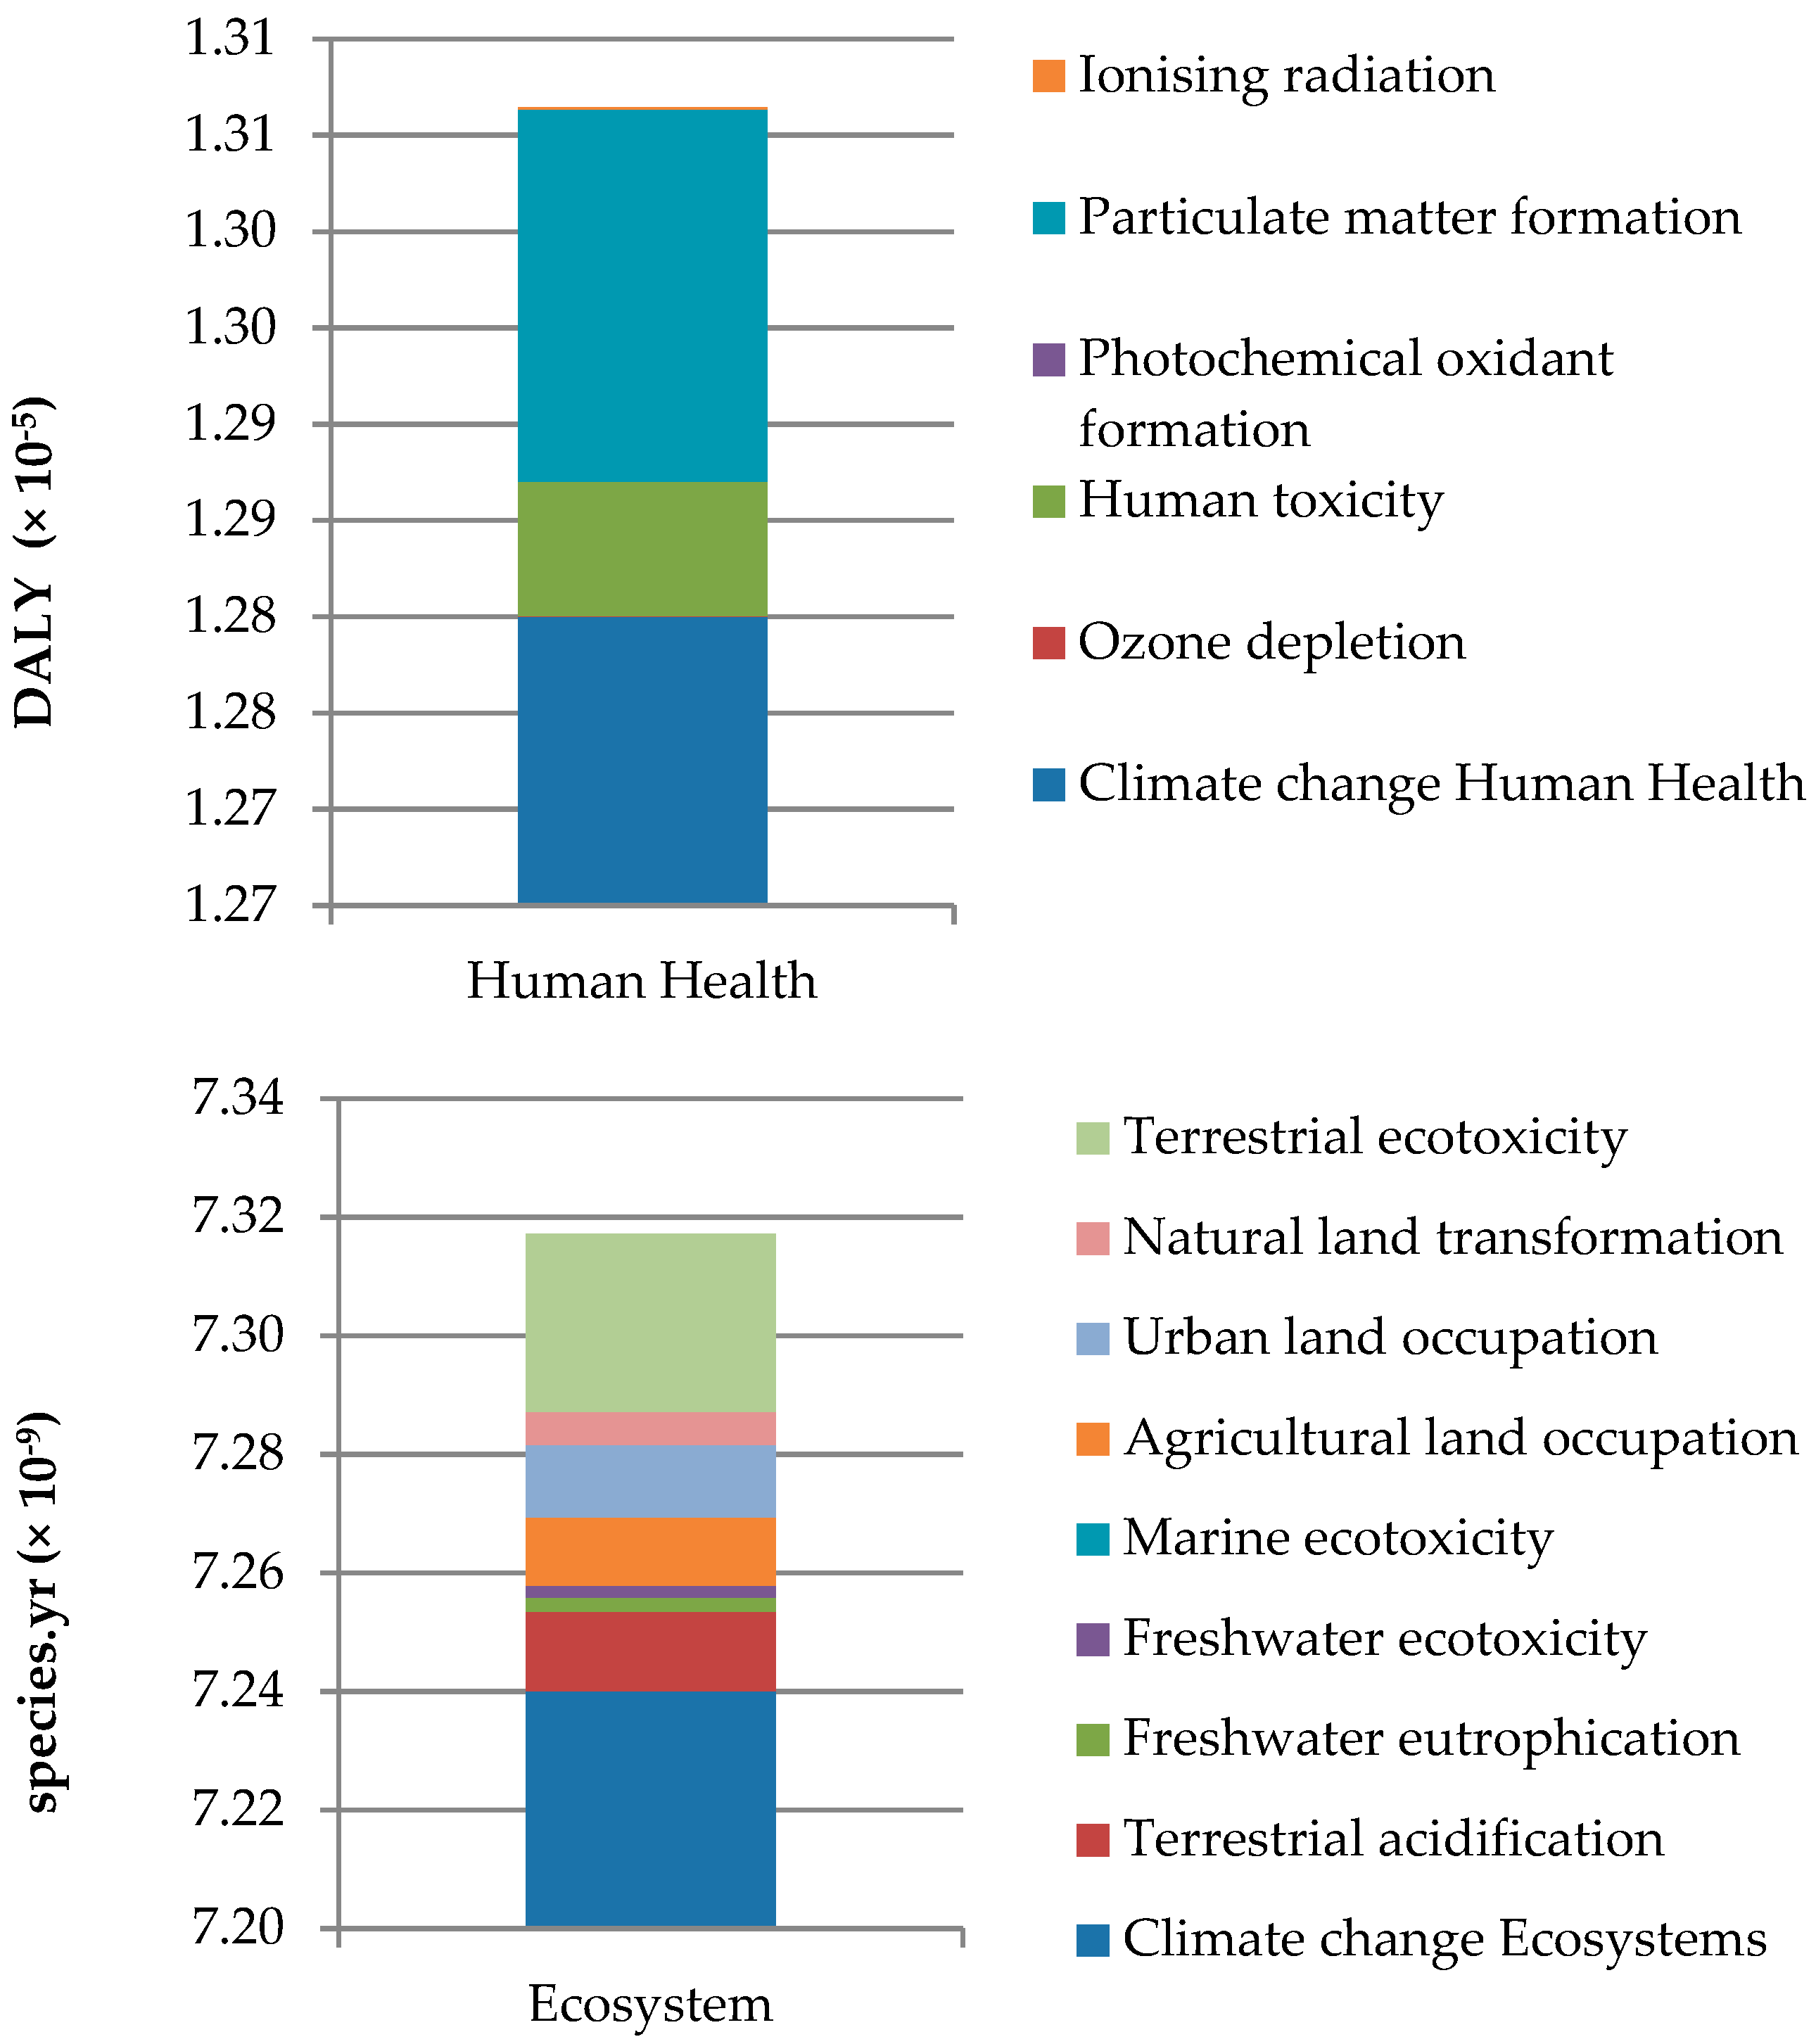
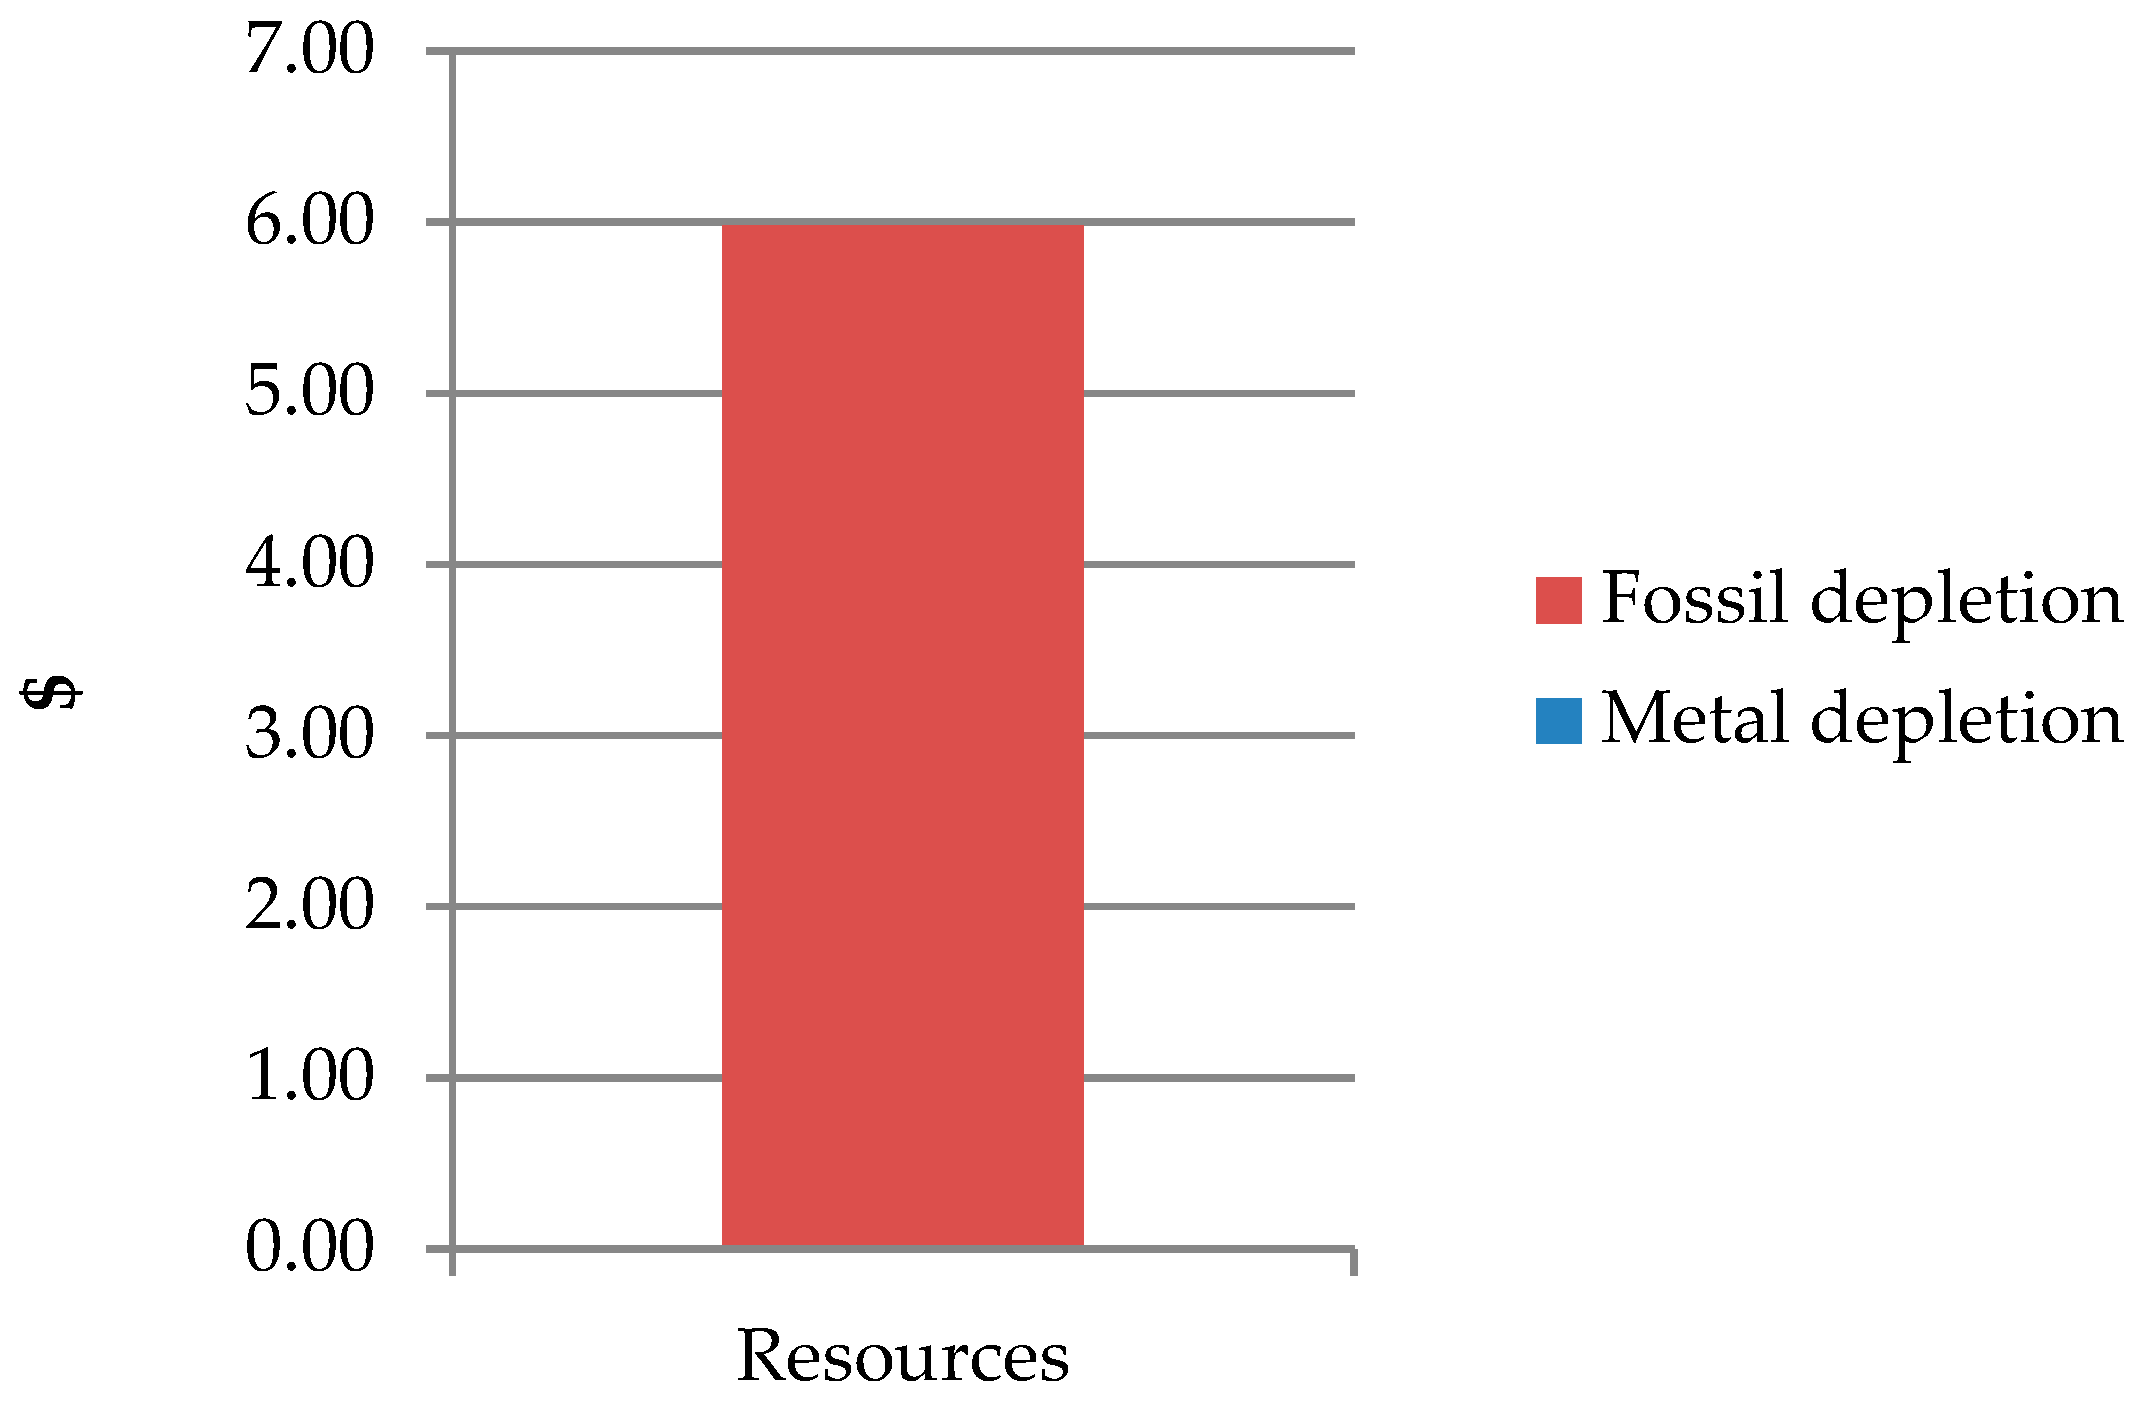
2.3. Environmental Impact Analysis

To compare the environmental impact of three treatment processes, life cycle assessment (LCA) was performed according to standard ISO 14040 [26]. Simapro was used as the LCA software. The database used was Ecoinvent 3.1. ReCiPe, midpoint and endpoint approach, and Hierarchist perspective were considered as the methodology to calculate environmental impact. The selected functional unit was “1 m3 of treated effluent”. The data used in this study were taken from the experimental results.

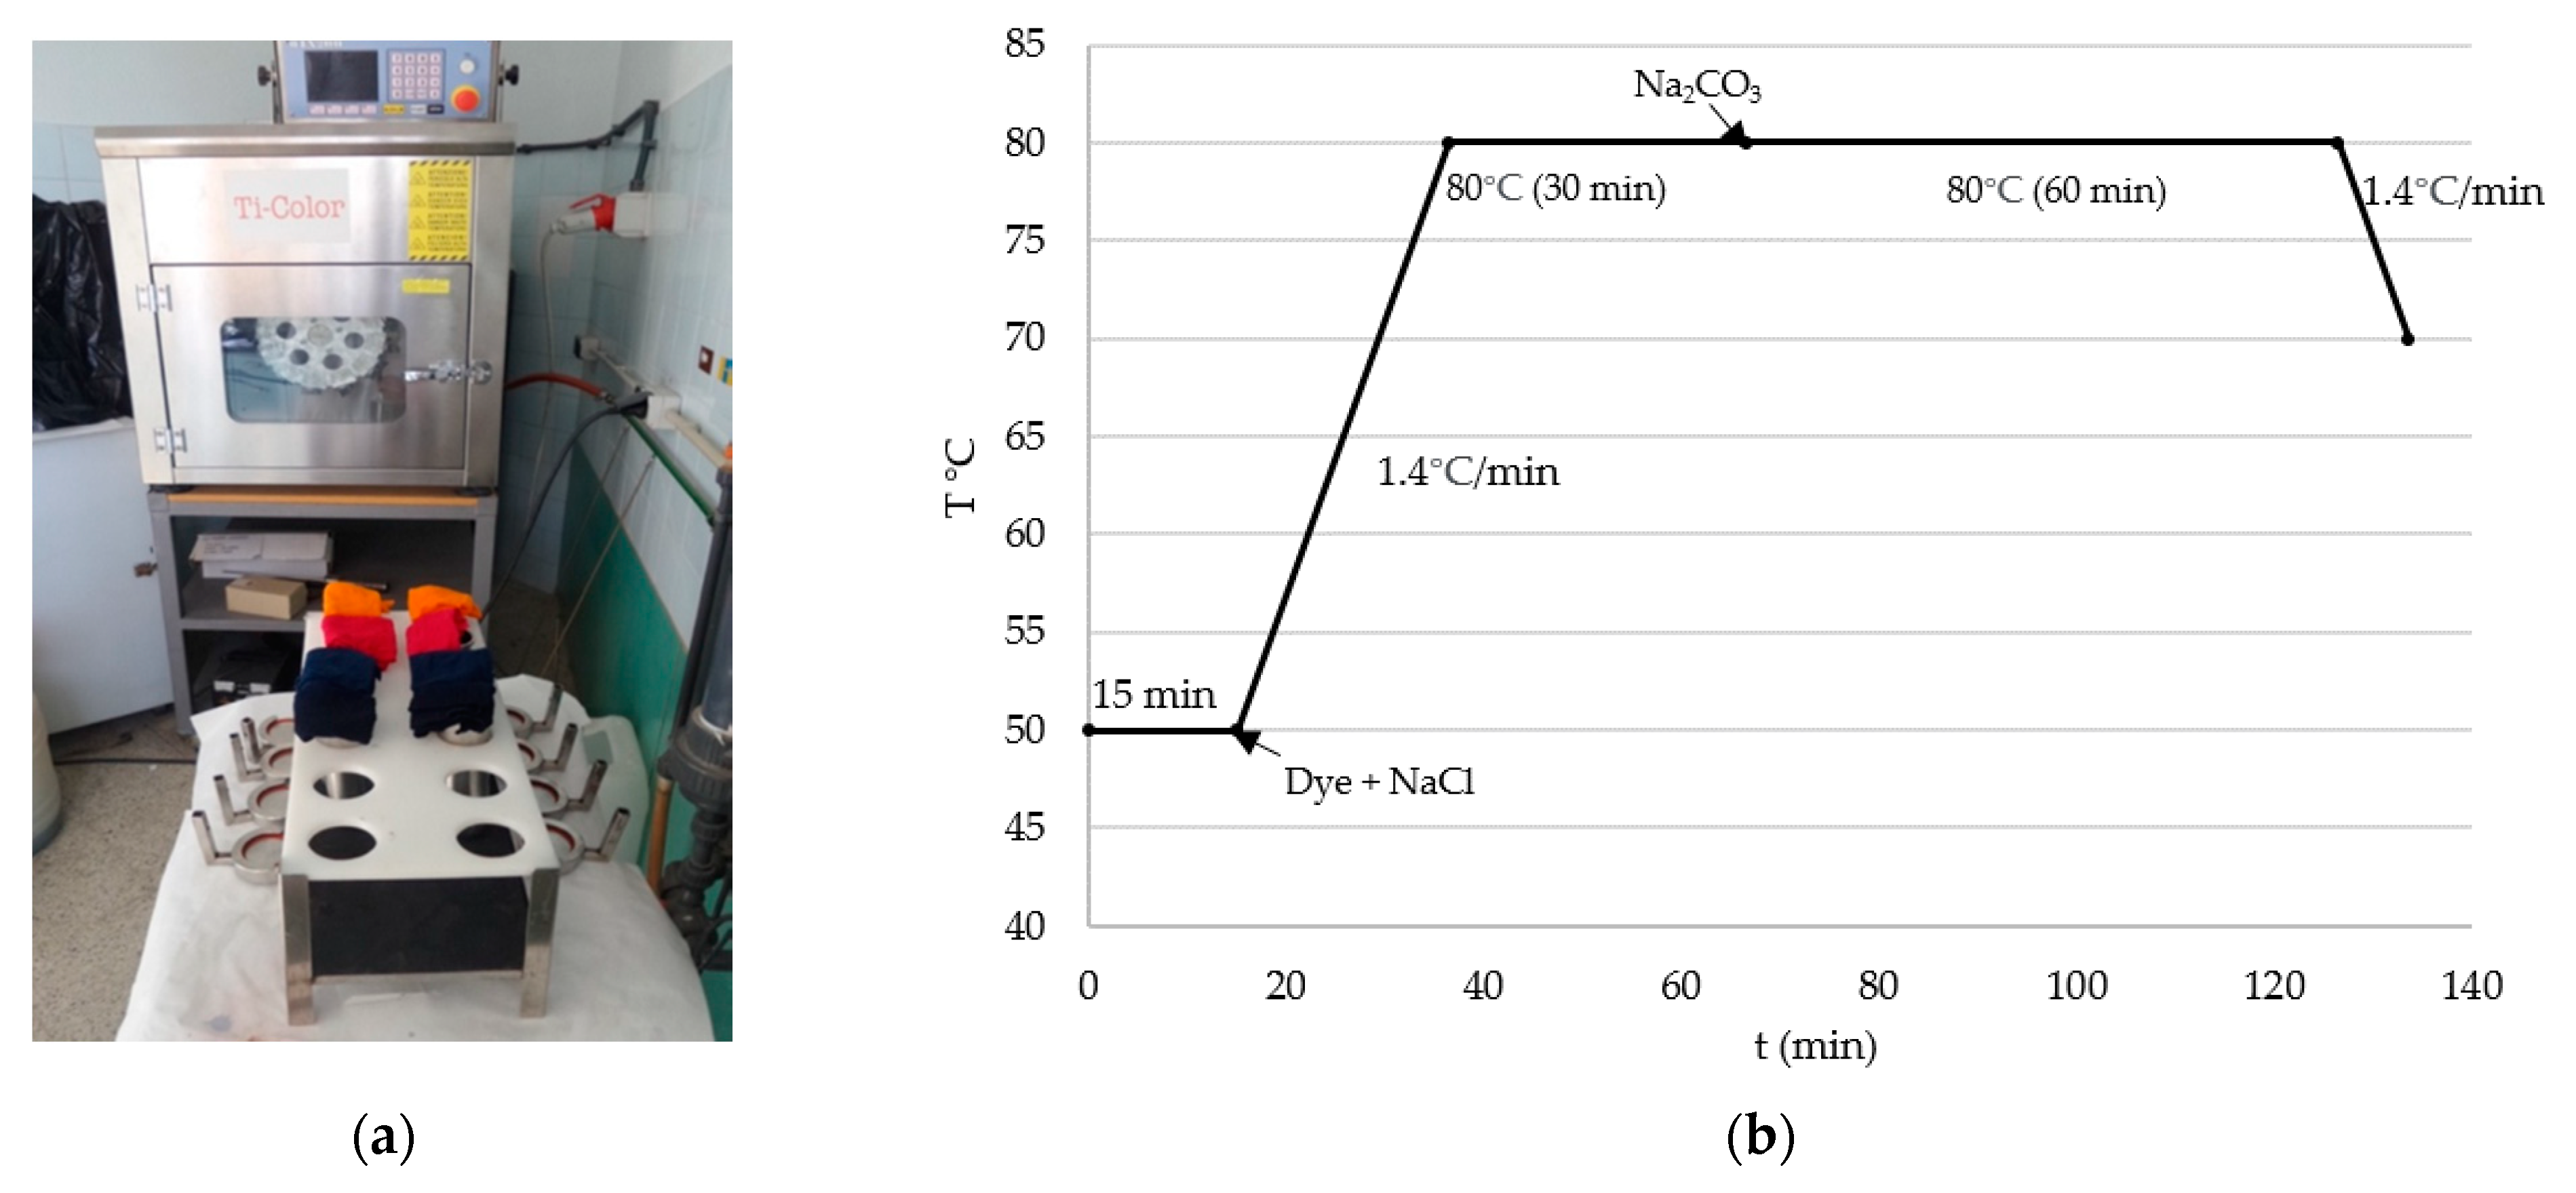
2.4. Dyeing Tests Using Treated Water

The dyeing tests using treated water were performed with a laboratory Ti-Color dyeing machine (Prato, Italy) (Figure 2a) under the following conditions [27]: 10 g cotton fabric, dye concentration of 3% o.w.f (overweight of fiber), liquor ratio 1:10 (1 g fiber/0.01 L dye bath). Three commercial reactive dyes supplied by Dystar were used in the water reuse study: Yellow Procion HEXL, Crimson Procion HEXL, and Navy Procion HEXL. Besides the amount of dye, 60 g/L NaCl and 26 g/L Na2CO3 were added. The dyeing procedure is shown in Figure 2b. After the dyeing procedure, nine washing steps were performed with softened tap water to remove the dye that was not fixed onto the fiber. This washing process included nine steps:
  • 1st–3rd: Washing bath with softened tap water at 50 °C for 10 min;
  • 4th: Soaping bath with 2 g/LCOTEMOLL TLTR at 95 °C for 15 min;
  • 5th: Rinsing bath with softened tap water at 50 °C for 10 min;
  • 6th: Soaping bath with 2 g/L COTEMOLL TLTR at 95 °C for 15 min;
  • 7th–9th: Rinsing bath with softened tap water at 50 °C for 10 min.

2.5. Analytical Methods

During this study, the control of the three pilot plants was carried out with analyses by characterizing the water at the entrance, in the bioreactor, and at the exit to determine the working efficiency. COD, TSS, TN, TP, color, pH, conductivity, and turbidity were determined following the Standard Methods 23rd edition [20].
The quality of dyed fabrics with reused water was determined according to Standard UNE-EN ISO 105-J03 by color differences with respect to reference dyeings performed with softened tap water [28]. Total color differences (DECMC(2:1)) were calculated from lightness (DL*), chroma (DC*), and Hue (DH*) using the following equation:
DE CMC ( 2 : 1 ) = [ ( DL · S L ) 2 + ( DC   ab * / S C ) 2 + ( DH   ab * / S H ) 2 ] 1 / 2
where SL, SC, and SH were calculated from the chromatic coordinates corresponding to reference dyeings (LR, CR, and hR) as follows:
SL = 0.040975LR/(1 + 0.01765LR)
If LR < 16, SL= 0.511
SC = [0.0638CR/(1 + 0.0131CR)] + 0.638
SH = SC(Tf + 1 − f)
f = {(CR)4/[(CR)4 + 1900]}1/2
T= 0.36 + │0.4·cos(35 + hR)│ if hR ≥ 345° or hR ≤ 164°
T= 0.56 + │0.2·cos(168 + hR)│ if 164° < hR < 345°
A spectrophotometer, MINOLTA CM 3600d (Osaka, Japan), was used for these measurements according to Standard illuminant D65/10°.
Generally, the color difference of one unit (DECMC (2:1) ≤ 1) is the acceptable limit in the textile industry.

3. Results and Discussion

3.1. Treating Efficiency

During the experiments, the average biomass concentrations in the reactor of CAS, MBR, and MBBR were 3 g/L, 2.3 g/L, and 3.5 g/L, respectively. As the textile wastewater had rather low contents of TN (54 mg/L) and TP (11 mg/L), over 90% removal of TN and TP was obtained after MBR and MBBR treatment, whereas CAS eliminated 88% of TN and TP.
As mentioned in Section 2.1, the initial HRT for CAS, MBR, and MBBR was 2 days, whereas the initial organic loading rate (OLR) was the same for the three treatments at 1 kg COD/ (m³ d). The HRT of MBR and MBBR was gradually reduced to evaluate if the treating efficiency could be maintained while the treating capacity was increased.
Color in the influent varied between 400 and 1500 mg Pt-co/L. The removal rates of color obtained by the three treatment systems are shown in Figure 3a. The average color removal efficiency was 55% in the CAS process and was 80% in the MBR system, while in the MBBR system the color removal achieved 61%. MBR was significantly more efficient at removing color than the CAS process under the same operating conditions. MBBR had a higher color-removing performance than the CAS process, while the HRT (2 days) of CAS was twice the HRT (1 day) of MBBR. In order to meet discharge standards, decolorizing agent was added to the effluent from the CAS and MBBR processes. After adding 200 ppm of decolorizing agent, the color content reached the discharge standard in CAS, while the amount of decolorizing agent needed for MBBR was 100 ppm. In conventional biological treatment, the addition of various adsorbents and chemicals into the activated sludge system to improve the color removal efficiency is a common method, which will increase the cost and will generate secondary contaminates [29,30].
COD of the influent remained at about 2000 mg/L. The average COD effluent of the CAS process was 350 mg/L, and the average efficiency of COD removal was 83%. The average COD value of the effluent from MBR was 170 mg/L, and the COD removal rate was 91%. The removal rates of COD in the three pilot plants are illustrated in Figure 3b. Furthermore, the CAS process worked with an HRT of 2 days, while the HRT of MBR worked only within 1.3 days. This demonstrated the efficiency and stability of the biological process of MBR. Similar results of COD removal in the MBR system and CAS process were also observed previously [17,31], indicating that after MBR treatment, a better COD removal efficiency can be obtained from the conventional AS process. The average COD value of the effluent from MBBR was 179 mg/L, and the COD removal rate was 82%. Although the removal rates of COD of the CAS and MBBR processes were similar, HRT of MBBR was half of the HRT of the CAS process. The average OLRs for the CAS system, MBR, and MBBR were 1 kg COD/ (m³ d), 1.5 kg COD/ (m³ d), and 2 kg COD/ (m³ d), respectively.
The TSS removal rates in the CAS system, MBR, and MBBRs are shown in Figure 3c. During the parallel experiments of CAS and MBR systems, the average value of TSS in the influent was 940 mg/L. The average TSS removal efficiency in the CAS process was 66%, while in MBR system the TSS removal achieved 99.6%. From the perspective of TSS removal, membrane filtration is an attractive method because of the total retention of suspended matter and significant retention of colloidal matter [32]. The results showed the advantage of the MBR process in TSS reduction with respect to the CAS process. The MBR process reached high TSS elimination without the necessity to add a tertiary treatment. MBBR achieved an average TSS removal rate of 78%, which was better than that of the CAS system.

3.2. Economic Study of the Three Treatment Processes

The local textile industry produced 222,700 m3 of wastewater per year with 11 months under operation. The wastewater treatment method of the industry is conventional activated sludge (CAS). The daily treatment flow is 920 m3/d. The current HRT of the CAS plant is 2 days.

3.2.1. Capital Expenditures (CAPEX)

The CAPEX of the CAS system was considered to be the reference (0) in the economic study. The CAPEX of MBR and MBBR treatments were added directly to the CAPEX of the CAS system.
For the MBR full-scale system, the membrane and the installation of the membrane (366,153 €) have been considered for the CAPEX estimation according to the CAPEX calculation from a study of the cost of a small MBR (100–2500 m3/d flow capacity) [33].
For the MBBR full-scale system, the cost of carrier medias (115,500 €) has been considered for the CAPEX estimation according to the suppliers’ information.

3.2.2. Operational Expenditures (OPEX)

Consumption of energy, decolorizing agent data, and environmental tax of sludge production and wastewater discharge were gathered in order to estimate operational expenditures (OPEX) of the three treatment plants.
Additionally, the cost of membrane replacement represented 2.4% of the energy cost [34], and the average lifetime of the UF membrane was taken as 10 years. The maintenance and repair costs represented 19.5% of the energy cost [34]. MBR could withstand higher concentrations of biomass with much longer sludge retention time (SRT) than in conventional AS, which allows much less sludge production in the MBR system and consequently, lowers the frequency of sludge disposal [13,35]. During the experimental study of MBR, sludge concentration did not exceed the withstanding limit of the membrane. The sludge generation of MBR was estimated according the increasing rate of the biomass concentration and the concentration limit for the membrane.
The detailed OPEX calculation of each treatment plant is demonstrated in the following tables. (Table 4 AS, Table 5 MBR, Table 6 MBBR).
In terms of the consumption part, MBR had the highest cost (0.51 €/m3) of electricity consumption because it required more electricity to operate and to maintain the membrane filtration. However, AS had the highest cost in the total consumption, with a value of 0.55 €/m3, among the three treatments due to the larger amount of decolorizing agent used. This was not necessary for MBR because MBR achieved the color removal requirement and was used less in MBBR since MBBR had a better color removal performance. The reason that MBBR consumed half the electricity of the CAS system is that the HRT of MBBR was 1 day while in CAS it was 2 days, which means that MBBR with doubled treating capacity could save 50% of the electricity expense.
In regard to environmental tax, it can be observed that MBR had the lowest expense (0.43 €/m3) since it had a better performance with organic compounds and TSS. MBBR, with half the HRT and more efficient treatment behavior, would pay a lower environmental tax (0.78 €/m3) than the CAS system (0.85 €/m3).
As mentioned in Section 3.3.1, the CAPEX for MBR was 366,153 €, and for MBBR it was 115,500 €, in order to improve the existing AS treatment of the studied textile industry. The only investment of MBBR in CAPEX is the carriers, and the maintenance of carriers is more convenient and economical than maintaining the membrane. Even though the OPEX of MBR and MBBR are at the same value, MBBR had the advantage of low energy consumption and competitive treatment performance. Taken together, the results of CAPEX and OPEX show that MBBR is a more attractive option for the textile industry economically.

3.3. LCA Study Results

3.3.1. Inventory Results

The inventory results of each treating process are shown in Table 7. All data are related to the functional unit (1 m3 treated water). The impact of sludge generation was not taken into account in Simapro software; therefore, the impact of sludge generation could not be quantified in the LCA study. Nevertheless, sludge generated in the three treatments was quantified and is presented in Table 7.

3.3.2. Environmental Impact Assessment

The environmental impact of each treatment process according to the LCA results using endpoint approach is discussed, and then the three studied treatments are compared with respect to their total environmental impact.

CAS System

The results of the environmental impact assessment are presented in points (mPt) so that different categories could be compared. Firstly, the impact of the CAS treatment process was evaluated. As shown in Table 8, the CAS process had the lowest impact on Ecosystems, while it had a major impact on Resources, followed by Human health.
The decolorizing agent represents 60%–70% of the environmental impact of the CAS system, having the most significant impact for all the categories.
The impact of the decolorizing agent on the detailed categories with relation to Human health, Ecosystem, and Resources is shown in Figure 4. The decolorizing agent had an impact on Human health mainly because of the effect on Climate change human health as well as Particulate matter formation categories, while Terrestrial ecotoxicity and Climate change ecosystems categories had major impacts on Ecosystems. Apart from that, the Fossil depletion category had the major responsibility for impacting Resources, while the Metal depletion category had almost no impact.

MBR Treatment

In the MBR treatment, as can be seen in Table 9, there was no consumption of decolorizing agent since the system removed most of the color in the effluents. The consumption of electricity during treatment represents the total environmental impact. The results show that the impact on Ecosystem was much lower, while the major impacts were on Resources and Human Health.
Figure 5 shows the impact of electricity consumption for MBR treatment on the detailed categories related to Human Health, Ecosystem, and Resources. Climate change human health and Particulate matter formation categories were the main factors that had an impact on Human health of electricity consumption. In the meantime, the impact on Ecosystems mainly was due to Agricultural land occupation and Climate change ecosystem, while Terrestrial ecotoxicity, Natural land transformation, Urban land occupation, and Terrestrial acidification had minor impacts on the Ecosystem category. Furthermore, the major impact on Resources came from Fossil depletion category, while the Metal depletion category had almost no impact.

MBBR Treatment

As shown in Table 10, MBBR treatment, like AS and MBR treatments, also had a major impact on Resources, while the impact on Ecosystem was the lowest. The environmental impact of the consumption of decolorizing agent was mainly presented in Resources.

Comparison of the Three Treatments

The environmental impacts of three treatments are compared in Table 11 to evaluate which treatment had lower environmental impacts.
As shown, the MBBR system had the lowest impact on all three categories. Although decolorizing agent was used in the final step of AS and MBBR to obtain a well-clarified effluent and due to the filtration, decolorizing agent was not needed for MBR, the consumption of electricity had more significant environmental impacts on Human Health and Ecosystems.
In addition to the endpoint methods, which are helpful for decision-making because results can be compared in points, midpoint analysis was also performed to help identify issues of specific environmental concerns [40]. The results of midpoint assessment are shown in Table 12. It can be observed clearly that MBBR was environmentally advantageous since most of its impacts were the lowest in most of the categories, except in Climate change Human Health, Marine eutrophication, and Freshwater ecotoxicity, which were the three impact categories associated with the use of decolorizing agent. In MBBR operation, impacts on several categories could be reduced more than 70% more than those generated in MBR, and these categories were Particulate matter formation, Terrestrial acidification, Agricultural land occupation, Urban land occupation, Natural land transformation, and Urban land occupation. The CAS system had high environmental impacts, especially on Climate change Human Health, Marine eutrophication, and Freshwater ecotoxicity, due to the amount of decolorizing agent used in the treatment.

3.4. Reuse of the Treated Effluent

Taking into account the previous results of economic and LCA analyses, MBBR treatment was selected as the most feasible method to be applied at industrial scale. At this point, the possibility of reusing the treated wastewater in a new dyeing processes was determined. MBBR was selected to check if the removal results of COD, SST, and color were sufficient to make new dyes without their quality being affected by the presence of organic matter residues, suspended solids, and residual dyes.
One hundred percent of the treated water from the MBBR process was reused for a new dyeing process. Three reactive dyes—Yellow Procion HEXL, Crimson Procion HEXL, and Navy Procion HEXL—were used in the water reuse study. The color differences with respect to a reference dyeing are shown in Table 13. DECMC(2:1) values of all three dyes were lower than 1, which is the acceptable limit for the textile industry. The results imply the feasibility of MBBR treatment to obtain a water reuse proportion up to 100% in the new dye baths. It should be considered that in practical textile production, there is 30% water loss due to evaporation or water fixed into the textile products. Therefore, the wastewater generated accounts for 70% of freshwater consumed by the industry. Although all the treated water was reused, it is not equal to 100% of the total water consumed by the industry. If we wanted to reuse all treated water, this would be 70% of the water consumed.
A comparison of the cotton fabrics dyed with the three dyes studied is shown in Figure 6.

4. Conclusions

After carrying out the comparative study in three pilot plants with CAS, MBR, and MBBR technologies, MBBR showed that it was a better alternative than CAS, with a comparable COD removal rate to CAS and a more efficient color reduction, while the treating capacity was doubled. Although the MBR was the most efficient technology for organic compounds and color removal, the economic and LCA study suggested that MBBR is a more attractive option for textile wastewater treatment at an industrial-scale plant. MBBR had the same OPEX as MBR, both lower than that of the CAS system, but MBBR had lower investment costs and lower CAPEX, which was 68% less than the CAPEX of MBR. MBBR also largely reduced the environmental impacts on different categories with respect to CAS and MBR processes in general. MBBR reduces the environmental impact as compared with the AS, since it reduced the consumption of electricity and decolorizing agent with respect to AS. MBR had a higher electrical consumption but avoided the consumption of decolorizing agent.
Finally, new dyes made with treated water from MBBR met the quality standard for the textile industry (DECMC(2:1) ≤ 1). The presence of organic matter residues, suspended solids, and residual dyes in the effluent of MBBR did not affect the dyeing quality. Reuse of wastewater up to 100% is very promising in the textile industry as it is a considerable water-consuming industry worldwide.

Author Contributions

Investigation, X.Y.; Methodology, X.Y.; Project administration, V.L.-G. and M.C.; Resources, X.Y.; Supervision, V.L.-G., M.V. and M.C.; Writing—original draft, X.Y.; Writing—review & editing, V.L.-G. All authors have read and agreed to the published version of the manuscript

Funding

This research was co-funded by ACCIÓ (Generalitat de Catalunya) within the REGIREU Project (COMRDI16-1-0062).

Acknowledgments

BIO-FIL (Barcelona, Spain) is gratefully acknowledged for providing plastic carriers BIOFILL C-2 in the MBBR study. Authors express their gratitude to Acabats del Bages, S.A. (Monistrol de Montserrat, Spain) for providing textile wastewater during the operation.

Conflicts of Interest

The authors declare no conflicts of interest.

References

  1. Kumar, P.; Prasad, B.; Mishra, I.M.; Chand, S. Treatment of composite wastewater of a cotton textile mill by thermolysis and coagulation. J. Hazard. Mater. 2008, 151, 770–779. [Google Scholar] [CrossRef]
  2. Baêta, B.E.L.; Ramos, R.L.; Lima, D.R.S.; Aquino, S.F. Use of submerged anaerobic membrane bioreactor (SAMBR) containing powdered activated carbon (PAC) for the treatment of textile effluents. Water Sci. Technol. 2012, 65, 1540–1547. [Google Scholar] [CrossRef]
  3. Vilaseca, M.; Gutiérrez, M.-C.; López-Grimau, V.; López-Mesas, M.; Crespi, M. Biological Treatment of a Textile Effluent After Electrochemical Oxidation of Reactive Dyes. Water Environ. Res. 2010, 82, 176–182. [Google Scholar] [CrossRef] [PubMed] [Green Version]
  4. Salazar, L.; Crespi, M. Evaluation of kinetic coefficients using membrane bioreactor and active sludge process treating textile wastewater. Desalin. Water Treat. 2010, 13, 471–478. [Google Scholar]
  5. Muoio, R.; Palli, L.; Ducci, I.; Coppini, E.; Bettazzi, E.; Daddi, D.; Fibbi, D.; Gori, R. Optimization of a large industrial wastewater treatment plant using a modeling approach: A case study. J. Environ. Manag. 2019, 249, 109436. [Google Scholar] [CrossRef] [PubMed]
  6. Lim, A.L.; Bai, R. Membrane fouling and cleaning in microfiltration of activated sludge wastewater. J. Memb. Sci. 2003, 216, 279–290. [Google Scholar] [CrossRef]
  7. Lourenço, N.D.; Franca, R.D.G.; Moreira, M.A.; Gil, F.N.; Viegas, C.A.; Pinheiro, H.M. Comparing aerobic granular sludge and flocculent sequencing batch reactor technologies for textile wastewater treatment. Biochem. Eng. J. 2015, 104, 57–63. [Google Scholar] [CrossRef]
  8. López-Grimau, V.; Riera-Torres, M.; López-Mesas, M.; Gutiérrez-Bouzán, C. Removal of aromatic amines and decolourisation of azo dye baths by electrochemical treatment. Color. Technol. 2013, 129, 267–273. [Google Scholar] [CrossRef]
  9. López-Grimau, V.; Pepió, M.; Gutiérrez-Bouzán, C.; Buscio, V. Kinetic models for the electrochemical decolouration of two reactive azo dyes. Desalin. Water Treat. 2018, 136, 405–412. [Google Scholar] [CrossRef]
  10. López-Grimau, V.; Vilaseca, M.; Gutiérrez-Bouzán, C. Comparison of different wastewater treatments for colour removal of reactive dye baths. Desalin. Water Treat. 2016, 57, 2685–2692. [Google Scholar] [CrossRef] [Green Version]
  11. Lotito, A.M.; De Sanctis, M.; Rossetti, S.; Lopez, A.; Di Iaconi, C. On-site treatment of textile yarn dyeing effluents using an integrated biological–chemical oxidation process. Int. J. Environ. Sci. Technol. 2014, 11, 623–632. [Google Scholar] [CrossRef] [Green Version]
  12. Yurtsever, A.; Çınar, Ö.; Sahinkaya, E. Treatment of textile wastewater using sequential sulfate-reducing anaerobic and sulfide-oxidizing aerobic membrane bioreactors. J. Memb. Sci. 2016, 511, 228–237. [Google Scholar] [CrossRef]
  13. Ng, A.N.L.; Kim, A.S. A mini-review of modeling studies on membrane bioreactor (MBR) treatment for municipal wastewaters. Desalination 2007, 212, 261–281. [Google Scholar] [CrossRef]
  14. Arévalo, J.; Garralón, G.; Plaza, F.; Moreno, B.; Pérez, J.; Gómez, M.Á. Wastewater reuse after treatment by tertiary ultrafiltration and a membrane bioreactor (MBR): A comparative study. Desalination 2009, 243, 32–41. [Google Scholar] [CrossRef]
  15. Wang, Z.; Wu, Z. Distribution and transformation of molecular weight of organic matters in membrane bioreactor and conventional activated sludge process. Chem. Eng. J. 2009, 150, 396–402. [Google Scholar] [CrossRef]
  16. Bernhard, M.; Müller, J.; Knepper, T.P. Biodegradation of persistent polar pollutants in wastewater: Comparison of an optimised lab-scale membrane bioreactor and activated sludge treatment. Water Res. 2006, 40, 3419–3428. [Google Scholar] [CrossRef] [PubMed]
  17. Saha, P.; Hossain, M.Z.; Mozumder, M.S.I.; Uddin, M.T.; Islam, M.A.; Hoinkis, J.; Deowan, S.A.; Drioli, E.; Figoli, A. MBR technology for textile wastewater treatment: First experience in Bangladesh. Membr. Water Treat. 2014, 5, 197–205. [Google Scholar] [CrossRef]
  18. Friha, I.; Bradai, M.; Johnson, D.; Hilal, N.; Loukil, S.; Ben Amor, F.; Feki, F.; Han, J.; Isoda, H.; Sayadi, S. Treatment of textile wastewater by submerged membrane bioreactor: In vitro bioassays for the assessment of stress response elicited by raw and reclaimed wastewater. J. Environ. Manag. 2015, 160, 184–192. [Google Scholar] [CrossRef]
  19. Castro, F.D.; Bassin, J.P.; Dezotti, M. Treatment of a simulated textile wastewater containing the Reactive Orange 16 azo dye by a combination of ozonation and moving-bed biofilm reactor: Evaluating the performance, toxicity, and oxidation by-products. Environ. Sci. Pollut. Res. 2017, 24, 6307–6316. [Google Scholar] [CrossRef]
  20. Yang, X.; Crespi, M.; López-Grimau, V. A review on the present situation of wastewater treatment in textile industry with membrane bioreactor and moving bed biofilm reactor. Desalin. Water Treat. 2018, 103, 315–322. [Google Scholar] [CrossRef]
  21. Park, H.O.; Oh, S.; Bade, R.; Shin, W.S. Application of A2O moving-bed biofilm reactors for textile dyeing wastewater treatment. Korean J. Chem. Eng. 2010, 27, 893–899. [Google Scholar] [CrossRef]
  22. Tarantini, M.; Scalbi, S.; Misceo, M.; Verità, S. Life Cycle Assessment as a Tool for Water Management Optimization in Textile Finishing Industry; SPIE—The International Society for Optical Engineering, Society of Photo-optical Instrumentation Engineers: Bellingham, WA, USA, 2004; Volume 5583, pp. 163–170. [Google Scholar]
  23. Nakhate, P.H.; Moradiya, K.K.; Patil, H.G.; Marathe, K.V.; Yadav, G.D. Case study on sustainability of textile wastewater treatment plant based on lifecycle assessment approach. J. Clean. Prod. 2020, 245, 118929. [Google Scholar] [CrossRef]
  24. Cetinkaya, A.Y.; Bilgili, L. Life Cycle Comparison of Membrane Capacitive Deionization and Reverse Osmosis Membrane for Textile Wastewater Treatment. Water. Air. Soil Pollut. 2019, 230, 149. [Google Scholar] [CrossRef]
  25. Buscio, V.; Crespi, M.; Gutiérrez-Bouzán, C. Application of PVDF ultrafiltration membranes to treat and reuse textile wastewater. Desalin. Water Treat. 2016, 57, 8090–8096. [Google Scholar] [CrossRef] [Green Version]
  26. ISO 14040: 2006. Environmental Management–Life Cycle Assessment—Principles and Framework. Available online: https://www.iso.org/standard/37456.html (accessed on 4 May 2020).
  27. Buscio, V.; García-Jiménez, M.; Vilaseca, M.; López-Grimau, V.; Crespi, M.; Gutiérrez-Bouzán, C. Reuse of Textile Dyeing Effluents Treated with Coupled Nanofiltration and Electrochemical Processes. Materials (Basel) 2016, 9, 490. [Google Scholar] [CrossRef]
  28. AENOR Textiles—Tests for Colour Fastness—Part J03: Calculation of Colour Differences (ISO 105-J03:2009); Spanish Association for the Standardization and Certification: Madrid, Spain, 2009. (In Spanish)
  29. Pala, A.; Tokat, E. Activated Carbon Addition to an Activated Sludge Model Reactor for Color Removal from a Cotton Textile Processing Wastewater. J. Environ. Eng. 2003, 129, 1064–1068. [Google Scholar] [CrossRef]
  30. Sirianuntapiboon, S.; Sansak, J. Treatability studies with granular activated carbon (GAC) and sequencing batch reactor (SBR) system for textile wastewater containing direct dyes. J. Hazard. Mater. 2008, 159, 404–411. [Google Scholar] [CrossRef]
  31. Salazar, L.; Crespi, M.; Roberto, S. Comparative study between activated sludge versus membrane bioreactor for textile wastewater. Desalin. Water Treat. 2011, 35, 101–109. [Google Scholar]
  32. Dong, B.; Chen, H.; Yang, Y.; He, Q.; Dai, X. Treatment of printing and dyeing wastewater using MBBR followed by membrane separation process. Desalin. Water Treat. 2014, 52, 4562–4567. [Google Scholar] [CrossRef]
  33. Lo, C.H.; McAdam, E.; Judd, S. The cost of a small membrane bioreactor. Water Sci. Technol. 2015, 72, 1739–1746. [Google Scholar] [CrossRef] [Green Version]
  34. Iglesias, R.; Simón, P.; Moragas, L.; Arce, A.; Rodriguez-Roda, I. Cost comparison of full-scale water reclamation technologies with an emphasis on membrane bioreactors. Water Sci. Technol. 2017, 75, 2562–2570. [Google Scholar] [CrossRef] [PubMed]
  35. Radjenović, J.; Matošić, M.; Mijatović, I.; Petrović, M.; Barceló, D. Membrane Bioreactor (MBR) as an Advanced Wastewater Treatment Technology. In Emerging Contaminants from Industrial and Municipal Waste; Springer: Berlin/Heidelberg, Germany, 2008; pp. 37–101. [Google Scholar]
  36. S.A., E.E. Endesa—Luz. Available online: https://www.endesatarifasluzygas.com/luz/?sem=sem-endesa-google-tl-75&adgroupid=77440481986&gclid=CjwKCAiAy9jyBRA6EiwAeclQhG_kGGL-xchrpwXH50-OM42n6Yx1KUOLsskbYiOKVgbKUWkNwAa99BoC-zkQAvD_BwE (accessed on 26 February 2020).
  37. Montornès del Vallès, B. Discoloration Agent. TIDE 2000 S.L. Available online: http://www.tide2000.net/productos/coagulantes-y-decolorantes/ (accessed on 26 February 2020).
  38. Ministry of Energy Ley 2/2014, de 27 de enero, de Medidas Fiscales, Administrativas, Financieras y del sector público. Boletín of del Estado, 30 January 2014; 61561–61567.
  39. Oficial, D. LEY 4/2017, de 28 de marzo, de presupuestos de la Generalidad de Cataluña para 2017. 2017, pp. 4–7. Available online: https://www.boe.es/ccaa/dogc/2017/7340/f00001-00134.pdf (accessed on 4 May 2020).
  40. Kägi, T.; Dinkel, F.; Frischknecht, R.; Humbert, S.; Lindberg, J.; De Mester, S.; Ponsioen, T.; Sala, S.; Schenker, U.W. Session “Midpoint, endpoint or single score for decision-making?”—SETAC Europe 25th Annual Meeting, 5 May 2015. Int. J. Life Cycle Assess. 2016, 21, 129–132. [Google Scholar] [CrossRef]
Figure 1. Flow diagrams of (a) conventional activated sludge (CAS); (b) membrane bioreactor (MBR); (c) moving bed biofilm reactor (MBBR).
Water 12 01306 g001
Figure 2. (a) Ti-Color equipment (b) dyeing procedure.
Water 12 01306 g002
Figure 3. Removal rates of color (a), COD (b), and TSS (c) in activated sludge system, MBR, and MBBR.
Water 12 01306 g003
Figure 4. Analysis of the effect of the decolorizing agent on the impacted CAS categories.
Water 12 01306 g004aWater 12 01306 g004b
Figure 5. Analysis of the effect of electricity consumption on the impacted MBR categories.
Water 12 01306 g005aWater 12 01306 g005b
Figure 6. Comparison of cotton dyeings made with the three dyes studied.
Water 12 01306 g006
Table 1. Characteristics of textile wastewater.
ParametersAverage
pH8.6 *
COD mg/L2000
Color Pt-co /L700
BOD mg/L400
TSS mg/L940
TN mg/L54
TP mg/L11
* The pH of the original textile wastewater was initially adjusted from 8.6 to 7.2 before the treatments. COD: chemical oxygen demand; BOD: biochemical oxygen demand; TSS: total suspended solids; TN: total nitrogen; TP: total phosphorous.
Table 2. ZeeWeed-1 (ZW-1) membrane characteristics.
ModelZW-1, submersible module
ConfigurationOutside/in hollow fiber
Membrane Surface0.05 m2
Pore Size0.04 µm
Maximum Transmembrane Pressure (TMP)0.62 bar
Typical Operating TMP0.1–0.5 bar
Maximum TMP Backwash0.55 bar
Operating pH Range5–9
Table 3. BIOFILL type C-2 carrier characteristics.
Specific Surface590 m2/m3
Piece Diameter25 mm
Free Volume90%
Weight per Piece2.1 g
Density<1 kg/m³
Table 4. CAS operational cost for treating 1 m3 wastewater.
Concept Total Price €/m3Reference
(a) ConsumptionUnitAmountUnitUnit priceConvert to€/m30.55
ElectricitykW/m30.96€/kw0.1870.17952 [36]
Decolorizing agentkg/m30.2€/kg1.850.37 [37]
(b) Environmental taxUnitAmountUnitUnit price 0.86
Sludge generationkg/m30.83€/kg0.1580.013114 [38]
Wastewater discharge [39]
OM 1kg/m30.23€/kg1.00230.230529
TSSkg/m30.32€/kg0.50110.160352
Nkg/m30.008€/kg0.7610.006088
Pkg/m30.003€/kg1.52220.0045666
ConductivityS/cm0.00598€/Sm3/cm8.01980.0479584
summation 0.449494
ST 2 = 1.5 × SUM 0.67424101
GT 3 0.163
Total price 1.41
1 OM: organic material; 2 ST: specific tax; 3 GT: general tax.
Table 5. MBR operational cost for treating 1 m3 wastewater.
Concept Total Price €/m3Reference
(a) ConsumptionUnitAmountUnitUnit priceConvert to€/m30.51
ElectricitykW/m32.72€/kw0.1870.50864 [36]
Decolorizing agentkg/m30€/kg1.850 [37]
(b) Environmental taxUnitAmountUnitUnit price 0.43
Sludge generationkg/m30.023€/kg0.01580.0003634 [38]
Wastewater discharge [39]
OMkg/m30.11€/kg1.00230.110253
TSSkg/m30.04€/kg0.50110.020044
Nkg/m30.004€/kg0.7610.003044
Pkg/m30.002€/kg1.52220.0030444
ConductivityS/cm0.00533€/Sm3/cm8.01980.04274553
summation 0.17913093
ST = 1.5 × SUM 0.2686964
GT 0.163
(c) Membrane replacement 0.01[34]
(d) Maintenance and repair 0.10[34]
Total price 1.05
Table 6. MBBR operational cost for treating 1 m3 wastewater.
Concept Total Price €/m3Reference
(a) ConsumptionUnitAmountUnitUnit priceConvert to€/m30.27
ElectricitykW/m30.48€/kw0.1870.08976 [36]
Decolorizing agentkg/m30.1€/kg1.850.185 [37]
(b) Environmental taxUnitAmountUnitUnit price 0.78
Sludge generationkg/m30.29€/kg0.1580.004582 [38]
Wastewater discharge [39]
OMkg/m30.23€/kg1.00230.230529
TSSkg/m30.24€/kg0.50110.120264
Nkg/m30.009€/kg0.7610.006849
Pkg/m30.002€/kg1.52220.0030444
ConductivityS/cm0.00595€/Sm3/cm8.01980.04771781
summation 0.40840421
ST = 1.5 × SUM 0.61260632
GT 0.163
Total price 1.05
Table 7. Inventory analysis of three processes.
AmountUnit/FUEcoinvent Unit Process
Processes Included in LCAASMBRMBBR
InputOutputInputOutputInputOutput
COD20.3520.1720.34Kg
TSS0.940.320.940.040.940.24Kg
N0.0550.0080.0550.0040.0550.009Kg
P0.0080.0030.0080.0020.0080.002Kg
Color700315700140700267g Pt-co
Conductivity6.465.986.465.336.465.95mS/cm
Wastewater10.9591110.959m3
Sludge 0.83 0.023 0.29Kg
decolorizing agent0.2 0 0.1 KgDTPA, diethylenetriaminepentaacetic acid, at plant/RER U
Electricity0.96 2.72 0.48 KwhElectricity, medium voltage, production ES, at grid/ES U
Table 8. Environmental impact of CAS.
Human Health (mPt)Ecosystems (mPt)Resources (mPt)
Electricity (kWh/m3)22.81.931.8
Decolorizing agent (kg/m3)34.43.481.2
TOTAL57.25.3113.0
Table 9. Environmental impact of MBR.
Human Health (mPt)Ecosystems (mPt)Resources (mPt)
Electricity (kWh/m3)64.65.490.1
Decolorizing agent(kg/m3)000
TOTAL64.65.490.1
Table 10. Environmental impact of MBBR.
Human Health (mPt)Ecosystems (mPt)Resources (mPt)
Electricity (kWh/m3)11.40.915.9
Decolorizing agent(kg/m3)17.21.740.6
TOTAL28.62.656.5
Table 11. Environmental impacts of the three processes.
Human Health (mPt)Ecosystems (mPt)Resources (mPt)
AS57.25.3113.0
MBR64.65.490.1
MBBR28.62.656.5
Table 12. Comparison of three processes: midpoint analysis.
Impact CategoryUnitASMBRMBBR
Climate change Human Healthkg CO2-eq1.290.190.65
Ozone depletionkg CFC-11 eq1.39 × 10−77.03 × 10−86.94 × 10−8
Human toxicitykg 1.4-DB eq0.126.10 × 10−26.06 × 10⁻²
Photochemical oxidant formationkg NMVOC3.89 × 10−35.58 × 10−31.95 × 10−3
Particulate matter formationkg PM10 eq1.95 × 10−33.41 × 10−39.73 × 10−4
Ionising radiationkg U235 eq0.160.260.08
Terrestrial acidificationkg SO2-eq6.46 × 10−31.17 × 10−23.23 × 10−3
Freshwater eutrophicationkg P-eq7.84 × 10−56.77 × 10−53.92 × 10−5
Marine eutrophicationkg N-eq2.24 × 10−34.27 × 10−41.12 × 10−3
Terrestrial ecotoxicitykg 1.4-DB eq2.96 × 10−41.69 × 10−41.48 × 10−4
Freshwater ecotoxicitykg 1.4-DB eq7.40 × 10−32.48 × 10−43.70 × 10−3
Marine ecotoxicitykg 1.4-DB eq1.04 × 10−35.19 × 10−45.18 × 10−4
Agricultural land occupationm2 year5.51 × 10−31.27 × 10−22.75 × 10−3
Urban land occupationm2 year2.16 × 10−34.34 × 10−31.08 × 10−3
Natural land transformationm2 year1.25 × 10−52.67 × 10−56.27 × 10−6
Water depletionm31.12 × 10−28.10 × 10−35.60 × 10−3
Metal depletionkg 1 Fe eq2.02 × 10−32.08 × 10−31.01 × 10−3
Fossil depletionkg oil eq5.17 × 10−74.14 × 10−72.59 × 10−7
Table 13. Color differences between fabrics dyed with the treated effluent and a reference dyeing.
Reactive Dyes100% Effluent Reused
DECMC(2:1)
Yellow Procion HEXL0.55 ± 0.08
Crimson Procion HEXL0.76 ± 0.07
Navy Procion HEXL0.42 ± 0.01

