Assessing Water Security in Water-Scarce Cities: Applying the Integrated Urban Water Security Index (IUWSI) in Madaba, Jordan


1
Faculty of Civil and Environmental Engineering, University of Kassel, Kurt-Wolters-Str. 3, 34125 Kassel, Germany
2
Institute for Technology and Resources Management in the Tropics and Subtropics (ITT), TH Köln-University of Applied Sciences, Betzdorfer Straße 2, 50679 Köln, Germany
3
Chairman of the Middle East Water Forum (MEWF), Arar Street 20, Al Fuheis 19152, Jordan
*
Author to whom correspondence should be addressed.
Water 2020, 12(5), 1299; https://doi.org/10.3390/w12051299
Submission received: 1 April 2020
/
Revised: 24 April 2020
/
Accepted: 29 April 2020
/
Published: 5 May 2020
(This article belongs to the Special Issue Urban Water Policy and Planning Strategies for an Uncertain Water Future)
Abstract
:Water security is a major concern for water-scarce cities that face dynamic water challenges due to limited water supply, climate change and increasing water demand. Framing urban water security is challenging due to the complexity and uncertainties of the definitions and assessment frameworks concerning urban water security. Several studies have assessed water security by granting priority indicators equal weight without considering or adapting to the local conditions. This study develops a new urban water security assessment framework with application to the water-scarce city of Madaba, Jordan. The study applies the new assessment framework on the study area and measures urban water security using the integrated urban water security index (IUWSI) and the analytic hierarchy process (AHP) as a decision management tool to prioritise and distinguish indicators that affect the four dimensions of urban water security: drinking water, ecosystems, climate change and water-related hazards, and socioeconomic aspects (DECS). The integrated urban water security index (IUWSI) highlights the state of water security and intervention strategies in Madaba. The study reveals that urban water security in Madaba is satisfactory to meet basic needs, with shortcomings in some aspects of the DECS. However, Madaba faces poor security in terms of managing climate- and water-related risks. The IUWSI framework assists with a rational and evidence-based decision-making process, which is important for enhancing water resources management in water-scarce cities.
1. Introduction
Water security is widely recognised by policy makers and academics as a global risk and policy challenge that transcends national security, endangers the health and livelihoods of vulnerable communities, and matters to global security [1,2,3,4]. Since water security is a multifaceted challenge, the concept of water security is viewed from diverse perspectives that cannot be easily reconciled [5,6]. It can generally be seen as the umbrella goal of water resources management toward sustainable development thinking with the focus on meeting water demand for societal and ecological needs [7,8,9]. The concept has emerged from the need to balance people’s needs with conserving water resources, and is reflected explicitly in the United Nations’ Sustainable Development Goal related to water and sanitation (SDG6) [10].
The world is rapidly urbanizing; villages become towns and towns become cities. The urban population has risen dramatically from 751 million (1950) to 4.2 billion (2018) [11,12]. This trend is expected to continue, such that, by 2050, two-thirds of the world’s population will live in cities, and by 2030, there will be 43 densely populated cities with over 10 million dwellers [12]. With more than 80% of global gross domestic product (GDP) generated in cities, urbanization can play a crucial role in spurring progress towards Sustainable Development Goals 6 and 11 as nations strive to build inclusive, safe, resilient, and sustainable cities [13,14,15,16].
The intersection of water security and urbanization poses many issues, ranging from high population density and water crises to climate risks and natural disasters [5,9,17,18,19]. Rapid urbanization has exceeded the capacity of governments to meet the water demand, which has led to many water challenges, such as a lack of access to safely managed water and sanitation, intermittency of water supply, water quality degradation, failing flood management, and environmental degradation [20,21,22,23,24]. In recent years, many cities have faced serious water shortages, such as Delhi and Chennai (India), Cape Town (South Africa), Mexico City (Mexico), and Santiago (Chile), and many cities are likely to run out of water in the future [25,26,27,28].
Water security is a multifaced challenge that hangs on a plethora of socioeconomic, public health, governance, anthropogenic, natural risk, infrastructure, and institutional dimensions that are hard to align and manage [29,30,31,32]. The discourse on urban water security in recent years has involved many studies, at different levels, on definitions and assessment frameworks with indicators of water security [4,9,29,33,34,35,36,37,38,39]. Most of these assessments are poorly integrated with the needs of policy makers and there is thus a clear scalar mismatch [40,41]. The concept was studied and used in widely diverging ways; the Oxford school argues approaching water security with a risk perspective is more pragmatic [30,42,43], while others emphasize the role of adaptive capacity and inclusive governance mechanisms to ensure water security goes with sustainability [44,45]. Others stress the need to develop earth observations to increase reliability, comparability and reproducibility [7,46,47]. UN-Water looked at water security in its distinct aspects and addressed four dimensions, namely drinking water and human well-being, ecosystem, climate change and water related hazards, and socio-economic aspects (DECS framework) [10]. However, the major challenges of such all-encompassing studies are the complexity of operationalising the concept of water security holistically and captured it in one metric or in a robust policy action [6].
Our recent study [31] thoroughly investigated the holistic view of urban water security and proposed a new working definition and assessment framework, based on the sustainable development goal related to water and sanitation SDG6 [10] and the UN human rights to water and sanitation resolution 64/292 [48,49]. According to the authors, urban water security should be defined as “The dynamic capacity of water systems and stakeholders to safeguard sustainable and equitable access to water of adequate quantity and acceptable quality that is continuously, physically and legally, available at an affordable cost for: sustaining livelihoods, human well-being, and socio-economic development, ensuring protection against waterborne pollution and water-related disasters, and for preserving ecosystems in a climate of peace and political stability” [31].
This study takes a novel approach to address the above challenges by assessing water security in its DECS assessment framework and capture it in one single metric, namely the integrated urban water security index (IUWSI). We applied this approach in Madaba, Jordan to represent water scarce city with complex challenges, that could characterize the water challenges of many cities around the world. Jordan’s water security is a fundamental challenge to the country’s stability [50]. Jordan is one of the top water-scarce countries in the world [51,52]. It is extremely vulnerable as it is facing great pressures on water resources that include long-term drought, a high level of nonrevenue water, illegal use, transboundary water competition, and an influx of refugees [53,54,55]. Drinking water is supplied on an intermittent basis—once or twice per week—in most cities, with a high level of nonrevenue water (48%) in 2017 [56,57,58,59]. Intermittency of water supply leads to a vicious cycle of urban system degradation and water insecurity [60,61,62].
Jordan has been experiencing increasing demands due to population growth and an influx of displaced people, coupled with climate change, which significantly widens the gap between water supply and demand [52,63]. By the year 2025, if the current trajectory remains in place, Jordan may face a serious, long-term water crisis, since the per capita water supply will drop from the current 145 m3/year to only 91 m3/year, reaching a water deficit of 630 × 106 m3/year [53,57,64].
The main objectives of this study are to (1) apply the new DECS framework and IUWSI in Madaba, Jordan, by assessing and normalizing the indicators toward the levels of urban water security; (2) put in place a mechanism for the prioritization of urban water security according to the DECS dimensions and indicators, by considering the local conditions; and (3) measure the integrated urban water security index to identify the gaps and threats to the DECS dimensions and indicators that are to be used as a decision-support tool for better formulation of water security plans.
2. Methods
2.1. Study Area
The working definition and assessment framework were applied in a water-scarce city (Madaba, Jordan) in order to assess the existing urban water security status and guide decision makers toward appropriate intervention strategies. Madaba lies in the middle of Jordan and is situated 35 km southwest of Amman. The governorate of Madaba is divided into the Madaba directorate and the Dhiban directorate. It spans an area of 1000 km2 and had a population of 200,000 in 2018 [59,65].
Ninety-eight percent of people in Madaba have access to the water service, but only 65% are connected to the wastewater network [59]. Water is distributed from the Madaba reservoir to eight main zones on a weekly schedule, with inequality of supply hours due to the intermittent water supply [58,66,67]. Consumers are therefore forced to rely on alternative water sources such as storing water in large tanks and buying water directly from tanker truckers—private water vendors—to meet their water demands and to use for various coping strategies. However, these eight zones are for the most part lower than the Madaba reservoir and in theory can be served by gravity; the distribution system is inadequate to the point that friction losses are higher than the available head and therefore the system is assisted by pumping.
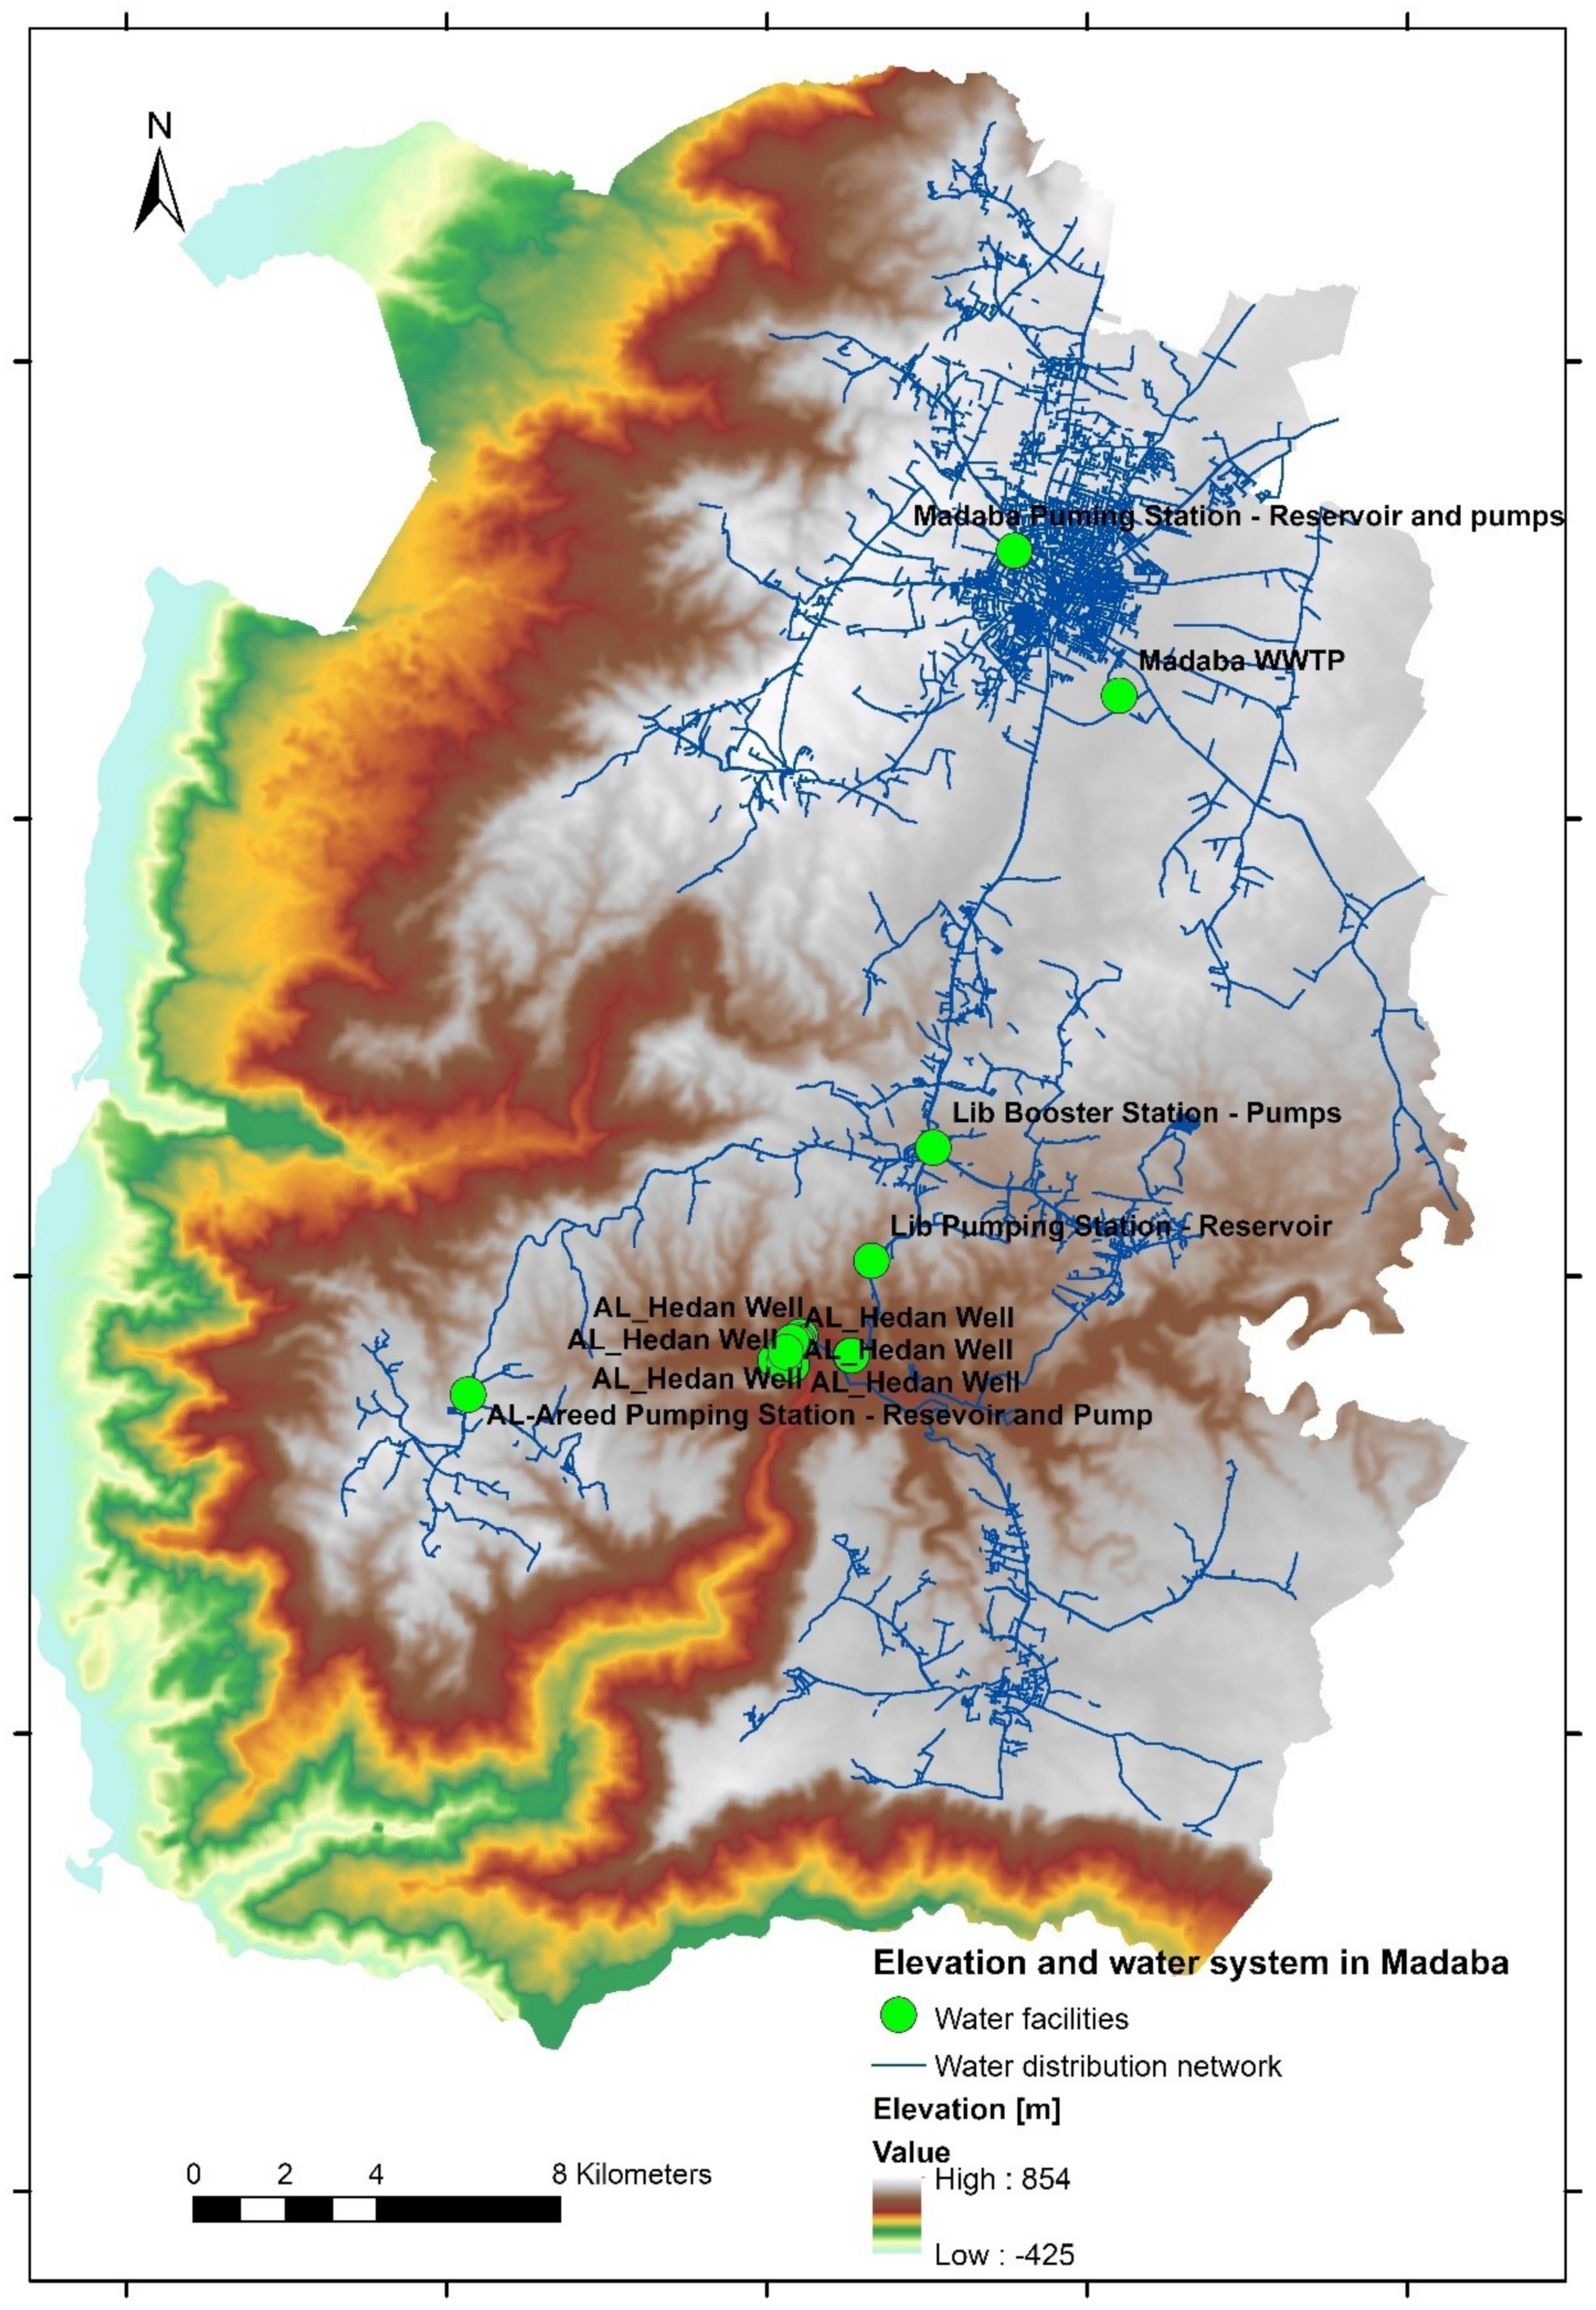
The total length of the existing distribution network is 1000 km from the wells to the customers’ meters, with an average pressure of 0,6 MPa. Water is pumped from an altitude of 330 m a.s.l. to elevations of 750–800 m a.s.l., which requires huge amounts of energy. As shown in Figure 1, the Madaba governorate is supplied by 15 wells in Heedan and Wala, which are pumped via the pumping stations in Walah and Libb to the main reservoir in Madaba (6000 m3) via a nominal diameter (DN 600) branch line off the main transmission line (DN 800) from Libb to Muntazah (Amman). The total production from the Heedan well field in 2018 was 10.5 million m3 [36]. The customers of Madaba Directorate are either supplied by the Madaba Reservoir via gravity supply (35%) or by direct pumping (65%) from the Madaba Pumping Station. The existing distribution pipework in Madaba itself is 433 km in length plus an additional 187 km for the rest of the directorate, with pipe sizes ranging from DN 50 up to DN 600 [58,66].
2.2. Assessment Framework and Normalization
The methodology of the paper is based on Aboelnga et al. [31] assessment framework of urban water security as a means of understanding the following four dimensions: drinking water, the ecosystem, climate change and water-related hazards, and socioeconomic aspects—called the DECS framework. The methodology can be summarised as follows:
- Measure the indicators of the DECS framework in Madaba, Jordan.
- Normalization and representation of the results.
- Assigning weights, aggregation of results, and measuring the IUWSI.
Table 1, Table 2, Table 3 and Table 4 represent the indicators on a common scale—since they have different units—from 1 to 5, where 1 is poor and 5 is excellent. The thresholds of the indicators are relevant to be applied in any city and based on detailed literature reviews in the domain of water security [31].
The indicators have been chosen based on relativeness, measurability, transparency, and data availability. In this study, all the data required to assess the urban water security in Madaba were secondary data obtained from recent publications assessing the urban water supply and greenhouse gases GHG emissions [58,66], as well as from national reports from bodies such as the Ministry of Water and Irrigation in Jordan, the Ministry of Health, and Madaba’s Water and Wastewater Utility [56,57,67,68,69,70].
2.3. Weighing the Indicators and Measuring Urban Water Security
The analytical hierarchy process (AHP) is the most common multicriteria method developed by Saaty as a decision-making tool for prioritizing indicators of different units of measurement and allows for some small inconsistencies in judgments [71,72,73]. AHP is widely used in many environmental studies, such as urban sustainability, environmental impact assessment, environmental hazards, environmental quality indexing, environmental vulnerability assessment, energy resources allocation, and water sources security [74,75,76,77,78].
The free Excel worksheet of an AHP developed by Goepel was used as supporting tool for decision-making in Madaba, Jordan, to define the relative importance of each indicator of the DECS framework [79,80]. Pairwise comparisons were used to determine the weight of each indicator. The assessment was performed by the authors who are experts in the field—including the former minister of water resources in Jordan—and know well the water system in the study area. The results of the pair-wise comparisons were arranged in a matrix as shown below.
Despite its broad applicability, the AHP method suffers from a disadvantage: it requires a lot of comparisons for decision-making, especially if there are many indicators like the dimension of drinking water [81]. This condition takes time to apply them to many water stakeholders. We note the importance of the participatory approach of different stakeholders to define the relative importance of the indicators. However, we shared the results of the model with subject matter experts in the study area and found that the weights of the indicators were relatively acceptable.
The AHP decomposes the complexity of urban water security in the form of a hierarchy, descending from an urban water security index to the four dimensions of the DECS framework, including the associated indicators with their relative weights. The model makes use of a pairwise comparison to subjectively compare one indicator with another using the expertise and knowledge of the decision makers as a guide. It compares the urban water security dimensions and its indicators with different units (pairwise comparisons): first within each level of the DECS dimensions, and then between the levels, to identify the importance of each indicator from the decision makers’ perspective, using the scale from 1 to 9 given in Table 5 [82,83].
In order to obtain the priorities of the indicators, the matrices (A1, A2, … An) reflect the interaction among a set of n elements by using pairwise comparison for each indicator with the other indicators in the same dimension. The judgement of each indicator (Ai, Aj) is characterized here as “aij”. Since aii = 1 for all values of i, the diagonal of the matrix equals 1.
The weights of each indicator are represented as (w1, w2, …, wn); the relative importance of the indicator over the others is represented as wi/wj. The AHP decision tool compares the relative weight of each indicator in a set with respect to the overarching goal. The output of the pairwise comparison is presented in a matrix form as follows:
Then problem turns into a general process for calculating the largest eigenvalue corresponding to the eigenvector to assess the Consistency Index (CI), where A is the matrix, x is the eigenvector, and λ is the eigenvalue. When we divide the CI by the random consistency number, the final value of consistency ratio (CR) is recommended to be less than 0.10 to be consistent, and if it is more than 0.10, the matrix should be adjusted by reassessing the relative importance [71]:
Building the AHP Model of Madaba, Jordan
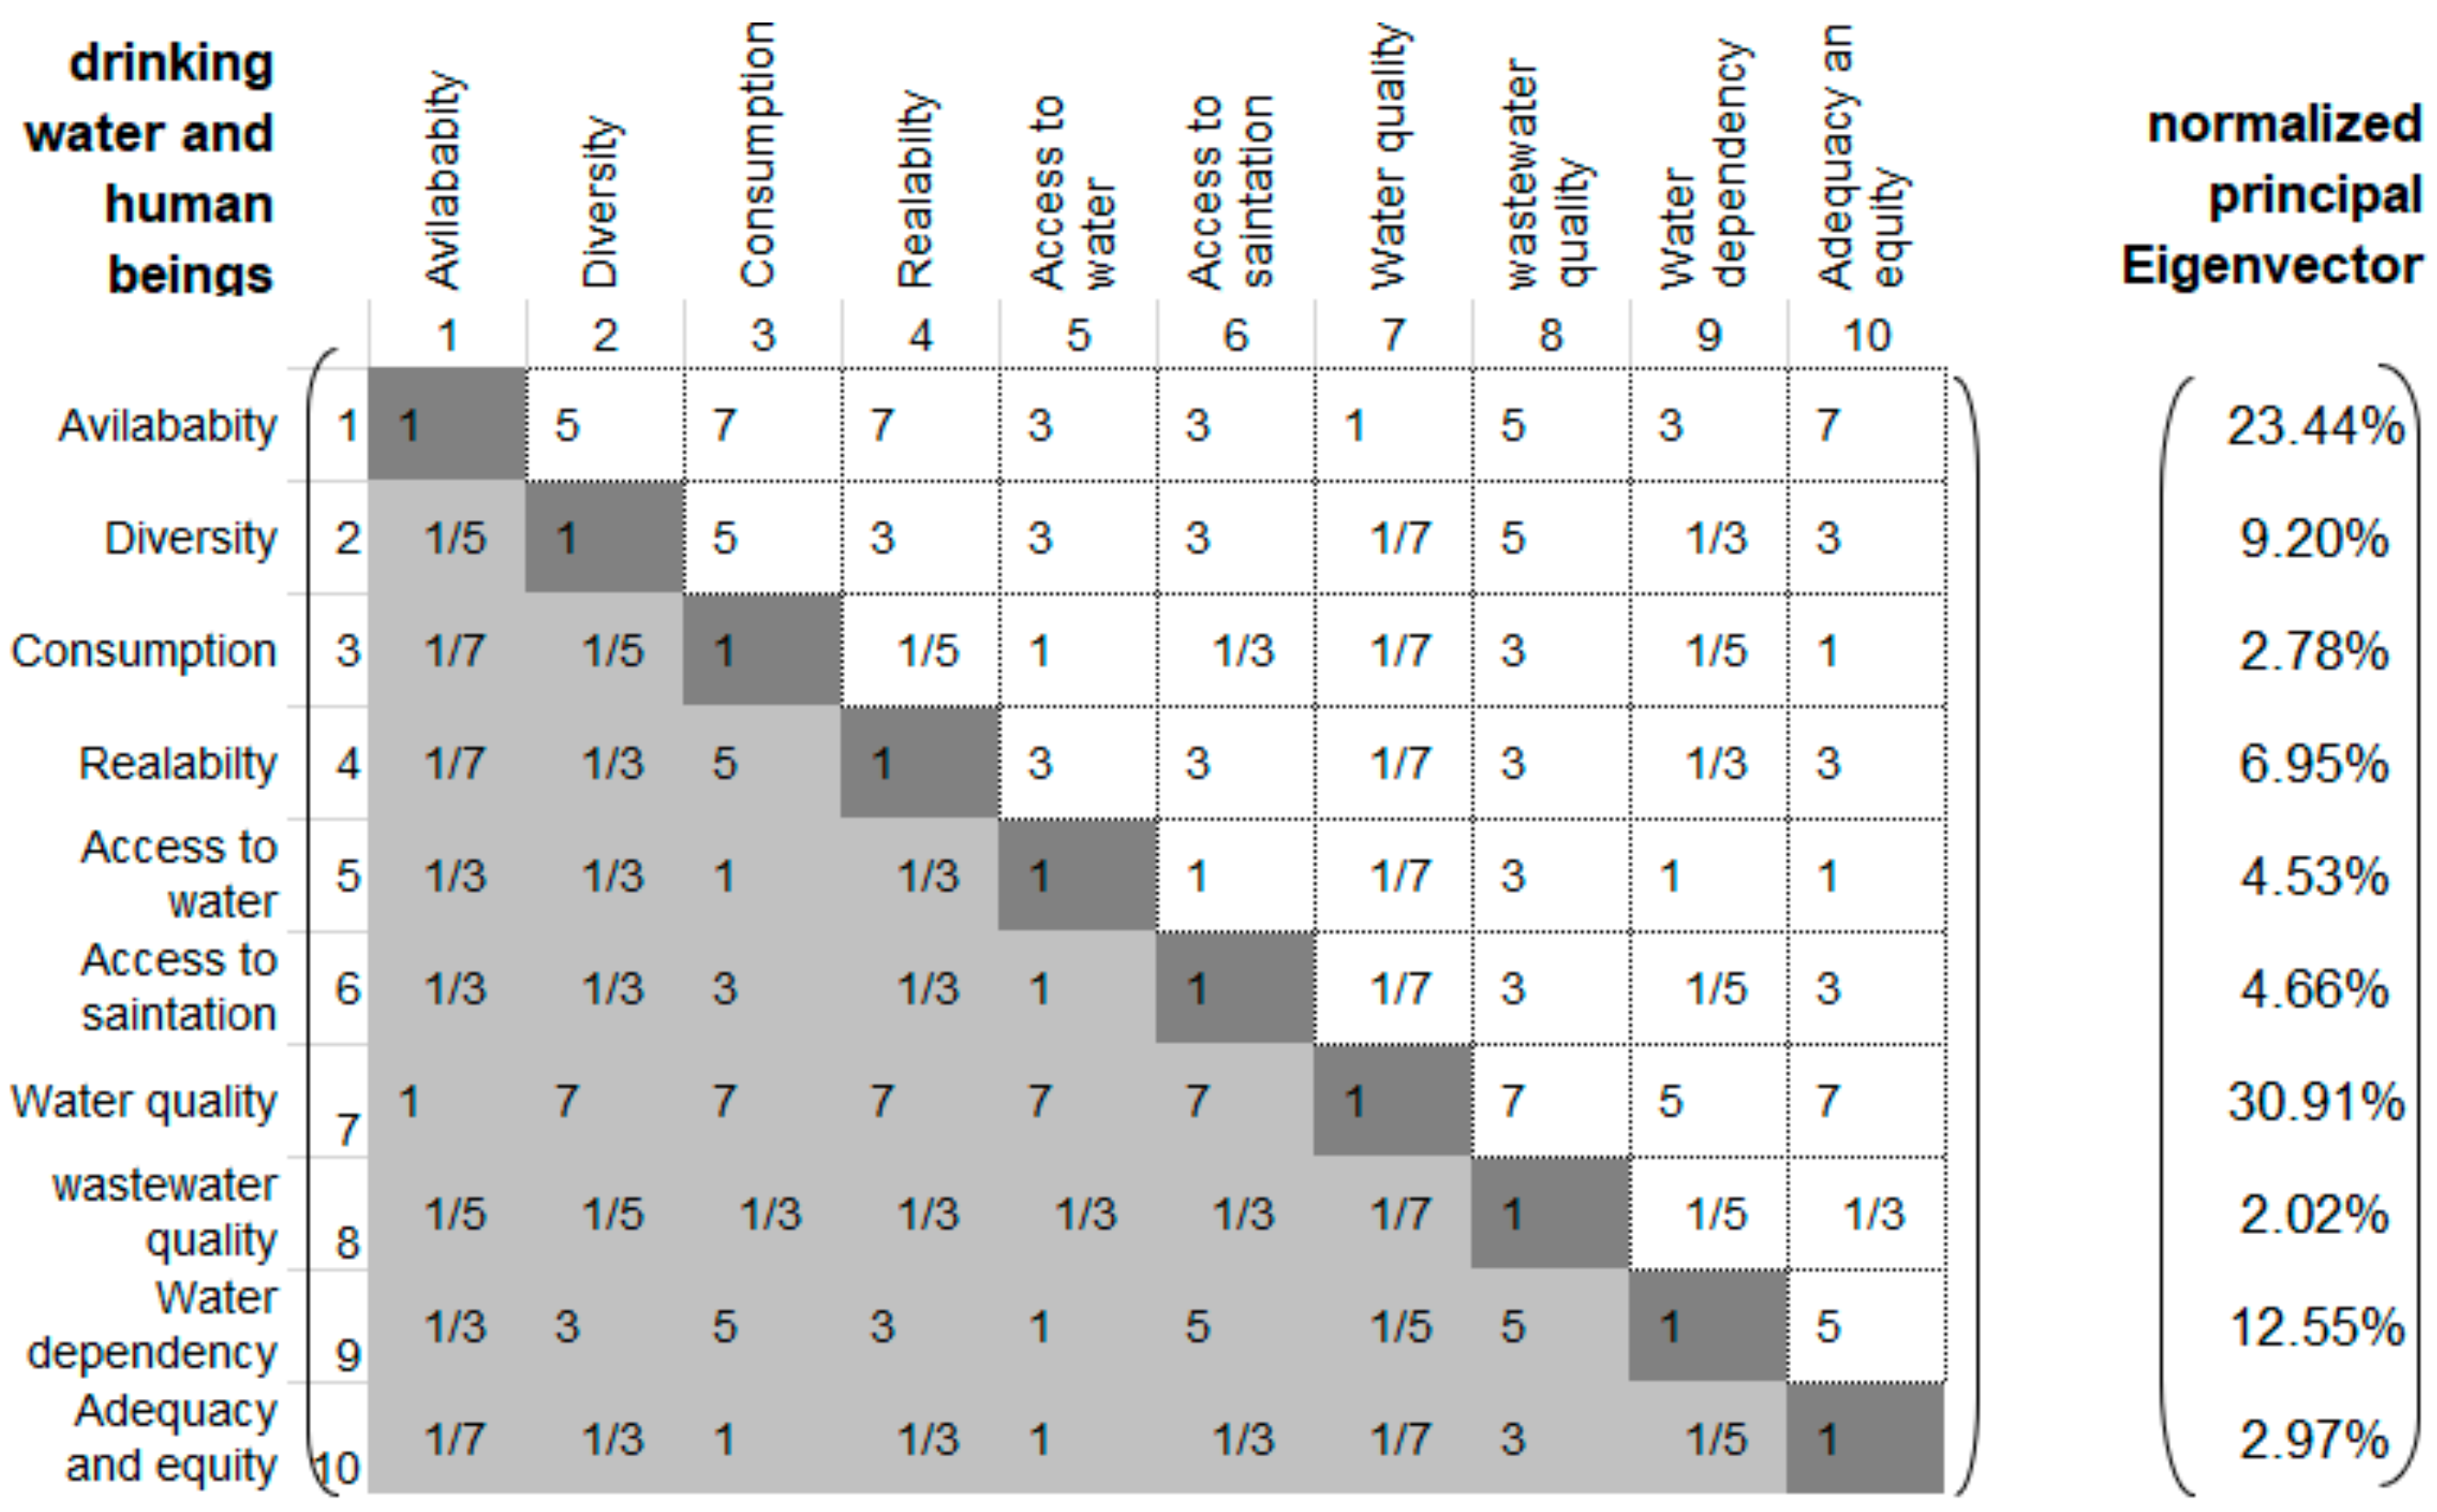
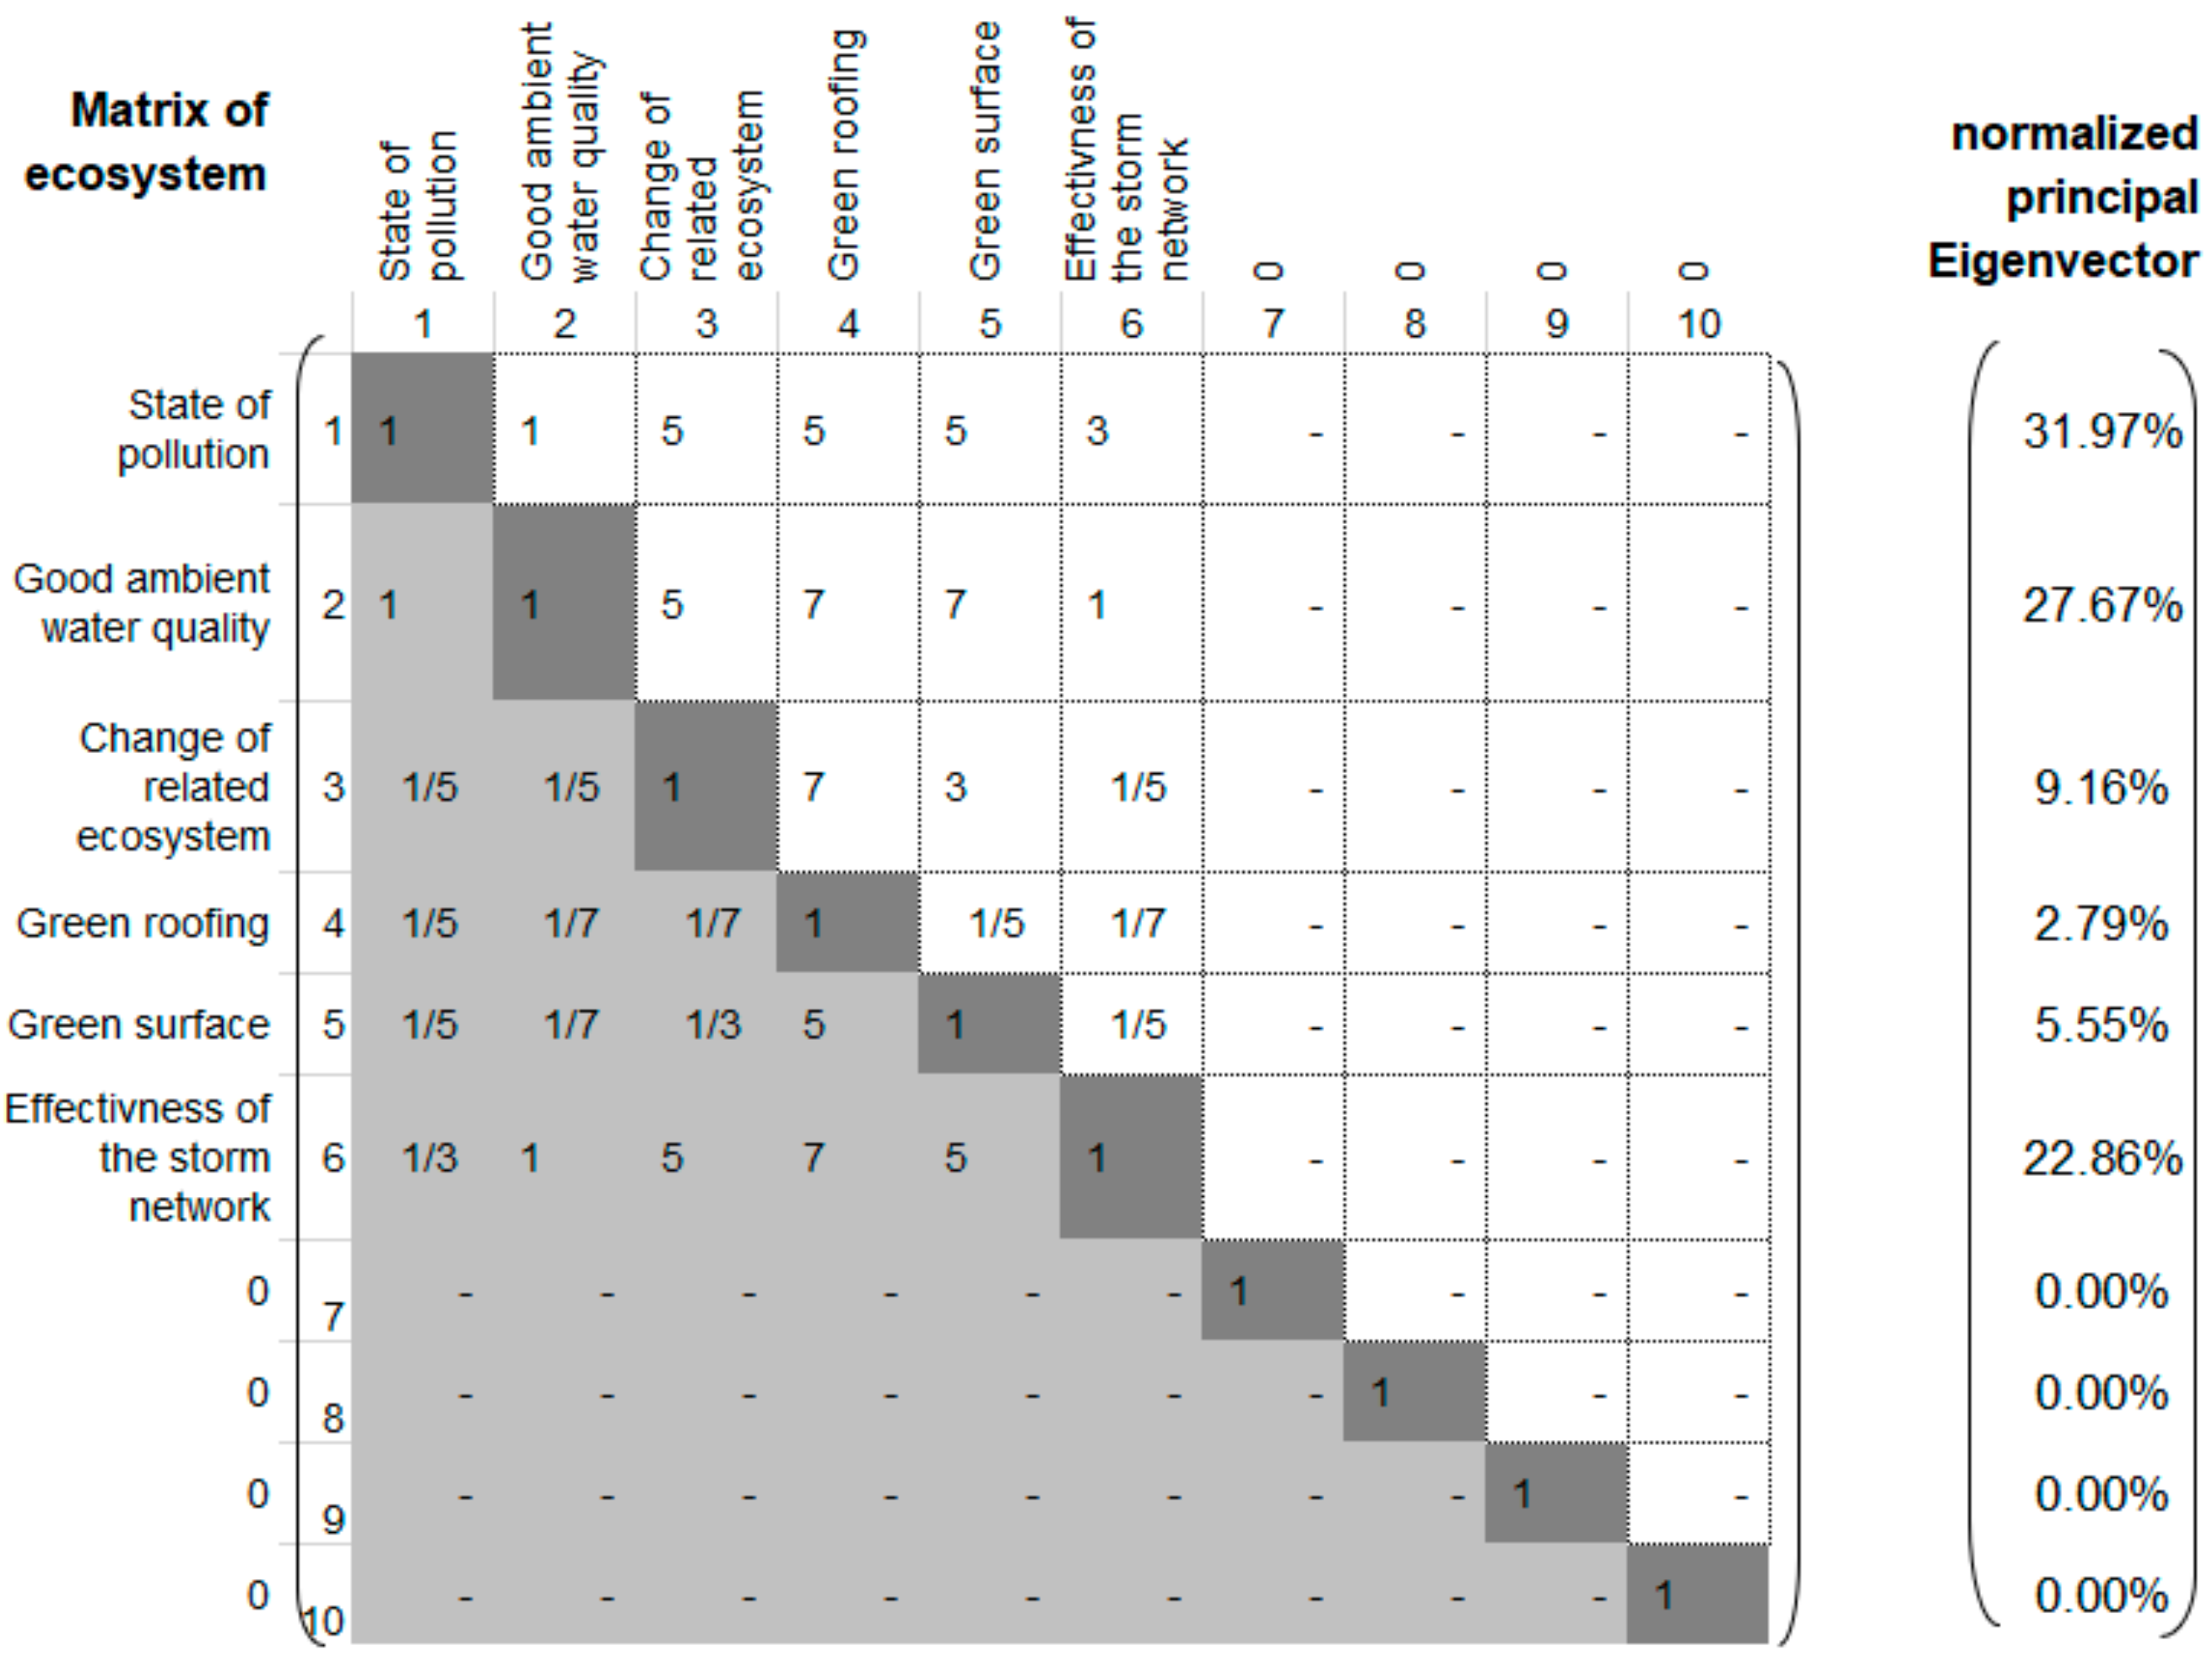
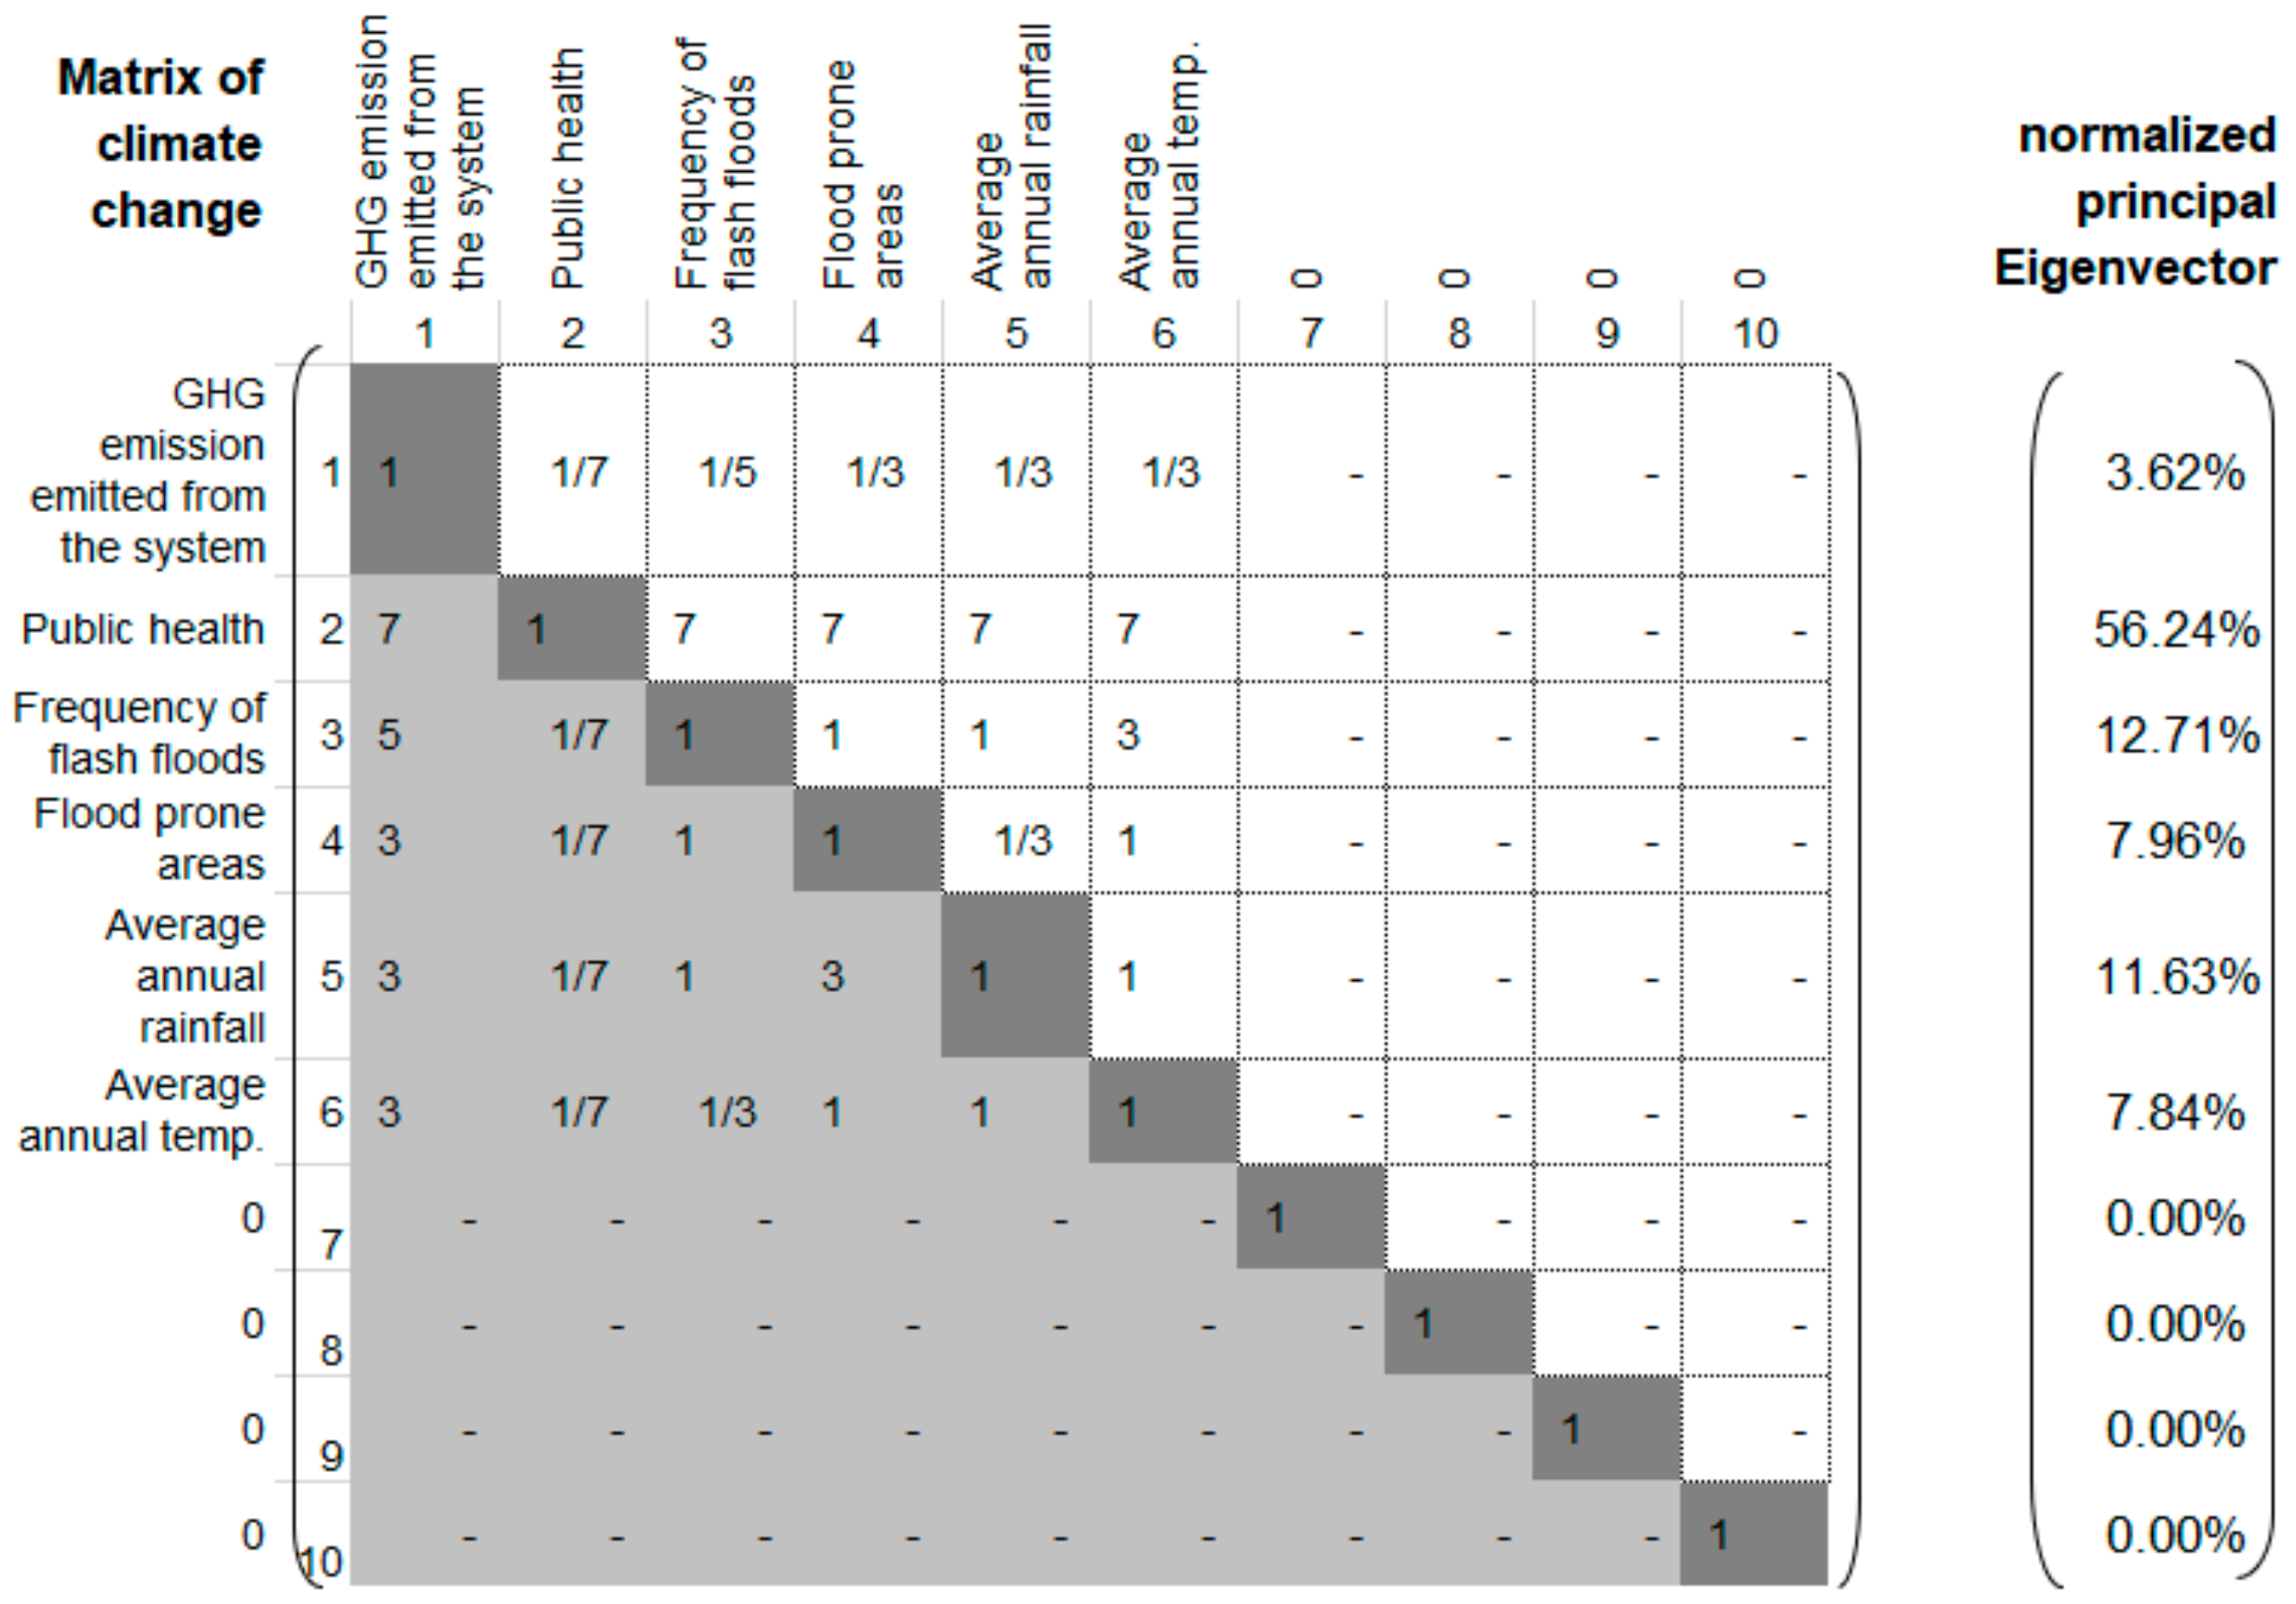
After we assess and make pairwise comparisons to priorities the indicators by evaluating two indicators or dimensions at a time in terms of relative importance, the model generates a weight for each indicator and a normalized comparison matrix is created as shown in Figure 2, Figure 3, Figure 4, Figure 5 and Figure 6. The results of the matrix include the eigenvalue (λ) and the consistency ratio (CR) to verify the consistence of decision-making process.
After we get the weights of each indicator from the AHP model, the integrated urban water security index IUWSI can be calculated by multiplying the weights and the score values of the indicators. The result can be interpreted as shown in Table 6 in terms of level of water security, which ranges from <1.5 to >4.5; the bigger the index value is, the better the urban water security situation will be.
IUWSI refers to the integrated urban water security index value of a certain city; W refers to the weight of the indicators A of the IUWSI.
3. Results and Discussion
The DECS dimensions were assessed using their related indicators, in which each indicator is quantified and normalized to assess the level of water security. After that, weights were assigned for the indicators based on the results from the AHP, prioritised to reflect the significance and impact of each indicator in the study area.
3.1. Drinking Water and Human Well-Being
This dimension was assessed (Table 7) in terms of securing an adequate and sustainable quantity of water of an acceptable quality, which is physically, legally, and continuously available to meet the water demand.
The overall IUWSI for the dimension of drinking water and human well-being is 2.6 (a satisfactory level). However, there are major gaps and serious concerns in Madaba—based on the score results and weights of the indicators—related to the availability of water resources and the diversity and reliability of the infrastructure. The fresh water available from the Heedan and Wala wells in Madaba is 135 m3/capita/day in 2016, of which irrigated agriculture constituted 6.6 million m3, industries 1 million m3, and municipalities 9.0 million m3. According to the water-stress index, the available fresh water is 135 m3/capita/day, which puts Madaba at the level of absolute water scarcity (less than 500 m3/capita/day). Wastewater reuse is an untapped resource in Madaba, in that less than 30% of the treated wastewater is being effectively reused for restricted agriculture. The excess water is being discharged onto the land and wasted. This amount would relieve and secure treated wastewater for agricultural uses.
Madaba has not secured alternative water resources to safeguard the drinking water supply for households. Action in this area is fundamental to achieve a high level of urban water security. Water and energy are dependent upon each other, so their deficit is coupled in Madaba, with major effects on the urban system and people’s lives. The contribution of alternative energy sources, such as renewable energies to Madaba’s water system, is vital to decrease GHG emissions and shifting the intermittent water supply into a continuous supply. Thus, diversification of both water and energy resources is essential to achieve urban water security.
The reliability of the water infrastructure is measured in terms of nonrevenue water (NRW) in Madaba, which is a great challenge on the road to achieving urban water security. About 40% of the supplied water is being lost due to physical losses (the infrastructure leakage index was 3.12 in 2016), and commercial losses make up 40% of the total nonrevenue water. Metering is also a component of commercial losses; 91.02% of households in Madaba are connected to meters, but mechanical meters, illegal uses, and billing inefficiencies are still a major cause of commercial losses. Energy efficiency programs in Madaba are being improved, especially in pump stations, with an average of 72.24% of the total energy consumed in the grid. Moreover, adequacy and equity in Madaba are a major concern in that people receive water only once or twice per week, for an average of 7 h daily.
On the other hand, Madaba has a good water security level in terms of water quality, accessibility, and water dependency: 1715 water samples from drinking water were tested and found to be of high grade, complying with the water quality standards. The same was true for wastewater and industrial water (132 samples from the wastewater treatment plant and 22 samples from the industrial factory). However, water quality is still a serious issue in that turbidity is high in the winter season and the utility is obliged to stop pumping water from the wells and import water from the capital, Amman.
The physical accessibility of water and sanitation services is a key to achieving the basic human right to water and salination. According to SDG 6.1.1, 98% of Madaba’s population (31,192 subscribers) have access to safely managed drinking water services, while 65% of the population (15,462 subscribers) use safely managed sanitation services (SDG 6.2.1 a) and are connected to the wastewater network.
Madaba imports 332,000 m3 of water from Amman during the winter due to heavy rains because water turbidity is high and risks to public health are a major concern. Thus, water pumping from the wells is halted as a precautionary measure.
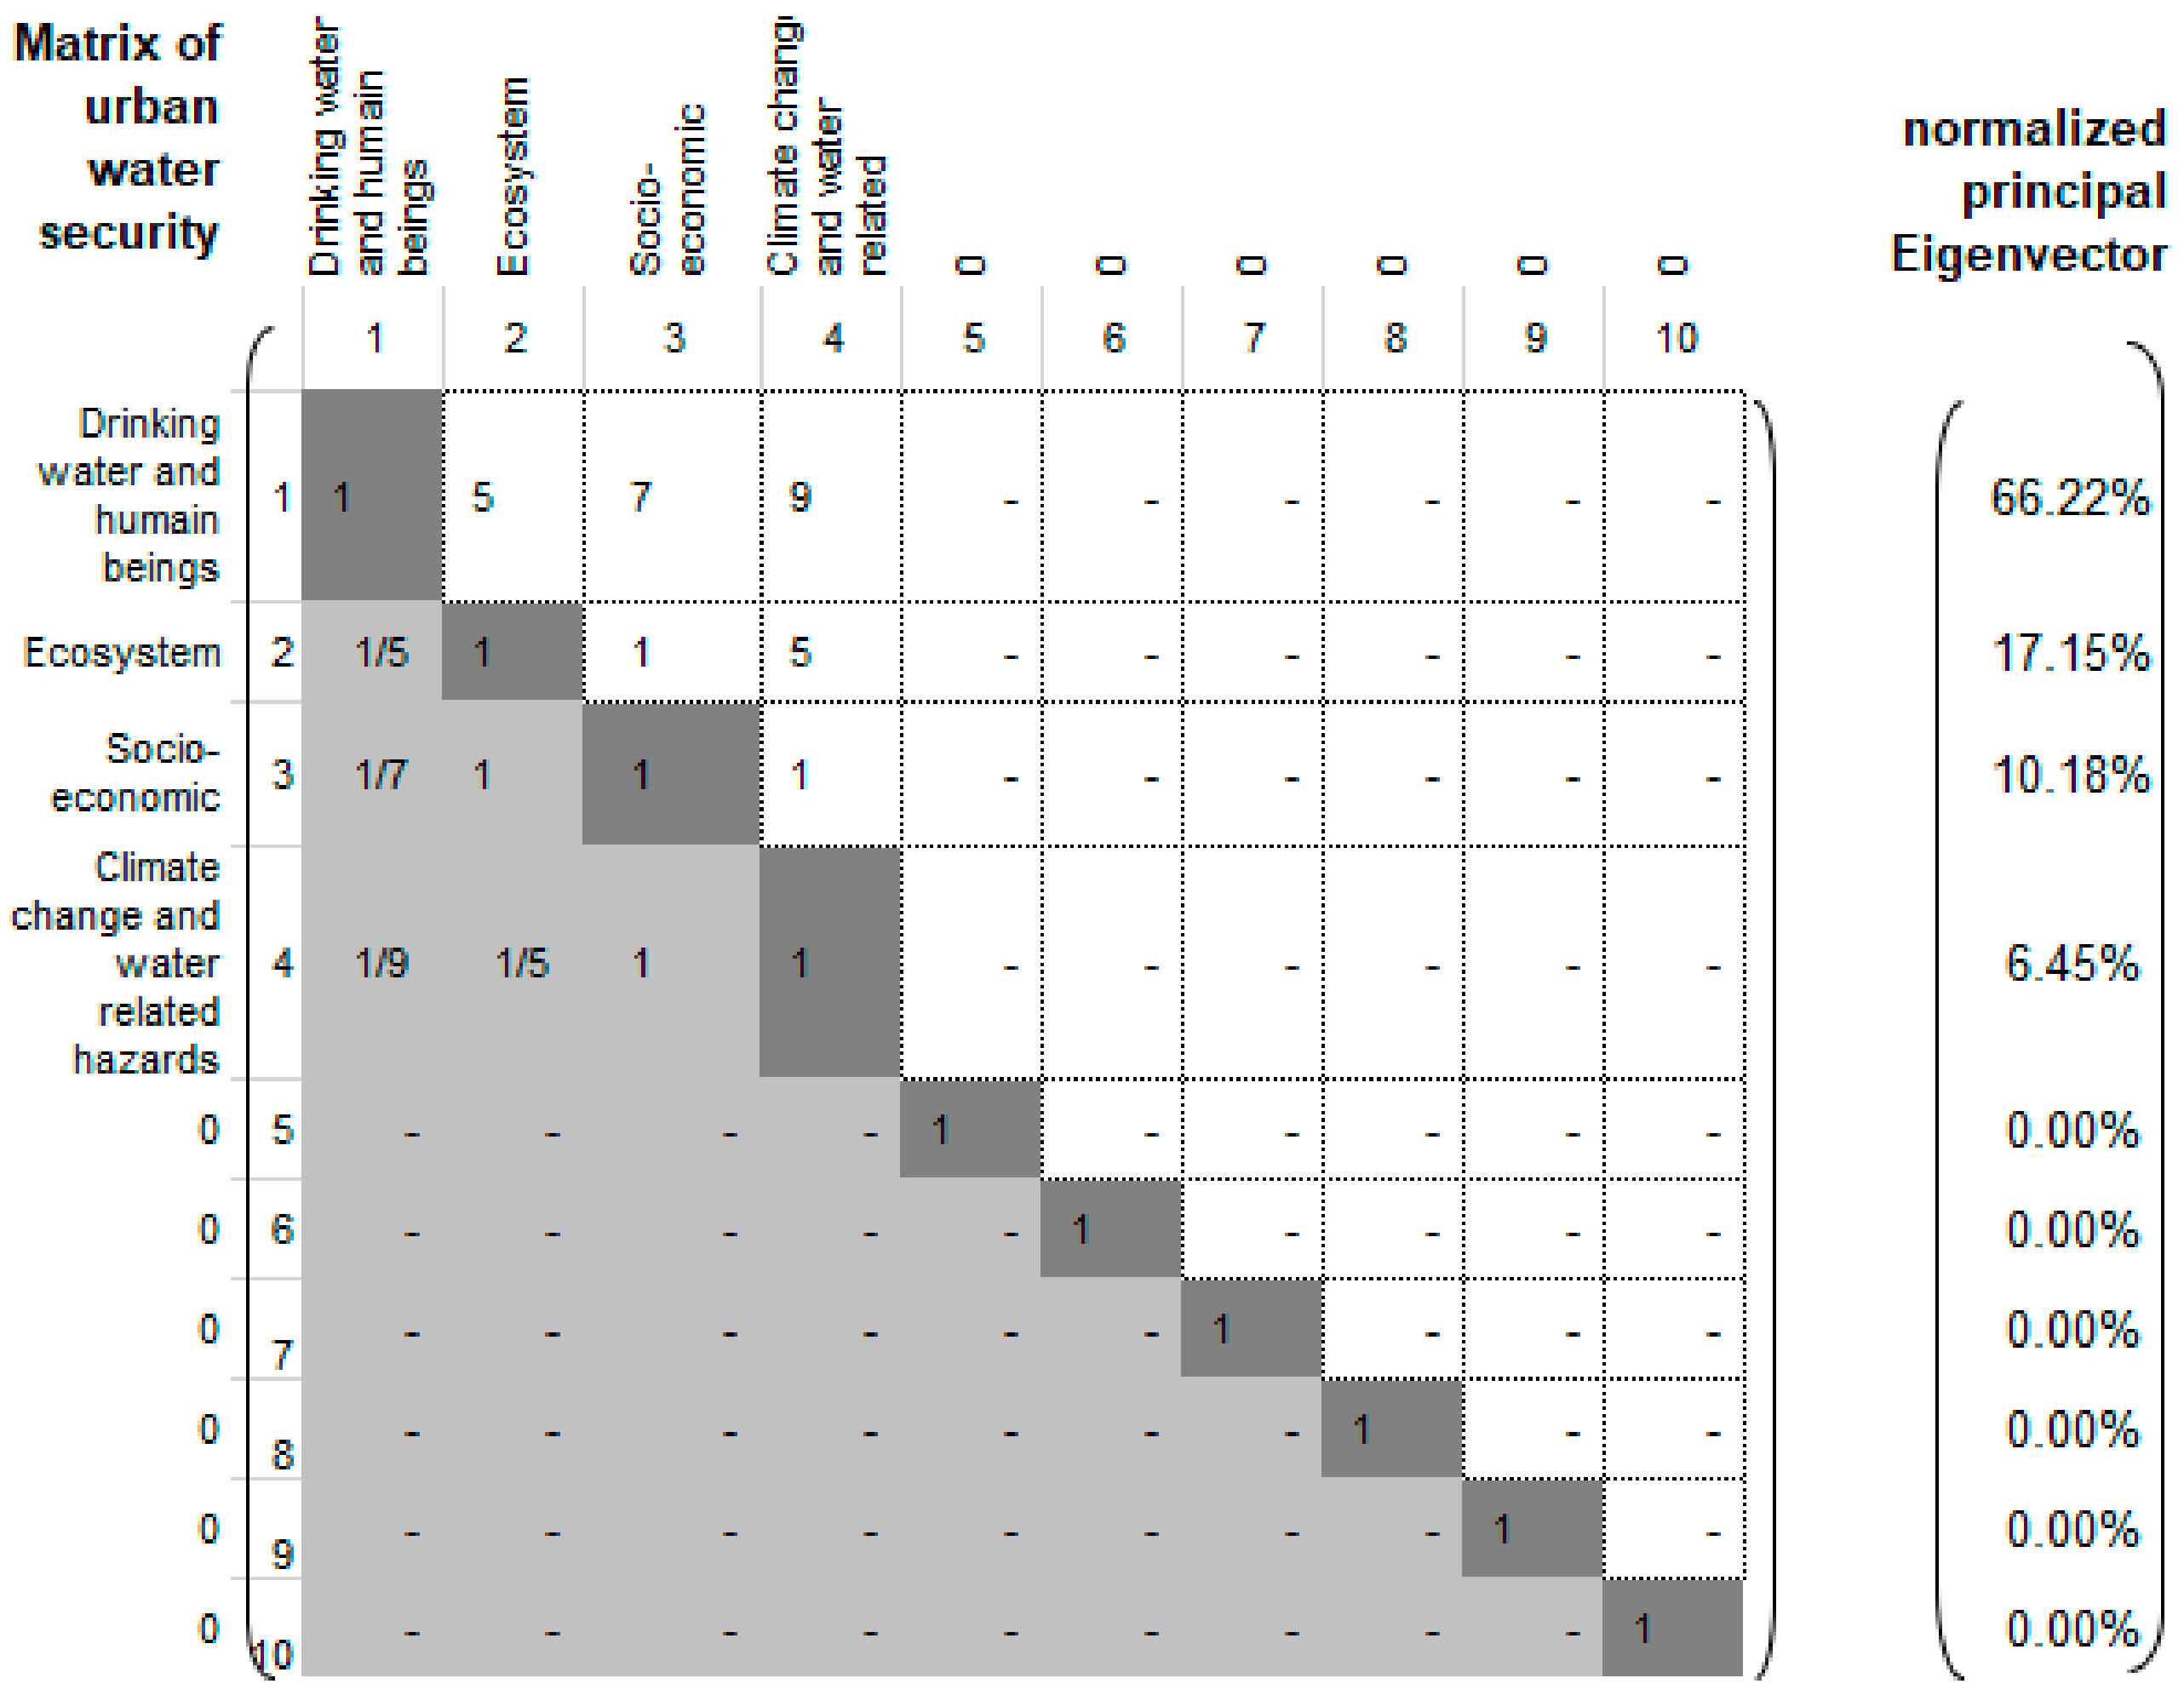
3.2. Ecosystems
The ecosystem is at a reasonable level (2.52) of water security, as computed from the related indicators (Table 8), with major gaps in two indicators: pollution and the effectiveness of the wastewater and storms networks. Sanitation infrastructure is still a significant gap; only about 67% of wastewater is being treated in Madaba’s wastewater treatment plant. Although wastewater represents a risk in this case, it provides many opportunities if this untapped resource is properly utilised for urban agriculture and recharging ground water. In Madaba, blockage complaints (3250 in 2016) are an indicator of the inefficiency of the storm and wastewater infrastructure. It is crucial to strengthen the resilience of the infrastructure for ecosystem and water security.
The proportion of bodies of water with good ambient water quality is at a good level. Samples from the groundwater from Wala and Heedan wells were tested and confirmed to meet the WHO and locally applicable quality standards 90% of the time, while the water quality was found to be deteriorated due to water turbidity in the winter.
However, there are major concerns about the low impact of indicators related to green roofing. In Madaba, green roofing has not been deployed since roof tanks take up a considerable area of the roof and local technologies are not in place. Madaba’s green spaces are minimal; it may be described as a city in the desert. Madaba is at risk of urban water insecurity due to the ecosystem aspect.
3.3. Climate Change and Water-Related Hazards
The results for climate change and water-related hazards show poor water security (1.6) in most of the related indicators, as summarized in Table 9.
Madaba is a heavily industrial city whose total GHG emissions for the entire water and wastewater system are 6.07 kg CO2/m3 (3.4 kg CO2/m3 from water supply + 2.67 kg CO2/m3 from wastewater) due to the high energy consumption from the pump stations, a high level of nonrevenue water, and the energy consumed by the Madaba wastewater treatment plant (WWTP).
According to the Ministry of Health [59], Madaba has a record 3475 cases of diarrhoea; this may be correlated with the intermittent water supply, which can lead to significant risks to public health due to the potential suction of nonportable water by negative pressure, biofilm detachment, and microbial regrowth, especially when static conditions occur. Roof tanks often increase bacterial regrowth.
Urban flooding is caused by heavy and/or prolonged rainfall that exceeds the capacity of the drainage system. Flooding and drought are natural hazards with a great economic and social impact on cities. The growing threat of urban flooding has revealed the poor state of the city’ resilience to climate change. Madaba has experienced unprecedent flooding in 2018, which led to a death of 13 people. The flood prone areas are in Zarqa Main, a valley area of 270 km2 that represents 0.29% of the total area of Madaba.
3.4. Socioeconomic Aspects
The socioeconomic results of each indicator are in Table 10, with major gaps in the following crucial indicators: budget directed to water and sanitation, illegal uses, and customers’ complaints. In Jordan, only 1.05% of the total budget of the government is directed to the water sector. Maximizing the budget directed to the water sector is indispensable to achieve urban water security. In Madaba, illegal uses are a great concern; 396 cases were reported in 2016. Customer satisfaction is a key factor to achieve urban water security; a state in which the utility is capable of operating and managing the water system so as to satisfy the water demand. In Madaba’s intermittent water supply system, complaints about leakage and no water are one of the main issues that put pressure on the performance of the water utility.
The topography of Madaba and pumping water far from the Heedan and Wala wells play a major role in increasing the per unit energy consumption to 4.98 Kwh/m3, coupled with the intermittency of water—water is highly pressurized for a short supply time to meet the demand, which causes negative impacts in terms of increasing the greenhouse gas emissions as well as on the infrastructure in terms of leakage and high energy consumption. Wastewater treatment and discharge consumes 30% of the total energy in the water cycle. In Madaba, 1.31 kwh/m3 is the average consumption, mainly due to overconsumption by the aerators. However, the Madaba WWTP has the potential to produce biogas; wastewater is still an untapped resource to achieve water and energy security for WWTPs in Jordan.
In Madaba, water is highly subsidized by the government. Thus, the water tariff per 15 m3 is USD 0.78, which is very low, to cover the operation and maintenance costs. Part of the water tariff (USD 0.15 per 15 m3) contributes directly to wastewater, which is not enough for cost recovery and bridging the infrastructure gap as only 65% of Madaba’s population is connected to the wastewater network.
The total annual operating revenue per population served divided by the national GNI per capita is 0.58%, an indicator of the affordability of water and sanitation services in Madaba. The indicator can give an approximate measure of the affordability, but it cannot reveal the high costs of coping with the intermittent water supply in Madaba. The water tariff and the high level of nonrevenue water are key components of cost recovery in Madaba; the operating revenue can only cover 78% of operating expenditure.
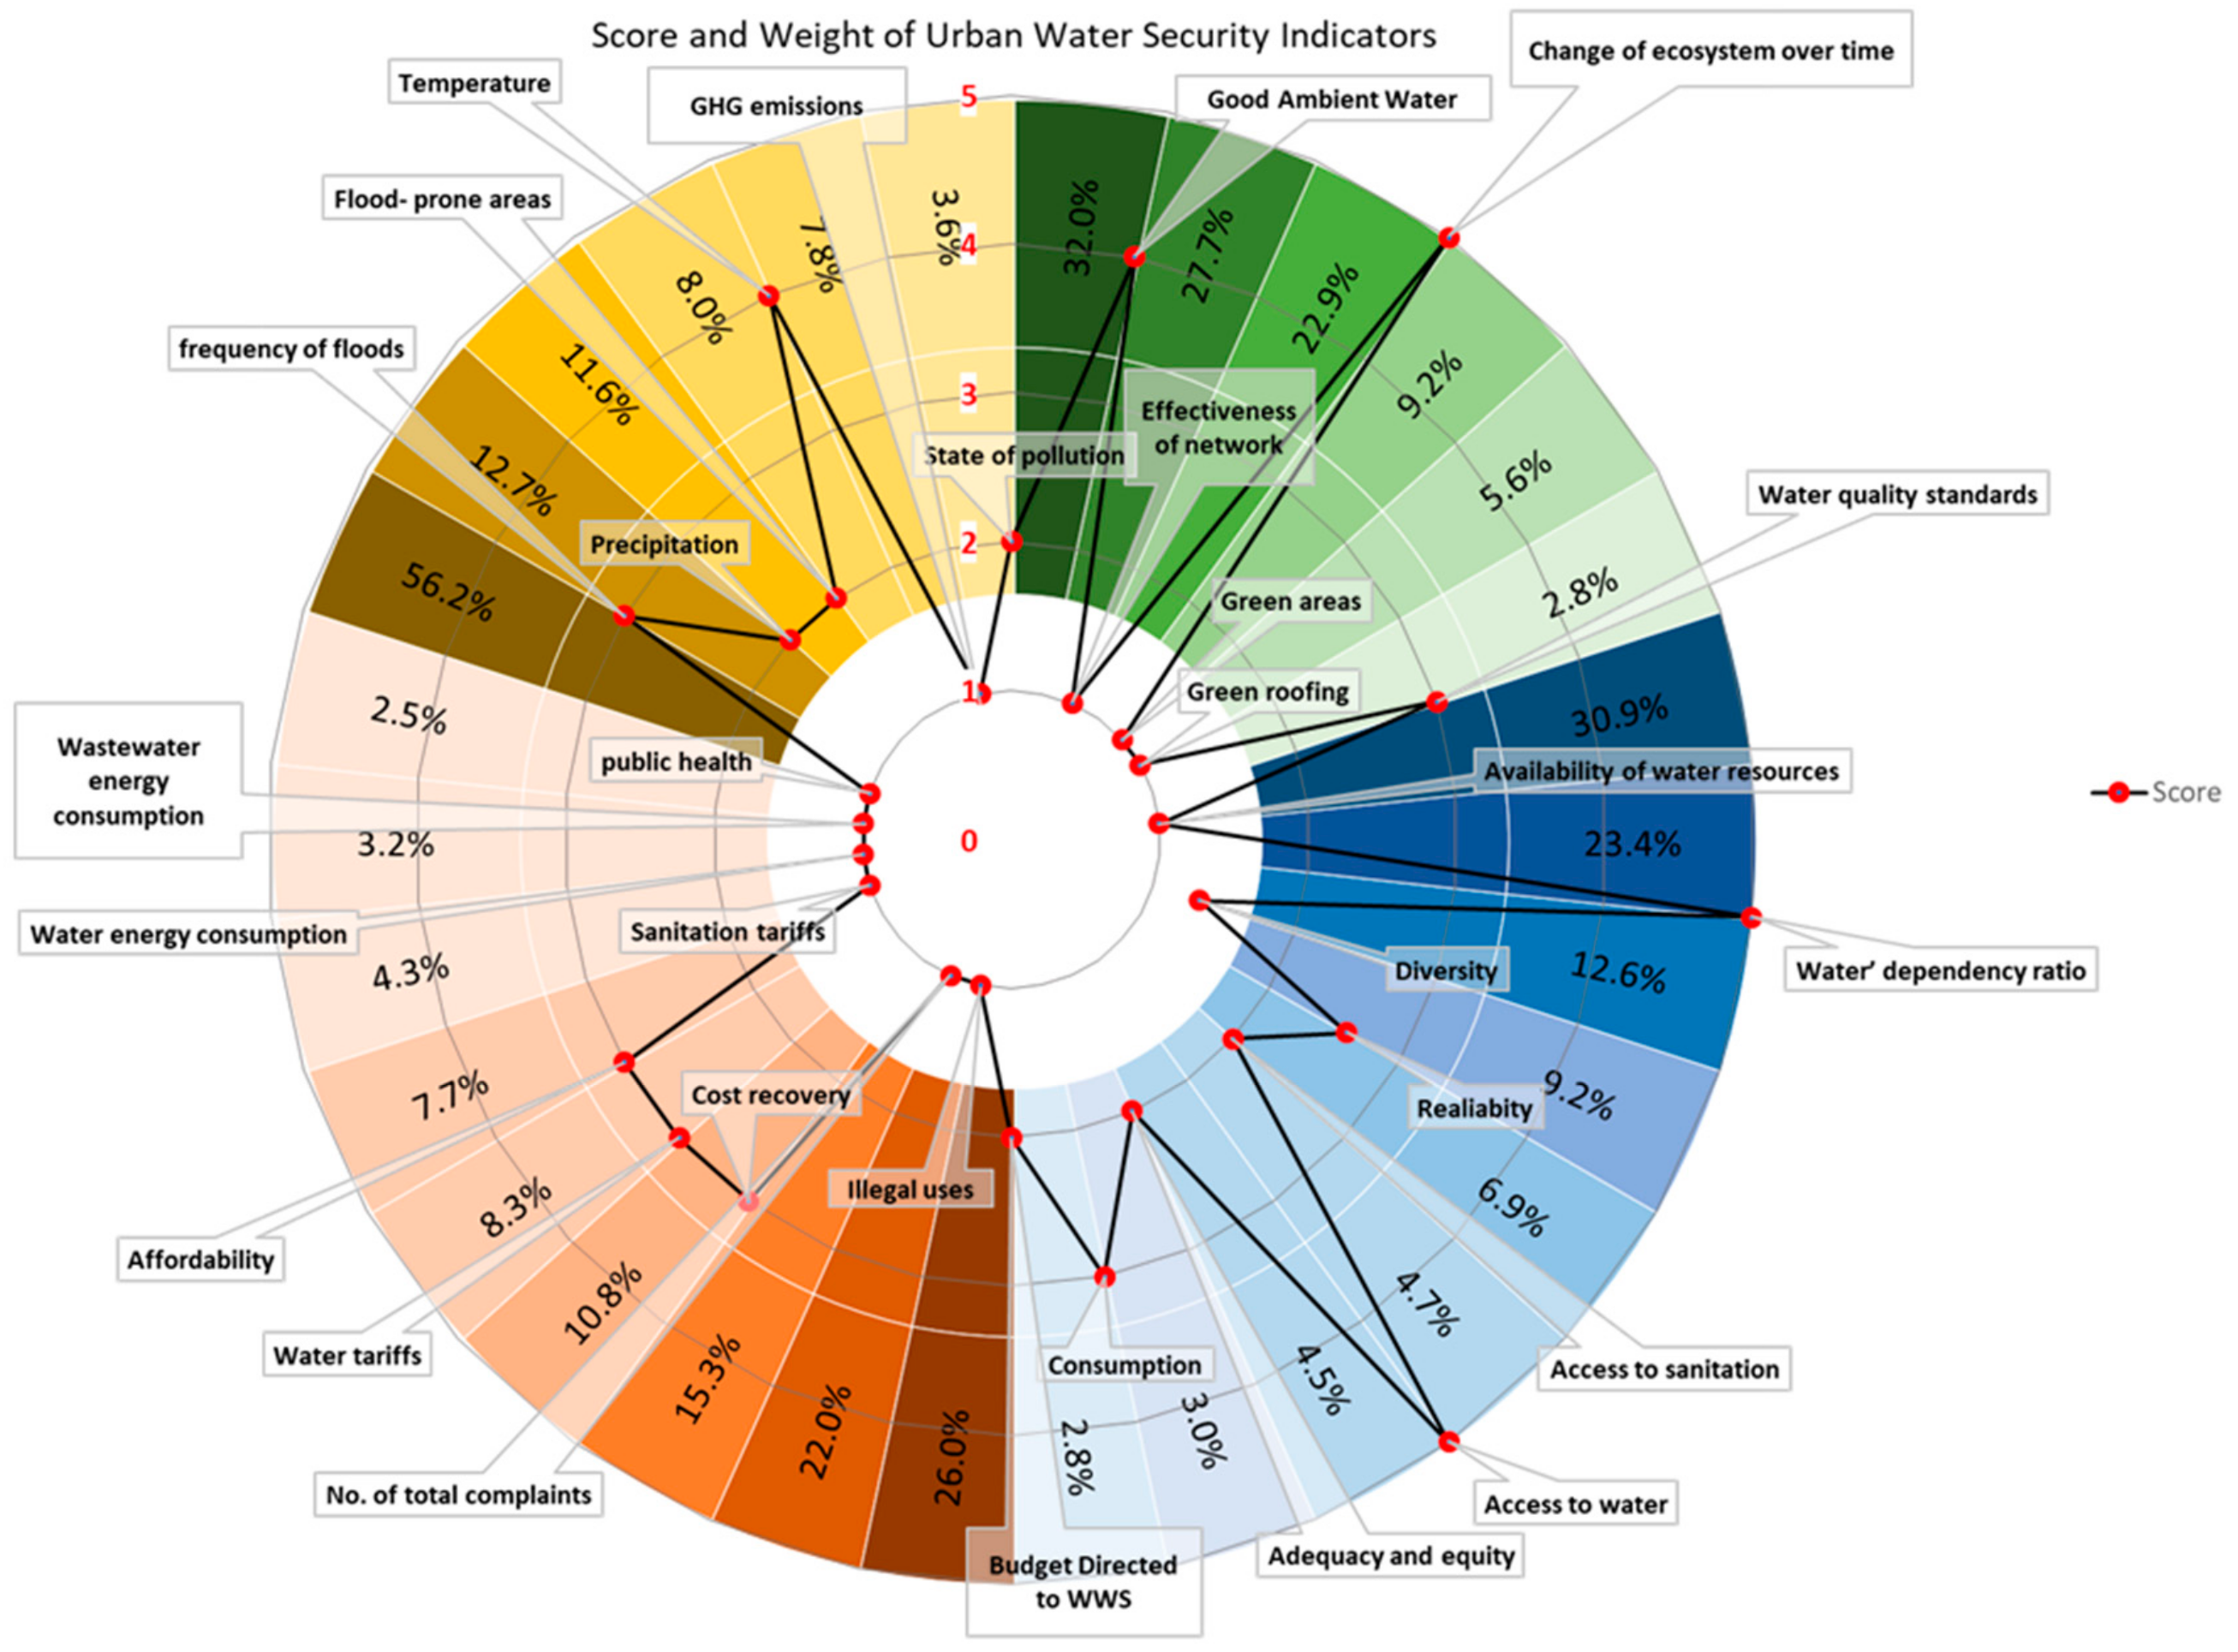
The overall water security is presented in Figure 7 by the score value and the relative importance of each indicator. The IUWSI diagram is used to graphically represent the results of indicators and its weights with graded colours—ordered by the relative importance of each indicator—in order to facilitate the visualization of the state of urban water security and the needed intervention strategies in Madaba, Jordan.
The level of water security in Madaba is represented below by the cumulative single index IUWSI.
4. Conclusions
It is clear that there are a plethora of issues that can help explain the current urban water security figures in Madaba. This study develops a systematic approach to study the dynamics of urban water security using the IUWSI in the water-scarce city of Madaba, Jordan. The overall IUWSI in Madaba shows a satisfactory level—that is, it can meet basic demands but has inefficient water governance due to centralized decision-making and focuses on just one dimension of urban water security—drinking water. The degree of water security in Madaba in the dimensions of drinking water and the ecosystem is satisfactory, but with weak major indicators: water availability, diversity, reliability, pollution, and effectiveness of water and storm networks.
The socioeconomic and climate change dimensions are fair and poor, respectively, with major concerns about the related indicators of the budget directed at illegal water uses, customer complaints, public health, and floods. Addressing all the aforementioned indicators would strengthen the capacity of the system and allow water stakeholders to achieve urban water security.
Despite clear evidence of dwindling water resources and increasing water demands, Madaba continues to count on conventional (non-renewable) solutions to groundwater and silo-oriented solutions to meet the basic needs of drinking water, neglecting crucial dimensions and indicators of the DECS framework. In Madaba, urban water management is linear and discounted from the entire water cycle; water is mainly abstracted from the Heedan and Wala wells with limited thought given to sustainability constrains, the vulnerability of the ecosystem, fragmented socioeconomic development, or wastewater and stormwater management.
Accordingly, the study makes the following key policy recommendations about urban water security in Madaba based on the results of the indicators in terms of high relative weights with low scores:
- The urban water security index provides the water stakeholders with a clear understanding of the challenges and what is needed for achieving water security in Madaba.
- Diversity of water resources in Madaba is a major concern, and vital to increase the availability of water resources and achieve urban water security. Wastewater reuse and nonrevenue water are untapped resources in Madaba, and would have a great positive impact on the reliability of the system.
- The dangers of high-water turbidity in Madaba’s wells during flash floods—which are increasing as a result of climate change—made the system dependent on external sources and imported water from the capital, Amman. Climate resilience measures are necessary to mitigate climate extremes in the future.
- Intermittent water supply in Madaba poses risks to water quality and water services in terms of adequacy and equity.
- Access to safely managed sanitation is crucial to improving water security and reducing pollution in Madaba.
- Green roofing and urban agriculture should receive a lot of attention to improve the ecosystem dimension.
- Adaptative management and IWRM based on public participation and knowledge exchange can increase the adaptivity capacity in the face of climate change and water-related hazards, and are critical to the resilience of people and infrastructure and to achieve water security.
- Energy consumption in Madaba’s water supply is high due to the topography and energy losses. Investing in energy efficiency programs and renewable energies is a good measure to reduce greenhouse gas emissions.
- The budget being directed to water and sanitation services is essential to achieve water security; adjusting water and wastewater tariffs is needed to maximize domestic finances for achieving water security.
- Illegal uses pose threats to the DECS framework; strict measures and technologies are needed to detect theft and crack down on it.
The IUWSI provides a holistic framework to operationalize the concept, identify different types of insecurity, highlight gaps in indicators, weight indicators based on their importance, and recognize the complex causal processes that lead to a certain level of urban water security.
We argue that urban water security could be relevant as a tool for reforming water policies in many countries that face substantial challenges in managing water resources effectively. This broader approach can be used to assess the extent to which water policies are aligned with the key objectives and the required resources. The findings are symptomatic of Jordan and the Middle East region in which rapid urbanization coupled with climate extremes are key factors placing pressure on the limited water resources. As a result, water supply is intermittent, water quality is deteriorated, there is inequality of water supply and great competition for access to water, and a continuing need to pursue strong reform agenda.
The findings highlight the dangers faced if we continue with a business-as-usual approach. It is crucial to shift from silo solutions to more integrated ones to ensure urban water security. A clear action is needed for countries running in a vicious cycle of water insecurity due to interment water supply. We recommend that policy makers take decisive action toward the weak indicators with high impact and to shift intermittent water supply into 24 × 7 provisioning, to ensure sustainable water management and get back the virtuous cycle of water security.
We argue that this novel approach would help policy makers and water stakeholders to target their scant resources toward achieving urban water security. While some policy measures, such as increasing access to sanitation, water-use efficiency, cracking down illegal uses, and increasing the budget directed to water sector, have positive implications for achieving urban water security, other measures, such as reusing wastewater for agriculture, diversity of water and energy sources, inter-basin transfers of water to deal with water shortage, and reducing greenhouse gases emission to deal with climate risks, may increase the trade-offs and nexus challenges. For example, treated wastewater use in agriculture as an untapped resource may be positive for water conservation, although you increase the risk to groundwater quality and polluting the farmland with chemical residual of wastewater treatments. These trade-offs are strongest in water-scarce countries with limited resources and capacities, where many people lack access to safely managed water and sanitation as in Jordan and the Middle East region. Policy makers have to make choices among intervention measures using this tool, which focus prominently on the weak indicators with high impact. Managing the trade-offs in dynamic water security is a daunting task and significant challenges remain.
The existing literature on water security assessments is too narrow to apply an equal weight to all the indicators of water security, which often does not represent the reality on the ground and underestimate the necessary interventions at the local scale. The results of the study are dependent on the local context that can be different from other cases. The study highlights the importance of the weights as a tool in planning pathways toward water security and underscore the most important indicators with high impact to invest first. This will result in maximizing synergies and minimizing trade-offs among indicators. The result of the Figure 7 is a good representation of the required interventions to achieve urban water security in terms of defining the weak indicators with high relative weights.
This study is an initial attempt to develop AHP models for evaluating the relative importance of the DECS indicators by comparing a set of indicators and weights for urban water security. The AHP model should be refined and views from different stakeholders must be collected, considered and balanced according to the differences that may arise. Since water security is a dynamic process affected by increasing demands, changing climate, political structures, economic growth, and resources, the relative importance of indicators should also be seen as an iterative process based on feedbacks.
The study can be implemented and scaled to many parts of the world and this would help to create a platform for comparative analysis and benchmarking cities toward achieving urban water security. Therefore, water stakeholders, public authorities, and regulators can learn the best practices from each other, to continuously improve the integrated management of water resources and services.
Author Contributions
H.T.A. and L.R. designed this research; H.T.A. carried out this research with L.R., F.-B.F. and H.E.-N. revised the analysis and the paper; F.-B.F. and L.R. supervised and took part in the design, implementation, and analysis. All authors have read and agreed to the published version of the manuscript.
Funding
This research received no external funding.
Acknowledgments
The authors are thankful to Bambos Charalambous, Chair of the IWA Intermittent Water Supply Specialist Group for his valuable comments and feedback on this paper. The author also thanks the Ministry of Water Resources in Jordan, and the water utility (Miyahuna) for providing the data necessary for the analysis.
Conflicts of Interest
The authors declare no conflict of interest.
References
- World Economic Forum. The Global Risks Report 2020, 15th ed.; World Economic Forum: Geneva, Switzerland, 2020; ISBN 978-1-944835-15-6. [Google Scholar]
- Cook, C.; Bakker, K. Water security: Debating an emerging paradigm. Glob. Environ. Chang. 2012, 22, 94–102. [Google Scholar] [CrossRef]
- Wheater, H.S.; Gober, P. Water security and the science agenda. Water Resour. Res. 2015, 51, 5406–5424. [Google Scholar] [CrossRef]
- Steffen, W.; Richardson, K.; Rockström, J.; Cornell, S.E.; Fetzer, I.; Bennett, E.M.; Biggs, R.; Carpenter, S.R.; de Vries, W.; de Wit, C.A.; et al. Planetary boundaries: Guiding human development on a changing planet. Science 2015, 347. [Google Scholar] [CrossRef] [PubMed] [Green Version]
- Srinivasan, V.; Konar, M.; Sivapalan, M. A dynamic framework for water security. Water Secur. 2017, 1, 12–20. [Google Scholar] [CrossRef]
- Lankford, B.; Bakker, K.; Zeitoun, M.; Conway, D. Water Security. Principles, Perspectives and Practices; Routledge: Abingdon, UK, 2013; ISBN 9780415534710. [Google Scholar]
- Bolognesi, T.; Gerlak, A.; Giuliani, G. Explaining and Measuring Social-Ecological Pathways: The Case of Global Changes and Water Security. Sustainability 2018, 10, 4378. [Google Scholar] [CrossRef] [Green Version]
- Gerlak, A.K.; House-Peters, L.; Varady, R.G.; Albrecht, T.; Zúñiga-Terán, A.; de Grenade, R.R.; Cook, C.; Scott, C.A. Water security: A review of place-based research. Environ. Sci. Policy 2018, 82, 79–89. [Google Scholar] [CrossRef]
- Hoekstra, A.Y.; Buurman, J.; van Ginkel, K.C.H. Urban water security: A review. Environ. Res. Lett. 2018, 13, 053002. [Google Scholar] [CrossRef] [Green Version]
- UNESCO and UNESCO i-WSSM. Water security and the sustainable development goals. In Water Security and the Sustainable Development Goals; Series l; UNESCO Publishing: Paris, France, 2019; ISBN 978-92-3-100323-3. [Google Scholar]
- United Nations. The World’s Cities in 2018—Data Booklet. Available online: https://www.un.org/en/events/citiesday/assets/pdf/the_worlds_cities_in_2018_data_booklet.pdf (accessed on 7 January 2020).
- United Nations. World Urbanization Prospects: The 2018 Revision. ST/ESA/SER.A/420. 2018. Available online: https://population.un.org/wup/Publications/Files/WUP2018-Report.pdf (accessed on 7 January 2020).
- Grübler, A.; Fisk, D. Energizing Sustainable Cities. Assessing Urban Energy; Earthscan: London, UK, 2013; ISBN 9780203110126. [Google Scholar]
- Nilsson, M.; Griggs, D.; Visbeck, M. Policy: Map the interactions between Sustainable Development Goals. Nature 2016, 534, 320–322. [Google Scholar] [CrossRef]
- Zhang, X.; Chen, N.; Sheng, H.; Ip, C.; Yang, L.; Chen, Y.; Sang, Z.; Tadesse, T.; Lim, T.P.Y.; Rajabifard, A.; et al. Urban drought challenge to 2030 sustainable development goals. Sci. Total Environ. 2019, 693, 133536. [Google Scholar] [CrossRef]
- Horne, J.; Tortajada, C.; Harrington, L. Achieving the Sustainable Development Goals: Improving water services in cities affected by extreme weather events. Int. J. Water Resour. Dev. 2018, 34, 475–489. [Google Scholar] [CrossRef]
- Roth, D.; Khan, M.S.A.; Jahan, I.; Rahman, R.; Narain, V.; Singh, A.K.; Priya, M.; Sen, S.; Shrestha, A.; Yakami, S. Climates of urbanization: Local experiences of water security, conflict and cooperation in peri-urban South-Asia. Clim. Policy 2019, 19, S78–S93. [Google Scholar] [CrossRef] [Green Version]
- Hassan Rashid, M.A.u.; Manzoor, M.M.; Mukhtar, S. Urbanization and Its Effects on Water Resources: An Exploratory Analysis. Asian J. Water Environ. Pollut. 2018, 15, 67–74. [Google Scholar] [CrossRef]
- Sadoff, C.W. Securing Water, Sustaining Growth; Report of the GWP/OECD Task Force on Water Security and Sustainable Growth; Sadoff, C.W., Hall, J.W., Grey, D., Aerts, J.C.J.H., Ait-Kadi, M., Brown, C., Cox, A., Dadson, S., Garrick, D., Kelman, J., et al., Eds.; University of Oxford: Oxford, UK, 2015; ISBN 9781874370550. [Google Scholar]
- Chang, Y.-T.; Liu, H.-L.; Bao, A.-M.; Chen, X.; Wang, L. Evaluation of urban water resource security under urban expansion using a system dynamics model. Water Sci. Technol. Water Supply 2015, 15, 1259–1274. [Google Scholar] [CrossRef]
- Clifford Holmes, J.K.; Slinger, J.H.; Musango, J.K.; Brent, A.C.; Palmer, C.G. Using System Dynamics to Explore the Water Supply and Demand Dilemmas of a Small South African Municipality. In Proceedings of the 32nd International Conference of the System Dynamics Society, Delft, The Netherlands, 20–24 July 2014. [Google Scholar]
- Chen, Y.; Zhou, H.; Zhang, H.; Du, G.; Zhou, J. Urban flood risk warning under rapid urbanization. Environ. Res. 2015, 139, 3–10. [Google Scholar] [CrossRef] [PubMed]
- Da Costa Silva, G. Climate change and the water–energy nexus: An urban challenge. J. Water Clim. Chang. 2014, 5, 259–275. [Google Scholar] [CrossRef]
- Vairavamoorthy, K.; Gorantiwar, S.D.; Mohan, S. Intermittent Water Supply under Water Scarcity Situations. Water Int. 2007, 32, 121–132. [Google Scholar] [CrossRef]
- Rajendran, S. Water Scarcity in Chennai: A Financial-Economic Appraisal of Rain Water Harvesting. SSRN J. 2008. [Google Scholar] [CrossRef]
- Shepherd, N. Making Sense of “Day Zero”: Slow Catastrophes, Anthropocene Futures, and the Story of Cape Town’s Water Crisis. Water 2019, 11, 1744. [Google Scholar] [CrossRef] [Green Version]
- Liu, S.; Wang, N.; Xie, J.; Jiang, R.; Zhao, M. Optimal Scale of Urbanization with Scarce Water Resources: A Case Study in an Arid and Semi-Arid Area of China. Water 2018, 10, 1602. [Google Scholar] [CrossRef] [Green Version]
- Burls, N.J.; Blamey, R.C.; Cash, B.A.; Swenson, E.T.; Fahad, A.a.; Bopape, M.-J.M.; Straus, D.M.; Reason, C.J.C. The Cape Town “Day Zero” drought and Hadley cell expansion. Npj Clim. Atmos. Sci. 2019, 2, 24. [Google Scholar] [CrossRef] [Green Version]
- Grey, D.; Sadoff, C.W. Sink or Swim? Water security for growth and development. Water Policy 2007, 9, 545–571. [Google Scholar] [CrossRef]
- Grey, D.; Garrick, D.; Blackmore, D.; Kelman, J.; Muller, M.; Sadoff, C. Water security in one blue planet: Twenty-first century policy challenges for science. Philos. Trans. A Math. Phys. Eng. Sci. 2013, 371, 20120406. [Google Scholar] [CrossRef] [PubMed] [Green Version]
- Aboelnga, H.T.; Ribbe, L.; Frechen, F.-B.; Saghir, J. Urban Water Security: Definition and Assessment Framework. Resources 2019, 8, 178. [Google Scholar] [CrossRef] [Green Version]
- Halbe, J.; Pahl-Wostl, C.; Sendzimir, J.; Adamowski, J. Towards adaptive and integrated management paradigms to meet the challenges of water governance. Water Sci. Technol. 2013, 67, 2651–2660. [Google Scholar] [CrossRef]
- Allan, J.V.; Kenway, S.J.; Head, B.W. Urban water security—What does it mean? Urban Water J. 2018, 15, 899–910. [Google Scholar] [CrossRef] [Green Version]
- Jensen, O.; Wu, H. Urban water security indicators: Development and pilot. Environ. Sci. Policy 2018, 83, 33–45. [Google Scholar] [CrossRef]
- Shrestha, S.; Aihara, Y.; Bhattarai, A.P.; Bista, N.; Kondo, N.; Futaba, K.; Nishida, K.; Shindo, J. Development of an objective water security index and assessment of its association with quality of life in urban areas of developing countries. SSM Popul. Health 2018, 6, 276–285. [Google Scholar] [CrossRef]
- Garfin, G.; Scott, C.; Wilder, M.; Varady, R.; Merideth, R. Metrics for assessing adaptive capacity and water security: Common challenges, diverging contexts, emerging consensus. Curr. Opin. Environ. Sustain. 2016, 21, 86–89. [Google Scholar] [CrossRef] [Green Version]
- Koop, S.H.A.; van Leeuwen, C.J. Application of the Improved City Blueprint Framework in 45 Municipalities and Regions. Water Resour. Manag. 2015, 29, 4629–4647. [Google Scholar] [CrossRef] [Green Version]
- Van Leeuwen, C.J. City Blueprints: Baseline Assessments of Sustainable Water Management in 11 Cities of the Future. Water Resour. Manag. 2013, 27, 5191–5206. [Google Scholar] [CrossRef] [Green Version]
- Bolognesi, T.; Kluser, S. Water Security as a Normative Goal or as a Structural Principle for Water Governance. In A Critical Approach to International Water Management Trends: Policy and Practice; Bréthaut, C., Schweizer, R., Eds.; Palgrave Macmillan: Basingstoke, Hampshire, UK, 2017; pp. 201–231. ISBN 978-1-137-60085-1. [Google Scholar]
- Van den Brandeler, F.; Gupta, J.; Hordijk, M. Megacities and rivers: Scalar mismatches between urban water management and river basin management. J. Hydrol. 2019, 573, 1067–1074. [Google Scholar] [CrossRef]
- Bakker, K. Water management. Water security: Research challenges and opportunities. Science 2012, 337, 914–915. [Google Scholar] [CrossRef] [PubMed]
- Garrick, D.; Hall, J.W. Water Security and Society: Risks, Metrics, and Pathways. Annu. Rev. Environ. Resour. 2014, 39, 611–639. [Google Scholar] [CrossRef] [Green Version]
- Damania, R. The economics of water scarcity and variability. Oxf. Rev. Econ. Policy 2020, 36, 24–44. [Google Scholar] [CrossRef]
- Zeitoun, M.; Lankford, B.; Krueger, T.; Forsyth, T.; Carter, R.; Hoekstra, A.Y.; Taylor, R.; Varis, O.; Cleaver, F.; Boelens, R.; et al. Reductionist and integrative research approaches to complex water security policy challenges. Glob. Environ. Chang. 2016, 39, 143–154. [Google Scholar] [CrossRef] [Green Version]
- Norman, E.S.; Dunn, G.; Bakker, K.; Allen, D.M.; Cavalcanti de Albuquerque, R. Water Security Assessment: Integrating Governance and Freshwater Indicators. Water Resour. Manag. 2013, 27, 535–551. [Google Scholar] [CrossRef]
- Gain, A.K.; Giupponi, C.; Wada, Y. Measuring global water security towards sustainable development goals. Environ. Res. Lett. 2016, 11, 124015. [Google Scholar] [CrossRef]
- Vörösmarty, C.J.; McIntyre, P.B.; Gessner, M.O.; Dudgeon, D.; Prusevich, A.; Green, P.; Glidden, S.; Bunn, S.E.; Sullivan, C.A.; Liermann, C.R.; et al. Global threats to human water security and river biodiversity. Nature 2010, 467, 555–561. [Google Scholar] [CrossRef]
- United Nations Human Rights Council (UNHRC). Resolution 15/9. Human Rights and Access to Safe Drinking Water and Sanitation. Available online: https://ap.ohchr.org/documents/alldocs.aspx?doc_id=17740 (accessed on 7 January 2020).
- Hall, R.P.; van Koppen, B.; van Houweling, E. The human right to water: The importance of domestic and productive water rights. Sci. Eng. Ethics 2014, 20, 849–868. [Google Scholar] [CrossRef] [Green Version]
- Schyns, J.; Hamaideh, A.; Hoekstra, A.; Mekonnen, M.; Schyns, M. Mitigating the Risk of Extreme Water Scarcity and Dependency: The Case of Jordan. Water 2015, 7, 5705–5730. [Google Scholar] [CrossRef] [Green Version]
- Hadadin, N.; Qaqish, M.; Akawwi, E.; Bdour, A. Water shortage in Jordan—Sustainable solutions. Desalination 2010, 250, 197–202. [Google Scholar] [CrossRef]
- Ministry of Water and Irrigation (MWI). The Amended Guideline of the Water Resources Protection for the Year of 2019. Available online: http://www.mwi.gov.jo/sites/en-us/Documents/The%20Amended%20Guideline%20of%20the%20Water%20Resources%20Protection%20for%20the%20Year%20of%202019.pdfhttp://www.mwi.gov.jo/sites/en-us/Documents/The%20Amended%20Guideline%20of%20the%20Water%20Resources%20Protection%20for%20the%20Year%20of%202019.pdf (accessed on 7 January 2020).
- Yorke, V. Jordan’s Shadow State and Water Management: Prospects for Water Security Will Depend on Politics and Regional Cooperation. In Society-Water-Technology; Hüttl, R.F., Bens, O., Bismuth, C., Hoechstetter, S., Eds.; Springer International Publishing: Cham, Switzerland, 2016; pp. 227–251. ISBN 978-3-319-18970-3. [Google Scholar]
- Scott, C.A.; El-Naser, H.; Hagan, R.E.; Hijazi, A. Facing Water Scarcity in Jordan. Water Int. 2003, 28, 209–216. [Google Scholar] [CrossRef]
- Törnros, T.; Menzel, L. Addressing drought conditions under current and future climates in the Jordan River region. Hydrol. Earth Syst. Sci. 2014, 18, 305–318. [Google Scholar] [CrossRef] [Green Version]
- Ministry of Water and Irrigation (MWI). Jordan Water Sector Facts and Figures 2017. Available online: http://www.mwi.gov.jo/sites/en-us/Hot%20Issues/Jordan%20Water%20Sector%20Facts%20and%20Figures%202017.PDF (accessed on 16 December 2019).
- Ministry of Water and Irrigation (MWI). National Water Strategy 2016–2025. Available online: http://www.mwi.gov.jo/sites/en-us/Hot%20Issues/Strategic%20Documents%20of%20%20The%20Water%20Sector/National%20Water%20Strategy%28%202016-2025%29-25.2.2016.pdf (accessed on 7 January 2020).
- Aboelnga, H.; Saidan, M.; Al-Weshah, R.; Sturm, M.; Ribbe, L.; Frechen, F.-B. Component analysis for optimal leakage management in Madaba, Jordan. J. Water Supply Res. Technol. Aqua 2018, 67, 384–396. [Google Scholar] [CrossRef] [Green Version]
- Miyahuna. Miyahuna Annual Report 2018. 2018. Available online: https://miyahuna.com.jo/uploads/pdf_files/annual_reports/en.pdf_2018.pdf (accessed on 22 December 2019).
- Charalambous, B.; Liemberger, R. Understanding water losses in the context of IWS. In Dealing with the Complex Interrelation of Intermittent Supply and Water Losses; Charalambous, B., Laspidou, C., Eds.; IWA Publishing: London, UK, 2017; pp. 35–39. ISBN 9781780407074. [Google Scholar]
- Coelho, S.T.; James, S.; Sunna, N.; Abu Jaish, A.; Chatila, J. Controlling water quality in intermittent supply systems. Water Sci. Technol. Water Supply 2003, 3, 119–125. [Google Scholar] [CrossRef]
- Ilaya-Ayza, A.; Campbell, E.; Pérez-García, R.; Izquierdo, J. Network Capacity Assessment and Increase in Systems with Intermittent Water Supply. Water 2016, 8, 126. [Google Scholar] [CrossRef] [Green Version]
- Al-Kharabsheh, A.; Ta’any, R. Challenges of Water Demand Management in Jordan. Water Int. 2005, 30, 210–219. [Google Scholar] [CrossRef]
- El-Naser, H. Management of Scarce Water Resources. In A Middle Eastern Experience; WIT Press: Ashurst, UK, 2009; ISBN 9781845644147. [Google Scholar]
- Department of Statistics (DOS). General Population and Housing Census of Jordan. Available online: http://jorinfo.dos.gov.jo/PXWeb2014R2/Selection.aspx?px_tableid=Table%204.px&px_path=Population%20and%20Housing__Demographic%20Statistics&px_language=en&px_db=Population%20and%20Housing&rxid=d8467649-5faf-4b4c-8c29-f629d95a188e (accessed on 16 December 2019).
- Saidan, M.; Khasawneh, H.J.; Aboelnga, H.; Meric, S.; Kalavrouziotis, I.; Jasem, A.s.H.; Hayek, B.O.; Al-Momany, S.; Al Malla, M.; Porro, J.C. Baseline carbon emission assessment in water utilities in Jordan using ECAM tool. J. Water Supply Res. Technol. Aqua 2019, 68, 460–473. [Google Scholar] [CrossRef]
- Miyahuna Madaba. Annual Report 2016. Available online: www.miyahuna.com.jo/Madaba.aspx (accessed on 22 December 2019).
- Ministry of Water and Irrigation (MWI). Jordan’s Water Strategy 2016–2025; MWI: Amman, Jordan, 2016; pp. 13–19.
- Ministry of Water and Irrigation (MWI). Climate Change Policy for a Resilient Water Sector; MWI: Amman, Jordan, 2016; pp. 2–14.
- Ministry of Health. Statistical Yearbook 2016. Available online: https://moh.gov.jo/Echobusv3.0/SystemAssets/3088f91a-96cc-49e2-82c5-86951ace3ebd.pdf (accessed on 22 December 2019).
- Salomon, V.; Tramarico, C.; Marins, F. Analytic Hierarchy Process Applied to Supply Chain Management; InTech Open: London, UK. [CrossRef] [Green Version]
- Stypka, T.; Flaga-Maryanczyk, A.; Schnotale, J. Application of the AHP Method in Environmental Engineering: Three Case Studies. In Applications and Theory of Analytic Hierarchy Process—Decision Making for Strategic Decisions; De Felice, F., Saaty, T.L., Petrillo, A., Eds.; InTech: Rijeka, Croatia, 2016; ISBN 978-953-51-2560-0. [Google Scholar]
- Saaty, R.W. The analytic hierarchy process—What it is and how it is used. Math. Model. 1987, 9, 161–176. [Google Scholar] [CrossRef] [Green Version]
- Ramanathan, R. A note on the use of the analytic hierarchy process for environmental impact assessment. J. Environ. Manag. 2001, 63, 27–35. [Google Scholar] [CrossRef] [Green Version]
- Sólnes, J. Environmental quality indexing of large industrial development alternatives using AHP. Environ. Impact Assess. Rev. 2003, 23, 283–303. [Google Scholar] [CrossRef]
- Anh, N.K.; Phonekeo, V.; My, V.C.; Duong, N.D.; Dat, P.T. Environmental hazard mapping using GIS and AHP—A case study of Dong Trieu District in Quang Ninh Province, Vietnam. IOP Conf. Ser. Earth Environ. Sci. 2014, 18, 12045. [Google Scholar] [CrossRef] [Green Version]
- Banerjee, P.; Ghose, M.K.; Pradhan, R. AHP-based Spatial Air Quality Impact Assessment Model of vehicular traffic change due to highway broadening in Sikkim Himalaya. Ann. GIS 2018, 24, 287–302. [Google Scholar] [CrossRef] [Green Version]
- Sahoo, S.; Dhar, A.; Kar, A. Environmental vulnerability assessment using Grey Analytic Hierarchy Process based model. Environ. Impact Assess. Rev. 2016, 56, 145–154. [Google Scholar] [CrossRef]
- Goepel, K.D. Implementing the Analytic Hierarchy Process as a Standard Method for Multi-Criteria Decision Making in Corporate Enterprises—A New AHP Excel Template with Multiple Inputs. In Proceedings of the International Symposium on the Analytic Hierarchy Process, Kuala Lumpur, Malaysia, 23–26 June 2013; RSW publications: Pittsburgh, PA, USA, 2013. [Google Scholar] [CrossRef] [Green Version]
- Goepel, K.D. Implementation of an Online Software Tool for the Analytic Hierarchy Process (AHP-OS). Int. J. Anal. Hierarchy Process 2018, 10. [Google Scholar] [CrossRef] [Green Version]
- Leal, J.E. AHP-express: A simplified version of the analytical hierarchy process method. MethodsX 2020, 7, 100748. [Google Scholar] [CrossRef]
- Saaty, T.L. Fundamentals of Decision Making and Priority Theory with the Analytic Hierarchy Process; RWS Publications: Pittsburgh, PA, USA, 2000; ISBN 0962031763. [Google Scholar]
- Saaty, T.L. Creative Thinking, Problem Solving and Decision Making; RWS Publications: Pittsburgh, PA, USA, 2001; ISBN 1888603038. [Google Scholar]
Figure 1.
The elevation and water system of Madaba, Jordan.

Figure 2.
Matrix of drinking water and human well-being, = 11.288, CR = 9.6%.

Figure 3.
Matrix of ecosystem, = 6.479, CR = 9%.

Figure 4.
Matrix of climate change and water related hazards, λ = 6.446, CR = 7.1%.

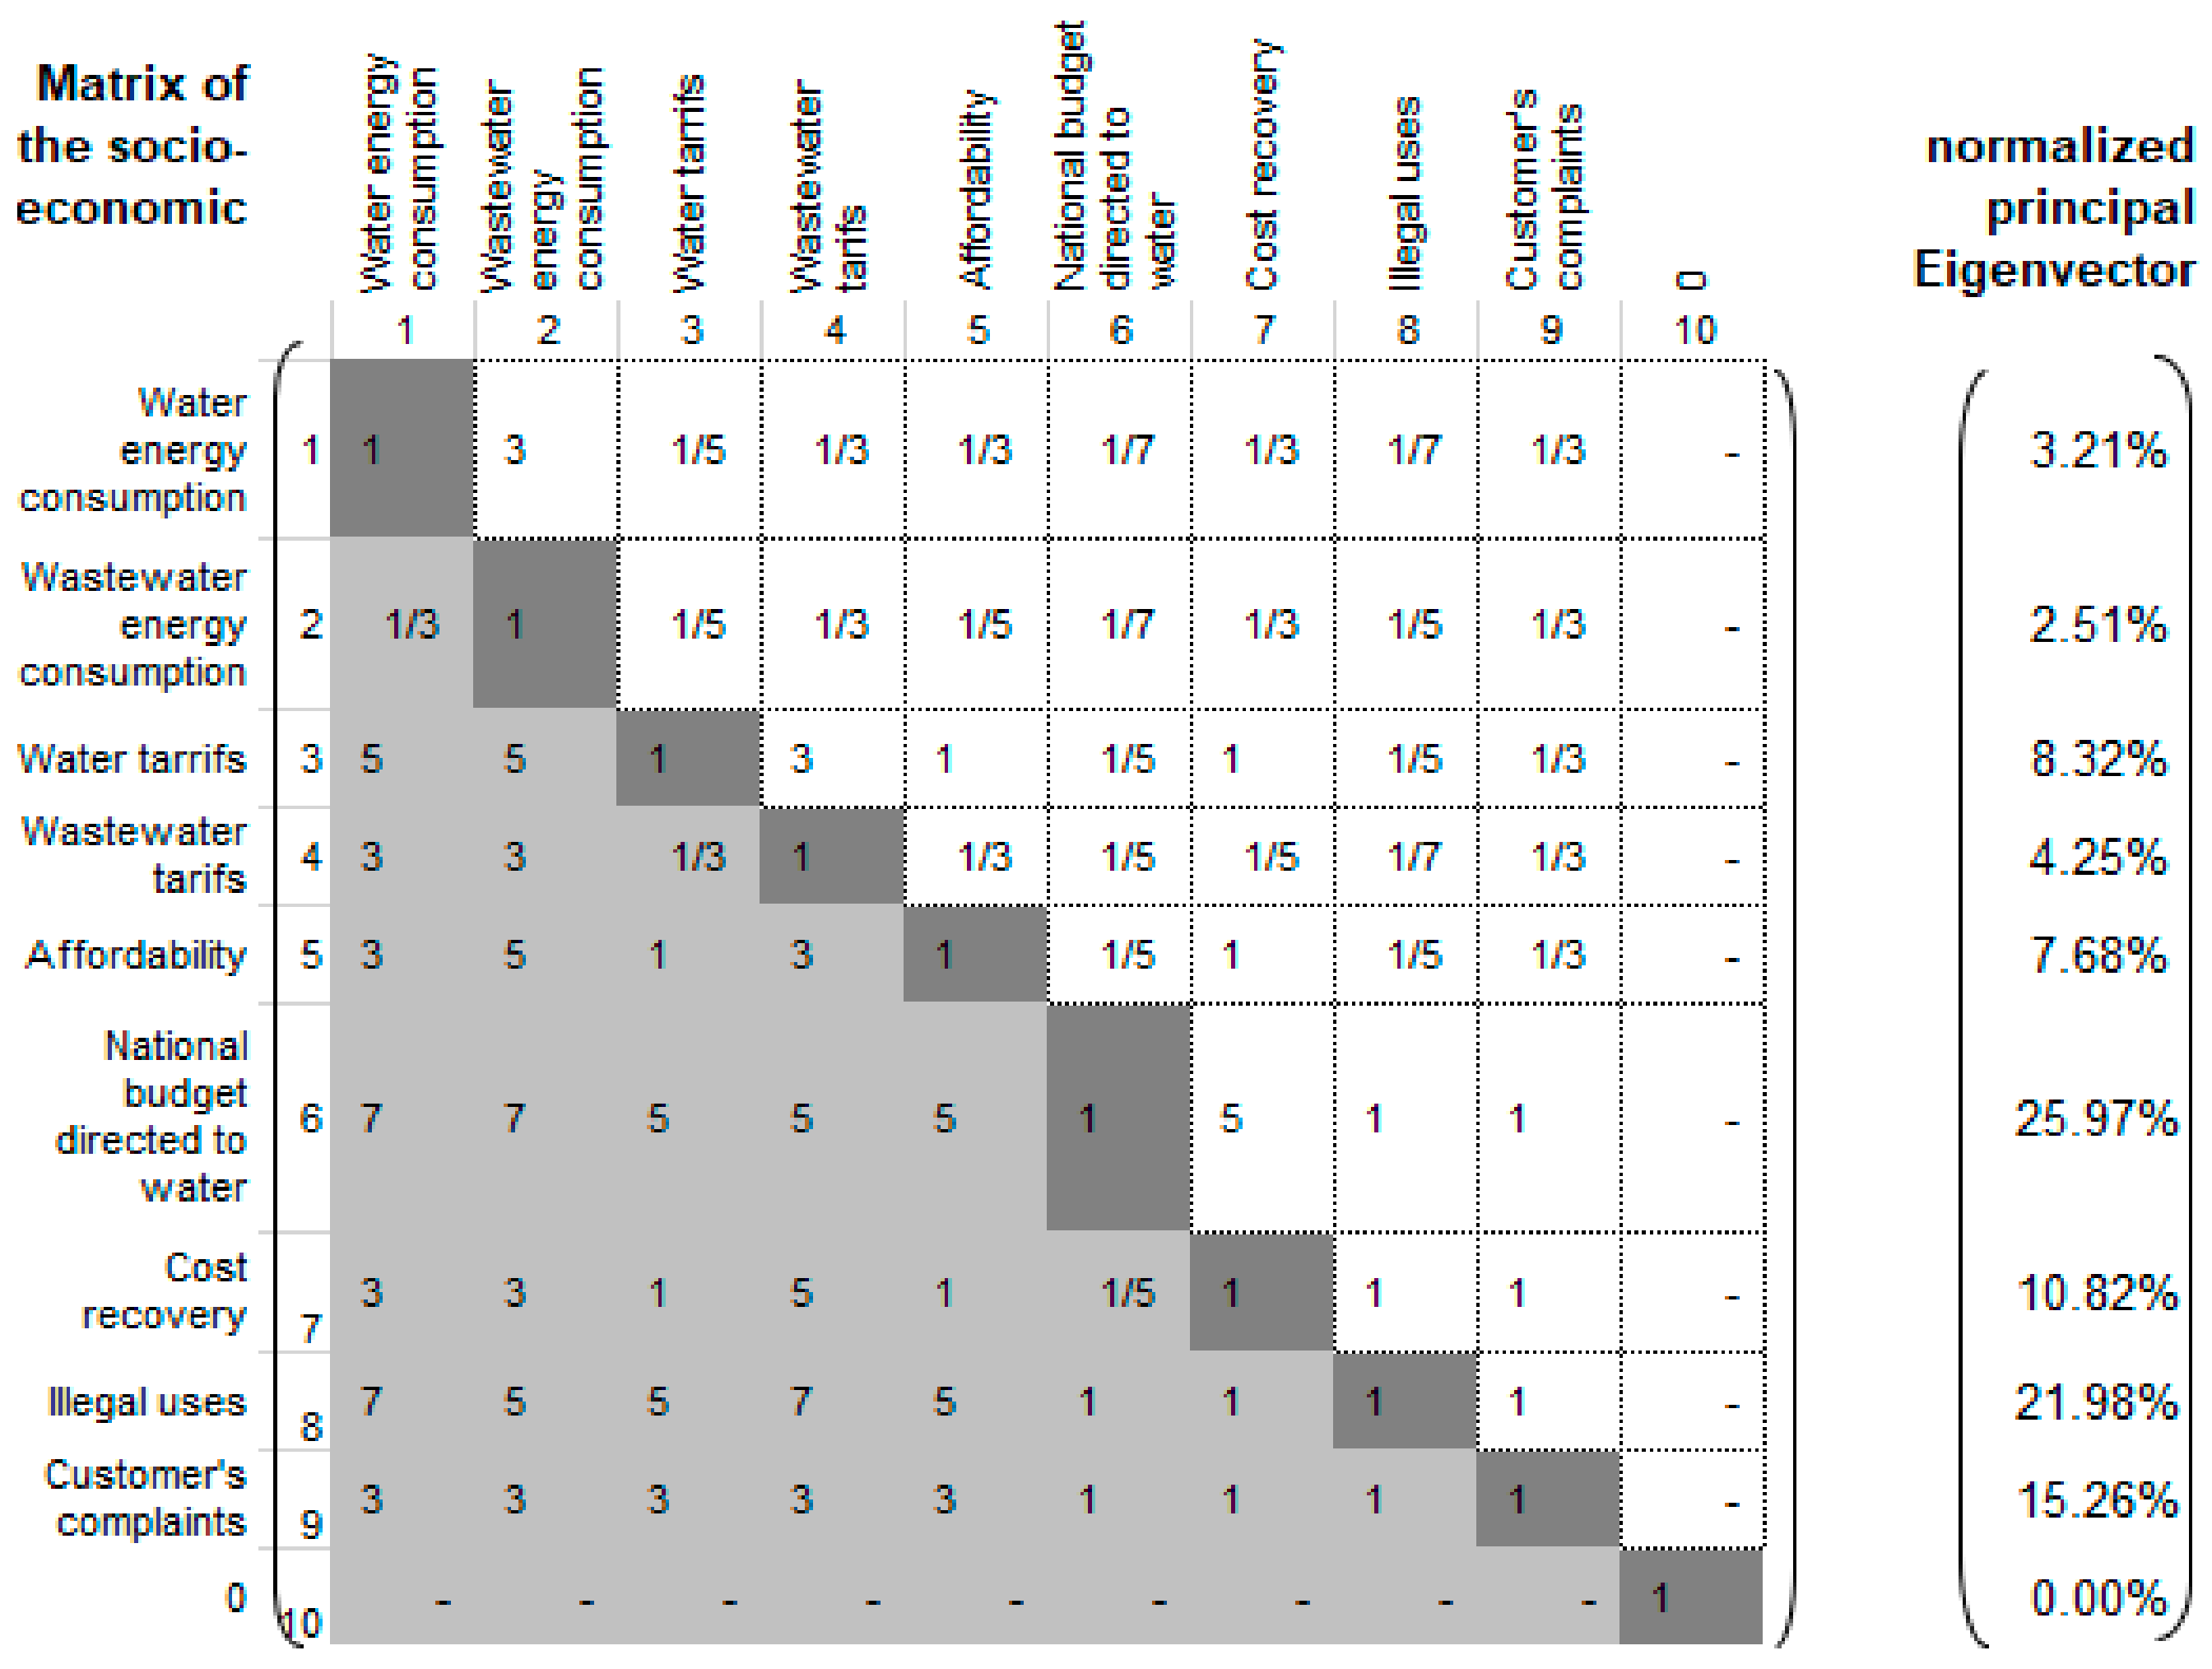
Figure 5.
Matrix of socio-economic aspects, λ = 9.955, CR = 8.2%.

Figure 6.
Matrix of urban water security, λ = 4.248, CR = 5%.

Figure 7.
The integrated urban water security index (score value: solid red circles) and the relative importance (percentage values) of each indicator in Madaba, Jordan. The colour (hue and tint) ramp denotes the relative weight for each indicator. The water security scale begins at 0 and increases, moving toward the outside edge of 5, which represents the high level of water security.


Table 1.
Indicators, variables, and representation of the variables’ scores in relation to the 1–5 scale of drinking water and human well-being [31].
Table 1.
Indicators, variables, and representation of the variables’ scores in relation to the 1–5 scale of drinking water and human well-being [31].
| Indicators | Variables | Units | 1 | 2 | 3 | 4 | 5 |
|---|---|---|---|---|---|---|---|
| Water availability | Fresh water per capita | m3/capita/year | <500 | 500–800 | 800–1000 | 1000–1700 | >1700 |
| Diversity of water and energy sources | Reused wastewater/production of wastewater | % | <10 | 10–30 | 30–50 | 50–70 | >70 |
| Contribution of alternative water sources, % | % | <5 | 5–15 | 15–30 | 30–60 | >60 | |
| Contribution of alternative energy sources, % | % | <5 | 5–15 | 15–30 | 30–60 | >60 | |
| Consumption | Billed authorized consumption per person per day | L/capita/day | ≤20 | 21–50 | 51–90 | 91–100 | ≥101 |
| Reliability | Nonrevenue water | % | ≥25 | 25–20 | 20–15 | 15–10 | 10–0 |
| Infrastructure leakage index | ≥3 | 3–2.5 | 2.5–2.0 | 2.0–1.5 | ≤1.5 | ||
| Metered water (percentage of households whose water consumption is metered) | % | 0–60 | 61–70 | 71–80 | 81–90 | 91–100 | |
| Energy efficiency in the network | % | <40 | 40–50 | 50–60 | 60–80 | >80 | |
| Commercial losses from non-revenue water | % | ≥25 | 25–20 | 20–15 | 15–10 | 10–0 | |
| Water quality | Proportion of drinking water samples meeting WHO and local standards | % | 0–60 | 61–70 | 71–80 | 81–90 | 91–100 |
| Proportion of samples of wastewater treatment plant meeting the world health organisation WHO and locally applicable quality standards | % | 0–60 | 61–70 | 71–80 | 81–90 | 91–100 | |
| Accessibility | Proportion of population using safely managed drinking water services | % | 0–60 | 61–70 | 71–80 | 81–90 | 91–100 |
| Proportion of population using safely managed sanitation services | % | 0–60 | 61–70 | 71–80 | 81–90 | 91–100 | |
| Adequacy and Equity | Average supply time compliance with minimum service standard | hr./day | <8 | 8–16 | 17–20 | 21–23 | 24 |
| Water bodies’ Dependency Ratio | Percentage of imported water from transboundary/system input volume | % | >60 | 60–40 | 40–20 | 20–10 | <10 |
Table 2.
Indicators, variables, and representation of the variables’ scores in relation to the 1–5 scale of ecosystems [31].
Table 2.
Indicators, variables, and representation of the variables’ scores in relation to the 1–5 scale of ecosystems [31].
| Indicators | Variables | Units | 1 | 2 | 3 | 4 | 5 |
|---|---|---|---|---|---|---|---|
| State of pollution | Percentage of safely treated wastewater flows (SDG6.3.1b) | % | 0–60 | 61–70 | 71–80 | 81–90 | 91–100 |
| Proportion of Bodies of Water with Good Ambient Water Quality (SDG6.3.2) | Proportion of samples of water sources (surface water or ground water) meeting WHO and locally applicable quality standards | % | 0–60 | 60–70 | 70–80 | 80–90 | 90–100 |
| Change in the Extent of Water-Related Ecosystems over Time (SDG 6.6.1) | Change in quantity of water contained within these ecosystems per year | (% change/year) | >60 | 60–40 | 40–20 | 20–10 | <10 |
| Green roofing | Surface area of green roofing in relation to total roof surface area | % | <5 | 5–15 | 15–30 | 30–60 | >60 |
| Green surfaces | Green surface area in relation to total surface area | % | <5 | 5–15 | 15–30 | 30–60 | >60 |
| Effectiveness of storm network and wastewater | Sewer system blockages (no. blockages/km/year) | No. blockages/km/year | >300 | 200–300 | 100–200 | 50–100 | <50 |
Table 3.
Indicators, variables, and representation of the variables’ scores in relation to the 1–5 scale of climate change and water-related hazards [31].
Table 3.
Indicators, variables, and representation of the variables’ scores in relation to the 1–5 scale of climate change and water-related hazards [31].
| Indicators | Variables | Units | 1 | 2 | 3 | 4 | 5 |
|---|---|---|---|---|---|---|---|
| GHG emissions | Greenhouse gas (GHG) emissions emitted from the system | kg CO2/m3 | >3.5 | 3.5–2.5 | 2.5–1.5 | 1.5–0.5 | <0.5 |
| Public health (water borne diseases) | Number of potable water contamination incidents (diarrhoea) | number/year per 100,000 people | ≥1000 | 800–500 | 500–100 | 100–30 | ≤30 |
| Frequency of floods | Number of deaths due to flood over three years | number/year per 100,000 people | ≥1000 | 800–500 | 500–100 | 100–30 | ≤30 |
| Frequency of droughts | No. of droughts | ||||||
| Flood-prone areas | Surface area of flood-prone area in relation to total surface area | % | >20 | 20–15 | 15–10 | 10–5 | <5 |
| Precipitation | Average annual precipitation | mm/year | <100 | 100–300 | 300–500 | 500–700 | >700 |
| Temperature | Average annual temperature | Celsius degree | >40 | 35–40 | 30–35 | 25–30 | <25 |
Table 4.
Indicators, variables, and representation of the variables’ scores in relation to the 1–5 scale of socioeconomic aspects [31].
Table 4.
Indicators, variables, and representation of the variables’ scores in relation to the 1–5 scale of socioeconomic aspects [31].
| Indicators | Variables | Units | 1 | 2 | 3 | 4 | 5 |
|---|---|---|---|---|---|---|---|
| Water energy consumption per authorized consumption | Per unit energy consumption for urban water supply | kWh/m3 | >4.5 | 4.5–3.5 | 3.5–2.5 | 2.5–1.5 | 1.5 |
| Wastewater energy consumption | Average energy consumption in cubic meter wastewater treatment | kWh/m3 | >1 | 1–0.75 | 0.75–0.5 | 0.5–25 | <0.25 |
| Water tariffs | Water tariff per 15 m3 | $/m3 | <0.5 | 0.5–0.75 | 0.75–1 | 1–1.5 | >1.5 |
| Sanitation tariffs | Wastewater tariff per 15 m3 | $/m3 | <0.5 | 0.5–0.75 | 0.75–1 | 1–1.5 | >1.5 |
| Affordability | Total annual operating revenue per population served/gross national income (GNI) per capita; expressed as a percentage | % | >1 | 0.8–1.0 | 0.8–0.6 | 0.6-0.4 | <0.4 |
| National budget directed to water | Percentage of national budget directed to water and sanitation services | % | <1 | 1–5 | 5–10 | 10–20 | >20 |
| Cost recovery | Operation and maintenance cost recovery | % | 0–60 | 60–70 | 70–80 | 80–90 | 90–100 |
| Illegal uses | No. of illegal uses | number/year/10,000 subscribers | >300 | 200–300 | 100–200 | 50–100 | <50 |
| Complaints | No. of total complaints (leakage, no water, blockage) | number/year/10,000 subscribers | >300 | 200–300 | 100–200 | 50–100 | <50 |
| Scale of Importance | Evaluation Meaning | Explanation |
|---|---|---|
| 1 | Equal importance | Two indicators share equal importance to the objective |
| 3 | Moderate importance | Experience and judgment slightly prefer one indicator over another |
| 5 | Strong importance | Experience and judgment strongly prefer one indicator over another |
| 7 | Very strong or demonstrated importance | An indicator is preferred very strongly over another; its dominance is demonstrated in practice |
| 9 | Extreme importance | The evidence preferring one indicator over another is of the highest possible order of importance |
| 2,4,6,8 | Intermediate values |
Table 6.
Interpretation of the integrated urban water security index scores [44].
Table 6.
Interpretation of the integrated urban water security index scores [44].
| Grading Urban Water Security | Level of Security | Explanation |
|---|---|---|
| <1.5 | Poor | Urban water security is poor at meeting the basic needs of the people. Lack of water governance and management is a major concern in all dimensions. |
| 1.5–2.5 | Fair | Policies and measures are not enough to achieve urban water security, with major concerns in almost all dimensions. |
| 2.5–3.5 | Reasonable | Urban water security is satisfactory to meet the basic needs, with gaps in some dimensions that affect the resilience and sustainability of the system. |
| 3.5–4.5 | Good | Sound policies and management exist for achieving urban water security for most of the dimensions, but some improvements are still needed. |
| >4.5 | Excellent | A well-managed and water-secure city that is capable of meeting demands and resilient to future shocks and risks. The index shows a high level of security for all dimensions. |
Table 7.
Values, scores, and relative weights of the drinking of water and human well-being indicators.
Table 7.
Values, scores, and relative weights of the drinking of water and human well-being indicators.
| Variable | Unit | Value in 2016 | Score | Weight (%) | |
|---|---|---|---|---|---|
| Water availability | Fresh water per capita | m3/capita/year | 135 | 1 | 23.4 |
| Diversity of water and energy sources | Reused wastewater/production of wastewater | % | 30 | 1 | 9.2 |
| Contribution of alternative water sources % | % | 6.06 | 2 | ||
| Contribution of alternative energy sources % | % | 0 | 1 | ||
| Consumption | Billed authorized consumption per person per day | L/capita/day | 78.89 | 3 | 2.8 |
| Reliability | Nonrevenue water | % | 40.7 | 1 | 6.9 |
| Infrastructure Leakage Index = CARL/UARL | % | 3.12 | 2 | ||
| Metered water (percentage of households whose water consumption is metered) | % | 91.02 | 5 | ||
| Energy efficiency in the network | % | 72.24 | 4 | ||
| Commercial losses from nonrevenue water | % | 40% | 1 | ||
| Water quality standards | Proportion of drinking water samples meeting WHO and local standards | % | 80 | 3 | 30.9 |
| Proportion of samples of wastewater treatment plant meeting WHO and locally applicable quality standard | % | 80 | 3 | ||
| Accessibility | Proportion of Population using safely managed drinking water services | % | 98 | 5 | 4.5 |
| Proportion of population using safely managed sanitation services (SDG 6.2.1 a) | % | 65 | 2 | 4.7 | |
| Adequacy and equity | Average number of supply h/day | h/day | 7 | 2 | 3 |
| Water dependency ratio | The percentage of annual volumes imported water to total annual available water resources | % | 6.06 | 5 | 12.6 |
Table 8.
Values, scores, and relative weights of the ecosystem indicators.
| Indicator | Variable | Unit | Value in 2016 | Score | Weight (%) |
|---|---|---|---|---|---|
| State of pollution | Percentage of safely treated wastewater flows SDG6.3.1 b | % | 67.37 | 2 | 32 |
| Bodies of water with good ambient water quality | Proportion of samples of water sources (surface water or groundwater) meeting WHO and locally applicable quality standards | % | 90 | 4 | 27.7 |
| Change in the extent of water-related ecosystems over time (SDG6.6.1) | (%change/year) | 5 | 5 | 9.2 | |
| Green areas | Green surface area in relation to total surface area | % | 0.001 | 1 | 5.6 |
| Green roofing | Surface area of green roofing in relation to total roof surface area | % | 3 | 1 | 2.8 |
| Effectiveness of storm network and wastewater network | Sewer system blockages (No. blockages/km/year) | No. blockages/km/year | 3529 | 1 | 22.9 |
Table 9.
Values, scores, and relative weights of the climate change and water-related hazards indicators.
Table 9.
Values, scores, and relative weights of the climate change and water-related hazards indicators.
| Indicator | Variable | Unit | Value | Score | Weight (%) |
|---|---|---|---|---|---|
| Greenhous Gas (GHG) | GHG emissions from urban water supply and wastewater | kg CO2/m3 | 6.07 | 1 | 3.6 |
| Public health (water-borne diseases) | Number of potable water contamination incidents (diarrhoea) | Number/year per 100,000 people | 1728 | 1 | 56.2 |
| No. of floods | Number of deaths due to floods over three years | Number/three years per 190,000 people | 13 | 3 | 12.7 |
| No. of droughts | Drought index | No records | |||
| Flood-prone areas | Surface area of the flood-prone area versus total surface area | % | 0.29 | 1 | 8 |
| Precipitation | Average annual precipitation | mm/year | 245 | 2 | 11.6 |
| Temperature | Average annual temperature | degrees Celsius | 28 | 4 | 7.8 |
Table 10.
Values, scores, and relative weights of the socioeconomic indicators.
| Indicator | Variable | Unit | Value | Score | Weight |
|---|---|---|---|---|---|
| Water energy consumption | Per unit energy consumption for urban water supply | kWh/m3 | 4.98 | 1 | 3.2 |
| Wastewater energy consumption | Average energy consumption in cubic meter wastewater treatment | kWh/m3 | 1.31 | 1 | 2.5 |
| Water tariff | Water tariff per 15 m3 | $/m3 | 0.78 | 3 | 8.3 |
| Wastewater tariff | wastewater tariff per 15 m3 | $/m3 | 0.15 | 1 | 4.3 |
| Affordability | Total annual operating revenues per population served/national GNI per capita; expressed in percentage. | % | 0.58 | 3 | 7.7 |
| Budget directed to water and wastewater services (WWS) | Percentage of national budget directed to WWS | % | 1.05 | 2 | 26 |
| Operation and maintenance cost recovery | Operating expenditure/operating revenue | % | 78 | 3 | 10.8 |
| Illegal uses | No. of illegal uses | Number/year/10,000 subscribers | 116 | 3 | 22 |
| Customer’s complaints | No. of total complaints (leakage, no water, blockage) | Number/year/10,000 subscribers | 1961 | 1 | 15.3 |
© 2020 by the authors. Licensee MDPI, Basel, Switzerland. This article is an open access article distributed under the terms and conditions of the Creative Commons Attribution (CC BY) license (http://creativecommons.org/licenses/by/4.0/).
Share and Cite
MDPI and ACS Style
Aboelnga, H.T.; El-Naser, H.; Ribbe, L.; Frechen, F.-B. Assessing Water Security in Water-Scarce Cities: Applying the Integrated Urban Water Security Index (IUWSI) in Madaba, Jordan. Water 2020, 12, 1299. https://doi.org/10.3390/w12051299
AMA Style
Aboelnga HT, El-Naser H, Ribbe L, Frechen F-B. Assessing Water Security in Water-Scarce Cities: Applying the Integrated Urban Water Security Index (IUWSI) in Madaba, Jordan. Water. 2020; 12(5):1299. https://doi.org/10.3390/w12051299
Chicago/Turabian StyleAboelnga, Hassan Tolba, Hazim El-Naser, Lars Ribbe, and Franz-Bernd Frechen. 2020. "Assessing Water Security in Water-Scarce Cities: Applying the Integrated Urban Water Security Index (IUWSI) in Madaba, Jordan" Water 12, no. 5: 1299. https://doi.org/10.3390/w12051299
Note that from the first issue of 2016, this journal uses article numbers instead of page numbers. See further details here.