Dynamic Changes of Soil Erosion in the Taohe River Basin Using the RUSLE Model and Google Earth Engine

1
College of Resource Environment and Tourism, Hubei University of Arts and Science, Xiangyang 441053, China
2
High Resolution Earth Observation System Data and Application Center of Xiangyang, Xiangyang 441053, China
*
Author to whom correspondence should be addressed.
Water 2020, 12(5), 1293; https://doi.org/10.3390/w12051293
Submission received: 3 March 2020
/
Revised: 29 April 2020
/
Accepted: 30 April 2020
/
Published: 2 May 2020
(This article belongs to the Section Water Quality and Contamination)
Abstract
:The Taohe River Basin is the largest tributary and an important water conservation area in the upper reaches of the Yellow River. In order to investigate the status of soil erosion in this region, we conducted a research of soil erosion. In our study, several parameters of the revised universal soil loss equation (RUSLE) model are extracted by using Google Earth Engine. The soil erosion modulus of the Taohe River Basin was calculated based on multi-source data, and the spatio-temporal variation characteristics of the soil erosion intensity were analyzed. The results showed the following: (1) the average soil erosion modulus of the Taohe River Basin in 2000, 2005, 2010, 2015 and 2018 were 1424, 1195, 1129, 1099 and 1124 t·ha−1·year−1, respectively, and the overall downward trend was obvious. (2) The ranges of soil erosion in the Taohe River Basin in 2000, 2005, 2010, 2015 and 2018 are basically the same—mainly with slight erosion—and the soil erosion in the middle and lower reaches was more serious. (3) When dealing with the vegetation cover factor and conservation practice factor in the RUSLE model, Google Earth Engine provided a new approach for soil erosion investigation and monitoring over a large area.
1. Introduction
Soil erosion can lead to riverbed siltation, trigger mountain torrents, destroy surface soil structure and reduce soil productivity, which has become the focus of environmental science, agriculture, soil and water conservation and other disciplines [1]. Serious soil erosion threatens the production and the life of human beings, which has become an environmental problem faced by human beings all over the world [2]. The problem of soil erosion in China is extremely serious. According to relevant data, the total area of soil erosion in China reached 2.73 × 10⁶ km2 in 2018, accounting for 28.80% of the total area [3]. The amount of soil erosion is much greater than the amount of soil loss tolerance [4]. Therefore, it is important to clarify the dynamic changes of soil erosion for the comprehensive management of soil and water conservation, the related construction of water conservancy projects and ecological civilization construction.
The soil erosion model is a common method for the quantitative estimation of soil erosion [5]. In 1986, the United States established the revised universal soil loss equation (RUSLE) based on the universal soil loss equation (USLE) model [6,7]. Compared with other soil erosion models, the RUSLE model has the advantages of having a simple formula, few parameter requirements and high estimation accuracy, and has become a widely used quantitative estimation model of soil erosion globally [8,9]. The extraction of the RUSLE model parameters relies heavily on image processing software such as the Environment for Visualizing Images (ENVI). In 2010, Google, Carnegie Mellon University and the United States Geological Survey jointly developed and established a cloud platform for processing satellite images and Earth observation data (Google Earth Engine). Compared with traditional image processing tools, Google Earth Engine has the function of mass data storage, which can quickly invoke and batch process remote sensing data [10,11,12]. Currently, it has become the most advanced cloud geographic information processing platform in the world [13]. Users can access the database online through the application programming language interface (API) provided by Python and a JavaScript platform based on web interactive development environment (IDE). It can conduct cloud computing and the visualization of Earth data over a large range and a long timescale in a short time, which can provide strong technical support for remote sensing monitoring in a large area [10]. Relevant scholars have achieved good results in vegetation monitoring [14,15,16], land use [17,18], crop classification [19,20] and water quality inversion [21,22] using Google Earth Engine.
At present, there are few reports on the combination of soil erosion and Google Earth Engine. Therefore, this paper took the Taohe River Basin as the research area, tried to combine the RUSLE model with Google Earth Engine, extracted some parameters of the RUSLE model with Google Earth Engine, calculated the soil erosion modulus in 2000, 2005, 2010, 2015 and 2018 in the Taohe River Basin, and analyzed the spatial and temporal characteristics of soil erosion.
2. Study Area
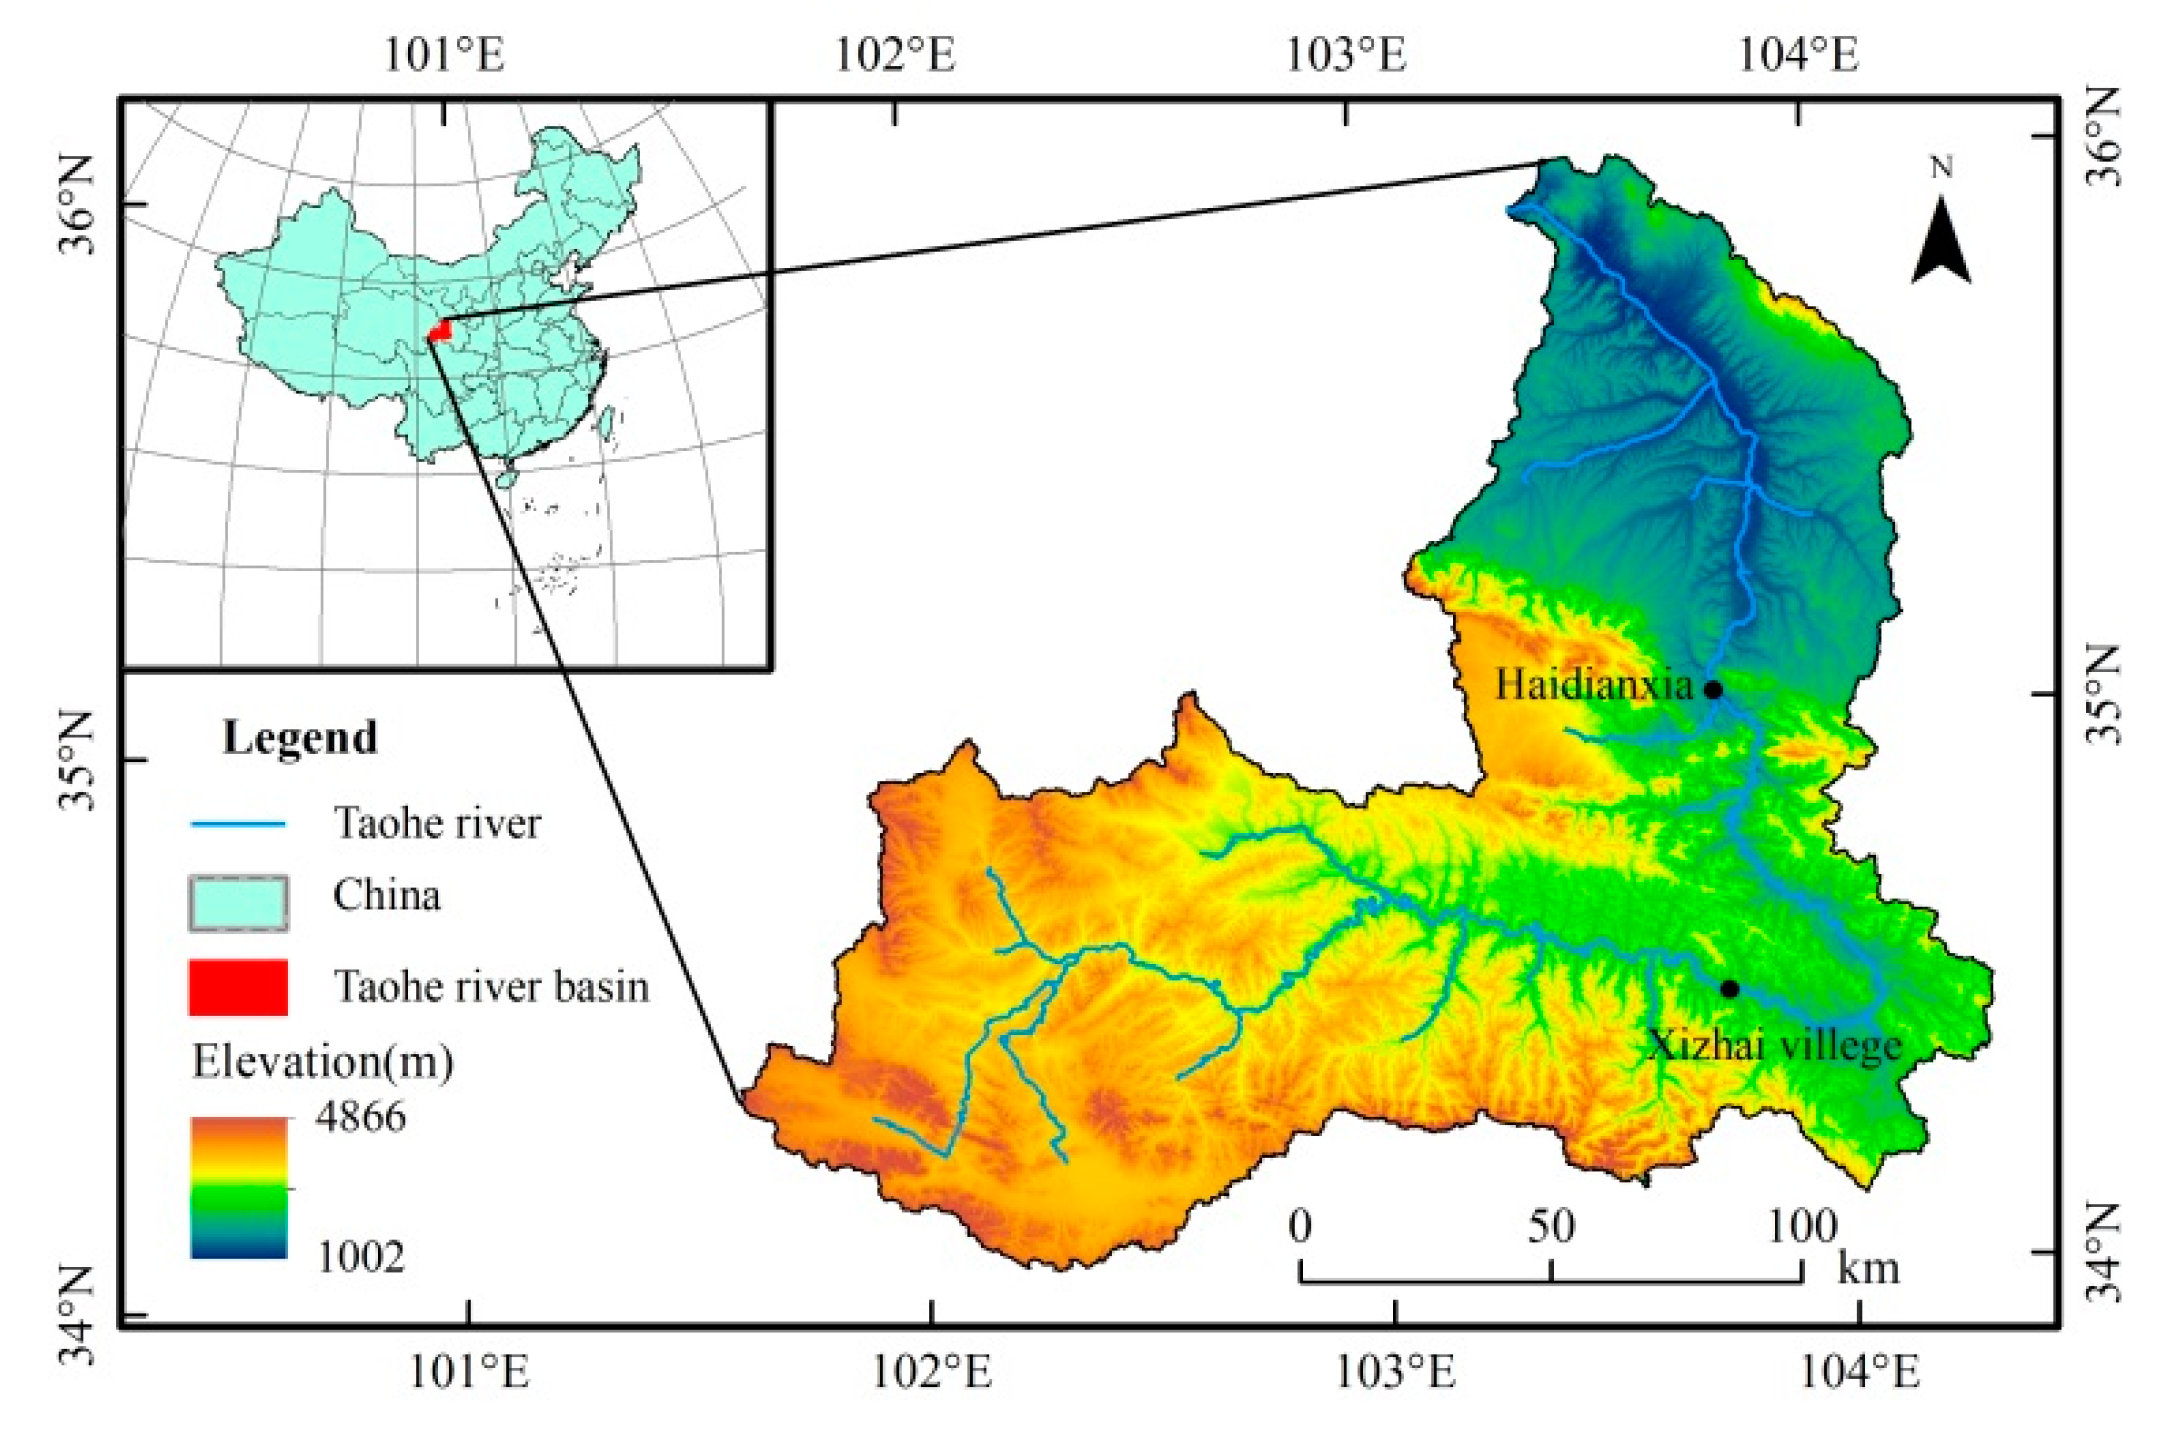
The Taohe River originates from the eastern part of Xiqing Mountain in Qinghai Province, China. Most of the area is located in the southwest of Gansu Province, with the range of 101.60°~104.33° E and 34.10°~36.02° N. The Taohe River is the second largest tributary of the Yellow River, with a total length of 673 km and a River Basin area of 2.55 × 10⁴ km2. Xizhai village and Haidianxia divide the Taohe River into upper, middle and lower reaches. The Taohe River Basin is divided into two geomorphic units: the Gannan plateau and the Longxi loess hill. The valley in the Gannan plateau area is narrow and the terrain on both sides is high and steep, while the loess hilly area is low and flat, and the elevation of the whole basin is between 1002–4866 m (Figure 1). The Taohe River Basin is located in the hinterland of the mainland. It has obvious plateau continental climate characteristics. The Gannan plateau is dominated by natural alpine grassland meadows and mountain forests. The loess hilly areas are dominated by semi-arid sparse woodland and shrub grassland. The soil types in the upper, middle and lower reaches of the river are respectively alpine meadow soil, mountain brown soil and loess [23].
3. Materials and Methods
3.1. Data Sources
The data used in this study include (1) soil texture at 1:100,000 in the Taohe River Basin, which was derived from the Resource and Environment Data Cloud Platform (http://www.resdc.cn/); (2) soil organic matter at 1:100,000 in the Taohe River Basin, which came from Soil Science Data Center (http://soil.geodata.cn/); (3) annual and monthly mean precipitation data of 14 meteorological stations in and around the Taohe River Basin in 2000, 2005, 2010, 2015 and 2018, obtained from the China Meteorological Information Center (https://data.cma.cn/); (4) the 250 m land use data of the Taohe River Basin in 2000, 2005, 2010, 2015 and 2018, which derived from the Resource and Environment Data Cloud Platform (http://www.resdc.cn/); (5) ASTER GDEMV2 30 m spatial resolution DEM data which came from the Geospatial Data Cloud (http://www.gscloud.cn/); (6) Landsat image data for 2000, 2005, 2010, 2015 and 2018 from Google Earth Engine (https://earthengine.google.cm/).
3.2. Research Methods
RUSLE Model
The RUSLE model was used to estimate soil erosion in the Taohe River Basin. The calculation is as follows [7]:
where A refers to the amount of soil loss in per unit time and per unit area (t·ha−1·year−1). R refers to the rainfall erosivity factor (MJ⋅mm⋅ha−1⋅h−1⋅year−1). K refers to the soil erodibility factor, which is the soil loss rate of specific soil rainfall erosivity per unit measured in a standard plot (t⋅ha⋅h⋅ ha−1 MJ−1⋅mm−1). L and S refer to the topographic factor (dimensionless). C refers to the vegetation cover factor (dimensionless). P refers to the conservation measure factor, which includes engineering and tillage measure factors (dimensionless) [24].
3.3. Determination of Various Factors in the RUSLE Model
3.3.1. Rainfall Erosivity Factor (R)
Precipitation is one of the important external forces that causes soil erosion, and it is also a dynamic index to objectively evaluate the separation and transportation of soil caused by rainfall. A method for estimating rainfall erosivity factor using annual and monthly rainfall proposed by Wischmeier is studied [6]. The calculation is as follows:
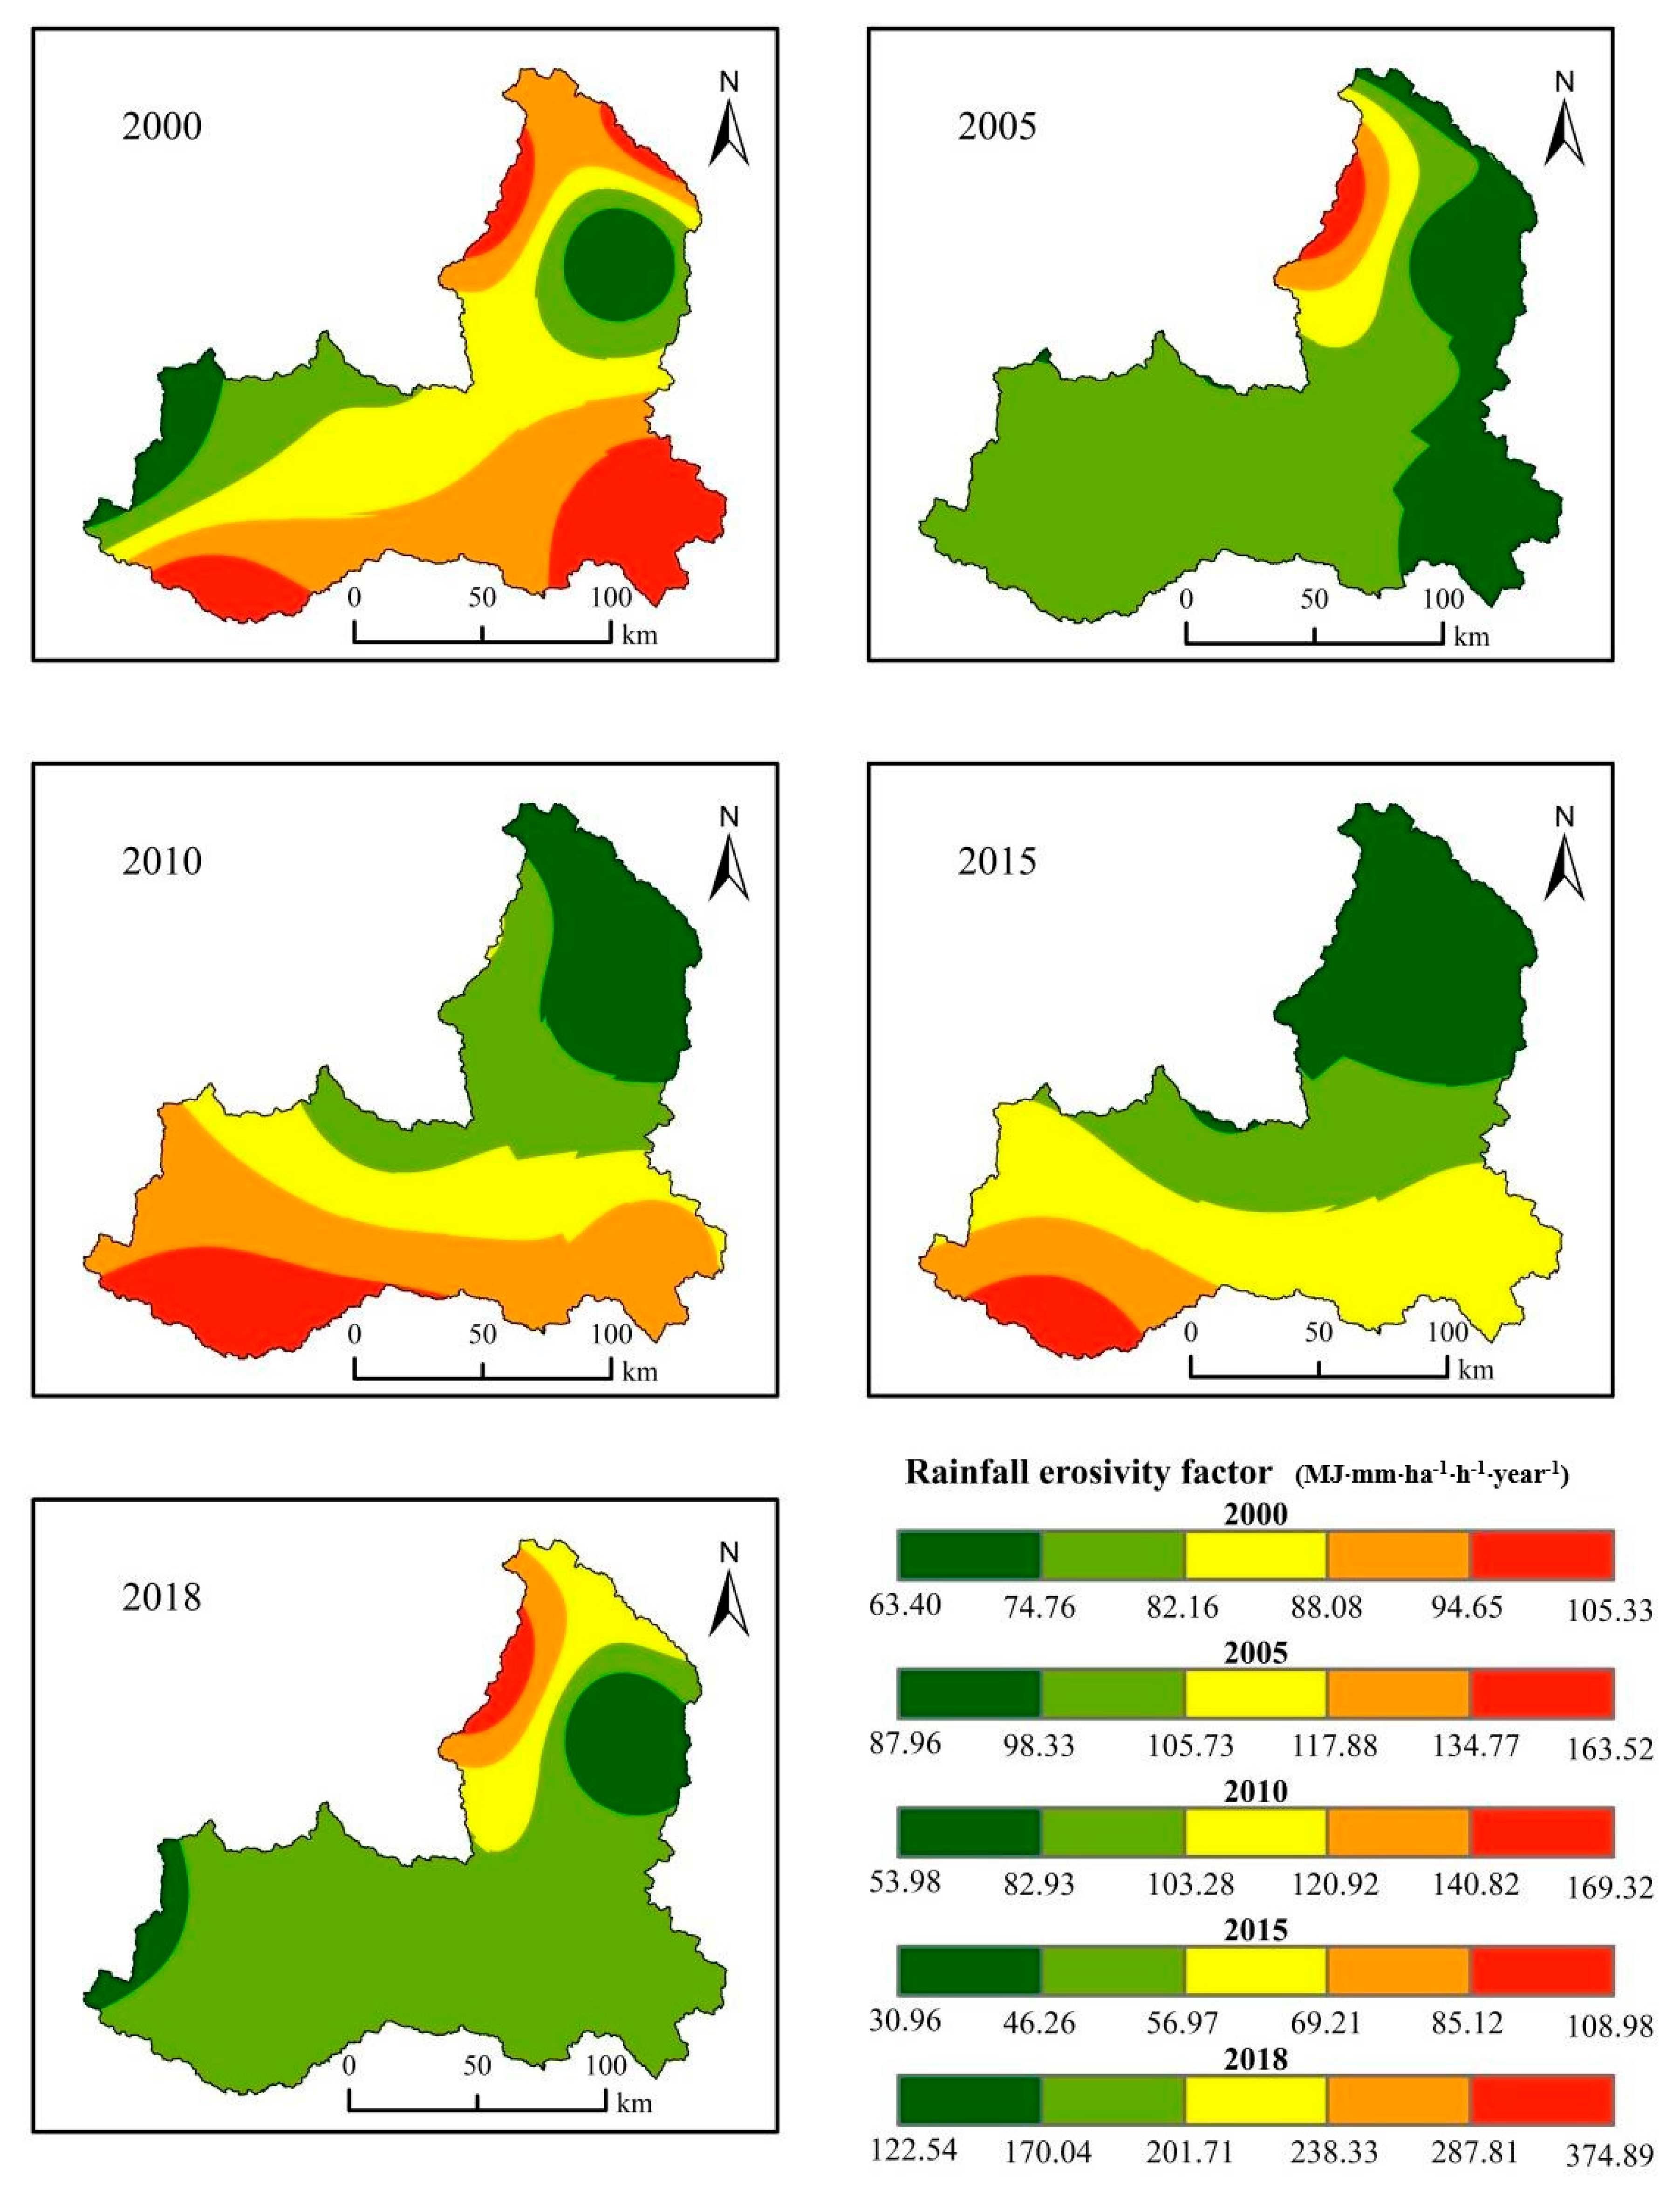
where Pi is monthly precipitation (mm) and P is annual precipitation (mm). According to the annual and monthly average precipitation data of 14 meteorological stations in and around the Taohe River Basin in 2000, 2005, 2010, 2015 and 2018, each station’s rainfall erosivity factor was calculated. Kriging interpolation was programmed in Google Earth Engine to obtain the spatial distribution of the rainfall erosivity factor at a 30 m spatial resolution in the Taohe River Basin (Figure 2).
3.3.2. Soil Erodibility Factor (K)
Soil erosion is affected by a combination of the physical and chemical properties of the soil. Soil erodibility is an important indicator of soil sensitivity to rainfall and runoff erosion. In this study, soil texture and soil organic carbon were used to estimate soil erodibility factors. The calculation is as follows [25]:
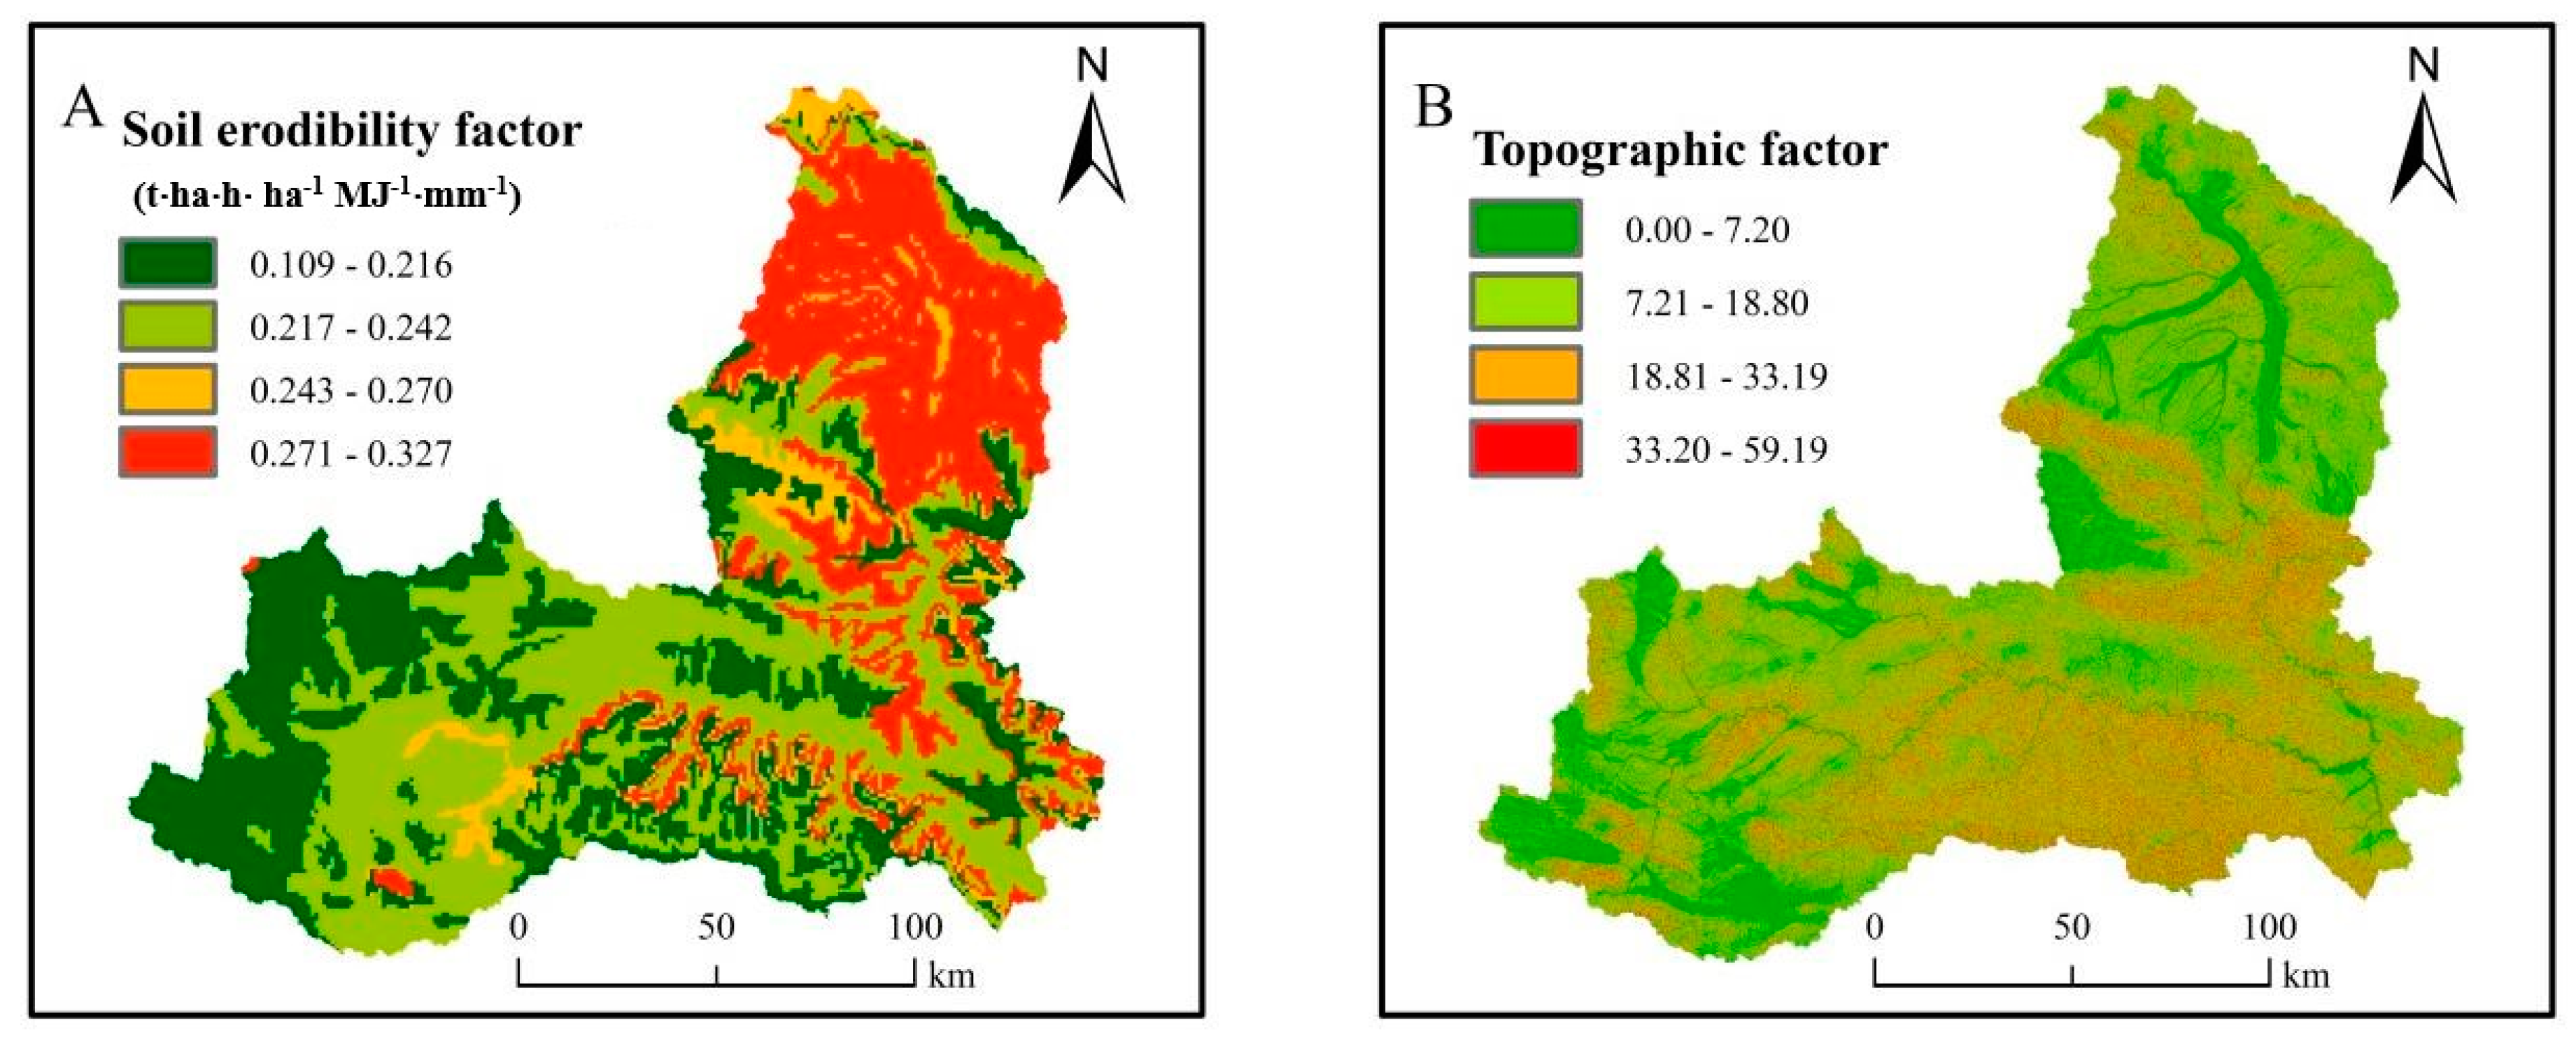
where Sand, Silt and Clay represent the sand, silt and clay content in the soil percentage (%), and C is the percentage of organic carbon content in soil (%); Sn1 = 1 − Sand/100. The greater the K value of the soil erodibility factor, the more susceptible the soil to erosion; conversely, the soil is less susceptible to erosion. According to the relationship between organic matter and organic carbon (soil organic carbon content = soil organic matter content × 0.58) [26], the spatial distribution data of 1:100,000 soil organic matter in the Taohe River Basin were transformed into 1:100,000 soil organic carbon spatial distribution data. According to Formula (3), the spatial distribution of the soil erodibility factor with 30 m spatial resolution in the Taohe River Basin was calculated by programming on Google Earth Engine (Figure 3A).
3.3.3. Topographic Factor (LS)
Topographic factors are called slope and slope length factors, which determine the movement state and direction of surface runoff. At a small scale, the slope length factor is generally measured by field data, but at a large scale, it is mainly obtained by DEM data.
The slope factor is calculated as follows [27,28]:
where S is the slope factor and θ is the value of the slope (°); the value of the slope can be extracted from DEM data.
The slope length factor of the Taohe River Basin was calculated by using overland flow according to Meth [29]. The calculation is as follows:
where L is the slope length factor, Aout is the cell exit confluence area (m2), Ain is the cell inlet confluence area (m2), x is the grid size (m), NCSL is the cell non-cumulative slope length (m), m is the slope length index, and the value of m is related to the slope. If the value of the slope is less than 0.5°, m is 0.2; if the value of the slope is greater than 0.5° and less than 1.5°, m is 0.3; if the value of slope is greater than 1.5° and less than 3°, m takes a value of 0.4; if the value of slope is greater than 3°, m takes a value of 0.5. In this study, with the aid of the topographic factor calculation tool, the LS value of the topographic factor with a 30 m spatial resolution in the Taohe River Basin was obtained (Figure 3B).
3.3.4. Vegetation Cover Factor (C)
Vegetation can protect the surface soil and slow down the rate of soil erosion. The normalized difference vegetation index (NDVI) is the most commonly used data source for calculating vegetation cover factors. The vegetation cover factor in the Taohe River Basin was calculated by NDVI data. The calculation is as follows [30]:
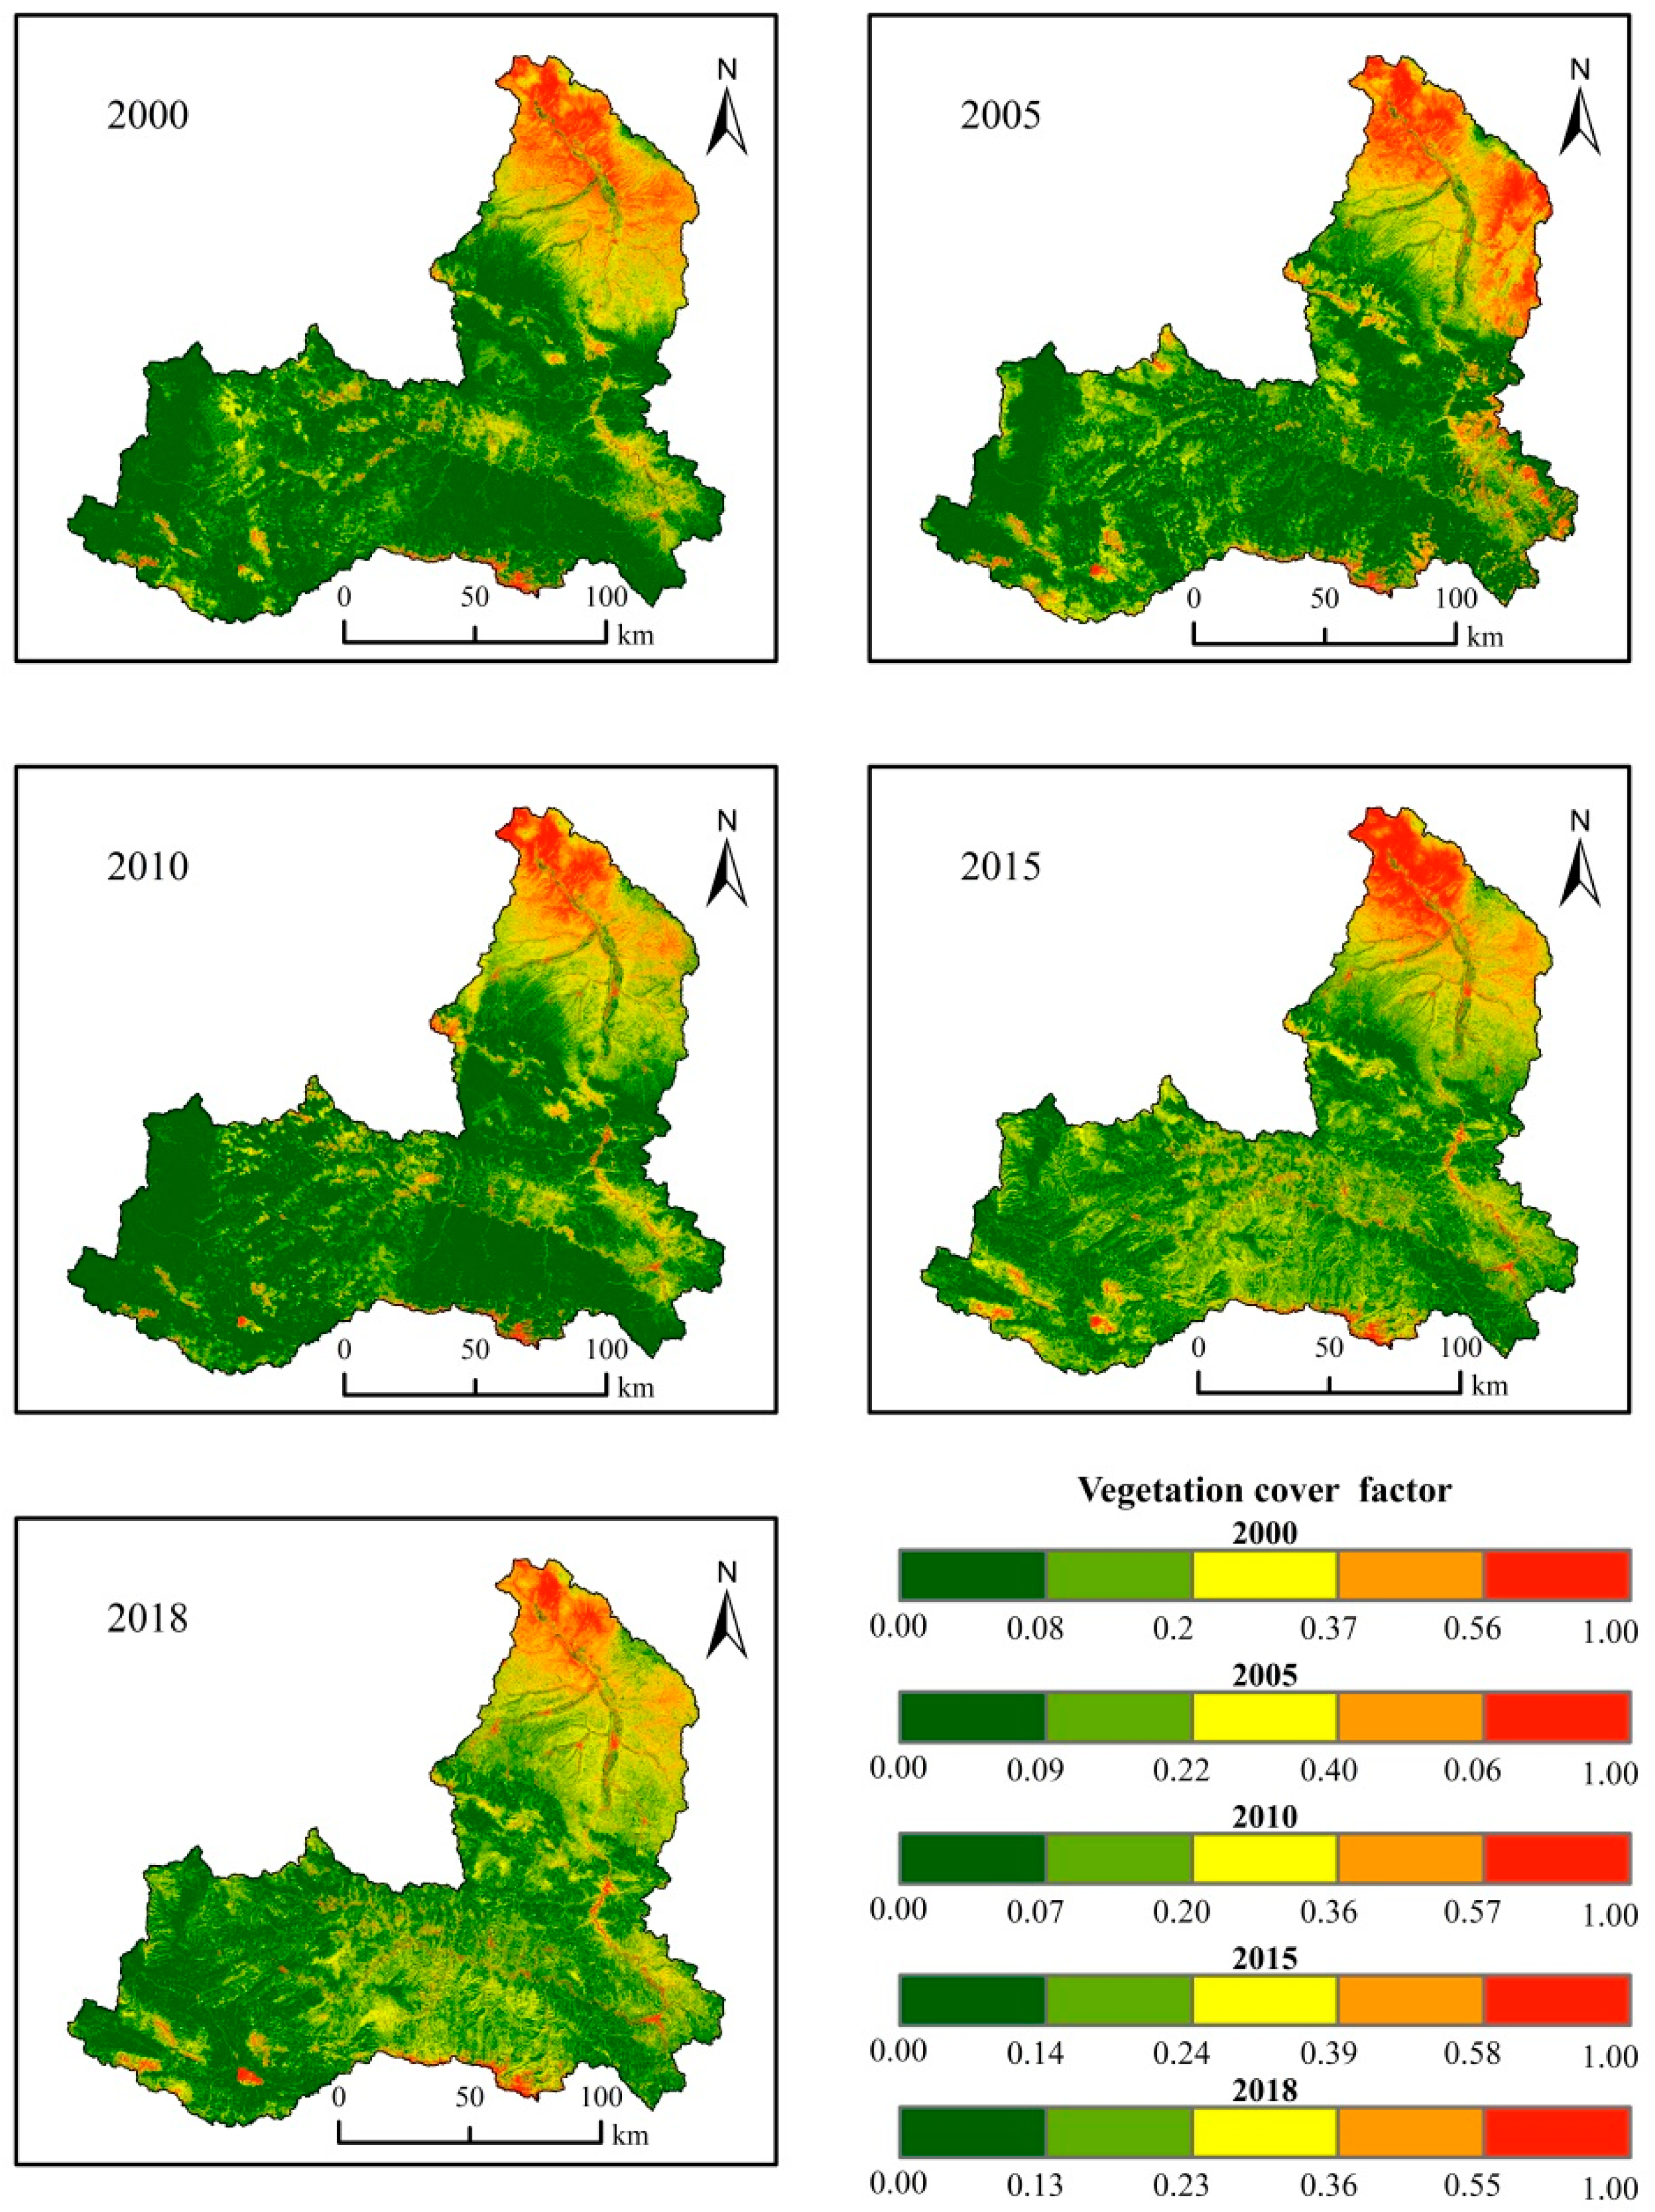
where a and b are the parameters that determine the NDVI-C relationship curve. The Van der Knijff’s experiment shows that when a = 2 and b = 1, the C value is the most appropriate value [30]. The higher the C factor, the worse the vegetation growth. In this study, the code was compiled in Google Earth Engine to realize the mosaic of the Landsat satellite images, NDVI calculation and annual maximum synthesis of NDVI in 2000, 2005, 2010, 2015 and 2018 at the Taohe River Basin (Figure 4).
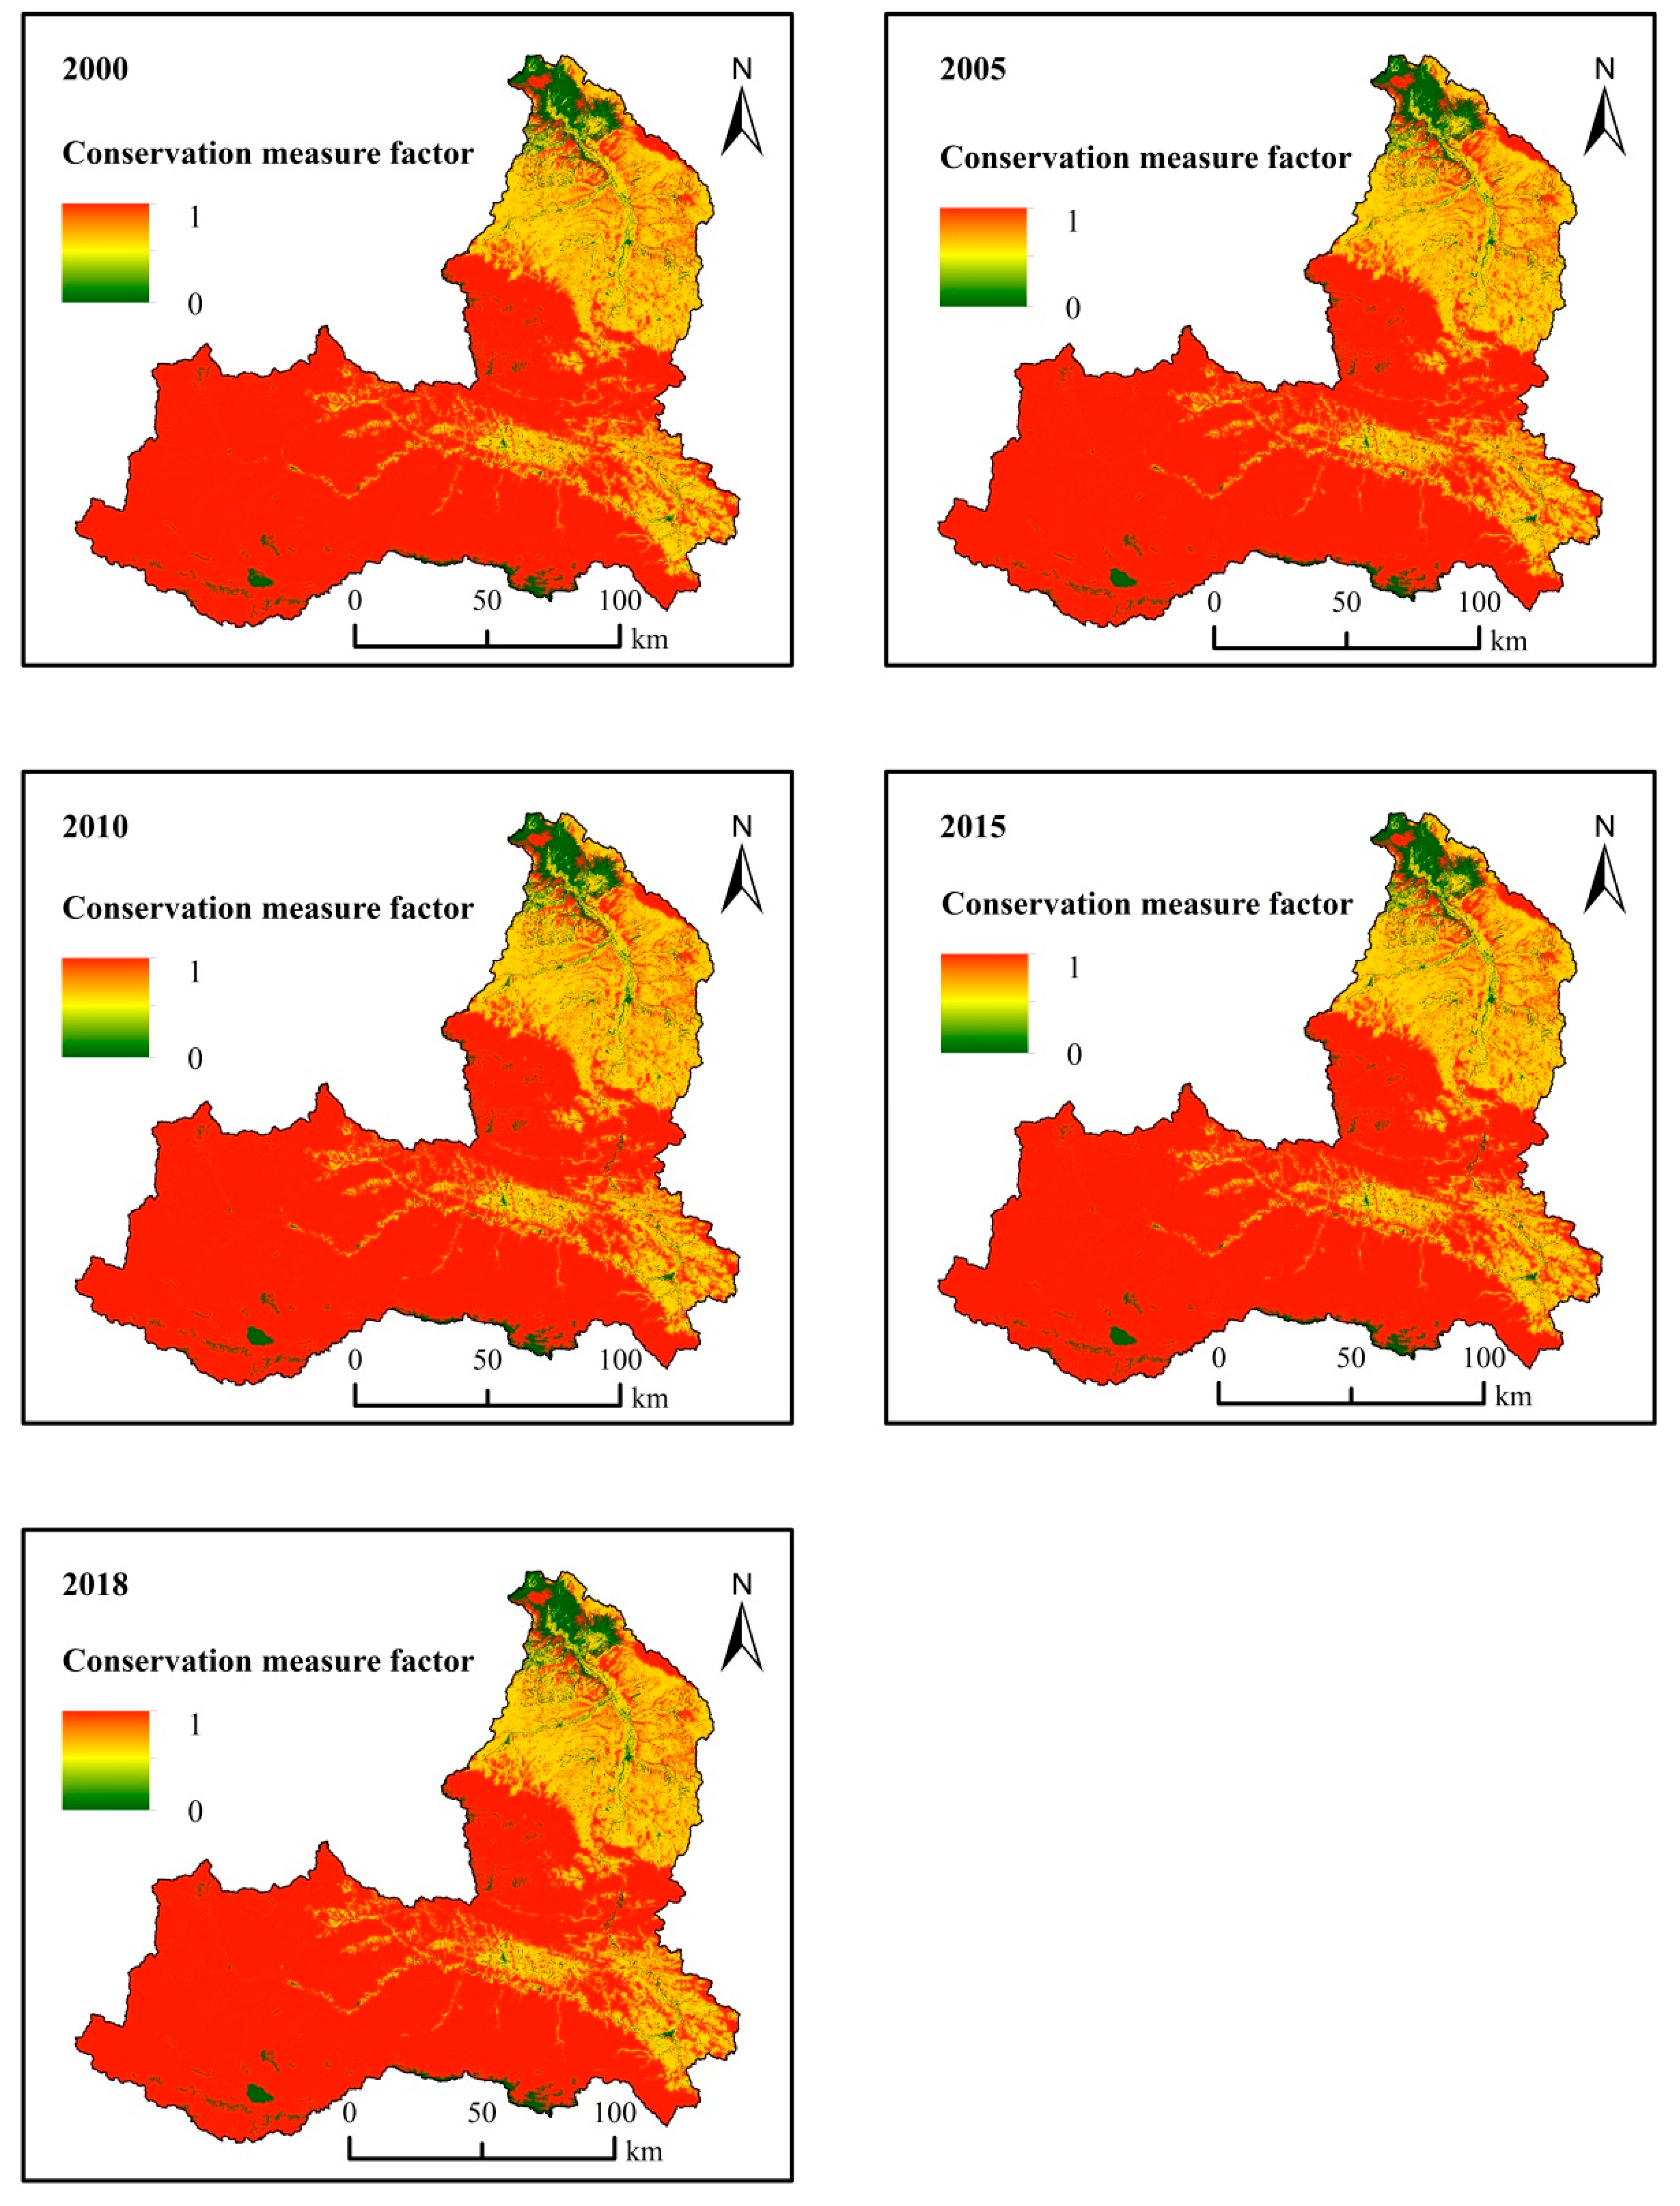
3.3.5. Conservation Measure Factor (P)
The conservation measure factor refers to the percentage of soil loss to planting down the slope after adopting soil and water conservation measures. The p value is between 0–1. If the value is 0, then the area is not affected by soil erosion; if the value is 1, the area has not been subjected to any soil or water conservation measures [24]. The field investigation of soil and water conservation measures is time-consuming and laborious. Therefore, the estimation of the p value in this study is realized by assigning values to land use types [31]. This study uses the LANDSAT/LT05/C01/T1_TOA and LANDSAT/LC08/C01/T1_RT datasets to screen out the Landsat images with the smallest cloud cover in the Taohe River Basin in 2000, 2005, 2010, 2015 and 2018, using Google Earth Engine programming. The 250 m land use data of the Taohe River Basin are training samples, and a random forest classifier is invoked. The classification system of cultivated land, forest land, grassland, wetland, artificial surface and six other types is obtained; the land use data of the Taohe River Basin are obtained in 2000, 2005, 2010, 2015 and 2018. According to Table 1 [24], the spatial distribution of the conservation measure factor at a 30 m spatial resolution of the Taohe River Basin is obtained (Figure 5).
4. Results
According to field data from the Soil and Water Conservation Bureau of the Gansu Provincial Department of Water Resources, the total amounts of soil erosion were 2.96 × 10⁸ t in the TaoheRiver Basin. This study concluded that the total amounts of soil erosion in the Taohe River Basin in 2000, 2005, 2010, 2015 and 2018 was 3.63 × 10⁸, 3.05 × 10⁸, 2.88 × 10⁸, 2.80 × 10⁸and 2.87 × 10⁸ t, with relative errors of 22.63%, 3.04%, 2.70%, 5.41% and 3.04%, respectively. On the whole, the results of this study are close to the measured results, which can be further analyzed.
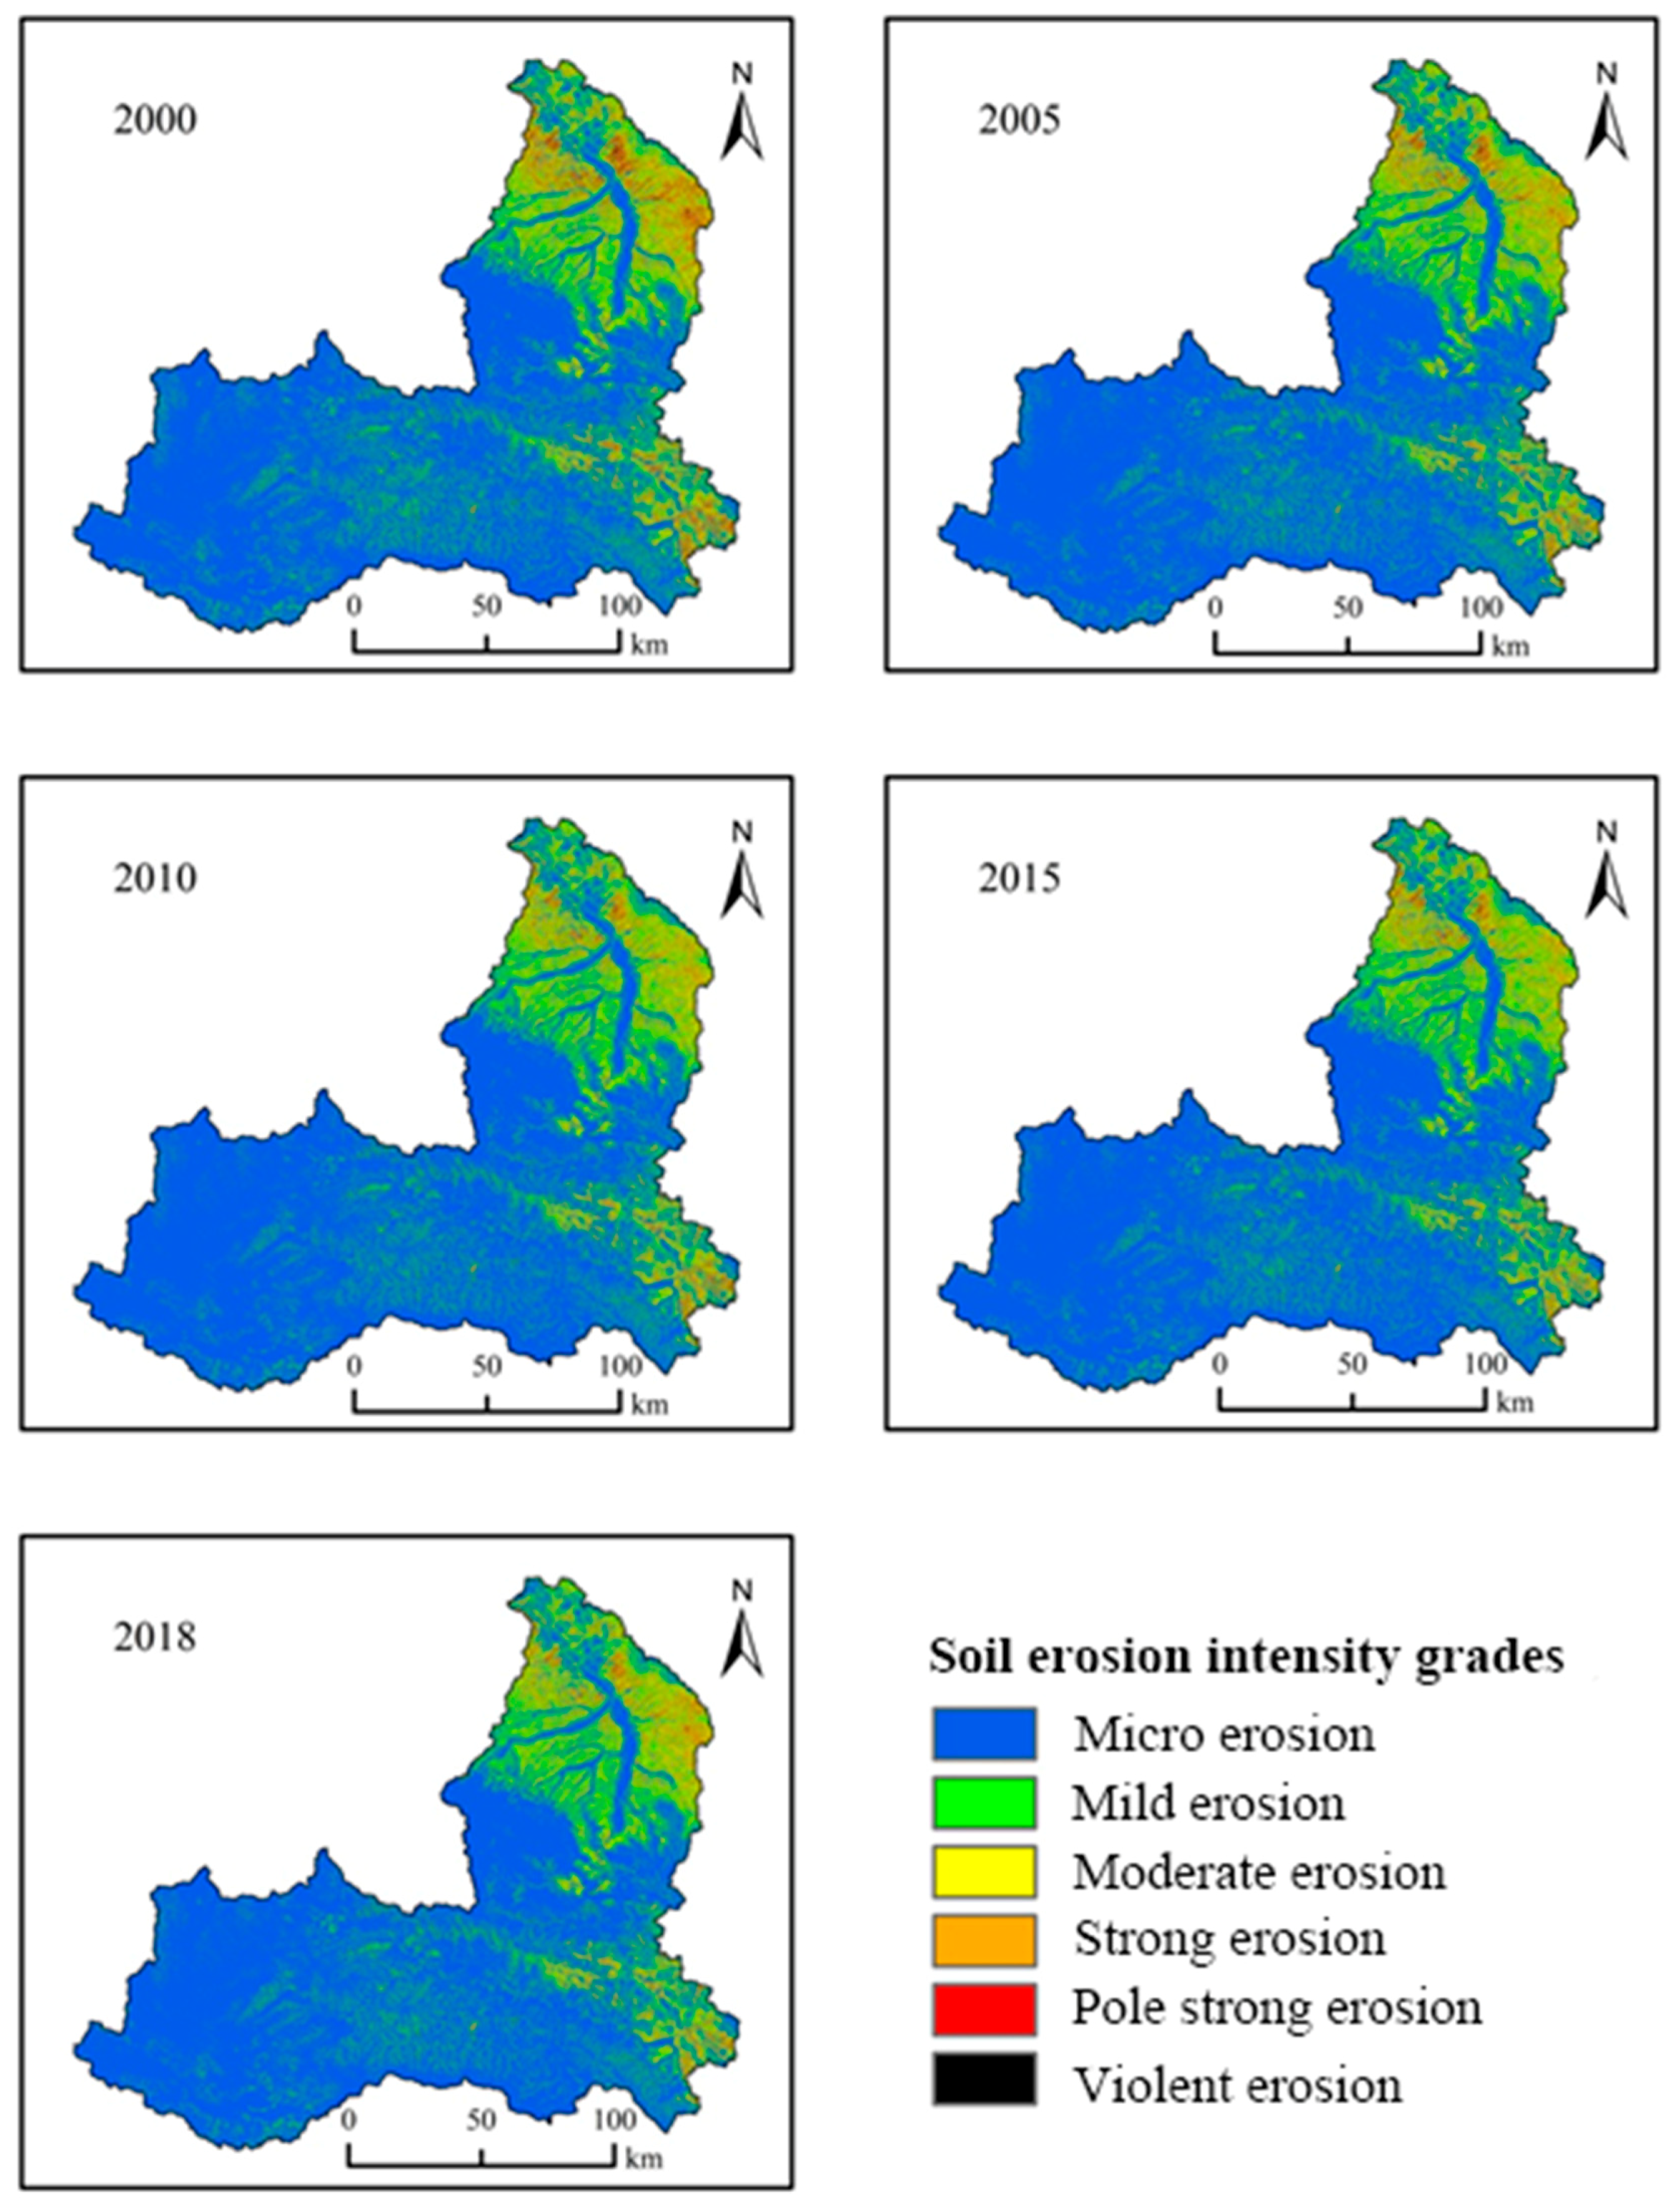
4.1. Spatial Variation of Soil Erosion Intensity
According to Formula (1), the spatial distribution of the soil erosion modulus of the Taohe River Basin in 2000, 2005, 2010, 2015 and 2018 was calculated based on the spatial distribution data of each factor in the RUSLE model. According to the “Classification standard of soil erosion intensity grades” issued by the Ministry of Water Resources of the People’s Republic of China [32], the soil erosion in the Taohe River Basin is divided into six erosion intensity grades (Table 2). The spatial distribution of soil erosion intensity levels in 2000, 2005, 2010, 2015 and 2018 was obtained (Figure 6), and the areas and percentage of each erosion intensity level over the whole study area was statistically calculated (Table 3; Table 4).
In 2000, 2005, 2010, 2015 and 2018, the range of soil erosion in the Taohe River Basin was basically the same, and most areas were dominated by micro erosion. The areas with severe erosion are mainly in the middle and lower reaches, distributed in the south and northeast of the basin (Figure 6). In 2000, 2005, 2010, 2015 and 2018, the areas of moderate erosion and below totaled 23,878.32, 24,213.90, 24,319.99, 24,374.41 and 24,335.56 km2, respectively, accounting for 93.59%, 94.91%, 95.32%, 95.54% and 95.38% of the total area. The areas of strong erosion and above were 1634.81, 1299.24, 1193.14, 1138.71 and 1177.56 km2, respectively, accounting for 6.41%, 5.09%, 4.68%, 4.46% and 4.62% of the total area (Table 3; Table 4).
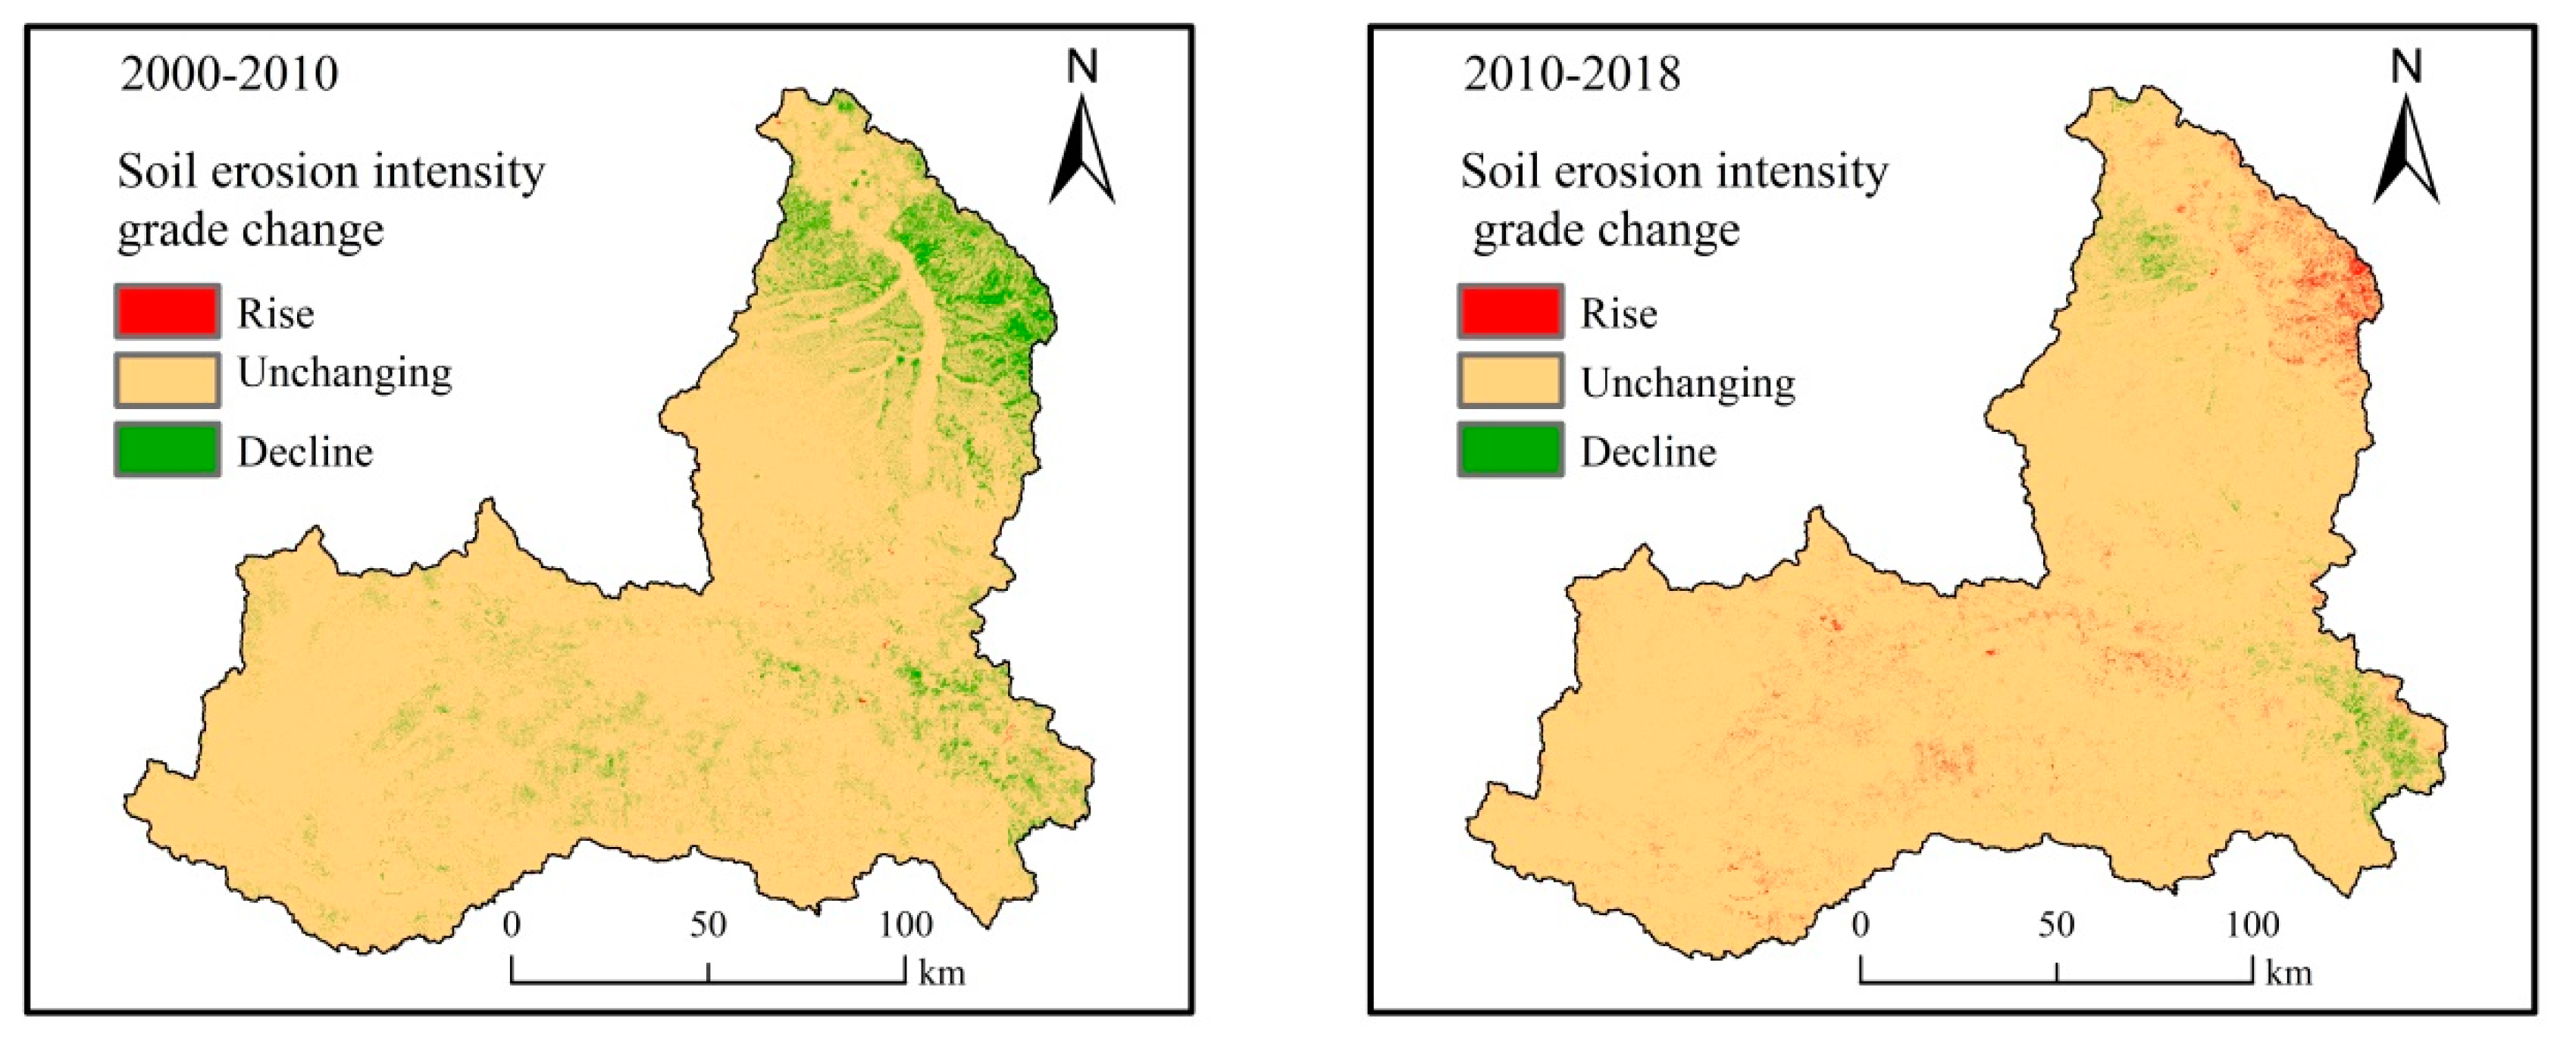
The spatial distributions of soil erosion intensity grades in 2000, 2010 and 2018 were analyzed to clarify the characteristics of soil erosion intensity transfer (Figure 7). From 2000 to 2010, the soil erosion intensity grade in the Taohe River Basin remained unchanged at 23,153.41 km2, accounting for 90.75% of the total area. The area with a rise in the soil erosion intensity grade was 36.99 km2, accounting for 0.14% of the total area. The area with a decline in the soil erosion intensity grade was 2322.73 km2, accounting for 9.10% of the total area, which is mainly distributed in the middle and downstream areas. From 2010 to 2018, the soil erosion intensity grade in the Taohe River Basin remained unchanged at 24,475.79 km2, accounting for 95.93% of the total area. The area with a rise in the soil erosion intensity grade was 509.43 km2, accounting for 2.00% of the total area. It is mainly distributed in the lower reaches (East bank of the lower reaches of the Taohe River), but also sporadically distributed in the upper reaches. The area with a decline in soil erosion intensity grade was 527.91 km2, accounting for 2.07% of the total area. It is mainly distributed in the lower reaches (west bank of the lower reaches of the Taohe River) and the middle reaches.
4.2. Time Variation of Soil Erosion Intensity
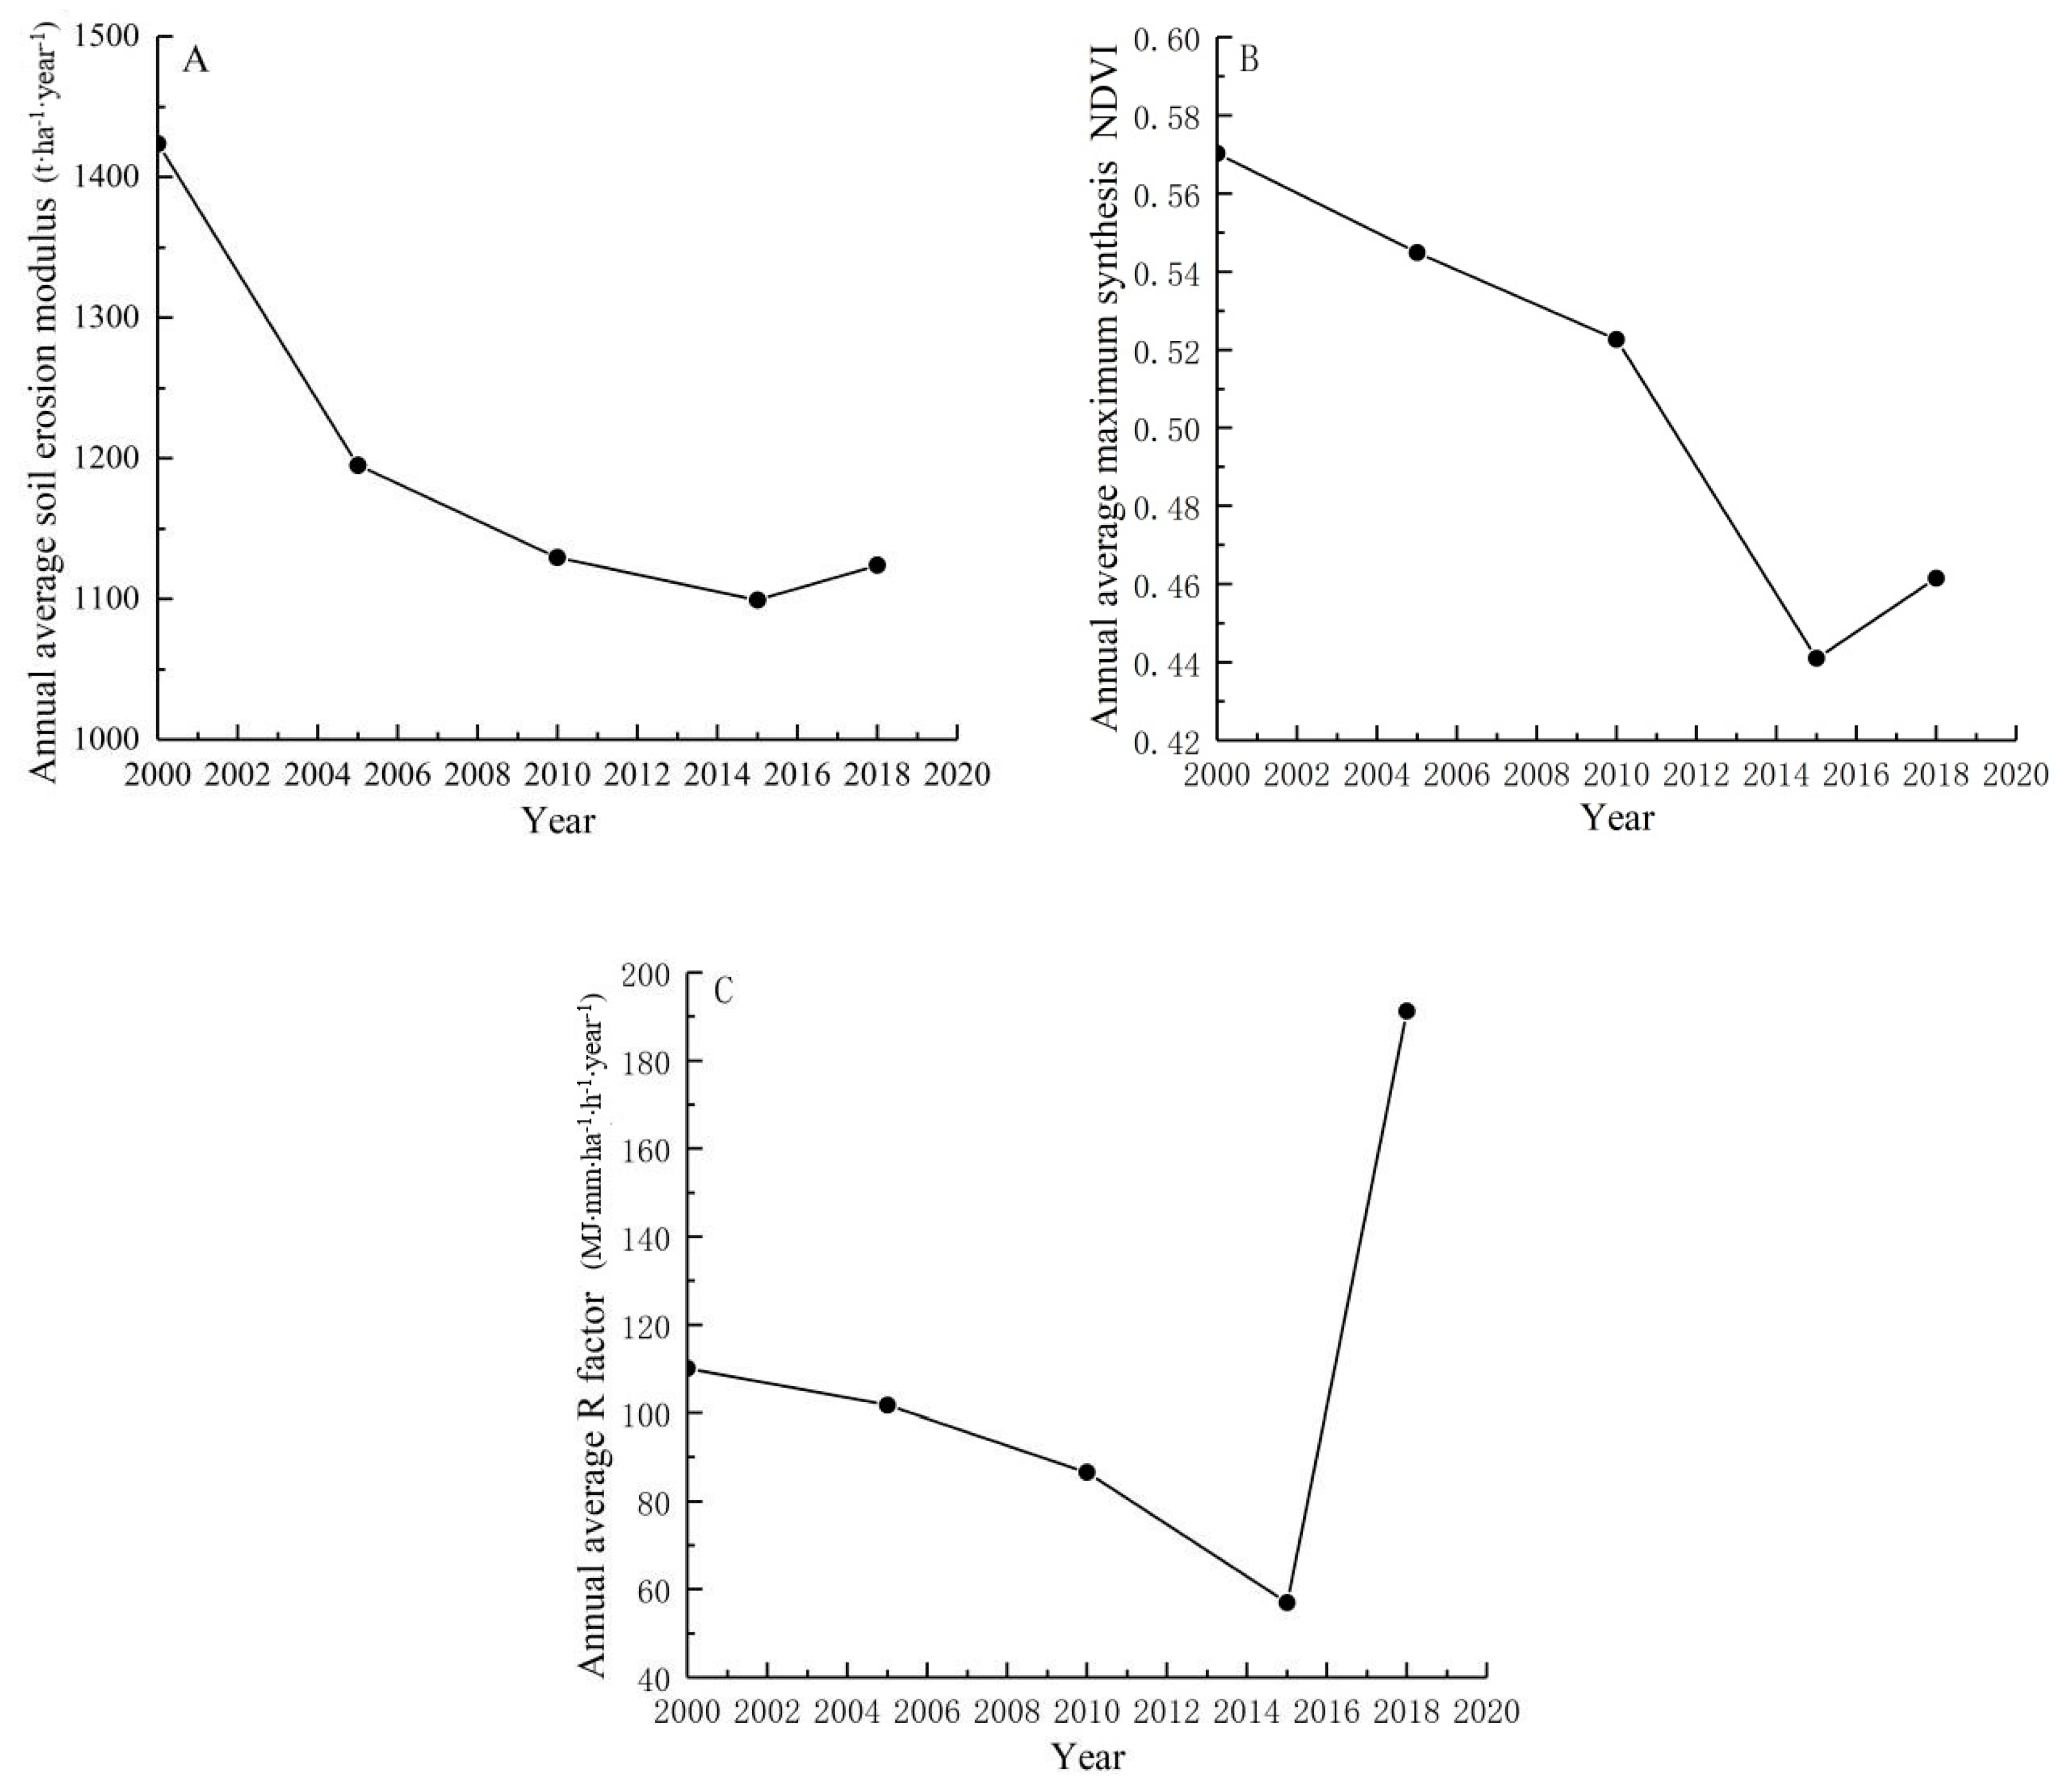
The average soil erosion modulus of the Taohe River Basin in 2000, 2005, 2010, 2015 and 2018 were 1423.76, 1195.12, 1192.26, 1099.16 and 1124.11 t·ha−1·year−1, respectively. The soil erosion modulus decreased by 16.06% from 2000 to 2005. The soil erosion modulus decreased by 5.51% from 2005 to 2010, the soil erosion modulus decreased by 2.67% from 2010 to 2015, the soil erosion modulus increased by 7.03% from 2015 to 2018, and the soil erosion modulus decreased by 21.04% from 2000 to 2018. The soil erosion modulus presents a downward trend from 2000 to 2015, with a slight increase in 2015–2018, and the overall downward trend is obvious (Figure 8A). The total amount of soil erosion in the Taohe River Basin in 2000, 2005, 2010, 2015 and 2018 was 3.63 × 10⁸, 3.05 × 10⁸, 2.88 × 10⁸, 2.80 × 10⁸ and 2.87 × 10⁸ t, respectively.
Vegetation and precipitation are two main factors affecting soil erosion dynamics. In 2000, 2005, 2010, 2015 and 2018, the maximum synthesis values of NDVI at the Taohe River Basin were 0.57, 0.54, 0.52, 0.44 and 0.46, respectively, and NDVI showed a decreasing trend (Figure 8B). The higher the NDVI value, the better the vegetation coverage, and the soil erosion could be effectively reduced. However, the soil erosion modulus showed a decreasing trend in the Taohe River Basin. Therefore, the vegetation was not the main reason affecting the decrease of soil erosion modulus in the Taohe River Basin. In 2000, 2005, 2010, 2015 and 2018, the average annual precipitation erosivity factors of the Taohe River Basin were 110.15, 101.71, 86.62, 57.03 and 191.29 MJ⋅mm⋅ha−1⋅h−1⋅year−1 (Figure 8C). The higher the precipitation erosion factor was, the more serious the soil erosion was. The precipitation erosivity factor showed a downward trend from 2000 to 2015, and it increased significantly in 2015–2018 (the northwestern region had an abnormally abundant year in 2018 [33]), which is consistent with the change of soil erosion modulus in the Taohe River Basin. Therefore, the change of precipitation is the direct cause of the change of soil erosion in the Taohe River Basin.
The areas of different erosion intensity grades were counted, and a transfer matrix of the soil erosion intensity grade was made. From 2000 to 2005, the stability rates of soil micro erosion, mild erosion, moderate erosion, strong erosion, pole strong erosion and violent erosion in the Taohe River Basin were 99.92%, 81.43%, 73.24%, 58.74%, 62.41% and 67.27%, respectively (Table 5). From 2005 to 2010, the stability rates of soil micro erosion, mild erosion, moderate erosion, strong erosion, pole strong erosion and violent erosion in the Taohe River Basin were 99.34%, 91.20%, 86.26%, 78.17%, 80.11% and 81.18%, respectively (Table 6). From 2010 to 2015, the stability rates of soil micro erosion, mild erosion, moderate erosion, strong erosion, pole strong erosion and violent erosion in the Taohe River Basin were 99.16%, 90.31%, 85.90%, 79.34%, 82.18% and 86.37%, respectively (Table 7). From 2015 to 2018, the stability rates of soil micro erosion, mild erosion, moderate erosion, strong erosion, pole strong erosion and violent erosion in the Taohe River Basin were 98.63%, 91.63%, 87.32%, 79.45%, 82.68% and 87.80%, respectively (Table 8). From 2000 to 2018, the stability rates of soil micro erosion, mild erosion, moderate erosion, strong erosion, pole strong erosion and violent erosion in the Taohe River Basin were 95.57%, 80.81%, 73.70%, 60.02%, 69.47% and 99.50%, respectively (Table 9). On the whole, the area change of violent soil erosion was the least in the Taohe River Basin. The area of strong soil erosion changed was largest in the Taohe River Basin.
In the Taohe River Basin from 2000 to 2018, the proportions of the area transferred from micro erosion to mild erosion, moderate erosion, strong erosion, pole strong erosion and violent erosion were 0.14%, 0.00%, 0.00%, 0.00% and 0.00%, respectively. Only an area of 24.48 km2 changed from micro erosion to mild erosion. The proportions of the area which transferred from mild erosion to micro erosion, moderate erosion, strong erosion, pole strong erosion and violent erosion were 21.45%, 0.23%, 0.01%, 0.00% and 0.00%, respectively. An area of 827.42 km2 changed from mild erosion to micro erosion, and an area of 8.89 km2 changed from mild erosion to moderate erosion. The proportions of the area which transferred from moderate erosion to micro erosion, mild erosion, strong erosion, pole strong erosion and violent erosion were 0.36%, 34.70%, 0.13%, 0.00% and 0.01%, respectively. An area of 673.17 km2 changed from moderate erosion to mild erosion. The proportions of the area which transferred from strong erosion to micro erosion, mild erosion, moderate erosion, pole strong erosion and violent erosion were 0.08%, 2.31%, 50.09%, 0.14% and 0.02%, respectively. An area of 394.90 km2 changed from strong erosion to moderate erosion, and an area of 18.24 km2 changed from strong erosion to mild erosion. The proportions of the area which transferred from pole strong erosion to micro erosion, mild erosion, moderate erosion, strong erosion and violent erosion were 0.07%, 0.22%, 7.81%, 42.38% and 0.07%, respectively. An area of 234.92 km2 changed from pole strong erosion to strong erosion, and an area of 43.31 km2 changed from pole strong erosion to moderate erosion. The proportions of the area which transferred from violent erosion to micro erosion, mild erosion, moderate erosion, strong erosion and pole strong erosion were 0.40%, 0.07%, 0.25%, 3.70%, and 40.77%, respectively. An area of 119.06 km2 changed from violent erosion to pole strong erosion. From 2000 to 2018, the unchanged area of soil erosion intensity grade in the Taohe River Basin was 23,140.47 km2, accounting for 90.70%; the weakened area of soil erosion intensity grade was 2333.26 km2, accounting for 9.15%; the intensified area of soil erosion intensity grade was 39.40 km2, accounting for 0.15%; and the overall soil erosion intensity grade was slightly weakened (Table 9).
5. Conclusions
In this study, Google Earth Engine and the RUSLE models were used to calculate the soil erosion modulus of the Taohe River Basin in 2000, 2005, 2010, 2015 and 2018, and the temporal and spatial variation characteristics of soil erosion intensity grade were analyzed. The main conclusions are as follows:
- (1)
- In 2000, 2005, 2010, 2015 and 2018, the average soil erosion modulus of the Taohe River Basin was 1424, 1195, 1129, 1099 and 1124 t·ha−1·year−1, respectively. The soil erosion modulus showed a downward trend from 2000 to 2015, with a slight increase in 2015–2018. The overall downward trend is obvious. Vegetation and precipitation are two main factors affecting soil erosion dynamics. But, the change of precipitation is the direct cause of the change of soil erosion in the Taohe River Basin.
- (2)
- In 2000, 2005, 2010, 2015 and 2018, the scope of soil erosion in the Taohe River Basin remained basically the same. The areas with serious erosion are mainly in the middle and lower reaches of the River Basin and distributed in the south and northeast of the River Basin. The middle and lower reaches of the Taohe River Basin belong to the loess soil, and the vegetation growth is weaker than that of the upper reaches, so the soil erosion in the middle and lower reaches is more serious.
- (3)
- From 2000 to 2018, the stability rates of micro erosion, mild erosion, moderate erosion, strong erosion, pole strong erosion and violent erosion in the Taohe River Basin were 95.57%, 80.81%, 73.70%, 60.02%, 69.47% and 99.50%, respectively. The area change of violent erosion in the Taohe River Basin was the smallest and the area change of strong erosion was the largest.
- (4)
- From 2000 to 2018, the area with an unchanged soil erosion intensity grade accounts for 90.70%; the area with a weakened soil erosion intensity grade accounts for 9.15%; and the area with an intensified soil erosion intensity grade accounts for 0.15%. On the whole, the soil erosion intensity grade is slightly weakened.
- (5)
- Google Earth Engine has a strong advantage in dealing with the vegetation cover factor and Conservation measure factor of the RUSLE models. This will provide strong technical support for the analysis of dynamic changes in soil erosion in large areas in the future.
In this paper, Google Earth Engine and the RUSLE model are combined for the first time to study the spatial and temporal changes of soil erosion in 2000, 2005, 2010, 2015 and 2018 and to find a new method for the data processing and acquisition required by the RUSLE model.
Author Contributions
Writing—original draft preparation, H.W.; writing—review and editing, H.Z. All authors have read and agreed to the published version of the manuscript.
Funding
This research was funded by the National Natural Science Foundation of China, grant number 40802083.
Conflicts of Interest
The authors declare no conflict of interest.
References
- Vanwalleghem, T. Soil Erosion and Conservation. In International Encyclopedia of Geography; John Wiley & Sons, Ltd.: Hoboken, NJ, USA, 2017. [Google Scholar]
- Nearing, M.A.; Xie, Y.; Liu, B.; Ye, Y. Natural and anthropogenic rates of soil erosion. Int. Soil Water Conserv. Res. 2017, 5, 77–84. [Google Scholar] [CrossRef]
- Ministry of Water Resources of the People’s Republic of China. Available online: http://www.mwr.gov.cn/sj/tjgb/zgstbcgb/201908/t20190820_1353674.html (accessed on 2 September 2018).
- Lei, Z.; Guolin, Y.; Yan, Z.; Yan, Z.; Bin, H.; Zhonghan, L.; Zhiyun, W.; Jing, L. The Amount of Soil Erosion in Baoxiang Watershed of Dianchi Lake Based on GIS and USLE. Bull. Soil Water Conserv. 2007, 27, 42–46. [Google Scholar]
- Li, T.H.; Zheng, L.N. Soil Erosion Changes in the Yanhe Watershed from 2001 to 2010 Based on RUSLE Model. J. Nat. Resour. 2012, 27, 1164–1175. [Google Scholar]
- Wischmeier, W.H.; Smith, D.D. Predicting rainfall erosion losses: A guide to conservation planning [USA]. In Agriculture Handbook (USA); United States Department of Agriculture: Washington, DC, USA, 1978; p. 537. [Google Scholar]
- Renard, K.G.; Ferreira, V.A. RUSLE Model Description and Database Sensitivity. J. Environ. Qual. 1993, 22, 458. [Google Scholar] [CrossRef]
- Zha, L.; Deng, G.; Gu, J. Dynamic changes of soil erosion in the Chaohu Watershed from 1992 to 2013. Acta Geogr. Sin. 2015, 70, 1708–1719. [Google Scholar]
- Renard, K.G.; Foster, G.R.; Weesies, G.A.; Mccool, D.K.; Yoder, D.C. Predicting soil erosion by water: A guide to conservation planning with the Revised Universal Soil Loss Equation (RUSLE). In United States Department of Agriculture, Agricultural Research Service (USDA-AARS) Handbook No. 703; Government Printing Office: Washington, DC, USA, 1997. [Google Scholar]
- Gorelick, N. Google Earth Engine. In Proceedings of the American Geophysical Union, Fall Meeting 2012, San Francisco, CA, USA, 3–7 December 2012. [Google Scholar]
- Gorelick, N.; Hancher, M.; Dixon, M.; Ilyushchenko, S.; Thau, D.; Moore, R. Google Earth Engine: Planetary-scale geospatial analysis for everyone. Remote Sens. Environ. 2017, 202, 18–27. [Google Scholar] [CrossRef]
- Patel, N.N.; Angiuli, E.; Gamba, P.; Gaughan, A.; Lisini, G.; Stevens, F.; Tatem, A.; Trianni, G. Multitemporal settlement and population mapping from Landsat using Google Earth Engine. Int. J. Appl. Earth Obs. Geoinf. 2015, 35, 199–208. [Google Scholar] [CrossRef] [Green Version]
- Hu, Y.; Shang, L.; Zhang, Q.; Wang, Z. Land change patterns and driving mechanism in Beijing since 1990 based on GEE Platform. Remote Sens. Technol. Appl. 2018, 4, 573–583. [Google Scholar]
- Johansen, K.; Phinn, S.; Taylor, M. Mapping woody vegetation clearing in Queensland, Australia from Landsat imagery using the Google Earth Engine. Remote Sens. Appl. Soc. Environ. 2015, 1, 36–49. [Google Scholar] [CrossRef]
- Tao, Z.; Hong, T. Vegetation Cover Change and Urban Expansion in Beijing-Tianjin-Hebei during 2001~2015 based on Google Earth Engine. Remote Sens. Technol. Appl. 2018, 33, 593–599. [Google Scholar]
- Wilson, C.H.; Caughlin, T.T.; Rifai, S.W.; Boughton, E.H.; Mack, M.C.; Flory, S.L. Multi-decadal time series of remotely sensed vegetation improves prediction of soil carbon in a subtropical grassland. Ecol. Appl. 2017, 27, 1646–1656. [Google Scholar] [CrossRef] [PubMed]
- Huang, H.; Chen, Y.; Clinton, N.; Wang, J.; Wang, X.; Liu, C.; Gong, P.; Yang, J.; Bai, Y.; Zheng, Y.; et al. Mapping major land cover dynamics in Beijing using all Landsat images in Google Earth Engine. Remote Sens. Environ. 2017, 202, 166–176. [Google Scholar] [CrossRef]
- Farda, N.M. Multi-temporal Land Use Mapping of Coastal Wetlands Area using Machine Learning in Google Earth Engine. IOP Conf. Ser. Earth Environ. Sci. 2017, 98, 012042. [Google Scholar] [CrossRef]
- Shelestov, A.; Lavreniuk, M.; Kussul, N.; Novikov, A.; Skakun, S. Large scale crop classification using Google earth engine platform. In Proceedings of the 2017 IEEE International Geoscience and Remote Sensing Symposium (IGARSS), Fort Worth, TX, USA, 23–28 July 2017. [Google Scholar]
- Lavreniuk, M.S.; Kussul, N.; Shelestov, A.; Vasiliev, V. Crop classification and mapping based on Sentinel missions data in cloud environment. In Proceedings of the American Geophysical Union, Fall Meeting 2017, New Orleans, LA, 11–15 December 2017. [Google Scholar]
- Fang, C.; Zhang, M.; Tian, B.; Li, Z. Extraction of Glacial Lake Outlines in Tibet Plateau Using Landsat 8 Imagery and Google Earth Engine. IEEE J. Sel. Top. Appl. Earth Obs. Remote Sens. 2017, 10, 1–8. [Google Scholar]
- András, Z.; Supan, P.; Zsófia, K. Near real-time qualitative monitoring of lake water chlorophyll globally using GoogleEarth Engine. In Proceedings of the European Geosciences Union General Assembly Conference, Vienna, Austria, 23–28 April 2017. [Google Scholar]
- Cheng, L.; Ma, L.; Yang, M.; Wan, G.; Wang, X. Changes of temperature and precipitation and their impacts on runoff in the upper Taohe River in northwest China from 1956 to 2014. Environ. Earth Sci. 2019, 78, 423. [Google Scholar] [CrossRef]
- Zeng, C.; Wang, S.; Bai, X.; Li, Y.; Tian, Y.; Li, Y.; Wu, L.; Luo, G. Soil erosion evolution and spatial correlation analysis in a typical karst geomorphology, using RUSLE with GIS. Solid Earth 2017, 8, 721–736. [Google Scholar] [CrossRef] [Green Version]
- Williams, J.R.; Renard, K.G.; Dyke, P.T. EPIC: A new method for assessing erosion’s effect on soil productivity. J. Soil Water Conserv. 1983, 38, 381–383. [Google Scholar]
- Nanjing Agricultural College. Soil Agricultural Chemistry Analysis; China Agriculture Press: Beijing, China, 1980. [Google Scholar]
- Mccool, D.K.; Foster, G.R.; Mutchler, C.K.; Meyer, L.D. Revised Slope Length Factor for the Universal Soil Loss Equation. Trans. ASAE 1989, 30, 1387–1396. [Google Scholar] [CrossRef]
- Liu Baoyuan Nearing, M.A.; Risse, L.M. Slope Gradient Effects on Soil Loss for Steep Slopes. Soil Sci. Soc. Am. J. 2000, 64, 1759–1763. [Google Scholar]
- Desmet PJ, J.; Govers, G. A GIS procedure for automatically calculating the USLE LS factor on topographically complex landscape units. J. Soil Water Cons. 1996, 51, 427–433. [Google Scholar]
- Van der Knijff, J.M.; Jones, R.J.A.; Montanarella, L. Soil erosion risk assessment in Italy. In Proceedings of the Man & Soil at the Third Millennium International Congress of the European Society for Soil Conservation, Valencia, Spain, 28 March–1 April 1999. [Google Scholar]
- Lee, E.; Ahn, S.; Im, S. Estimation of soil erosion rate in the Democratic People’s Republic of Korea using the RUSLE model. For. Sci. Technol. 2017, 13, 100–108. [Google Scholar] [CrossRef]
- People’s Republic of China Ministry of Water Resources. SL190-2007 Standards of Classification of Soil Erosion; China Water Power Press: Beijing, China, 2007. [Google Scholar]
- China Meterological Administration. Available online: http://www.cma.gov.cn/2011xwzx/2011xqxxw/2011xqxyw/201901/t20190123_513193.html (accessed on 15 September 2018).
Figure 1.
Location of the study area.

Figure 2.
Spatial distribution of rainfall erosivity factor in the Taohe River Basin in 2000, 2005, 2010, 2015 and 2018.
Figure 2.
Spatial distribution of rainfall erosivity factor in the Taohe River Basin in 2000, 2005, 2010, 2015 and 2018.

Figure 3.
Spatial distribution of soil erodibility factor and topographic factor in the Taohe River Basin.
Figure 3.
Spatial distribution of soil erodibility factor and topographic factor in the Taohe River Basin.

Figure 4.
Spatial distribution of vegetation cover factor in the Taohe River Basin in 2000, 2005, 2010, 2015 and 2018.
Figure 4.
Spatial distribution of vegetation cover factor in the Taohe River Basin in 2000, 2005, 2010, 2015 and 2018.

Figure 5.
Spatial distribution of conservation measure factors in the Taohe River Basin in 2000, 2005, 2010, 2015 and 2018.
Figure 5.
Spatial distribution of conservation measure factors in the Taohe River Basin in 2000, 2005, 2010, 2015 and 2018.

Figure 6.
The soil erosion intensity grades in the Taohe River Basin in 2000, 2005, 2010, 2015 and 2018.
Figure 6.
The soil erosion intensity grades in the Taohe River Basin in 2000, 2005, 2010, 2015 and 2018.

Figure 7.
Spatial distribution of soil erosion intensity grades change in the Taohe River Basin.

Figure 8.
Time variation of annual average soil erosion modulus (A), annual average maximum synthesis values of normalized difference vegetation index (NDVI) (B) and annual average R factor(C) in the Taohe River Basin.
Figure 8.
Time variation of annual average soil erosion modulus (A), annual average maximum synthesis values of normalized difference vegetation index (NDVI) (B) and annual average R factor(C) in the Taohe River Basin.


Table 1.
P-values of different land use types.
| Land Use Types | Paddy Filed | Cropland | Forest | Grassland | Water | Settlement Place | Unused Land |
|---|---|---|---|---|---|---|---|
| p | 0.15 | 0.35 | 1.0 | 1.0 | 0.0 | 0.0 | 0.0 |
Table 2.
Classification standard of soil erosion intensity grades [32].
Table 2.
Classification standard of soil erosion intensity grades [32].
| Soil Erosion Intensity Grades | Soil Erosion Modulus t/(km2⋅a) |
|---|---|
| Micro erosion | <1000 |
| Mild erosion | 1000~2500 |
| Moderate erosion | 2500~5000 |
| Strong erosion | 5000~8000 |
| Pole strong erosion | 8000~15,000 |
| Violent erosion | >15,000 |
Table 3.
Areas of different soil erosion intensity grades in the Taohe River Basin in 2000, 2005, 2010, 2015 and 2018 (km2).
Table 3.
Areas of different soil erosion intensity grades in the Taohe River Basin in 2000, 2005, 2010, 2015 and 2018 (km2).
| Year | Micro | Mild | Moderate | Strong | Pole Strong | Violent |
|---|---|---|---|---|---|---|
| 2000 | 18,081.4 | 3856.79 | 1940.13 | 788.44 | 554.31 | 292 |
| 2005 | 18,779.64 | 3672.48 | 1761.78 | 662.04 | 440.49 | 197 |
| 2010 | 18,924.48 | 3685.29 | 1710.22 | 623.47 | 403.11 | 167 |
| 2015 | 19,034.58 | 3678.41 | 1661.42 | 599.57 | 382.44 | 157 |
| 2018 | 18,892.53 | 3737.34 | 1705.69 | 622.15 | 394.52 | 161 |
Table 4.
Proportion of different soil erosion intensity grades in the Taohe River Basin in 2000, 2005, 2010, 2015 and 2018 (%).
Table 4.
Proportion of different soil erosion intensity grades in the Taohe River Basin in 2000, 2005, 2010, 2015 and 2018 (%).
| Year | Micro | Mild | Moderate | Strong | Pole Strong | Violent |
|---|---|---|---|---|---|---|
| 2000 | 70.87 | 15.12 | 7.6 | 3.09 | 2.17 | 1.14 |
| 2005 | 73.61 | 14.39 | 6.91 | 2.59 | 1.73 | 0.77 |
| 2010 | 74.18 | 14.44 | 6.7 | 2.44 | 1.58 | 0.65 |
| 2015 | 74.61 | 14.42 | 6.51 | 2.35 | 1.5 | 0.61 |
| 2018 | 74.05 | 14.65 | 6.69 | 2.44 | 1.55 | 0.63 |
Table 5.
The transfer matrix of soil erosion intensity grades in the Taohe River Basin from 2000 to 2005 (km2).
Table 5.
The transfer matrix of soil erosion intensity grades in the Taohe River Basin from 2000 to 2005 (km2).
| 2000 | ||||||||
|---|---|---|---|---|---|---|---|---|
| Micro | Mild | Moderate | Strong | Pole strong | Violent | Total | ||
| 2005 | Micro | 18,067.51 | 710.40 | 1.44 | 0.10 | 0.04 | 0.13 | 18,779.64 |
| Mild | 13.46 | 3140.69 | 515.91 | 2.05 | 0.30 | 0.06 | 3672.48 | |
| Moderate | 0.37 | 5.52 | 1420.93 | 322.45 | 12.31 | 0.19 | 1761.78 | |
| Strong | 0.05 | 0.10 | 1.73 | 463.16 | 195.53 | 1.48 | 662.04 | |
| Pole strong | 0.00 | 0.07 | 0.09 | 0.65 | 345.97 | 93.71 | 440.49 | |
| Violent | 0.00 | 0.00 | 0.02 | 0.03 | 0.18 | 196.48 | 196.71 | |
| Total | 18,081.40 | 3856.79 | 1940.13 | 788.44 | 554.31 | 292.06 | 25,513.13 | |
Table 6.
The transfer matrix of soil erosion intensity grades in the Taohe River Basin from 2005 to 2010 (km2).
Table 6.
The transfer matrix of soil erosion intensity grades in the Taohe River Basin from 2005 to 2010 (km2).
| 2005 | ||||||||
|---|---|---|---|---|---|---|---|---|
| Micro | Mild | Moderate | Strong | Pole Strong | Violent | Total | ||
| 2010 | Micro | 18,655.91 | 265.56 | 1.53 | 0.53 | 0.32 | 0.65 | 18,924.48 |
| Mild | 120.46 | 3349.48 | 214.03 | 0.68 | 0.38 | 0.25 | 3685.29 | |
| Moderate | 2.68 | 56.65 | 1519.74 | 129.21 | 1.74 | 0.21 | 1710.22 | |
| Strong | 0.41 | 0.52 | 25.95 | 517.49 | 78.76 | 0.34 | 623.47 | |
| Pole strong | 0.12 | 0.18 | 0.43 | 13.90 | 352.90 | 35.57 | 403.11 | |
| Violent | 0.05 | 0.09 | 0.11 | 0.23 | 6.39 | 159.69 | 166.56 | |
| Total | 18,779.64 | 3672.48 | 1761.78 | 662.04 | 440.49 | 196.71 | 25,513.13 | |
Table 7.
The transfer matrix of soil erosion intensity grades in the Taohe River Basin from 2010 to 2015 (km2).
Table 7.
The transfer matrix of soil erosion intensity grades in the Taohe River Basin from 2010 to 2015 (km2).
| 2010 | ||||||||
|---|---|---|---|---|---|---|---|---|
| Micro | Mild | Moderate | Strong | Pole Strong | Violent | Total | ||
| 2015 | Micro | 18,765.30 | 265.55 | 3.08 | 0.46 | 0.14 | 0.05 | 19,034.58 |
| Mild | 158.34 | 3328.37 | 190.68 | 0.73 | 0.21 | 0.09 | 3678.41 | |
| Moderate | 0.43 | 90.94 | 1469.06 | 99.20 | 1.66 | 0.12 | 1661.42 | |
| Strong | 0.19 | 0.12 | 47.08 | 494.65 | 57.21 | 0.32 | 599.57 | |
| Pole strong | 0.15 | 0.26 | 0.27 | 28.40 | 331.26 | 22.11 | 382.44 | |
| Violent | 0.07 | 0.05 | 0.06 | 0.03 | 12.63 | 143.86 | 156.70 | |
| Total | 18,924.48 | 3685.29 | 1710.22 | 623.47 | 403.11 | 166.56 | 25,513.13 | |
Table 8.
The transfer matrix of soil erosion intensity grades in the Taohe River Basin from 2015 to 2018 (km2).
Table 8.
The transfer matrix of soil erosion intensity grades in the Taohe River Basin from 2015 to 2018 (km2).
| 2015 | ||||||||
|---|---|---|---|---|---|---|---|---|
| Micro | Mild | Moderate | Strong | Pole Strong | Violent | Total | ||
| 2018 | Micro | 18,773.65 | 118.87 | 0.01 | 0.00 | 0.00 | 0.00 | 18,892.53 |
| Mild | 260.93 | 3370.62 | 105.64 | 0.15 | 0.00 | 0.00 | 3737.34 | |
| Moderate | 0.00 | 188.71 | 1450.78 | 65.36 | 0.80 | 0.03 | 1705.69 | |
| Strong | 0.00 | 0.21 | 103.11 | 476.39 | 42.31 | 0.13 | 622.15 | |
| Pole strong | 0.00 | 0.00 | 1.88 | 57.47 | 316.21 | 18.95 | 394.52 | |
| Violent | 0.00 | 0.00 | 0.00 | 0.19 | 23.11 | 137.59 | 160.89 | |
| Total | 19,034.58 | 3678.41 | 1661.42 | 599.57 | 382.44 | 156.70 | 25,513.13 | |
Table 9.
The transfer matrix of soil erosion intensity grades in the Taohe River Basin from 2000 to 2018 (km2).
Table 9.
The transfer matrix of soil erosion intensity grades in the Taohe River Basin from 2000 to 2018 (km2).
| 2000 | ||||||||
|---|---|---|---|---|---|---|---|---|
| Micro | Mild | Moderate | Strong | Pole Strong | Violent | Total | ||
| 2018 | Micro | 18,055.84 | 827.42 | 7.08 | 0.64 | 0.39 | 1.16 | 18,892.53 |
| Mild | 24.48 | 3020.02 | 673.17 | 18.24 | 1.22 | 0.21 | 3737.34 | |
| Moderate | 0.81 | 8.89 | 1257.04 | 394.90 | 43.31 | 0.74 | 1705.69 | |
| Strong | 0.20 | 0.22 | 2.61 | 373.41 | 234.92 | 10.80 | 622.15 | |
| Pole strong | 0.07 | 0.17 | 0.06 | 1.10 | 274.06 | 119.06 | 394.52 | |
| Violent | 0.01 | 0.07 | 0.17 | 0.14 | 0.41 | 160.10 | 160.89 | |
| Total | 18,081.40 | 3856.79 | 1940.13 | 788.44 | 554.31 | 292.06 | 25,513.13 | |
© 2020 by the authors. Licensee MDPI, Basel, Switzerland. This article is an open access article distributed under the terms and conditions of the Creative Commons Attribution (CC BY) license (http://creativecommons.org/licenses/by/4.0/).
Share and Cite
MDPI and ACS Style
Wang, H.; Zhao, H. Dynamic Changes of Soil Erosion in the Taohe River Basin Using the RUSLE Model and Google Earth Engine. Water 2020, 12, 1293. https://doi.org/10.3390/w12051293
AMA Style
Wang H, Zhao H. Dynamic Changes of Soil Erosion in the Taohe River Basin Using the RUSLE Model and Google Earth Engine. Water. 2020; 12(5):1293. https://doi.org/10.3390/w12051293
Chicago/Turabian StyleWang, Hao, and Hu Zhao. 2020. "Dynamic Changes of Soil Erosion in the Taohe River Basin Using the RUSLE Model and Google Earth Engine" Water 12, no. 5: 1293. https://doi.org/10.3390/w12051293
Note that from the first issue of 2016, this journal uses article numbers instead of page numbers. See further details here.