Evaluation of Satellite-Derived Soil Moisture in Qinghai Province Based on Triple Collocation


1
School of surveying and mapping science and engineering, Shandong University of Science and Technology, Qingdao 266000, China
2
Key Laboratory of Water Cycle and Related Land Surface Processes, Institute of Geographic Sciences and Natural Resources Research, CAS, Beijing 100101, China
*
Author to whom correspondence should be addressed.
Water 2020, 12(5), 1292; https://doi.org/10.3390/w12051292
Submission received: 1 April 2020
/
Revised: 28 April 2020
/
Accepted: 29 April 2020
/
Published: 2 May 2020
(This article belongs to the Special Issue Applications of Remote Sensing and GIS in Hydrology II)
Abstract
:Evaluating the reliability of satellite-based and reanalysis soil moisture products is very important in soil moisture research. The traditional methods of evaluating soil moisture products rely on the verification of satellite inversion data and ground observation; however, the ground measurement data is often difficult to obtain. The triple collocation (TC) method can be used to evaluate the accuracy of a product without obtaining the ground measurement data. This study focused on the whole of Qinghai Province, China (31°–40° N, 89°–103° E), and used the TC method to obtain the error variance for satellite-based soil moisture data, the signal-to-noise ratio (SNR) of the same data, and the correlation between the same data and the ground-truth soil moisture, using passive satellite products: Soil Moisture Active Passive (SMAP), Soil Moisture Ocean Salinity (SMOS), Fengyun-3B Microwave Radiation Imager (FY3B), Fengyun-3C Microwave Radiation Imager (FY3C), and Advanced Microwave Scanning Radiometer 2 (AMSR2); an active satellite product Advanced Scatterometer (ASCAT), and reanalysis data Goddard Earth Observing System Model version 5 (GEOS-5) land modeling system. The TC results for the passive satellite data were then compared with the satellite-derived enhanced vegetation index (EVI) to explore the influence of vegetation coverage on the results. The following conclusions are drawn: (1) for the SMAP, SMOS, FY3B, FY3C, and AMSR2 satellite data, the spatial distributions of the TC-derived error variance, the SNR of the satellite-derived soil moisture, and the correlation coefficient between the satellite-derived and ground-truth soil moisture, were all relatively similar, which indirectly verified the reliability of the TC method; and (2) SMOS data have poor applicability for the estimation of soil moisture in Qinghai Province due to their insufficient detection capability in the Qaidam area, high error variance (median 0.0053), high SNR (median 0.43), and low correlation coefficient with ground-truth soil moisture (median 0.57).
1. Introduction
Surface soil moisture, though accounting for less than 0.001% of global freshwater, plays an important role in the global surface water circulation [1]. On average, surface soil retains 14% of precipitation after three days, with the storage capacity usually being higher in arid areas [2]. Surface soil moisture also plays an important role in soil microbial respiration [3], the biogeochemical cycle [4], crop yield [5], dust generation [6], and disease transmission [7]. Additionally, surface soil moisture can be used to monitor deep soil moisture due to the strong correlation between surface soil moisture and deep soil moisture [8]. Therefore, efficient monitoring of surface soil moisture is necessary. However, it is challenging to observe soil moisture due to its variability in space and time. Conventional soil moisture measurements are commonly made using automatic stations or manual soil collection. However, although such measurements can produce accurate results, it is nevertheless difficult to obtain a large range of soil moisture values due to the sparsity of observation points and poor spatial representation [9]. On the other hand, in recent years, technological advances have made it possible to obtain long-time series of soil moisture data over a large scale using remote sensing techniques. Among them, microwave radar and radiometric measurements have provided the most important sources of soil moisture records worldwide. However, satellite measurements are limited by the noise of the sensor and the limitation of the retrieval model, resulting in large errors in the observation results.
Traditional methods used to evaluate the error in satellite-based estimates of soil moisture usually compare the satellite-retrieved soil moisture with ground-measured data. However, this method has the following disadvantages: (1) The comparison is usually limited due to the insufficient number of locations, the finite space available for verification points, and the heterogeneity of the ground surface, thus generating representative error and scale conversion error and making it difficult to ensure the robustness of the verification; (2) This method can only estimate the error between two sets of soil moisture data, and cannot estimate the error of the two datasets simultaneously. On the other hand, the triple collocation (TC) analysis method, as a new method for the estimation of the error in soil moisture measurements, has been widely applied to the global-scale evaluation of remote sensing soil-moisture data in recent years [10]. The TC method has the following advantages: (1) It does not require high-quality reference datasets, and can verify three different soil moisture datasets in the study area (Qinghai Province, China) without ground measured data; (2) It can obtain the error variance of three soil moisture datasets simultaneously; (3) The representative errors caused by spatial mismatch between station-measured ground data and remote sensing satellite data which occur in traditional verification methods are avoided; (4) The improved extended triple collocation (ETC) method can obtain the correlation between soil moisture datasets and actual surface soil moisture [11].
The TC method was originally designed by Stoffelen to obtain calibration constants of reference datasets in satellite wind speed products. The method was later applied to the remote-sensing monitoring of soil moisture and has gradually become an important tool for the satellite-based evaluation of soil moisture [12]. Scipal et al. applied the TC method to Tropical Rainfall Measuring Mission satellite (TRMM) radiometer, ERS-2 scatterometer, and ERA-Interim reanalysis data in order to obtain the error variance among the three methods [13]. Additionally, Chen et al. used Soil Moisture Active Passive (SMAP), Soil Moisture Ocean Salinity (SMOS), Advanced Scatterometer (ASCAT), and European Centre for Medium Range Weather Forecasts (ECMWF) reanalysis data to conduct TC analysis; they first applied TC to obtain a robust global-scale cross-assessment of the soil-moisture retrieval accuracy of SMAP, SMOS, and ASCAT based on anomaly temporal correlation [14]. Gruber et al. reviewed the existing error representations of satellite-based soil moisture data, analyzed the basic assumptions behind the TC method, and proposed a combined investigation of the signal-to-noise ratio (SNR) (expressed in logarithmic units), the unscaled error variances, and the soil moisture sensitivities of the datasets for the evaluation of remotely sensed soil moisture datasets [15]. Dong and Crow discussed the influence of auto-correlated retrieval errors on the TC method and proposed a generalized triple collocation (GTC) analysis algorithm which can decompose the total error variance of remote sensing soil moisture data into its auto-correlated and white-error components [16]. The standard TC method can only provide relative error, and requires a reference dataset to be selected from three parallel data products; this means that the resulting error variance is influenced by the deviations caused by the multiplication and addition operation of the reference dataset. Consequently, McColl et al. recently proposed an extended TC method based on the traditional TC method, which can estimate the absolute value of the time correlation between the evaluated product and unknown targets without a reference dataset [11]. In China, Wu Kai et al. used the TC method to calculate the error variances among Advanced Microwave Scanning Radiometer Earth Observing System (AMSRE) radiometer, ASCAT scatterometer, and European Reanalysis Agency Reanalysis Product (ERA) reanalysis data and compared the variances with MODIS data for vegetation coverage type in order to obtain the influence of vegetation type on the TC method [17].
The TC method was applied to remote sensing soil moisture data products—namely passive data, active data, and reanalysis data—from SMAP, SMOS, FY3B, FY3C, AMSR2, ASCAT, and GEOS5, in order to obtain the error variance, SNR, and correlation coefficient estimation of the TC method, and to compare the TC result of the passive product with the enhanced vegetation index (EVI) of the study area in order to determine the influence of vegetation coverage on the quality of the passive remote sensing soil moisture product. Subsequently, the results and a discussion are presented.
2. Materials and Methods
2.1. Triple Collocation (TC) Method
In the verification and comparative study of soil moisture, the TC method is usually used to estimate the random error variance of a specific soil moisture dataset, and usually requires three independent measurement systems to describe one physical variable. In this study, three independent measurement systems—namely passive satellite retrieval, active satellite retrieval, and terrain model products—were selected to estimate surface soil moisture. The following assumptions were made [14]: (1) All datasets are linearly correlated with the ground-truth soil moisture; (2) zero error cross-correlation exists between passive, active, and reanalysis data; (3) zero correlation exists between errors and unknown truth; and (4) the signals and errors are stable. The covariance method [15] was used to calculate the error variance and SNR of soil moisture. These two parameters are expressed by expressions (1) and (2), respectively:
where is the variance of X, is the covariance of X and Y, is the unknown true soil moisture state, i ∈ [X,Y,Z], and is the error variance of i.
The fractional mean-squared-error (fMSE) is a normalized representation of SNR and where fMSE = 0 indicates that the observed soil moisture signal has no noise, fMSE = 1 indicates that no soil moisture signal has been observed, and fMSE = 0.5 indicates that the observed soil moisture signal variance is equal to the noise variance. Hereafter, fMSE is used as a substitute for SNR.
McColl et al. developed a new ETC method, based on the TC method, to estimate the correlation coefficient between a single soil moisture dataset and ground-truth soil moisture [11]. Such ETC-based correlation estimation is considered feasible if the following conditions are met: (1) the parallel triple time series contains at least 50 data points; (2) There is a positive correlation between the three time series; (3) the ETC correlation outputs are positive for each of the three datasets [14]. The correlation coefficient R can be obtained via Equation (3):
where is the correlation between X and .
2.2. Data Sources
In this study, passive satellite datasets—namely SMAP [18], SMOS [19], FY3B, FY3C, AMSR2 [20], and an active satellite dataset—ASCAT—were selected, and a GEOS5 [21] reanalysis dataset was used as TC test data, as shown in Table 1.
The L3_SM_P product [14] is a daily global composite of the SMAP L2_SM_P product, which is projected on a global cylindrical 36 km Equal-Area Scalable Earth (EASE) grid (EASEv2 [22]). The ascending pass data were used for testing. The SMOS_CATDS [14] data product was generated on the 25 km EASEv2 grid, and the test was also carried out using ascending pass data. FY series products were downloaded from the National Meteorological Center of China Meteorological Administration and projected on a global cylindrical 25 km EASE grid (EASEv1). The ascending pass data were used (the ascending pass data have a relatively high coverage in the study area). AMSR2, as a successor sensor to AMSRE, has greatly reduced the radio frequency interference (RFI) for land observation data. AMSR2 (Equal latitude and longitude projection) EQR grid data products with a daily/monthly average resolution of 0.1°/0.25° can be obtained from the website of the Japan Aerospace Exploration Agency (JAXA). Since September 2012, the ASCAT [14,15,23] sensor carried by the METOP-B satellite has provided a C-band backscatter coefficient with a spatial resolution of 25–34 km and a revisit period of three days. The ASCAT_L2 soil moisture product (representing the soil surface layer [0–2 cm]) used in this study was obtained from the European Organisation for the Exploitation of Meteorological Satellites (EUMETSAT) Earth Observation Portal (EOP) based on a change detection algorithm developed by the Vienna University of Technology. The ground soil moisture model used in this study uses data from the GEOS-5 [21] basin ground model, which are provided every hour. The GEOS5′s subdata SFMC dataset (representing surface soil moisture [0–7 cm]) with a time period of 5:30 was selected in this study.
In this paper, EVI data for 2017 and 2018 were obtained from the MYD13A3 MODIS satellite data product using the maximum synthesis method. In order to compare these EVI data with the TC results, the EVI data were resampled to a resolution of 0.25° × 0.3125° by bilinear interpolation, as shown in Figure 1.
2.3. Data Preprocessing
Due to the presence of snow cover in winter, satellite-derived soil moisture data are not available in the study area for this season (the data is blank), and the soil moisture data from each dataset from the period of 1 April to 30 November of 2017 and 2018 were extracted. Subsequently, due to the difference in spatial resolution between the different soil moisture datasets adopted in this study, the passive data (SMAP, SMOS, FY3B, FY3C, and AMSR2) were interpolated using bilinear interpolation, and the active data (ASCAT) was interpolated to the resolution of the reanalysis data (GEOS5) using an inverse distance weighted interpolation. The units of all of the soil moisture data used in this study are volume water content (m3/m3 or %) and unit conversion was therefore unnecessary. Furthermore, although the active and passive satellite remote sensing soil moisture data used in this study have slightly different observation depths, the depths of both are on the order of centimeters beneath the soil surface, so we calculate it directly and less impact on the final TC result. In order to ensure the accuracy of the TC results, the regions with correlation coefficients less than 0.2 for the passive products, active products, and reanalysis data were masked and not used for the TC calculation. It is worth noting that the raster data calculated using the TC method show that the correlation coefficients among the three groups of data are all greater than 0.2 and pass the significance test for correlation coefficients (a = 0.05).
3. Results
3.1. Correlation between Satellite Soil Moisture Products
3.1.1. Correlation between Passive Satellite Soil Moisture Products
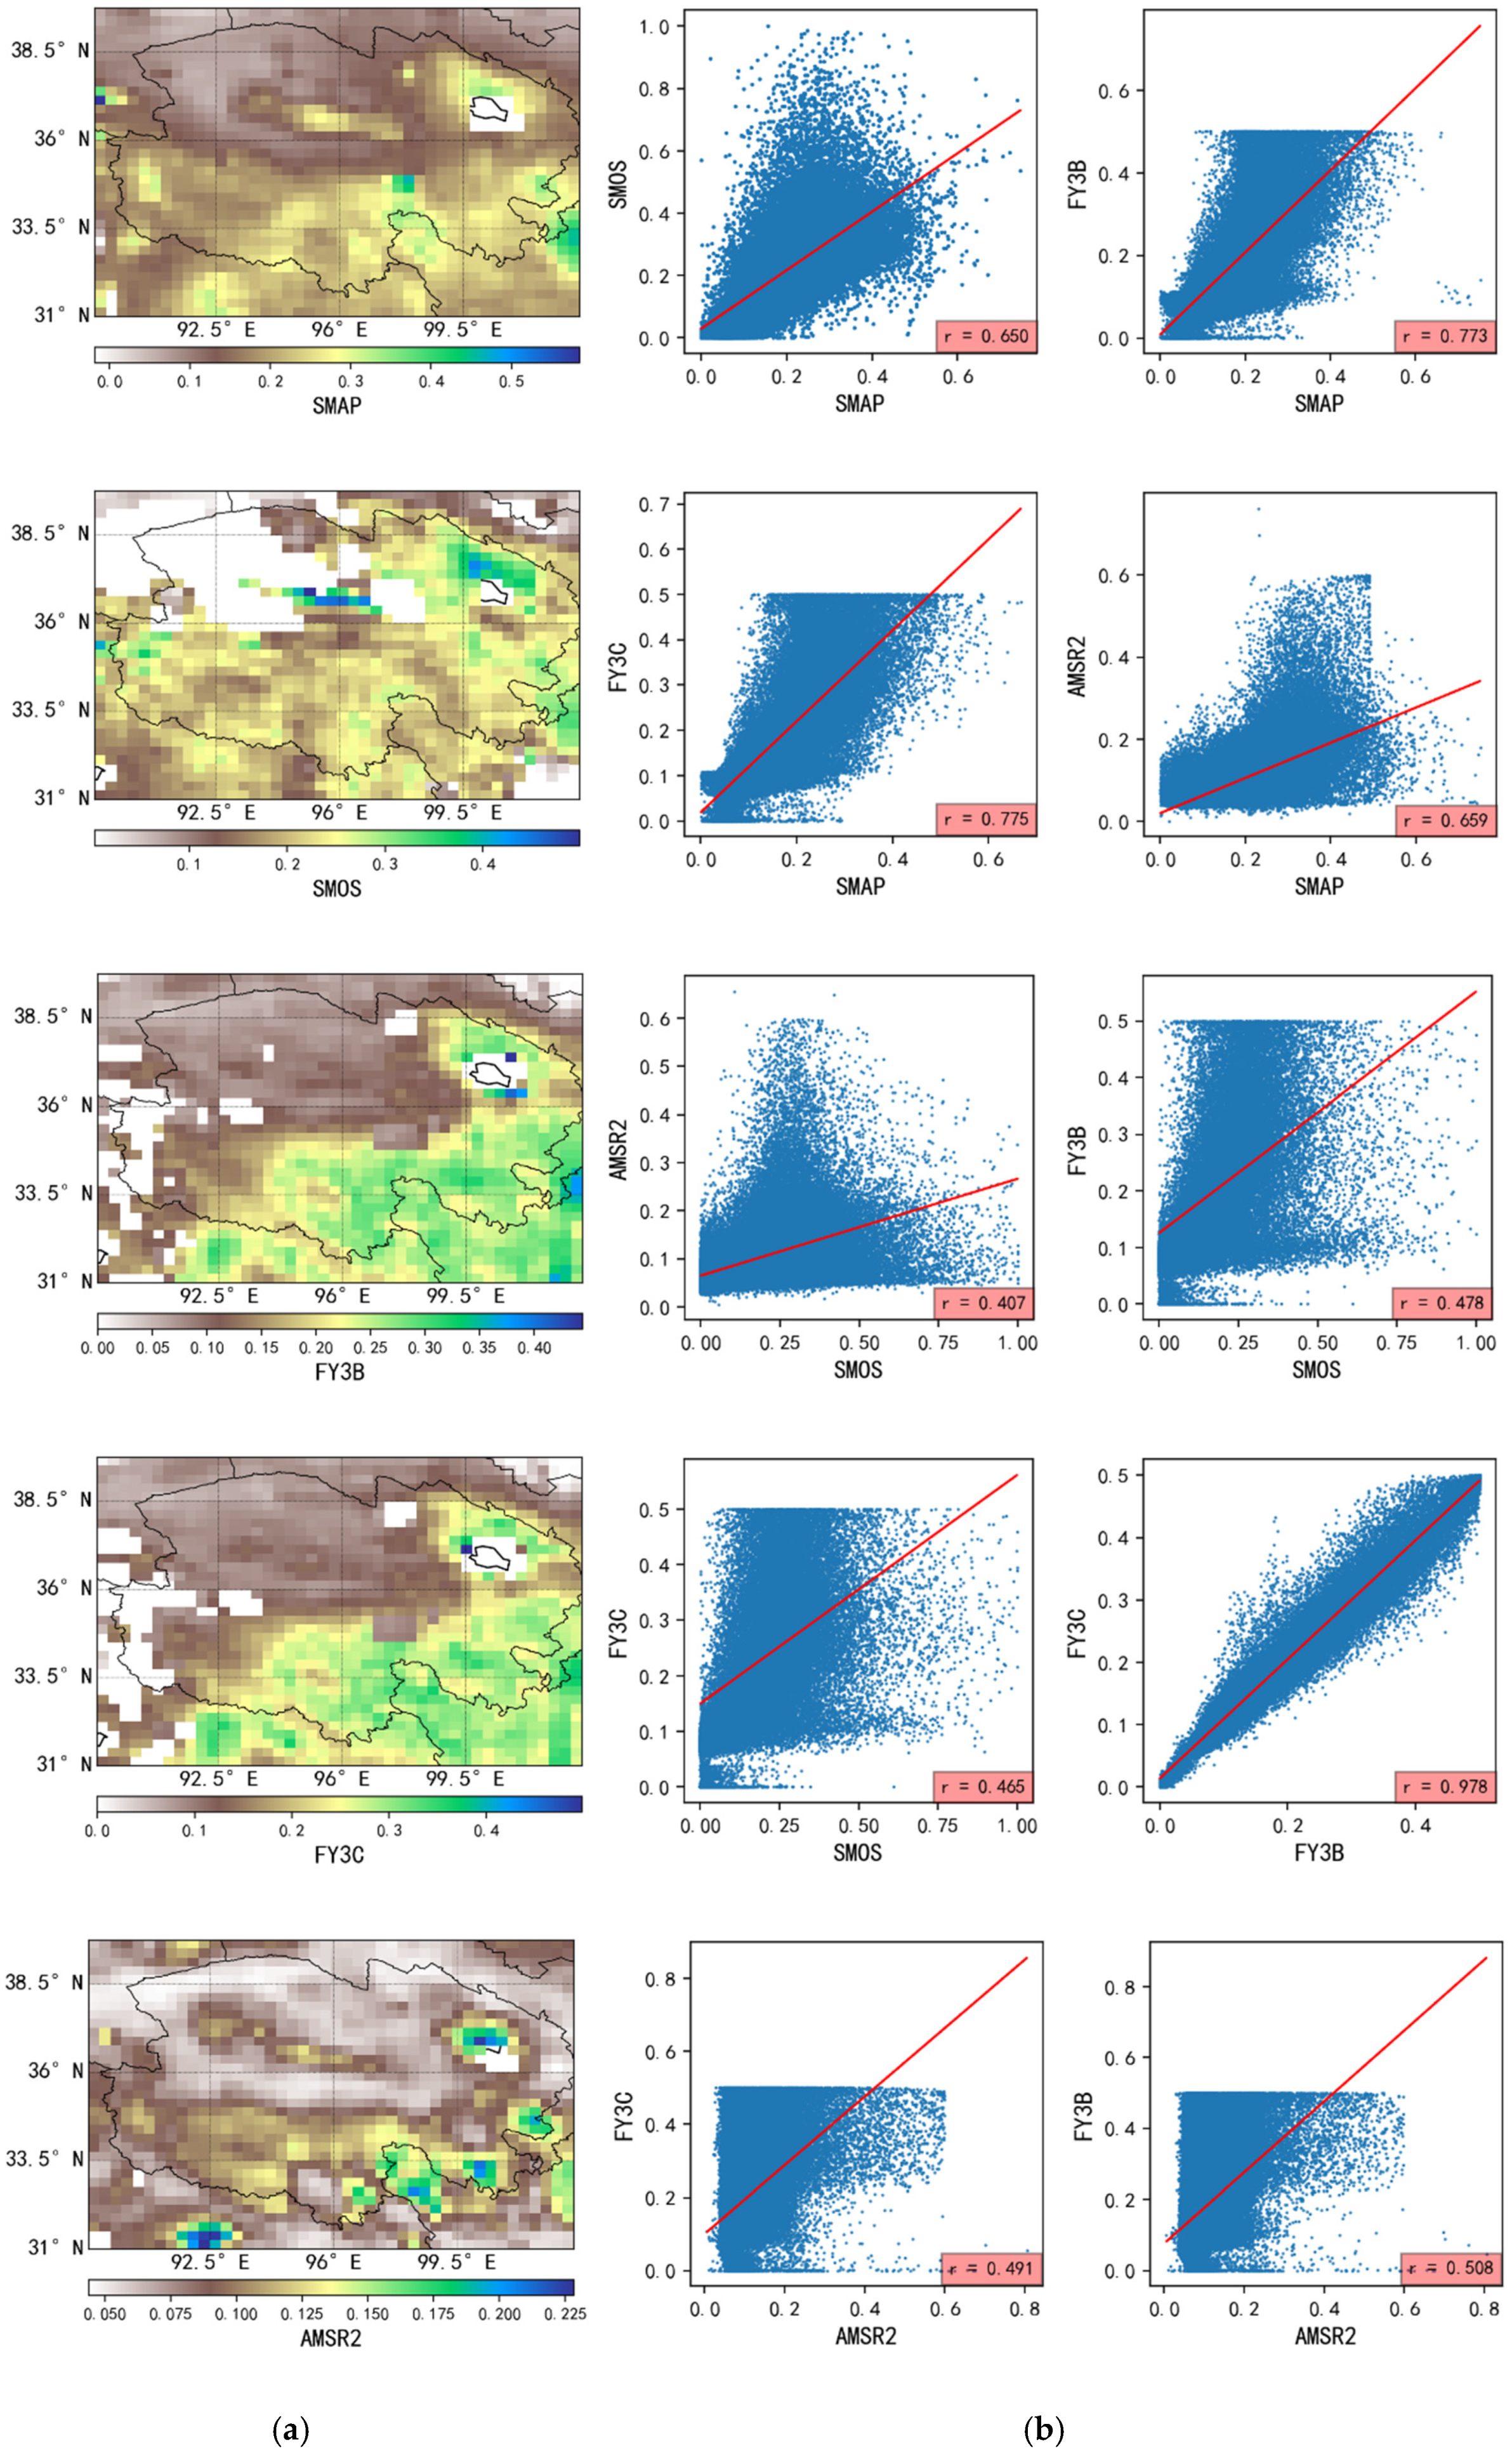
As can be seen in Figure 2, the leftmost column shows the average daily soil moisture of the five passive satellite products in the study area. It can be seen that, of the five types of passive product, all except SMOS have good coverage in Qinghai Province and have a similar spatial variation trend, namely that soil moisture decreases from the northwest to the southeast. This trend indirectly proves that all soil moisture products reflect the actual spatial pattern of the soil moisture and thus that satellite data is a reliable way to observe soil moisture, despite the fact that the algorithm and parameters of each passive data product are different. Meanwhile, the second and third columns of Figure 2 show scatter plots between the average daily soil moisture of the passive products. From the figure, it can be seen that the highest correlation coefficient (0.978) was obtained between the FY3B and FY3C products. Aside from the aforementioned correlation, the highest correlation coefficients were obtained between the SMAP product and the other four passive products, e.g., the correlation between SMAP and FY3C is 0.775, the correlation between SMAP and FY3B is 0.773, and the correlation between SMAP and AMSR2 is 0.659. This indicates the stability of the SMAP satellite data in Qinghai Province. On the other hand, the correlation between SMOS and other passive products is lower, which suggests the poor adaptability of the SMOS satellite product in Qinghai Province, as was also indicated by the TC results.
3.1.2. Correlation Analysis between Different Types of Soil Moisture Products
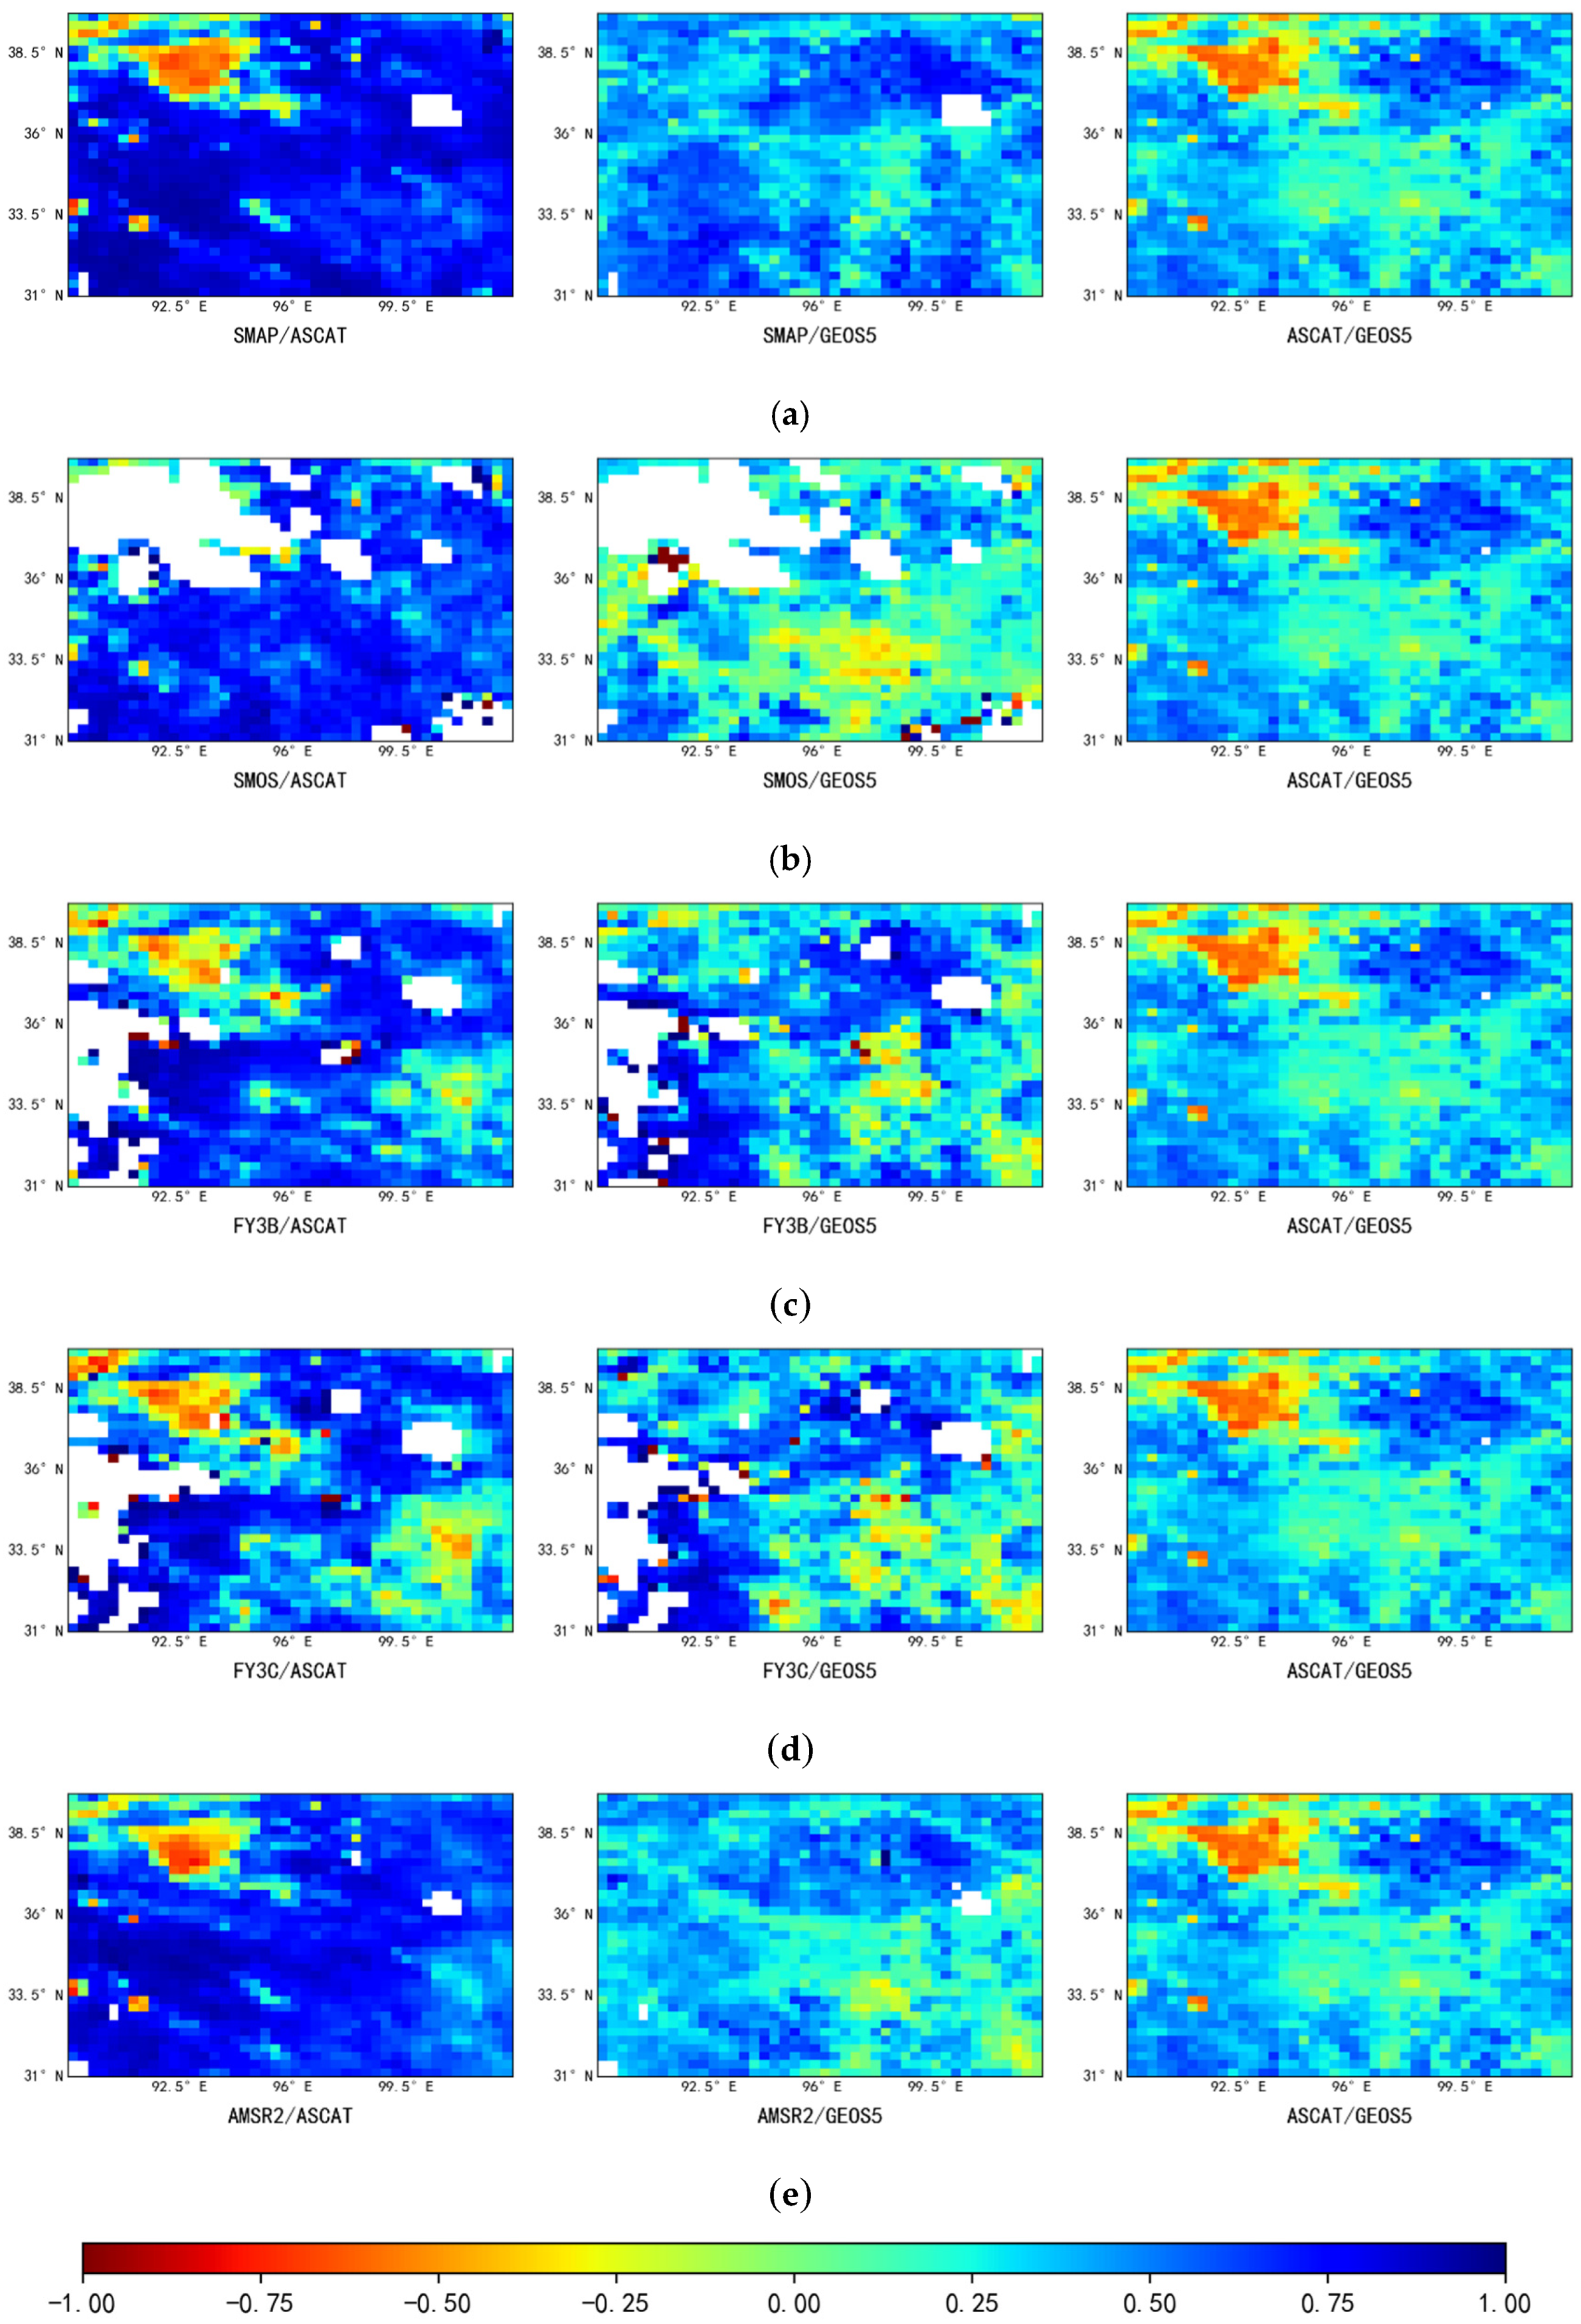
Firstly, correlation analysis was performed between passive products, active products, and reanalysis data to determine whether TC calculation would be carried out for the region (correlation coefficient criterion of >0.2, see Section 2.3). Figure 3 shows the correlation coefficients between five groups of data, namely [SMAP, ASCAT, GEOS5], [SMOS, ASCAT, GEOS5], [FY3B, ASCAT, GEOS5], [FY3C, ASCAT, GEOS5], and [AMSR2, ASCAT, GEOS5].
As can be seen from Figure 3, the correlations between the different types of data have similar spatial distributions—i.e., there is a weak positive correlation or a negative correlation in the area with high vegetation coverage in the southeastern region of the study area and in the area with low vegetation coverage in the northwestern region, while there is a strong positive correlation in the areas with moderate vegetation coverage in the southwestern and northeastern regions of the study area. This suggests that vegetation coverage has different effects on different types of soil moisture data; this will be discussed in detail in Section 4.
3.2. Analysis of Triple Collocation Results
In this study, the error variance, fMSE, and correlation coefficient between satellite-derived soil moisture and ground-truth soil moisture among the five datasets were obtained using the TC method.
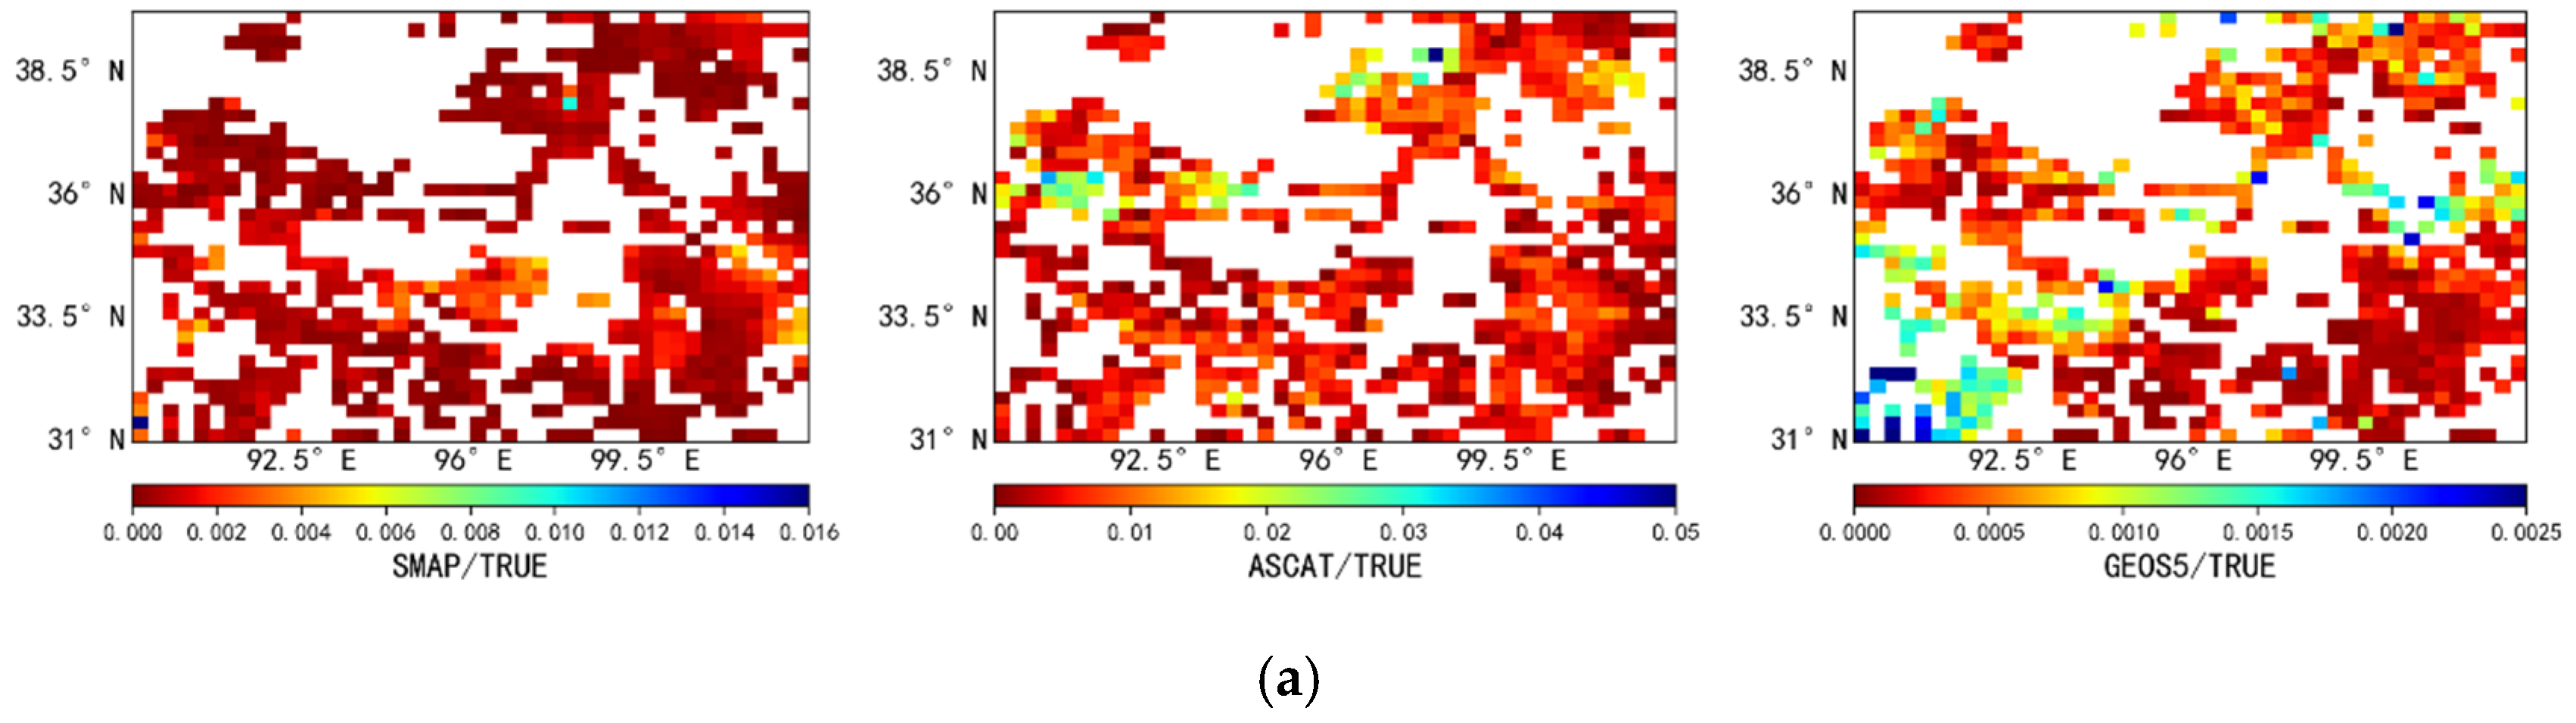
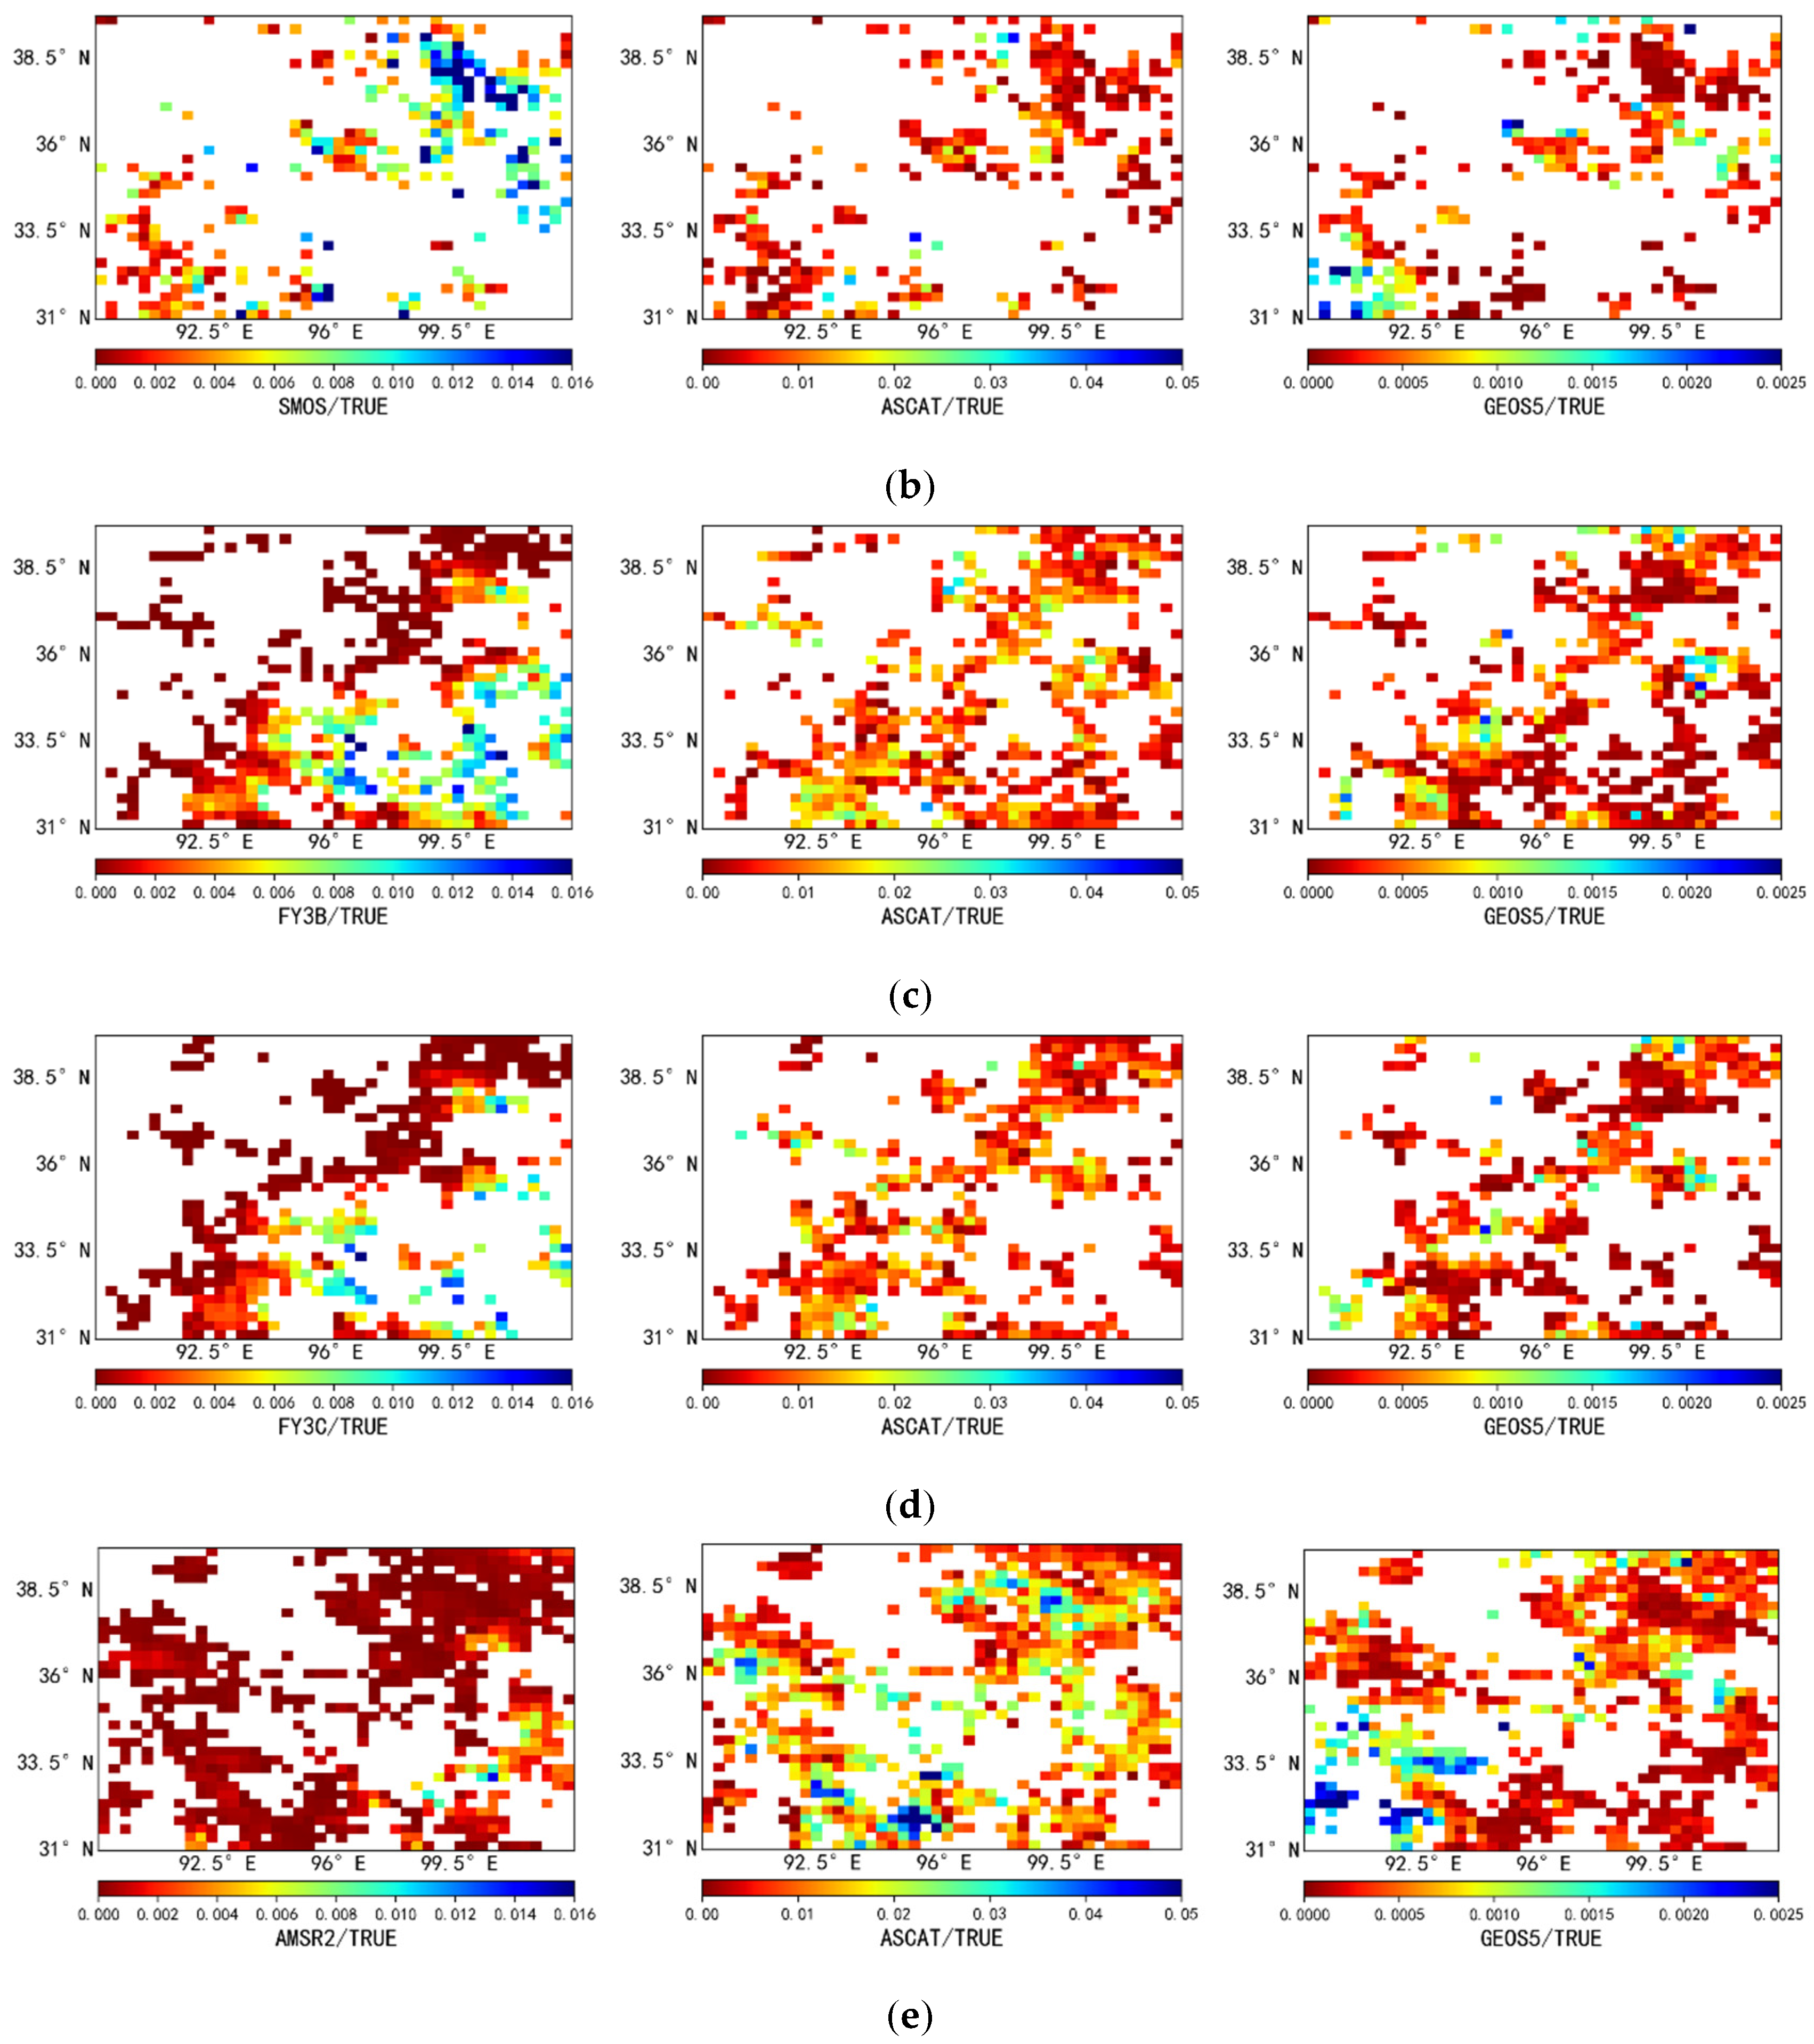
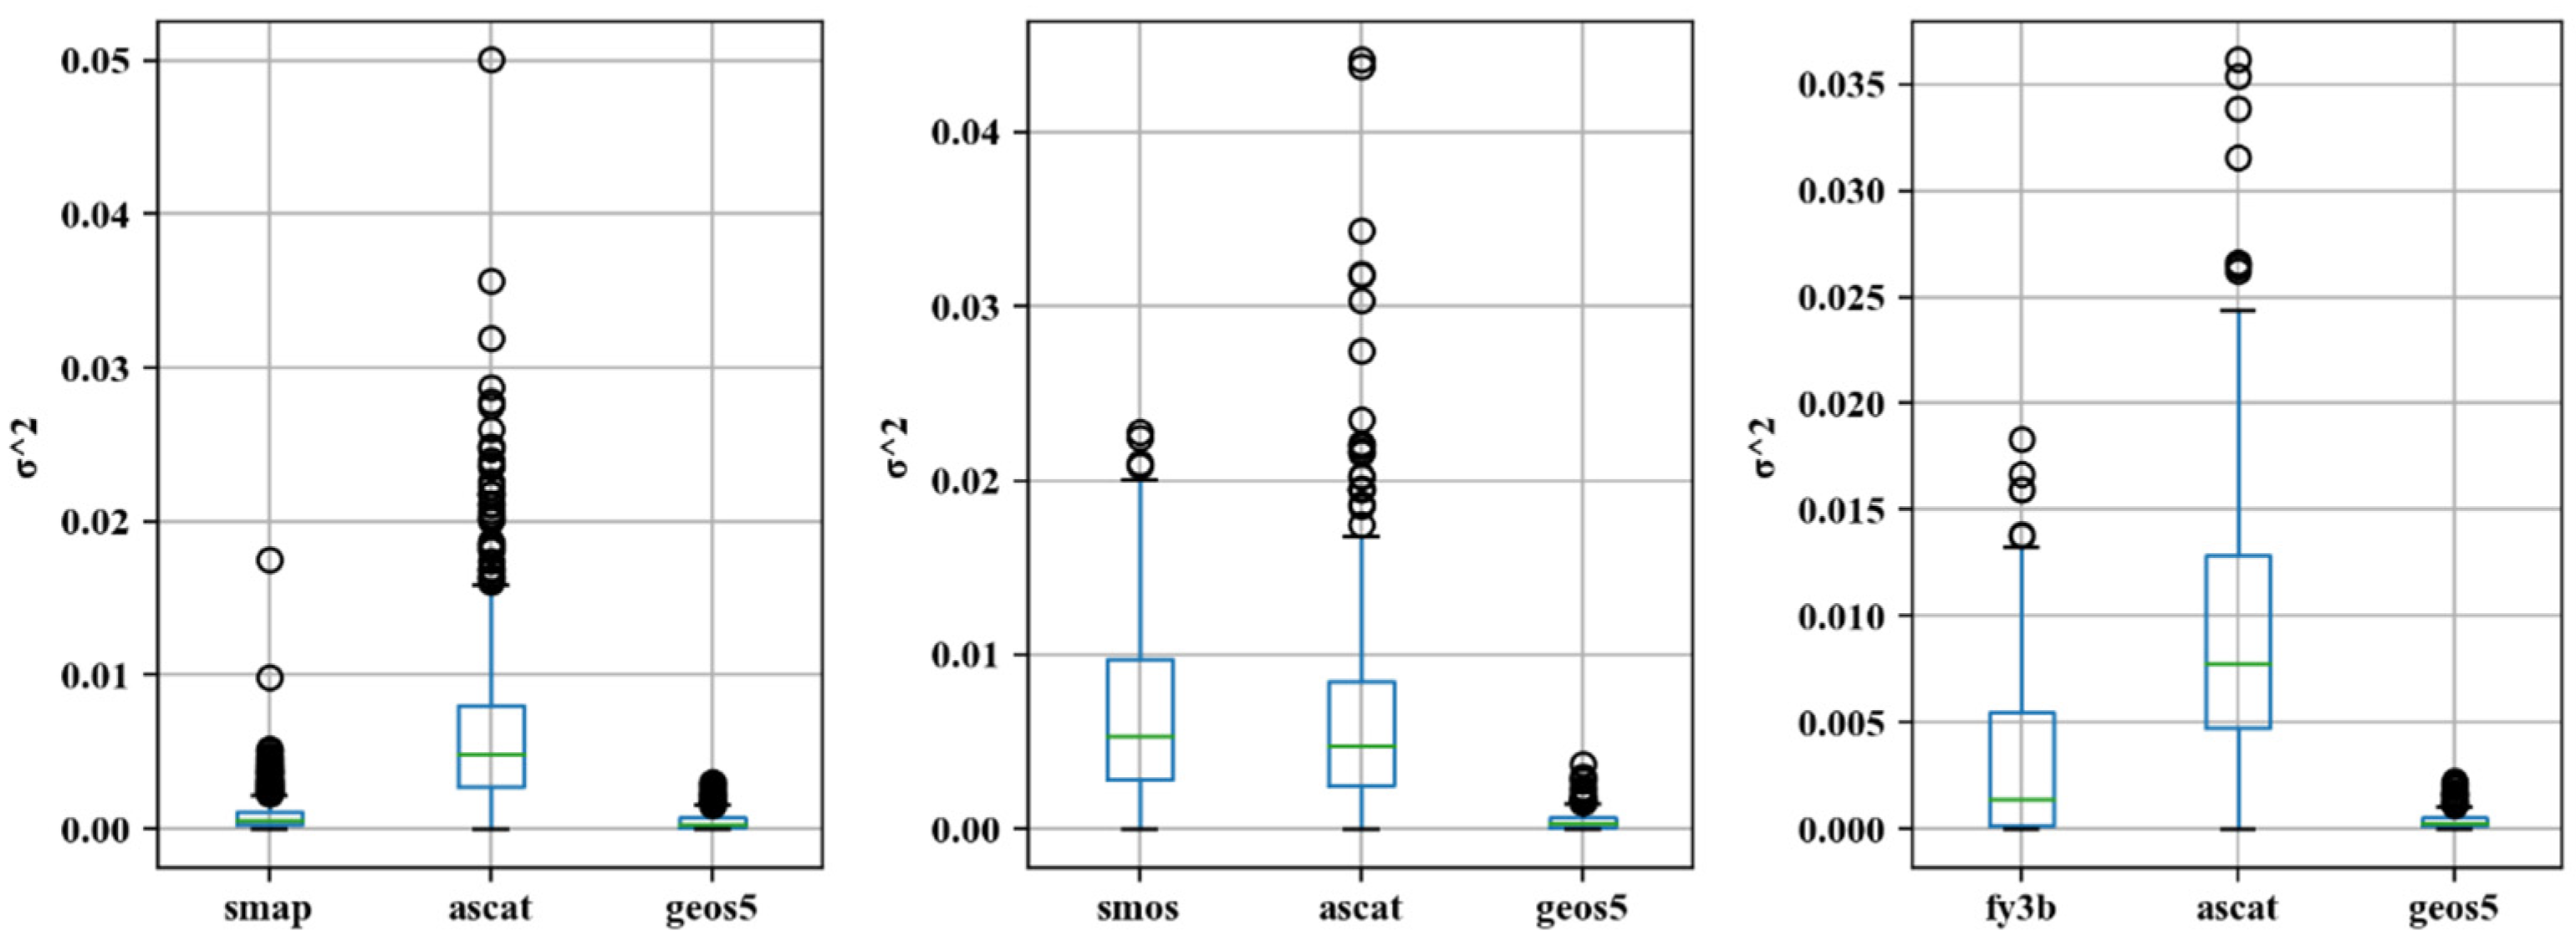
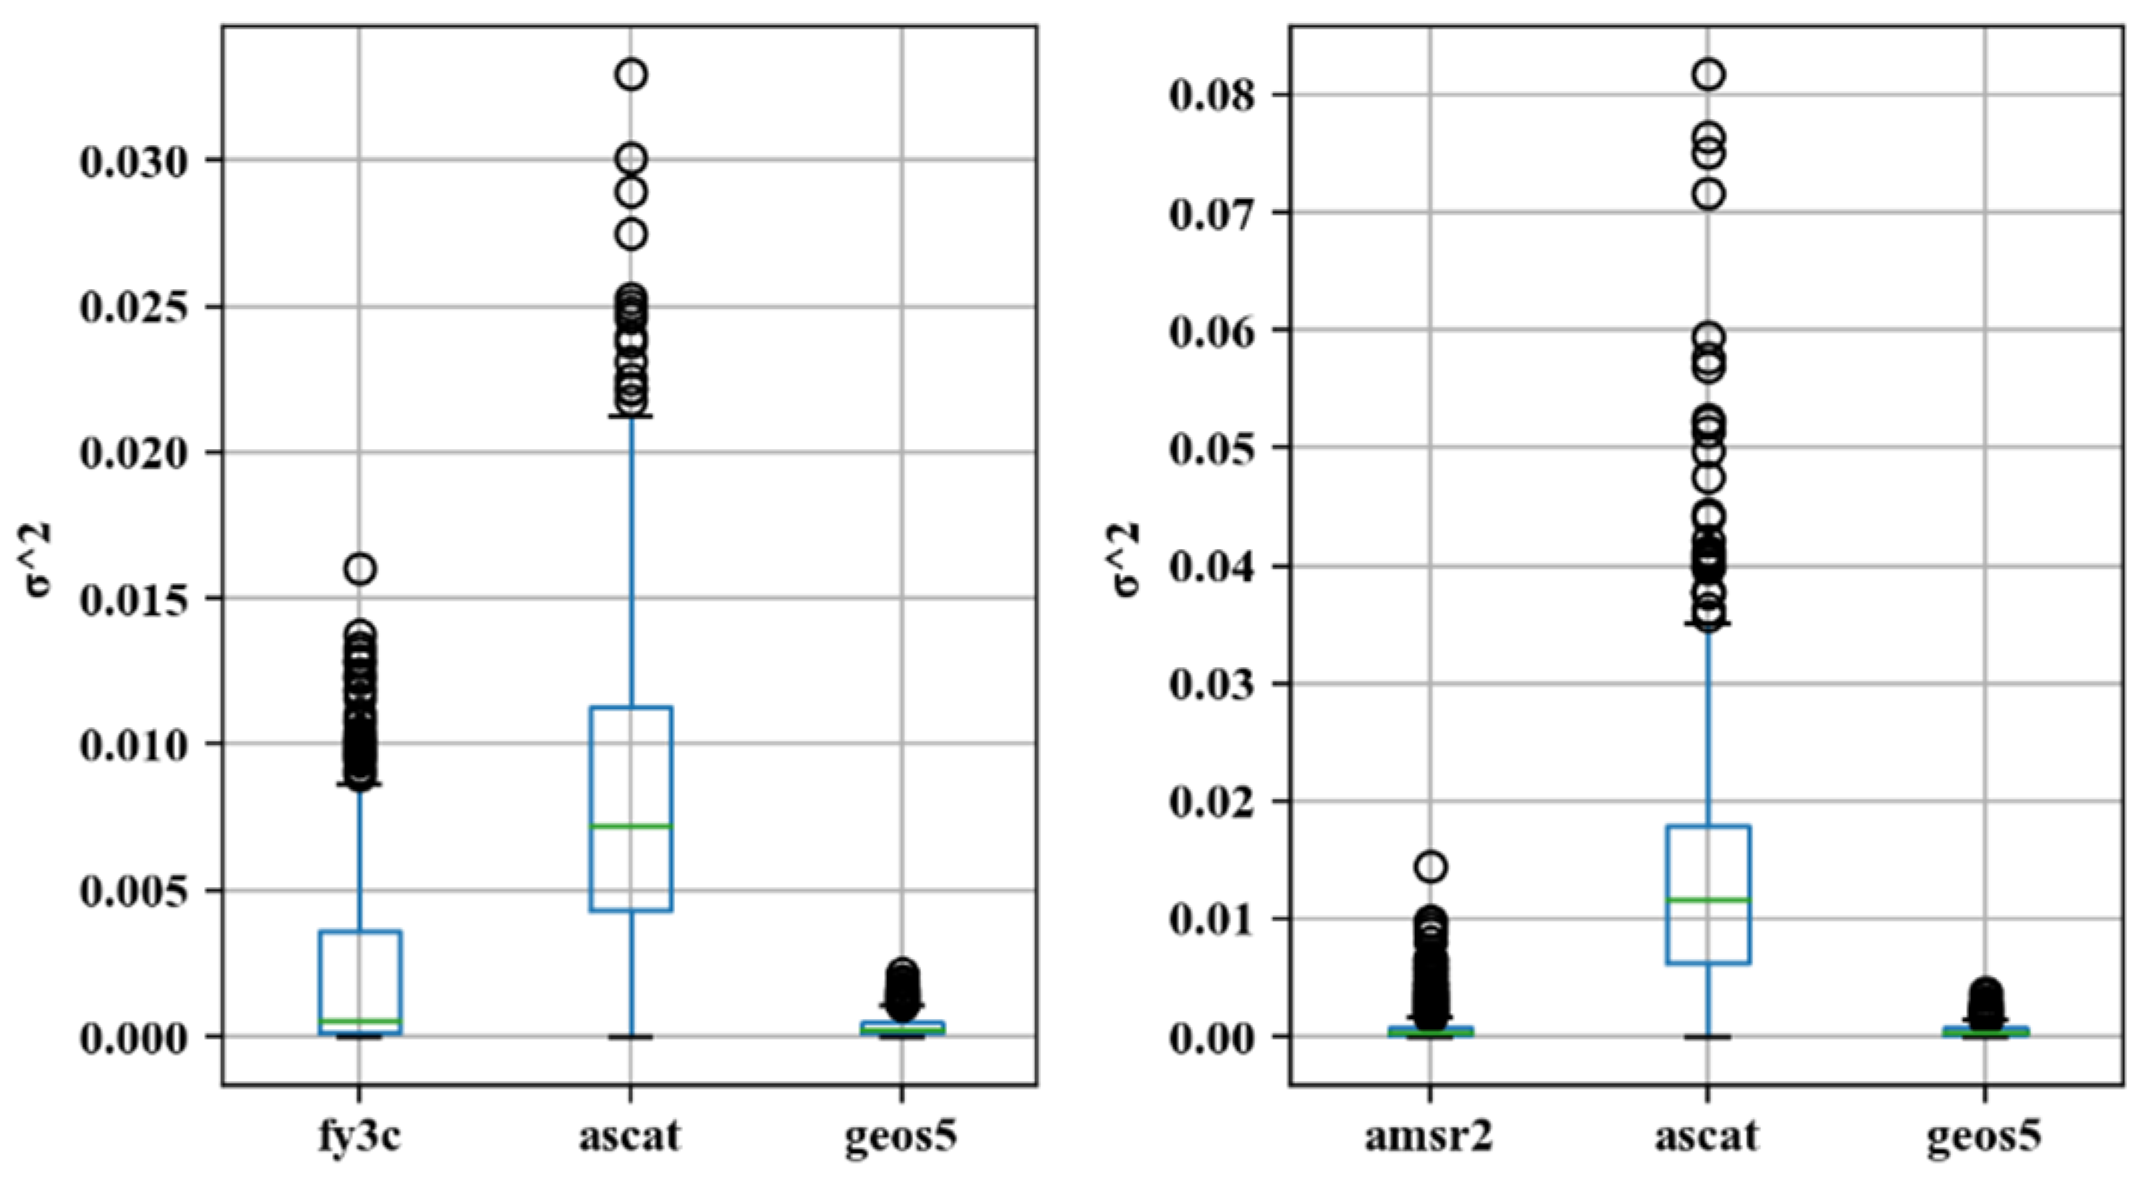
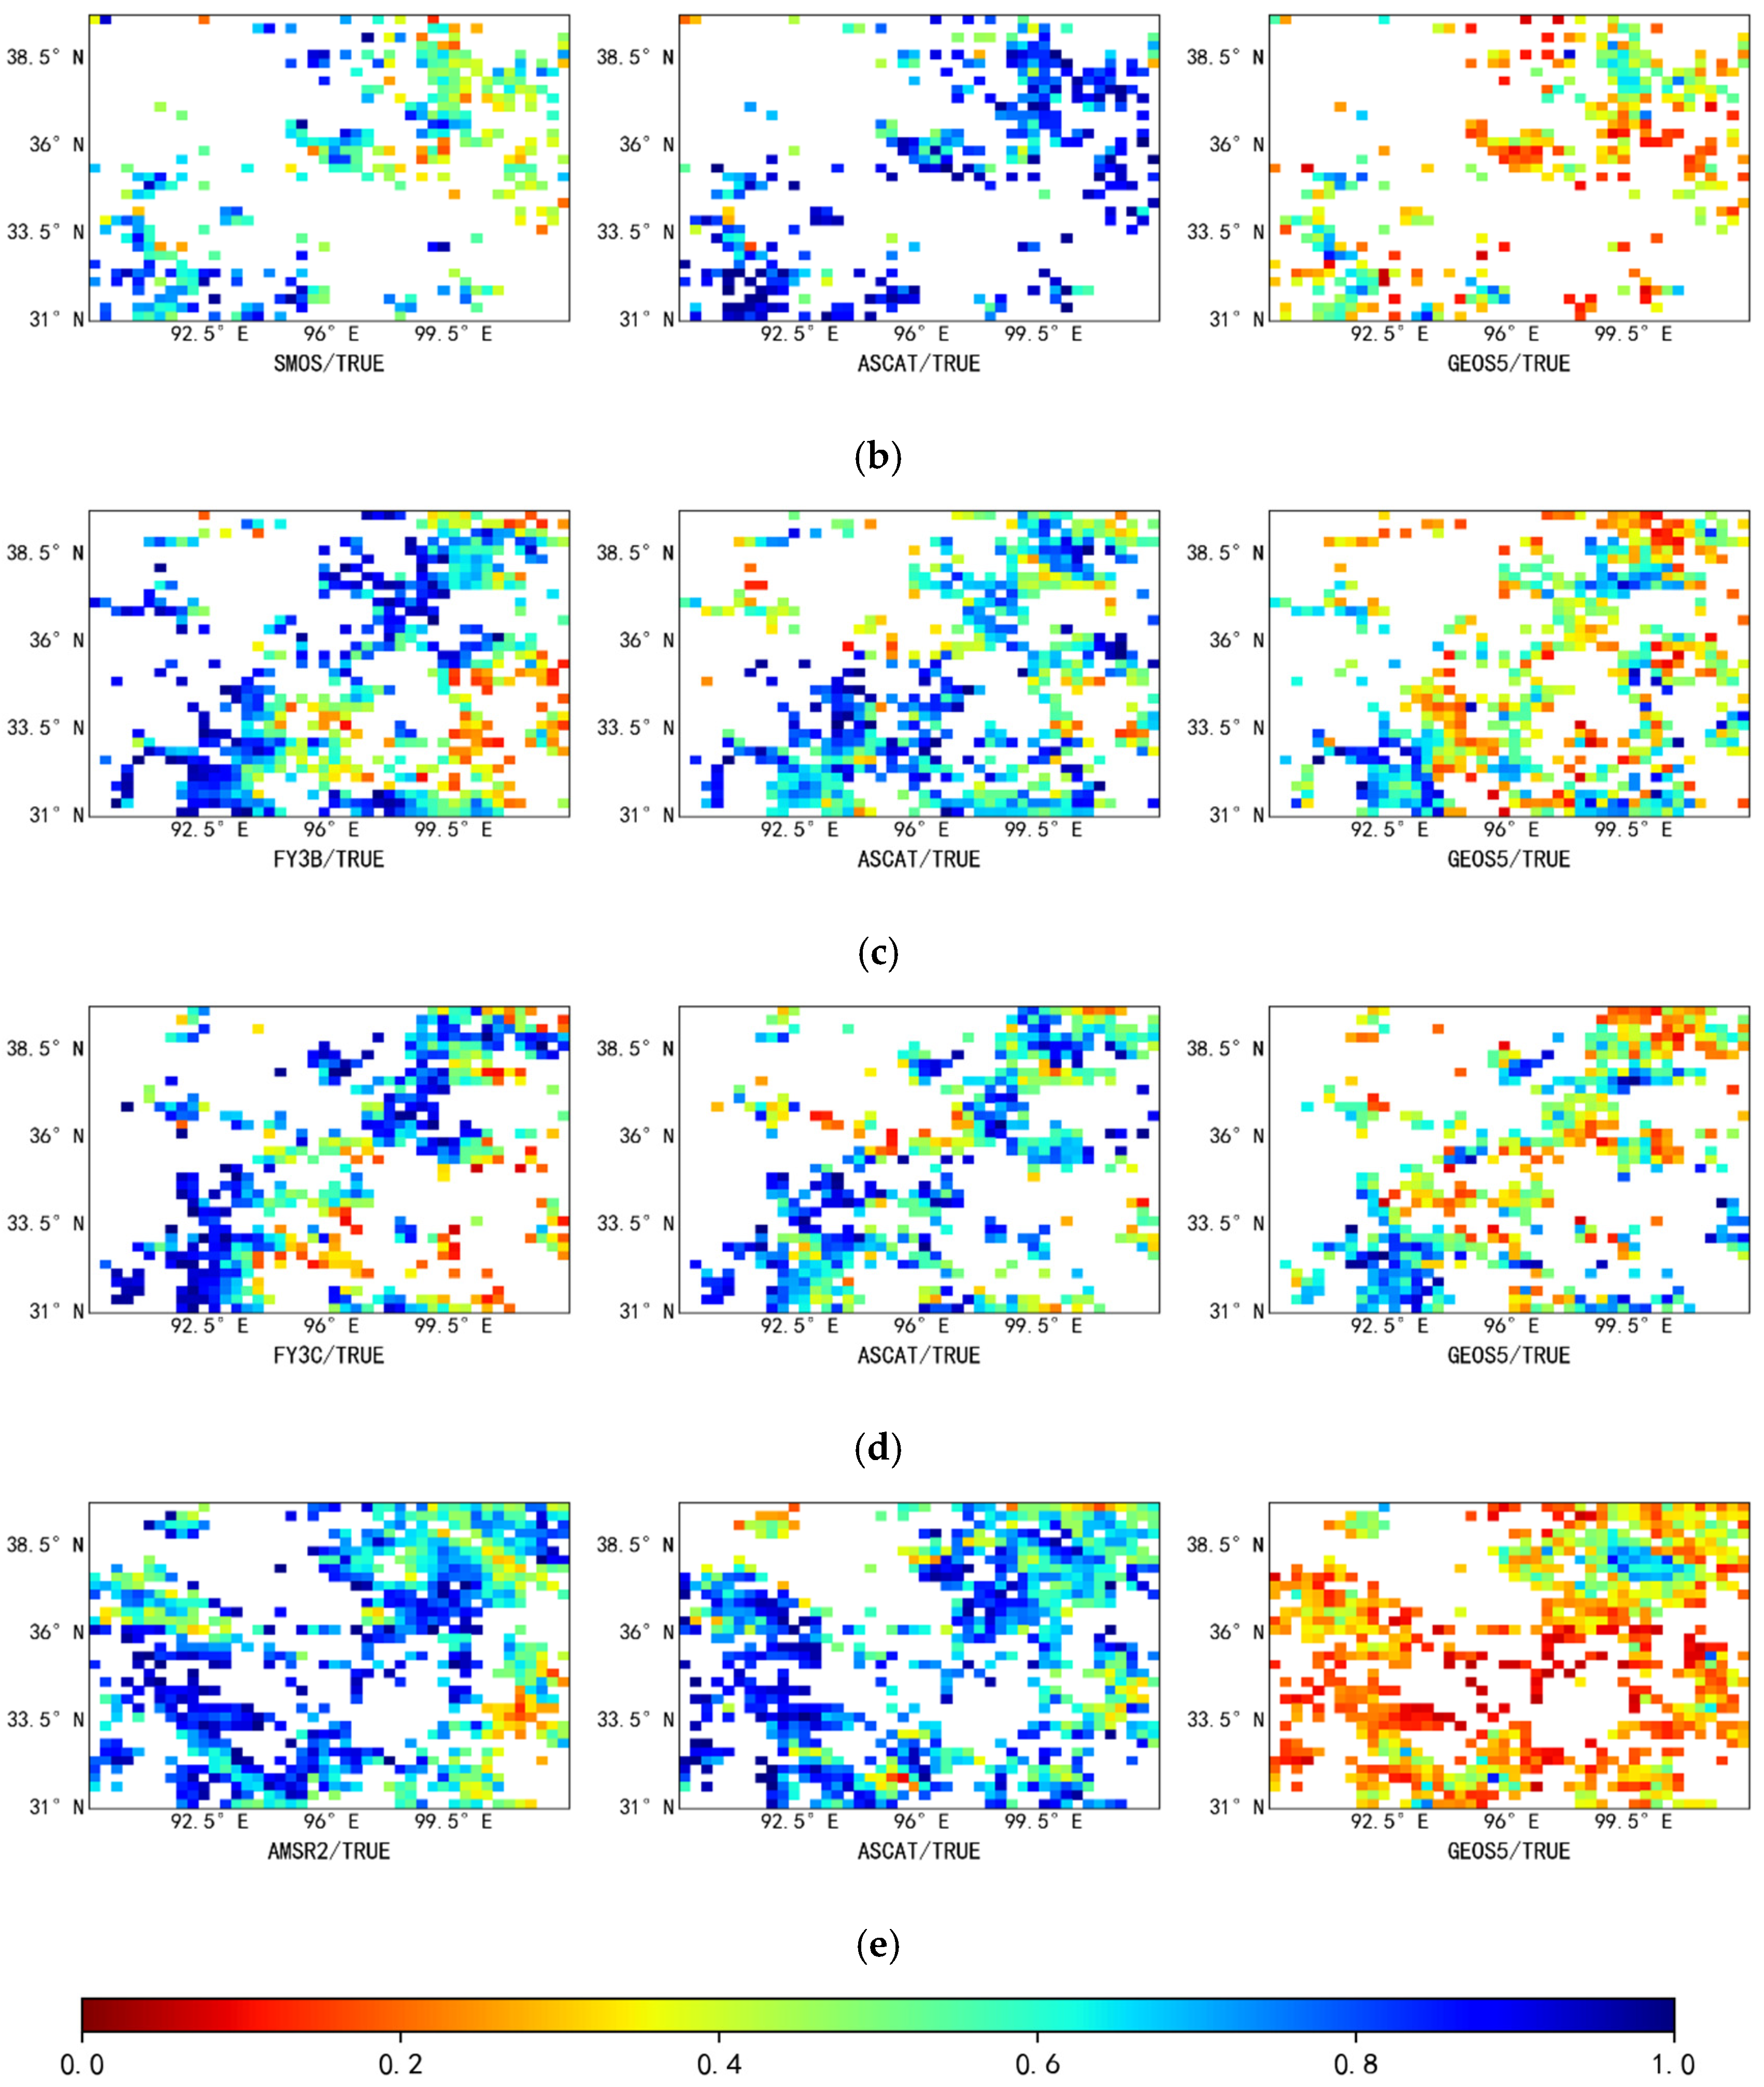
Figure 4 shows the spatial distribution of TC error variance for the passive products, active products, and reanalysis data. As shown in the figure, lower TC error variances are observed in the hinterland of the Qaidam Basin (yellow ellipse). This may be due to the fact that this region is the fifth-largest desert in China, with extremely low vegetation coverage, which may lead to large errors in the observed data between different types of products, strong negative correlation between different data sources, and a resultant low TC error variance in the region. Overall, the TC error variance of the SMAP passive product is lower, albeit with relatively high error TC variances in the central region. The TC error variance distributions of the FY3B, FY3C, and AMSR2 passive products are similar to each other, with the error variance increasing from the northwestern region to the southeastern region, that is, the error variance is larger in areas with higher vegetation coverage. In contrast, for the active product (ASCAT), regions with larger TC error variance are more scattered than for the passive products and are not limited to the southeastern region. Figure 5 shows tail box figures of the TC error variance. As can be seen from the figure, the TC error variance of the active product (ASCAT) is larger than those of the passive products SMAP, FY3B, FY3C, and AMSR2 and larger than that of the reanalysis data (GEOS5). Additionally, the TC error variance has a wider range and is more scattered for the active product compared to the SMAP, FY3B, FY3C, AMSR2, and GEOS5 products. The SMOS passive product is the only passive product for which both the median value and the range of the error variance are larger than those of ASCAT, which indirectly demonstrates that SMOS is not suitable for the estimation of soil moisture in the study area. The analysis of the above results is limited to areas for which TC results are available, and cannot explain the variance of soil moisture error in areas without TC results.
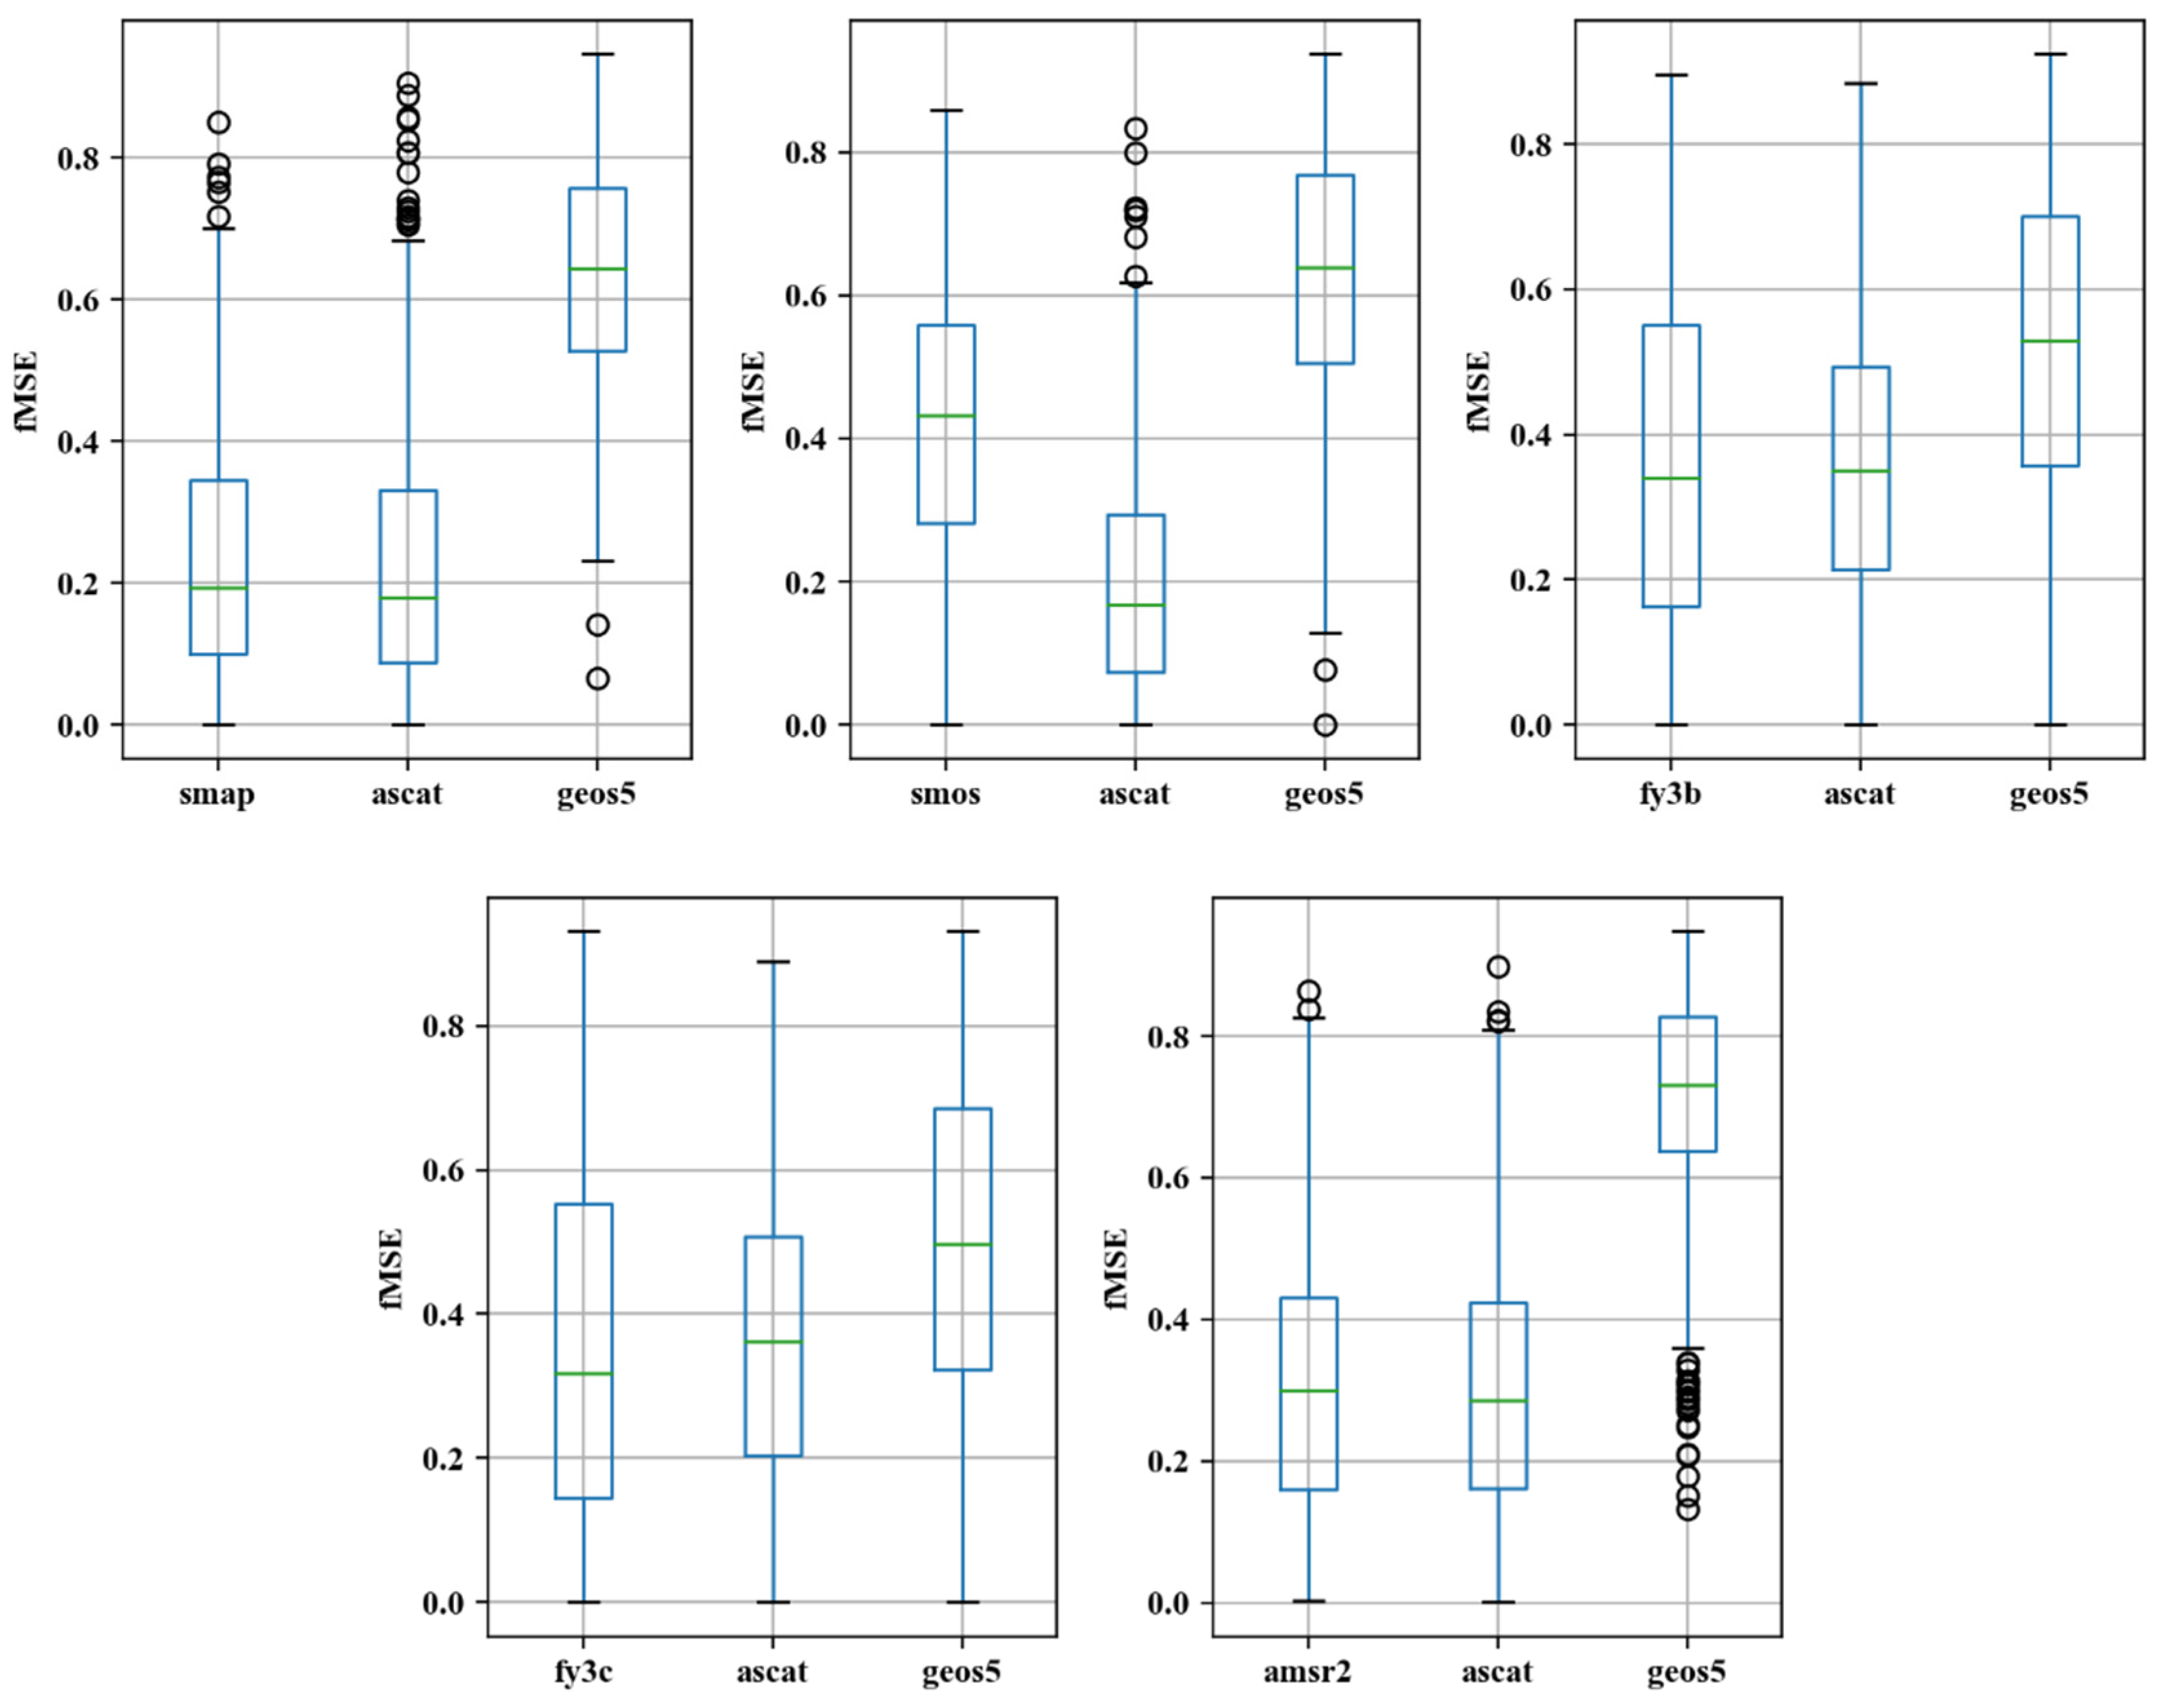
Figure 6 shows the spatial distribution of fMSE in the study area. From the figure, it can be seen that the fMSE data obtained by TC in [SMOS, ASCAT, GEOS5] are largely limited to the northeastern and southwestern corners of the study area and that the noise in the soil moisture data obtained from the SMOS passive data is significantly larger than that obtained using the ASCAT passive dataset. The spatial distribution of the fMSE for the four other passive data products are similar to each other, in that higher fMSE values are mostly observed in areas with extremely low vegetation coverage in the northeastern region and in areas with high vegetation coverage in the southeastern region, while lower fMSE values are observed in the southwestern region, which has moderate vegetation coverage. The spatial distribution of fMSE obtained using the active product (ASCAT) is similar to that obtained using the passive product, however larger fMSE values are more scattered than for the passive product. This can be explained by the fact that observation signals are significantly more noisy in the active product than in the passive products, which results in the more scattered distribution of fMSE in the active product. Additionally, it can be seen from Figure 7 that the fMSE for the GEOS5 reanalysis data is significantly larger than that for the active and passive data products (i.e., the noise is stronger), and that the median fMSEs for the SMAP, FY3B, FY3C, and AMSR2 data, respectively, are almost the same as the median fMSE for the ASCAT data.
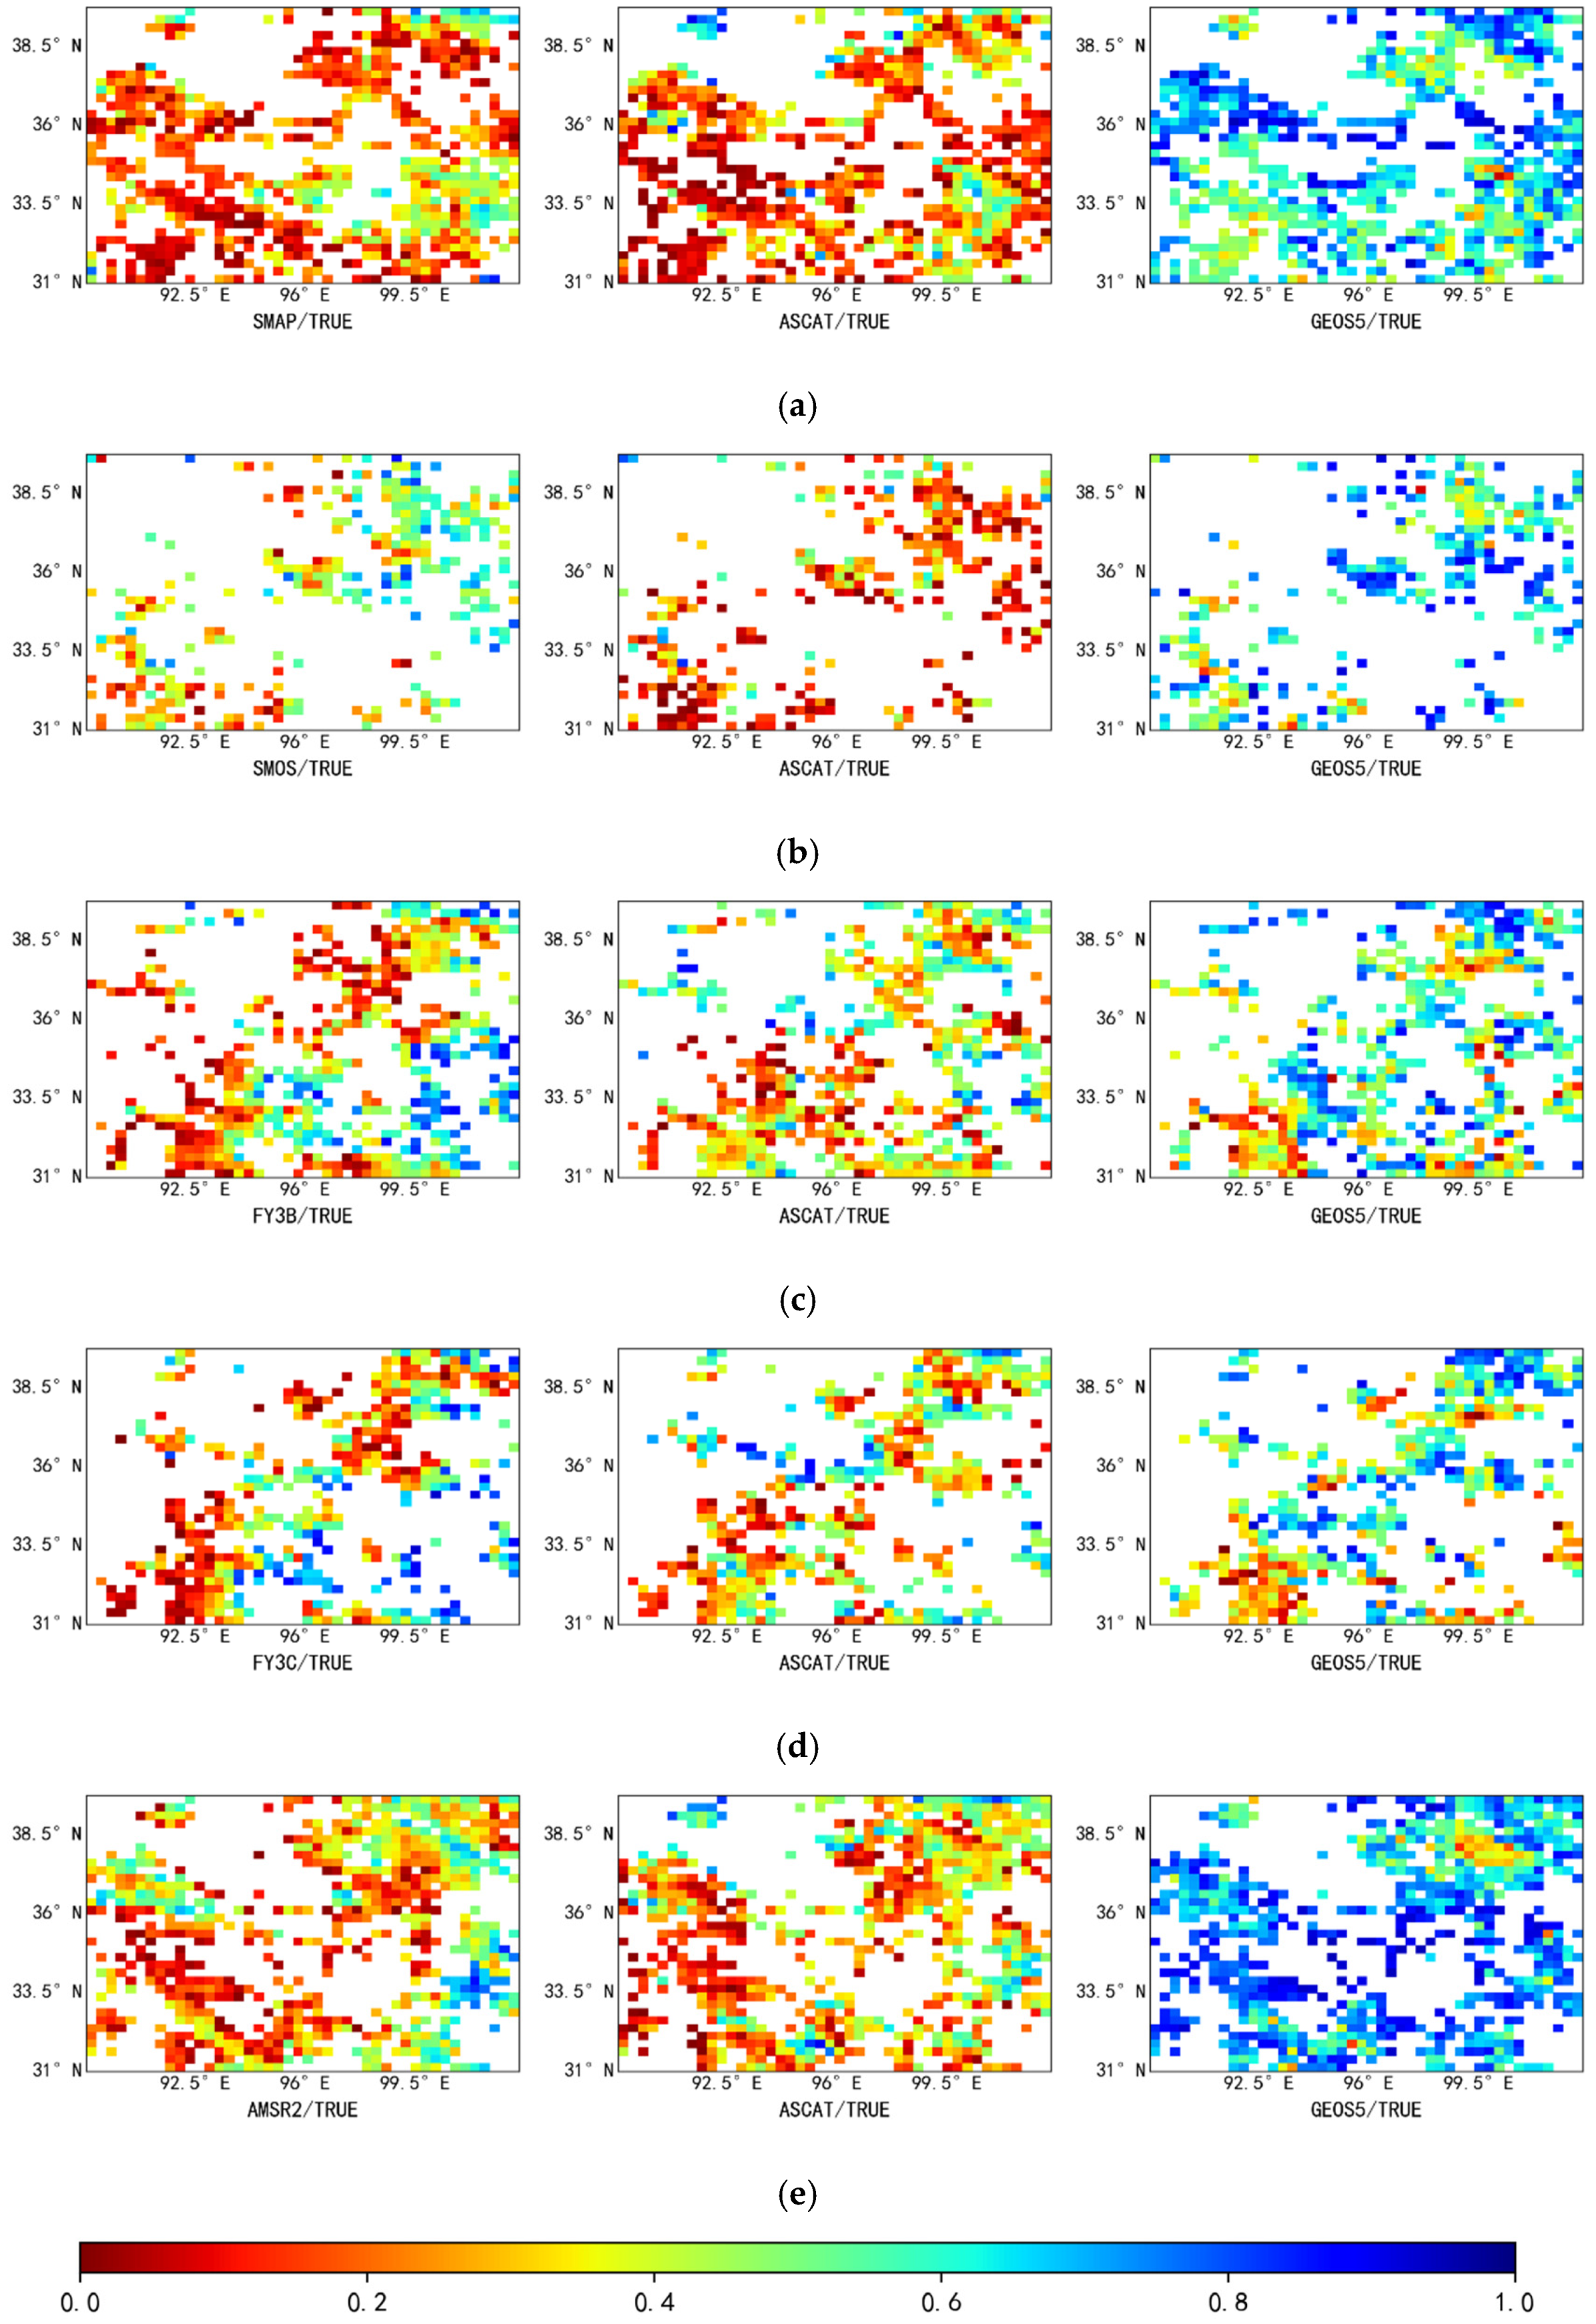
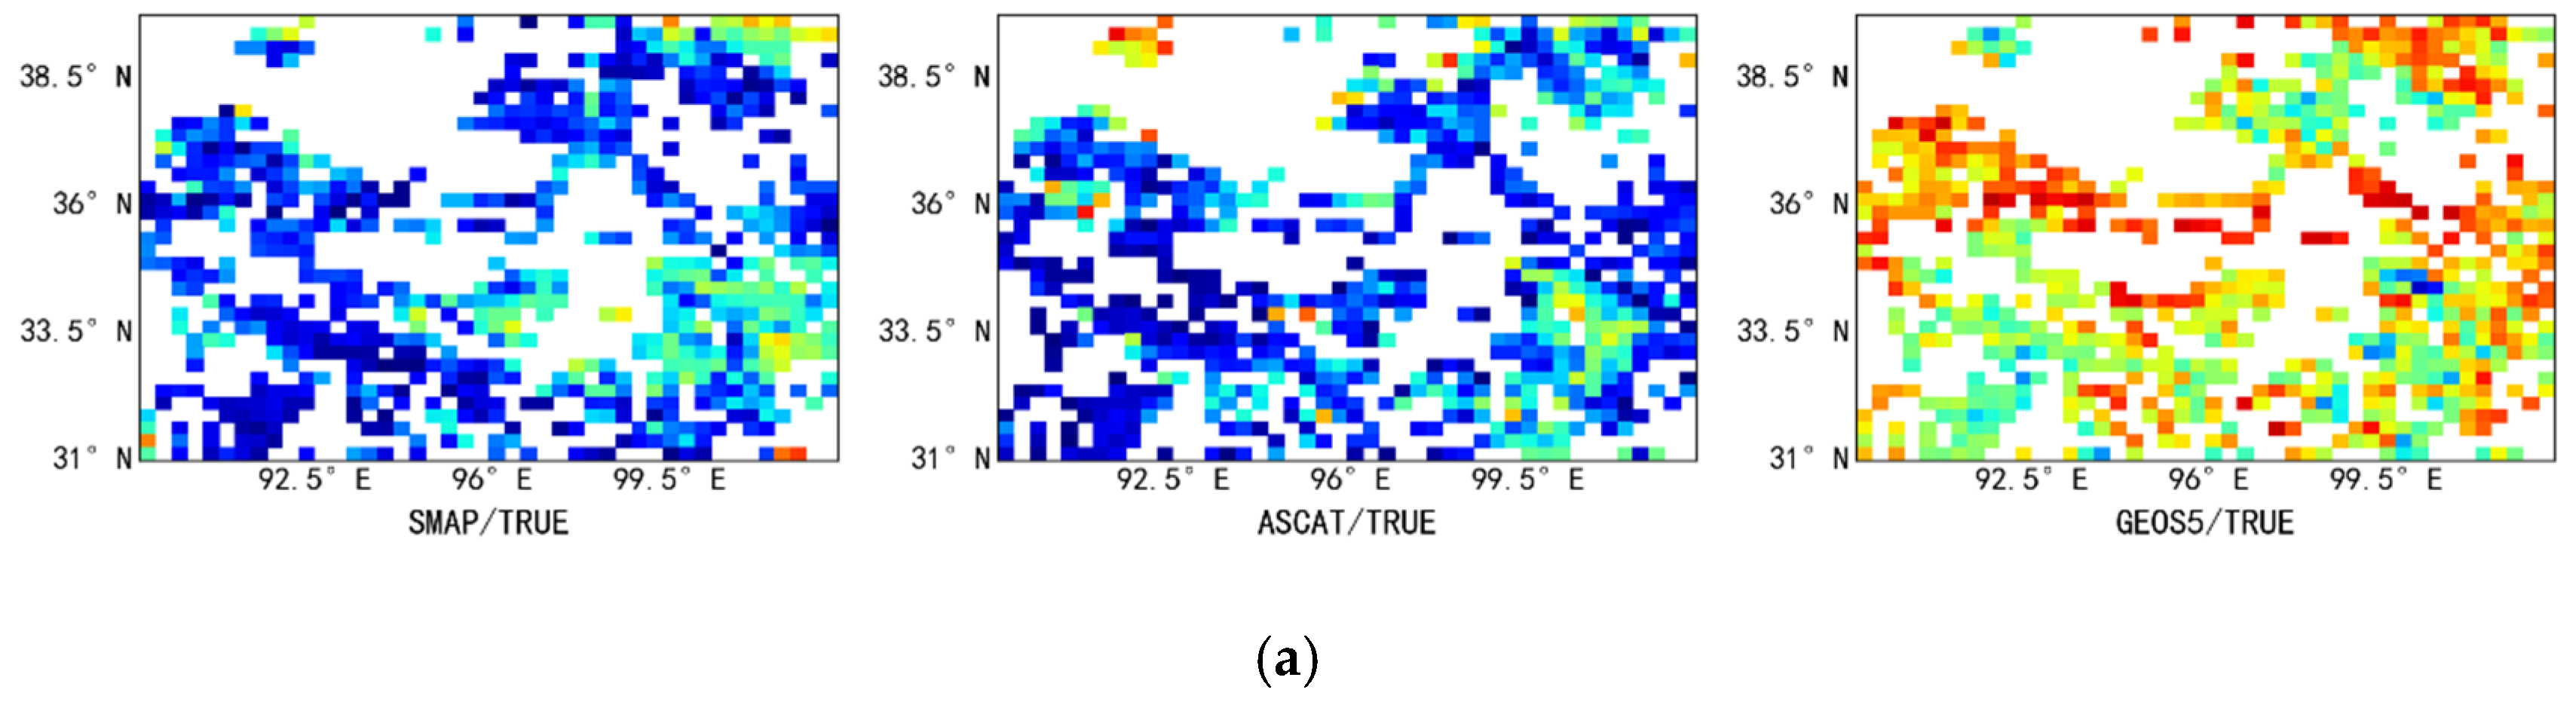
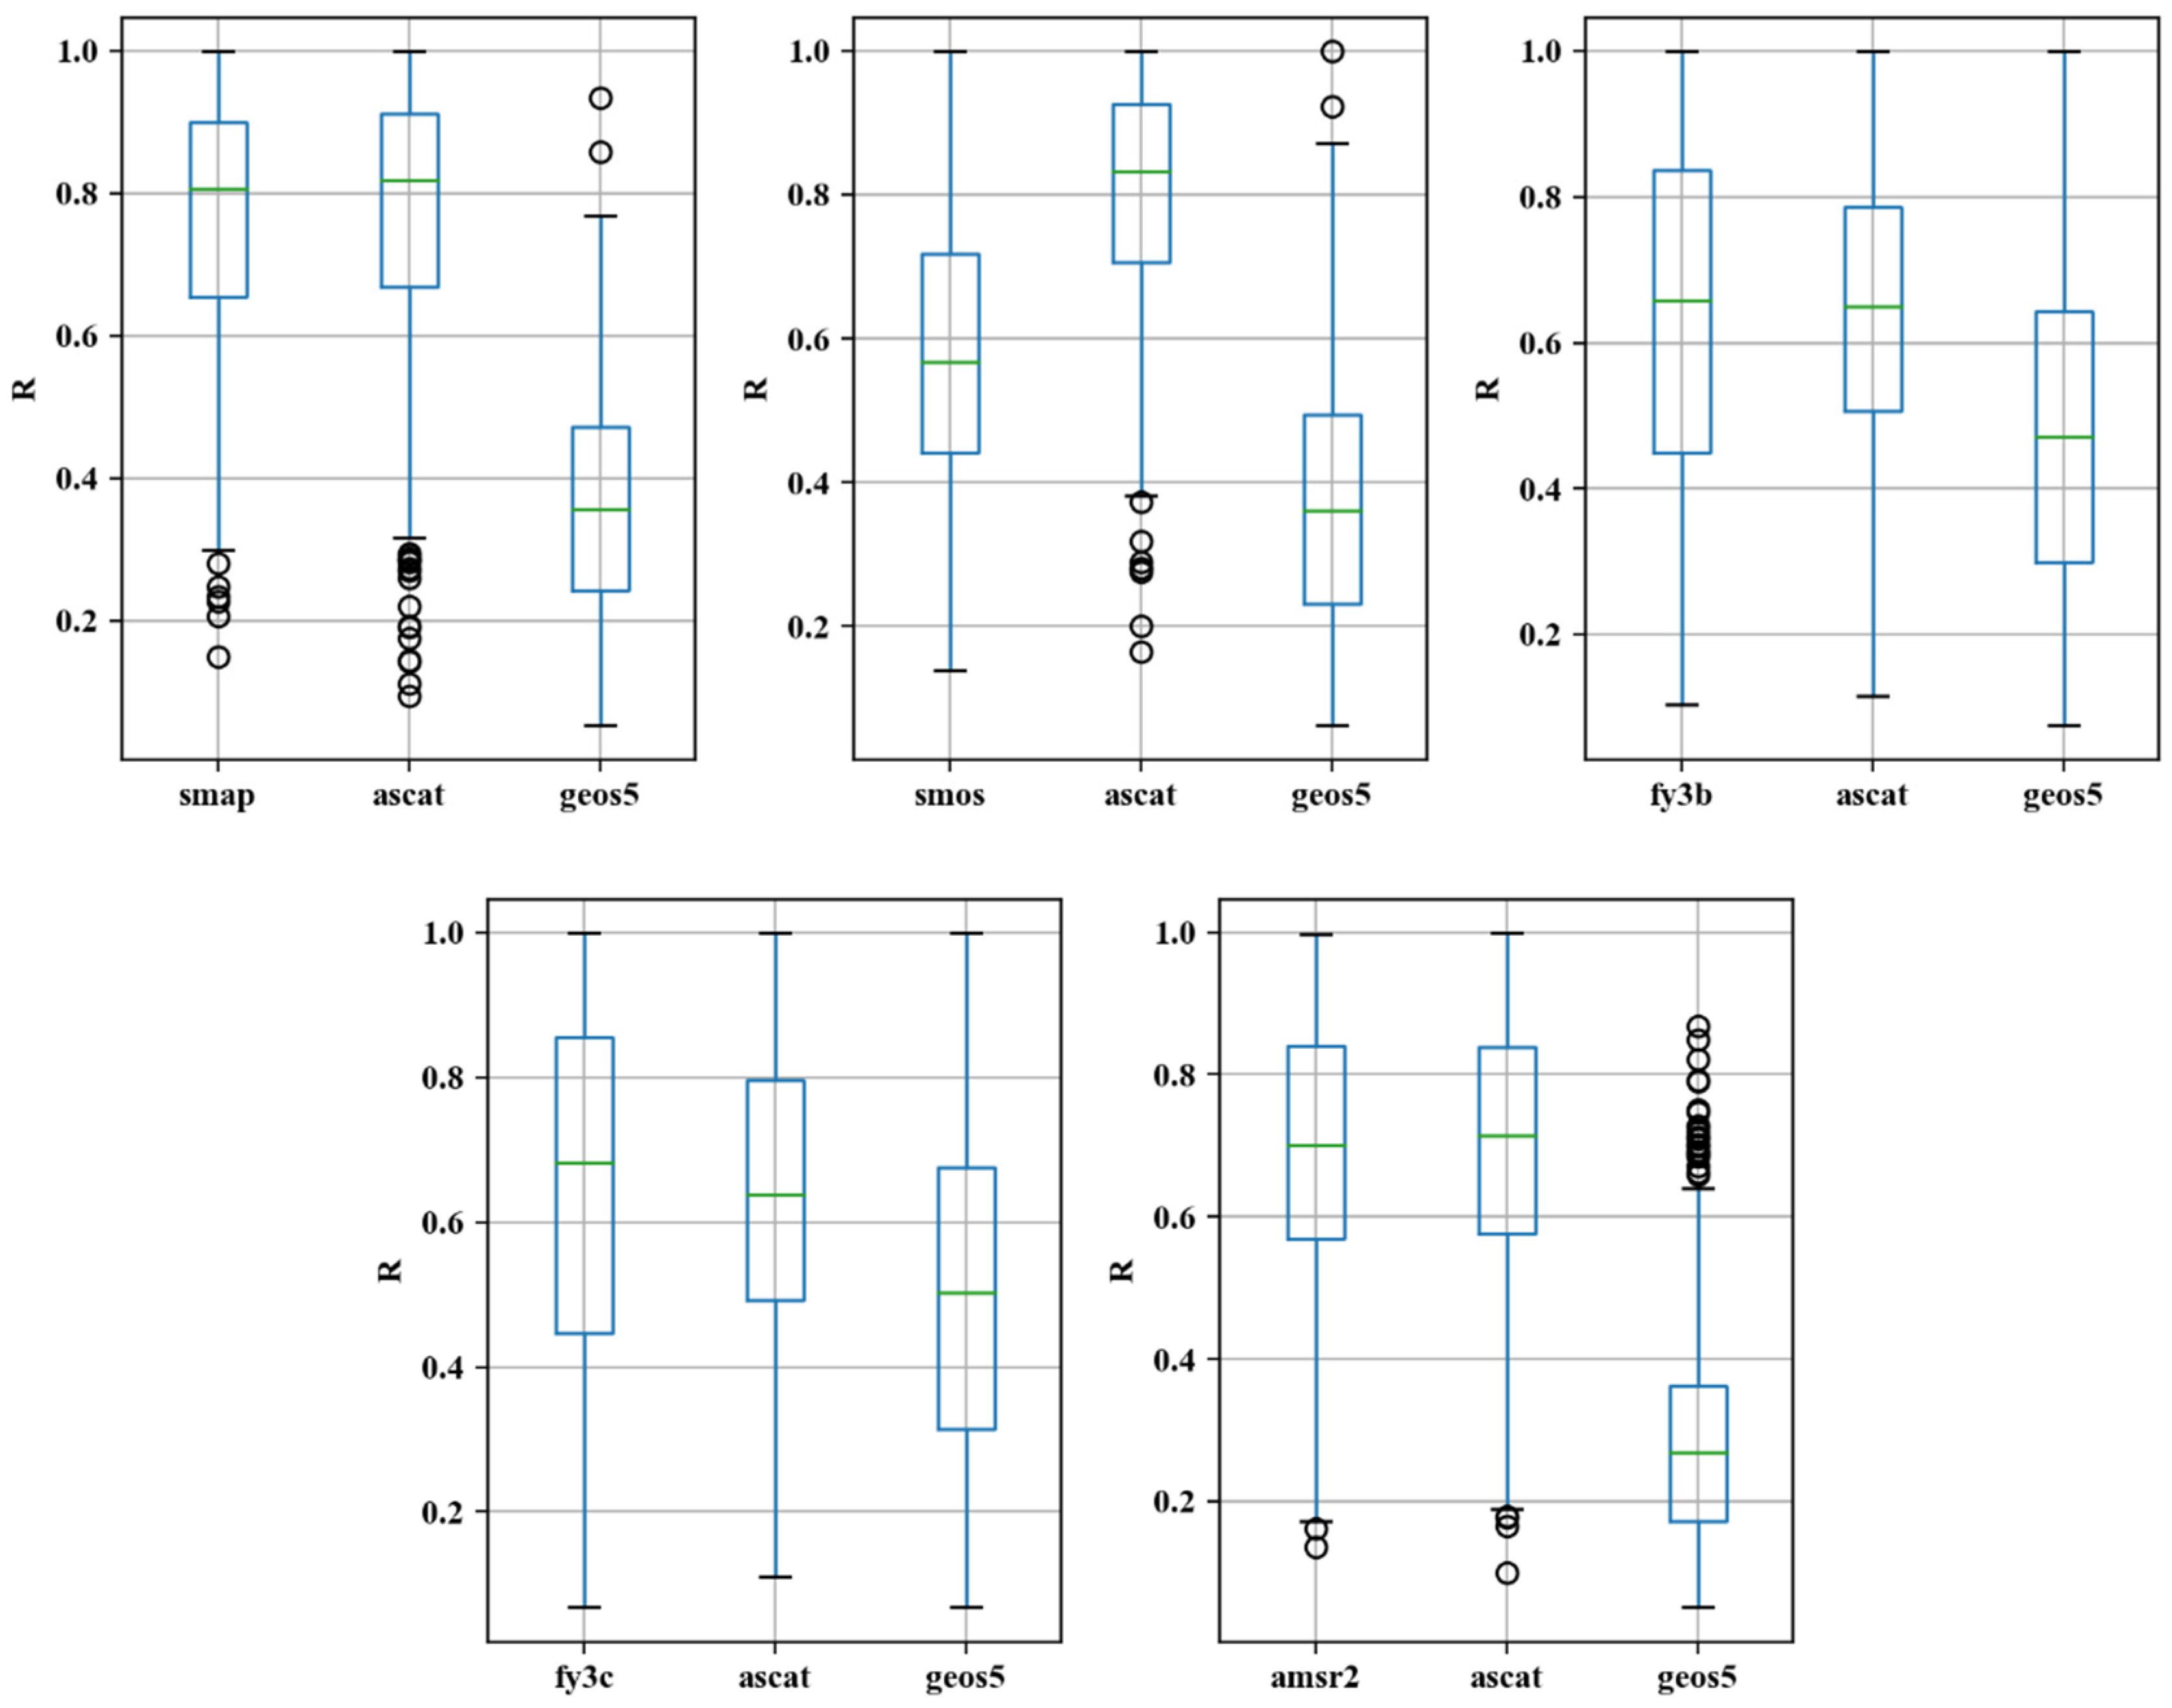
Figure 8 shows the spatial distribution of the correlation coefficient between the satellite-based soil moisture data and the ground-truth soil moisture data. As shown in the figure, the spatial distribution of the correlation coefficient between the active and passive products and ground-truth soil moisture is similar to the spatial distribution of fMSE (Figure 6), that is, lower correlation coefficients are observed in areas which have a higher fMSE. In particular, in areas with higher fMSE, such as the southeastern and northeastern regions (which have higher vegetation coverage), active and passive products have lower correlation coefficients, while significantly higher correlation coefficients are observed in the southwestern region (which has moderate vegetation coverage). For ASCAT data, the distribution of correlation coefficients is relatively scattered due to the effect of the scattered spatial distribution of fMSE, i.e., more surface noise leads to a lower correlation between satellite-derived soil moisture data and ground-truth soil moisture data. Figure 9 can also verify the above view, lower correlation coefficients have a higher fMSE(Figure 7).
3.3. Correlation between TC Results and Vegetation Coverage
The EVI is considered to reflect the characteristics of vegetation cover [24,25,26]. In view of the widespread application of passive soil moisture datasets in recent years, and the similarity in the spatial distributions of fMSE and correlation coefficient for the passive data, the error variance and correlation coefficient, respectively, of the soil moisture data obtained from the passive data products were selected to carry out correlation analysis with EVI data to observe the impact of vegetation coverage on the five passive soil moisture datasets.
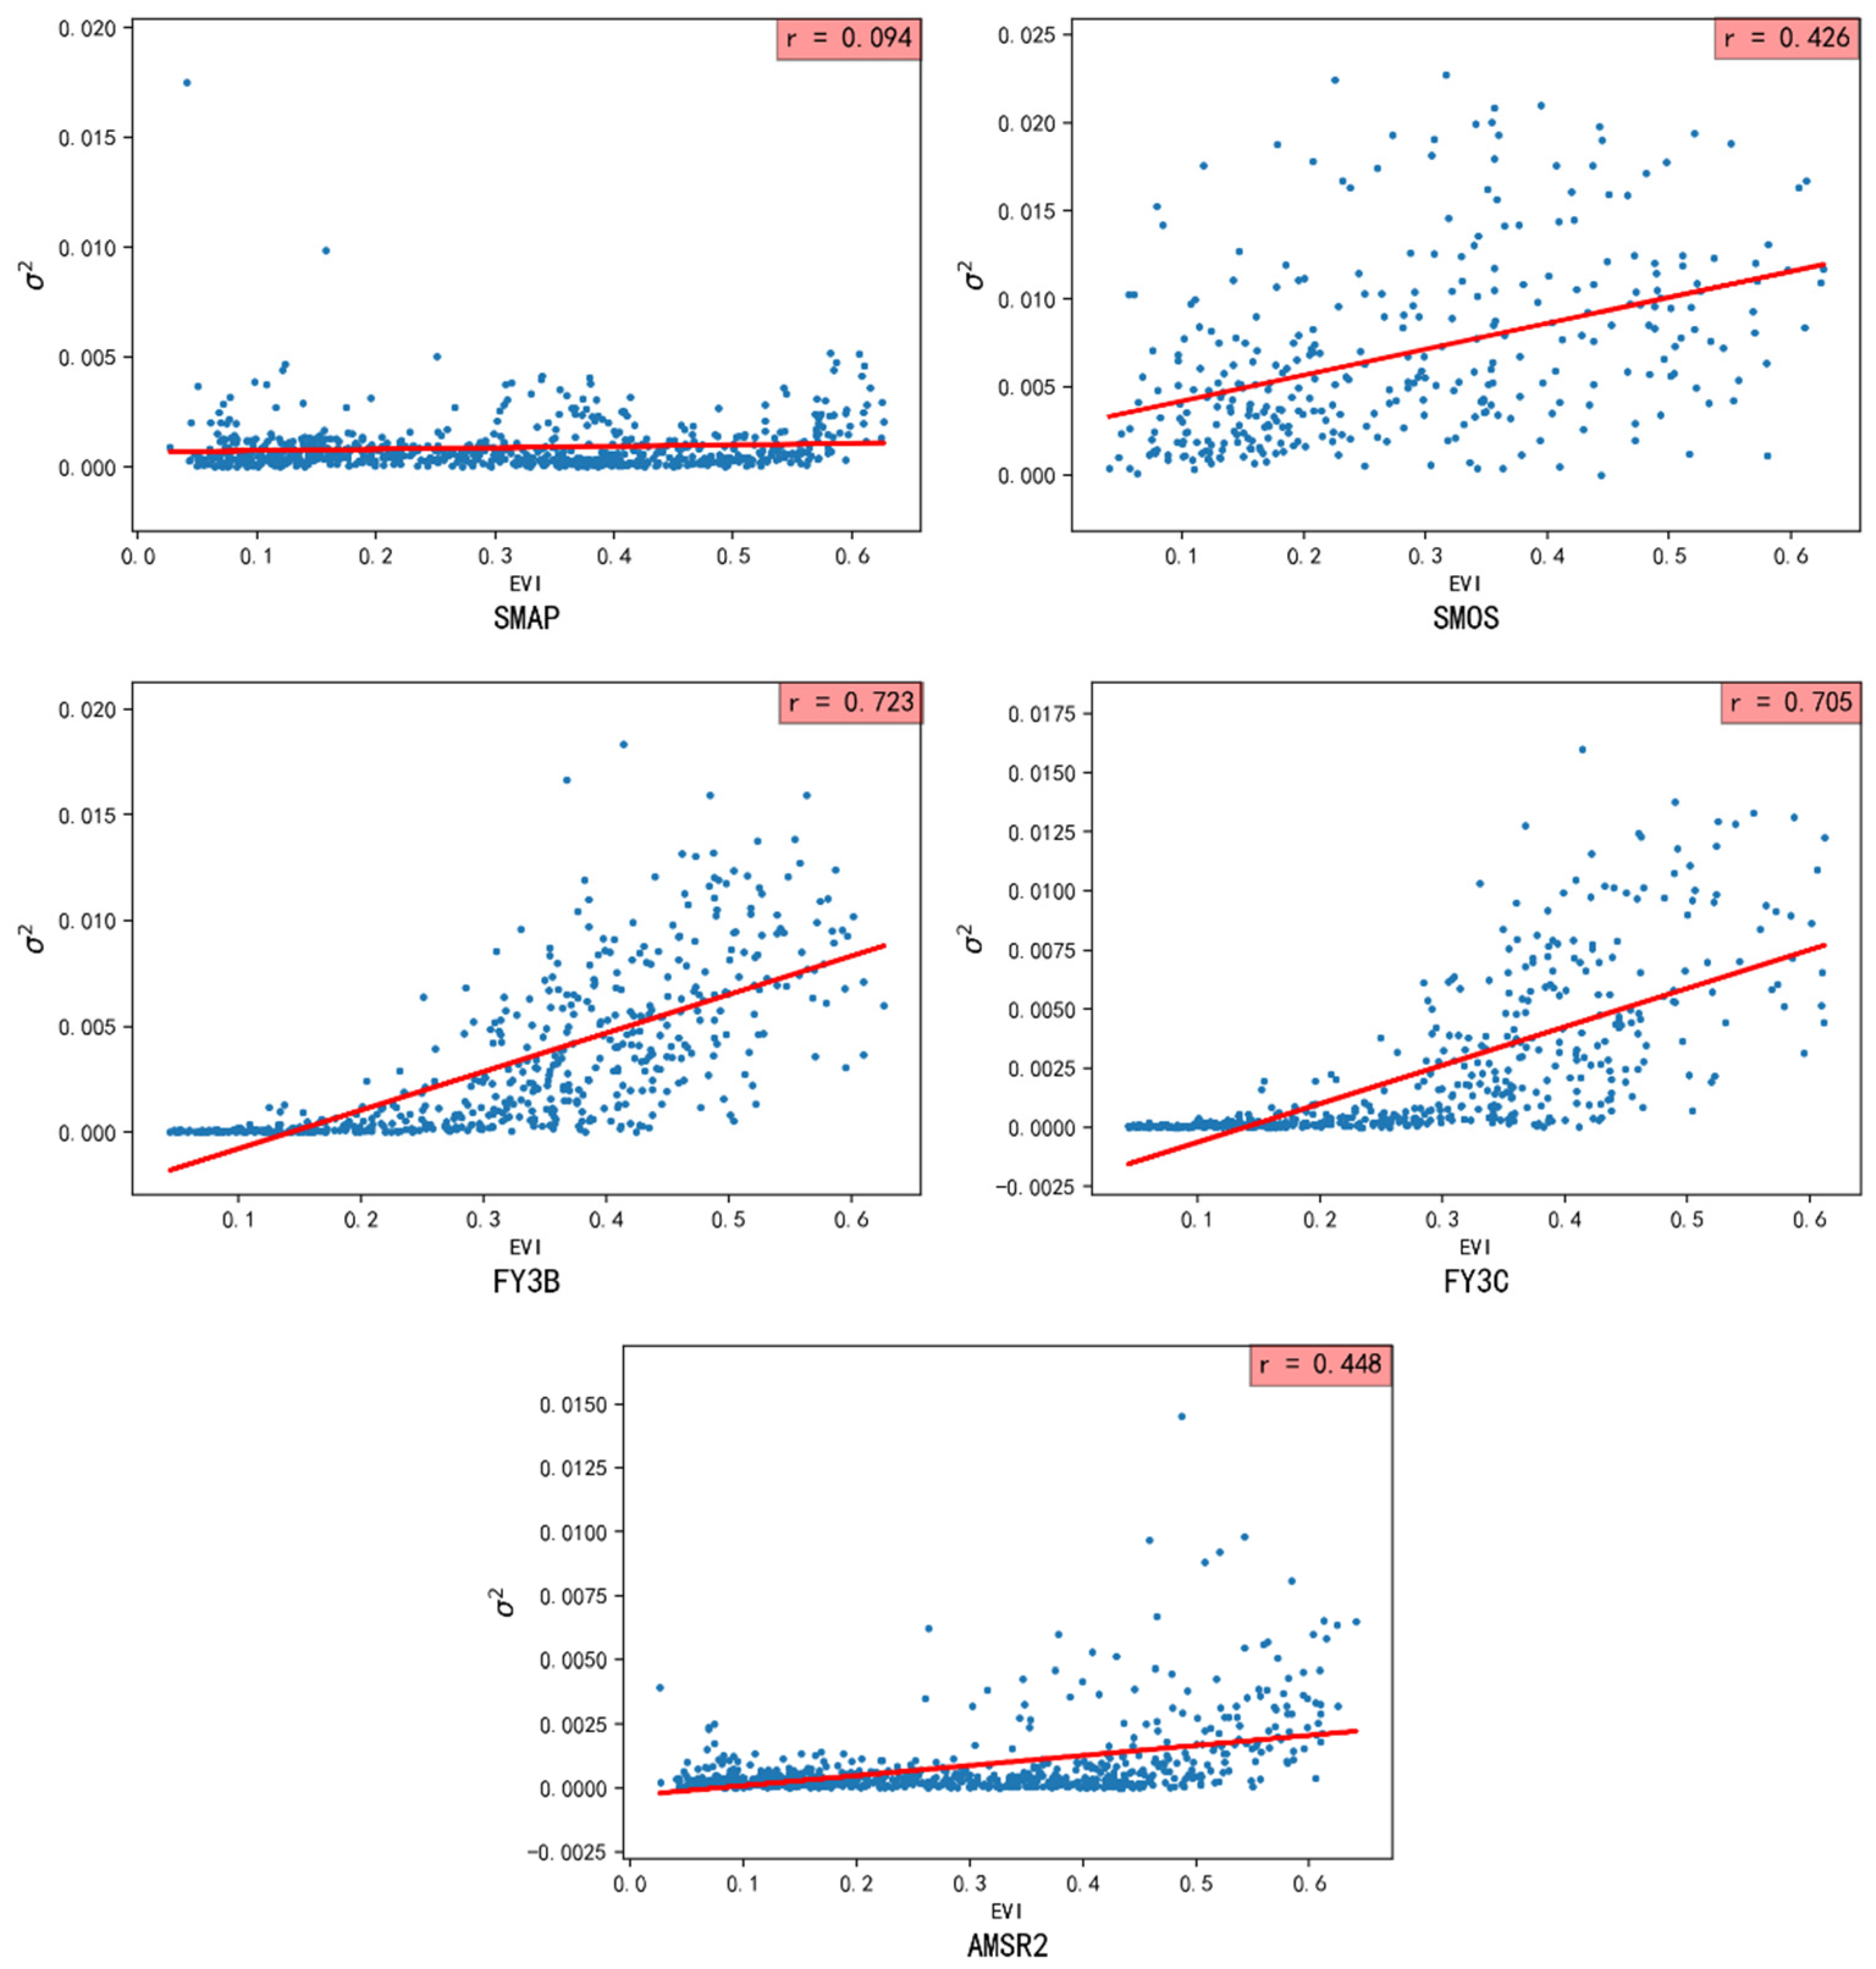
Figure 10 shows the correlation between the EVI data and the error variances of the five passive products (SMAP, SMOS, FY3B, FY3C, AMSR2). As shown in the figure, the weakest correlation coefficient (0.094) was observed between the error variance of SMAP and the EVI data, suggesting that the vegetation coverage has the least influence on the error variance of the SMAP soil moisture data. In contrast, the error variances of the other four passive products are positively correlated with the EVI data to a certain extent, suggesting that higher vegetation coverage leads to larger error variance. The correlation coefficients between the EVI data and the FY3B, FY3C, SMOS, and AMSR2 data are 0.723, 0.705, 0.426, and 0.448, respectively. As can be seen in Figure 10, the plot of the error variance of the SMOS data vs. EVI is relatively scattered, while those for the error variances of FY3B, FY3C, and AMSR2 vs. EVI are relatively concentrated when the EVI value is relatively small, and become relatively scattered with increasing EVI value, most notably for the FY3B and FY3C data.
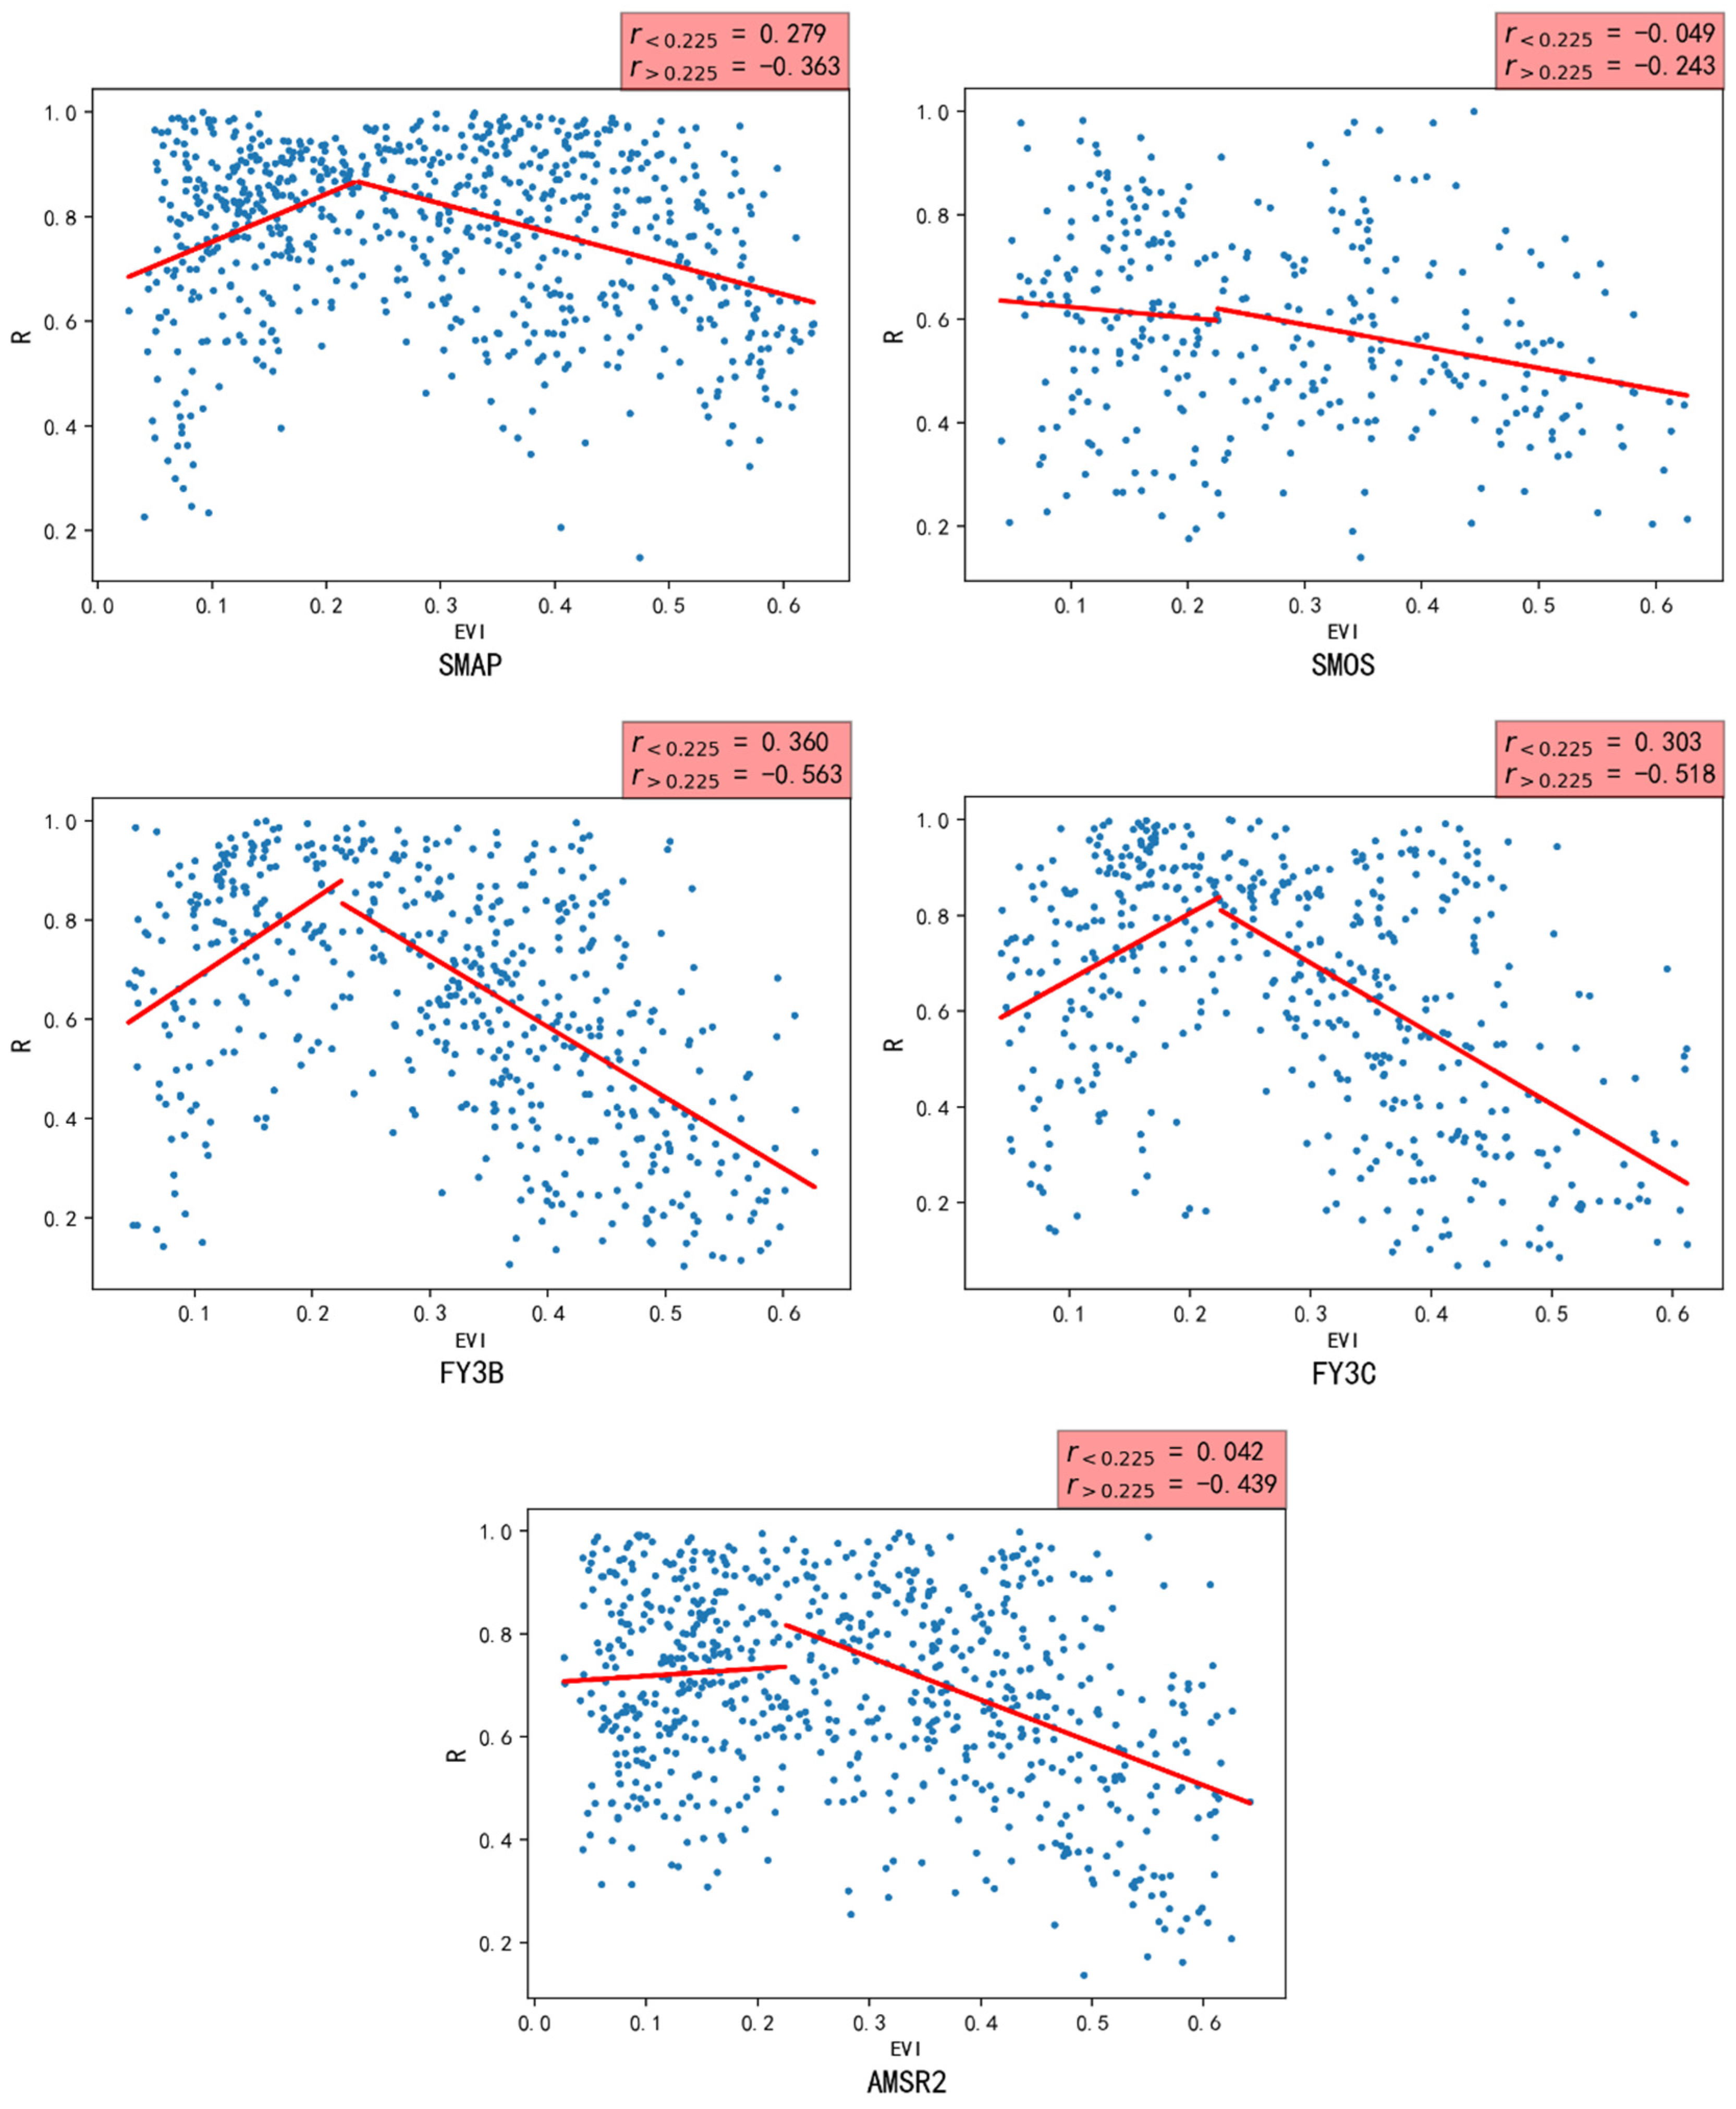
Figure 11 shows the correlations between the EVI data and the TC correlation coefficients (correlation between the passive data and the true soil moisture) for the SMAP, SMOS, FY3B, FY3C, and AMSR2 passive data. It was decided to divide the plots into two ranges, namely the EVI ranges of 0–0.225 and 0.225–1. As shown in Figure 11, for four out of the five passive soil moisture datasets, the TC correlation coefficients are positively correlated with EVI in the EVI range 0–0.225; the only exception is the SMOS dataset, whose TC correlation coefficients are negatively correlated with EVI in the EVI range 0–0.225. The correlation coefficients between the TC correlation coefficients and EVI are 0.279, 0.360, 0.303, and 0.042 for the SMAP, FY3B, FY3C, and AMSR2 datasets, respectively. In other words, in the EVI range of 0–0.225, the correlation between the SMAP, FY3B, and FY3C soil moisture data and the ground-truth soil moisture data increases with increasing EVI, while the EVI has little effect on the correlation between the SMOS and AMSR2 soil moisture data and the ground-truth soil moisture data in the same EVI range (0–0.225). For EVI values in the range 0.225–1, there is a negative correlation between the EVI data and the TC correlation coefficients for all five passive data products, namely −0.363 for SMAP, −0.243 for SMOS, −0.563 for FY3B, −0.518 for FY3C, and −0.439 for AMSR2. In other words, in this EVI range, the correlation between the satellite-derived soil moisture and the real value decreases with increasing EVI, that is, the data quality becomes worse. The soil moisture estimates based on FY3B and FY3C data are most affected by changes in EVI, while those based on SMOS are least affected.
From the above results, it can be seen that surfaces with very low vegetation coverage reduce the quality of soil moisture datasets obtained from passive remote sensing satellite data. Furthermore, microwave radiation is attenuated by vegetation on the soil surface, and microwave radiation from this vegetation introduces noise, which affects the accuracy of satellite-derived estimates of soil moisture [16]. The above results show that the TC method can be used to obtain more accurate estimates of the error variance of satellite-based soil moisture estimates and correlation estimation for the three kinds of soil moisture data analyzed in this study (passive, active, and reanalysis). However, it should be noted that the above analysis is limited to areas for which TC results are available, which may limit its application.
4. Conclusions
In this study, using the TC method, soil moisture data for Qinghai Province, China, derived from passive satellite data (SMAP, SMOS, FY3B, FY3C, and AMSR2), active satellite data (ASCAT), and reanalysis data (GEOS5) were analyzed to obtain error variance, fMSE, and the correlation between the satellite-based soil moisture estimates and the ground-truth soil moisture data. Subsequently, the resulting TC error variances and correlation coefficients were compared with satellite-derived EVI data. The following conclusions can be drawn: (1) EVI affects the TC results. In particular, areas with very low or very high EVI often have poor TC results or a complete lack of TC results; this can be attributed to the low positive correlation or negative correlation which is observed between the active and passive data products; (2) For active satellite products, the TC error variance is substantially larger than that for passive satellite products and reanalysis data, and the spatial distribution of the TC error variance that has a relatively large magnitude is more scattered; (3) the results of the TC analysis suggest that fMSE and the correlation coefficient between satellite-based and ground-truth soil moisture have similar spatial distributions in the study area, that is, the correlation is usually low in areas with high fMSE; (4) the fMSE and correlation coefficients between satellite-based and ground-truth soil moisture are significantly worse for the reanalysis data (GEOS5) than for the active and passive products, while the same parameters are similar for the active product (ASCAT) and the SMAP, FY3B, FY3C, and AMSR2 passive products in terms of numerical range and spatial distribution; this shows that the results of the TC analysis are reliable and objective; (5) the SMOS passive product is less applicable for the estimation of soil moisture in the study area than the other four passive products. This is mainly due to the fact that SMOS-derived estimates of soil moisture are lacking in Qaidam Basin, and that the TC-derived fMSE and correlation coefficient between satellite-derived and ground-truth soil moisture are significantly smaller than for the active product (ASCAT).
It should be noted that the aforementioned analysis is only applicable to areas for which TC results are available. Additionally, the observation time differs between different remote sensing data, and the associated soil depths are different, which might impact the TC results. Furthermore, some previous studies showed that the errors between active and passive satellite datasets are not completely independent, which will also have some adverse effects on the test results. Moreover, the TC method takes each independent spatial unit as the calculation unit, which means that the correlation between different spatial units often cannot be determined. Lastly, in this study, EVI data was scaled-up to the spatial resolution of GEOS5 by averaging, thus ignoring a large amount of detailed information and reducing the accuracy and credibility of the EVI data. Our future work will focus on how to improve the TC method to better verify the applicability of the satellite-derived soil moisture database.
Author Contributions
A.L. conceived the study. H.Z. and Z.Z. performed the data analysis and wrote the paper. A.L. read and edited the manuscript. All authors have read and agreed to the published version of the manuscript.
Funding
This research was funded the National Natural Science Foundation of China (41671026), the Important Science & Technology Specific Projects of Qinghai Province (2019-SF-A4-1) and the National Natural Science Foundation of Qinghai Province (2019-ZJ-7020).
Acknowledgments
We are very grateful to the teams at NASA, JAXA, ECMWF, and CIMISS who have made their datasets available and ready to use.
Conflicts of Interest
The authors declare no conflicts of interest.
References
- McColl, K.A.; Alemohammad, S.H.; Akbar, R.; Konings, A.G.; Yueh, S.; Entekhabi, D. The global distribution and dynamics of surface soil moisture. Nat. Geosci. 2017, 10, 100–104. [Google Scholar] [CrossRef]
- Fiifi, D.; Hagan, T.; Parinussa, R.M.; Wang, G. An Evaluation of Soil Moisture Anomalies from Global Model-Based Datasets over the People’s Republic of China. Water 2020, 12, 117. [Google Scholar]
- Manzoni, S.; Schimel, J.P.; Barbara, S. Responses of soil microbial communities to water stress: Results from a Responses of soil microbial communities to water stress: Results from a meta-analysis. Ecology 2017, 93, 930–938. [Google Scholar] [CrossRef] [PubMed]
- Porporato, A.; D’odorico, P.; Laio, F.; Rodriguez-Iturbe, I. Hydrologic Controls on Soil Carbon and nitrogen cycles. Adv. Water Resour. 2016, 26, 45–58. [Google Scholar] [CrossRef]
- Rosenzweig, C.; Tubiello, F.N.; Goldberg, R.; Mills, E.; Bloomfield, J. Increased crop damage in the US from excess precipitation under climate change. Glob. Environ. Chang. 2002, 12, 197–202. [Google Scholar] [CrossRef] [Green Version]
- Fécan, F.; Marticorena, B.; Bergametti, G. Parametrization of the increase of the aeolian erosion threshold wind friction velocity due to soil moisture for arid and semi-arid areas. Ann. Geophys. 1998, 17, 149–157. [Google Scholar] [CrossRef] [Green Version]
- Bomblies, A.; Eltahir, E.A.B. Assessment of the impact of climate shifts on malaria transmission in the Sahel. Ecohealth 2009, 6, 426–437. [Google Scholar] [CrossRef]
- Qiu, J.; Crow, W.T.; Nearing, G.S. The impact of vertical measurement depth on the information content of soil moisture for latent heat flux estimation. J. Hydrometeorol. 2016, 17, 2419–2430. [Google Scholar] [CrossRef]
- Lu, X.D. Methods of soil moisture meteorological observation are introduced. Agric. Technol. 2018, 38, 151–153. [Google Scholar]
- Su, C.-H.; Ryu, D.; Crow, W.T. Beyond triple collocation: Applications to soil moisture monitoring. J. Geophys. Res. Atmos. 2014, 19, 6419–6439. [Google Scholar] [CrossRef]
- McColl, K.A.; Vogelzang, J.; Konings, A.G.; Entekhabi, D.; Piles, M.; Stoffelen, A. Extended triple collocation: Estimating errors and correlation coefficients with respect to an unknown target. Geophys. Res. Lett. 2014, 41, 6229–6236. [Google Scholar] [CrossRef] [Green Version]
- Stoffelen, A. Toward the true near-surface wind speed: Error modeling and calibration using triple collocation. J. Geophys. Res. C Ocean. 1998, 103, 7755–7766. [Google Scholar] [CrossRef]
- Scipal, K.; Holmes, T.; De Jeu, R.; Naeimi, V.; Wagner, W. A possible solution for the problem of estimating the error structure of global soil moisture data sets. Geophys. Res. Lett. 2008, 35, 2–5. [Google Scholar] [CrossRef] [Green Version]
- Chen, F.; Crow, W.T.; Bindlish, R.; Colliander, A.; Burgin, M.S.; Asanuma, J.; Aida, K. Global-scale evaluation of SMAP, SMOS and ASCAT soil moisture products using triple collocation. Remote Sens. Environ. 2018, 214, 1–13. [Google Scholar] [CrossRef]
- Gruber, A.; Su, C.-H.; Zwieback, S.; Crow, W.; Dorigo, W.; Wagner, W. Recent advances in (soil moisture) triple collocation analysis. Int. J. Appl. Earth Obs. Geoinf. 2016, 45, 200–211. [Google Scholar] [CrossRef]
- Dong, J.; Crow, W.T. An Improved Triple Collocation Analysis Algorithm for Decomposing Autocorrelated and White Soil Moisture Retrieval Errors. J. Geophys. Res. Atmos. 2017, 122, 13081–13094. [Google Scholar] [CrossRef] [Green Version]
- Wu, K.; Shu, H.; Nie, L.; Jiao, Z.H. Error analysis of soil moisture based on Triple Collocation method. Remote Sens. Land Resour. 2018, 30, 68–75. [Google Scholar]
- Medeiros, J. Design and Development of the SMAP Microwave Radiometer Electronics. 2019; pp. 1–17. Available online: http://ntrs.nasa.gov/search.jsp?R=20140005426 (accessed on 30 April 2020).
- Kerr, Y.H.; Waldteufel, P.; Wigneron, J.P.; Delwart, S.; Cabot, F.; Boutin, J.; Escorihuela, M.J.; Font, J.; Reul, N.; Gruhier, C.; et al. The SMOS L: New tool for monitoring key elements ofthe global water cycle. Proc. IEEE 2010, 98, 666–687. [Google Scholar] [CrossRef] [Green Version]
- Zabolotskikh, E.V.; Mitnik, L.M.; Chapron, B. New approach for severe marine weather study using satellite passive microwave sensing. Geophys. Res. Lett. 2013, 40, 3347–3350. [Google Scholar] [CrossRef] [Green Version]
- Ducharne, A.; Koster, R.D.; Suarez, M.J.; Stieglitz, M.; Kumar, P. A catchment-based approach to modeling land surface processes in a general circulation model 2. Parameter estimation and model demonstration. J. Geophys. Res. Atmos. 2000, 105, 24823–24838. [Google Scholar] [CrossRef]
- Jia, Y.C.; Xie, M.W.; Jiang, H.T. Daily Estimate of global 36 km grid soil moisture. J. Geo Inf. Sci. 2017, 19, 854–860. [Google Scholar]
- Wagner, W.; Hahn, S.; Kidd, R.; Melzer, T.; Bartalis, Z.; Hasenauer, S.; Figa-Saldaña, J.; De Rosnay, P.; Jann, A.; Schneider, S.; et al. The ASCAT soil moisture product: A review of its specifications, validation results, and emerging applications. Meteorol. Z. 2013, 22, 5–33. [Google Scholar] [CrossRef] [Green Version]
- Su, J.L.; Luo, W.Q.; Wang, G.Z. Spatiotemporal Variation of Vegetation and Its Influencing Factors in Xijiang River Basin of Guangxi Based on MODIS-EVI. Res. Soil Water Conserv. 2019, 26, 232–238. [Google Scholar]
- Bo, Z.; Jianxin, M.; Lu, X.; Xinggang, M.; Bureau, L.M. Spatial and Temporal Variation of Vegetation Coverage in Mountain Area of Longnan:Based on MODIS EVI. Chin. Agric. Sci. Bull. 2017, 33, 70–77. [Google Scholar]
- Zhai, Y.Q.; Zhang, C.; Zhou, Q. Spatio-temporal variation and interrelationship of vegetation cover and soil moisture in Qinling-Daba Mountains. J. Geo Inf. Sci. 2018, 20, 967–977. [Google Scholar]
Figure 1.
The enhanced vegetation index (EVI) in the study area of Qinghai Province, China, based on the MYD13A3 MODIS satellite data product (2017).
Figure 1.
The enhanced vegetation index (EVI) in the study area of Qinghai Province, China, based on the MYD13A3 MODIS satellite data product (2017).

Figure 2.
The picture of passive satellite products: (a) The average daily soil moisture in the study area from various passive satellite products (leftmost column); (b) Scatterplots showing the correlation between these products (two rightmost columns).
Figure 2.
The picture of passive satellite products: (a) The average daily soil moisture in the study area from various passive satellite products (leftmost column); (b) Scatterplots showing the correlation between these products (two rightmost columns).

Figure 3.
Correlation coefficients between soil moisture data. The five columns of sub-figures show, from top to bottom: (a) [SMAP, ASCAT, GEOS5]; (b) [SMOS, ASCAT, GEOS5]; (c) [FY3B, ASCAT, GEOS5]; (d) [FY3C, ASCAT, GEOS5]; (e) [AMSR2, ASCAT, GEOS5]. The three rows of sub-figures show, from left to right, the correlation coefficients between passive and active, passive and reanalysis, and active and reanalysis data.

Figure 4.
Spatial characteristics of the triple collocation (TC) error variance (σ2) in the study area. The five columns of sub-figures show, from top to bottom: (a) [SMAP, ASCAT, GEOS5]; (b) [SMOS, ASCAT, GEOS5]; (c) [FY3B, ASCAT, GEOS5]; (d) [FY3C, ASCAT, GEOS5]; (e) [AMSR2, ASCAT, GEOS5]. The three rows of sub-figures show, from left to right, the error variance between the passive and true soil moisture, the error variance between the active and true soil moisture, and the error variance between the reanalysis and true soil moisture.


Figure 5.
Tail box figures of σ2 in the study area.


Figure 6.
Spatial characteristics of the fractional mean-squared-error (fMSE) in the study area. The five columns of sub-figures show, from top to bottom: (a) [SMAP, ASCAT, GEOS5]; (b) [SMOS, ASCAT, GEOS5]; (c) [FY3B, ASCAT, GEOS5]; (d) [FY3C, ASCAT, GEOS5]; (e) [AMSR2, ASCAT, GEOS5]. The three rows of sub-figures show, from left to right, the fractional mean-squared-error between the passive and true soil moisture, the fractional mean-squared-error between the active and true soil moisture, and the fractional mean-squared-error between the reanalysis and true soil moisture.

Figure 7.
Tail box figures of fMSE in the study area.

Figure 8.
Spatial characteristics of the correlation coefficient (R) in the study area. The five columns of sub-figures show, from top to bottom: (a) [SMAP, ASCAT, GEOS5]; (b) [SMOS, ASCAT, GEOS5]; (c) [FY3B, ASCAT, GEOS5]; (d) [FY3C, ASCAT, GEOS5]; (e) [AMSR2, ASCAT, GEOS5]. The three rows of sub-figures show, from left to right, the correlation coefficients between the passive and true soil moisture, the correlation coefficients between the active and true soil moisture, and the correlation coefficients between the reanalysis and true soil moisture.


Figure 9.
Tail box figure of R in the study area.

Figure 10.
Scatterplots of the TC σ2 for the SMAP, SMOS, FY3B, FY3C, and AMSR2 passive satellite data and EVI.
Figure 10.
Scatterplots of the TC σ2 for the SMAP, SMOS, FY3B, FY3C, and AMSR2 passive satellite data and EVI.

Figure 11.
Scatterplots of the TC correlation between the EVI, and soil moisture obtained from SMAP, SMOS, FY3B, FY3C, and AMSR2 passive satellite data.
Figure 11.
Scatterplots of the TC correlation between the EVI, and soil moisture obtained from SMAP, SMOS, FY3B, FY3C, and AMSR2 passive satellite data.


Table 1.
Information of the satellites which were used to estimate global soil moisture in this study.
Table 1.
Information of the satellites which were used to estimate global soil moisture in this study.
| Dataset Name | Sensor | Retrieval Band | Time of Ascending Pass/Descending Pass | Unit | Spatial Resolution | Time Period | Coverage |
|---|---|---|---|---|---|---|---|
| L3_SM_P | Passive | 1.4 GHz | 06:00/18:00 | m3/m3 | 36 km | 2015–present | Global |
| SMOS-CATDS | Passive | 1.4 GHz | 06:00/18:00 | m3/m3 | 25 km | 2010–present | Global |
| FY3B-MWRI | Passive | 10.7/36.5 GHz | 13:30/01:30 | m3/m3 | 25 km | 2011–present | Global |
| FY3C-MWRI | Passive | 10.7/36.5 GHz | 13:30/01:30 | m3/m3 | 25 km | 2014–present | Global |
| AMSR2_L3 | Passive | 10.7/36.5 GHz | 13:30/01:30 | Saturation (%) | 0.25° | 2012–present | Global |
| ASCAT_L2 | Active | 5.3 GHz | 21:30/09:30 | Saturation (%) | 12.5 km | 2012–present | Global |
| GEOS5 | Fusion | m3/m3 | 0.25° *0.3125° | 2014–present | Global |
© 2020 by the authors. Licensee MDPI, Basel, Switzerland. This article is an open access article distributed under the terms and conditions of the Creative Commons Attribution (CC BY) license (http://creativecommons.org/licenses/by/4.0/).
Share and Cite
MDPI and ACS Style
Zhu, H.; Zhang, Z.; Lv, A. Evaluation of Satellite-Derived Soil Moisture in Qinghai Province Based on Triple Collocation. Water 2020, 12, 1292. https://doi.org/10.3390/w12051292
AMA Style
Zhu H, Zhang Z, Lv A. Evaluation of Satellite-Derived Soil Moisture in Qinghai Province Based on Triple Collocation. Water. 2020; 12(5):1292. https://doi.org/10.3390/w12051292
Chicago/Turabian StyleZhu, Hongchun, Zhilin Zhang, and Aifeng Lv. 2020. "Evaluation of Satellite-Derived Soil Moisture in Qinghai Province Based on Triple Collocation" Water 12, no. 5: 1292. https://doi.org/10.3390/w12051292
Note that from the first issue of 2016, this journal uses article numbers instead of page numbers. See further details here.