Sources of Salinization of Groundwater in the Lower Yarmouk Gorge, East of the River Jordan
by
 , , , , , and
Peter Möller
1,* ,
,
Marco De Lucia
1,
Eliahu Rosenthal
2,
Nimrod Inbar
3,4,
Elias Salameh
5,
Fabien Magri
6,7 and
Christian Siebert
8 1
Section 3.4 Fluid Systems Modeling, GFZ German Research Centre for Geosciences, 14473 Potsdam, Germany
2
The School of Earth Sciences, Tel Aviv University, Tel Aviv 69978, Israel
3
Department of Geophysics and Space Sciences, Eastern R&D, Ariel 40700, Israel
4
Department of Physics, Ariel University, Ariel 40700, Israel
5
Department of Geology, University of Jordan, Amman 11942, Jordan
6
FA 2 Research, BASE Federal Office for the Safety of Nuclear Waste Management, 10623 Berlin, Germany
7
Hydrogeology Group, Institute of Geological Sciences, Free University of Berlin, 12249 Berlin, Germany
8
Department of Catchment Hydrology, Helmholtz Centre for Environmental Research UFZ, 06120 Halle/Saale, Germany
*
Author to whom correspondence should be addressed.
Water 2020, 12(5), 1291; https://doi.org/10.3390/w12051291
Submission received: 25 February 2020
/
Revised: 23 April 2020
/
Accepted: 28 April 2020
/
Published: 1 May 2020
(This article belongs to the Special Issue Focus on the Salinization Issue in the Mediterranean Area)
Abstract
:In the Lower Yarmouk Gorge the chemical composition of regional, fresh to brackish, mostly thermal groundwater reveals a zonation in respect to salinization and geochemical evolution, which is seemingly controlled by the Lower Yarmouk fault (LYF) but does not strictly follow the morphological Yarmouk Gorge. South of LYF, the artesian Mukeihbeh well field region produces in its central segment groundwaters, an almost pure basaltic-rock type with a low contribution (<0.3 vol-%) of Tertiary brine, hosted in deep Cretaceous and Jurassic formations. Further distal, the contribution of limestone water increases, originating from the Ajloun Mountains in the South. North of the LYF, the Mezar wells, the springs of Hammat Gader and Ain Himma produce dominantly limestone water, which contains 0.14–3 vol-% of the Tertiary brine, and hence possesses variable salinity. The total dissolved equivalents, TDE, of solutes gained by water/rock interaction (WRI) and mixing with brine, TDEWRI+brine, amount to 10–70% of total salinity in the region comprising the Mukheibeh field, Ain Himma and Mezar 3 well; 55–70% in the springs of Hammat Gader; and 80–90% in wells Mezar 1 and 2. The type of salinization indicates that the Lower Yarmouk fault seemingly acts as the divide between the Ajloun and the Golan Heights-dominated groundwaters.
1. Introduction
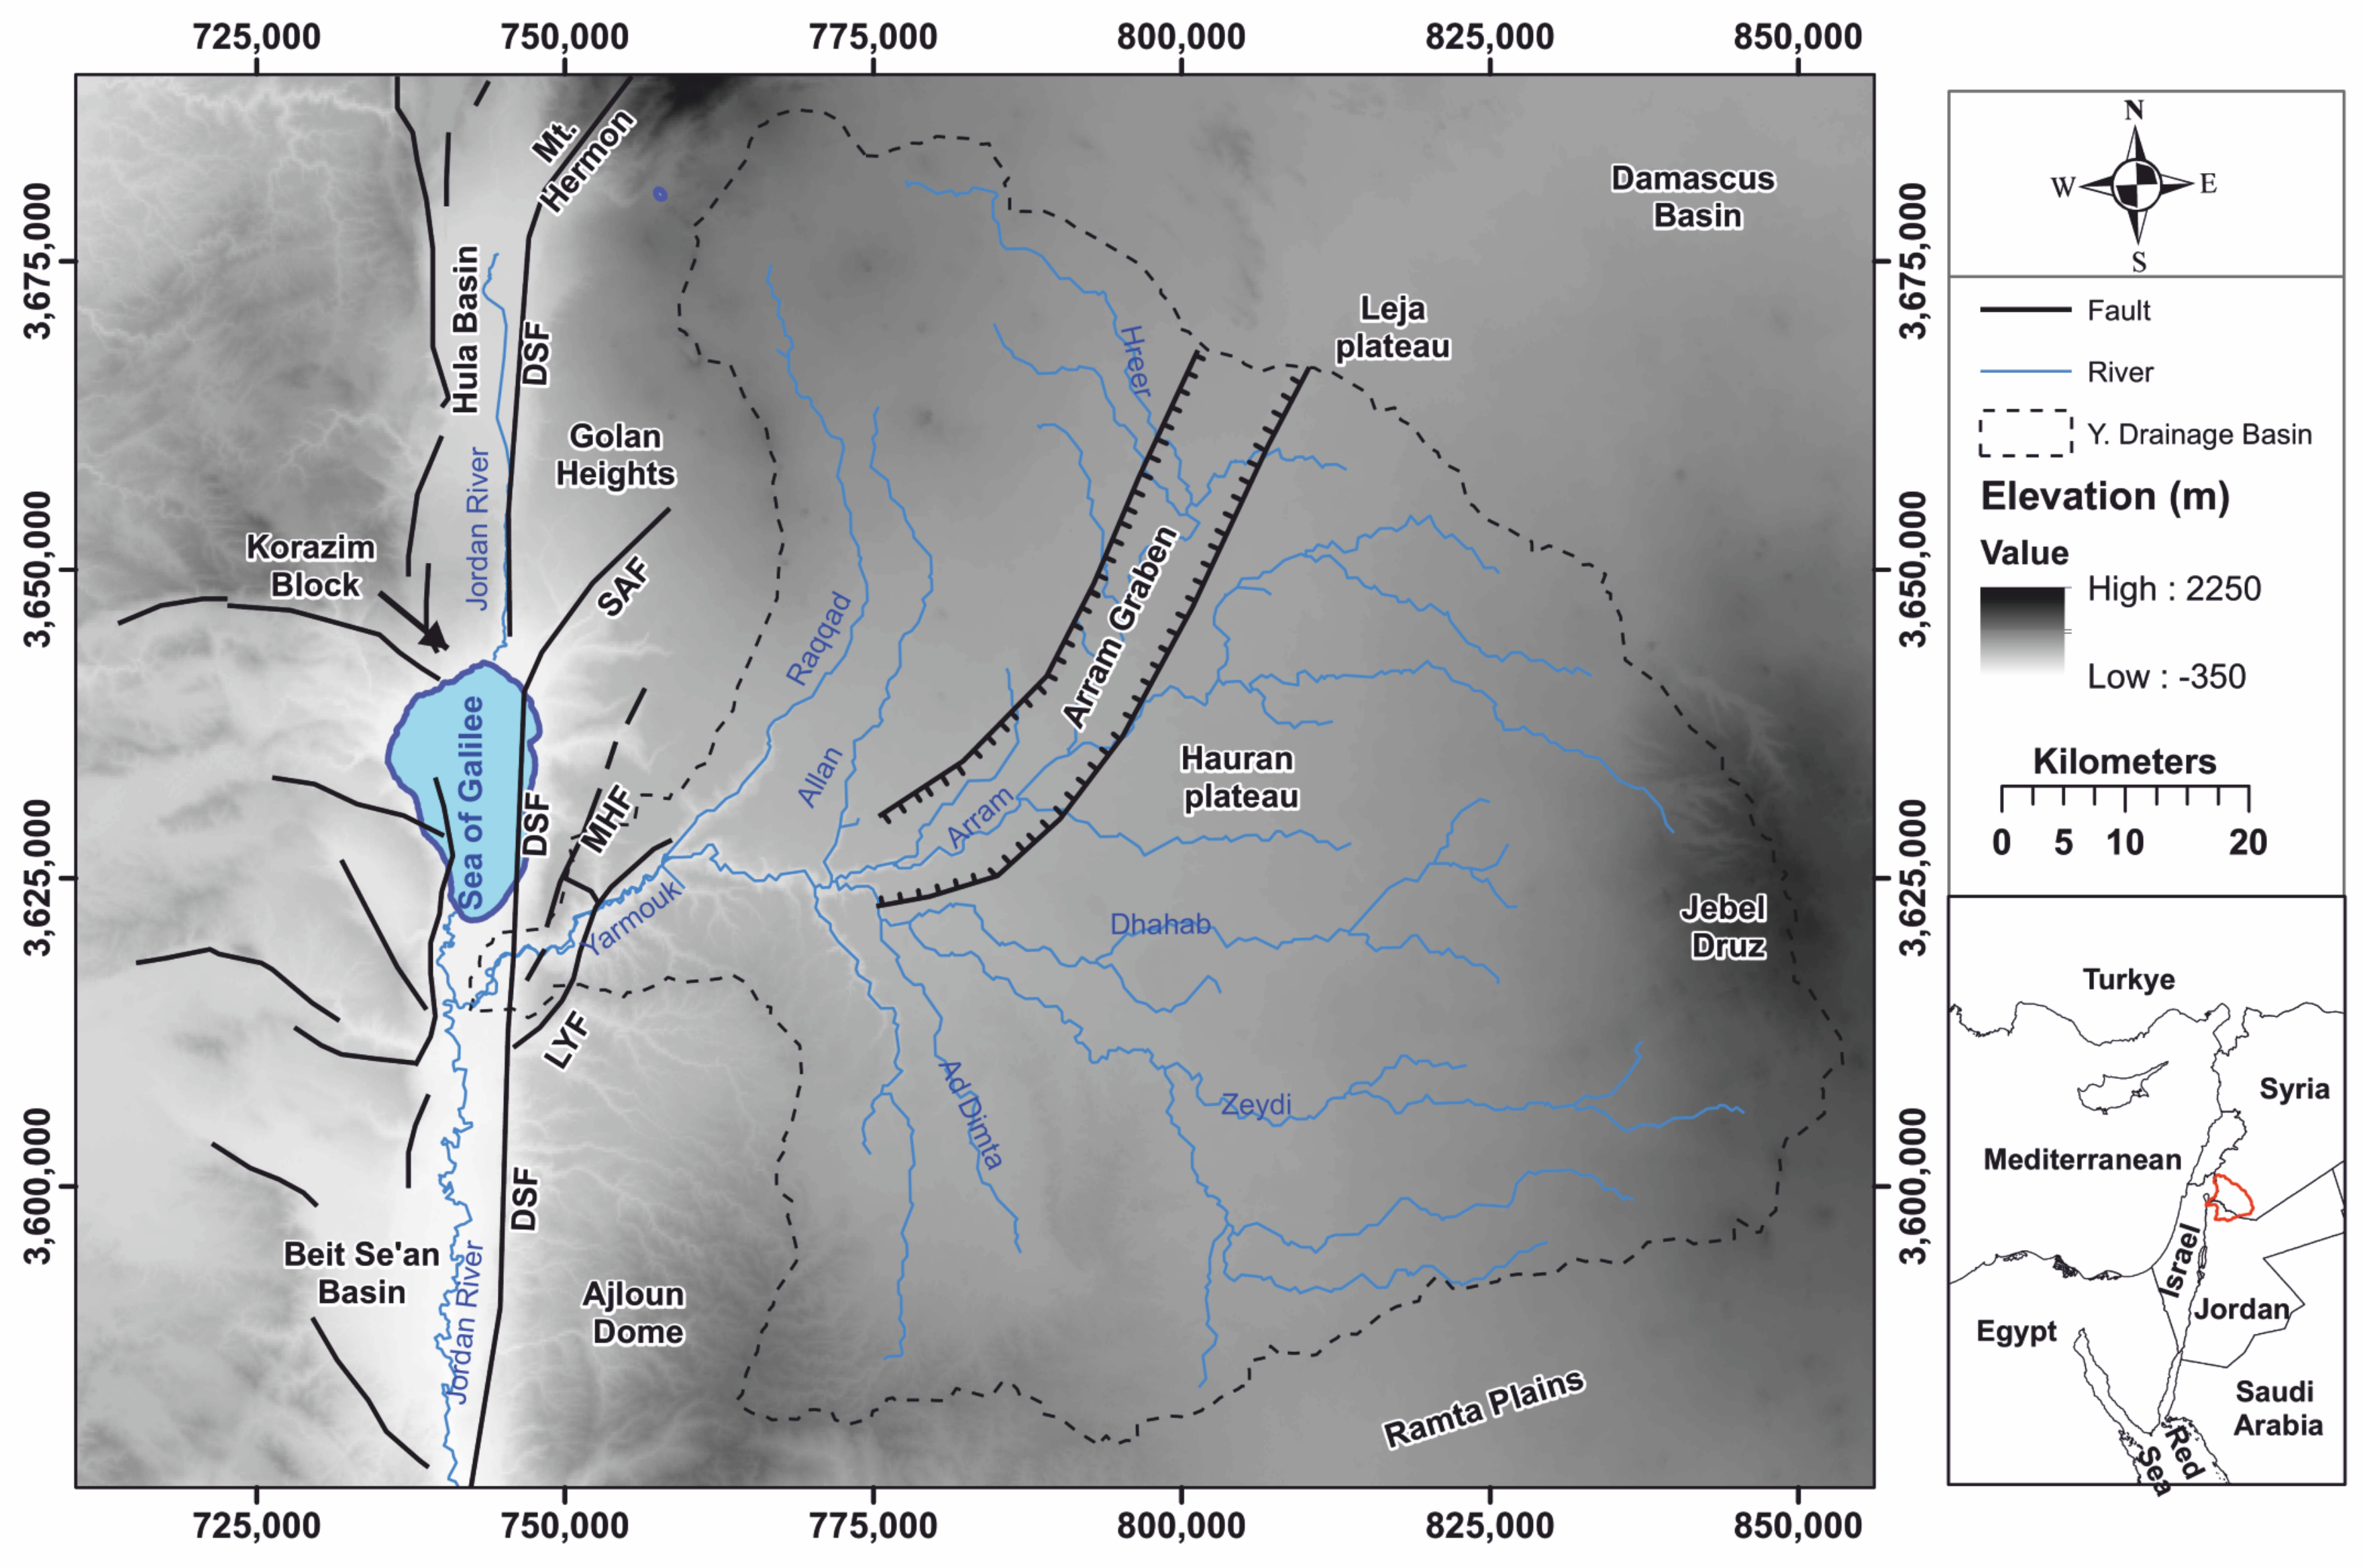
This study aims at the identification and quantification of sources of salinization in different geological formations in the well field region of the Lower Yarmouk Gorge (LYG) shared by Israel, Jordan and Syria (Figure 1). The productive water resource in the LYG is vitally important for Jordan and Israel because of water shortage in both countries [1]. Like elsewhere in all semi-arid regions in the world, the ground and surface-water resources are over-exploited, leading to water shortages due to increasing demand and to consequences of climate change [2]. In such regions, water supply is a serious socio-economic and political issue, if transboundary flow is involved. For sustainable management and protection of groundwater resources, water authorities need detailed knowledge of (i) the respective recharge areas of distinct wells or well fields, (ii) the flow characteristics and (iii) possible inter-aquifer flow [3]. In areas with transboundary water resources, rules of equitability and no-harm also have to be obeyed in order to prevent political interference [4].
The study of the hydrochemical compositions of groundwater and brines reveals the origin of water and its salinization (e.g., [2,5,6,7,8,9,10,11,12,13,14,15]). The inorganic composition of groundwater depends on the weathering of minerals in the catchment rocks, the water/rock interaction (WRI) along the flow paths and the amounts of atmospheric deposition [16]. Processes together yield typical ionic ratios in groundwater ([17] and references therein).
In contrast, trace elements such as the rare earth elements (REE) and uranium behave differently and thus are useful to highlight other aspects [15]. Their extremely low concentrations (<μmol/L) are controlled by adsorption onto mineral surfaces and co-precipitation with alteration minerals [18,19,20,21,22,23,24,25,26]. The suite of REE and yttrium, Y, henceforth combined to REY, is widely used to identify the origin of groundwaters [8,9,10,12,13,15,27]. REY immediately achieve steady state conditions in the infiltrating water due to their high charge and affinity to build surface complexes. For instance, more than 99% of REY released from dissolving calcite in limestones are immediately adsorbed onto calcite surfaces [17]. During migration of groundwater, REY are continuously subjected to exchange with surface-adsorbed REY. Thus, after some time the REY patterns of groundwater resemble those gained during weathering of the catchment rocks [28]. Therefore, REY patterns characterize the lithology of the recharge area, whereas major and minor elements reflect the solubility of minerals of the entire assemblage of catchment and aquifer rocks.
A previous conjoint application of major and trace elements in the ground water yielded insights into its salinization and flow paths in the study area, which will be briefly summarized in Section 2 [2,15,27,29]. However, the issue of potential transboundary flow of water between the Ajloun in the south [30,31] and the Golan Heights in the north [2,32,33,34] underneath the Yarmouk River was and still is debated. It has been considered whether or not the Gorge delineates a fault or represents an anisotropy zone which possibly prevents transboundary flow of groundwater between Jordan and Israel [35,36]. Seismic lines crossing this border have not been shot up to now but several ones in the southern Golan Heights are available [37]. Shallow faults in northwest Jordan are described in [38]. Based on these surveys and additional evidence [37], a strike-slip-flower-structured fault system and numerous buried faults crossing the Gorge at an acute angle are plausible.
The purpose of this contribution is to analyse and interprete the available hydrogeochemical data concerning major ions, the REY and the hydrogeological setting (Section 2) in order to discern the possible mixing paths and sources of salinization for the groundwaters of the Lower Yarmouk Gorge, discriminating between water/rock interactions and mixing with relic brines of different natures (Section 3). In particular, two different conceptual models are employed to estimate the fractions of limestone and basaltic-rock waters and brines which can be observed in the data (Section 3.3). Multivariate statistical analysis in the form of clustering (Section 3.4) is also employed to support and ultimatively validate the interpretation and to trace the discrepancies between geographically contiguous water samples in view of the identified processes (Section 4.4).
2. Hydrogeological Setting
The Yarmouk basin comprises the eastern Golan Heights and south-eastern flanks of the Hermon Massif, shared by Israel and Syria; the northern plunges of the Ajloun Dome (Jordan); and the Hauran Plateau, including the western flank of the Jebel Druz (Syria) (Figure 1). The LYG is the major outlet of surface and groundwater from the Yarmouk basin. Morphologically, the Gorge separates the Ajloun Mountains and the Jordanian Ramta Plains from the Golan Heights and the Hauran Plateau, respectively.
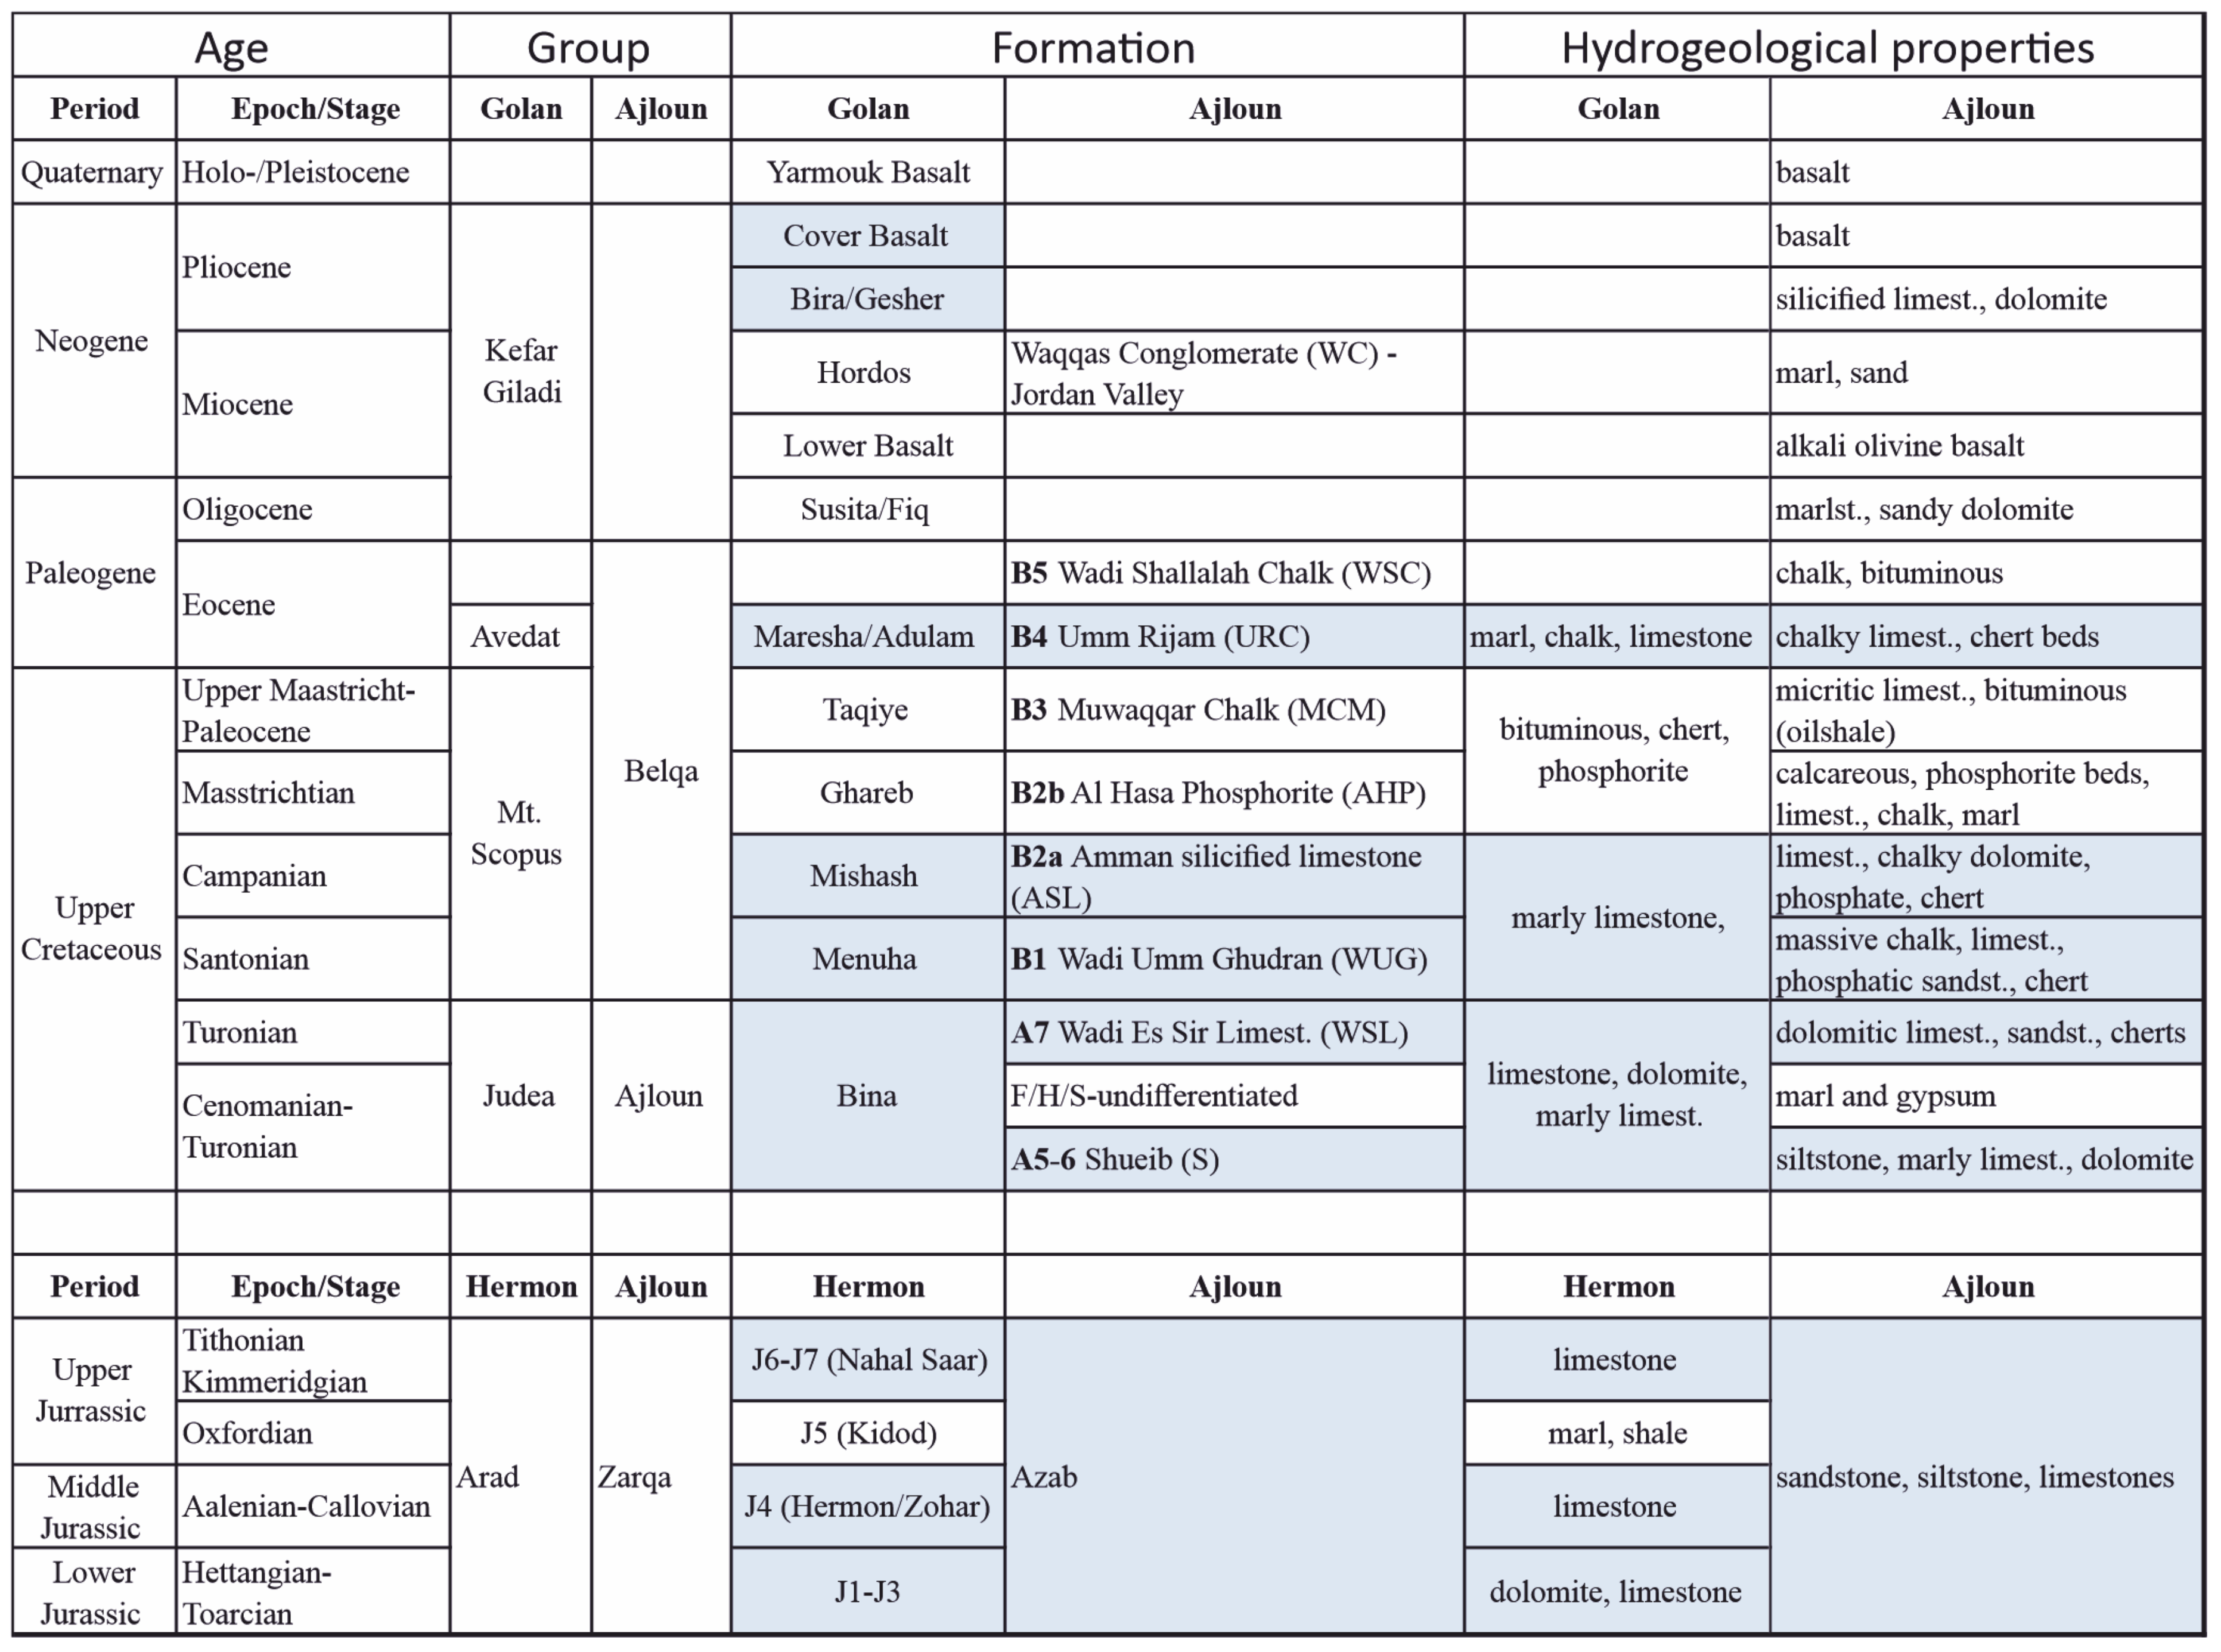
The anticlinal structure of the Ajloun is built of Lower Cretaceous Kurnub sandstones and Upper Cretaceous, marine, strongly karstified, fractured and silicified lime and dolostones, forming the A7/B2 aquifer in Jordan (Figure 2), which descends northward. For easement and shortness, the Jordanian nomenclature of formations is preferred in this contribution. Groundwaters in the A7/B2 are confined by the overlying bituminous Senonian B3 aquiclude, which contains phosphorite, chert and chalk, and separates the A7/B2 from the locally exploited limy B4 aquifer.
The Cretaceous and Tertiary sedimentary aquifers, which crop out in the Ajloun anticline, descend northward into the Golan syncline and surface later, again at the foothills of the Hermon anticline, which consist of thick Jurassic lime and dolostone aquifers with abundant basaltic intrusions [39]. As a consequence, groundwaters south and north of the Gorge migrate through the same aquiferous formations. Contrasting the Ajloun, the Golan Heights are unconformably covered by up to 700 m thick Plio-Pleistocene cover basalt [40,41]. A marly sequence at its base, the highly fractured basalt, serve as a regional aquifer, which itself is annually directly recharged by 500–1200 mm of precipitation [7]. During the pre-Quaternary phase, the Golan Heights were subjected to tectonic stress documented in a highly faulted and deformed subsurface [42] with intense and deep karstification of the Upper Cretaceous and Tertiary lime and dolostones [43]. A meridional ridge in these formations acts as a subsurface water divide in the covering basalt aquifer [7], leading to groundwater drainage in the latter either W–SW to the Hula and the Sea of Galilee basin, or E–SE into the Hauran Plateau and the Upper Yarmouk Gorge. Hydraulic connections between the basaltic cover and the underlying aquiferous Cretaceous carbonate formations may exist throughout the Golan Heights [44].
The eastward continuation of the Golan Heights is the flat and southward dipping volcanic area of the Hauran Plateau, which passes in the SE into the enormous accumulation of Neogene-Quaternary basalts of the Jebel Druze [45,46]. Precipitation infiltrates directly into Upper Quaternary basalts exposed all over the Plateau and drains towards the LYG, partially feeding perennial springs in the arcuated Wadi Arram (Figure 1) which was a major contributor to the Yarmouk River in the past [47].
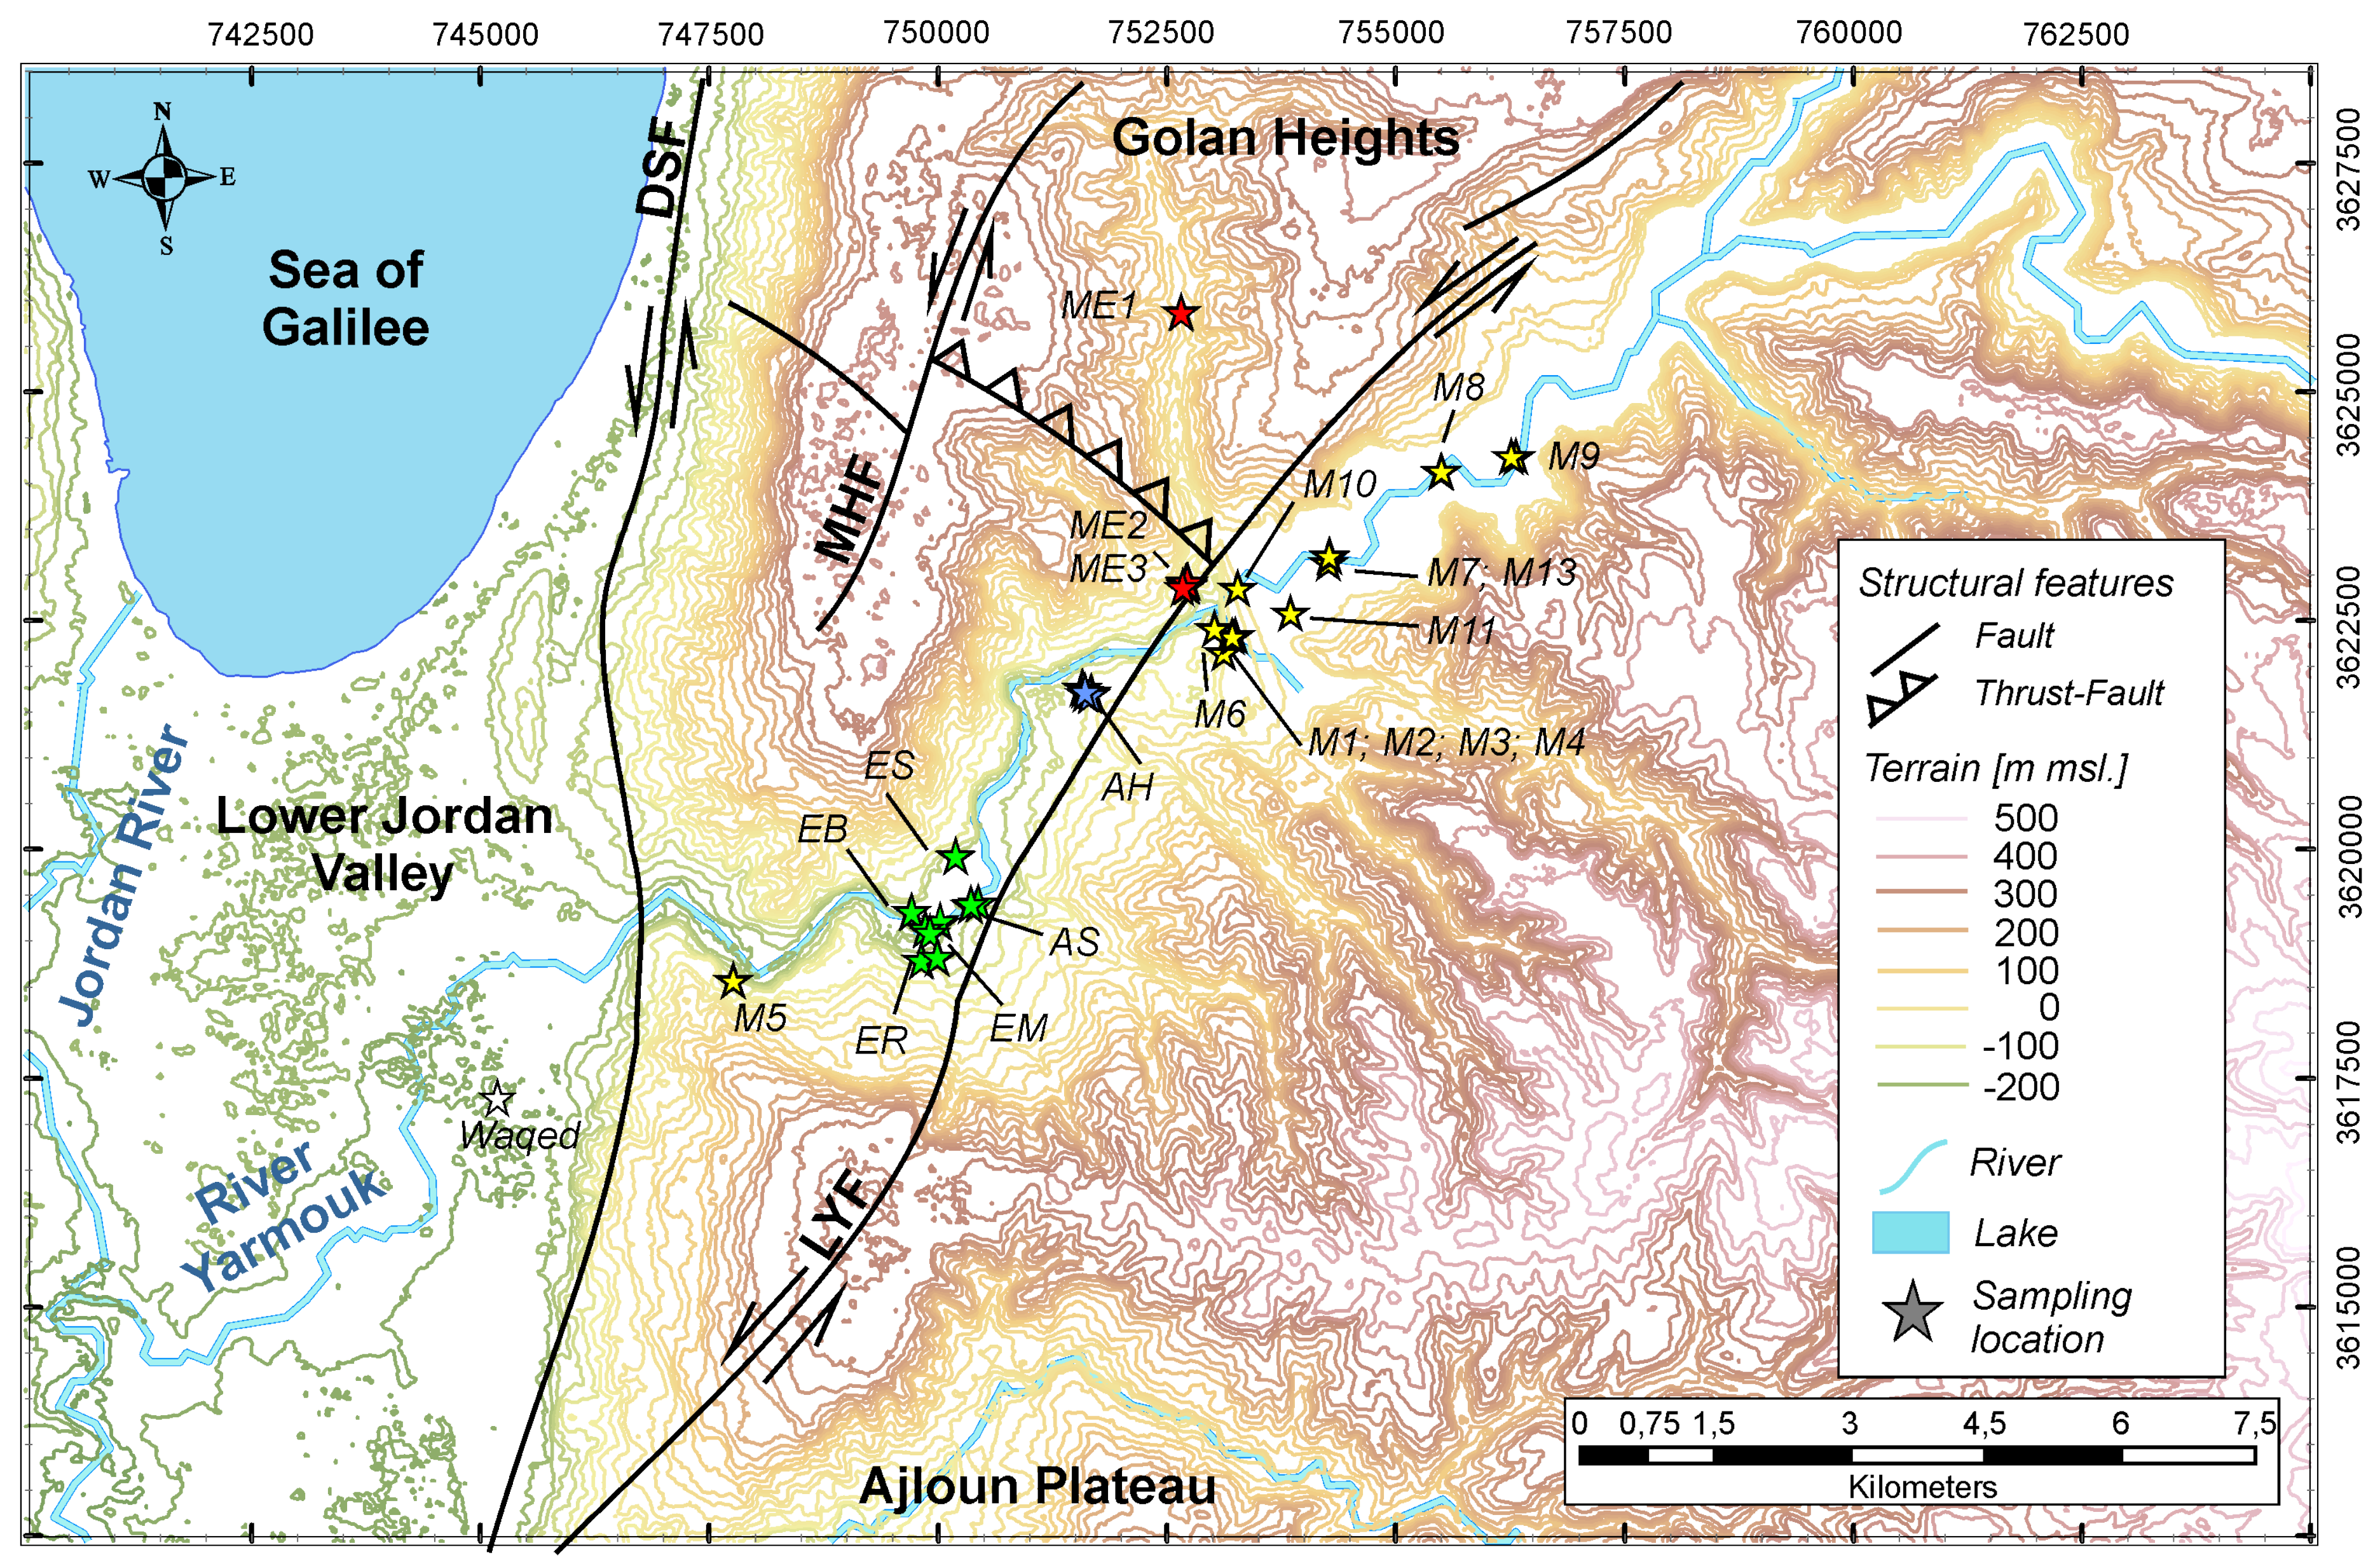
Along the northern flank of the LYG, hot groundwater emerges at Hammat Gader springs (codes EM, ER and EB in Table 1; 38–43 °C ) from the B3 aquitard [48] and ascends at 41–60 °C in the artesian wells of Mezar from A7 (Mezar 2) and B2 (Mezar 3) aquifers (Figure 3).
South of the Yarmouk River the hot water from Ain (Arabic term for spring) Himma (42 °C) emerges from the B3 aquitard, ascending along faults from the B2 aquifer [6]. In the nearby artesian Mukheibeh well field, the groundwater is exploited from A7/B2 discharging with temperatures of 29–46 °C probably heated by volcanic intrusions at depths of 3–4 km [49]. Hot groundwater from the A7 aquifer is also known to come from the western Ajloun escarpment within the Lower Jordan Valley [30,50,51]. In the Ajloun the temperature of groundwater from A7/B2 is only slightly enhanced (23–31 °C) and cool if draining the shallow basaltic aquifer or the B4.
With few exceptions, the groundwaters of the LYG are saturated with respect to calcite but not with respect to gypsum or halite [2]. The groundwaters from Ain Himma, the springs of Hammat Gader (enclosing codes ES, EB, ER and EM in Table 1) and Mezar well 3 are seemingly mixtures of local groundwater, relic seawater evaporation brine(s) and leached evaporites and dissolved calcite from limestone [2,15].
3. Materials and Methods
3.1. Sampling and Analytical Procedure
During a synchronous sampling campaign in 2016, wells and springs on both sides of the LYG were chemically analyzed. To allow for a regionally comprehensive elaboration, selected analytical results from earlier local campaigns were included (Table 1). During all campaigns, onsite parameters (pH, temperature, redox potential and electric conductivity) have been measured in the discharging water jets of springs and pumping wells using WRW 350i and respective probes (SenTix41, Sentix ORP, Tetracon325). When parameters were stable, samples were derived from jets applying a peristaltic pump and pre-cleaned silicon tubes connected to 0.22 μm filter before storage in pre-cleaned HD-PE bottles. Contrasting the anion samples, cation samples were later acidified using one drop of 6 N HCl to ensure conservation. The alkalinity (expressed as HCO3−) was determined by titrating 10 mL of sample with 1.6 N H2SO4 to pH 4.3. To determine REY, pre-concentration was required. Therefore, about 4 L of sample were filtered (0.22 μm), acidified by sub-boiled (index sbb) 6 N HCl to pH of about 2–2.5 and spiked with 1 ml of Tm solution, by which the recovery of REY in subsequent pre-concentration procedure could be checked. Usually the recovery was between 95% and 103%. At the same day, the samples were passed through C18 Sep-Pak cartridges, loaded with ethylhexylphosphate liquid ion exchanger. In the lab, each cartridge was eluated with 6 N HClsbb; eluates were evaporated to incipient dryness and taken up with HNO3sbb; and the resulting solution was analyzed applying ICP-MS (Elan DRC-e). Independently, Ca2+ and Mg2+ were determined by ICP-MS. K+ and Na+ were analyzed by ICP-AES (Spectro Arcos) using matrix adjusted standard solution for calibration. Cl−, Br−, were determined by Dionex ICS (AS18 column).
3.2. Selection of End Member Fluids in the Yarmouk Basin
The suggested quantification of salinity contributions is based on defined end members of water types in the LYG:
- Infiltration of precipitation over basaltic catchments, particularly in the Hauran plateau;
- Infiltration of precipitation over a limestone catchment mainly in the Ajloun Mountains and Mount Hermon/Golan Heights;
- Relics of brines residing in Jurassic-Cretaceous limestones;
- Dissolution of evaporites and water/rock interaction (WRI) along flow paths.
Basaltic rock and limestone waters with lowest Cl− concentrations are suggested as end members because enhanced Cl− concentrations suggest dissolution of halite from evaporites and/or leaching of seawater brines enclosed in limestones. The lowest Cl− concentrations of basaltic-rock water from the Golan and Hauran Plateau were 0.84 meq/L (Table 1 and Table A1).
The averages of limestone water of two well waters from each the Golan Heights and the Ajloun Mountains were selected. Their Cl− concentrations ranged between 0.89 and 0.80 meq/L (Table 2), suggesting that the samples with values >0.80 meq/L might have leached either evaporites or seawater brines.
Two particular brines have to be considered:
- The Late Tertiary brine was generated by evaporation of intruded Tethys seawater into the Jordan–Dead Sea Rift [52]. This evaporation brine infiltrated the Cretaceous and Jurassic aquifers east and west of the Rift. This type of MG2+-Cl− brine was identified at Ha’On in the 1960s [53] along the SE shore of Lake Tiberias. The variations in composition of two wells at Ha’On between 1961 and 2004 are averaged (Table 2). For more detail refer to Table A1.
- The Late Triassic to Early Jurassic brine of Rosh Pinna is hosted at depths of 2500 m in limestones of the Korazim block north of Lake Tiberias (Figure 1).
3.3. Estimation of Fractions of Brine, Basaltic Rock and Limestone Water
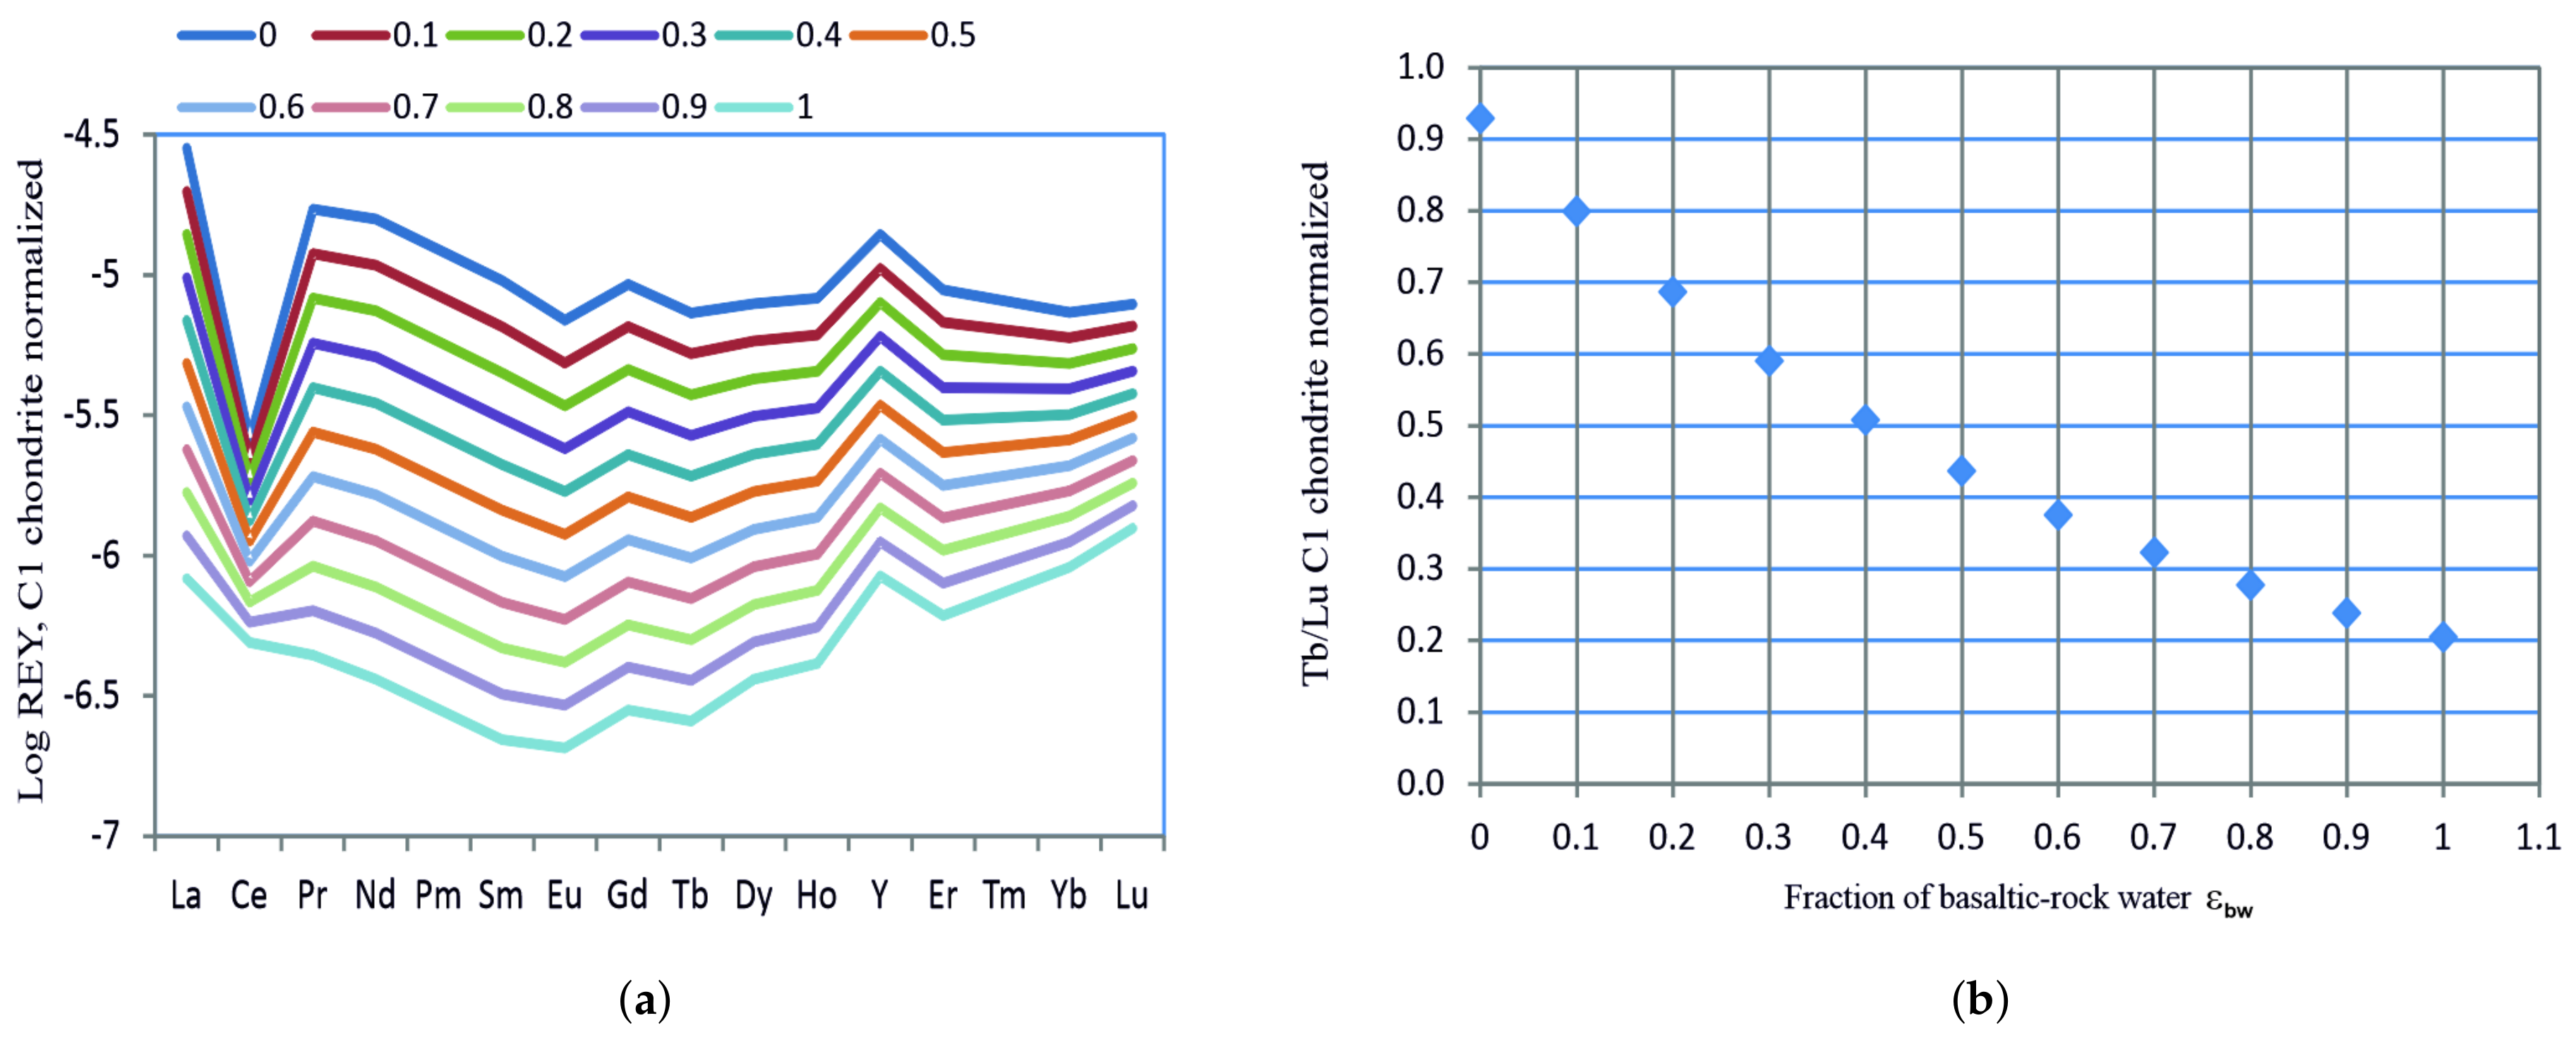
The fractions of basaltic-rock water, , in mixtures of both pure basaltic-rock water and limestone water (Figure 4a), are derived from interpretation of REY distribution patterns showing the variation of mixtures of both types of groundwater. Each of the mixtures of REY patterns is characterized by C1 chondrite-normalized Tb/Lu values decreasing with increasing values (Figure 4). Determining the Tb/Lu ratio of each individual groundwater and brine a reliable for each groundwater in the study area is derived from Figure 4b. The REY distribution patterns of all groundwaters and brines are discussed in [15].
This approach of assumes that the REY patterns are not significantly varied by dissolution of evaporites or by WRI, applying and , and the analyzed concentrations of species i. Two different estimates are presented by assuming either presence or absence of halite in evaporites. The concentration of ci,agw is approached by summation of the end member composition of basaltic-rock and limestone water (Table 2), and contributions of leached brine and WRI (Equation (1)). The summation of contribution of Cl− from basaltic-rock and limestone water is given as "estimated" by Equation (2). Equation (1) yields the sum of for each species i. If halite is absent, the maximum fraction of brine is derived from Equation (3) which is probably an overestimation. Assuming that Cl− is only a component of the brine and not of WRI, is given by Equation (4).
Another way to characterize the salinization of groundwater is achieved by estimating the total dissolved equivalents, TDE (in meq/L), which is independent on processes such as ion exchange with clay minerals; albitization and associated calcite precipitation; and dolomitization of limestones. TDE, however, varies due to dissolution and precipitation of minerals and mixing of fresh and saline waters. TDEbw and TDElmst are estimated for the contributions of corresponding waters (Equation (5)). TDE of the analyzed groundwater, TDEagw, is given by summation over all dissolved species i (Equation (6)). Assuming that Cl− is only contributed by WRI, the sum of TDEWRI + TDEbrine is estimated according to Equation (7) with TDEbrine = 0.
3.4. Multivariate Statistical Analysis: K-Medoids Clustering
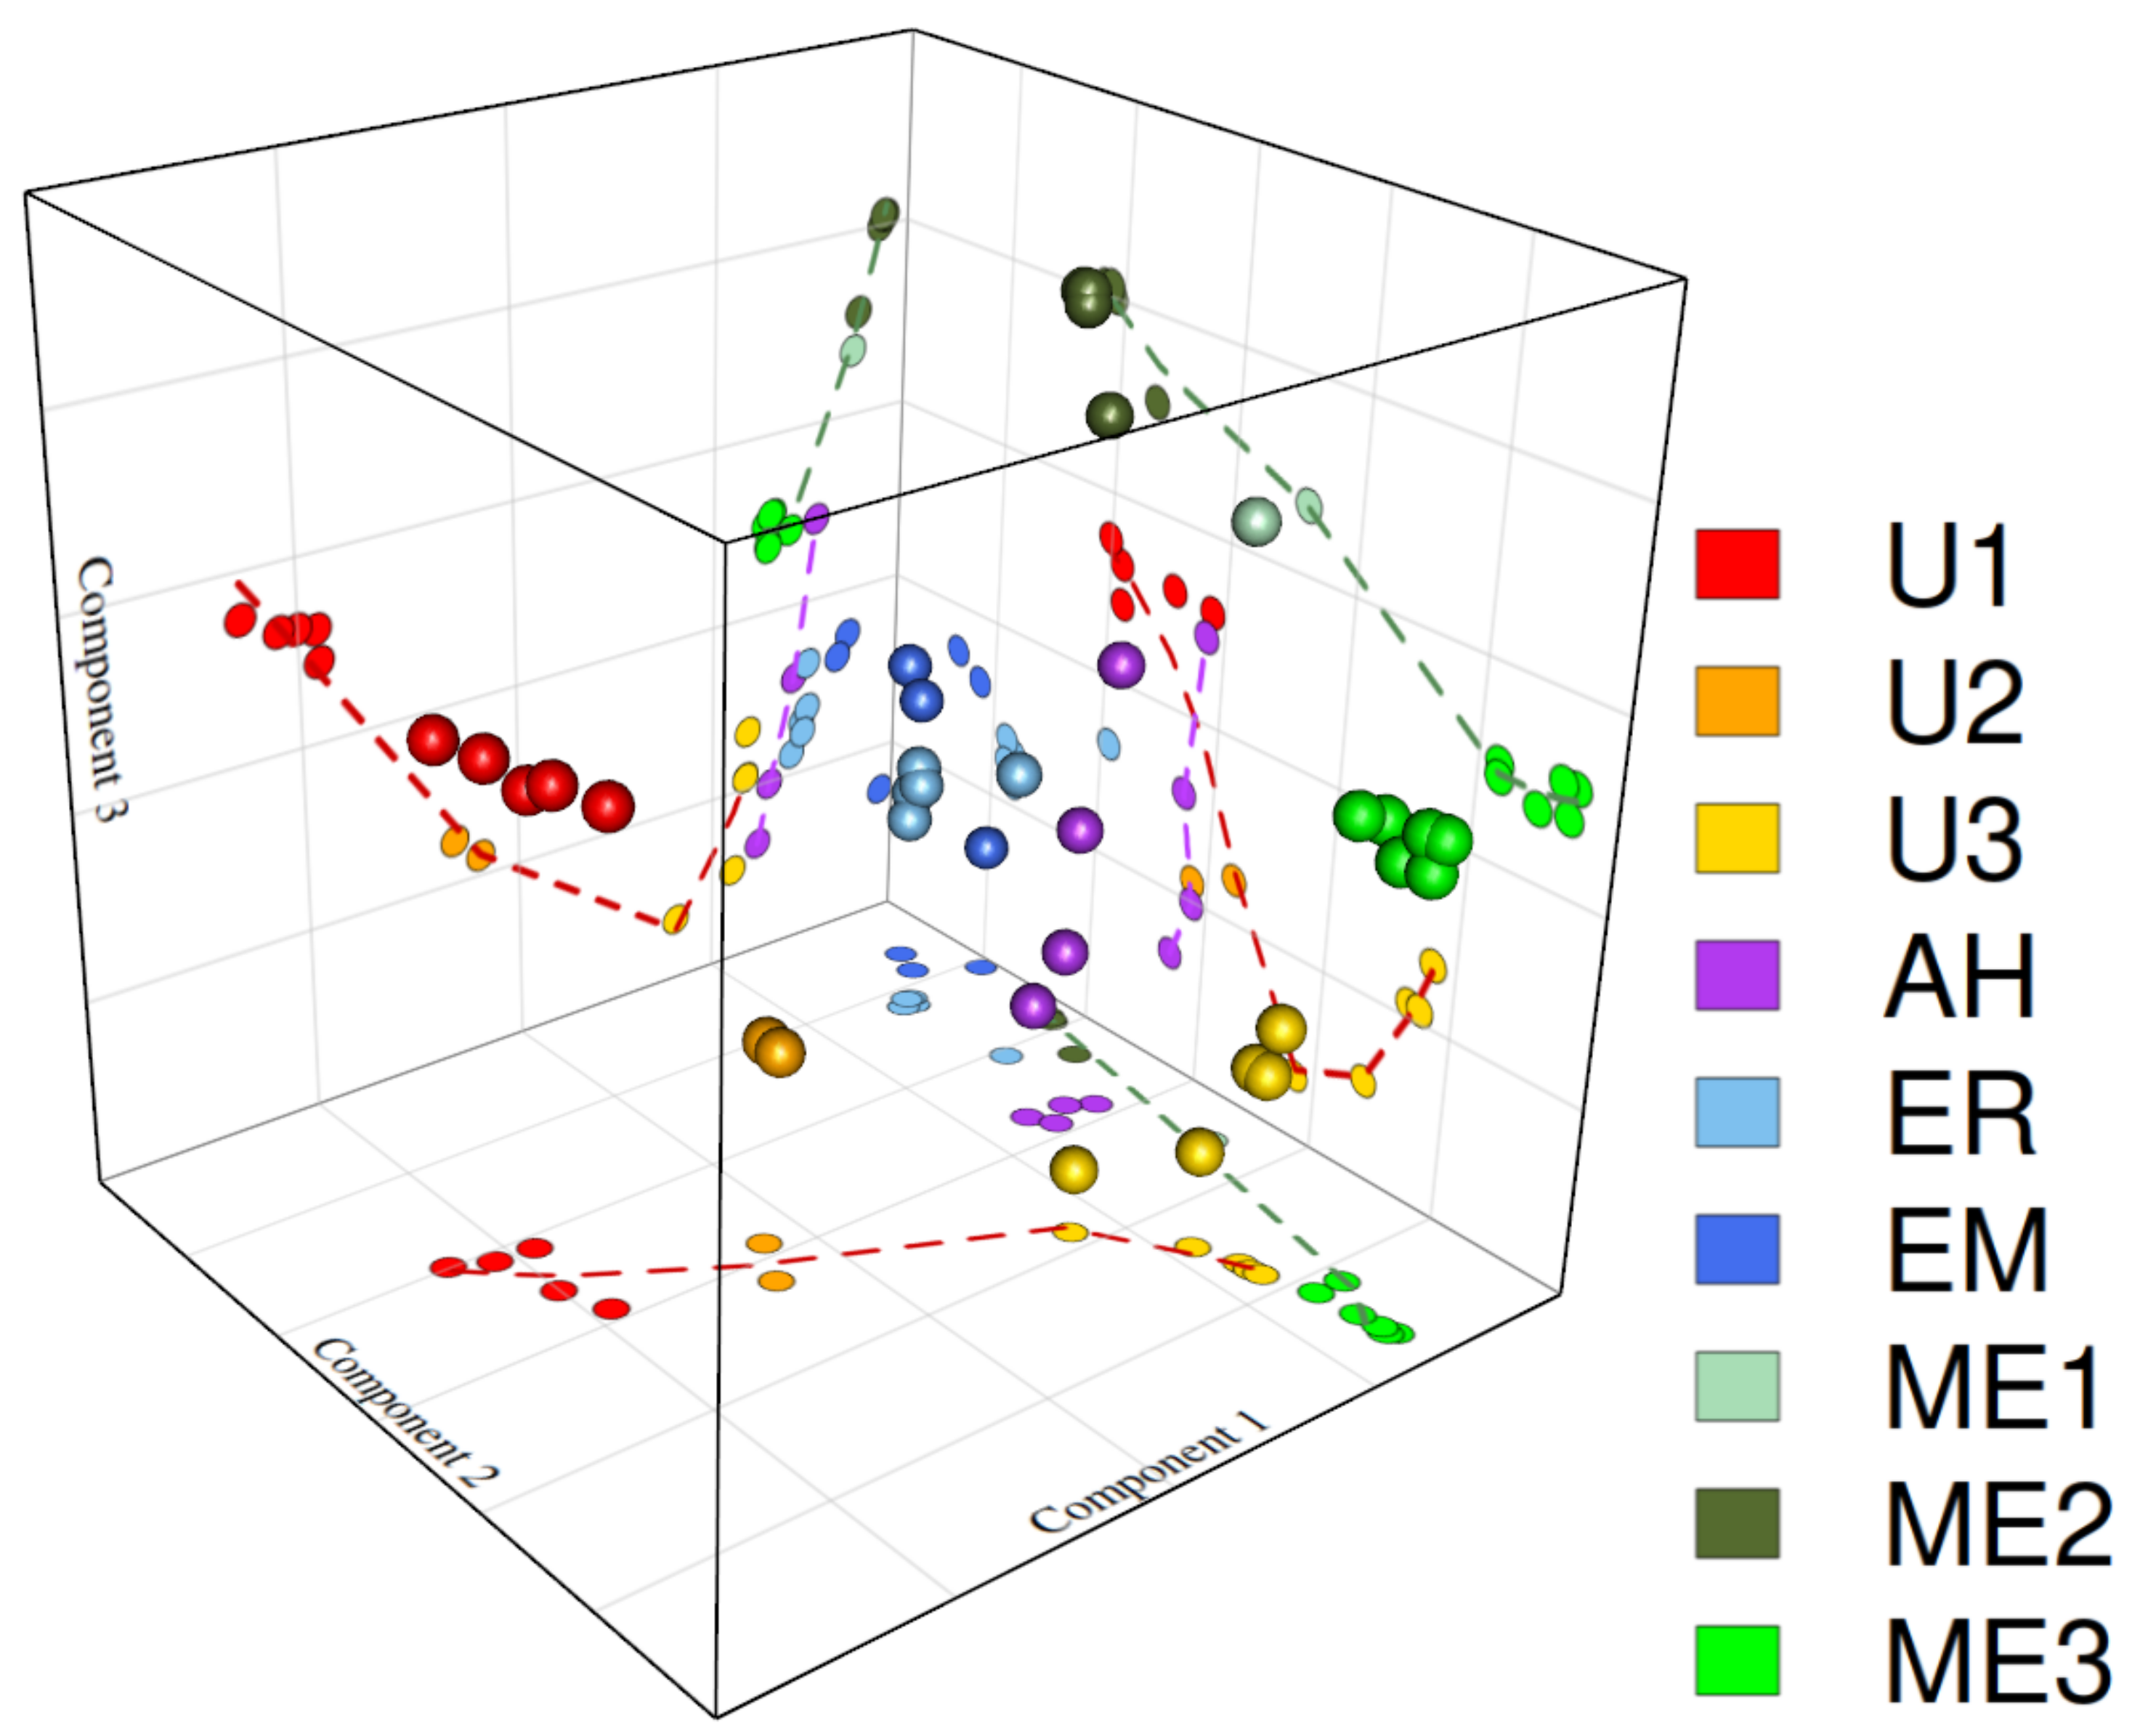
Multivariate statistical analysis provides a powerful set of tools to leverage the growing amount of available data and has been successfully used to discriminate past and active geochemical processes, especially in complex hydrogeochemical settings [54,55,56]. To fully explore the possible outcomes of such analyses, however, is outside the scope of this work, mostly because of the relatively low number of samples (n = 35) and their inhomogeneous covering of the region of study. Furthermore, the possible end members of the groundwaters and brines in the region of interest have already been identified in Section 3.2. A clustering algorithm is applied to the data of Table 1, limited to the elemental concentrations. This means grouping the samples into a specified number of categories based on the dissimilarities between their chemical components, in a data-driven approach, and thus, irrespective of the locations of the samples. The robust method called partitioning around medoids or k-medoids [57] in the implementation of [58] was hereby chosen instead of the classical k-means. The k-medoids algorithm chooses one actual data point as the center of each cluster instead of the center of mass, as in the k-means. The L1 norm or Manhattan distance (sum of the absolute distances of all components) was retained as a metric for the computation of distances for the concentration vectors. The L2 norm or Euclidean distance produced the same clustering but less readable results. The number of nine clusters was retained as a trade-off between the statistical significance of the partitioning, evaluated through the silhouette method, and the interpretability of the results. The added value of this analysis is presented in Section 4.4.
4. Results
4.1. Correlations of Solutes in Yarmouk Groundwater
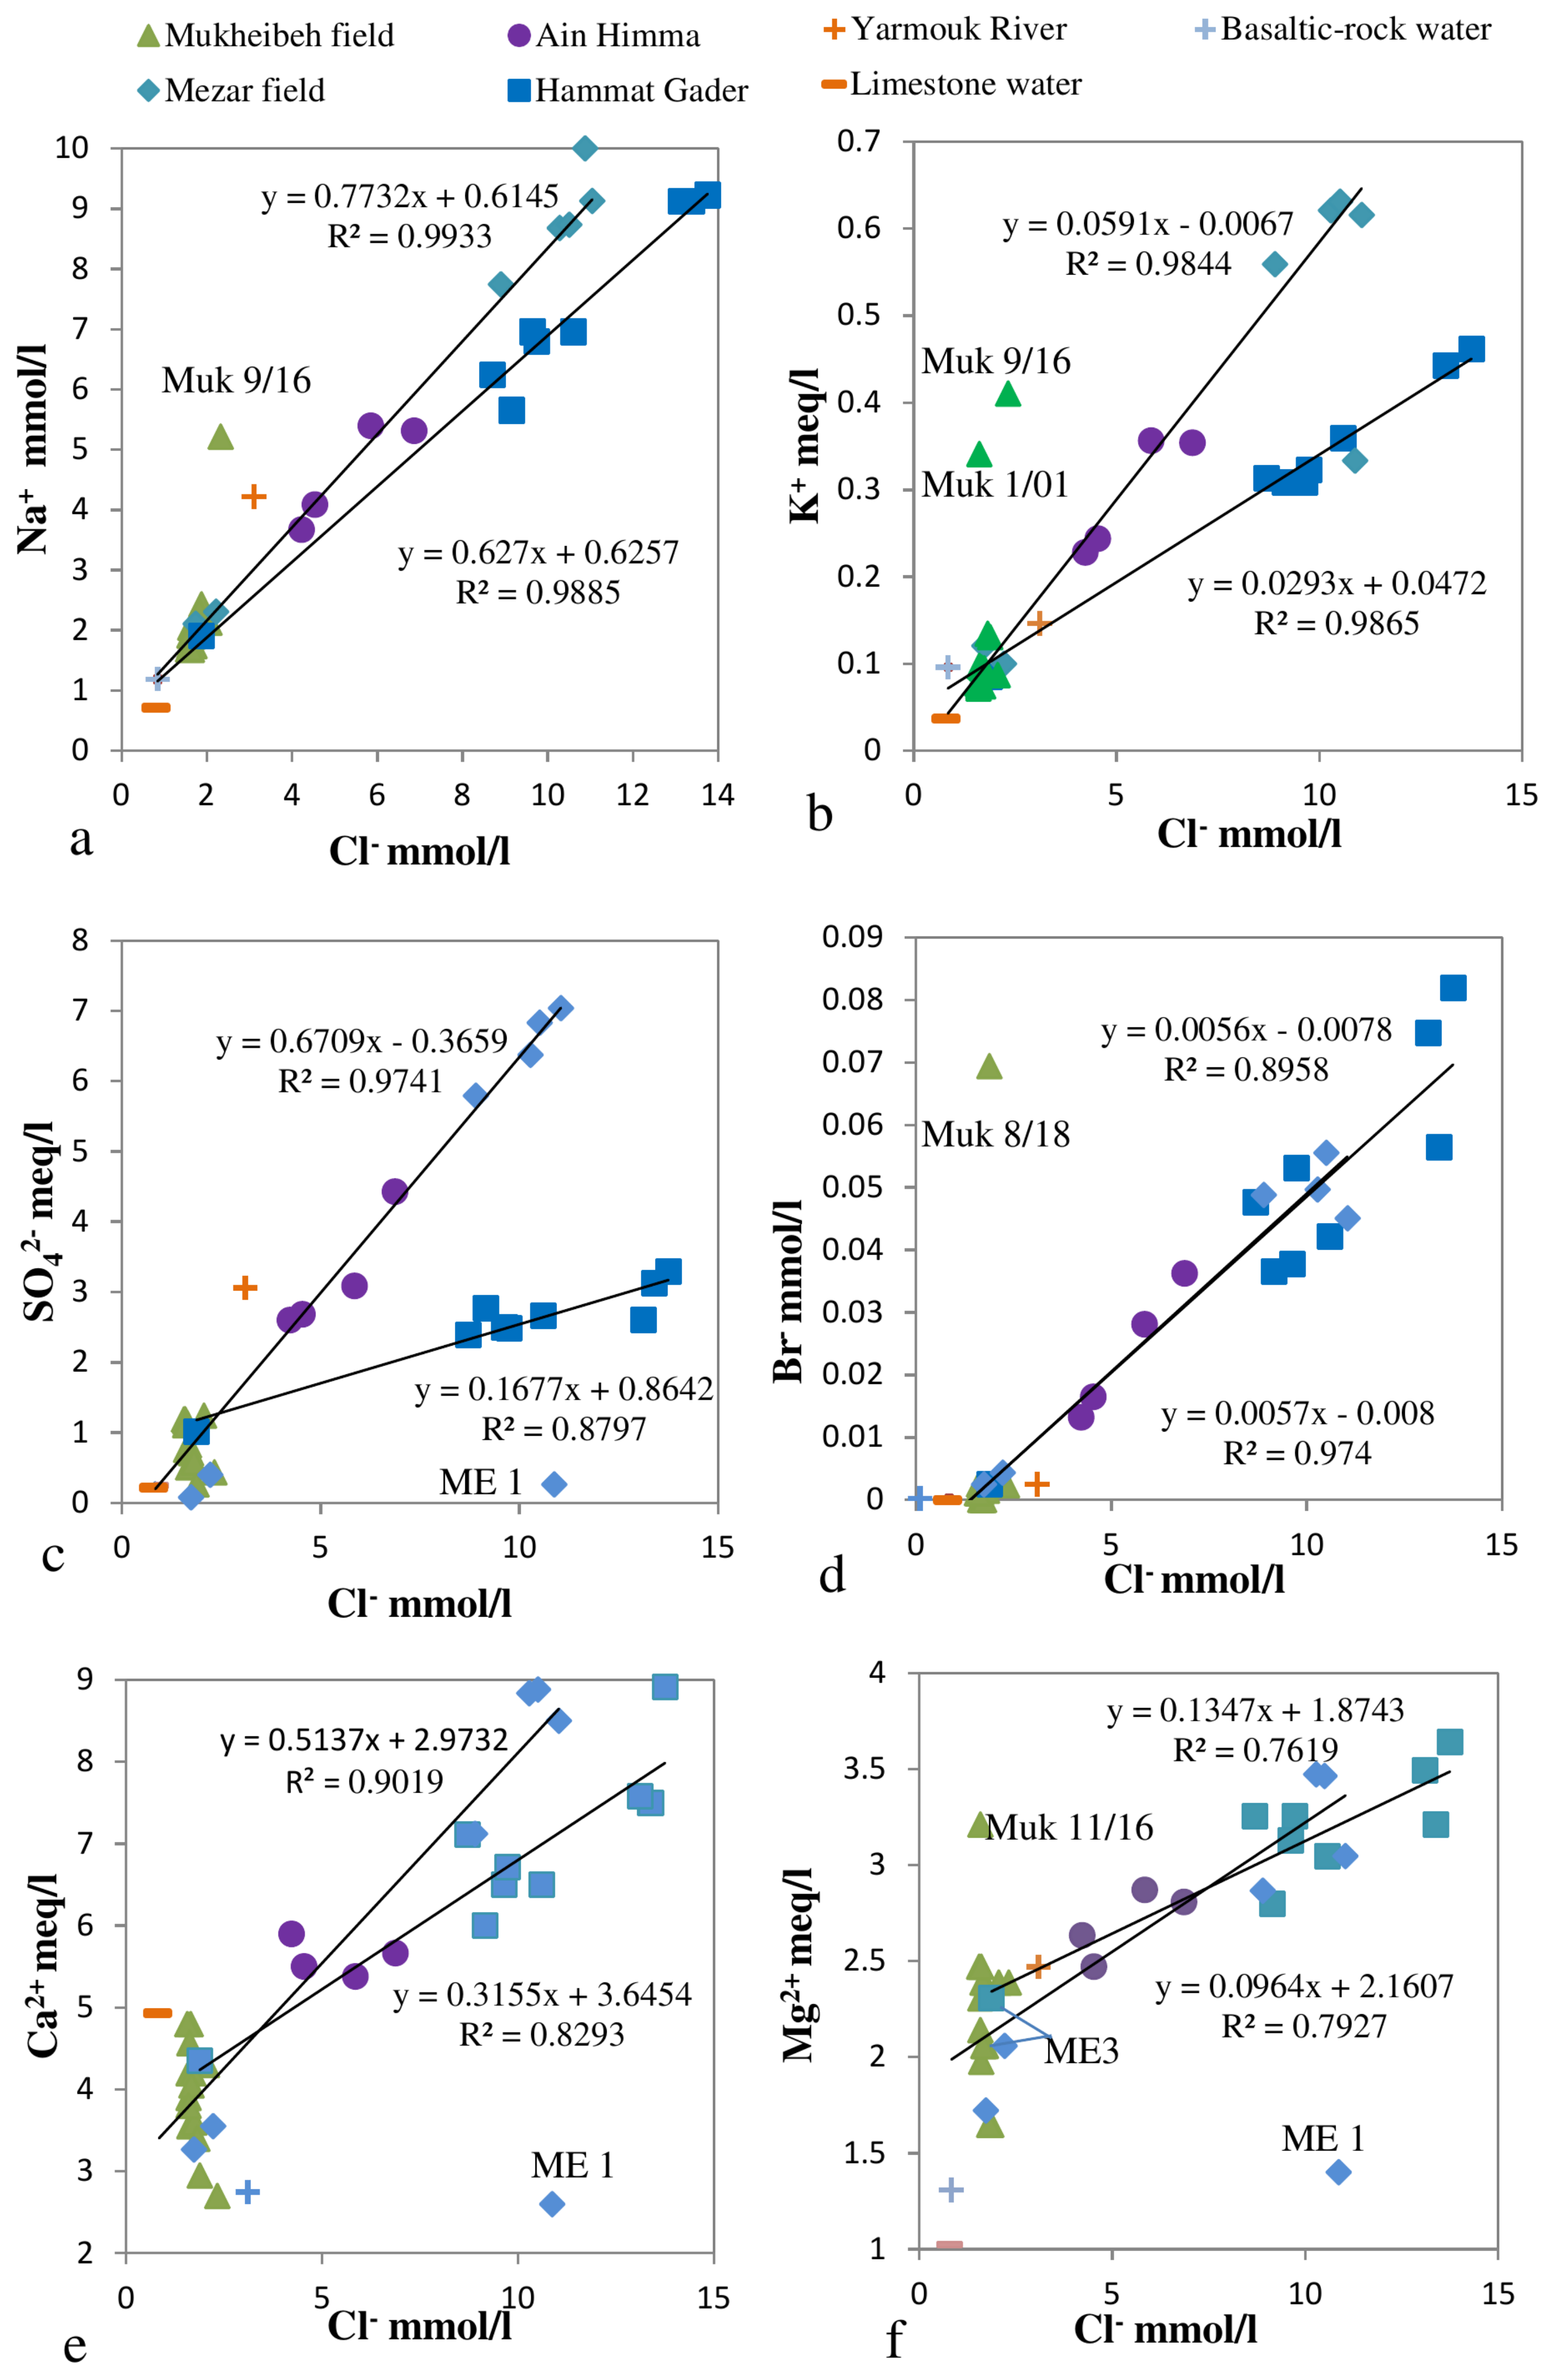
The cross plots of dissolved species in groundwater reveal relationships between end members of saline and fresh water. The fresh water end members of basaltic rock and limestone water (Table 2) are implemented in Figure 5. The correlation of various elements with Cl− reveals several things: Mukheibeh concentrations either tightly cluster (Figure 5a–d) or spread in one direction (Figure 5e–f). Waters from Hammat Gader and Mezar/Himma seem to represent dilution lines with different saline end members and the assumed basaltic rock and limestone water both plotting near the Mukheibeh cluster. The same may be true for Figure 5d, where the Br− concentrations of the low-salinity end members are close to zero. Values of Ca2+ and Mg2+ in fresh water show a wide spread, with diverging (Figure 5e) or monotonous (Figure 5f) increase with increasing Cl−. The Mukheibeh waters show enhanced Ca2+ and Mg2+ concentrations compared with the basaltic rock water and limestone water.
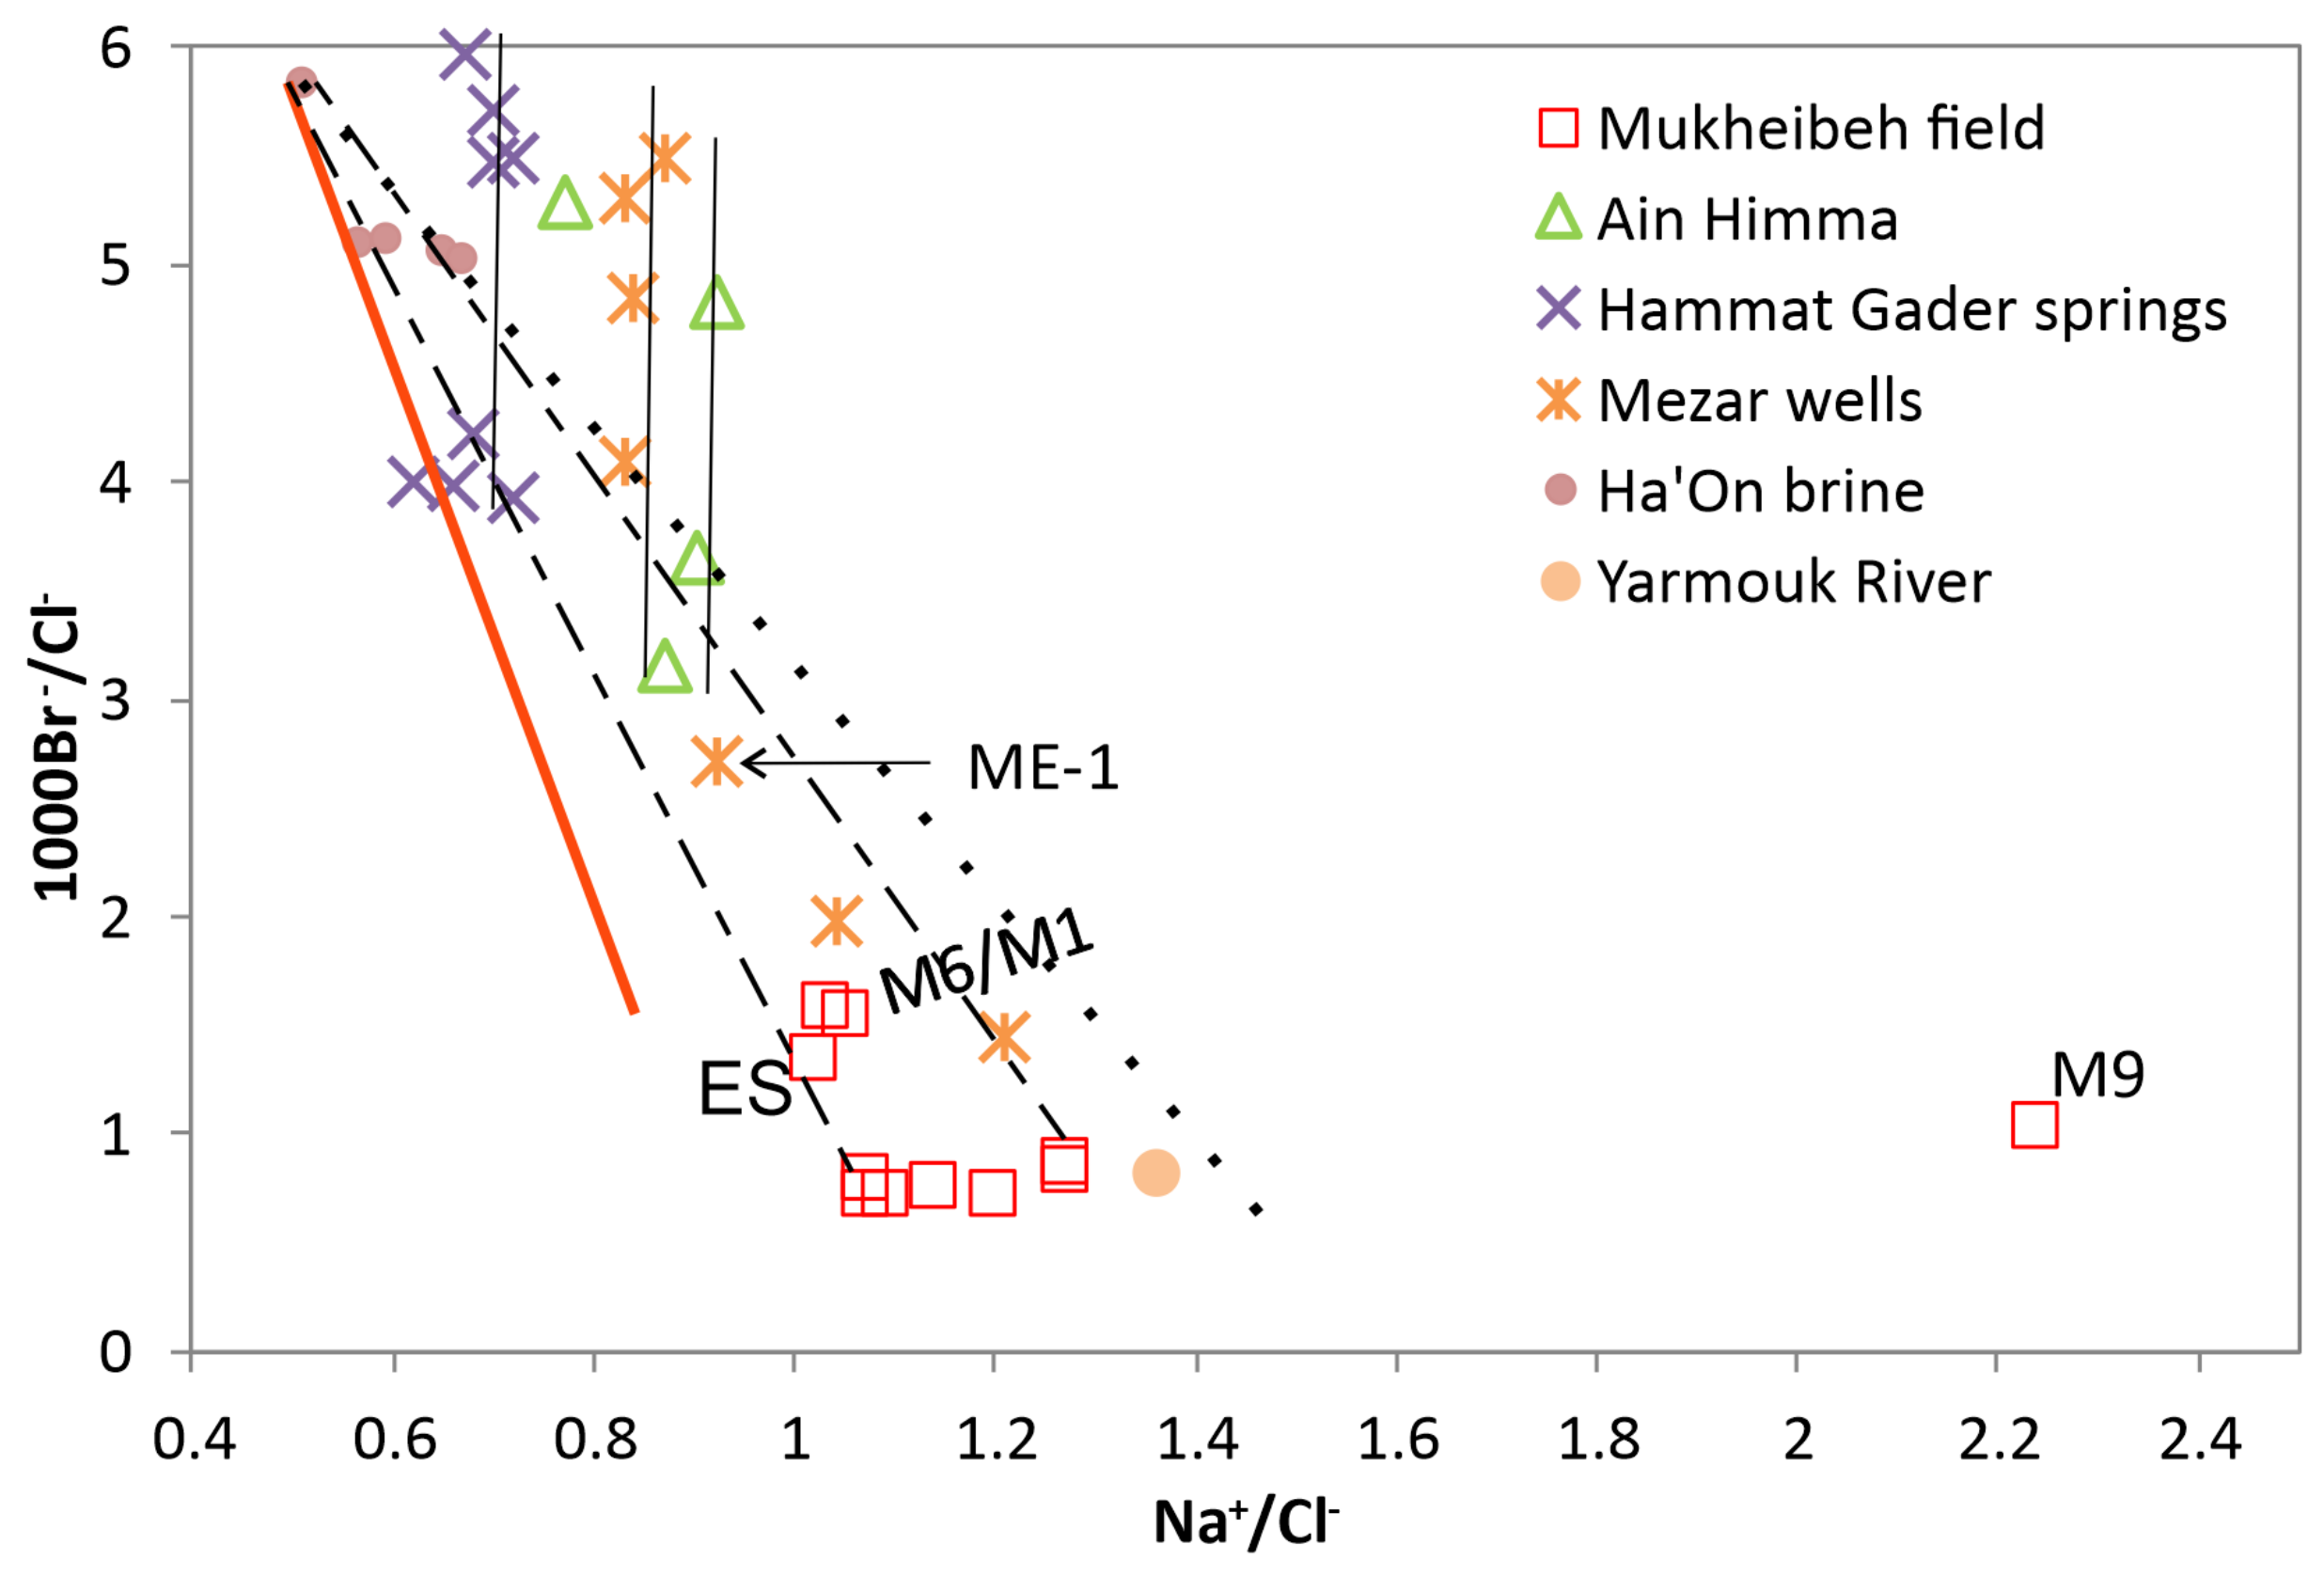
More details are revealed by the trend lines in the cross plots of 1000 × Br−/Cl− and Na+/Cl− in Figure 6. For orientation, the trend of evaporated seawater is given as a red line [59,60]. The groundwater from springs of Hammat Gader and Himma and from well Mezar 2 define vertical trends, which are only explainable by leaching of Br− from the organic-rich limestones of the B3 aquitard. Mezar 1 and 3 and the low Br−/Cl− samples of all vertical trends suggest a mixing line between Mukheibeh groundwater and evaporated seawater such as the Ha’On brine [61]. A second mixing line is indicated by Ein (Hebrew term for spring) Sahina (ES) and the wells Mukheibeh 1 and 6. The water of Mukheibeh 9 well shows an extreme position.
4.2. Mixing of Basaltic Rock and Limestone Water
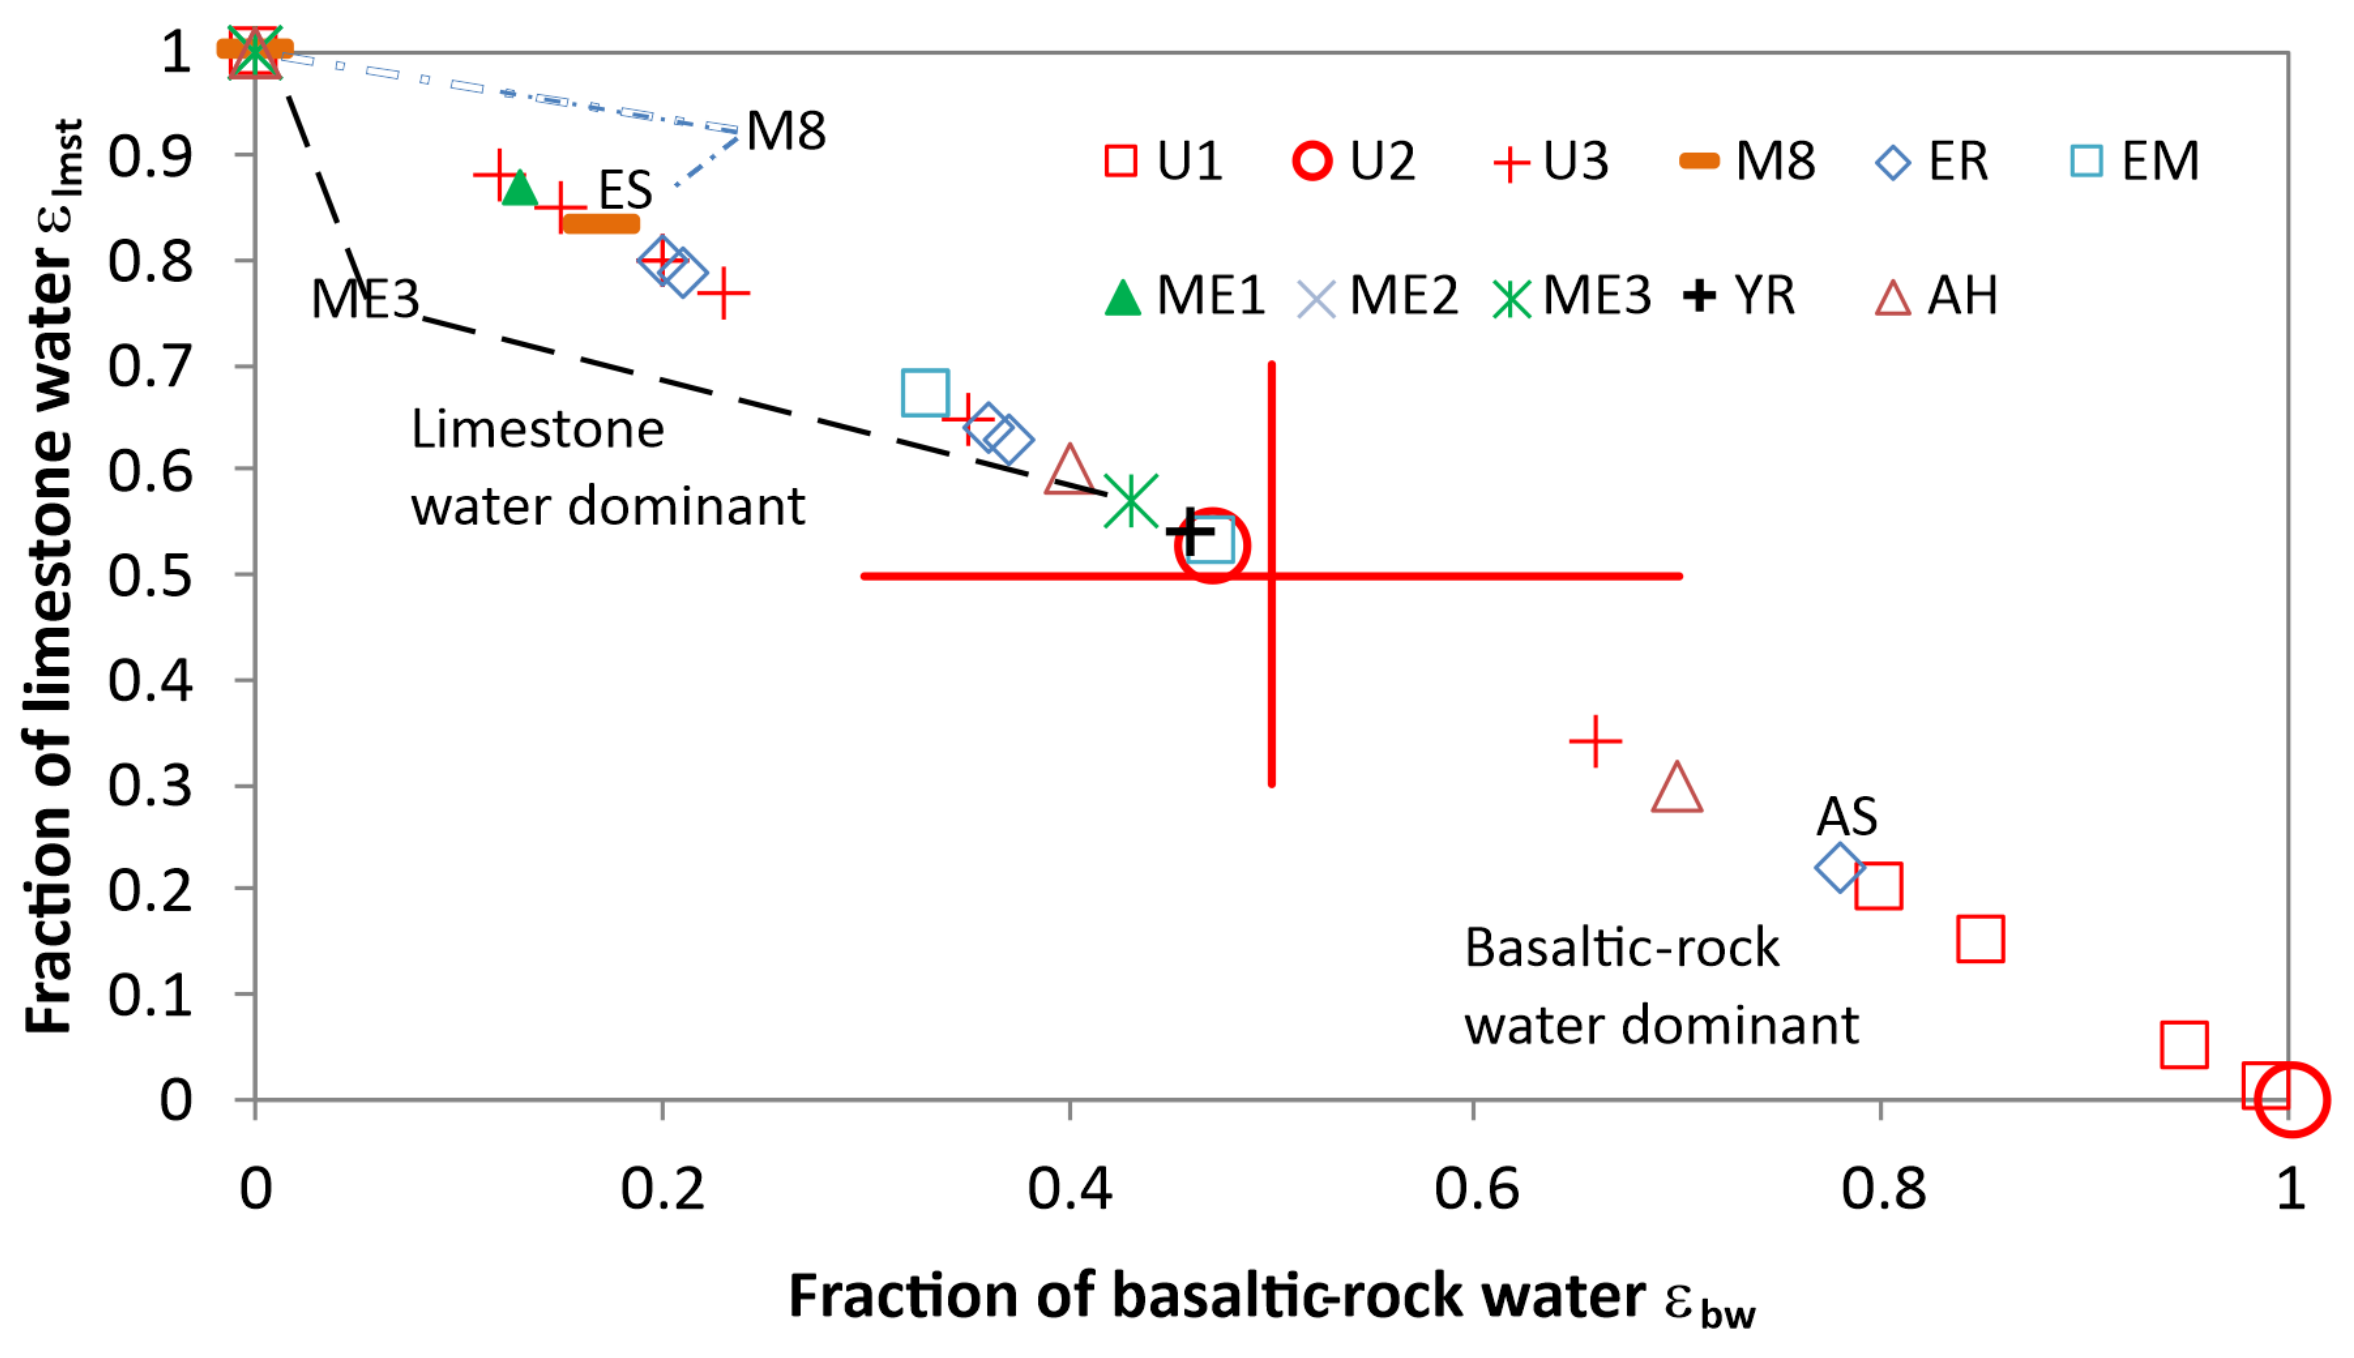
The cross plots of and show the distributions of the various types of water mixtures along the diagonal line (Figure 7). The red cross marks the arrays of either dominantly limestone or basaltic rock groundwater. The pure limestone water is presented by Mezar 2 and Mukheibeh 8 in the year 2013; the most basaltic-rock groundwater is among the Mukheibeh ones. Hammat Gader, Ain Himma and Mezar 3 cover the range of between zero and 0.5. Most of the Mukheibeh waters (U1 and U2) are of the basaltic-water type, whereas the Mukheibeh subgroup U3 (with one exception) and the remaining groundwaters are of limestone water type.
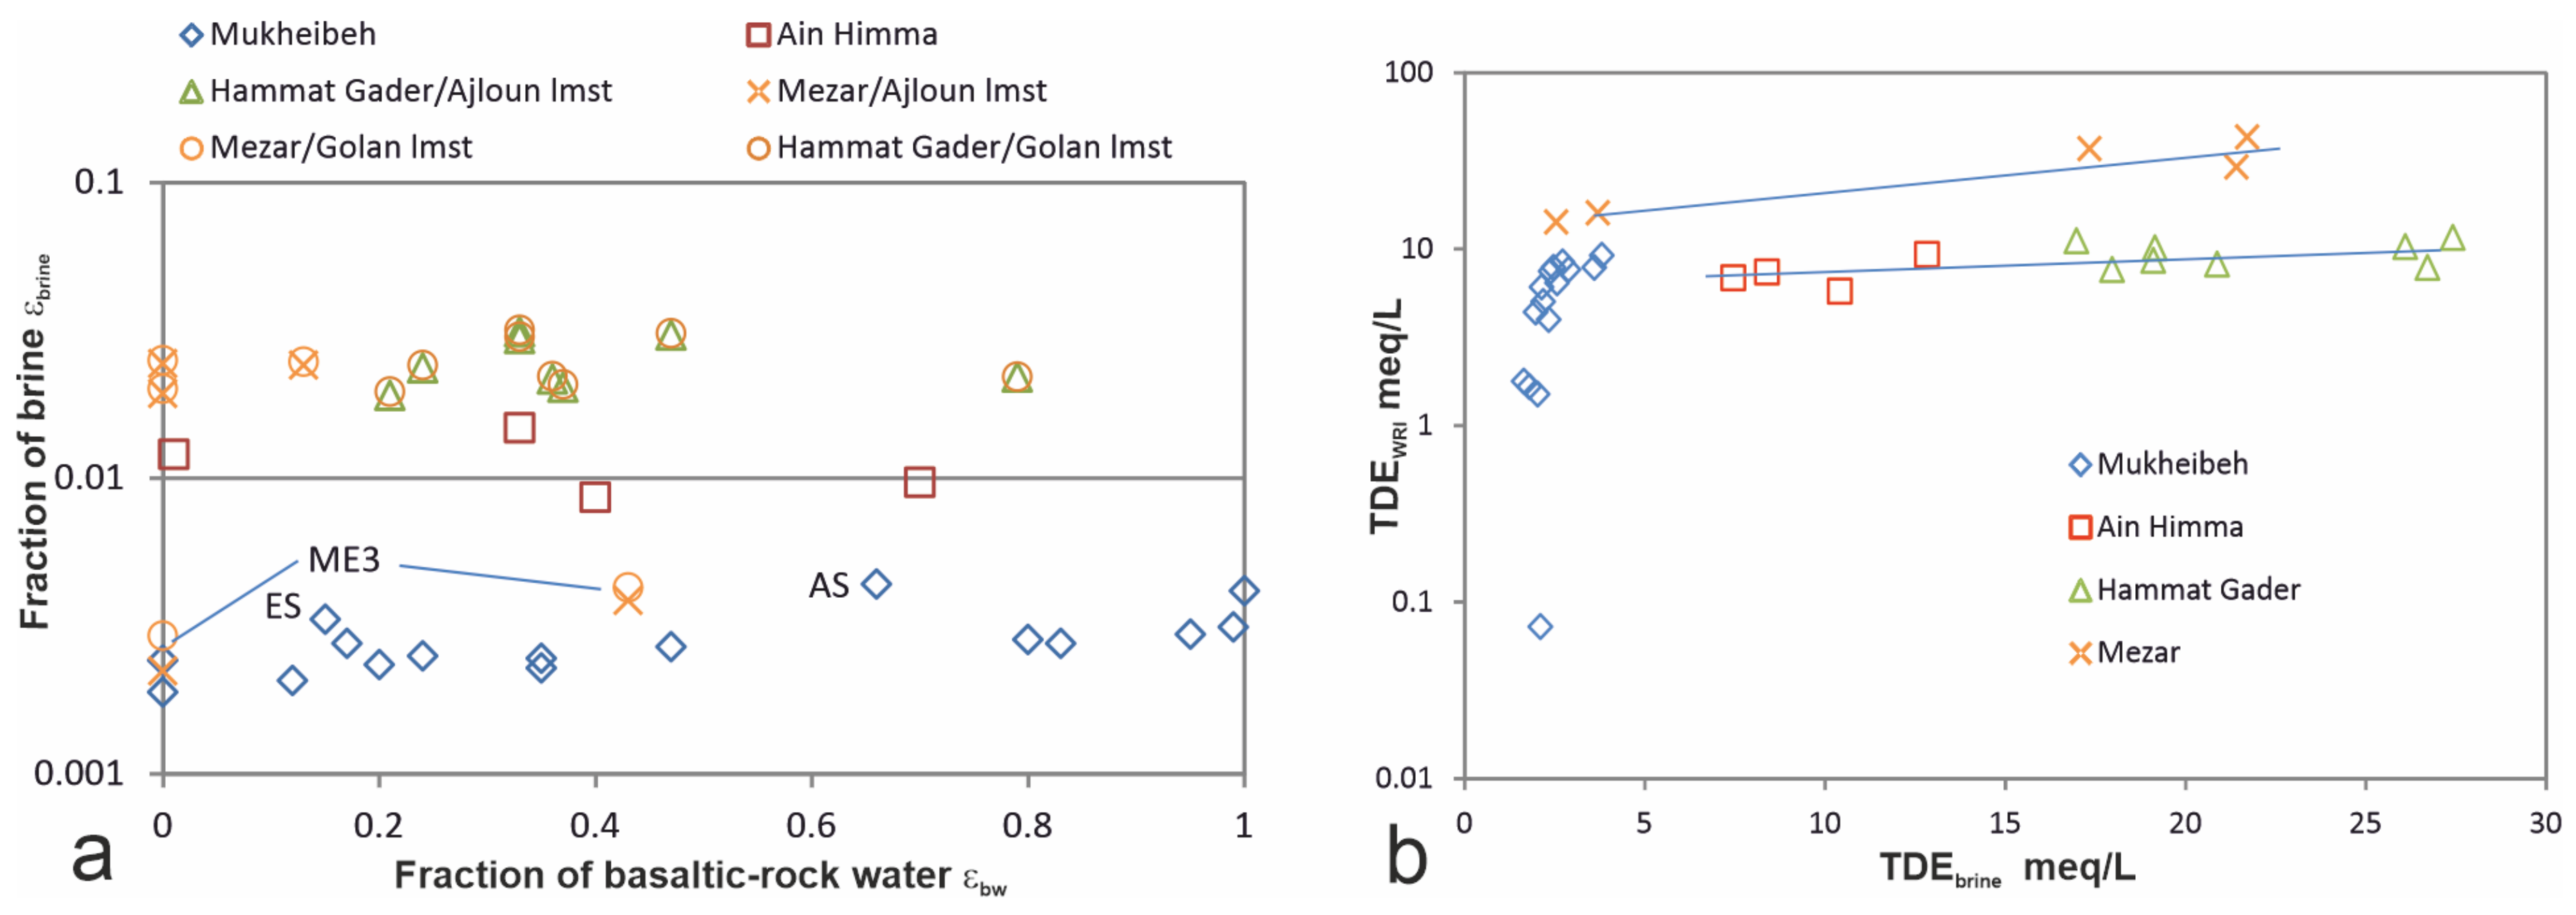
The Mukheibeh field is characterized by mixing of basaltic rock and Ajloun limestone water with of 0.0019–0.004 of Ha’On brine (Table 3); in Ain Himma water varies between 0.0086 and 0.015. When fitting Hammat Gader and the Mezar waters to mixtures of Golan limestone and basaltic rock water and Ha’On brine, ranges between 0.019 and 0.031 for Hammat Gader and ME1 and ME 2. In contrast, ME3 reveals between 0.0022 and 0.0039, resembling Mukheibeh water. After substituting the Ha’on brine by Rosh Pinna brine in Hammat Gader and Mezar 1 and 2, the declines to 0.013–0.028 (Table A2a) as the result of the enhanced chlorinity of Rosh Pinna which is 36% higher than in Ha’On brine (Table 2). The maximum of volume of brine fraction is 0.03. The cross plots of and suggest three different trends (Figure 8a). The low values of Mukheibeh water slightly increase with . Although Ein Sahina and Ain Saraya discharge in the area of Hammat Gader, they plot together with Mezar 3 and the Mukheibeh data. The trends of Hammat Gader and Mezar wells 1 and 2 show the highest fractions, while Ain Himma plots slightly lower .
4.3. Contributions by Water/Rock Interaction
Following the two suggested approaches of salinization in Section 3.2, two results are obtained depending on the origin of Cl− either from leaching of only evaporites or from leaching of evaporites (WRI) and brines. Both ways of estimations are documented in Table A2 and summarized in Table 3. The second approach yields the sum of TDEbrine and TDEWRI and a maximum for TDEbrine (Table A2), whereas yields TDEWRI+brine in Table 3. TDEWRI increases over two orders of magnitude in Mukheibeh groundwater. Contrastingly, the increase of TDEWRI in each of Mezar, Ain Himma and Hammat Gader is less than a factor of two (Figure 8b). The contributions of TDE from water/rock interactions (TDEWRI) are less those by brine (TDEbrine) in Hammat Gader, Mezar and most of the Ain Himma samples.
From the estimated species i of WRI or WRI+brine (Table A2), the amounts of dissolved gypsum and calcite are given by and in mmol/L in Table 3. The amount of halite equals the amount of Cl− in meq/L; (−) signs indicate precipitation; (+) values show dissolution. Calcite shows precipitation when fitting Hammat Gader and Mezar waters with Ajloun limestone water, which is not the case when using Golan limestone water. The compositions of brines from Hammat Gader and groundwater from Mezar 1 and 2 are estimated for various combinations of brines and fresh waters. The results of these mixing estimates are compiled in the lower parts of Table A2 and Table 3. The differences in mixing either Ajloun or Golan limestone water with either Ha’On or Rosh Pinna brines yield similar results for gypsum dissolution but significantly different ones for the dissolution of calcite. In the presence of brines, calcite is precipitated from Ajloun limestone water, whereas in Golan limestone, calcite dissolves. In the absence of brine, some Hammat Gader waters dissolve calcite, and Mezar groundwater precipitates calcite when fitted to Golan limestone water. The estimates reveal dissolution of significant amounts of gypsum and calcite in waters from Ain Himma, springs of Hammat Gader and well Mezar 2, whereas Mukheibeh waters dissolve much smaller amounts of both minerals (Table 3). The dissolution of calcite and gypsum leads to enhancement of Ca2+ in Mukheibeh groundwater (Figure 5e). The increase of Mg2+ in groundwater (Figure 5f) is caused by high Mg2+ concentration in the admixed Ha’On brine.
The cross plots of calcite and gypsum reveal that their amounts are very similar and independent on the absence or presence of brine Equation (2). Gypsum is always dissolved, but calcite is both dissolved in Hammat Gader, Mezar and part of the Muhheibeh waters, and precipitated in the other part of Mukheibeh and Himma water (Figure 9a). The cross plots of halite and gypsum dissolution only reveal two trends between Mukheibeh at one end and either Hammat Gader waters or Mezar and Himma waters at the other end (Figure 9b).
4.4. Data Interpretation through Multivariate Statistical Analysis
The results of the k-medoid clustering are visualized in terms of principal coordinates in the three-dimensional plot of Figure 10. Hereby a classical multidimensional scaling (otherwise known as principal coordinates analysis [62,63]) was performed on the dissimilarity matrix already computed by the clustering algorithm described above. These three first coordinates cumulatively explain 83% of the variance of the samples of Table 1. The spheres represent the positions of samples in the vectorial space of the principal coordinates; the similarly colored small dots indicate the corresponding projections on the three faces of the cube. In the C1/C2 plane Mukheibeh waters (code U1, U2, U3 in Table 1) yield a curve which is far away from the projection of Hammat Gader samples (codes ER and EM). ME2 waters show some relationship to ME1. The projections onto C1/C2 and C1/C3 planes reveal that ME3 waters are closely associated with code U3 in plane C1/C2. Only in the plane C2/C3 are ME3 and U3 well separated. Ain Himma is well separated from Hammat Gader and Mukheibeh (U1-U3) in the C1/C2 plane.
To summarize, Figure 10 visualizes and validates the grouping of waters and brines based on the similarities in chemical analyses (restricted to major ions) compiled in Table 1. The different code groups in Figure 10 form either clusters or strings in space, thereby indicating constant or variable mixtures, respectively.
5. Discussion
5.1. Sources of Salinization
Because the fractions of basaltic rock and limestone water are based on interpretations of REY patterns, it should be kept in mind that the end member limestone water may have already dissolved some gypsum and halite. This may have led to overly high brine and limestone water fractions, due to which the fraction of basaltic-rock water was lowered. For similar reasons the true contribution of WRI may be slightly higher than derived in Table 3. Possible atmospheric contributions are minimized by selecting basaltic rock and limestone water with the lowest Cl− concentrations.
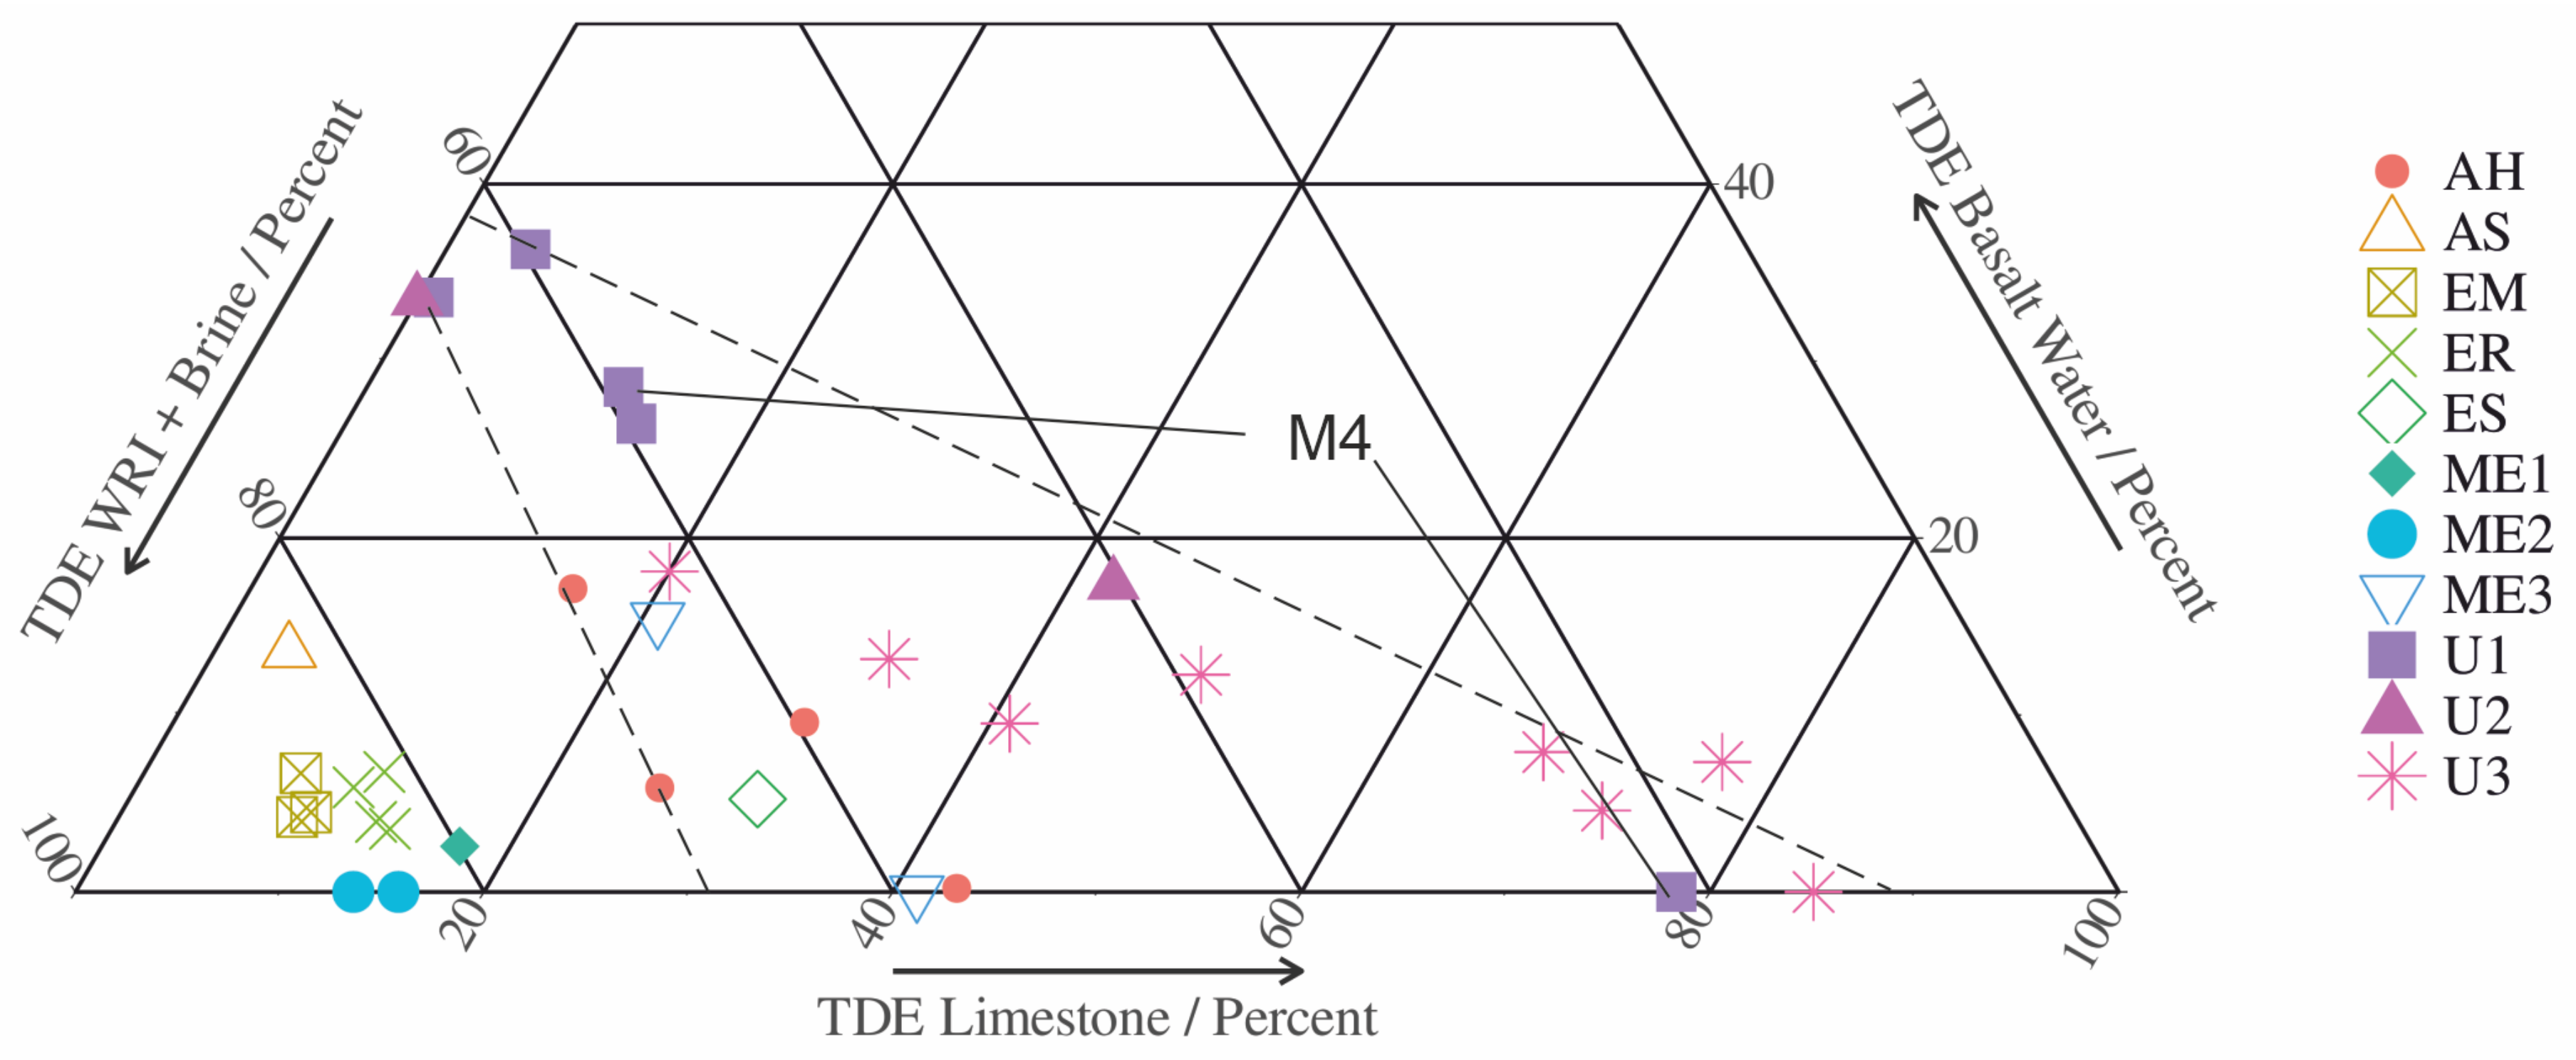
The triplot visualizes the differences of the various local groundwaters and brines (Figure 11). The contributions TDEWRI+brine, TDEbw and TDElmst in groundwaters show a narrow cluster of Mezar wells 1 and 2, Hammat Gader and Ain Saraya samples, whereas water from Mukheibeh well field, Ain Himma and Mezar 3 covers a wide field between the dashed lines. The contributions in TDE from brine and WRI are between 10% and 70%; contributions are 80% and 90% in Mukheibeh, Ain Himma and Mezar 3 and Hammat Gader and Mezar wells 1 and 2. These estimates do not really differ, if the sources of limestones water or brines are varied.
The Mukheibeh groundwater originates from an aquifer with a constant contribution of brine but increasing dissolution of calcite (Figure 9a). Calcite in code group U3 and Ain Himma is always precipitated (Table 3) contrasting the mixing in Hammat Gader, and Mezar wells 1 and 2. The mixture of Mount Hermon/Golan limestone water and Ha’On brine in Mezar 2 distinctly differs from Hammat Gader by enhanced contributions by WRI (Figure 8, Figure 10 and Figure 11). The correlation of gypsum and halite suggests dissolution of evaporites (Figure 9b).
In the assumed absence of brine the dissolution of halite amounts to about 1 mmol/L for Mukheibeh and Mezar 3; about 4–6 mmol/L in Ain Himma; and between 8 and 13 mmol/L in Hammat Gader and Mezar wells 1 and 2 (Table 3; Figure 11). Independent on the type of estimate, the dissolution of gypsum varies between 0 and 0.5 mmol/L in Mukheibeh and Mezar well 1 and 3 waters. It ranges from 1 to 3.5 mmol/L in Ain Himma, Hammat Gader and Mezar 2.
In the absence of deep brines, gypsum and calcite are dissolved in Hammat Gader and Mezar 1 and 3 in Golan limestone water. In the presence of Rosh Pinna brine instead of Ha’On brine, calcite often has to be precipitated, making the former less reasonable because the limestone water is already saturated with respect to calcite. Mezar 3 does not dissolve gypsum but calcite, particularly in the presence of Rosh Pinna brine (Table 3). Taking Ajloun limestone water and Ha’On brine, calcite is precipitated from groundwater of Hammat Gader and Mezar (Table A2), suggesting that Ajloun water is not present in any in these waters.
All groundwater mixes with brine present in aquifer rocks and interacts with aquifer rocks. The contribution of brine dominates the salinity of groundwater. The Tortonian Ha’On brine was identified in the study area. It is reasonable to assume that this brine infiltrated the Cretaceous (and probably Jurassic) limestone aquifers and is therefore omnipresent in the surroundings of the Yarmouk Gorge [29]. Estimates based on the contributions of Rosh Pinna brine abundantly lead to dissolution of calcite when applying Equation (2), which is unreasonable because in limestone aquifers calcite saturation should be attained.
5.2. Groundwater Divide between the Ajloun and the Golan Heights
Chemical similarities suggest that Mezar 3 on the northern Yarmouk River bank, but located very near to the LYF, produces groundwater of the Mukheibeh type (Figure 3). Ein Sahina and M5, both north of LYF, produce water of the Mukheibeh type (Table 1). Ain Saraya south of the Yarmouk River, just opposite of Hammat Gader but north of LYF, produces water typical for Hammat Gader (Table 1). Ain Himma, located southwest of the Yarmouk River but north of the LYF, is seemingly related to Hammat Gader brines (Figure 5). The thermohaline water of Hammat Gader seems to ascend along faults from greater depth. These examples of distribution of salinized groundwater indicate that probably not the Yarmouk River, but instead, the LYF delineates the groundwater divide between the Ajloun and the Golan Heights. LYF clearly separates the Mukeibeh well field with 0.002 < εbrine < 0.004 from the Mezar well field (0.02 < εbrine < 0.04), Ain Himma (0.009 < εbrine < 0.013) and Hammat Gader region (0.02 < εbrine < 0.04).
Although the LYF follows the trend of the Yarmouk River, the chemical composition of local groundwater and brines is oriented according to the LYF and not the political border between Jordan and Israel given by the Yarmouk River. According to the regional differences, the transboundary flow may be influenced by local pumping on the Israeli side, the artesian outflow on the Jordanian side and recharge of the common aquifer on both sides of the LYF.
In well and spring water of the Mezar field and Hammat Gader region, significant changes in REY patterns [15] indicate variation in groundwater flow and mixing of basaltic rock and limestone waters (Figure 4b). Mezar 3 in 2008 produced water with the same REY pattern of Mezar 2, which definitely originates from the deep aquifer in the Golan. In Figure 11 Mukheibeh 2, 4 and 8 show high variations in composition within the Mukheibeh array of dashed lines. This behavior suggests that their flow system probably depends on pumping and recharge. The most extremely different compositions reveal waters from the wells Mezar 2 (depth −807 m) and Mezar 3 (depth −102 m), drilled few tens of meters apart. Mezar 3 water in 2001 and 2016 was of the Mukheibeh type (Figure 2). In 2008, Mezar 2 and 3 showed the same type of REY patterns which do not fit into Figure 4a [15].
Figure 5, Figure 6, Figure 8, Figure 10 and Figure 11 suggest different aquifers. The uppermost fresh water aquifer producing the Mukheibeh type is dominantly recharged by either basaltic-rock or limestone water. Some of the infiltrated water penetrates into deeper aquifers and leaches along their flow paths, evaporites and relics of brine. The deepest aquifer is that of Mezar 2. Hammat Gader originates from an aquifer which enables much less contact with gypsum but slightly more with halite, whereas Mezar 2 and Himma water had more contact with gypsum and less halite.
6. Conclusions
The combined use of REY, multivariate statistical analysis, chemical features and geological features represents a new approach with which to semiquantitatively determine the contributions of various sources of salinization in groundwater, such as basaltic-rock and limestone water, water/rock interactions and leaching fossil brines. The contribution of atmospheric precipitation is considered as part of the recharge water or to be negligible in water with lowest Cl− concentrations.
The basaltic-rock-dominated waters show the lowest salinities. The basaltic-rock waters show higher TDEWRI than TDEbrine. The basaltic-rock groundwaters from the Hauran Plateau mix with limestone water from either the Ajloun or the Golan Heights depending on the positions of springs and wells south or north of the Lower Yarmouk Fault, respectively. South of LYF, the artesian Mukeihbeh well field produces in its central segment, groundwaters of almost pure basaltic-rock type with a low contribution of limestone water and <0.3 vol-% of Tertiary brine, hosted in deep Cretaceous and Jurassic formations. In the Mukheibeh field the total dissolved equivalents of solutes gained by water/rock interaction and mixing with brine, TDEWRI+brine, amounts to 10–65%. Further away from this center, the contribution of limestone water originating from the Ajloun Mountains increases. The limestone waters manifest the highest salinities. These waters occur in the region of Mezar and Hammat Gader. North of the LYF, the Mezar wells, the springs of Hammat Gader and Ain Himma, produce dominantly limestone water, which contains 0.14–3 vol-% of the Tertiary brine and hence possess variable salinity.
The water of Ain Himma composition sometimes resembles that of Mezar 2, suggesting groundwater from great depth. Ain Saraya south of the Yarmouk River produces a similar type of saline water as in Hammat Gader north of the LYF. The total dissolved equivalents of solutes gained by water/rock interaction and mixing with brine, TDEWRI+brine, amount to 60–70% of total salinity in Ain Himma and Mezar 3 well; 55–70% in the springs of Hammat Gader; and 80–90% in wells Mezar 1 and 2. The uniform trend of Mg2+ with Cl− in all groundwaters except the Mukeheibeh ones suggest leaching of the Tertiary Ha’On brine which is of Mg2+-Cl− type. The different dilution trends of other dissolved species such as Na+, K+, Ca2+, Br− and of either Hammat Gader or Mezar/Ain Himma indicate differences in occurrences of evaporite minerals in the respective aquifers. The salinity of groundwater in the study region is mainly due to (i) leaching of remnants of Tertiary Rift brine and not to mixing with relicts of the Triassic brine, and (ii) water/rock interactions, such as dissolution of halite, gypsum and calcite. Running sub-parallel to the Yarmouk River, the LYF seems to be the actual groundwater divide between the Ajloun and the Golan Heights. The Lower Yarmouk fault seemingly acts as the divide between the Ajloun and the Golan Heights-dominated groundwater. Since the Yarmouk River represents the international border between Jordan and Israel, these examples suggest transboundary flow over short distances, possibly through local N–S-trending faults and fissures beneath the river.
Author Contributions
Conceptualization: P.M.; methodology: P.M., M.D.L. and C.S.; data curation: C.S.; writing—original draft preparation: P.M.; writing—review and editing: C.S., M.D.L., N.I., F.M., E.R. and E.S.; visualization: P.M., M.D.L. and N.I.; supervision: P.M.; project administration and funding acquisition: FM. All authors have read and agreed to the published version of the manuscript.
Funding
Authors gratefully acknowledge the DFG funding support (grant Ma4450/2) in the frame of a trilateral program to support peaceful development in the Middle East.
Acknowledgments
We thank various members of the local water authorities enabling sampling along the Yarmouk River. The assistance of M. Raggad during sampling is gratefully acknowledged.
Conflicts of Interest
The authors declare that they have no conflicts of interest.
Abbreviations
The following abbreviations are used in this manuscript:
| LYG | Lower Yarmouk Gorge |
| WRI | Water/rock interaction |
| Fraction of brine | |
| Fraction of basaltic-rock water | |
| Fraction of limestone water | |
| Concentration of species i in analyzed groundwater | |
| Concentration of species i in basaltic-rock water | |
| Concentration of species i in brine | |
| Concentration of mixed basaltic-rock and limestone water | |
| Concentration of species i due to WRI | |
| TDEbw | Total dissolved equivalents due to weathered basalt |
| TDElmst | Total dissolved equivalents due to dissolved limestones |
| TDEagw | Total dissolved equivalents in analyzed groundwater |
| TDEbrine | Total dissolved equivalents in brine |
| TDEest | Total dissolved equivalents of estimated mixture of basaltic rock and limestone water |
| TDEWRI | Total dissolved equivalents due to water/rock interaction |
| TDEWRI+brine | Total dissolved equivalents due to water/rock interaction and mixing with brine |
Appendix

Table A1.
Analyses of Ha’On brine, Triassic brines of Rosh Pinna, basaltic spring waters from the Golan Heights and the Hauran Plateau and limestone waters from the Ajloun Mountains and Golan Heights. Because the analyses of Ha’On brine are from different wells for each group, the average and standard deviation (%) are given. The extrapolated concentrations of Mg2+, K+, Na+, Cl− and Br− of the original Ha’On are derived from data on evaporated seawater [59,60].
| Reference | Well | Sampling Date | Ca2+ mg/L | Mg2+ mg/L | K+ mg/L | Na+ mg/L | Cl− | mg/L | Br− mg/L | mg/L | Na/Cl eq.ratio | 1000Br/Cl eq.ratio | Mg/Ca eq.ratio |
|---|---|---|---|---|---|---|---|---|---|---|---|---|---|
| Extrapolated original Ha’On (Figure 6) | 47,500 | 14,200 | 50,000 | 184,000 | 2250 | 0.42 | 5.43 | ||||||
| Late Tertiary Ha’On brine | |||||||||||||
| Mandel 1965 [53] | D-1071 | 1961 | 1476 | 2100 | 317 | 8633 | 21971 | 32.5 | 266.6 | 384 | 0.61 | 5.38 | 2.34 |
| Mandel 1965 [53] | D-1071 | 1964 | 1427 | 2141 | 285 | 8990 | 22624 | tr | 153.2 | 341 | 0.61 | 3.00 | 2.47 |
| Mandel 1965 [53] | D-1071 | 1965 | 1285 | 2258 | 296 | 9093 | 23045 | 3.7 | 186 | 0.61 | 2.89 | ||
| Average | 1396 | 2166 | 299 | 8906 | 22547 | 18 | 210 | 304 | 0.61 | 4.13 | 2.55 | ||
| Dilution factor | 22 | 47 | 6 | 8 | 11 | ||||||||
| Bergelson et al. 1999 [64] | D-1071 | 1993 | 593 | 971 | 409 | 4040 | 9600 | 112 | 109 | 427 | 0.65 | 5.04 | 2.69 |
| Bergelson et al. 1999 [64] | D-1071 | 1993 | 589 | 1000 | 414 | 4209 | 10188 | 98.6 | 537 | 0.64 | 2.79 | ||
| Average | 591 | 985 | 411 | 4125 | 9894 | 106 | 109 | 482 | 0.64 | 4.89 | 2.74 | ||
| Dilution factor | 48 | 35 | 12 | 19 | 21 | ||||||||
| Mandel 1965 [53] | D-1072 | 1961 | 653 | 1645 | 185 | 6103 | 14670 | 117 | 179 | 1195 | 0.64 | 5.41 | 4.15 |
| Bergelson et al. 1999 [64] | D-1072 | 1993 | 599 | 1140 | 262 | 4382 | 11394 | 27.4 | 131 | 439 | 0.59 | 5.10 | 3.13 |
| Bergelson et al.1999 [64] | D-1072 | 2000 | 1078 | 1657 | 442 | 5212 | 15800 | 59.8 | 207 | 504 | 0.51 | 5.81 | 2.53 |
| Siebert et al. 2014 [2] | D-1072 | 2004 | 758 | 1169 | 394 | 4276 | 11668 | 644 | 133 | 576 | 0.56 | 5.07 | 2.54 |
| Average | 772 | 1403 | 321 | 4993 | 13383 | 212 | 163 | 678 | |||||
| Dilution factor | 34 | 44 | 10 | 14 | 14 | ||||||||
| Klein BenDavid et al. 2004 [65] | D-1072 | 2003 | 559 | 910 | 425 | 3687 | 8486 | 765 | 95.6 | 548 | 0.67 | 5.00 | 2.68 |
| Dilution factor | 52.2 | 33.4 | 13.6 | 21.7 | 23.5 | ||||||||
| Ha’On average | 902 | 1499 | 343 | 5863 | 14945 | 207 | 159 | 514 | 0.60 | 4.73 | 2.74 | ||
| Dilution factor | 31.7 | 41.4 | 8.5 | 12.3 | 14.1 | ||||||||
| Triassic brine | depth | ||||||||||||
| Starinski 1974 [66] | Rosh Pinna 1 | 3845-3864 | 26946 | 2918 | 1157 | 33415 | 105349 | 347 | 171 | 0.49 | 0.18 | ||
| Starinski 1974 [66] | Rosh Pinna 1 | 2486-2586 | 4794 | 724 | 358 | 8004 | 22819 | 1161 | 370 | 0.54 | 0.25 | ||
| Limestone water from Mount Hermon Massif | |||||||||||||
| Sie 786/08 | Ein Dan | 2008 | 65.9 | 5.4 | 0.7 | 4.3 | 9.8 | 9.0 | 0.68 | 0.14 | |||
| Sie 787/08 | Ein Banyas | 2008 | 72.3 | 12.4 | 1.5 | 9.9 | 12.9 | 57.3 | 1.18 | 0.28 | |||
| Average | 69.1 | 8.9 | 1.1 | 7.1 | 11.3 | 33.1 | 0.97 | 0.21 | |||||
| Limestone water from the Ajloun | |||||||||||||
| Siebert et al. 2014 [2] | Ain Al Azal | 96.0 | 16.8 | 0.6 | 16.1 | 32.4 | 14.6 | 291 | |||||
| Siebert et al. 2014 [2] | Ain Al Murarar | 101 | 8.04 | 2.29 | 16.6 | 24.3 | 6.06 | 277 | |||||
| Average | 98.6 | 12.4 | 1.43 | 16.4 | 28.3 | 10.337 | 284 | ||||||
| Limestone water from the Golan | |||||||||||||
| Siebert et al. 2014 [2] | Alonei HaBashan 3 | 9.9 | 8 | 4.6 | 43.3 | 17.2 | 4.9 | 132 | |||||
| Siebert et al. 2014 [2] | Allonei HaBashan 8 | 5.63 | 3.97 | 3.31 | 56.2 | 18.4 | 4.695 | 124 | |||||
| Average | 7.77 | 5.99 | 3.96 | 49.8 | 17.8 | 4.7975 | 128 | ||||||
| Basaltic-rock water from Golan Heights and Hauran Plateau | |||||||||||||
| Dafny et al. 2006 [7] | Average (n = 60) | 30.8 | 17.2 | 3.8 | 27.8 | 29.7 | 10.8 | 0.022 | 177 | 1.44 | 0.33 | 0.92 | |
| Kattan 1997 [11] | Average (n = 21) | 26.8 | 12.1 | 3.6 | 25.9 | 29.6 | 15 | 126 | |||||
| Weighted average | 29.8 | 15.9 | 3.75 | 27.3 | 29.7 | 11.9 | 0.022 | 164 |
Table A2.
Estimation of brine and water/rock contributions to the salinity of groundwaters. (a) The contribution of the basaltic-rock water, the sum of basaltic rock and limestone water; the contributions of brine are estimated based on brine after Equation (2). The difference between analyzed and estimated concentrations yield the contribution of water/rock interaction here presented as gypsum and calcite dissolution. (b) Similar to (a) but brine is set to zero. Consequently, only the sum of water/rock interaction and brine is obtained.
| after Eq. (4) | ; TDE after Eq. (7) | ||||||||||||||||||||||||||||||||||||||||||
| Estimated groundwater | Contribution of brine to estimated groundwater | Difference of analysed & estimated conc.: | Difference of analysed & estimated conc.: | ||||||||||||||||||||||||||||||||||||||||
| Sampling | |||||||||||||||||||||||||||||||||||||||||||
| Code | Source | Year | Ca | Mg | K | Na | Cl | SO | HCO | TDEgw | Ca | Mg | K | Na | Cl | SO | HCO | TDEbrine | Ca | Mg | K | Na | SO | HCO | TDEWRI | Gypsum | Calcite | Ca | Mg | K | Na | Cl | SO | HCO | TDEWRI | Gypsum | Calcite | Halite | |||||
| meq/l | meq/l | meq/l | mmol/l | meq/l | mmol/l | ||||||||||||||||||||||||||||||||||||||
| Estimates based on basaltic-rock-, Ajloun limestone water and Ha’On brine | |||||||||||||||||||||||||||||||||||||||||||
| U1 | Mukheibeh 2 | 2016 | 1.70 | 0.58 | 0.82 | 0.07 | 0.34 | 0.22 | 2.36 | 6.09 | 0.13 | 0.37 | 0.03 | 0.76 | 1.25 | 0.01 | 0.02 | 2.57 | 2.06 | 1.20 | −0.77 | 0.87 | 0.94 | 2.12 | 6.41 | 0.47 | 0.56 | 2.20 | 1.56 | −0.74 | 1.62 | 1.25 | 0.95 | 2.14 | 8.98 | 0.47 | 0.62 | 1.25 | |||||
| U1 | Mukheibeh 4 | 2016 | 4.93 | 1.02 | 0.04 | 0.71 | 0.80 | 0.21 | 4.66 | 12.37 | 0.09 | 0.23 | 0.02 | 0.48 | 0.79 | 0.01 | 0.02 | 1.63 | −0.81 | 1.05 | 0.02 | 0.55 | 0.97 | 0.02 | 1.79 | 0.48 | −0.89 | −0.73 | 1.28 | 0.04 | 1.03 | 0.80 | 0.97 | 0.04 | 3.42 | 0.49 | −0.85 | 0.79 | |||||
| U1 | Mukheibeh 4 | 2013 | 2.11 | 0.63 | 0.72 | 0.15 | 0.40 | 0.22 | 2.65 | 6.88 | 0.12 | 0.34 | 0.02 | 0.70 | 1.16 | 0.01 | 0.02 | 2.39 | 2.57 | 1.41 | −0.67 | 0.82 | 0.91 | 2.44 | 7.48 | 0.45 | 0.83 | 2.69 | 1.75 | −0.64 | 1.52 | 1.16 | 0.92 | 2.46 | 9.87 | 0.46 | 0.88 | 1.16 | |||||
| U1 | Mukheibeh 2 | 2013 | 1.57 | 0.56 | 0.85 | 0.05 | 0.32 | 0.22 | 2.26 | 5.83 | 0.14 | 0.39 | 0.03 | 0.80 | 1.32 | 0.01 | 0.03 | 2.72 | 3.09 | 1.52 | −0.80 | 0.83 | 0.96 | 2.82 | 8.43 | 0.48 | 1.07 | 3.23 | 1.91 | −0.77 | 1.64 | 1.32 | 0.97 | 2.85 | 11.15 | 0.49 | 1.13 | 1.32 | |||||
| U1 | Mukheibeh 1 | 2001 | 2.21 | 0.65 | 0.69 | 0.17 | 0.41 | 0.22 | 2.72 | 7.08 | 0.13 | 0.35 | 0.03 | 0.73 | 1.20 | 0.01 | 0.02 | 2.46 | 2.23 | 1.47 | −0.64 | 0.80 | 0.90 | 3.12 | 7.87 | 0.45 | 0.66 | 2.35 | 1.82 | −0.62 | 1.52 | 1.20 | 0.91 | 3.14 | 10.33 | 0.46 | 0.72 | 1.20 | |||||
| U2 | Mukheibeh 6 | 2016 | 1.53 | 0.55 | 0.86 | 0.04 | 0.32 | 0.22 | 2.24 | 5.76 | 0.19 | 0.51 | 0.04 | 1.06 | 1.75 | 0.02 | 0.03 | 3.60 | 2.58 | 1.32 | −0.81 | 1.03 | 1.01 | 2.74 | 7.87 | 0.50 | 0.79 | 2.77 | 1.83 | −0.77 | 2.09 | 1.75 | 1.03 | 2.77 | 11.47 | 0.51 | 0.87 | 1.75 | |||||
| U2 | Mukheibeh 7 | 2016 | 3.33 | 0.80 | 0.42 | 0.40 | 0.57 | 0.22 | 3.52 | 9.27 | 0.12 | 0.33 | 0.02 | 0.69 | 1.13 | 0.01 | 0.02 | 2.33 | 0.75 | 1.25 | −0.37 | 0.66 | 0.51 | 1.19 | 3.98 | 0.26 | 0.12 | 0.87 | 1.58 | −0.35 | 1.34 | 1.13 | 0.52 | 1.21 | 6.31 | 0.26 | 0.17 | 1.13 | |||||
| U3 | Mukheibeh 10 | 2016 | 4.25 | 0.93 | 0.20 | 0.58 | 0.70 | 0.22 | 4.17 | 11.05 | 0.11 | 0.29 | 0.02 | 0.60 | 0.99 | 0.01 | 0.02 | 2.03 | −0.76 | 0.84 | −0.13 | 0.87 | 0.60 | 0.08 | 1.50 | 0.30 | −0.68 | −0.65 | 1.13 | −0.11 | 1.47 | 0.99 | 0.61 | 0.10 | 3.53 | 0.30 | −0.63 | 0.99 | |||||
| U3 | Mukheibeh 5 | 2016 | 4.52 | 0.97 | 0.14 | 0.63 | 0.74 | 0.22 | 4.37 | 11.58 | 0.09 | 0.26 | 0.02 | 0.53 | 0.87 | 0.01 | 0.02 | 1.79 | −1.06 | 0.75 | −0.06 | 0.88 | 0.53 | 0.62 | 1.66 | 0.27 | −0.80 | −0.97 | 1.01 | −0.04 | 1.41 | 0.87 | 0.54 | 0.63 | 3.46 | 0.27 | −0.76 | 0.87 | |||||
| U3 | Mukheibeh 11 | 2016 | 3.74 | 0.86 | 0.33 | 0.48 | 0.63 | 0.22 | 3.81 | 10.06 | 0.10 | 0.28 | 0.02 | 0.58 | 0.96 | 0.01 | 0.02 | 1.97 | −0.04 | 2.07 | −0.27 | 0.85 | 0.88 | 0.90 | 4.40 | 0.44 | −0.46 | 0.06 | 2.35 | −0.25 | 1.44 | 0.96 | 0.89 | 0.92 | 6.37 | 0.45 | −0.42 | 0.96 | |||||
| U3 | Mukheibeh 9 | 2016 | 2.69 | 0.71 | 0.58 | 0.27 | 0.48 | 0.22 | 3.06 | 8.01 | 0.20 | 0.54 | 0.04 | 1.12 | 1.85 | 0.02 | 0.04 | 3.80 | −0.18 | 1.13 | −0.21 | 3.83 | 0.20 | 4.43 | 9.19 | 0.10 | −0.19 | 0.01 | 1.67 | −0.17 | 4.95 | 1.85 | 0.22 | 4.46 | 12.99 | 0.11 | −0.10 | 1.85 | |||||
| ME3 | Mukheibeh 8 | 2013 | 4.92 | 1.02 | 0.04 | 0.71 | 0.80 | 0.21 | 4.66 | 12.36 | 0.11 | 0.30 | 0.02 | 0.62 | 1.02 | 0.01 | 0.02 | 2.10 | −1.63 | 0.32 | 0.08 | 0.99 | 0.35 | −0.04 | 0.07 | 0.18 | −0.99 | −1.53 | 0.62 | 0.10 | 1.61 | 1.02 | 0.36 | −0.02 | 2.16 | 0.18 | −0.95 | 1.02 | |||||
| U3 | Mukheibeh 8 | 2016 | 4.34 | 0.94 | 0.18 | 0.60 | 0.72 | 0.22 | 4.25 | 11.23 | 0.12 | 0.34 | 0.02 | 0.70 | 1.16 | 0.01 | 0.02 | 2.39 | −1.51 | 0.36 | −0.07 | 1.13 | 0.04 | −0.24 | −0.29 | 0.02 | −0.77 | −1.40 | 0.70 | −0.05 | 1.84 | 1.16 | 0.05 | −0.22 | 2.09 | 0.02 | −0.73 | 1.16 | |||||
| U3 | Mukheibeh 13 | 2016 | 0.66 | 0.91 | 0.23 | 0.55 | 0.68 | 0.22 | 4.08 | 7.33 | 0.11 | 0.31 | 0.02 | 0.64 | 1.06 | 0.01 | 0.02 | 2.17 | 2.82 | 0.84 | −0.16 | 0.81 | 0.48 | 0.23 | 5.02 | 0.24 | 1.17 | −0.51 | 1.15 | −0.14 | 1.45 | 1.06 | 0.49 | 0.25 | 3.75 | 0.25 | −0.50 | 1.06 | |||||
| U3 | Mukheibeh 13 | 2013 | 0.79 | 0.51 | 0.37 | 1.42 | 0.44 | 0.14 | 2.15 | 5.82 | 0.13 | 0.36 | 0.03 | 0.74 | 1.23 | 0.01 | 0.02 | 2.53 | 3.13 | 1.18 | −0.30 | −0.27 | 0.36 | 2.87 | 6.97 | 0.18 | 1.39 | 0.31 | 1.20 | −0.23 | 1.42 | 1.04 | 0.29 | 1.23 | 5.26 | 0.15 | 0.01 | 1.04 | |||||
| ES | Ein Sahina | 2016 | 0.56 | 0.50 | 0.21 | 1.84 | 0.47 | 0.12 | 2.12 | 5.84 | 0.15 | 0.41 | 0.03 | 0.85 | 1.40 | 0.01 | 0.03 | 2.88 | 3.64 | 1.39 | −0.16 | −0.78 | 0.89 | 2.78 | 7.76 | 0.44 | 1.38 | −0.07 | 1.35 | −0.08 | 1.30 | 1.15 | 0.80 | 0.64 | 5.10 | 0.40 | −0.44 | 1.15 | |||||
| AH | Ein Himma | 2007 | 3.81 | 0.87 | 0.31 | 0.49 | 0.64 | 0.22 | 3.86 | 10.19 | 0.67 | 1.83 | 0.13 | 3.78 | 6.24 | 0.06 | 0.12 | 12.83 | 1.19 | 0.11 | −0.08 | 1.05 | 4.15 | 2.89 | 9.30 | 2.07 | −1.48 | 1.86 | 1.94 | 0.05 | 4.82 | 6.24 | 4.21 | 3.02 | 22.13 | 2.10 | −1.18 | 6.24 | |||||
| AH | Ein Himma | 2001 | 4.89 | 1.02 | 0.04 | 0.70 | 0.79 | 0.21 | 4.63 | 12.31 | 0.54 | 1.48 | 0.11 | 3.07 | 5.06 | 0.05 | 0.10 | 10.41 | −0.06 | 0.37 | 0.21 | 1.63 | 2.82 | 0.78 | 5.75 | 1.41 | −1.44 | 0.48 | 1.85 | 0.31 | 4.69 | 5.06 | 2.87 | 0.88 | 16.16 | 1.44 | −1.19 | 5.06 | |||||
| AH | Ein Himma | 2013 | 3.57 | 0.84 | 0.37 | 0.44 | 0.61 | 0.22 | 3.69 | 9.73 | 0.39 | 1.06 | 0.08 | 2.19 | 3.62 | 0.04 | 0.07 | 7.45 | 1.94 | 0.74 | −0.21 | 1.03 | 2.35 | 1.01 | 6.85 | 1.18 | −0.20 | 2.33 | 1.80 | −0.14 | 3.23 | 3.62 | 2.39 | 1.08 | 14.31 | 1.19 | −0.03 | 3.62 | |||||
| AH | Ein Himma | 2016 | 2.55 | 0.69 | 0.61 | 0.24 | 0.46 | 0.22 | 2.96 | 7.74 | 0.44 | 1.20 | 0.09 | 2.47 | 4.08 | 0.04 | 0.08 | 8.39 | 2.51 | 0.58 | −0.45 | 1.38 | 2.43 | 0.96 | 7.40 | 1.21 | 0.04 | 2.95 | 1.77 | −0.37 | 3.84 | 4.08 | 2.47 | 1.04 | 15.79 | 1.23 | 0.24 | 4.08 | |||||
| AS | Ain Saraya | 2016 | 2.25 | 0.65 | 0.69 | 0.18 | 0.42 | 0.22 | 2.75 | 7.15 | 0.99 | 2.70 | 0.19 | 5.59 | 9.23 | 0.09 | 0.18 | 18.98 | 3.27 | −0.23 | −0.57 | 1.19 | 2.19 | 1.54 | 7.38 | 1.09 | 0.54 | 4.25 | 2.48 | −0.38 | 6.77 | 9.23 | 2.28 | 1.73 | 26.36 | 1.14 | 0.99 | 9.23 | |||||
| ER | Ein Balsam | 2016 | 3.67 | 0.85 | 0.34 | 0.46 | 0.62 | 0.22 | 3.76 | 9.93 | 0.92 | 2.50 | 0.18 | 5.17 | 8.55 | 0.09 | 0.17 | 17.58 | 1.41 | −0.56 | −0.21 | 0.01 | 2.47 | 0.80 | 3.93 | 1.23 | −0.53 | 2.33 | 1.95 | −0.03 | 5.19 | 8.55 | 2.55 | 0.97 | 21.51 | 1.28 | −0.11 | 8.55 | |||||
| ER | Ein Reach | 2016 | 4.11 | 0.91 | 0.23 | 0.55 | 0.68 | 0.22 | 4.08 | 10.79 | 1.06 | 2.91 | 0.21 | 6.01 | 9.92 | 0.10 | 0.20 | 20.41 | 1.32 | −0.77 | −0.08 | 0.40 | 2.35 | 0.50 | 3.71 | 1.17 | −0.51 | 2.39 | 2.13 | 0.12 | 6.41 | 9.92 | 2.45 | 0.70 | 24.12 | 1.23 | −0.03 | 9.92 | |||||
| ER | Ein Reach | 2000 | 4.22 | 0.93 | 0.21 | 0.57 | 0.70 | 0.22 | 4.15 | 10.98 | 0.86 | 2.35 | 0.17 | 4.85 | 8.02 | 0.08 | 0.16 | 16.49 | 2.04 | −0.02 | −0.06 | 0.81 | 2.10 | 1.62 | 6.48 | 1.05 | −0.03 | 2.90 | 2.33 | 0.10 | 5.66 | 8.02 | 2.18 | 1.78 | 22.97 | 1.09 | 0.36 | 8.02 | |||||
| ER | Ein Reach | 2004 | 3.71 | 0.85 | 0.33 | 0.47 | 0.63 | 0.22 | 3.79 | 9.99 | 0.98 | 2.67 | 0.19 | 5.52 | 9.12 | 0.09 | 0.18 | 18.76 | 2.04 | −0.28 | −0.20 | 0.80 | 2.17 | 1.82 | 6.36 | 1.09 | −0.07 | 3.01 | 2.40 | −0.01 | 6.32 | 9.12 | 2.27 | 2.01 | 25.12 | 1.13 | 0.37 | 9.12 | |||||
| EM | Ein Makla | 2016 | 3.33 | 0.80 | 0.42 | 0.40 | 0.57 | 0.22 | 3.52 | 9.27 | 1.37 | 3.76 | 0.27 | 7.77 | 12.83 | 0.13 | 0.26 | 26.38 | 2.79 | −1.35 | −0.26 | 0.97 | 2.78 | −0.20 | 4.73 | 1.39 | 0.01 | 4.17 | 2.41 | 0.01 | 8.73 | 12.83 | 2.91 | 0.06 | 31.11 | 1.45 | 0.63 | 12.83 | |||||
| EM | Ein Makla | 2000 | 3.81 | 0.87 | 0.31 | 0.49 | 0.64 | 0.22 | 3.86 | 10.19 | 1.41 | 3.85 | 0.27 | 7.95 | 13.13 | 0.13 | 0.26 | 27.00 | 3.70 | −1.08 | −0.12 | 0.79 | 2.95 | 1.45 | 7.69 | 1.47 | 0.38 | 5.11 | 2.77 | 0.15 | 8.74 | 13.13 | 3.08 | 1.72 | 34.69 | 1.54 | 1.01 | 13.13 | |||||
| EM | Ein Makla | 2004 | 3.81 | 0.87 | 0.31 | 0.49 | 0.64 | 0.22 | 3.86 | 10.19 | 1.34 | 3.66 | 0.26 | 7.56 | 12.49 | 0.13 | 0.25 | 25.69 | 2.44 | −1.07 | −0.13 | 1.07 | 2.80 | 1.25 | 6.35 | 1.40 | −0.18 | 3.78 | 2.59 | 0.13 | 8.63 | 12.49 | 2.93 | 1.49 | 32.04 | 1.46 | 0.43 | 12.49 | |||||
| ME1 | Meizar 1 | 2016 | 4.49 | 0.96 | 0.14 | 0.62 | 0.74 | 0.22 | 4.34 | 11.51 | 1.09 | 2.98 | 0.21 | 6.15 | 10.15 | 0.10 | 0.20 | 20.88 | −2.98 | −2.54 | −0.02 | 3.23 | −0.05 | −0.98 | -3.34 | −0.03 | −1.46 | −1.89 | 0.44 | 0.19 | 9.38 | 10.15 | 0.05 | −0.78 | 17.54 | 0.02 | −0.97 | 10.15 | |||||
| ME2 | Meizar 2 | 2016 | 4.93 | 1.02 | 0.04 | 0.71 | 0.80 | 0.21 | 4.66 | 12.37 | 1.10 | 3.01 | 0.21 | 6.21 | 10.26 | 0.11 | 0.21 | 21.10 | 2.47 | −0.98 | 0.36 | 2.21 | 6.72 | −1.24 | 9.53 | 3.36 | −2.12 | 3.57 | 2.02 | 0.58 | 8.42 | 10.26 | 6.83 | −1.04 | 30.64 | 3.41 | −1.63 | 10.26 | |||||
| ME2 | Meizar 2 | 2001 | 4.93 | 1.02 | 0.04 | 0.71 | 0.80 | 0.21 | 4.66 | 12.37 | 0.87 | 2.38 | 0.17 | 4.92 | 8.13 | 0.08 | 0.16 | 16.73 | 1.32 | −0.54 | 0.35 | 2.11 | 5.50 | −0.82 | 7.91 | 2.75 | −2.09 | 2.19 | 1.84 | 0.52 | 7.03 | 8.13 | 5.58 | −0.66 | 24.64 | 2.79 | −1.70 | 8.13 | |||||
| ME3 | Meizar 3 | 2016 | 3.47 | 0.82 | 0.39 | 0.42 | 0.59 | 0.22 | 3.62 | 9.53 | 0.17 | 0.48 | 0.03 | 0.99 | 1.63 | 0.02 | 0.03 | 3.35 | −0.09 | 0.76 | −0.32 | 0.90 | 0.17 | 1.76 | 3.17 | 0.08 | −0.13 | 0.08 | 1.24 | −0.29 | 1.88 | 1.63 | 0.19 | 1.80 | 6.52 | 0.09 | −0.05 | 1.63 | |||||
| ME3 | Meizar 3 | 2001 | 4.93 | 1.02 | 0.04 | 0.71 | 0.80 | 0.21 | 4.66 | 12.37 | 0.10 | 0.28 | 0.02 | 0.57 | 0.94 | 0.01 | 0.02 | 1.93 | −1.76 | 0.42 | 0.06 | 0.83 | −0.14 | 0.49 | −0.10 | −0.07 | −0.81 | −1.66 | 0.70 | 0.08 | 1.40 | 0.94 | −0.13 | 0.51 | 1.83 | −0.07 | −0.77 | 0.94 | |||||
| Estimates based on basaltic-rock-, Golan limestone water and Ha’on brine | |||||||||||||||||||||||||||||||||||||||||||
| AS | Ain Saraya | 2016 | 1.29 | 0.54 | 0.70 | 0.49 | 0.36 | 0.20 | 2.21 | 5.78 | 1.00 | 2.72 | 0.19 | 5.63 | 9.29 | 0.10 | 0.19 | 19.11 | 4.21 | −0.14 | −0.59 | 0.84 | 2.21 | 2.08 | 8.63 | 1.11 | 1.00 | 5.21 | 2.59 | −0.39 | 6.47 | 9.29 | 2.31 | 2.27 | 27.73 | 1.15 | 1.45 | 9.29 | |||||
| ER | Ein Balsam | 2016 | 0.81 | 0.52 | 0.38 | 1.38 | 0.43 | 0.14 | 2.15 | 5.82 | 0.94 | 2.56 | 0.18 | 5.29 | 8.73 | 0.09 | 0.17 | 17.96 | 4.25 | −0.28 | −0.26 | −1.01 | 2.54 | 2.41 | 7.65 | 1.27 | 0.86 | 5.19 | 2.28 | −0.07 | 4.27 | 8.73 | 2.63 | 2.58 | 25.62 | 1.31 | 1.28 | 8.73 | |||||
| ER | Ein Reach | 2016 | 0.66 | 0.51 | 0.28 | 1.65 | 0.46 | 0.13 | 2.13 | 5.83 | 1.09 | 2.97 | 0.21 | 6.14 | 10.15 | 0.10 | 0.20 | 20.87 | 4.75 | −0.44 | −0.14 | −0.84 | 2.43 | 2.44 | 8.21 | 1.22 | 1.16 | 5.84 | 2.54 | 0.08 | 5.30 | 10.15 | 2.54 | 2.64 | 29.08 | 1.27 | 1.65 | 10.15 | |||||
| ER | Ein Reach | 2000 | 0.63 | 0.51 | 0.26 | 1.72 | 0.46 | 0.12 | 2.13 | 5.83 | 0.88 | 2.42 | 0.17 | 5.00 | 8.25 | 0.08 | 0.17 | 16.97 | 5.60 | 0.33 | −0.12 | −0.48 | 2.18 | 3.64 | 11.15 | 1.09 | 1.71 | 6.49 | 2.75 | 0.05 | 4.52 | 8.25 | 2.27 | 3.80 | 28.12 | 1.13 | 2.11 | 8.25 | |||||
| ER | Ein Reach | 2004 | 0.80 | 0.52 | 0.37 | 1.40 | 0.44 | 0.14 | 2.15 | 5.82 | 1.00 | 2.73 | 0.19 | 5.64 | 9.31 | 0.10 | 0.19 | 19.15 | 4.92 | 0.01 | −0.25 | −0.24 | 2.25 | 3.46 | 10.14 | 1.12 | 1.34 | 5.92 | 2.74 | −0.05 | 5.39 | 9.31 | 2.34 | 3.64 | 29.29 | 1.17 | 1.79 | 9.31 | |||||
| EM | Ein Makla | 2016 | 0.93 | 0.52 | 0.46 | 1.17 | 0.42 | 0.16 | 2.17 | 5.81 | 1.39 | 3.80 | 0.27 | 7.86 | 12.98 | 0.13 | 0.26 | 26.70 | 5.18 | −1.12 | −0.29 | 0.10 | 2.84 | 1.15 | 7.87 | 1.42 | 1.17 | 6.57 | 2.69 | −0.02 | 7.96 | 12.98 | 2.97 | 1.41 | 34.57 | 1.48 | 1.80 | 12.98 | |||||
| EM | Ein Makla | 2000 | 0.77 | 0.51 | 0.35 | 1.46 | 0.44 | 0.14 | 2.15 | 5.82 | 1.43 | 3.91 | 0.28 | 8.07 | 13.33 | 0.14 | 0.27 | 27.41 | 6.72 | −0.78 | −0.17 | −0.31 | 3.02 | 3.16 | 11.65 | 1.51 | 1.85 | 8.15 | 3.12 | 0.11 | 7.76 | 13.33 | 3.16 | 3.43 | 39.06 | 1.58 | 2.50 | 13.33 | |||||
| EM | Ein Makla | 2004 | 0.77 | 0.51 | 0.35 | 1.46 | 0.44 | 0.14 | 2.15 | 5.82 | 1.36 | 3.72 | 0.27 | 7.68 | 12.69 | 0.13 | 0.25 | 26.10 | 5.46 | −0.77 | −0.17 | −0.02 | 2.87 | 2.95 | 10.32 | 1.44 | 1.29 | 6.82 | 2.95 | 0.09 | 7.66 | 12.69 | 3.00 | 3.21 | 36.41 | 1.50 | 1.91 | 12.69 | |||||
| ME1 | Meizar 1 | 2016 | 0.54 | 0.50 | 0.20 | 1.89 | 0.48 | 0.12 | 2.12 | 5.84 | 1.12 | 3.05 | 0.22 | 6.30 | 10.41 | 0.11 | 0.21 | 21.41 | 0.95 | −2.15 | −0.08 | 1.81 | 0.04 | 1.24 | 1.80 | 0.02 | 0.45 | 2.06 | 0.90 | 0.13 | 8.11 | 10.41 | 0.15 | 1.45 | 23.21 | 0.07 | 0.96 | 10.41 | |||||
| ME2 | Meizar 2 | 2016 | 0.39 | 0.49 | 0.10 | 2.16 | 0.50 | 0.10 | 2.10 | 5.85 | 1.13 | 3.09 | 0.22 | 6.39 | 10.56 | 0.11 | 0.21 | 21.71 | 6.98 | −0.54 | 0.29 | 0.57 | 6.83 | 1.31 | 15.45 | 3.42 | 0.07 | 8.11 | 2.55 | 0.51 | 6.97 | 10.56 | 6.94 | 1.52 | 37.16 | 3.47 | 0.59 | 10.56 | |||||
| ME2 | Meizar 2 | 2001 | 0.39 | 0.49 | 0.10 | 2.16 | 0.50 | 0.10 | 2.10 | 5.85 | 0.90 | 2.47 | 0.18 | 5.10 | 8.43 | 0.09 | 0.17 | 17.34 | 5.83 | −0.10 | 0.28 | 0.48 | 5.61 | 1.73 | 13.82 | 2.80 | 0.11 | 6.73 | 2.37 | 0.46 | 5.58 | 8.43 | 5.70 | 1.90 | 31.16 | 2.85 | 0.52 | 8.43 | |||||
| ME3 | Meizar 3 | 2016 | 0.88 | 0.52 | 0.43 | 1.25 | 0.42 | 0.15 | 2.16 | 5.81 | 0.19 | 0.53 | 0.04 | 1.09 | 1.80 | 0.02 | 0.04 | 3.70 | 2.48 | 1.01 | −0.36 | −0.03 | 0.23 | 3.22 | 6.54 | 0.12 | 1.12 | 0.08 | 1.24 | −0.29 | 1.88 | 1.63 | 0.19 | 1.80 | 6.52 | 0.09 | −0.05 | 1.63 | |||||
| ME3 | Meizar 3 | 2001 | 0.39 | 0.49 | 0.10 | 2.16 | 0.50 | 0.10 | 2.10 | 5.85 | 0.13 | 0.36 | 0.03 | 0.75 | 1.24 | 0.01 | 0.02 | 2.54 | 2.74 | 0.87 | −0.01 | −0.80 | −0.03 | 3.04 | 5.81 | −0.01 | 1.39 | −1.66 | 0.70 | 0.08 | 1.40 | 0.94 | −0.13 | 0.51 | 1.83 | −0.07 | −0.77 | 0.94 | |||||
| Estimates based on basaltic-rock-, Golan limestone water and Rish Pinna brine | |||||||||||||||||||||||||||||||||||||||||||
| AS | Ain Saraya | 2016 | 1.29 | 0.54 | 0.70 | 0.49 | 0.36 | 0.19 | 2.21 | 5.78 | 3.46 | 0.86 | 0.13 | 5.03 | 9.29 | 0.35 | 0.09 | 19.21 | 1.74 | 1.72 | −0.52 | 1.44 | 1.96 | 2.18 | 8.52 | 0.98 | −0.11 | 5.21 | 2.59 | −0.39 | 6.47 | 9.29 | 2.31 | 2.27 | 27.73 | 1.15 | 1.45 | 9.29 | |||||
| ER | Ein Balsam | 2016 | 0.81 | 0.52 | 0.38 | 1.38 | 0.43 | 0.14 | 2.15 | 5.82 | 3.26 | 0.81 | 0.12 | 4.73 | 8.73 | 0.33 | 0.08 | 18.06 | 1.93 | 1.47 | −0.20 | −0.45 | 2.30 | 2.50 | 7.55 | 1.15 | −0.18 | 5.19 | 2.28 | −0.07 | 4.27 | 8.73 | 2.63 | 2.58 | 25.62 | 1.31 | 1.28 | 8.73 | |||||
| ER | Ein Reach | 2016 | 0.66 | 0.51 | 0.28 | 1.65 | 0.46 | 0.13 | 2.13 | 5.83 | 3.78 | 0.94 | 0.14 | 5.49 | 10.15 | 0.38 | 0.10 | 20.99 | 2.05 | 1.60 | −0.07 | −0.19 | 2.16 | 2.55 | 8.09 | 1.08 | −0.05 | 5.84 | 2.54 | 0.08 | 5.30 | 10.15 | 2.54 | 2.64 | 29.08 | 1.27 | 1.65 | 10.15 | |||||
| ER | Ein Reach | 2000 | 0.63 | 0.51 | 0.26 | 1.72 | 0.46 | 0.13 | 2.13 | 5.83 | 3.08 | 0.77 | 0.12 | 4.47 | 8.25 | 0.31 | 0.08 | 17.06 | 3.41 | 1.98 | −0.07 | 0.05 | 1.96 | 3.72 | 11.06 | 0.98 | 0.73 | 6.49 | 2.75 | 0.05 | 4.52 | 8.25 | 2.27 | 3.80 | 28.12 | 1.13 | 2.11 | 8.25 | |||||
| ER | Ein Reach | 2004 | 0.80 | 0.51 | 0.37 | 1.40 | 0.44 | 0.14 | 2.15 | 5.82 | 3.47 | 0.86 | 0.13 | 5.04 | 9.31 | 0.35 | 0.09 | 19.25 | 2.45 | 1.87 | −0.18 | 0.35 | 1.99 | 3.56 | 10.04 | 1.00 | 0.23 | 5.92 | 2.74 | −0.05 | 5.39 | 9.31 | 2.34 | 3.64 | 29.29 | 1.17 | 1.79 | 9.31 | |||||
| EM | Ein Makla | 2016 | 0.93 | 0.52 | 0.46 | 1.17 | 0.42 | 0.16 | 2.16 | 5.81 | 4.84 | 1.20 | 0.19 | 7.03 | 12.98 | 0.49 | 0.12 | 26.85 | 1.73 | 1.48 | −0.21 | 0.94 | 2.48 | 1.29 | 7.72 | 1.24 | −0.37 | 6.57 | 2.69 | −0.02 | 7.96 | 12.98 | 2.97 | 1.41 | 34.57 | 1.48 | 1.80 | 12.98 | |||||
| EM | Ein Makla | 2000 | 0.77 | 0.51 | 0.35 | 1.46 | 0.44 | 0.14 | 2.15 | 5.82 | 4.97 | 1.24 | 0.19 | 7.21 | 13.33 | 0.50 | 0.13 | 27.57 | 3.18 | 1.89 | −0.08 | 0.55 | 2.66 | 3.30 | 11.50 | 1.33 | 0.26 | 8.15 | 3.12 | 0.11 | 7.76 | 13.33 | 3.16 | 3.43 | 39.06 | 1.58 | 2.50 | 13.33 | |||||
| EM | Ein Makla | 2004 | 0.77 | 0.51 | 0.35 | 1.46 | 0.44 | 0.14 | 2.15 | 5.82 | 4.73 | 1.18 | 0.18 | 6.87 | 12.69 | 0.48 | 0.12 | 26.24 | 2.09 | 1.77 | −0.09 | 0.79 | 2.52 | 3.09 | 10.17 | 1.26 | −0.22 | 6.82 | 2.95 | 0.09 | 7.66 | 12.69 | 3.00 | 3.21 | 36.41 | 1.50 | 1.91 | 12.69 | |||||
| ME1 | Meizar 1 | 2016 | 0.54 | 0.50 | 0.20 | 1.89 | 0.48 | 0.12 | 2.12 | 5.84 | 3.88 | 0.97 | 0.15 | 5.64 | 10.41 | 0.39 | 0.10 | 21.53 | −1.82 | −0.07 | −0.01 | 2.48 | −0.24 | 1.35 | 1.68 | −0.12 | −0.79 | 2.06 | 0.90 | 0.13 | 8.11 | 10.41 | 0.15 | 1.45 | 23.21 | 0.07 | 0.96 | 10.41 | |||||
| ME2 | Meizar 2 | 2016 | 0.39 | 0.49 | 0.10 | 2.16 | 0.50 | 0.10 | 2.10 | 5.85 | 3.94 | 0.98 | 0.15 | 5.71 | 10.56 | 0.40 | 0.10 | 21.83 | 4.18 | 1.57 | 0.36 | 1.25 | 6.54 | 1.42 | 15.33 | 3.27 | −1.18 | 8.11 | 2.55 | 0.51 | 6.97 | 10.56 | 6.94 | 1.52 | 37.16 | 3.47 | 0.59 | 10.56 | |||||
| ME2 | Meizar 2 | 2001 | 0.39 | 0.49 | 0.10 | 2.16 | 0.50 | 0.10 | 2.10 | 5.85 | 3.14 | 0.78 | 0.12 | 4.56 | 8.43 | 0.32 | 0.08 | 17.43 | 3.59 | 1.59 | 0.34 | 1.02 | 5.38 | 1.82 | 13.73 | 2.69 | −0.90 | 6.73 | 2.37 | 0.46 | 5.58 | 8.43 | 5.70 | 1.90 | 31.16 | 2.85 | 0.52 | 8.43 | |||||
| ME3 | Meizar 3 | 2016 | 0.88 | 0.52 | 0.43 | 1.25 | 0.42 | 0.15 | 2.16 | 5.81 | 0.67 | 0.17 | 0.03 | 0.97 | 1.80 | 0.07 | 0.02 | 3.72 | 2.00 | 1.37 | −0.35 | 0.08 | 0.18 | 3.24 | 6.52 | 0.09 | 0.91 | 2.67 | 1.54 | −0.33 | 1.05 | 1.80 | 0.25 | 3.25 | 10.24 | 0.13 | 1.21 | 1.80 | |||||
| ME3 | Meizar 3 | 2001 | 0.39 | 0.49 | 0.10 | 2.16 | 0.50 | 0.10 | 2.10 | 5.85 | 0.46 | 0.11 | 0.02 | 0.67 | 1.24 | 0.05 | 0.01 | 2.56 | 2.42 | 1.11 | 0.00 | −0.72 | −0.06 | 3.06 | 5.80 | −0.03 | 1.24 | 2.88 | 1.23 | 0.02 | −0.06 | 1.24 | −0.02 | 3.07 | 8.36 | −0.01 | 1.45 | 1.24 | |||||
References
- Rödiger, T.; Geyer, S.; Mallast, U.; Merz, R.; Krause, P.; Siebert, C. Multi-response calibration of a conceptual hydrological model in the semiarid catchment of Wadi al Arab, Jordan. J. Hydrol. 2014, 509, 193–206. [Google Scholar] [CrossRef]
- Siebert, C.; Möller, P.; Geyer, S.; Kraushaar, S.; Dulski, P.; Guttman, J.; Suhah, A.; Rödiger, T. Thermal waters in the Lower Yarmouk Gorge and their relation to surrounding aquifers. Chemie der Erde/Geochem. 2014, 74, 425–441. [Google Scholar] [CrossRef]
- Clemens, M.; Khurelbaatar, G.; Merz, R.; Siebert, C.; van Affrden, M.; Rödiger, T. Groundwater protection under water scarcity; from regional risk assessment to local wastewater treatment solutions. Sci. Total Environ. 2020, 706, 136066. [Google Scholar] [CrossRef] [PubMed]
- Bevenisti, E.; Gvirtzman, H. Harnessing international law to determine Israeli-Palestinian water rights: The Mountain Aquifer. Nat. Res. J. 1993, 33, 543–567. [Google Scholar]
- Siebert, C.; Geyer, S.; Möller, P.; Rosenthal, E.; Berger, D.; Guttman, J. Lake Tiberias and its dynamic hydrochemical environment. In The Water of the Jordan Valley; Hoetzel, H., Möller, P., Rosenthal, E., Eds.; Springer: Berlin/Heidelberg, Germany, 2009; pp. 219–246. [Google Scholar]
- Bajjali, W.; Clark, I.D.; Fritz, P. The artesian thermal groundwaters of northern Jordan: Insights into their recharge history and age. J. Hydrol. 1997, 192, 355–382. [Google Scholar] [CrossRef]
- Dafny, E.; Burg, A.; Gvirtzman, H. Deduction of groundwater flow regime in a basaltic aquifer using geochemical and isotopic data; The Golan Heights, Israel case study. J. Hydrol. 2006, 330, 506–524. [Google Scholar] [CrossRef]
- Johannesson, K.H.; Farnham, I.M.; Stetzenbach, K.J. Rare earth element fractionation and concentration variation along a groundwater flow path within shallow basin fill aquifer, southern Nevada, USA. Geochim. Cosmochim. Acta 1999, 63, 2697–2708. [Google Scholar] [CrossRef]
- Johannesson, K.H.; Tang, J.; Daniels, J.M.; Bounds, W.J.; Burdidge, D.J. Rare earth element concentrations and speciation in organic-rich blackwaters of the Great Dismal Swamp, Virginia, USA. Chem. Geol. 2004, 209, 271–294. [Google Scholar] [CrossRef]
- Johannesson, K.H.; Zhou, X.; Guo, C.; Stetzenbach, K.J.; Hodge, V.F. Origin of rare earth element signatures in ground water of circumneutral pH from Nevada and eastern California. Chem. Geol. 2000, 164, 239–257. [Google Scholar] [CrossRef]
- Kattan, Z. Chemical and environmental isotope study of precipüitation in Syria. J. Arid. Environ. 1997, 36, 601–615. [Google Scholar] [CrossRef]
- Lawrence, M.G.; Jupiter, S.D.; Kamber, B.S. Aquatic geochemistry of rare earth elements and Yttrium in the Pioneer River catchment, Australia. Mar. Freshw. Res. 2006, 57, 725–736. [Google Scholar] [CrossRef]
- Möller, P.; Rosenthal, E.; Dulki, P.; Geyer, S.; Guttman, Y. Rare earths and yttrium hydrostratigraphy along the Lake Kinneret-Dead Sea- Arava transform fault, Israel and adjoining territories. Appl. Geochem. 2003, 18, 1613–1628. [Google Scholar] [CrossRef]
- Sener, M.F.; Sener, M.; Uysal, T. The evolution of the Cappadocia geothermal province, Anatolia, (Turkey): Geochemical and geochronological evidence. Hydrogeol. J. 2017, 25, 2323–2345. [Google Scholar] [CrossRef]
- Siebert, C.; Möller, P.; Magri, F.; Shaliv, E.; Rosenthal, E.; Al-Raggad, M.; Rödiger, T. Applying rare earth elements, uranium and 87Sr/86Sr to disentangle structurally enforced confluence of regional groundwater resources, the case of the Lower Yarmouk Gorge. Geofluids 2019. [Google Scholar] [CrossRef]
- Wood, W.W. Geogenic groundwater solutes: The myth. Hydrogeol. J. 2019, 27, 2729–2738. [Google Scholar] [CrossRef]
- Möller, P.; Siebert, C. Cycling of calcite and hydrous metal oxides and chemical changes of major element and REE chemistry in monomictic hardwater lake: Impact on sedimentation. Chemie der Erde/Geochem. 2016, 76, 133–148. [Google Scholar] [CrossRef]
- Bau, M. Scavenging of dissolved yttrium and rare earths by precipitating iron oxyhydroxide: Experimental evidence for Ce oxidation, Y–Ho fractionation, and lanthanide tetrad effect. Geochim. Cosmochim. Acta 1999, 63, 67–77. [Google Scholar] [CrossRef]
- Olsson, J.; Stipp, S.L.S.; Makvichy, E.; Gislason, S.R. Metal scavenging by calcium carbonate at the Eyjafjallajökull volcano: A carbon capture and storage analogue. Chem. Geol. 2014, 384, 135–148. [Google Scholar] [CrossRef] [Green Version]
- Quinn, K.A.; Byrne, R.H.; Schijf, J. Comparative scavenging of yttrium and the rare earth elements in seawater: Compatitive influence of solution and surface chemistry. Aquat. Geochem. 2004, 10, 59–80. [Google Scholar] [CrossRef]
- Stipp, S.L.S.; Cristensen, J.T.; Lakstanov, L.Z.; Baker, J.A.; Waight, T.E. Rare earth element (REE) incorporation in natural calcite: Upper limits for actinide uptake in a secondary phase. Radiochim. Acta 2006, 94, 523–528. [Google Scholar] [CrossRef]
- Tanaka, K.; Miura, N.; Asahara, Y.; Kawabe, I. Rare earth element and strontium isotopic study of seamount-type limestone in Mesozoic accretionary complex of southern Chichibu Terrane, central Japan: Implication for incorporation process of seawater REE into limestones. Geochem. J. 2003, 37, 163–180. [Google Scholar] [CrossRef] [Green Version]
- Tanaka, K.; Kawabe, I. REE abundance in ancient seawater inferred from marine limestones and experimental REE partition coefficients between calcite and aqueous solution. Geochem. J. 2006, 40, 425–435. [Google Scholar] [CrossRef] [Green Version]
- Tanaka, K.; Ohta, A.; Kawabe, I. Experimental REE partitioning between calcite and aqueous solutions at 25 °C and 1 atm: Constraints on the incorporation of seawater REE into seamount-type limestones. Geochem. J. 2004, 38, 19–32. [Google Scholar] [CrossRef] [Green Version]
- Terakado, Y.; Masuda, A. The coprecipitation of rare-earth elements with calcite and aragonite. Chem. Geol. 1988, 69, 103–110. [Google Scholar] [CrossRef]
- Toyama, K.; Terakado, Y. Experimental study of rare earth element partitioning between calcite and sodium chloride solution at room temperature and pressure. Geochem. J. 2014, 48, 463–477. [Google Scholar] [CrossRef] [Green Version]
- Siebert, C.; Rosenthal, E.; Möller, P.; Rödiger, T.; Meiler, M. The hydrochemical identification of groundwater flowing to the Bet She’an–Harod multiaquifer system (Lower Jordan Valley) by rare earth elements, yttrium, stable isotopes (H, O) and Tritium. Appl. Geochem. 2012, 27, 703–714. [Google Scholar] [CrossRef]
- Möller, P.; Rosenthal, E.; Inbar, N.; Magri, F. Hydrochemical considerations for identifying water from basaltic aquifers: The Israeli experience. J. Hydrol. Reg. Stud. 2016, 5, 33–47. [Google Scholar] [CrossRef] [Green Version]
- Rosenthal, E.; Möller, P.; Siebert, C.; Magri, F.; Guttman, J.; Inbar, N. Hydrology, hydrogeology and hydrogeochemistry of the Yarmouk basin. Environ. Earth Sci. 2020, 79, 71. [Google Scholar] [CrossRef]
- Salameh, E. Using environmental isotopes in the study of recharge-discharge mechanisms of the Yarmouk catchment area in Jordan. Hydrogeol. J. 2004, 12, 451–463. [Google Scholar] [CrossRef]
- Salameh, E.; Bannayan, H. Water Resources of Jordan—Present Status and Future Potentials; Friedrich Ebert Stiftung (FES) and Royal Society for the Conservation of Nature (RSCN): Amman, Jordan, 1996; 178p. [Google Scholar]
- Rosenthal, E. Hydrogeology and Hydrogeochemistry of the Bet Shean and Harod Valleys. Geol. Surv. Isr. Rep. 1972, 2. (In Hebrew) [Google Scholar]
- Flexer, A. Stratigraphy and facies development of Mount Scopus (Senonian-Paleocene) in Israel and adjacent countries. Isr. J. Earth Sci. 1968, 17, 85–114. [Google Scholar]
- Rosenthal, E.; Weinberger, G.; Almogi-Labin, A.; Flexer, A. Late Cretaceou—Early Tertiary development of depositional basins in Samaria (Israel) as part of the evolution of regional folding systems. AAPG Bull. 1999, 84, 997–1042. [Google Scholar] [CrossRef]
- Inbar, N.; Raggad, M.; Siebert, C.; Möller, P.; Rödiger, T.; Rosenthal, E.; Guttman, J.; Magri, F. Active tectonics at the Lower Yarmouk Gorge? In Proceedings of the EGU General Assembly Conference Abstracts, Vienna, Austria, 23–28 April 2017; Volume 19, p. 9563. [Google Scholar]
- Tzoufka, K.; Magri, F.; Rödiger, T.; Inbar, N.; Shalev, E.; Möller, P.; Raggad, M.; Rosenthal, E.; Siebert, C. The effect of hydraulic anisotropies on intensely exploited groundwater resources: The numerical evaluation of a hydrothermal transboundary aquifer system in the Middle East. Hydrol. J. 2018, 26, 2875–2890. [Google Scholar] [CrossRef]
- Inbar, N.; Rosenthal, E.; Magri, F.; Alraggad, M.; Möller, P.; Flexer, A.; Guttman, J.; Siebert, C. Faulting patterns in the Lower Yarmouk Gorge potentially influence groundwater flow paths. Hydrol. Earth Syst. Sci. 2019, 23, 763–771. [Google Scholar] [CrossRef] [Green Version]
- Sahawneh, J. Structural Control of Hydrology, Hydrogeology and Hydrochemistry along the Eastern Escarpment of the Jordan Rift Valley, Jordan. Ph.D. Thesis, Karlsruher Institute für Technologie (KIT), Karlsruhe, Germany, 2011; 284p. [Google Scholar]
- Shimron, A.E. Geochemical Exploration and New Geological Data along the SE Flanks of the Hermon Range; Report GSI/32/89; Geological Survey of Israel: Jerusalem, Israel, 1989. [Google Scholar]
- Roded, R.; Shalev, E.; Katoshevski, D. Basalt Heat flow and hydrothermal regime at the Golan-Ajloun hydrological basins. J. Hydrol. 2013, 476, 200–211. [Google Scholar] [CrossRef]
- Mor, D. The Volcanism of the Golan Heights; Report GSI/5/86; Geological Survey of Israel: Jerusalem, Israel, 1986; (In Hebrew with extended English abstract). [Google Scholar]
- Meiler, M.; Reshef, H.; Shulman, H. Seismic depth domain stratigraphic classification of the Golan Heights, Central Dead Sea Fault. Tectonophysics 2011, 510, 354–369. [Google Scholar] [CrossRef]
- Gilad, D.; Schwartz, S. Hydrogeology of the Jordan sources aquifers. Isr. Hydrol. Serv. Rep. Hydro 1978, 5/78, 58. (In Hebrew) [Google Scholar]
- Michelson, H. The Geology and Paleogeography of the Golan Heights. Ph.D. Thesis, Tel Aviv University, Tel Aviv, Israel, 1979; 163p. [Google Scholar]
- Kattan, Z. Chemical and environmental isotope study of the fissured basalt aquifer system of the Yarmouk basin. IAEA-SM/336/28. In Proceedings of the IAEA Symposium on Isotopes in Water Resources Management, Vienna, Austria, 20–24 March 1995. [Google Scholar]
- Maqqram, H. Hydrogeological Study of Water Resources in the Basin of Jebel Druz (Jebel el Arab); Syrian Arab Republic, Rep. Division for Water Resources: Damascus, Syria, 1996. (In Arabic)
- Etana Files. The Yarmouk Basin. Between conflict and development. Period. Bull. About Civ. Soc. Local Gov. Syr. 2015, 11. [Google Scholar]
- Arad, A.; Bein, A. Saline- versus freshwater contribution to the thermal waters of the northern Jordan Rift Valley. Isr. J. Hydrol. 1986, 83, 49–66. [Google Scholar] [CrossRef]
- Qura’an, A. The Gravitational Studies of the North-Western Part of Jordan. Master’s Thesis, University of Jordan, Amman, Jordan, 1991. [Google Scholar]
- Möller, P.; Dulski, P.; Salameh, E.; Geyer, S. Characterization of the sources of thermal spring- and well water in Jordan by rare earth element and yttrium distribution and stable isotopes. Acta Hydrochim. Hydrobiol. 2006, 34, 101–116. [Google Scholar] [CrossRef]
- Möller, P.; Geyer, S.; Salameh, E.; Dulski, P. Sources of mineralization and salinization of thermal groundwater of Jordan. Acta Hydrochim. Hydrobiol. 2006, 34, 86–100. [Google Scholar] [CrossRef]
- Möller, P.; Rosenthal, E.; Inbar, N.; Siebert, C. Development of the Inland Sea and its evaporites in the Jordan-Dead Sea Transform based on hydrogeochemical considerations and the geological consequences. Int. J. Earth Sci. 2018, 107, 2409–2431. [Google Scholar] [CrossRef]
- Mandel, S. Chemical Analyses in Observation Boreholes since 1950; Final report on the Lake Tiberias Salinity Committee; Tahal-Water Planning for Israel Ltd.: Tel Aviv, Israel, 1965; Volume 1. [Google Scholar]
- Busico, G.; Cuoco, E.; Kazakis, N.; Colombani, N.; Mastrocicco, M.; Tedesco, D.; Voudouris, K. Multivariate statistical analysis to characterize/discriminate between anthropogenic and geogenic trace elements occurrence in the Campania plain, Southern Italy. Environ. Pollut. 2018, 234, 260–269. [Google Scholar] [CrossRef] [PubMed]
- Kazakis, N.; Mattas, C.; Pavlou, A.; Patrikaki, O.; Voudouris, K. Multivariate statistical analysis for the assessment of groundwater quality under different hydrogeological regimes. Environ. Earth Sci. 2017, 76, 349. [Google Scholar] [CrossRef]
- Machiwal, D.; Cloutier, V.; Güler, C.; Kazakis, N. A Review of GIS-Integrated Statistical Techniques for Groundwater Quality Evaluation and Protection. Environ. Earth Sci. 2018, 77, 681. [Google Scholar] [CrossRef]
- Reynolds, A.; Richards, G.; de la Iglesia, B.; Rayward-Smith, V. Clustering rules: A comparison of partitioning and hierarchical clustering algorithms. J. Math. Model. Algorithms 1992, 5, 475–504. [Google Scholar] [CrossRef]
- Maechler, M.; Rousseeuw, P.; Struyf, A.; Hubert, M.; Hornik, K. cluster: Cluster Analysis Basics and Extensions. R package version 2.1.0. 2019. Available online: https://CRAN.R-project.org/package=cluster (accessed on 25 March 2020).
- McCaffrey, M.A.; Lazar, B.; Holland, H.D. The evaporation path of seawater and the coprecipitation of Br− and K+ with halite. J. Sediment. Petrol. 1987, 57, 928–937. [Google Scholar] [CrossRef]
- Raab, M. The origin of the evaporites in the Jordan-Arava valley in view of the evolution of brines and evaporites during seawater evaporation. Ph.D. Thesis, The Hebrew University of Jerusalem, Jerusalem, Israel, 1996; 114p. (In Hebrew). [Google Scholar]
- Möller, P.; Siebert, C.; Geyer, S.; Inbar, N.; Rosenthal, E.; Flexer, A.; Zilberbrand, M. Relationship of brines in the Kinnarot basin, Jordan-Dead Sea Rift valley. Geofluids 2012, 12, 166–181. [Google Scholar] [CrossRef]
- Gower, J.C. Some distance properties of latent root and vector methods used in multivariate analysis. Biometrika 1966, 53, 325–328. [Google Scholar] [CrossRef]
- Mardia, K.V. Some properties of classical multidimensional scaling. Commun. Stat. Theory Methods 1978, A7, 1233–1241. [Google Scholar] [CrossRef]
- Bergelson, G.; Nativ, R.; Bein, A. Salinization and dilution history of ground water discharging into the Sea of Galilee, the Dead Sea Transform, Israel. Appl. Geochem. 1999, 14, 91–118. [Google Scholar] [CrossRef]
- Klein BenDavid, O.; Sass, E.; Katz, A. The evolution of marine evaporitic brines in inland basins: The Jordan-Dead Sea Rift valley. Geochim. Cosmochim. Acta 2004, 68, 1763–1775. [Google Scholar] [CrossRef]
- Starinski, A. Relationship between Ca-Chloride Brines and Sedimentary Rocks in ISRAEL. Ph.D. Thesis, Hebrew University, Jerusalem, Israel, 1974. (In Hebrew, English summary). [Google Scholar]
Figure 1.
Overview of the Yarmouk drainage basin and its environment. The basin is outlined in red in the lower insert. Note the graben structure with the perennial Arram River in the Yarmouk basin. DSF = Dead Sea Transform fault; SAF = Sheikh Ali fault; MHF = Mevo Hamma fault; LYF = Lower Yarmouk fault.

Figure 2.
Stratigraphic table comparing the Israeli and Jordanian nomenclature. Aquiferous units are colored in blue after [15].
Figure 2.
Stratigraphic table comparing the Israeli and Jordanian nomenclature. Aquiferous units are colored in blue after [15].

Figure 3.
A detailed view of the sampling locations in the Lower Yarmouk Gorge. Very important are the Lower Yarmouk (LYF) and Mevo Hamma faults (MHF) and the rise of the Hammat Gader block in between. DST= Dead Sea fault. The region of Hammat Gader encloses codes, EB, ER and EM (Table 1). Color codes of stars: yellow—Mukheibeh well field; red—Mezar well field; green—Hammat Gader; blue—Ain Himma.

Figure 4.
Variation of rare earth element distribution patterns in mixtures of basaltic-rock and limestone water. (a) Estimates of mixing of basaltic-rock-(1) and limestone water (0); (b) resulting C1 chondrite normalized Tb/Lu values as a function of εbw. REY data are taken from [15] and are normalized to C1 chondrite to get smooth curves. The average of Ein Dan and Ein Banyas in Mount Hermon Massif are used as pure limestone water; as basaltic-rock water the analysis of Mukheibeh 2/2013 is used. Data are taken from [2].

Figure 5.
Cross plots of dissolved species in groundwater. Note that the high-salinity groundwaters are related to either basaltic or limestone water (a–e). This is not the case in (f). Averages of low-Cl−-containing water from the Ajloun Mountains and from the Golan Heights are used for limestone water. Averages of low-Cl−-containing water from the Hauran Plateau are used for basaltic-rock water (code names are explained in Table 1). x/yy indicates the sampling ID and the year of sampling in the 21th century. Regression lines and R2 are estimated with Microsoft excel 2010.

Figure 6.
Cross plots of Na+/Cl− vs. 1000 × Br−/Cl− of Ha’On brine analyses in the years 1961–2004 and of evaporated seawater (red line) [59,60]. Present-day Ha’On brine is a dilution product of the original Ha’On brine and basaltic-rock groundwater with Na+/Cl− > 1 (dashed line). The intersection of the dilution line with the trend line of the evaporated seawater approach: the values of Na+/Cl− and 1000 Br−/Cl− of the original Tortonian Ha’On brine are 0.43 and 5.9, which significantly deviate from the ones measured in the years of 1961 and 2004 (Table 1). The vertical lines indicate leaching of Br− from B2. The solid line represents mixing of Ha’On brine and basaltic-rock water in the Mukheibeh field. Code names are explained in Table 1.

Figure 7.
Cross plots of fractions of basaltic rock and limestone water in the Lower Yarmouk Gorge (LYG). Hammat Gader and Mezar are based on Golan limestone water; Muhkeibeh water is related to Ajloun limestone water. M = Mukheibeh sample.
Figure 7.
Cross plots of fractions of basaltic rock and limestone water in the Lower Yarmouk Gorge (LYG). Hammat Gader and Mezar are based on Golan limestone water; Muhkeibeh water is related to Ajloun limestone water. M = Mukheibeh sample.

Figure 8.
Cross plots of (a) εbw and εbrine and (b) TDEbrine and TDEWRI. These data are obtained under the assumption that εbrine can be estimated after Equation (2). Hammat Gader and Mezar data are based on Golan limestone water and Ha’On brine. Muhkeibeh water is related to Ajloun limestone water.

Figure 9.
Cross plots of minerals. (a) Amounts of gypsum and calcite in WRI based on the assumption that εbrine can be estimated after Equation (2). (b) Amounts of halite and gypsum in WRI+brine. Here εbrine is assumed to be zero and its contribution appears together with those of the WRI.
Figure 9.
Cross plots of minerals. (a) Amounts of gypsum and calcite in WRI based on the assumption that εbrine can be estimated after Equation (2). (b) Amounts of halite and gypsum in WRI+brine. Here εbrine is assumed to be zero and its contribution appears together with those of the WRI.

Figure 10.
3D visualization of the clustering of the water samples along the first three principal coordinates. The different colors of large spheres in three-dimensional space and the corresponding colored dots on the projection planes visualize the differences in composition of the groundwater in the Yarmouk Gorge subdivided into nine code groups (Table 1). This plot is based on concentrations in meq/L.

Figure 11.
Ternary plot of contributions in %TDE of basaltic-rock-water, limestone water and WRI+brine. Several trends evolve. All trends seem to culminate in the Yarmouk River water. The dashed lines fix the array of Mukheibeh, Ain Himma, Mezar 3 and Ein Sahina. Clearly separated, the waters from Hammat Gader (EM, ER); Mezar 1 and 2; and Ain Saraya cluster in the lower left corner. With M4, a subgroup is indicated within the Mukheibeh U1 group (code refers to Table 3) visualizing the possibility of high variation in composition of groundwater from one and the same well.

Table 1.
Analyses of spring and well waters from the Lower Yarmouk Gorge. Grouping according the geographical and chemical proximity (code). In the two last columns the normalized Tb/Lu ratios and the fraction of basaltic-rock water, εbw, in mixture with limestone water are given as derived from Figure 4.
| Code | Source | Sampling | East | North | pH | Eh * | Temp | EC | Ca2+ | Mg2+ | K+ | Na+ | Cl− | TDE | Tb/Lu | εbw | ||
|---|---|---|---|---|---|---|---|---|---|---|---|---|---|---|---|---|---|---|
| Group | Year | (UTM, WGS84, Z36N) | mV | °C | μS/cm | meq/L$ | Normalized | |||||||||||
| U1 | Mukheibeh 2 | 2016 | 753241 | 3622342 | 6.13 | 17.90 | 28.90 | 830 | 3.90 | 2.14 | 0.07 | 1.70 | 1.59 | 1.17 | 4.50 | 15.07 | 0.23 | 0.95 |
| U1 | Mukheibeh 4 | 2016 | 753212 | 3622331 | 7.04 | 272.71 | 29.10 | 827 | 4.20 | 2.30 | 0.07 | 1.74 | 1.59 | 1.19 | 4.69 | 15.79 | 1.07 | 0 |
| U1 | Mukheibeh 4 | 2013 | 753209 | 3622333 | 7.10 | 62.99 | 28.80 | 807 | 4.80 | 2.39 | 0.08 | 1.67 | 1.56 | 1.14 | 5.11 | 16.75 | 0.27 | 0.83 |
| U1 | Mukheibeh 2 | 2013 | 753243 | 3622340 | 7.12 | 64.61 | 28.14 | 809 | 4.80 | 2.47 | 0.08 | 1.68 | 1.65 | 1.19 | 5.11 | 16.98 | 0.21 | 0.99 |
| U1 | Mukheibeh 1 | 2001 | 753119 | 3622154 | 7.00 | 66.71 | 29.10 | 797 | 4.57 | 2.47 | 0.08 | 1.70 | 1.61 | 1.13 | 5.86 | 17.42 | 0.29 | 0.80 |
| U2 | Mukheibeh 6 | 2016 | 753018 | 3622417 | 7.06 | −40.08 | 31.00 | 667 | 4.30 | 2.39 | 0.09 | 2.13 | 2.07 | 1.25 | 5.01 | 17.23 | 0.19 | 1.00 |
| U2 | Mukheibeh 7 | 2016 | 754257 | 3623142 | 7.17 | −17.13 | 38.50 | 774 | 4.20 | 2.39 | 0.07 | 1.74 | 1.71 | 0.74 | 4.73 | 15.57 | 0.46 | 0.47 |
| U3 | Mukheibeh 10 | 2016 | 753267 | 3622856 | 6.96 | −116.60 | 39.00 | 710 | 3.60 | 2.06 | 0.09 | 2.04 | 1.69 | 0.82 | 4.27 | 14.58 | 0.7 | 0.20 |
| U3 | Mukheibeh 5 | 2016 | 747753 | 3618570 | 7.32 | 161.62 | 40.90 | 876 | 3.55 | 1.98 | 0.10 | 2.04 | 1.61 | 0.76 | 5.00 | 15.04 | 0.78 | 0.12 |
| U3 | Mukheibeh 11 | 2016 | 753845 | 3622588 | 6.92 | 200.18 | 31.90 | 821 | 3.80 | 3.21 | 0.07 | 1.91 | 1.59 | 1.11 | 4.73 | 16.43 | 0.53 | 0.35 |
| U3 | Mukheibeh 9 | 2016 | 756312 | 3624296 | 7.20 | −67.10 | 28.90 | 1157 | 2.70 | 2.39 | 0.41 | 5.22 | 2.33 | 0.44 | 7.52 | 21.00 | 0.35 | 0.66 |
| U3 | Mukheibeh 8 | 2013 | 755490 | 3624127 | 7.45 | −123.14 | 44.90 | 701 | 3.40 | 1.65 | 0.13 | 2.32 | 1.82 | 0.58 | 4.64 | 14.53 | 1.1 | 0 |
| U3 | Mukheibeh 8 | 2016 | 755495 | 3624134 | 7.16 | −62.14 | 44.90 | 723 | 2.95 | 1.65 | 0.13 | 2.43 | 1.88 | 0.26 | 4.03 | 13.33 | 0.73 | 0.17 |
| U3 | Mukheibeh 13 | 2016 | 754268 | 3623212 | 7.12 | −46.50 | 38.90 | 778 | 3.60 | 2.06 | 0.09 | 2.00 | 1.74 | 0.71 | 4.33 | 14.53 | 0.69 | 0.24 |
| U3 | Mukheibeh 13 | 2013 | 754280 | 3623202 | 7.38 | −76.13 | 38.50 | 752 | 4.05 | 2.06 | 0.10 | 1.90 | 1.67 | 0.51 | 5.04 | 15.32 | 0.67 | 0.35 |
| ES | Ein Sahina | 2016 | 750190 | 3619926 | 7.04 | 453.74 | 28.00 | 844 | 4.35 | 2.30 | 0.08 | 1.91 | 1.88 | 1.02 | 4.93 | 16.48 | 0.75 | 0.15 |
| AH | Ein Himma | 2007 | 751665 | 3621722 | 7.02 | −27.54 | 40.00 | 1433 | 5.67 | 2.80 | 0.35 | 5.31 | 6.88 | 4.43 | 6.88 | 32.32 | 0.98 | 0.33 |
| AH | Ein Himma | 2001 | 751665 | 3621722 | 7.06 | −144.95 | 41.50 | 1418 | 5.38 | 2.87 | 0.36 | 5.40 | 5.86 | 3.09 | 5.52 | 28.47 | 0.94 | 0.01 |
| AH | Ein Himma | 2013 | 751600 | 3621710 | 7.10 | 71.63 | 37.70 | 1130 | 5.90 | 2.63 | 0.23 | 3.67 | 4.23 | 2.60 | 4.77 | 24.04 | 0.5 | 0.40 |
| AH | Ein Himma | 2016 | 751661 | 3621700 | 7.03 | 85.46 | 40.00 | 499 | 5.50 | 2.47 | 0.24 | 4.09 | 4.54 | 2.69 | 4.00 | 23.53 | 0.32 | 0.70 |
| AS | Ain Saraya | 2016 | 750429 | 3619424 | 6.83 | −15.94 | 38.30 | 1655 | 6.50 | 3.13 | 0.31 | 6.96 | 9.65 | 2.50 | 4.47 | 33.51 | 0.29 | 0.79 |
| ER | Ein Balsam | 2016 | 749705 | 3619324 | 6.76 | 10.68 | 41.90 | 1600 | 6.00 | 2.80 | 0.31 | 5.65 | 9.17 | 2.77 | 4.73 | 31.43 | 0.56 | 0.37 |
| ER | Ein Reach | 2016 | 750014 | 3619198 | 6.69 | −75.73 | 43.40 | 1860 | 6.50 | 3.05 | 0.36 | 6.96 | 10.61 | 2.67 | 4.78 | 34.91 | 0.66 | 0.24 |
| ER | Ein Reach | 2000 | 750348 | 3619399 | 6.85 | −95.66 | 38.00 | 1728 | 7.12 | 3.25 | 0.31 | 6.23 | 8.71 | 2.39 | 5.93 | 33.95 | 0.68 | 0.21 |
| ER | Ein Reach | 2004 | 749984 | 3618816 | 6.81 | −146.95 | 41.50 | 1759 | 6.72 | 3.25 | 0.32 | 6.79 | 9.75 | 2.48 | 5.79 | 35.11 | 0.55 | 0.36 |
| EM | Ein Makla | 2016 | 749859 | 3619141 | 6.59 | −116.47 | 49.50 | 2160 | 7.50 | 3.21 | 0.44 | 9.13 | 13.40 | 3.12 | 3.58 | 40.38 | 0.46 | 0.47 |
| EM | Ein Makla | 2000 | 749909 | 3619091 | 6.64 | −131.40 | 47.30 | 2190 | 8.91 | 3.64 | 0.46 | 9.23 | 13.77 | 3.30 | 5.57 | 44.88 | 0.57 | 0.33 |
| EM | Ein Makla | 2004 | 749811 | 3618793 | 6.73 | −166.56 | 49.60 | 2160 | 7.58 | 3.46 | 0.44 | 9.12 | 13.13 | 3.14 | 5.35 | 42.23 | 0.57 | 0.33 |
| ME1 | Meizar 1 | 2016 | 752652 | 3625884 | 7.38 | −79.02 | 35.20 | 1630 | 2.60 | 1.40 | 0.33 | 10.00 | 10.89 | 0.26 | 3.56 | 29.05 | 0.748 | 0.13 |
| ME2 | Meizar 2 | 2016 | 752706 | 3622894 | 6.40 | −76.90 | 60.60 | 2080 | 8.50 | 3.05 | 0.62 | 9.13 | 11.06 | 7.04 | 3.62 | 43.01 | 1.44 | 0 |
| ME2 | Meizar 2 | 2001 | 752700 | 3622914 | 6.63 | −102.33 | 60.00 | 1650 | 7.12 | 2.86 | 0.56 | 7.74 | 8.93 | 5.80 | 4.00 | 37.01 | 1.4 | 0 |
| ME3 | Meizar 3 | 2016 | 752725 | 3622926 | 6.81 | −119.60 | 42.20 | 810 | 3.55 | 2.06 | 0.10 | 2.30 | 2.22 | 0.40 | 5.41 | 16.05 | 0.48 | 0.43 |
| ME3 | Meizar 3 | 2001 | 752707 | 3622922 | 7.09 | −129.23 | 41.80 | 664 | 3.27 | 1.72 | 0.12 | 2.11 | 1.74 | 0.08 | 5.17 | 14.20 | 1.39 | 0 |
| YR | Yarmouk | 2016 | 756255 | 3624301 | 8.40 | 190.97 | 23.50 | 961 | 2.75 | 2.47 | 0.15 | 4.22 | 3.10 | 3.06 | 3.02 | 18.77 | 0.47 | 0.46 |
* Eh-values: expressed relative to standard hydrogen electrode; $ relative standard deviation for analytes: ≤1% for Ca, Mg, K, Na; ≤2% for Cl, SO4 and ≤5% for HCO3.
Table 2.
Averages of water types in the Lower Yarmouk Gorge. For more details refer to Table A1.
Table 2.
Averages of water types in the Lower Yarmouk Gorge. For more details refer to Table A1.
| Ca2+ | Mg2+ | K+ | Na+ | Cl− | |||
|---|---|---|---|---|---|---|---|
| meq/L | |||||||
| Basaltic-rock water | 1.49 | 1.31 | 0.10 | 1.19 | 0.84 | 0.25 | 2.69 |
| Ajloun limestone water | 4.93 | 1.02 | 0.04 | 0.71 | 0.80 | 0.22 | 4.66 |
| Golan limestone water | 0.39 | 0.31 | 0.20 | 2.49 | 0.89 | 0.24 | 6.41 |
| Ha’On brine | 45.1 | 123 | 8.79 | 255 | 421 | 4.31 | 8.42 |
| Rosh Pinna brine, 2486–2586 m | 240 | 59.6 | 9.18 | 348 | 643 | 24.2 | 6.06 |
Table 3.
Compilation of TDE values; brine fraction εbrine; and mineralogical compositions of water/rock interaction (WRI) and WRI+brine.
Table 3.
Compilation of TDE values; brine fraction εbrine; and mineralogical compositions of water/rock interaction (WRI) and WRI+brine.
| Code Group | Location | Sampling Date Year | Sum of TDE | TDEBW | TDEest | TDEbrine meq/L | TDEWRI | Basaltic Water Fraction εbw | Brine Water Fraction εbrine | εbrine after Equation (4) diss(+)/precip(-) | εbrine = 0 after Equation (7) diss(+)/precip(-) | |||
|---|---|---|---|---|---|---|---|---|---|---|---|---|---|---|
| Gypsum | Calcite | Gypsum | Calcite | Halite | ||||||||||
| mmol/L | mmol/L | |||||||||||||
| Estimates based on basaltic-rock-, Ajloun limestone water and Ha’On brine | ||||||||||||||
| U1 | Mukheibeh 2 | 2016 | 15.07 | 5.47 | 6.09 | 2.57 | 6.41 | 0.95 | 0.00 | 0.47 | 0.56 | 0.47 | 0.62 | 1.25 |
| U1 | Mukheibeh 4 | 2016 | 15.79 | 0.00 | 12.37 | 1.63 | 1.79 | 0.00 | 0.00 | 0.48 | −0.89 | 0.49 | −0.85 | 0.79 |
| U1 | Mukheibeh 4 | 2013 | 16.75 | 4.78 | 6.88 | 2.39 | 7.48 | 0.83 | 0.00 | 0.45 | 0.83 | 0.46 | 0.88 | 1.16 |
| U1 | Mukheibeh 2 | 16.98 | 5.70 | 5.83 | 2.72 | 8.43 | 0.99 | 0.00 | 0.48 | 1.07 | 0.49 | 1.13 | 1.32 | |
| U1 | Mukheibeh 1 | 2001 | 17.42 | 4.61 | 7.08 | 2.46 | 7.87 | 0.80 | 0.00 | 0.45 | 0.66 | 0.46 | 0.72 | 1.20 |
| U2 | Mukheibeh 6 | 2016 | 17.23 | 5.76 | 5.76 | 3.60 | 7.87 | 1.00 | 0.00 | 0.50 | 0.79 | 0.51 | 0.87 | 1.75 |
| U2 | Mukheibeh 7 | 2016 | 15.57 | 2.71 | 9.27 | 2.33 | 3.98 | 0.47 | 0.00 | 0.26 | 0.12 | 0.26 | 0.17 | 1.13 |
| U3 | Mukheibeh 10 | 2016 | 14.58 | 1.15 | 11.05 | 2.03 | 1.50 | 0.20 | 0.00 | 0.30 | −0.68 | 0.30 | −0.63 | 0.99 |
| U3 | Mukheibeh 5 | 2016 | 15.04 | 0.69 | 11.58 | 1.79 | 1.66 | 0.12 | 0.00 | 0.27 | −0.80 | 0.27 | −0.76 | 0.87 |
| U3 | Mukheibeh 11 | 2016 | 16.43 | 2.02 | 10.06 | 1.97 | 4.40 | 0.35 | 0.00 | 0.44 | −0.46 | 0.45 | −0.42 | 0.96 |
| U3 | Mukheibeh 9 | 2016 | 21.00 | 3.80 | 8.01 | 3.80 | 9.19 | 0.66 | 0.00 | 0.10 | −0.19 | 0.11 | −0.10 | 1.85 |
| U3 | Mukheibeh 8 | 2013 | 14.53 | 0.00 | 12.36 | 2.10 | 0.07 | 0.00 | 0.00 | 0.18 | −0.99 | 0.18 | −0.95 | 1.02 |
| U3 | Mukheibeh 8 | 2016 | 13.33 | 0.98 | 11.24 | 2.39 | −0.29 | 0.17 | 0.00 | 0.02 | −0.77 | 0.02 | −0.73 | 1.16 |
| U3 | Mukheibeh 13 | 2016 | 14.53 | 1.38 | 7.33 | 2.17 | 5.02 | 0.24 | 0.00 | 0.24 | 1.17 | 0.25 | −0.50 | 1.06 |
| U3 | Mukheibeh 13 | 2013 | 15.32 | 2.02 | 7.11 | 2.13 | 6.08 | 0.35 | 0.00 | 0.18 | 1.39 | 0.15 | 0.01 | 1.04 |
| U3 | Ein Sahina | 2016 | 16.48 | 0.86 | 5.93 | 2.88 | 7.66 | 0.15 | 0.00 | 0.44 | 1.38 | 0.40 | −0.44 | 1.15 |
| AH | Ain Himma | 2007 | 32.32 | 1.90 | 10.19 | 12.83 | 9.30 | 0.33 | 0.01 | 2.07 | −1.48 | 2.10 | −1.18 | 6.24 |
| AH | Ain Himma | 2001 | 28.47 | 0.06 | 12.31 | 10.41 | 5.75 | 0.01 | 0.01 | 1.41 | −1.44 | 1.44 | −1.19 | 5.06 |
| AH | Ain Himma | 2013 | 24.04 | 2.30 | 9.73 | 7.45 | 6.85 | 0.40 | 0.01 | 1.18 | −0.20 | 1.19 | −0.03 | 3.62 |
| AH | Ain Himma | 2016 | 23.53 | 4.03 | 7.74 | 8.39 | 7.40 | 0.70 | 0.01 | 1.21 | 0.04 | 1.23 | 0.24 | 4.08 |
| Estimates based on basaltic-rock-, Golan limestone water and Ha’On brine | ||||||||||||||
| AS | Ain Saraya | 2016 | 33.51 | 4.55 | 5.78 | 19.11 | 8.63 | 0.79 | 0.02 | 1.11 | 1.00 | 1.15 | 1.45 | 9.29 |
| EB | Ein Balsam | 2016 | 31.43 | 2.13 | 5.82 | 17.96 | 7.65 | 0.37 | 0.02 | 1.27 | 0.86 | 1.31 | 1.28 | 8.73 |
| ER | Ein Reach | 2016 | 34.91 | 1.38 | 5.83 | 20.87 | 8.21 | 0.24 | 0.02 | 1.22 | 1.16 | 1.27 | 1.65 | 10.15 |
| ER | Ein Reach | 2000 | 33.95 | 1.21 | 5.83 | 16.97 | 11.15 | 0.21 | 0.02 | 1.09 | 1.71 | 1.13 | 2.11 | 8.25 |
| ER | Ein Reach | 2004 | 35.11 | 2.07 | 5.82 | 19.15 | 10.14 | 0.36 | 0.02 | 1.12 | 1.34 | 1.17 | 1.79 | 9.31 |
| EM | Ein Makla | 2016 | 40.38 | 2.71 | 5.81 | 26.70 | 7.87 | 0.47 | 0.03 | 1.42 | 1.17 | 1.48 | 1.80 | 12.98 |
| EM | Ein Makla | 2000 | 44.88 | 1.90 | 5.82 | 27.41 | 11.65 | 0.33 | 0.03 | 1.51 | 1.85 | 1.58 | 2.50 | 13.33 |
| EM | Ein Makla | 2004 | 42.23 | 1.90 | 5.82 | 26.10 | 10.32 | 0.33 | 0.03 | 1.44 | 1.29 | 1.50 | 1.91 | 12.69 |
| ME1 | Mezar 1 | 2016 | 29.05 | 0.75 | 5.84 | 21.41 | 1.80 | 0.13 | 0.02 | 0.02 | 0.45 | 0.07 | 0.96 | 10.41 |
| ME2 | Mezar 2 | 2016 | 43.01 | 0.00 | 5.85 | 21.71 | 15.45 | 0.00 | 0.02 | 3.42 | 0.07 | 3.47 | 0.59 | 10.56 |
| ME2 | Mezar 2 | 2001 | 37.01 | 0.00 | 5.85 | 17.34 | 13.82 | 0.00 | 0.02 | 2.80 | 0.11 | 2.85 | 0.52 | 8.43 |
| ME3 | Mezar 3 | 2016 | 16.05 | 2.48 | 5.81 | 3.70 | 6.54 | 0.43 | 0.00 | 0.12 | 1.12 | 0.09 | −0.05 | 1.63 |
| ME3 | Mezar 3 | 2001 | 14.20 | 0.00 | 5.85 | 2.54 | 5.81 | 0.00 | 0.00 | −0.01 | 1.39 | −0.07 | −0.77 | 0.94 |
| Estimates based on basaltic-rock-, Golan limestone water and Rosh Pinna brine | ||||||||||||||
| AS | Ain Saraya | 2016 | 33.51 | 4.55 | 5.78 | 19.21 | 8.52 | 0.79 | 0.01 | 0.98 | −0.11 | 1.15 | 1.45 | 9.29 |
| EB | Ein Balsam | 2016 | 31.43 | 2.13 | 5.82 | 18.06 | 7.55 | 0.37 | 0.01 | 1.15 | −0.18 | 1.31 | 1.28 | 8.73 |
| ER | Ein Reach | 2016 | 34.91 | 1.38 | 5.83 | 20.99 | 8.09 | 0.24 | 0.02 | 1.08 | −0.05 | 1.27 | 1.65 | 10.15 |
| ER | Ein Reach | 2000 | 33.95 | 1.21 | 5.83 | 17.06 | 11.06 | 0.21 | 0.01 | 0.98 | 0.73 | 1.13 | 2.11 | 8.25 |
| ER | Ein Reach | 2004 | 35.11 | 2.07 | 5.82 | 19.25 | 10.04 | 0.36 | 0.01 | 1.00 | 0.23 | 1.17 | 1.79 | 9.31 |
| EM | Ein Makla | 2016 | 40.38 | 2.71 | 5.81 | 26.85 | 7.72 | 0.47 | 0.02 | 1.24 | −0.37 | 1.48 | 1.80 | 12.98 |
| EM | Ein Makla | 2000 | 44.88 | 1.90 | 5.82 | 27.57 | 11.50 | 0.33 | 0.02 | 1.33 | 0.26 | 1.58 | 2.50 | 13.33 |
| EM | Ein Makla | 2004 | 42.23 | 1.90 | 5.82 | 26.24 | 10.17 | 0.33 | 0.02 | 1.26 | −0.22 | 1.50 | 1.91 | 12.69 |
| ME1 | Mezar 1 | 2016 | 29.05 | 0.75 | 5.84 | 21.53 | 1.68 | 0.13 | 0.02 | −0.12 | −0.79 | 0.07 | 0.96 | 10.41 |
| ME2 | Mezar 2 | 2016 | 43.01 | 0.00 | 5.85 | 21.83 | 15.33 | 0.00 | 0.02 | 3.27 | −1.18 | 3.47 | 0.59 | 10.56 |
| ME2 | Mezar 2 | 2001 | 37.01 | 0.00 | 5.85 | 17.43 | 13.73 | 0.00 | 0.02 | 2.69 | −0.90 | 2.85 | 0.52 | 8.43 |
| ME3 | Mezar 3 | 2016 | 16.05 | 2.48 | 5.81 | 3.72 | 6.52 | 0.43 | 0.00 | 0.09 | 0.91 | 0.13 | 1.21 | 1.80 |
| ME3 | Mezar 3 | 2001 | 14.20 | 0.00 | 5.85 | 2.56 | 5.80 | 0.00 | 0.00 | −0.03 | 1.24 | −0.01 | 1.45 | 1.24 |
© 2020 by the authors. Licensee MDPI, Basel, Switzerland. This article is an open access article distributed under the terms and conditions of the Creative Commons Attribution (CC BY) license (http://creativecommons.org/licenses/by/4.0/).
Share and Cite
MDPI and ACS Style
Möller, P.; De Lucia, M.; Rosenthal, E.; Inbar, N.; Salameh, E.; Magri, F.; Siebert, C. Sources of Salinization of Groundwater in the Lower Yarmouk Gorge, East of the River Jordan. Water 2020, 12, 1291. https://doi.org/10.3390/w12051291
AMA Style
Möller P, De Lucia M, Rosenthal E, Inbar N, Salameh E, Magri F, Siebert C. Sources of Salinization of Groundwater in the Lower Yarmouk Gorge, East of the River Jordan. Water. 2020; 12(5):1291. https://doi.org/10.3390/w12051291
Chicago/Turabian StyleMöller, Peter, Marco De Lucia, Eliahu Rosenthal, Nimrod Inbar, Elias Salameh, Fabien Magri, and Christian Siebert. 2020. "Sources of Salinization of Groundwater in the Lower Yarmouk Gorge, East of the River Jordan" Water 12, no. 5: 1291. https://doi.org/10.3390/w12051291
Note that from the first issue of 2016, this journal uses article numbers instead of page numbers. See further details here.