Article

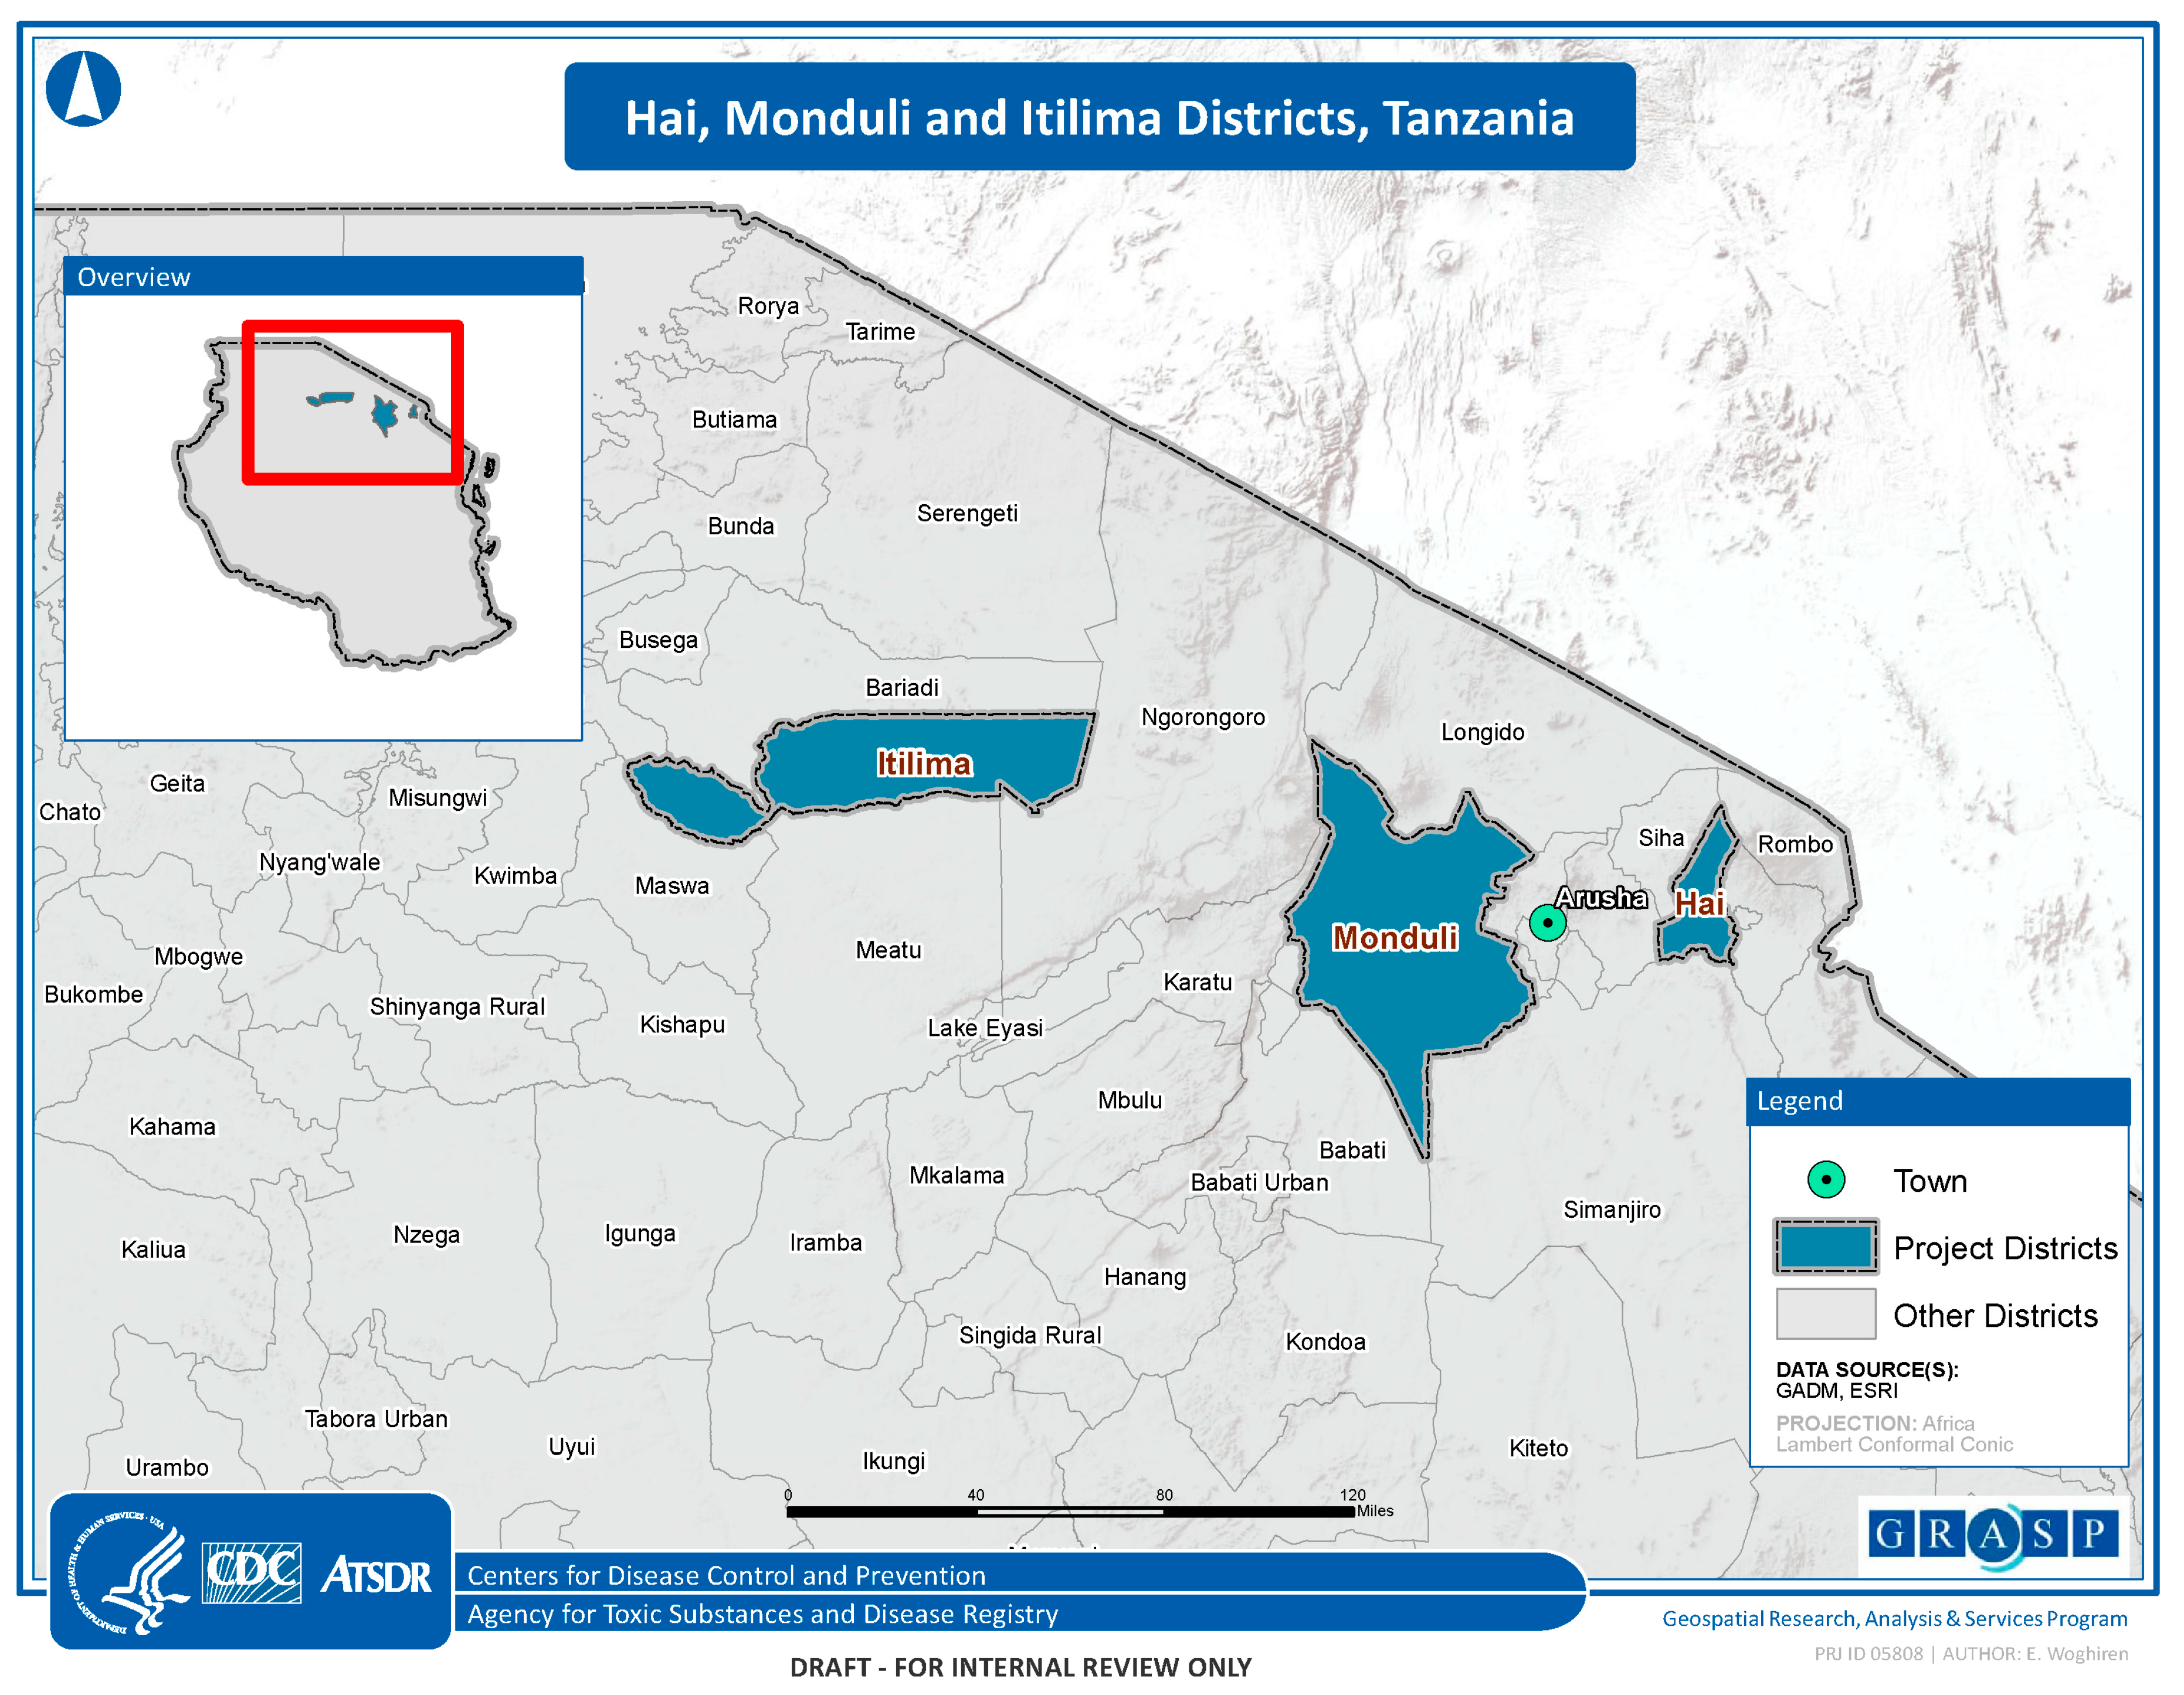
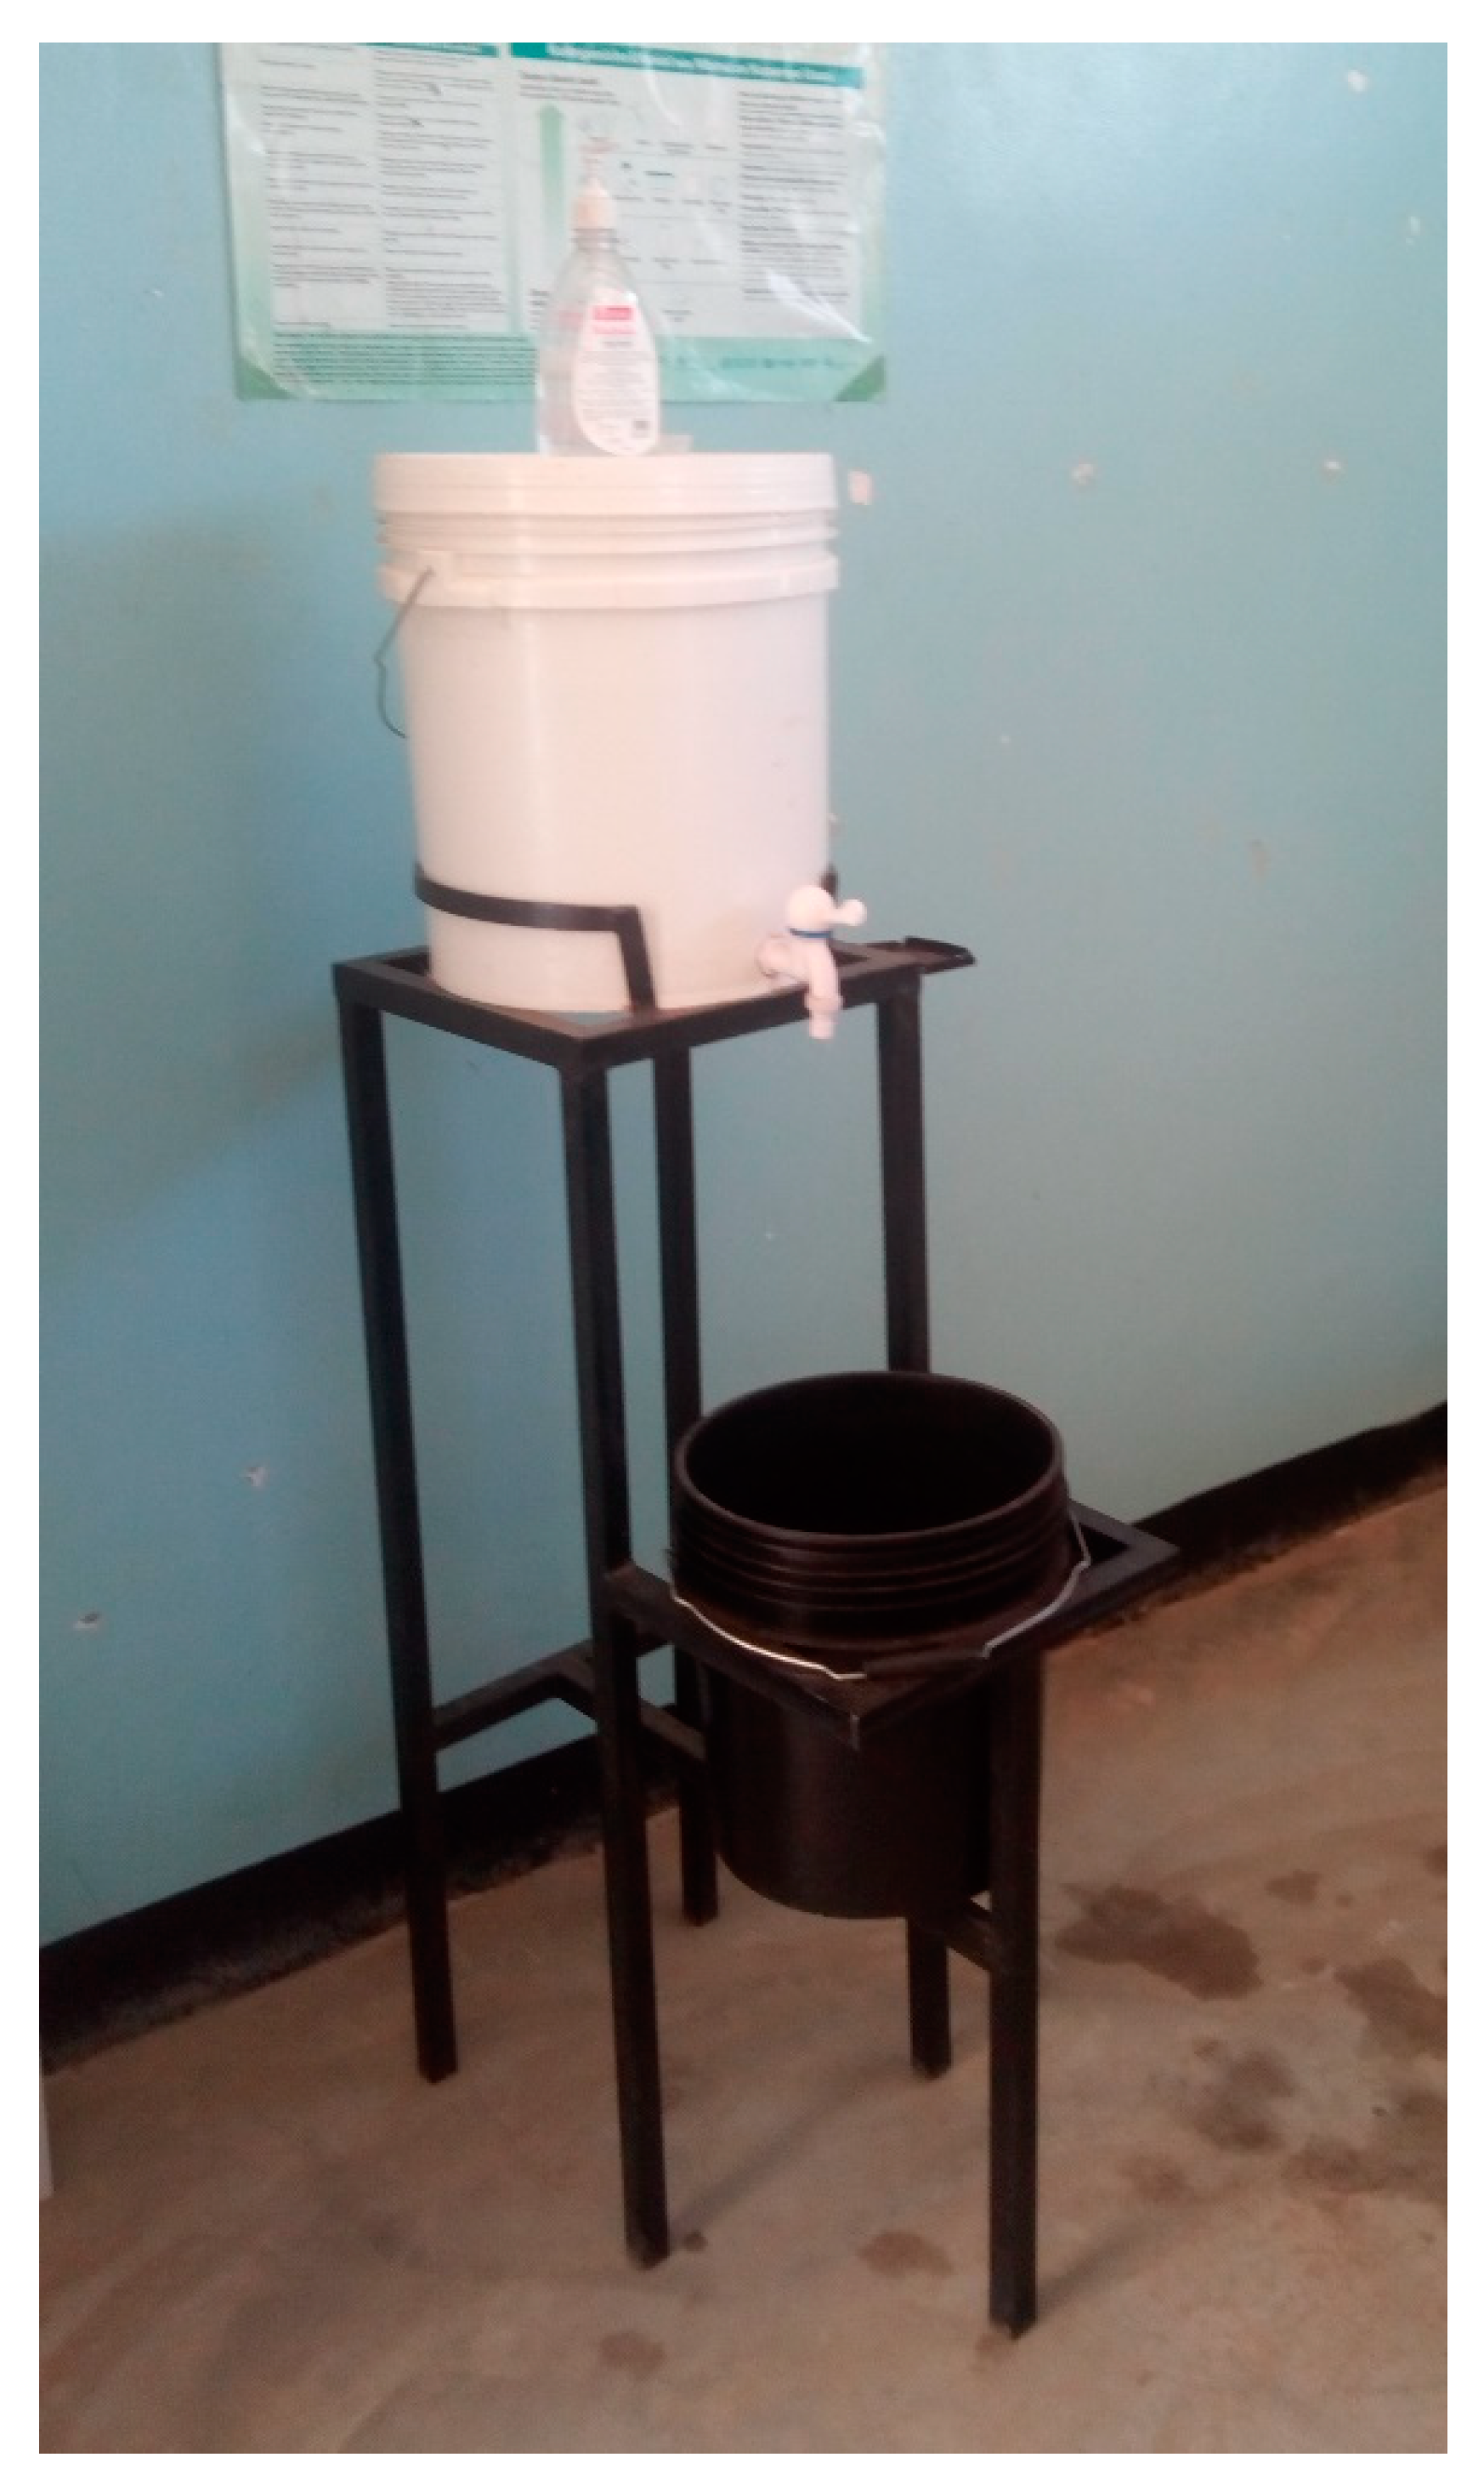
Evaluation of an Inexpensive Handwashing and Water Treatment Program in Rural Health Care Facilities in Three Districts in Tanzania, 2017

1
Waterborne Diseases Prevention Branch, U.S. Centers for Disease Control and Prevention, Atlanta, GA 30329, USA
2
Ministry of Health, Community Development, Gender, Elderly, and Children, 40478 Dodoma, Tanzania
3
PATH Tanzania, Dar es Salaam P.O. Box 13600, Tanzania
4
PATH, Seattle, WA 98109, USA
*
Author to whom correspondence should be addressed.
Water 2020, 12(5), 1289; https://doi.org/10.3390/w12051289
Submission received: 15 April 2020 / Revised: 27 April 2020 / Accepted: 28 April 2020 / Published: 1 May 2020
(This article belongs to the Section Water Quality and Contamination)

Abstract

:
Unsafe water, sanitation, and hygiene (WASH) conditions in healthcare facilities (HCFs) can increase the risk of disease transmission, yet WASH coverage is inadequate in HCFs in most low- and middle-income countries. In September 2017, we conducted a baseline survey of WASH coverage in 100 HCFs in three rural Tanzanian districts. Based on needs calculated from the baseline, we distributed handwashing and drinking water stations, soap, and chlorine solution; we repeated the survey 10 months later. The intervention improved coverage with handwashing stations (82% vs. 100%, p < 0.0001), handwashing stations with water (59% vs. 96%, p < 0.0001), handwashing stations with soap and water (19% vs. 46%, p < 0.0001), and handwashing stations with soap and water within 5 m of latrines (26% vs. 53%, p < 0.0001). Coverage of drinking water stations increased from 34% to 100% (p < 0.0001) HCFs with at least one drinking water station with free chlorine residual (FCR) > 0.2mg/ml increased from 6% to 36% (p < 0.0001), and in a sample of HCFs, detectable E. coli in stored drinking water samples decreased from 46% to 5% (p < 0.001). Although the program increased access to handwashing stations, drinking water stations, and safe drinking water in HCFs in rural Tanzania, modest increases in soap availability and water treatment highlighted persistent challenges.

1. Introduction

The 2014 and 2018 Ebola epidemics in West and Central Africa underscored the threat to global health security and healthcare worker safety posed by inadequate infection prevention and control practices, including lack of access to basic water, sanitation, and hygiene (WASH) infrastructure in healthcare facilities (HCFs) [1]. Inadequate WASH infrastructure also prevents the implementation of effective infection prevention and control measures to manage COVID-19 cases in HCFs [2]. In May 2018, the Secretary General of the United Nations issued a global call to action for improving WASH in HCFs, citing the urgent problems of low coverage and high attendant risk of disease spread [3]. His call reinforced Sustainable Development Goal number 6 (SDG6), the achievement of which would require universal WASH coverage in HCF by 2030 [4].
To measure progress toward the achievement of SDG6, the Joint Monitoring Program of the World Health Organization and UNICEF uses the following indicators of basic WASH service levels: improved water sources on HCF premises; sex-segregated functioning toilets for staff and patients; functioning handwashing facilities with soap and water in proximity to patient care areas; waste segregation, treatment, and disposal; and available protocols and trained personnel for basic environmental cleaning [5]. Data on coverage of WASH in HCFs in low- and middle-income countries are limited and have only been aggregated across countries recently [5,6,7]. Global estimates from 78 low- and middle-income countries in 2018 found that 50% of HCFs had access to an improved water source (piped water, public tap, tubewell, protected well, rainwater collection) on site, 66% had access to improved sanitation, 61% had soap for handwashing, and 61% had access to safe waste disposal [6].
In Tanzania, the 2019 Joint Monitoring Program report estimated that 21% of rural HCFs had achieved the basic service level for hygiene and 54% had basic water supply service level [5]. The 2019 report received rural hygiene coverage data from just one other sub-Saharan African country, Zimbabwe, at 54%. Reports from 15 sub-Saharan African countries estimated basic water service levels ranging from 9–50% [5]. Because many improved water sources are contaminated with human waste, improved water sources are not necessarily considered safe, necessitating water treatment [8].
Among health implications of poor WASH coverage in Tanzanian HCFs, births have been shown to take place in environments with unsafe WASH conditions, which can affect newborn survival [9,10,11]. A 2012 survey from southern Tanzania found that risks of death were the same for neonates born at home as they were for neonates born in HCFs, suggesting a need to improve the quality of health services, including WASH [11]. Improving WASH in HCFs can also increase mothers’ trust in the health care system [12] and the likelihood of choosing to give birth in an HCF [13].
There are a number of challenges to improving WASH services in rural HCFs in developing countries such as Tanzania, including the high cost of construction of infrastructure, scarce financing, sustaining services, and the variability of needs between different HCFs [14]. To address some of these challenges in the short to medium term, use of low cost, simple technologies, such as portable handwashing and drinking water stations, have helped fill some gaps in coverage of basic drinking water and hygiene service levels in other settings [15,16,17].
In 2017, civil society partners collaborated with the Tanzania Ministry of Health, Community Development, Gender, Elderly, and Children (MOHCDGEC) to install portable handwashing and drinking water stations and provide one-month starter supplies of soap and chlorine solution in HCFs in three rural districts in Tanzania. To determine whether this intervention was feasible, acceptable, and helped to reduce gaps in some WASH services in these rural HCFs, we conducted an evaluation from September 2017 to July 2018.

2. Materials and Methods

We selected a convenience sample of all 100 HCFs in three rural districts for the program (Figure 1). Monduli District (33 HCFs) in the Arusha Region and Hai District (35 HCFs) in the Kilimanjaro Region were chosen because they were located close to the project office in Arusha, facilitating data collection and implementation of the interventions. Itilima District (32 HCFs) in the Simiyu Region was selected because HCFs there are farther from major trading centers and transport routes than the other districts and were known to have poor WASH infrastructure. All three districts are rural, with populations that are engaged in small-scale agriculture, cattle herding, and informal economic activities. The most isolated HCFs in each district are located approximately 7–9 h from the nearest tertiary hospital on dirt and paved roads.
The assessment tool was developed using sections of the 2016 MOHCDGEC draft National Guidelines on WASH in Healthcare Facilities [18] and was designed to obtain information on WASH characteristics at these rural HCFs from the staff person who was most knowledgeable about the facility’s WASH infrastructure (hereafter referred to as “knowledgeable staff person”). In most HCFs, the knowledgeable staff person was the HCF in-charge (usually a doctor), while in the other HCFs, the knowledgeable staff person was either a clinical officer, nurse, or midwife. Where applicable, we adapted questions from the World Health Organization’s Water and Sanitation Health Facility Improvement Tool [19]. We included questions on staffing, patient caseloads, water sources and reliability, and waste disposal and observations on the number of handwashing and drinking water stations and the presence of soap, towels, waste containers, latrine characteristics, incinerators, and placenta pits (ventilated and cement-lined pits for disposal of placentas and potentially pathological waste). We used the Joint Monitoring Program definition of improved water sources: “water sources—which by nature of their design and construction have the potential to deliver safe water; these include piped water (from springs or other ground water sources), boreholes or tubewells, protected dug wells, protected springs, rainwater, and packaged or delivered water.” [5].
In September 2017, enumerators made surprise visits to all HCFs in the three project districts to administer the baseline assessment tool to healthcare workers and test source, drinking, and handwashing water for free and total chlorine residual using Hach® CN-66 test kits (Hach.com, Loveland, CO, USA). In water that had no free chlorine residual, enumerators tested for the presence of Escherichia coli using the compartment bag test (AquaGenX, Chapel Hill, NC, USA) [20].
Following the completion of each assessment, district and regional health officials were briefed on results and HCF-specific reports were prepared and provided to HCF staff. After the baseline assessment, HCF staff were trained on the use and maintenance of handwashing and drinking water stations, proper hand hygiene, chlorination of stored water, the importance of WASH in HCFs, and MOHCDGEC policy. Handwashing and drinking water stations, consisting of 20 L buckets with tight-fitting lids and spigots on metal stands, were procured and installed based on calculated needs from the assessments, supplementing existing facilities to ensure full coverage in patient care areas (Figure 2). One-month starter supplies of soap and chlorine solution were also provided. During October–December 2017, handwashing and drinking water stations were distributed to each HCF. Healthcare workers were trained about proper maintenance of the handwashing and drinking water stations and the importance of daily chlorination of drinking water and replenishment of soap. No system of monitoring was set up. A follow-up evaluation was conducted in July 2018 using the baseline tool with several additional questions on use and acceptability of the water stations.
Experienced, trained Tanzanian enumerators collected data on smartphones using Open Data Kit software. Data were cleaned and analyzed using STATA 15 software (www.stata.com). Coverage was estimated by determining the number of rooms in each HCF where patients received care as the denominator, and the number of handwashing or drinking water stations in each room as the numerator. The percentage of latrines with handwashing stations within 5 m was also assessed. Coverage was reported as an aggregated estimate for the entire district (e.g., the total number handwashing stations in all HCFs in the district/the total number of patient care rooms in each district). We compared baseline and final HCF coverage rates using Wilcoxon rank-sum tests for continuous variables and McNemar’s test for categorical variables.
The protocol was reviewed and approved by the Institutional Review Board at the National Institute for Medical Research in Tanzania. The Human Subjects Advisor for the National Center for Emerging and Zoonotic Infectious Diseases at CDC issued a non-research determination for this data collection activity because it is considered a public health practice.

3. Results

The baseline assessment was conducted in September 2017 at all 100 HCFs, which had a median of 3 staff (range 1–40) and 3 patient care areas (range 1–8) (Table 1). Among all facilities, HCF staff saw a median of 200 patients per month (range 35–700) and performed a median of 6 deliveries per month (range 0–100). Of 100 HCFs, 75 had an improved water source (Table 2). Of 43 HCFs with water supply on premises, 32 (74%) had improved sources and included piped networks, tube wells, and rainwater harvesting. The water supply was available year-round in 70% of HCFs, 24 h a day in 64%, and reported by 64% of HCFs as sufficient to meet their needs.
At baseline, all HCFs had an outdoor latrine and 37% had indoor toilets (Table 3). Latrines were separated between staff and patients in 36% of HCFs and between male and female patients in 48% of HCFs; 11% of HCFs had a latrine accessible to mobility-challenged persons. Existing handwashing infrastructure varied between HCFs, including some sinks with taps connected to a water supply, open buckets for handwashing and drinking water, drinking cups situated next to storage tanks, and buckets with taps for handwashing. In all HCFs, water for handwashing and drinking came from the HCF water supply, either piped directly to the tap or collected from the source and carried to the water station.
Waste separation was reported by 92% of HCFs, infectious waste containers were observed in 61%, and sharps containers in 69% (Table 3). Field workers observed placenta pits in 52% of HCFs, incinerators in 45%, and a wall around the waste disposal area (pit or incinerator) in 21%.
Enumerators repeated the survey in July 2019, 10 months after baseline. Data analysis showed increases over baseline in the percent coverage of patient care areas by functional (providing flow of water) handwashing stations (82% vs. 100%, p < 0.0001), handwashing stations with water (63% vs. 98%, p < 0.0001), handwashing stations with water and soap (19% vs. 46%, p < 0.0001), and handwashing stations with water and soap within 5 m of latrines (26% vs. 53%, p < 0.0001) (Table 4).
Data analysis also showed increases from baseline to follow-up in percent coverage of patient care areas by functional drinking water stations (34% vs. 95%, p < 0.0001), drinking water with detectable free chlorine residual (6% vs. 36%, p < 0.0001), and a decrease in stored water samples with detectable E. coli (46% vs. 5%, p = 0.0005).
In 52% of HCFs, knowledgeable staff reported that water stations were filled by nurses and 29% reported “whoever is free that day”; 35% reported that there was a designated staff member to chlorinate the drinking water. At follow-up, knowledgeable staff at 42% of HCFs reported that a water station had broken, while 19% of HCFs reported repairing a broken container. Reasons given for not repairing containers included a lack of money to buy parts and unavailability of parts.
On multivariable analysis, the odds of having full drinking water stations were greater in HCFs with water storage capacity greater than 1000 L than HCFs with less water storage capacity (OR 11.6, p 0.02, 95% CI: 1.4—95.3); the odds of having full handwashing stations were similar between HCFs with different water storage capacity (OR 0.79 p 0.6, 95% CI: 0.3—1.9). The odds of stored drinking water yielding either free chlorine residual or E. coli did not differ by HCF water source, presence, or absence of persons responsible for filling and treating water, different average patient loads, and differences in total HCF staff. Several themes were identified in responses to open-ended questions. Challenges to successfully maintaining the water stations included inadequate budget for repairs, lack of skills to repair stations, and theft. Knowledgeable staff persons reported that proper use of the water stations was hindered by a lack of budget for soap and chlorine products and insufficient education of HCF staff and patients.

4. Discussion

This evaluation showed that although distinct improvements were made in the provision of basic handwashing and drinking water facilities to rural HCFs in Tanzania, 8 months later, substantial room for improvement remained. The main achievement of this relatively low-cost project (Table S1) was increased availability of functioning handwashing and drinking water stations in patient care areas, which improved access to hygiene stations and safe drinking water. Across all 3 districts, there were also increases in the basic service level for hygiene, defined by the Joint Monitoring Program as functional hand hygiene facilities with soap and water at points of care and within 5 m of toilets [21], and in access to treated water, as confirmed by the presence of free chlorine residual and/or the absence of E. coli. These findings were consistent with other evaluations of inexpensive WASH interventions in HCFs [15,16,17]. These outcomes likely resulted from a combination of several factors: the donation of handwashing and drinking water stations and supplies, which overcame immediate financial and logistical barriers; training that may have helped motivate HCF staff to maintain water stations and supply them with soap and water; national WASH in HCF guidelines; and engagement of district-level health personnel at implementation, which may have also motivated adherence. We found no association between filled handwashing stations and storage capacity, but there was an association between filled drinking water stations and storage capacity. These findings suggest that HCFs may have prioritized filling handwashing stations regardless of water supply and only filled drinking water stations if sufficient stored water was available. Availability of water, therefore, may be an important determinant of the provision of drinking water in these rural HCFs. We did not find associations between E. coli or free chlorine residual in stored water and any other variable. We did not attempt to determine whether knowledge levels or supervision of workers were associated with use of water stations. These variables could be examined in future studies to explore their influence on proper use of water stations.
Despite gains in handwashing station coverage from this intervention, indicators in the target districts still fell well short of the Joint Monitoring Program and MOHGDEC goal of universal access to at least the basic hygiene service level. Similarly, despite improved access to treated drinking water, coverage was substantially below the 100% target. Although access to safe drinking water is not a specific criterion for achievement of the basic service level for water supply for SDG6, safely managed water, as measured by the presence of free chlorine residual or absence of E. coli, is an example of an advanced WASH service level that can contribute to improved health outcomes. Our data suggest that multiple barriers, including limited water availability, limited financial resources, supply chain challenges, identifying dedicated staff for these tasks, and staff knowledge gaps may have hindered the achievement of full coverage. Each barrier is exacerbated in rural HCFs, which tend to be smaller, with fewer staff, and have less access to supplies, financial and educational resources, and political institutions. The challenges of achieving full coverage of basic service levels of these WASH services highlight the importance of health system strengthening for sustainability of interventions and achievement of the Sustainable Development Goals [22].
For budgetary reasons, the scope of this project did not include water supply, sanitation, and healthcare waste management interventions. Baseline data suggested that because relatively low percentages of HCFs have water supply on premises (43%), separate latrines for staff and patients (36%), accessible latrines for mobility challenged persons (11%), and access to an incinerator (45%), achievement of SDG6 in water supply and sanitation will require substantial investment and time. Program decisions on appropriate WASH interventions will need to take into account a balance between acuteness of need, relative cost, and time constraints for implementation of expensive infrastructure interventions, particularly in rural regions with lower population density.
This study had several important limitations. First, because the project took place in a convenience sample of three districts in proximity to the project office, the results are not generalizable. Second, this evaluation took place less than 12 months after implementation, limiting the assessment of duration of use to a relatively short period. Although knowledgeable staff persons noted budgetary and access challenges to sustaining this intervention, at least two other evaluations have documented use of similar interventions for periods of 4 to 12 years after implementation [15,23]. Third, costs of commodities are likely to increase over time, increasing financial barriers. Fourth, although the compartment bag test, which was used for water testing, is commonly used in developing countries for semi-quantitative estimates of E. coli contamination, it has not been approved by the U.S. Food and Drug Administration or World Health Organization. At least one study found that compartment bag test performance is comparable to membrane filtration, which suggests that results of water testing in this study were accurate [24]. Finally, we lacked the resources to make direct observations of the use of the handwashing stations, which limited our ability to assess whether access to handwashing stations contributed to increases in effective or consistent hygiene practices.
In conclusion, this evaluation demonstrated that a relatively low-cost intervention that can be implemented in the short term was able to contribute to modest improvements in access to handwashing facilities and safe drinking water in rural HCFs in Tanzania. Resource limitations and incomplete integration of the intervention into the local health system remain the principal barriers to accomplishing full coverage in project HCFs. The emerging risk of COVID-19 and recurrent cholera outbreaks in Tanzania highlight the urgency of addressing WASH deficiencies in HCFs.

Supplementary Materials

The following are available online at https://www.mdpi.com/2073-4441/12/5/1289/s1, Table S1. Project costs.

Author Contributions

Conceptualization: L.V. and R.Q.; Methodology: W.D., K.M., H.M., and R.Q.; Formal Analysis: W.D.; Investigation, W.D., K.M., S.K., and H.M.; Resources: K.M., R.Q., and L.V.; Data Curation: W.D. and H.M.; Writing—Original Draft Preparation: W.D.; Writing—Review and Editing: W.D., K.M., S.K., H.M., L.V., and R.Q.; Supervision: K.M., S.K., L.V., and R.Q.; Project Administration: H.M.; Funding acquisition: L.V. and R.Q. All authors have read and agreed to the published version of the manuscript.

Funding

This project was supported by a Global Health Security Agenda grant from the Centers for Disease Control and Prevention to PATH, and by the United States Agency for International Development.

Acknowledgments

The authors would like to thank PATH Tanzania; The Tanzania Ministry of Health, Community Development, Gender, Elderly and Children; Regional Health and Medical Officers in Arusha, Kilimanjaro and Simiyu Provinces; District Health and Medical Officers in Monduli, Hai, and Itilima Districts; Efomo Woghiren of the Geospatial Research, Analysis and Services Program (GRASP) at the Centers for Disease Control and Prevention for making Figure 1; and Sunkyung Kim of the Centers for Disease Control and Prevention.

Conflicts of Interest

The authors declare no conflict of interest.

Disclaimer

The findings and conclusions in this report are those of the author(s) and do not necessarily represent the official position of the Centers for Disease Control and Prevention.

References

  1. Forrester, J.D.; Pillai, S.K.; Beer, K.D.; Neatherlin, J.; Massaquoi, M.; Nyenswah, T.G.; Montgomery, J.M.; De Cock, K. Assessment of Ebola virus disease, health care infrastructure, and preparedness—Four counties, Southeastern Liberia, August 2014. MMWR Morb. Mortal. Wkly. Rep. 2014, 63, 891–893. [Google Scholar] [PubMed]
  2. UNICEF. UNICEF WASH Programme Contribution to COVID—19 Prevention and Response; UNICEF: New York, NY, USA, 2020; Available online: https://www.unicef.org/documents/wash-programme-contribution-coronavirus-disease-covid-19-prevention-and-response (accessed on 18 April 2020).
  3. UN Secretary-General, at Launch of International Decade for Action, Supports New Approaches for Better Managing Fresh Water Scarcity. Available online: https://www.un.org/press/en/2018/sgsm18951.doc.htm (accessed on 20 April 2020).
  4. UN Goal 6: Sustainable Development Knowledge Platform. Available online: https://sustainabledevelopment.un.org/sdg6 (accessed on 21 August 2018).
  5. WHO; UNICEF. WASH in Health Care Facilities: Global Baseline Report 2019; WHO: Geneva, Switzerland; UNICEF: New York, NY, USA, 2019; Available online: https://www.unwater.org/publications/wash-in-health-care-facilities-global-baseline-report-2019/ (accessed on 18 April 2020).
  6. Cronk, R.; Bartram, J. Environmental conditions in health care facilities in low and middle-income countries: Coverage and inequalities. Int. J. Hyg. Environ. Health 2018, 221, 409–422. [Google Scholar] [CrossRef] [PubMed]
  7. Guo, A.; Bowling, J.M.; Bartram, J.; Kayser, G. Water, Sanitation, and Hygiene in Rural Health-Care Facilities: A Cross-Sectional Study in Ethiopia, Kenya, Mozambique, Rwanda, Uganda, and Zambia. Am. J. Trop. Med. Hyg. 2017, 97, 1033–1042. [Google Scholar] [CrossRef] [PubMed]
  8. Onda, K.; Lobuglio, J.; Bartram, J. Global access to safe water: Accounting for water quality and the resulting impact on MDG progress. World Health Popul. 2013, 14, 32–44. [Google Scholar] [CrossRef] [PubMed]
  9. Gon, G.; Restrepo-Mendez, M.C.; Campbell, O.M.R.; Barros, A.J.D.; Woodd, S.; Benova, L.; Graham, W.J. Who Delivers without Water? A Multi Country Analysis of Water and Sanitation in the Childbirth Environment. PLoS ONE 2016, 11, e0160572. [Google Scholar] [CrossRef] [PubMed] [Green Version]
  10. Benova, L.; Cumming, O.; Gordon, B.A.; Magoma, M.; Campbell, O.M.R. Where there is no toilet: Water and sanitation environments of domestic and facility births in Tanzania. PLoS ONE 2014, 9, e106738. [Google Scholar] [CrossRef] [PubMed]
  11. Nathan, R.; Mwanyangala, M.A. Survival of neonates in rural Southern Tanzania: Does place of delivery or continuum of care matter? BMC Pregnancy Childbirth 2012, 12, 18. [Google Scholar] [CrossRef] [PubMed] [Green Version]
  12. Benova, L.; Cumming, O.; Campbell, O.M.R. Systematic review and meta-analysis: Association between water and sanitation environment and maternal mortality. Trop. Med. Int. Health TM IH 2014, 19, 368–387. [Google Scholar] [CrossRef] [PubMed]
  13. Loharikar, A.; Russo, E.; Sheth, A.; Menon, M.; Kudzala, A.; Tauzie, B.; Masuku, H.D.; Ayers, T.; Hoekstra, R.M.; Quick, R. Long-term impact of integration of household water treatment and hygiene promotion with antenatal services on maternal water treatment and hygiene practices in Malawi. Am. J. Trop. Med. Hyg. 2013, 88, 267–274. [Google Scholar] [CrossRef] [PubMed] [Green Version]
  14. Curry, S. Five Pressing Global Water and Sanitation Challenges; Centre for Affordable Water and Sanitation Technology: Calgary, AB, Canada, 2016; Available online: https://www.cawst.org/blog/bydate/2016/01/five-pressing-global-water-sanitation-challenges/ (accessed on 18 April 2020).
  15. Sreenivasan, N.; Gotestrand, S.A.; Ombeki, S.; Oluoch, G.; Fischer, T.K.; Quick, R. Evaluation of the impact of a simple hand-washing and water-treatment intervention in rural health facilities on hygiene knowledge and reported behaviours of health workers and their clients, Nyanza Province, Kenya, 2008. Epidemiol. Infect. 2015, 143, 873–880. [Google Scholar] [CrossRef] [PubMed]
  16. Rajasingham, A.; Leso, M.; Ombeki, S.; Ayers, T.; Quick, R. Water treatment and handwashing practices in rural Kenyan health care facilities and households six years after the installation of portable water stations and hygiene training. J. Water Health 2018, 16, 263–274. [Google Scholar] [CrossRef] [PubMed] [Green Version]
  17. Bennett, S.D.; Otieno, R.; Ayers, T.L.; Odhiambo, A.; Faith, S.H.; Quick, R. Acceptability and use of portable drinking water and hand washing stations in health care facilities and their impact on patient hygiene practices, Western Kenya. PLoS ONE 2015, 10, e0126916. [Google Scholar] [CrossRef] [PubMed]
  18. MOHCDGEC. The National Guidelines for Water, Sanitation and Hygiene in Health Care Facilities; Ministry of Health, Community Development, Gender, Elderly and Children: Tanzania, 2017. Available online: https://washmatters.wateraid.org/publications/national-guidelines-for-wash-services-in-health-care-facilities-in-tanzania (accessed on 20 April 2020).
  19. WHO; UNICEF. Water and Sanitation for Health Facility Improvement Tool (WASH FIT); WHO: New York, NY, USA, 2017; Available online: https://apps.who.int/iris/bitstream/handle/10665/254910/9789241511698-eng.pdf;jsessionid=342FC0CF8F25CC58C914F416721E3889?sequence=1 (accessed on 20 April 2020).
  20. Aquagenx. The Compartment Bag Test (CBT) Quantitative Escherichia Coli Water Quality Test Kits. 2019. Available online: https://www.aquagenx.com/e-coli-test-kits/ (accessed on 20 April 2020).
  21. United Nations. Sustainable Development Goal 6 Targets & Indicators. 2015. Available online: https://sustainabledevelopment.un.org/sdg6 (accessed on 20 April 2020).
  22. Kieny, M.P.; Bekedam, H.; Dovlo, D.; Fitzgerald, J.; Habicht, J.; Harrison, G.; Kluge, H.; Lin, V.; Menabde, N.; Mirza, Z.; et al. Strengthening health systems for universal health coverage and sustainable development. Bull. World Health Organ. 2017, 95, 537–539. [Google Scholar] [CrossRef] [PubMed]
  23. Davis, W.; Odhiambo, A.; Oremo, J.; Otieno, R.; Mwaki, A.; Rajasingham, A.; Kim, S.; Quick, R. Evaluation of a Water and Hygiene Project in Health-Care Facilities in Siaya County, Kenya, 2016. Am. J. Trop. Med. Hyg. 2019, 101, 576–579. [Google Scholar] [CrossRef] [PubMed]
  24. Stauber, C.; Miller, C.; Cantrell, B.; Kroell, K. Evaluation of the compartment bag test for the detection of Escherichia coli in water. J. Microbiol. Methods 2014, 99, 66–70. [Google Scholar] [CrossRef] [PubMed]
Figure 1. Map of the project sites.
Water 12 01289 g001
Figure 2. Handwashing station.
Water 12 01289 g002
Table 1. Baseline healthcare facility characteristics, Hai, Monduli, and Itilima Districts, Tanzania, 2017.
HCF CharacteristicsCombined
(n = 100)
Monduli (n = 33)Hai (n = 35)Itilima (n = 32)
median (range)median (range)median (range)median (range)
Outpatients last month200 (35–700)170 (35–500)180 (60–600)290 (52–700)
Deliveries per month6 (0–100)5 (0–45)2 (0–30)20 (0–100)
Total paid staff3 (1–40)2 (2–38)3 (1–40)3 (2–32)
Beds2 (0–5)2 (0–4)2 (0–5)2 (0–4)
Number of patient care areas2 (1–8)2 (1–7)2 (1–8)2 (1–5)
Main electricity sourcen (%)n (%)n (%)n (%)
Electricity grid system42 (46)12 (38)25 (78)5 (17)
Solar energy49 (53)19 (61)7 (21)23 (82)
HCF (healthcare facilities) reports cuts in electricity46 (50)19 (61)10 (31)17 (60)
Table 2. Baseline HCF water supply and quality, Hai, Monduli, and Itilima Districts, Tanzania, 2017.
Water VariablesCombined
(n = 100)
Monduli
(n = 33)
Hai (n = 35)Itilima (n = 32)
n (%)n (%)n (%)n (%)
Improved water source75 (75)15 (71)34 (97)26 (92)
Source on premises43 (43)17 (51)16 (45)10 (31)
Improved and on premises32 (32)8 (24)16 (45)8 (25)
Has year-round water supply from main source70 (70)20 (60)33 (94)17 (53)
Has 24 h water supply64 (64)20 (60)31 (88)13 (40)
Reports sufficient water to meet needs64 (64)22 (66)31 (88)11 (34)
Storage capacity (mean number of liters, range)2605 (0–35,000)5953 (0–35,000)870 (0–5000)1050 (0–12,000)
Water source used during week of survey:
Pipe48 (48)12 (36)32(91)4 (13)
Public pipe/standpipe9 (9)2 (6)0(0)7 (22)
Tube well/borehole10 (10)0 (0)1(3)9 (28)
Protected dug well3 (3)1 (3)0(0)2 (6)
Rainwater23 (23)15 (45)0(0)8 (25)
Table 3. Baseline HCF latrine and waste management conditions, Hai, Monduli, and Itilima Districts, Tanzania, 2017.
Latrine and Waste Management VariablesCombined (n = 100)Monduli
(n = 33)
Hai
(n = 35)
Itilima
(n = 32)
n (%)n (%)n (%)n (%)
Latrines
Has an outdoor latrine100 (100)33 (100)35 (100)32 (100)
Has indoor toilets 37 (37)19 (58)12 (34)6 (19)
Separate latrines for staff and patients36 (36)20 (61)12 (34)4 (13)
Separate latrines for males and females48 (48)11 (33)16 (46)21 (66)
Latrines separated for staff and for male and female patients9 (9)2 (6)4 (11)3 (9)
Separate, sex segregated latrines for staff and for patients6 (6)0 (0)3 (9)3 (9)
At least one separate latrine for mobility-limited people11 (11)4 (12)1 (3)6 (19)
Waste Management
Report separating infectious and non-infectious waste 92 (92)30 (90)35 (100)27 (84)
Separate infectious waste containers observed61 (61)20 (60)22 (62)19 (59)
Separate sharps containers observed69 (69)23 (69)25 (71)21 (65)
Placenta pit52 (52)16 (48)13 (37)23 (71)
Incinerator present45 (45)7 (21)17 (48)21 (65)
Wall around waste disposal area (pit or incinerator)21 (21)3 (9)8 (25)10 (31)
Table 4. Percentage of patient care areas in HCFs with handwashing (HW) and drinking water (DW) stations, baseline and endline; Hai, Monduli, and Itilima Districts, Tanzania, 2017.
Handwashing and Drinking Water Station VariablesCombinedMonduliHaiItilima
BaselineEndlinepBaselineEndlinepBaselineEndlinepBaselineEndlinep
Total patient care areas258306 8495 106126 6885
%% %% %% %%
HW stations (overall)82100<0.001861000.005841000.00171100<0.001
HW stations with water only6398<0.00163980.00758750.07681560.02
HW stations w/soap and water1946<0.00120360.081150<0.00129520.05
DW stations (overall)3495<0.00143100<0.00141100<0.0011583<0.001
DW stations with waterNA81NANA85NANA83NANA75NA
At least 1 DW station with FCR > 0.2636<0.0016390.00210240.153340.002
HCFs with E. coli in stored water †465<0.00153330.325000.00231NANA
Total latrines254285 7781 100105 7778
%% %% %% %%
HW stations within 5 m of latrines3257<0.00138490.01428680.0530540.01
HW stations with water only3055<0.00133490.00928610.0729540.009
HW stations w/soap and water2653<0.0012648<0.00125600.0526490.011
† only tested if FCR was 0.

