Runoff Changes from Urumqi Glacier No. 1 over the Past 60 Years, Eastern Tianshan, Central Asia


1
College of Geography and Environment Science, Northwest Normal University, Lanzhou 730070, China
2
State Key Laboratory of Cryospheric Science/TianShan Glaciological Station, Northwest Institute of Eco-Environment and Resources, Chinese Academy of Sciences, Lanzhou 730000, China
3
College of Science, Shihezi University, Shihezi 832003, China
4
College of Geographical Sciences, Fujian Normal University, Fuzhou 350007, China
*
Author to whom correspondence should be addressed.
Water 2020, 12(5), 1286; https://doi.org/10.3390/w12051286
Submission received: 3 March 2020
/
Revised: 29 April 2020
/
Accepted: 29 April 2020
/
Published: 1 May 2020
(This article belongs to the Special Issue Whither Cold Regions Hydrology under Changing Climate Conditions)
Abstract
:Glaciers are vital to water resources in the arid land of central Asia. Long-term runoff records in the glacierized area are particularly valuable in terms of evaluating glacier recession and water resource change on both a regional and global scale. The runoff records of streams draining basins with 46% current glacier cover, located at the Urumqi Glacier No. 1 in the source area of the Urumqi River in eastern Tianshan, central Asia, were examined for the purpose of assessing climatic and glacial influences on temporal patterns of streamflow for the period 1959–2018. Results suggest that runoff from the catchment correlates well with temperature and associated precipitation data. During the period 1993–2018, it increased by 114.39 × 10⁴ m3, which was 1.7 times the average runoff during the period 1959–1992. A simple water balance model is introduced to calculate the different components of the runoff, including precipitation runoff from glacier surface and from nonglacial areas, glacier mass balance and glacial runoff. Thus, the long-term change of each component and its response to climate change are revealed. We found that the period 1997–2018 is likely to be the “peak water” (tipping point) of the glacial runoff resulting from shrinkage of glacier area.
1. Introduction
Glaciers are vital to water resources, particularly in the arid land in Central Asia [1,2,3]. Most glaciers on Earth have retreated due to global atmospheric warming during the 20th century. Mountain glaciers around the globe have responded strongly to recent climate change and are expected to experience continued mass loss and retreat throughout the 21st century [4,5,6,7,8], which inevitably affects the water supply on their downstream communities. Glacier evolution and its impacts on hydrology is an urgent and critical question in practice as well as for scientific research, and presently, worldwide studies on glacial runoff are based on detailed observations from a rather small number of glacierized catchments or glaciers [9,10,11,12,13,14,15,16,17,18,19]. Consequently, detailed individual glacial runoff observation is imperative for the evaluation of glacier recession and water resource change on both a regional and global scale.
Urumqi Glacier No. 1 (UG1; 43°06′ N, 86°49′ E), located at the headwaters of the Urumqi River in eastern Tianshan, the core area of arid and semiarid central Asia, has the longest observation record of all the glaciers in China, covering the period from 1959 to the present. It is also one of the few glaciers in the world that has been monitored for more than half a century. As an important water supply for Urumqi, the provincial capital city of Xinjiang Uyger Autonomous Region, glacial runoff of UG1 and its change as well as its sustainability have drawn extensive attention. The 60-year glaciological and hydrometeorological observations in connection with this glacier provide a unique opportunity to examine the process and the response to climate change on glacial runoff in arid central Asia. Previous studies carried out on this glacier have focused on mass balance observation and simulation, glacier hydrology, area and terminus changes [20,21,22,23,24,25,26,27,28,29,30,31]. With respect to the different components of streamflow, a few studies have been conducted, particularly on glacial runoff. For instance, Yang [20] separated the glacial runoff of UG1 from streamflow for the first time by introducing a water balance model, and also described the basic characteristics of glacial runoff. Li et al. [25] found that the average annual glacial runoff increased by a factor of over two during the period 1959–2006, which was triggered by significant increases in temperature (annual average value increased 0.9 °C) and precipitation (annual average value increased 83.4 mm). This study analyzes the behavior of the different components of long-term streamflow and their interactions with temperature and precipitation on glacierized area. Such studies are scarce in the region and will greatly improve our understanding of the hydrological processes and mechanisms in glacierized areas in arid regions of central Asia.
2. Site Description, Methodology and Data Sets
2.1. Site Description
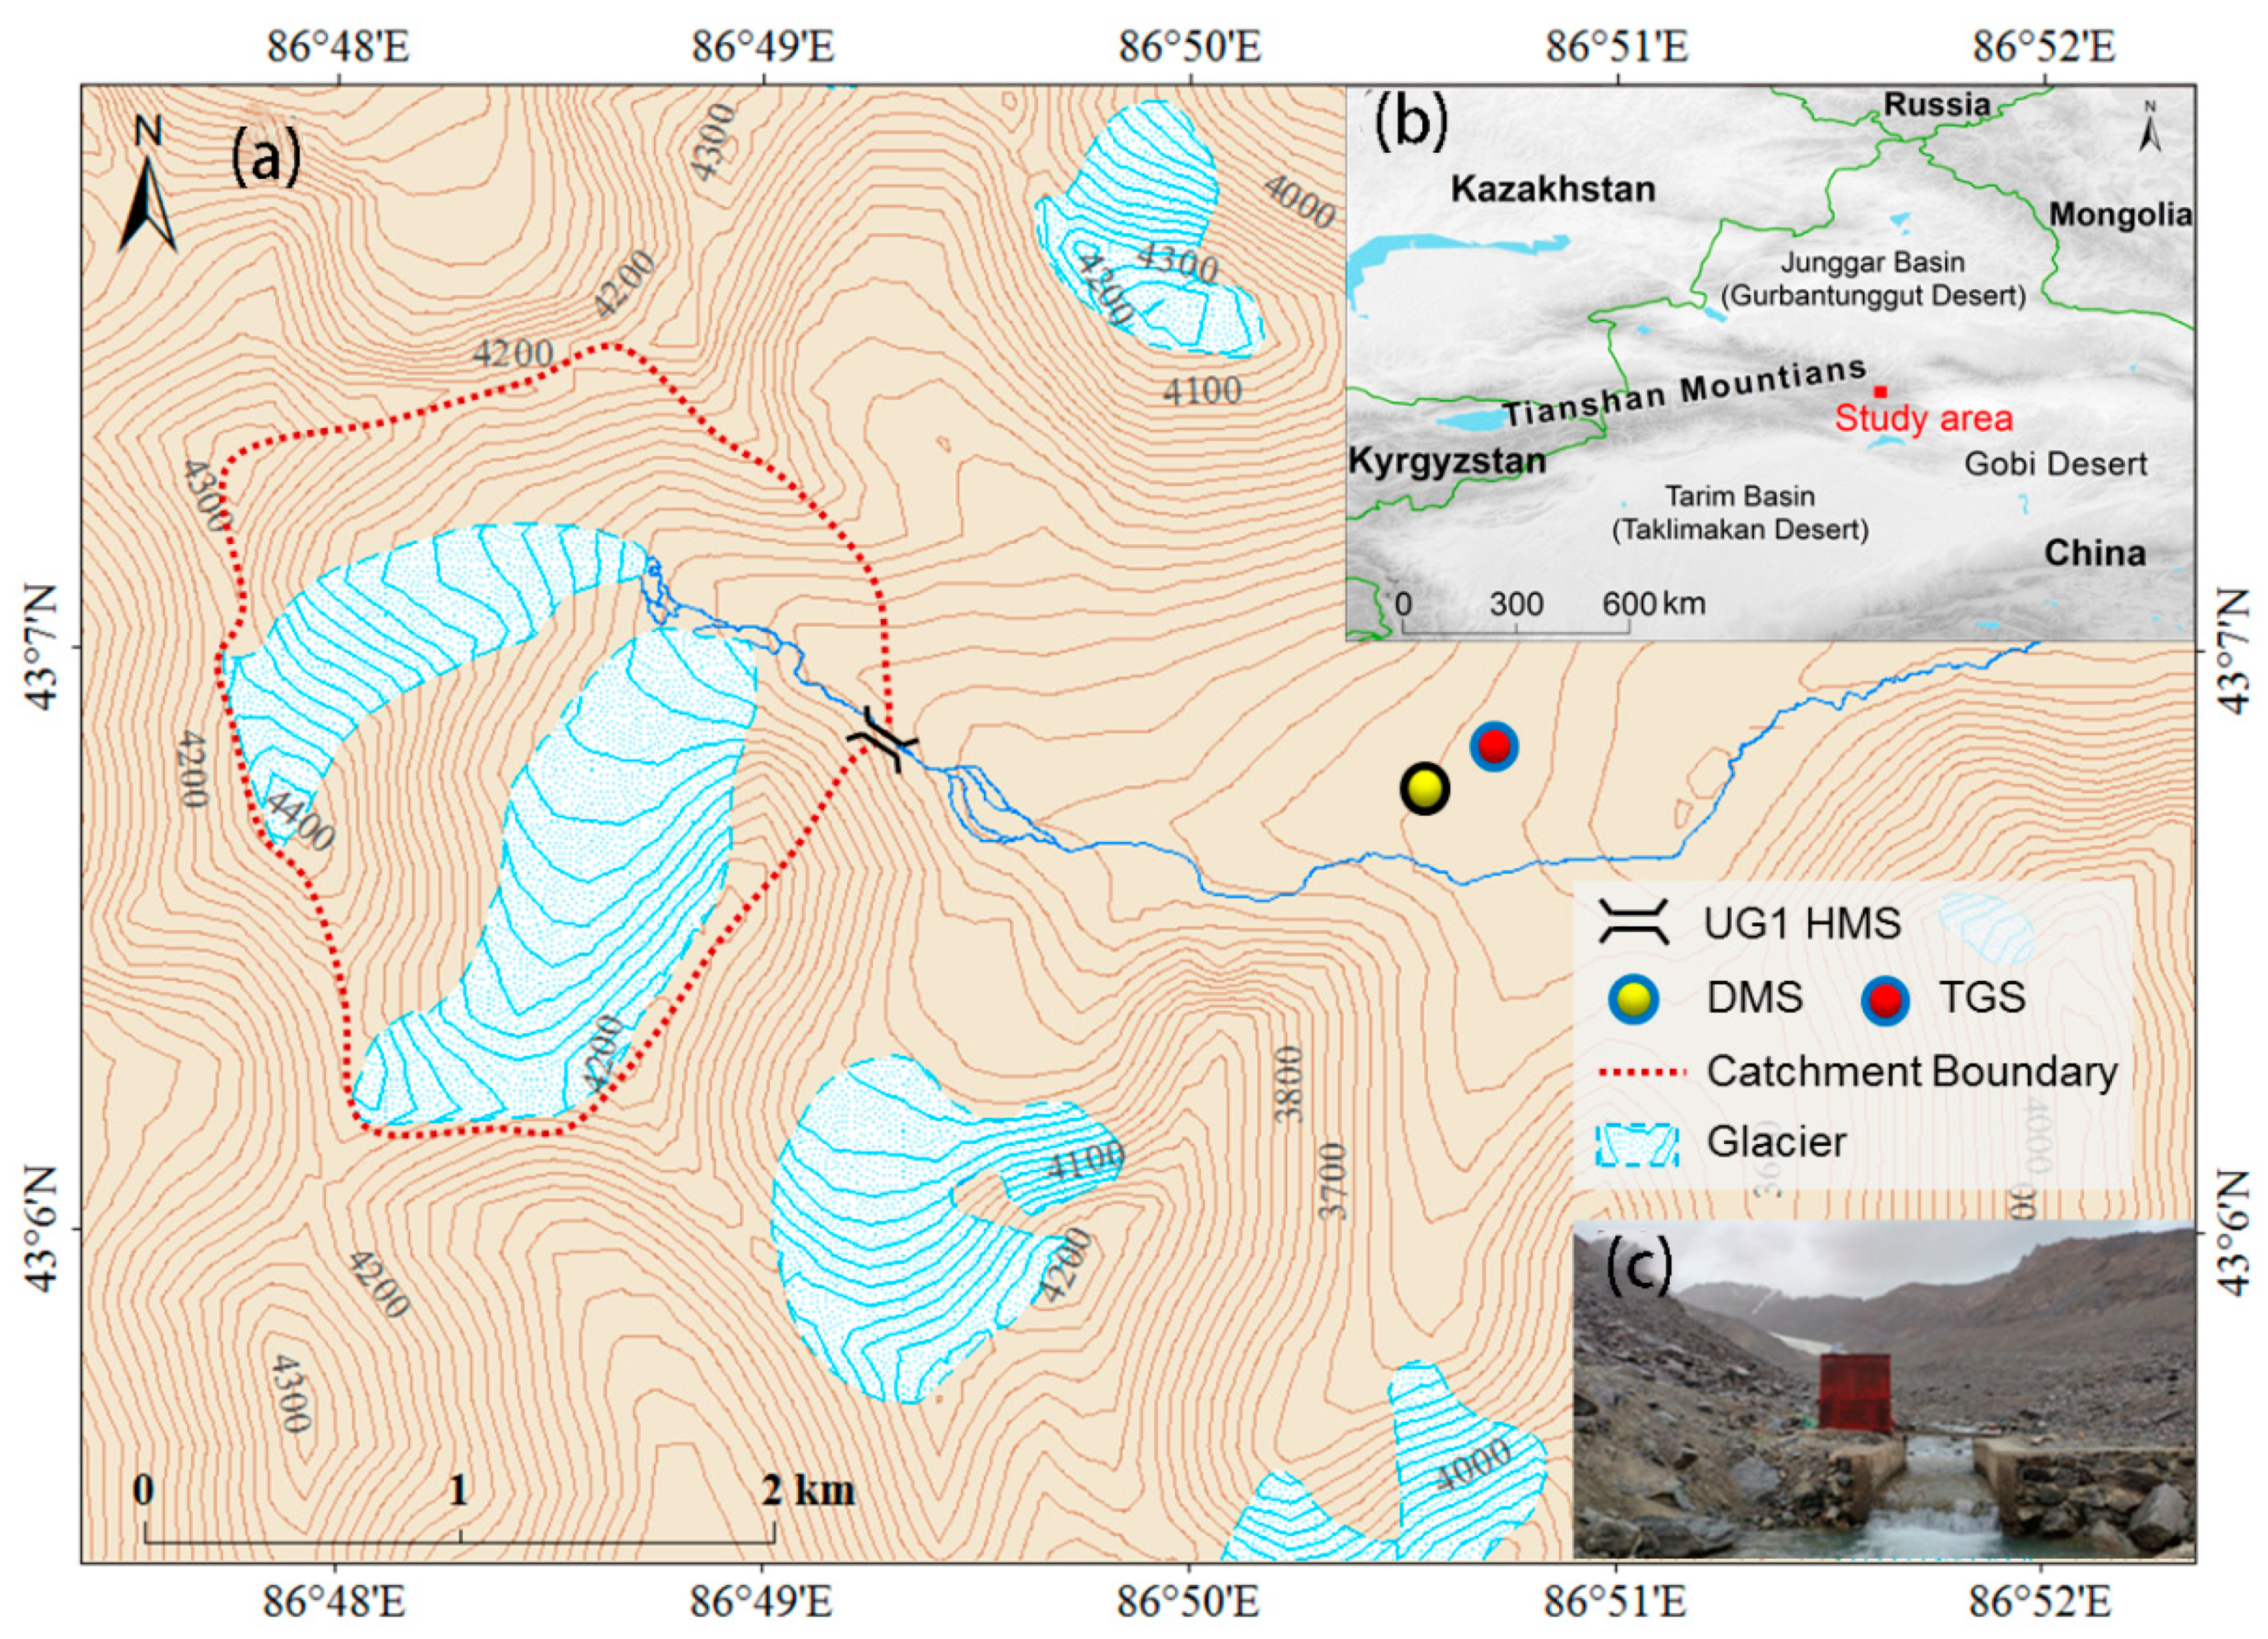
As shown in Figure 1, Urumqi Glacier No. 1 (UG1) is a northeast-facing valley glacier located at the source area of the Urumqi River in eastern Tianshan that contains 9035 glaciers with a total area of 9225 km2 and approximately 1011 km3 in volume [25]. The area is bordered by the Gurbantunggut Desert to the north, the Taklimakan to the south and the Gobi Desert to the east. UG1 is composed of east and west tributaries and covered from 1.95 km2 in 1962 to 1.54 km2 in 2017 [32]. It flanks the highest peak, Tianger Peak II, in southeastern Tianshan, which has an elevation of 4484 m a.s.l. These two tributaries became separated into two small dependent glaciers in 1993 due to continued glacier shrinkage [33]. The glaciers are surrounded by barren rock with scarce vegetation on the valley floor, but the mountain environment from 1500 to 2900 m a.s.l. is a forest zone, above 2900 m a.s.l. is alpine meadow and above 3000 m is bare rock, glacial deposits and permafrost in this region [25]. Climatological, glaciological and hydrological observations around this glacier were launched when Tianshan Glaciological Station (TGS) was established 3 km northeast of the glacier by the Chinese Academy of Sciences (CAS) in 1959. Adjacent to TGS, the Daxigou meteorological station began operation in 1958, at an elevation of 3539 m a.s.l. It is a national ordinary meteorological station set up by the China Meteorological Administration (CMA). The study area of this paper is the small catchment covering the glacier and controlled by the Urumqi Glacier No. 1 hydrometeorological station (UG1HMS). This gauging station was established in 1959 at the front of UG1 at an elevation of 3693 m for the purpose of measuring glacial runoff. The catchment elevation ranges between 3693 m and 4484 m a.s.l. and covers an area of 3.34 km2, nearly half of which is covered by the glacier.
2.2. Methodology and Data Sets
2.2.1. Water Balance Model
In order to present the observed long-term fluctuation of streamflow from the UG1 catchment and to analyze its interaction with temperature and precipitation, we introduce a simple water balance model to separate the different components of the streamflow. This allows us to characterize the temporal variability and governing factors of the different contributors. This model was previously partially employed and described for the UG1HMS catchment by Yang [20] and Li et al. [25]. By ignoring the spatial variation in the catchment and the temporal variability within a year for the variables in the model, this model is able to focus only on the total amount of the variables over the catchment in a yearly time scale. The annual water balance during a water balance year or a glacier mass balance year (from 1 September in previous year to 31 August) at the UG1HMS can be described by
where Rg is glacial runoff originated from glacierized area, R is total runoff measured at the gauging station and Rng is the nonglacial runoff derived from precipitation over the nonglacierized area in the catchment. In a simplified condition, Rng can be calculated from
where P is precipitation in the catchment, Ac and Ag are the areas of the catchment and of the glacier, respectively. The variable αng is the runoff coefficient over the nonglacierized area (ratio of observed runoff and precipitation over the nonglacierized area).
Because glacial runoff Rg is defined as the runoff solely from the glacier, which includes precipitation runoff derived from the glacierized area (Rpg) and glacier mass budget (balance) (MB), then Rg also can be described by
where Rpg can be calculated from
where αg is the runoff coefficient for the glacier (ratio of observed runoff and precipitation on the glacial surface).
According to Equations (1)–(3), MB can be calculated from
In our case, MB is also obtained from in situ measurement on the UG1 by using the glaciological method (stake/snowpit method), which provides an independent parameter to validate this model.
2.2.2. Data Sets
In the water balance model described, the runoff (R) measurements at the UG1HMS began in 1959 and were interrupted during 1967–1979, but the data were subsequently reconstructed using meteorological data [20]. The observations at the gauging stations are carried out from May to September each year, where the observed water level records are converted to discharges based on rating curves, and then converted into total daily, seasonal and annual volumes in cubic meters or annual runoff depths (dividing annual volumes by catchment areas) in mm. Over 95% of the annual runoff at the stations occurs during the observation period, whereas for the rest of the year, the stream is mostly frozen. The runoff data have been compiled and internally published in annual reports of the Tianshan Glacier Station from 1980–2018 [25].
Because the amount of precipitation in the UG1HMS catchment (P) is crucial for the water balance model, an intensive study was carried out to convert the measurements at Daxigou meteorological station to the real amount of precipitation in the catchment [34,35]. By comparing the precipitation volume from different rainfall gauges mounted at Daxigou and within the catchment, a correction coefficient (1.26) of that observed precipitation at Daxigou was determined by the study, which indicates the annual precipitation in the catchment (P) equals 1.26 times that observed at Daxigou. This correction coefficient was affirmed and introduced by subsequent research [20,25]. It is also adopted in our study.
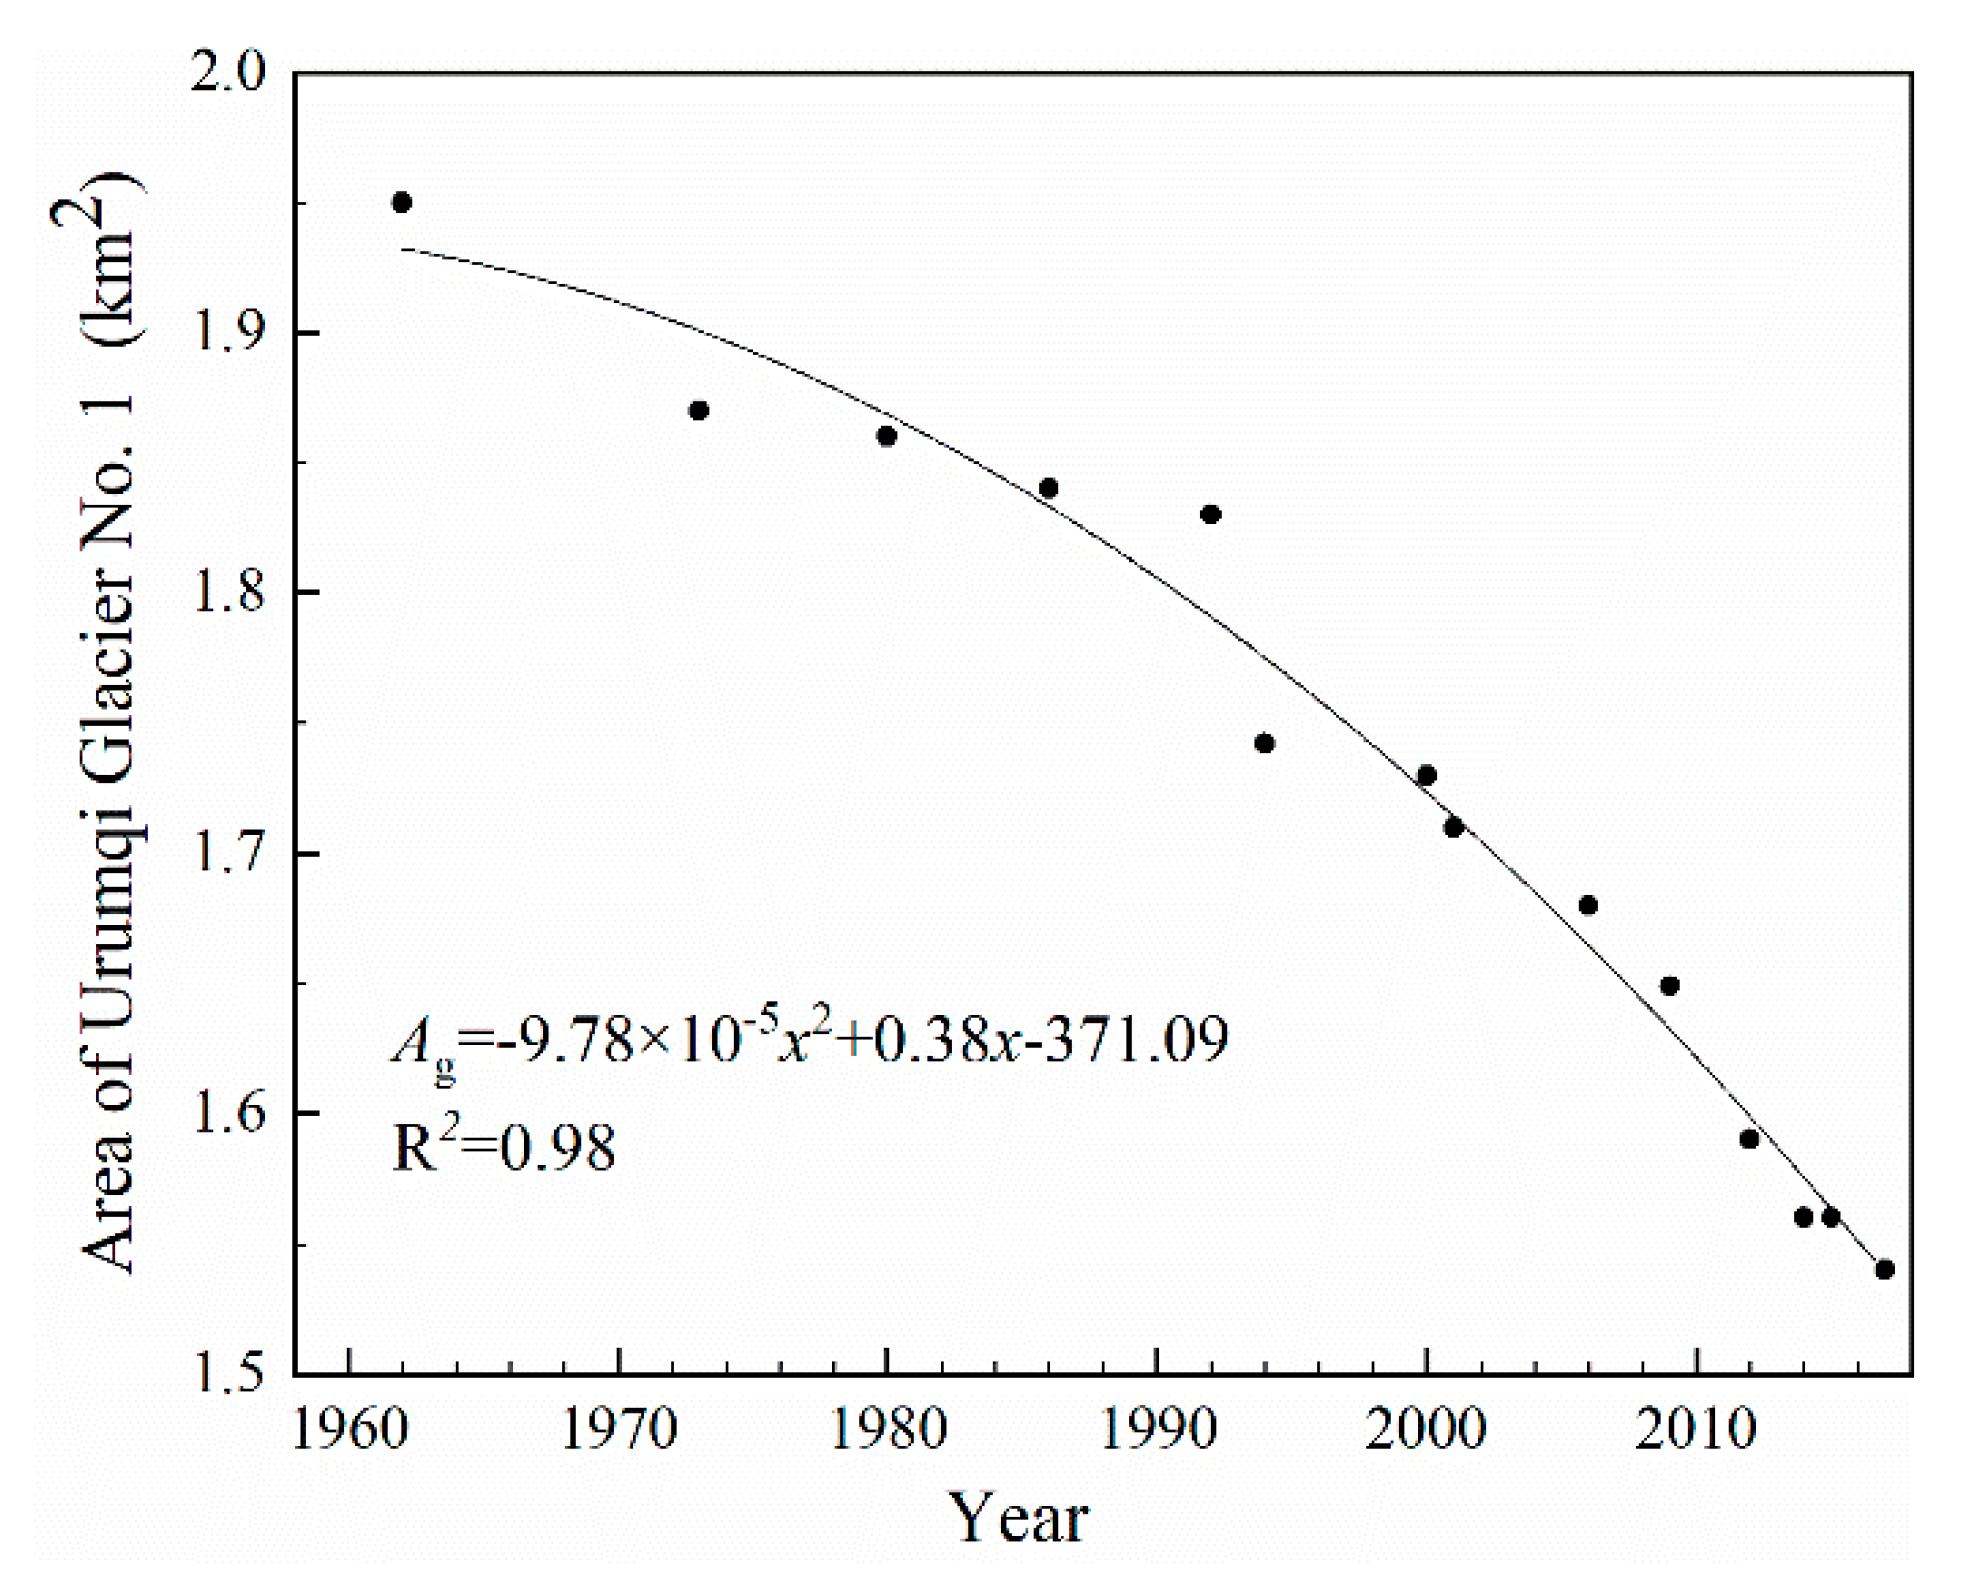
The area of UG1 (Ag), which was continuously shrinking throughout the entire period of observation, was measured from time-to-time by a variety of techniques such as theodolite, ground-based stereophotogrammetry, total station, GPS–RTK, remote sensing cartography and laser scanning. Based on these measurements, 14 topographic maps and the area data of the glacier were generated from 1962 throughout 2018. In our study, a regression equation (R2 = 0.98, n = 14, p < 0.01) was created according to the area data shown in Figure 2, which was used to estimate the annual values of Ag. Figure 2 indicates the shrinkage of the area is accelerating, which results from glacier mass loss and geometric adjustment to the mass loss through a glacier dynamic process [26].
The runoff coefficients for the area on the glacier (αg) and over the nonglacierized area (αng) are imperative input parameters in the water balance model. Based on long-term observation and a comprehensive analysis, Yang et al. [20] found that the values of these parameters varied in a relatively wide range for individual precipitation, but were relatively constant on interannual scale, ranging between 0.51–2.16, with an average value of 0.9 from 1959 to 1987. The best values of αg and αng for the UG1HMS catchment were thus estimated to be 0.85 and 0.7, respectively [20]. According to previous studies [36,37,38,39], the runoff coefficients are mainly determined by the magnitude of evapotranspiration. The interannual variations in terrestrial water storage and evapotranspiration are insignificant in a basin in a cold environment, like the UG1HMS catchment, which is covered by bare rock with little vegetation and has extensive snow and glacier cover. This might explain the relatively stable and high runoff coefficient of the UG1HMS catchment.
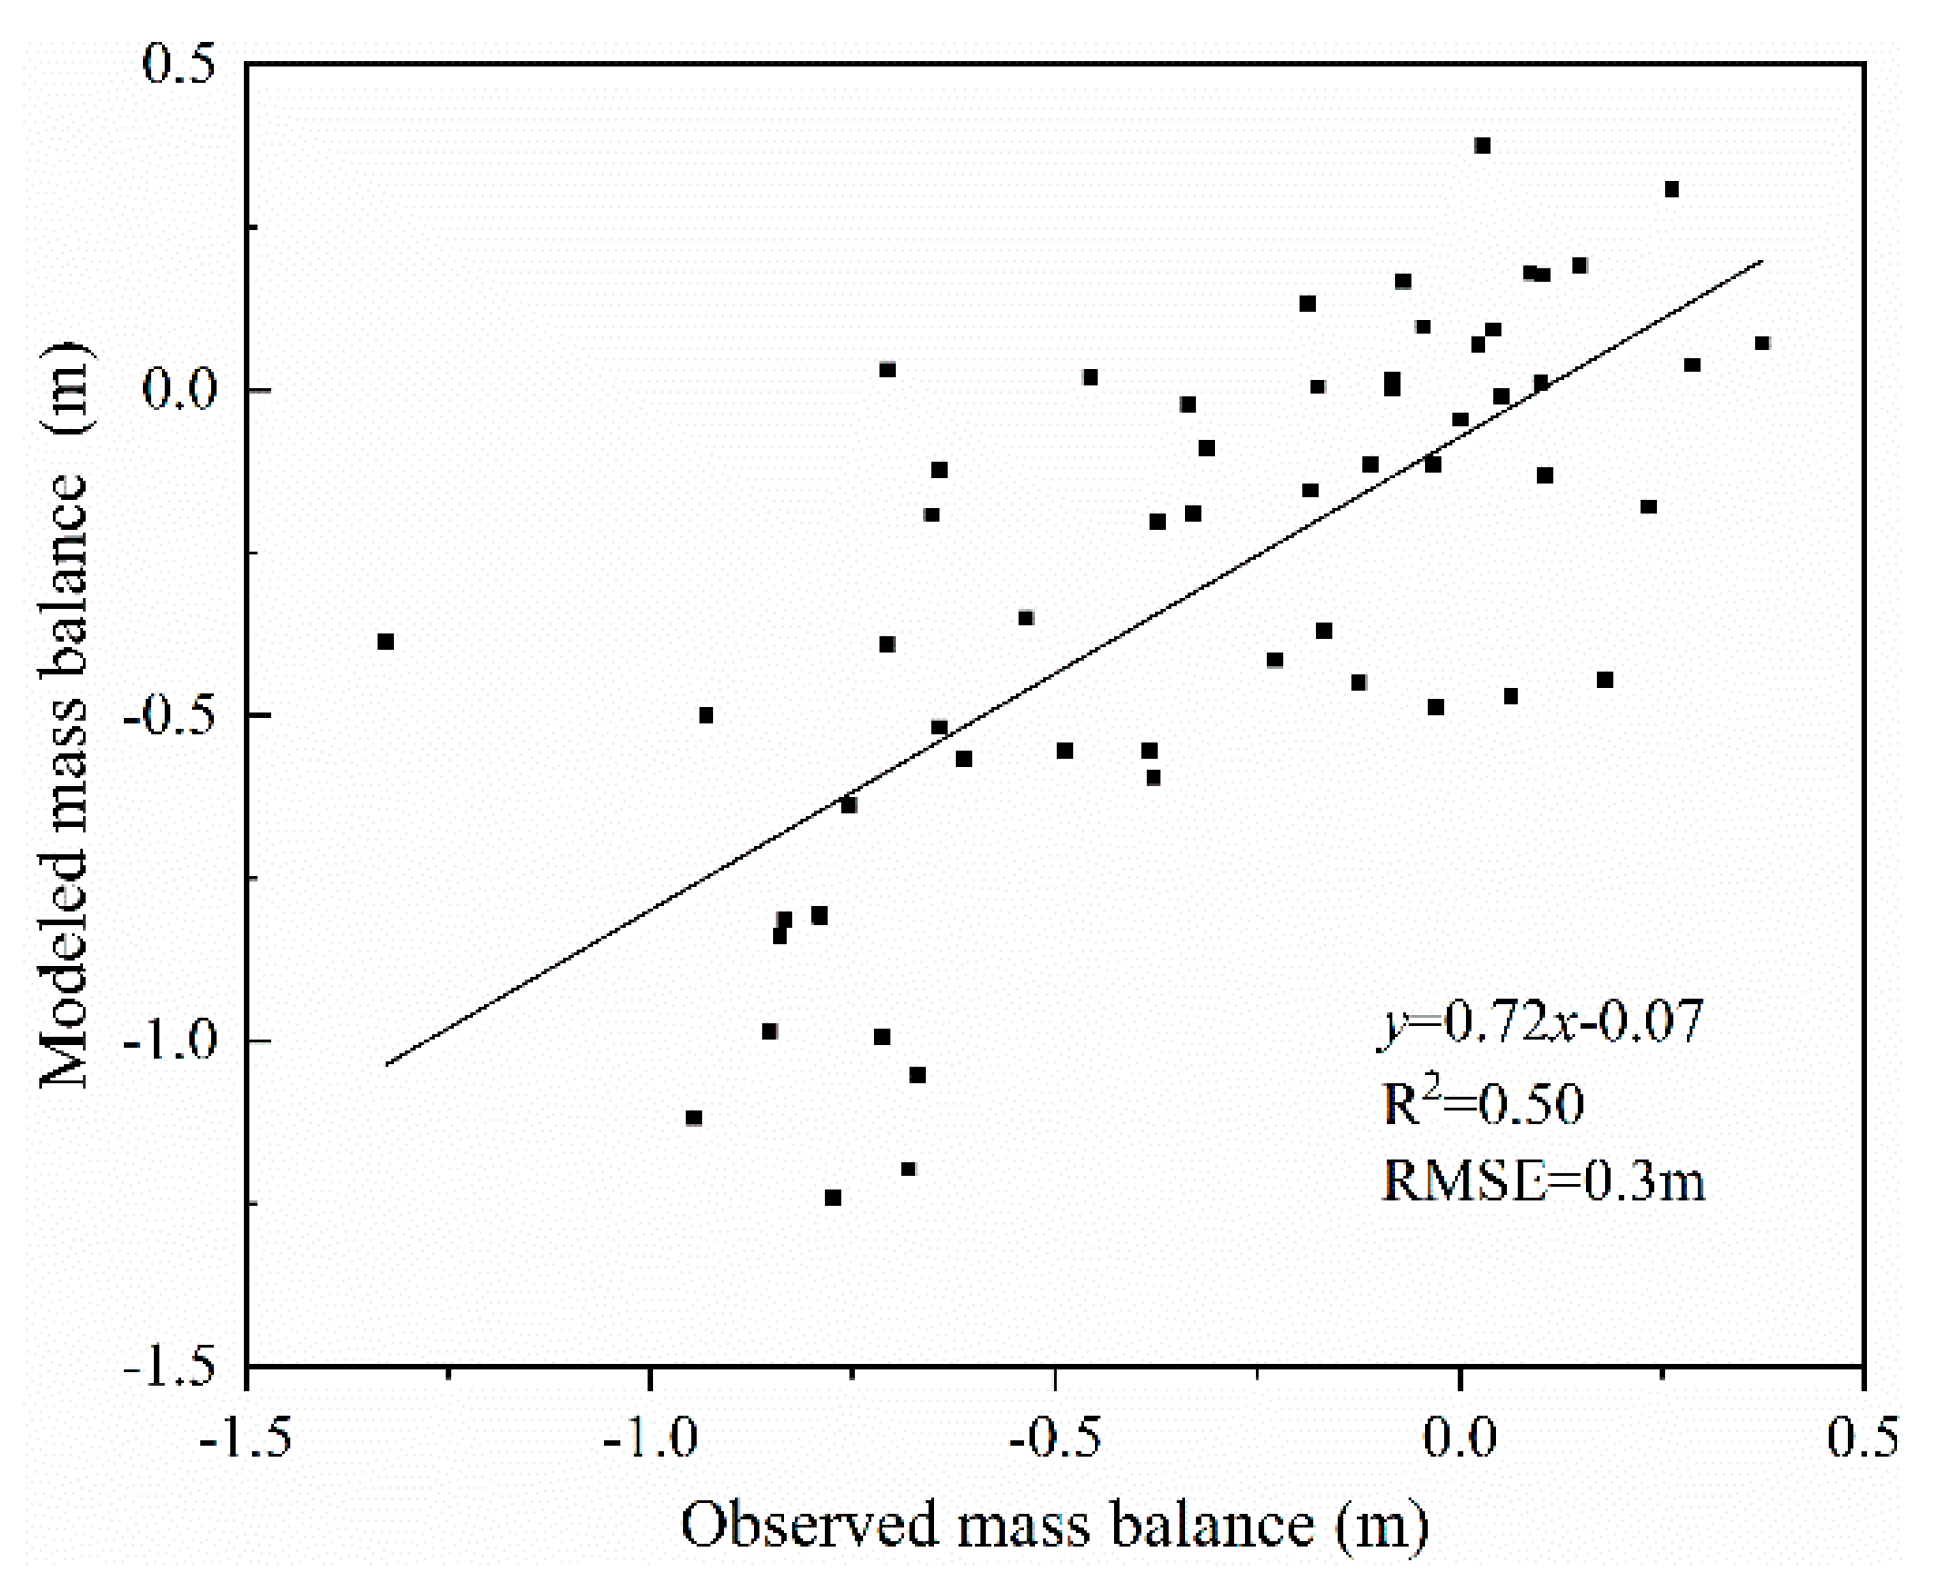
However, some more recent research suggested that the recent climate warming would have enhanced surface evaporation and thus decreased the values of the runoff coefficients [25,40]. To assess these runoff coefficients, test runs of the model were conducted in our study. We found that when the known pair of runoff coefficients is applied to the model, the modeled glacier mass balance agrees well with the glaciological mass balance (Figure 3). This result suggests that this known pair of runoff coefficients is still suitable for the UG1HMS catchment.
The mass balance of Urumqi Glacier No. 1 has been observed since 1959. The mass balance data are available from 1959 to 2018, except for 1967–1979. The missing data from 1966 to 1979 was reconstructed by meteorological data [41]. The single-point specific mass balance has been measured on a monthly basis from 1 May to 31 August by the stake/snow pit method. The stake network consists of not less than 42 stakes drilled into the glacier surface and evenly distributed with elevation. Using the data of specific mass balance and additional snow pits, glacier-wide mass balance, annual net accumulation and ablation during the period from September 1 in previous year to August 31 are calculated by contour maps of accumulation and ablation [21,22,42,43]. Glaciological data have been internally published in annual reports of the Tianshan Glaciological Station from 1980–2018, and in the Glacier Mass Balance Bulletin and Global Glacier Change Bulletin [44].
3. Results and Discussion
Based on Equations (1), (2), (4) and (5), glacial runoff (Rg), nonglacial runoff (Rng), precipitation runoff derived from the glacier surface (Rpg) and glacier mass balance (MB) at the UG1HMS are computed. The results show that the contribution of glacial runoff (Rg) to the total runoff (R) over the past 60 years is dominating, accounting for 70%, and the remaining 30% comes from nonglacial runoff (Rng) derived from precipitation over the nonglacierized area in the catchment. The glacial runoff (Rg) is composed of the glacier mass balance (MB) and the precipitation runoff formed from the glacier surface (Rpg), which, respectively, account for 26% and 44% of the Rg on average for the past 60 years.
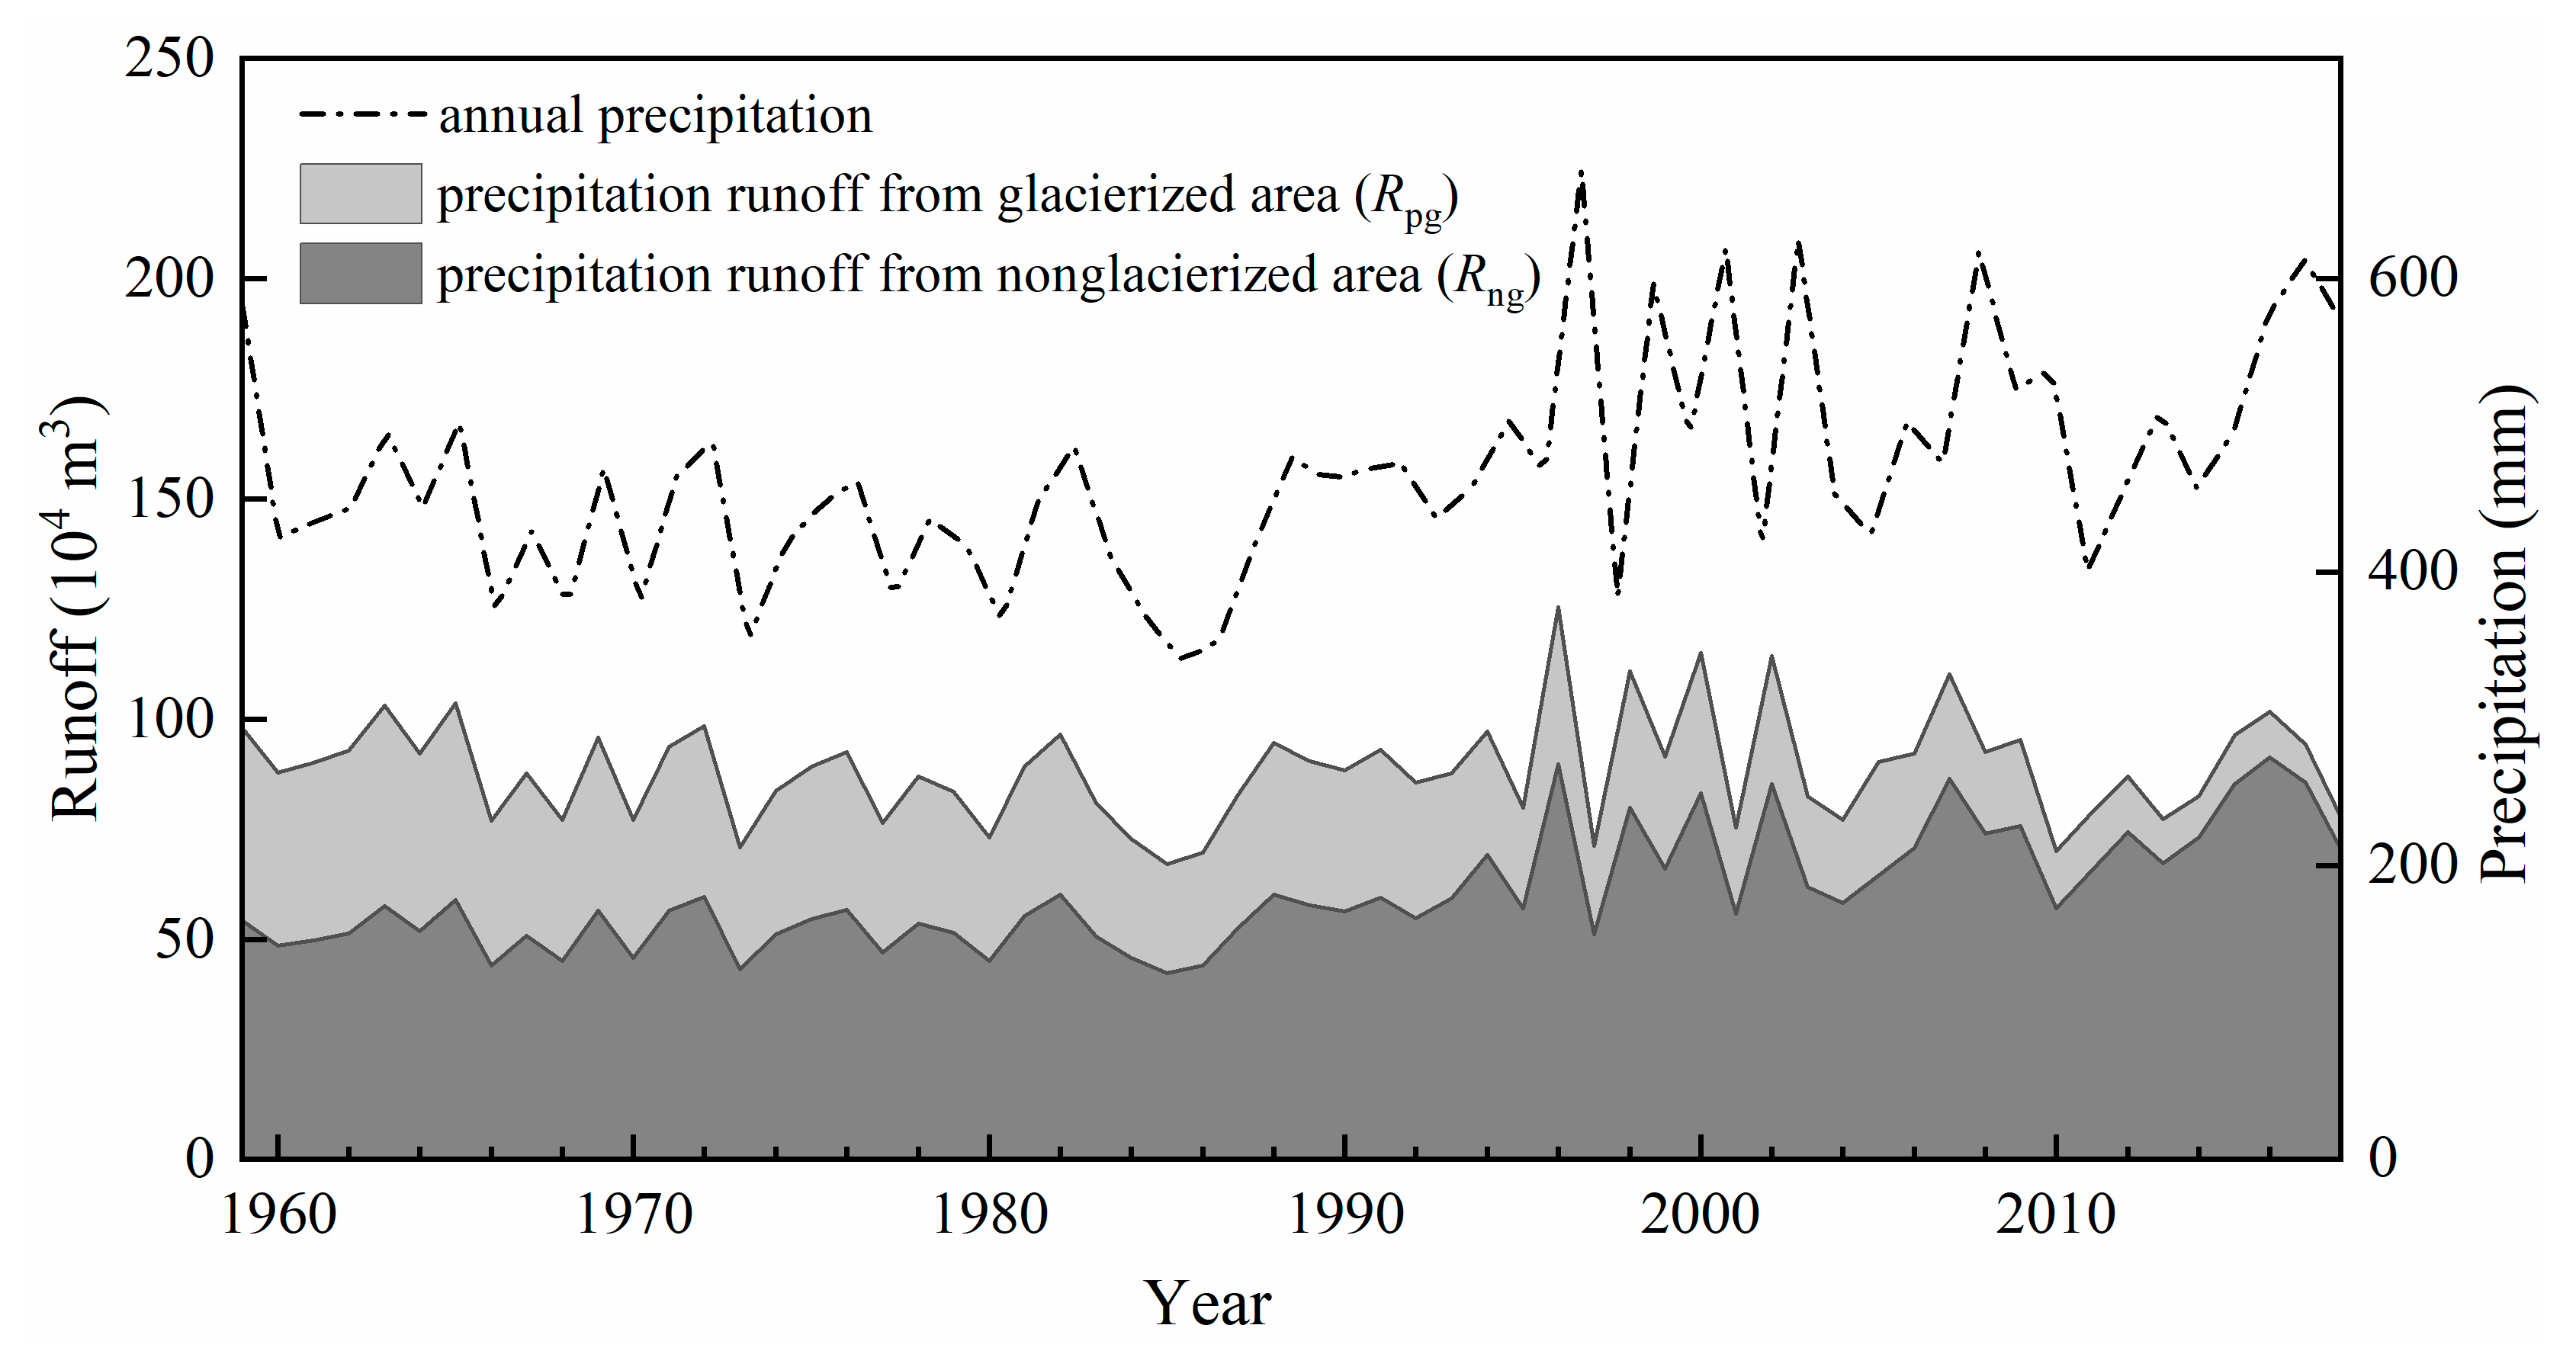
Figure 4 shows the variations of R, Rg and MB during the period of 1959–2018. To explore the drivers behind the fluctuation, the average temperature during the maximum glacier-melting period from July to August and the annual precipitation are also plotted in the same figure. The temporal variations of Rpg and Rng are shown in Figure 5. Because both precipitation runoff derived from the glacierized area (Rpg) and from nonglacierized areas (Rng) are related to precipitation, the annual precipitation series is also included in this figure.
3.1. Total Runoff (R)
R demonstrates a significant amplification from 1959 to 2018 with large interannual fluctuation. It can be roughly divided into two stages (Figure 4). During the first stage from 1959 to 1992, the value of R was relatively low, with an average of 157.39 × 10⁴ m3. In the second stage from 1993 to 2018, R rises dramatically, particularly in its baseline. The value reaches as high as 271.78 × 10⁴ m3 on average, an increase of 114.39 × 10⁴ m3, which is 1.7 times compared with the first stage. Today, R appears at a high level with a large interannual variability.
The long-term change of temperature is overall consistent and well correlated with total runoff (R2 = 0.68, n = 60, p < 0.01) as shown in Figure 4. It also exhibits two stages: rising strongly after 1992 as R does. The average value of the temperature during the period of 1993–2018 was 1.0 °C higher than that in 1959–1992. Because air temperature is well correlated with meltwater in mountains areas [45,46], this indicates that the escalating runoff largely originates from the increased meltwater production as a result of the mass loss of the glacier.
The relationship between precipitation and runoff is more complex. On the one hand, precipitation increases significantly during the period of 1996–2018, with an average annual value of 517 mm, 80 mm higher than that of 1959–1995. This is highly consistent with the overall increase of runoff. On the other hand, the interannual correlation between runoff and precipitation from 1959–2018 is relatively weak (R2 = 0.35, n = 60, p < 0.01). The reason is perhaps that while enhanced precipitation increases the overall quantity of water entering the watershed, it also diminishes glacier melting on an annual timescale.
Our study indicates that R depends on both the timing and magnitude of precipitation and temperature. It rapidly rises to a high level after 1992 coinciding with the double-stepped increases in temperature and precipitation. The increase in precipitation resulted in the increase of the total amount of water entering the catchment, and the increase in temperature aggravated the melting of snow and ice in the glacierized area.
3.2. Precipitation Runoff Derived from the Nonglacierized Area (Rng) and Glacier Surface (Rpg)
The values of precipitation runoff derived from the nonglacierized area (Rng) calculated by Equation (2) ranges between 42.34 × 10⁴ m3 and 91.23 × 10⁴ m3 with an average of 60.51 × 10⁴ m3 over the past 60 years, which accounts for 30% of the total runoff (R) on average. According to Equation (2), Rng is determined by the amount of precipitation, the runoff coefficient of the nonglacierized area (αng) and the value of nonglacierized area (Ac–Ag) in the catchment. Consistent with the variation of precipitation, the long-term change of Rng can be roughly divided into two periods: from 1959 to 1995 and from 1996 to 2018. During the period of 1996–2018, Rng averaged 72.7 × 10⁴ m3, compared with 52.9 × 10⁴ m3 during the period of 1959–1995, thus showing an increase of 19.8 × 10⁴ m3 or 27% (Figure 5).
With respect to αng in Equation (2), it is constant over time and not temperature dependent in the research catchment because the nonglacierized area mainly includes bare hillside, with sparse vegetation coverage, the loss of precipitation results mainly from evaporation and snow sublimation on stable rock and soil surface with an elevation between 3659 m and 4480 m. Rising temperature may elevate the rainfall ratio in liquid precipitation and enhances the melting of snowpack in the catchment; however, it does not change the annual value of Rng, as all snowpack in the nonglacierized area eventually melts away at the end of summer and supplies to Rng.
The precipitation runoff derived from the glacier surface Rpg is calculated by using Equation (4), ranging between 67.13 × 10⁴ m3 and 125.38 × 10⁴ m3 with an average value of 88.58 × 10⁴ m3 over the past 60 years, and accounts for 44% of the total runoff (R). According to Equation (2), Rpg is determined by the amount of precipitation, the runoff coefficient of the glacier (αg) and the glacier area (Ag) in the catchment. The temporal variation of Rpg (Figure 5) is generally consistent with precipitation, but unlike the Rng, the average value in the period of 1996–2018 is 91.69 × 10⁴ m3, compared with that of 86.64 × 10⁴ m3 in the period of 1959–1995, thus showing just a little increase.
Regarding αg in Equation (4), it is found to be influenced by multiple factors, because the transformation of precipitation to runoff on a glacier surface is more complicated than that on the nonglacierized area. A glacier usually can be divided into accumulation and ablation zones. The dividing line is called the equilibrium line. The surface of the accumulation zone is composed of firn (snow that lasts for more than a year), and the surface of the ablation zone is usually bare ice in summer. All precipitation occurring in the ablation zone is able to convert into runoff at an annual scale, thus making αg a constant value in the ablation zone. However, in the accumulation zone, a portion of snowfall is turned into glacier through the processes of granulation, densification and dynamic metamorphism, which may take several years [47]. The other portion is melted and penetrates into the firn layer on the glacier, which either refreezes and becomes part of the glacier, or forms runoff at the interface between firn and glacial ice and transforms into Rpg [48]. The αg in the ablation zone is obviously greater than in the accumulation zone where it is positive, depending on temperature. Furthermore, higher temperature can enlarge the ablation zone and reduce the accumulation zone by raising the equilibrium line (average value is 4073 m a.s.l.), which also increases αg. The αg value (0.85) used in this study is a multiyear observed average value. On an annual scale, αg varies greatly and largely depends on temperature.
According to Equations (2) and (4), the shrinkage of glacier area Ag resulted in a reduction of Rg and an amplification of Rng. This explains the larger increase in Rng than that in Rg during the period of 1996–2018. Regarding the total runoff R, it is reduced by the shrinkage of Ag. This is because αg is greater than αng, and the increase in Rng was not able to compensate for the decrease in Rg.
3.3. Glacier Mass Balance (MB)
The glacier mainly gains mass (solid precipitation) in the accumulation zone and loses mass through melting in the ablation zone [49]. MB is defined as the net change in mass of a glacier over a balance year (from 1 September in previous year to 31 August). Thus, MB presents the runoff derived from glacier melting itself. A positive value of MB indicates the surplus of glacier mass gained from snowfall. On the contrary, a negative value indicates the loss of glacier mass released to glacial runoff. Over the past 60 years, MB calculated by the water balance model (Equation (4)) shows a strong negative growth tendency (Figure 4), ranging between 66.82 × 10⁴ and −213.71 × 10⁴ m3, with an average of −57.87 × 10⁴ m3 (negative value means mass loses of the glacier). These values were verified by the in situ observation: the mass balance measured by using stake/snowpit method at the same period of time is consistent with calculated glacier mass balance series (Figure 3), ranging from 72.01 × 10⁴ to −216.21 × 10⁴ m3, with an average of −56.12 × 10⁴ m3. According to the value of MB, glacier melting releases 54.88 × 10⁴ m3 on average to the catchment annually, which accounts for 26% of R in the past 60 years.
The long-term variation of MB is inversely correlated with air temperature (R2 = − 0.67, n = 60, p < 0.01). According to glacier physics, glacier mass balance is determined by the energy budget (balance) of the glacier surface. The energy comes mainly from solar radiation. As one of the factors in the energy budget, air temperature plays a vital role in glacier melting [26]. If the ice is covered by snow, the energy is first used to melt snow. If there is no snow cover, the ice starts to melt, generating glacial runoff [50]. Actually, to explain mass balance and its interaction with meteorological elements (here referring to temperature and precipitation), a mass balance model coupled with a surface energy balance model on the glacier is required. From a previous study based on a mass balance model, three mechanisms are found to be responsible for an enhanced mass loss of UG1 [26]. The first is air temperature rise during the melting season as described by positive degree days (PDD, the sum of daily mean air temperatures above the melting point in a year) [24,26], which directly enhances the melting rate of the glacier. Due to the rapid ascent of air temperature, the simultaneous increase in precipitation did not prevent UG1 from the acceleration of mass loss in this case. This is because the warming temperature elevates the ratio of rainfall to snowfall precipitation and enhances glacier melting [26]. The second is the ice temperature rise of UG1, which reduces the heat in raising the ice surface to the melting point and in the refreezing of percolation of meltwater as well. As a result, it increases the sensitivity of the glacier to climate warming, making it an important contributor to the accelerated mass loss. The third is the albedo reduction of the glacier surface due to the continued increase of the ablation area. The positive feedback of glacier recession on the ablation area has most likely resulted in an accelerated mass loss. The low albedo in the ablation was found to be caused by mineral dust, which is mainly derived from the surrounding Asian deserts, as well as organic matter, such as living cyanobacteria on the dust surface, which is produced quickly as temperature rises.
The relationship between MB and precipitation is complicated. A higher snowfall can moderate glacier melting thus making MB more positive, and oppositely, a higher rainfall can accelerate glacier melting thus making MB more negative. Additionally, the shrinkage of the glacier area (Ag) results in a reduction in the total amount of glacier melt and leads to an extra positive MB value.
3.4. Glacial Runoff (Rg)
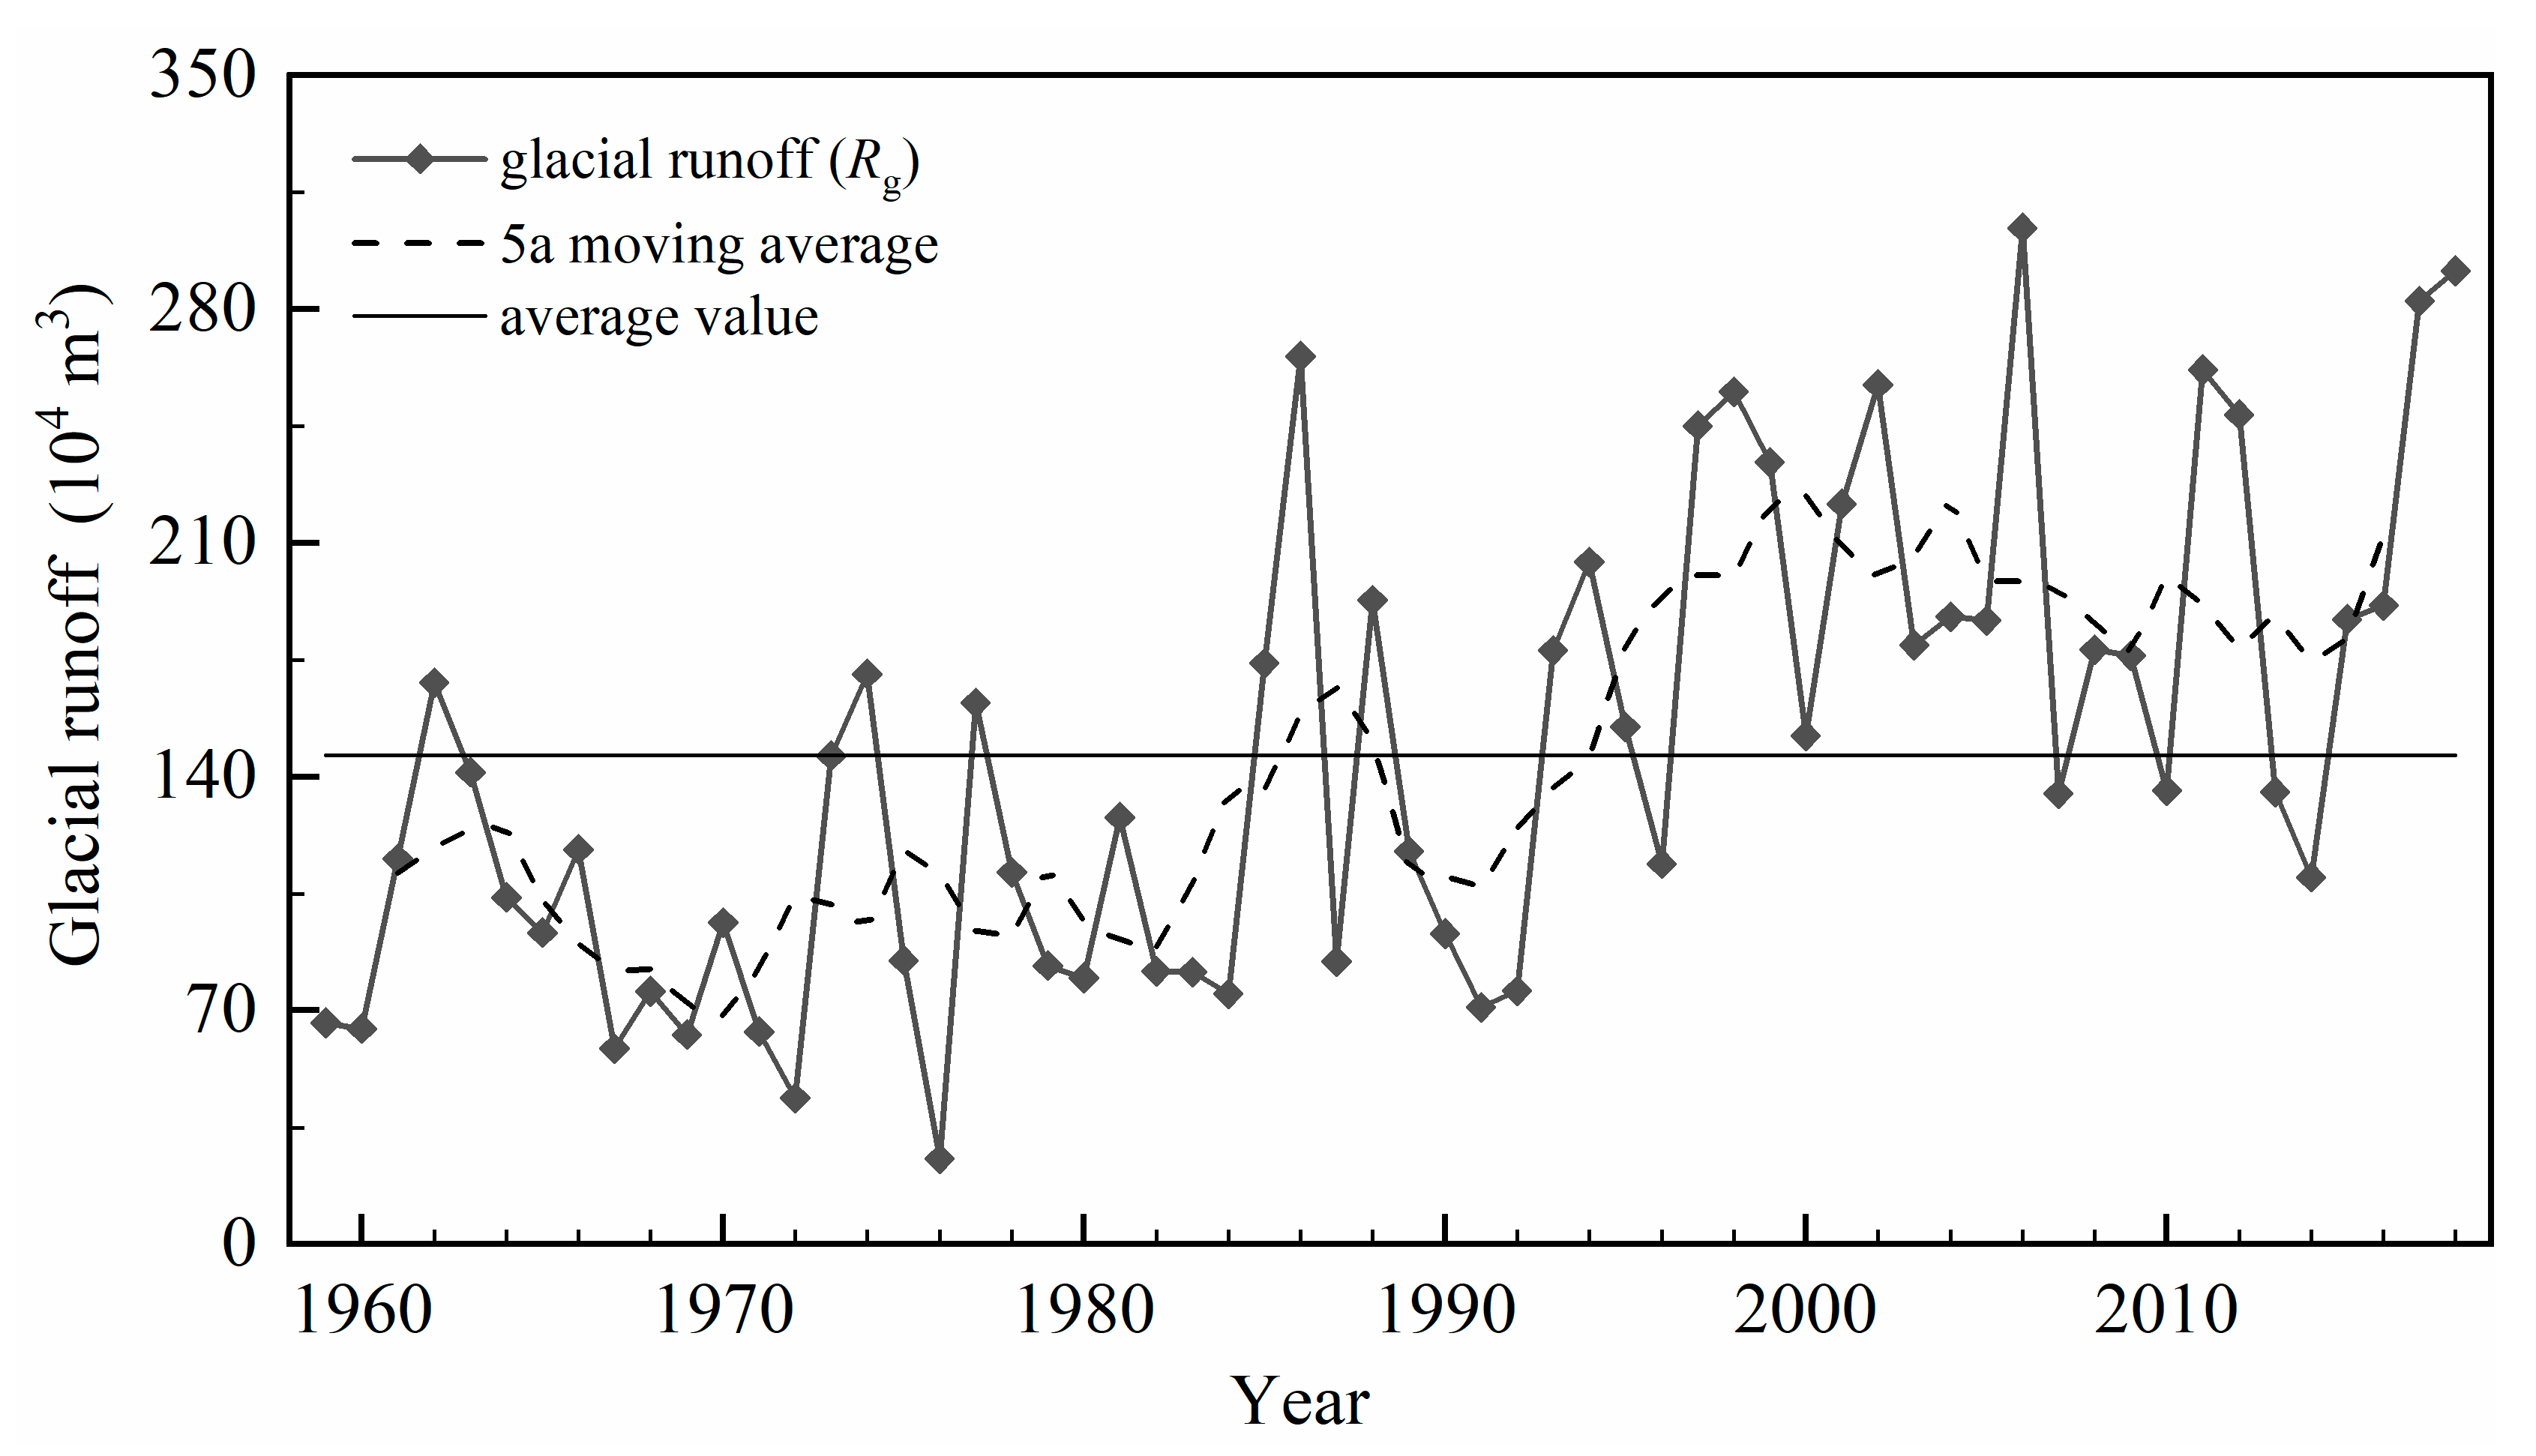
Originating in the glacier, the glacial runoff Rg of UG1 is composed of mass balance (MB) and precipitation runoff (Rpg), and is calculated by subtracting nontotal runoff Rng from total runoff R (Equation (1)). As result, the values of glacial runoff over the past 60 years fluctuate significantly between 25.61 × 10⁴ and 304.35 × 10⁴ m3 with an average of 146.45 × 10⁴ m3, which accounts for 70% of R. This indicates that R is largely determined by Rg.
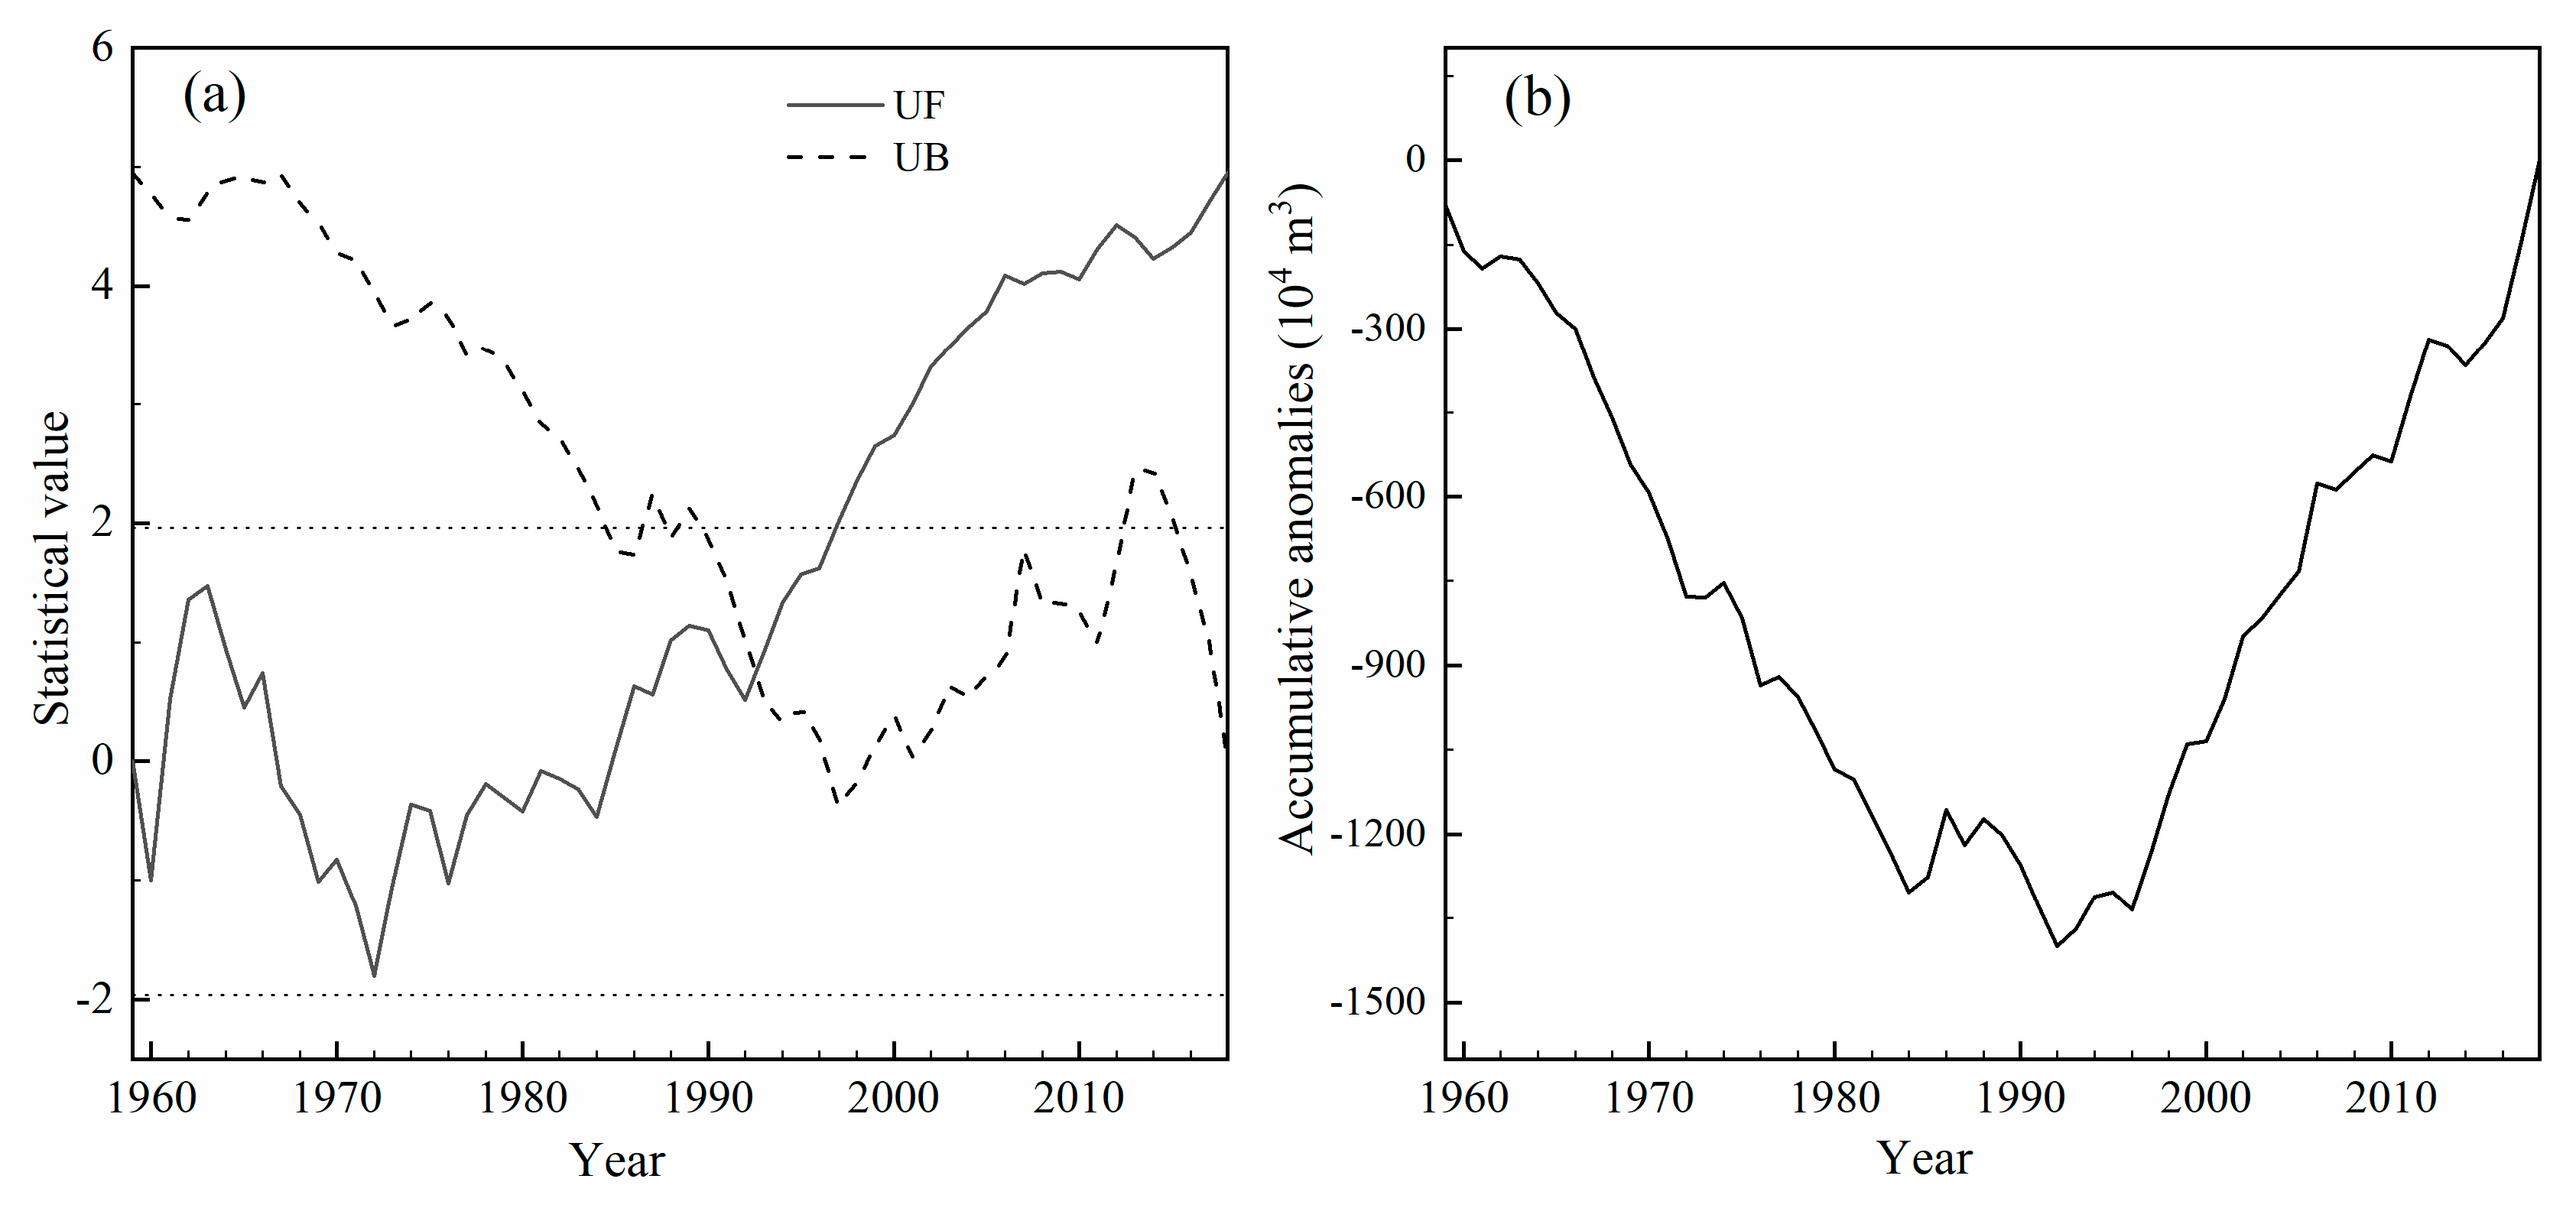
The long-term change of Rg and the five-year moving average curve demonstrate an overall rising tendency (Figure 4 and Figure 6). To look into the details, we performed a trend test for glacial runoff (Figure 7). Results from the Mann–Kendall (M–K) mutation test showed that the glacial runoff had an abrupt change in 1992. The only point of intersection between UF and UB (two confidence lines of α = 0.05)occurred in 1992 and the intersection point was within two confidence lines of α = 0.05, indicating that an abrupt change of the glacial runoff occurred in 1992. It was also confirmed by the mathematical analysis of the curve change point. The UF was higher than 1.96 after 1997, and the tendency of UF to continue to increase was obvious (Figure 7a). The minimum flow of its cumulative anomaly curve appeared around 1992 and experienced a fluctuation from low to high (Figure 7b). Both results indicate there was a dividing time line around 1992, and this result passed the significance test of α = 0.01. As a result, similar to R, the glacial runoff can be characterized by two stages: one from 1959 to 1992 and the other from 1993 to 2018. During the first stage, Rg was relatively low with an average value of 105.24 × 10⁴ m3. In the second stage, however, Rg experienced sustained growth. The average value, reaching 200.33 × 10⁴ m3, increased by 94.64 × 10⁴ m3 and corresponded to a value that was 1.904 times the first stage.
The maximum value of 266 × 104 m3 of the first stage appeared in 1986. A previous study examined the hydrological process of this specific year, in which the mechanism was clearly revealed [51]. The extremely high Rg in 1986 was attributed to record high temperatures that occurred during July–August. The average value of temperature in July–August was 1.1 °C higher than that observed in the past years. As a result, the average monthly runoff was over 2.65 times the monthly average for prior years. Due to the remarkably high temperature, the ablation zone of UG1 in 1986 was largely expanded into the former accumulation zone, which dramatically enhanced the glacier melting. Subsequently, a huge mass of UG1 was lost and transformed into Rg.
During the second stage from 1993 to 2018, the Rg continuously rose and gradually reached its maximum period of 1997–2007 with an average value of 213.02 × 10⁴ m3, and then demonstrated a slight decreasing tendency with great annual fluctuations from 2008 to 2018, as shown in Figure 4. The average value in this period of time declined to 189.07 × 10⁴ m3.
The value of Rg equal the algebraic sum of mass balance (MB) and precipitation runoff derived from glacier surface (Rpg) (Equation (3)), therefore, it should be closely related to air temperature and the precipitation. Over the past 60 years, Rg was found to be well correlated with temperature (R2 = 0.65, n = 60, p < 0.01) but poorly correlated with precipitation (R2 = 0.2, n = 60, p > 0.05).
As from previous results, a higher temperature was beneficial to producing both MB and Rpg, but as for the precipitation, it was more complex. The effect of snowfall and rainfall in precipitation were different. Firstly, in a year with abundant snowfall, both Rpg and Rng had higher values, thus contributing more water to R. However, at the same time, because a higher snowfall can protect the glacier from melting, the value of MB turns to be more positive (the glacier gains more mass), so that the glacier generates less water to Rg, so as to R. This is opposite in a year with less snowfall. Therefore, the opposite effect of snowfall on Rpg and MB over a glacier can actually stabilize Rg, and thereby R. Because of the adjustment capacity to streamflow, the glacier is regarded as “solid reservoir,” which is extremely advantageous to the water supply in arid land of central Asia.
Secondly, the rainfall in the precipitation over the glacier can bring heat to the surface and accelerate the glacier melting, so that the effect of rainfall on MB is opposite to that of snowfall. The ratio between snowfall and rainfall is thus significant to Rg, which is sensitive to air temperature. The precipitation in the study area mainly occurs in summer. The average value of precipitation from May through September accounts for 87% of the whole year. Therefore, a higher temperature can reduce the value of the ratio of snowfall to rainfall, and therefore promote glacier melting. This phenomenon is quite different from the Alps in Europe, where more precipitation is brought by westerly current and occurs during winter as snowfall, which can efficiently protect the glacier from melting [52,53].
As the result, the amplification of Rg during the period from 1992 to 2018 is mainly attributed to the negative increases in MB caused by an elevated temperature, and also the rise in Rpg triggered by precipitation increase. In addition, the reduction of the ratio between snowfall and rainfall caused by a rising temperature is believed to play a significant positive role.
Here, special attention must be paid to the period of 2008–2018 in Figure 6. During this time period, contrary to a continuous increase of temperature (as shown in Figure 4), Rg shows an unexpected slightly downward trend. Meanwhile, precipitation is fluctuating with an overall descending trend. Two reasons are found to be possibly responsible for the decline of Rg. The first is the general decrease in precipitation, which diminishes Rpg. The second must be the reduction of the glacier area Ag. The shrinkage of Ag not only leads to a decrease in Rpg according to Equation (4), but also reduces the total amount of melt on the glacier (making MB more positive in value), both of which can be found from the temporal changes of Rpg and MB. Due to the reduction of Ag, a much larger growth in Rng than that in Rpg occurs, as shown in Figure 5. The MB runoff is found to demonstrate a slightly decreasing trend during the period 2008–2018, as shown in Figure 4, which is evidently because of the shrinkage of Ag. This process was studied and described by previous research [16,54]. According to the studies, as glaciers recede, water is released from long-term glacial storage (MB). Thus, annual Rg volume typically increases until a maximum is reached, often referred to as “peak water,” beyond which Rg decreases because the reduced glacier area can no longer support rising meltwater volumes. As a matter of fact, the area of UG1 showed a decrease of 21%, from 1.95 km2 in 1962 to 1.54 km2 in 2017. If the negative effect of Rg was enough to offset the positive effect of rising temperature on Rg, the peak water (tipping point) of the glacial runoff already appeared during the period of 1997–2007. To confirm this finding, however, longer observation and more in-depth quantitative analysis are further required. Apparently, the decreasing trend of glacial runoff after 2007 resulted from both diminishing precipitation and decreasing glacier area.
4. Conclusions and Outlook
The Urumqi River headwater region has the longest runoff records of any glacier in China. This study analyses streamflow at Urumqi Glacier No. 1 gauging station (R). A simple water balance model is used to separate the different components of R, including precipitation runoff from the glacier surface (Rpg) and from nonglacial areas (Rng), glacier mass balance MB and glacial runoff Rg. The long-term changes of R and its components, as well as their response to climate change are revealed.
- Average total runoff at the UG1HMS was about 206.96 × 10⁴ m3 over the past 60 years, of which the average Rg accounted for 70%, among them Rpg and MB accounted for 44% and 26%, respectively. The rest was precipitation runoff in nonglacierized areas. R demonstrated a significant increase in the period of 1993–2018, with an increase of 114.39 × 10⁴ m3, corresponding to 1.7 times R during the period of 1959–1992. This increase was correlated with temperature and associated with precipitation, indicating that both the mass reduction of the glacier and the elevated precipitation were contributors. At present, R and its components are characterized by high values with great annual fluctuation.
- As important components, precipitation runoff from the glacier surface (Rpg) and nonglacial areas (Rng) were determined by the amount of precipitation in the catchment, showing a step increase after 1995. A higher temperature can elevate the runoff coefficient on the glacier (αg) resulting in an enhanced Rpg, and vice versa. The recession of the glacier area, which reduces Rg and increases Rng, had an overall negative impact on the R value.
- The modeled glacier mass balance MB was inversely correlated with air temperature and showed a strong negative growth trend over the past 60 years. For precipitation, A higher solid precipitation can moderate glacier melting thus making MB more positive, and oppositely, a higher liquid precipitation can accelerate glacier melting thus making MB more negative.
- Over the past 60 years, the long-term change of glacial runoff showed an increasing trend, particularly after 1992. After reaching its maximum during the period 1997–2007, it decreased slightly from 1998 to 2018. We found that the general reduction of precipitation and particularly the shrinkage of the glacier area were responsible for the downward trend. The period of 1997–2007 is likely to be the “peak water” (tipping point) of the glacial runoff, as described by Huss et al. (2018) [16]. However, to verify it, longer observation and a more in-depth quantitative analysis are required.
In this study, to reveal a long-term change of runoff over the glacierized area and minimize the inherent temporal noise of the high-resolution time series, we analyzed the annual periods. However, the relationship and the interactive mechanism between the runoff or its components and meteorological elements are better described using a higher temporal resolution scale. In addition, the division of time period in this study is inevitably subjective and arbitrary. For this reason, a higher temporal resolution of the hydrological model needs to be introduced in future studies.
Author Contributions
Conceptualization, Z.L. and Y.J.; methodology, Z.L.; software, Y.J.; validation, Z.L., Y.J. and H.D.; formal analysis, Y.J.; investigation, Y.J.; resources, M.Z.; data curation, S.J.; writing—original draft preparation, Y.J.; writing—review and editing, Y.J., Z.L. and C.X.; funding acquisition, Z.L. All authors have read and agreed to the published version of the manuscript.
Funding
This research was funded by the Second Tibetan Plateau Scientific Expedition and Research, grant number 2019QZKK0201; the Strategic Priority Research Program of Chinese Academy of Sciences (Class A), grant number XDA20060201 and XDA20020102; the National Natural Science Foundation of China, grant number 41761134093; 41471058; the SKLCS founding, grant number SKLCS-ZZ-2020.
Conflicts of Interest
The authors declare no conflict of interest.
References
- Immerzeel, W.W.; Van-Beek, L.P.H.; Bierkens, M.F.P. Climate change will affect the Asian water towers. Science 2010, 328, 1382–1385. [Google Scholar] [CrossRef] [PubMed]
- Immerzeel, W.W.; Van Beek, L.P.H.; Konz, M.; Shrestha, A.B.; Bierkens, M.F.P. Hydrological response to climate change in a glacierized catchment in the Himalayas. Clim. Chang. 2018, 110, 721–736. [Google Scholar] [CrossRef] [PubMed] [Green Version]
- Sorg, A.; Huss, M.; Rohrer, M.; Stoffel, M. The days of plenty might soon be over in glacierized Central Asian catchments. Environ. Res. Lett. 2014, 9, 104018. [Google Scholar] [CrossRef]
- Marzeion, B.; Jarosch, A.H.; Hofer, M. Past and future sea-level change from the surface mass balance of glaciers. Cryosphere 2012, 6, 1295–1322. [Google Scholar] [CrossRef] [Green Version]
- Radić, V.; Bliss, A.; Beedlow, A.C.; Hock, R.; Miles, E.; Cogley, J.G. Regional and global projections of twenty-first century glacier mass changes in response to climate scenarios from global climate models. Clim.Dyn. 2014, 42, 37–58. [Google Scholar] [CrossRef]
- Huss, M.; Hock, R. A new model for global glacier change and sea-level rise. Front. Earth Sci. 2015, 3, 54. [Google Scholar] [CrossRef] [Green Version]
- Zemp, M.; Hoelzle, M.; Haeberli, W. Six decades of glacier mass-balance observations: A review of the worldwide monitoring network. Ann. Glaciol. 2009, 50, 101–111. [Google Scholar] [CrossRef] [Green Version]
- Zemp, M.; Huss, M.; Thibert, E.; Eckert, N.; McNabb, R.; Huber, J.; Barandun, M.; Machguth, H.; Nussbaumer, S.U.; Gartner-Roer, I.; et al. Global glacier mass changes and their contributions to sea-level rise from 1961 to 2016. Nature 2019, 568, 382–386. [Google Scholar] [CrossRef]
- Ayala, Á.; Farías-Barahona, D.; Huss, M.; Pellicciotti, F.; McPhee, J.; Farinotti, D. Glacier runoff variations since 1955 in the Maipo river basin, semiarid Andes of Central Chile. Cryosphere Discuss. 2019. [Google Scholar] [CrossRef] [Green Version]
- Baraer, M.; Mark, B.G.; Mckenzie, J.M.; Condom, T.; Bury, J.; Huh, K.I.; Portocarrero, C.; Gomez, J.; Rathay, S. Glacier recession and water resources in Peru’s Cordillera Blanca. J. Glaciol. 2012, 58, 134–150. [Google Scholar] [CrossRef] [Green Version]
- Bliss, A.; Hock, R.; Radić, V. Global response of glacier runoff to twenty-first century climate change. J. Geophys. Res. Earth Surf. 2014, 119, 717–730. [Google Scholar] [CrossRef]
- Casassa, G.; López, P.; Pouyaud, B.; Escobar, F. Detection of changes in glacial run-off in alpine basins: Examples from North America, the Alps, central Asia and the Andes. Hydrol. Process. 2009, 23, 31–41. [Google Scholar] [CrossRef]
- Farinotti, D.; Usselmann, S.; Huss, M.; Bauder, A.; Funk, M. Runoff evolution in the Swiss Alps: Projections for selected high-alpine catchments based on ENSEMBLES scenarios. Hydrol. Process. 2012, 26, 1909–1924. [Google Scholar] [CrossRef]
- Frans, C.; Istanbulluoglu, E.; Lettenmaier, D.P.; Clarke, G.; Bohn, T.J.; Stumbaugh, M. Implications of decadal to century scale glacio-hydrological change for water resources of the Hood River basin, OR, USA. Hydrol. Process. 2016, 30, 4314–4329. [Google Scholar] [CrossRef]
- Huss, M. Present and future contribution of glacier storage change to runoff from macroscale drainage basins in Europe. Water Resour. Res. 2011, 47, W07511. [Google Scholar] [CrossRef] [Green Version]
- Huss, M.; Hock, R. Global-scale hydrological response to future glacier mass loss. Nat. Clim. Chang. 2018, 8, 135–140. [Google Scholar] [CrossRef] [Green Version]
- Immerzeel, W.W.; Wanders, N.; Lutz, A.F.; Shea, J.M.; Bierkens, M.F.P. Reconciling high-altitude precipitation in the upper Indus basin with glacier mass balances and runoff. Hydrol. Earth.Syst.Sci. 2015, 19, 4673–4687. [Google Scholar] [CrossRef] [Green Version]
- Lutz, A.; Immerzeel, W.; Shrestha, A.; Bierkens, M. Consistent increase in High Asia’s runoff due to increasing glacier melt and precipitation. Nat. Clim.Chang. 2014, 4, 587–592. [Google Scholar] [CrossRef] [Green Version]
- Neal, E.G.; Hood, E.; Smikrud, K. Contribution of glacier runoff to freshwater discharge into the Gulf of Alaska. Geophys. Res. Lett. 2010, 37, L06404. [Google Scholar] [CrossRef] [Green Version]
- Yang, Z.N. Glacier Water Resources in China; Gansu Science and Technology Press: Lanzhou, China, 1991; pp. 74–78. (In Chinese) [Google Scholar]
- Ye, B.S.; Yang, D.Q.; Jiao, K.Q.; Han, T.D.; Jing, Z.F.; Yang, H.A.; Li, Z.Q. The Urumqi river source glacier No. 1, Tianshan, China: Changes over the past 45 years. Geophys. Res. Lett. 2005, 32, 1–4. [Google Scholar] [CrossRef]
- Han, T.D.; Ding, Y.J.; Ye, B.S.; Liu, S.Y.; Jiao, K.Q. Mass-balance characteristics of Urumqi glacier No. 1, Tien Shan, China. Ann. Glaciol. 2006, 43, 323–328. [Google Scholar] [CrossRef] [Green Version]
- Jing, Z.F.; Jiao, K.Q.; Yao, T.D.; Wang, N.L.; Li, Z.Q. Mass balance and recession of Urumqi glacier No. 1, Tien Shan, China, over the last 45 years. Ann. Glaciol. 2006, 43, 214–217. [Google Scholar] [CrossRef] [Green Version]
- Li, Z.Q.; Shen, Y.P.; Li, H.L.; Dong, Z.W.; Wang, L.W. Response of the melting Urumqi glacier No. 1 in eastern Tianshan to climate change. Adv. Clim. Change Res. 2008, 4, 67–72. [Google Scholar]
- Li, Z.Q.; Wang, W.B.; Zhang, M.J.; Wang, F.T.; Li, H.L. Observed changes in streamflow at the headwaters of the Urumqi river, eastern Tianshan, Central Asia. Hydrol. Process. 2010, 24, 217–224. [Google Scholar] [CrossRef]
- Li, Z.Q.; Li, H.L.; Chen, Y.N. Mechanisms and simulation of accelerated shrinkage of continental glaciers: A case study of Urumqi glacier No. 1 in eastern Tianshan, central Asia. J. Earth Sci. 2011, 22, 423–430. [Google Scholar] [CrossRef]
- Gao, M.J.; Han, T.D.; Ye, B.S.; Jiao, K.Q. Characteristics of melt water discharge in the Glacier No. 1 basin, headwater of Urumqi river. J. Hydrol. 2013, 489, 180–188. [Google Scholar]
- Sun, M.P.; Li, Z.Q.; Yao, X.J.; Zhang, M.J.; Jin, S. Modeling the hydrological response to climate change in a glacierized high mountain region, northwest China. J. Glaciol. 2015, 61, 127–136. [Google Scholar] [CrossRef] [Green Version]
- Gao, H.K.; Li, H.; Duan, Z.; Ren, Z.; Meng, X.Y.; Pan, X.C. Modelling glacier variation and its impact on water resource in the Urumqi glacier No. 1 in Central Asia. Sci. Total Environ. 2018, 644, 1160–1170. [Google Scholar] [CrossRef]
- Xu, C.H.; Li, Z.Q.; Li, H.L.; Wang, F.T.; Zhou, P. Long-range terrestrial laser scanning measurements of annual and intra-annual mass balances for Urumqi glacier No. 1, eastern Tien Shan, China. Cryosphere 2019, 13, 2361–2383. [Google Scholar] [CrossRef] [Green Version]
- Hagg, W.J.; Braun, L.N.; Uvarov, V.N.; Makarevich, K.G. A comparison of three methods of mass-balance determination in the Tuyuksu glacier region, Tien Shan, Central Asia. J. Glaciol. 2004, 50, 505–510. [Google Scholar] [CrossRef] [Green Version]
- Xu, C.H.; Li, Z.Q.; Wang, P.Y.; Anjumab, M.N.; LI, H.L.; Wang, F.T. Detailed comparison of glaciological and geodetic mass balances for Urumqi glacier No. 1, eastern Tien Shan, China, from 1981 to 2015. Cold Reg. Sci. Technol. 2018, 155, 137–148. [Google Scholar] [CrossRef]
- Zhang, G.; Li, Z.Q.; Wang, W.B.; Wang, W.D. Rapid decrease of observed mass balance in the Urumqi glacier No. 1, Tianshan mountains, central Asia. Quat. Int 2014, 349, 135–141. [Google Scholar] [CrossRef]
- Yang, D.Q.; Jiang, T.; Zhang, Y.S. Analysis and correction of errors in precipitation measurement at the head of Urumqi river, Tianshan. J. Glaciol. Geocryol. 1988, 10, 384–396. (In Chinese) [Google Scholar]
- Yang, D.Q.; Shi, Y.F.; Kang, E.S. Results of solid precipitation measurement intercomparison in the alpine area of Urumqi river basin. Chin. Sci. Bull. 1991, 36, 1105–1109. [Google Scholar]
- Kane, D.L.; Yang, D.Q. Overview of water balance determinations for high latitude watersheds. In Northern Research Basins Water Balance; Kane, D.L., Yang, D.Q., Eds.; International Association of Hydrological Sciences: Wallingford, UK, 2004. [Google Scholar]
- Suzuki, K.; Kubota, J.; Ohata, T.; Vuglinsky, V. Influence of snow ablation and frozen ground on spring runoff generation in the mogot experimental watershed, southern mountainous taiga of eastern Siberia. Nord. Hydrol. 2006, 37, 21–29. [Google Scholar] [CrossRef]
- Zhang, W.C.; Zhang, Y.S.; Ogawa, K.; Yamaguchi, Y. Observation and estimation of daily actual evapotranspiration and evaporation on a glacierized watershed at the headwater of the Urumqi river, Tianshan, China. Hydrol. Process. 1999, 13, 1589–1601. [Google Scholar]
- Zhang, W.C.; Chen, J.; Ogawa, K.; Yamaguchi, Y. An approach to estimating evapotranspiration in the Urumqi river basin, Tianshan, China, by means of remote sensing and a geographical information system technique. Hydrol. Process. 2005, 19, 1839–1854. [Google Scholar] [CrossRef]
- Chen, R.S.; Kang, E.S.; Ding, Y.J. Some knowledge on and parameters of China’s alpine hydrology. Adv. Water Sci. 2014, 25, 308–314. (In Chinese) [Google Scholar]
- Zhang, J.H.; Wang, X.J.; Li, J. Study of the relationship between mass balance change of Glacier No. 1 at the headwater of Urumqi river, Tianshan and climate. J Glaciol. Geocryol. 1984, 6, 25–36. (In Chinese) [Google Scholar]
- Wang, P.Y.; Li, Z.Q.; Li, H.L.; Wang, W.B.; Yao, H.B. Comparison of glaciological and geodetic mass balance at Urumqi glacier No. 1, Tian Shan, central Asia. Global Planet Change 2014, 114, 14–22. [Google Scholar] [CrossRef]
- Thomson, L.I.; Zemp, M.; Copland, L.; Cogley, J.G.; Ecclestone, M.A. Comparison of geodetic and glaciological mass budgets for White glacier, Axel Heiberg Island, Canada. J. Glaciol. 2017, 63, 55–66. [Google Scholar] [CrossRef] [Green Version]
- World Glacier Monitoring Service. Available online: https://wgms.ch/global-glacier-state/ (accessed on 30 May 2019).
- Jansson, P.; Hock, R.; Schneider, T. Temperature index melt modelling in mountain areas. J. Hydrol. 2003, 282, 104–115. [Google Scholar]
- Hock, R.; Jansson, P.; Braun, L. Modelling the response of mountain glacier discharge to climate warming. In Global Change and Mountain Regions: An Overview of Current Knowledge; Huber, U.M., Bugmann, H., Reasoner, M.A., Eds.; Springer: Dordrecht, The Netherlands, 2005; pp. 243–252. [Google Scholar]
- You, X.N.; Li, Z.Q.; Wang, F.T. Study on time scale of snow-ice transformation through snow layer tracing method-Take Glacier No. 1 at the headwaters of Urǜmqi river as an example. J. Glaciol. Geocryol. 2005, 27, 853–860. (In Chinese) [Google Scholar]
- Wang, F.T.; Li, Z.Q.; Edwards, R.; Li, H.L. Long-term changes in the snow–firn pack stratigraphy on Ürümqi glacier No. 1, eastern Tien Shan, China. Ann. Glaciol. 2007, 46, 331–334. [Google Scholar] [CrossRef]
- Qin, D.H. Glossary of Cryosphere Science; Meteorological Press: Beijing, China, 2014; pp. 18–19. (In Chinese) [Google Scholar]
- Gao, H.K.; Ding, Y.J.; Zhao, Q.D.; Hrachowitz, M.; Savenije, H.G. The importance of aspect for modelling the hydrological response in a glacier catchment in Central Asia. Hydrol. Process. 2017, 31, 2842–2859. [Google Scholar] [CrossRef]
- Zhu, S.S. Analysis of recent change on runoff of melt ice and snow in head of Urumqi river. J Glaciol. Geocryol 1991, 25, 117–123. (In Chinese) [Google Scholar]
- Ludwig, P.; Schaffernicht, E.J.; Shao, Y.P.; Pinto, J.G. Regional atmospheric circulation over Europe during the last glacial maximum and its links to precipitation. J. Geophys. Res. Atmos. 2016, 121, 2130–2145. [Google Scholar] [CrossRef] [Green Version]
- Fujita, K. Influence of precipitation seasonality on glacier mass balance and its sensitivity to climate change. Ann. Glaciol. 2008, 48, 88–92. [Google Scholar] [CrossRef] [Green Version]
- Gleick, P.H.; Palaniappan, M. Peak water limits to freshwater withdrawal and use. Proc. Natl. Acad. Sci. USA 2010, 107, 11155–11162. [Google Scholar] [CrossRef] [Green Version]
Figure 1.
Study site description: (a) sketch map of the study catchment including the locations of Urumqi Glacier No. 1 (UG1), Urumqi Glacier No. 1 hydrometeorological station (UG1HMS), Daxigou meteorological station (DMS) and Tianshan Glaciological Station (TGS); (b) location of the study site; (c) photograph of the Urumqi Glacier No. 1 hydrometeorological station (UG1HMS) (taken by Shuang Jinin, 2018).

Figure 2.
Observed areas (black circles) and its fitting curve and regression equation for Urumqi Glacier No. 1.
Figure 2.
Observed areas (black circles) and its fitting curve and regression equation for Urumqi Glacier No. 1.

Figure 3.
Correlation between modeled mass balance and observed mass balance.

Figure 4.
Variations of annual precipitation, temperature (average of July–August), total runoff (R), glacial runoff (Rg) and glacier mass balance (MB) at the Urumqi Glacier No. 1 hydrometeorological station (UG1HMS) from 1959 to 2018.
Figure 4.
Variations of annual precipitation, temperature (average of July–August), total runoff (R), glacial runoff (Rg) and glacier mass balance (MB) at the Urumqi Glacier No. 1 hydrometeorological station (UG1HMS) from 1959 to 2018.

Figure 5.
Variations of annual precipitation and precipitation runoff derived from the glacierized area (Rpg) and nonglacierized areas (Rng) from 1959 to 2018.
Figure 5.
Variations of annual precipitation and precipitation runoff derived from the glacierized area (Rpg) and nonglacierized areas (Rng) from 1959 to 2018.

Figure 6.
Variations of glacial runoff (Rg) with its five-year moving average (5a) curve and its average value for Urumqi Glacier No. 1 from 1959 to 2018.
Figure 6.
Variations of glacial runoff (Rg) with its five-year moving average (5a) curve and its average value for Urumqi Glacier No. 1 from 1959 to 2018.

Figure 7.
Curves of the Mann–Kendall mutation test (a) and cumulative anomaly (b) of glacial runoff of the Urumqi Glacier No. 1.
Figure 7.
Curves of the Mann–Kendall mutation test (a) and cumulative anomaly (b) of glacial runoff of the Urumqi Glacier No. 1.

© 2020 by the authors. Licensee MDPI, Basel, Switzerland. This article is an open access article distributed under the terms and conditions of the Creative Commons Attribution (CC BY) license (http://creativecommons.org/licenses/by/4.0/).
Share and Cite
MDPI and ACS Style
Jia, Y.; Li, Z.; Jin, S.; Xu, C.; Deng, H.; Zhang, M. Runoff Changes from Urumqi Glacier No. 1 over the Past 60 Years, Eastern Tianshan, Central Asia. Water 2020, 12, 1286. https://doi.org/10.3390/w12051286
AMA Style
Jia Y, Li Z, Jin S, Xu C, Deng H, Zhang M. Runoff Changes from Urumqi Glacier No. 1 over the Past 60 Years, Eastern Tianshan, Central Asia. Water. 2020; 12(5):1286. https://doi.org/10.3390/w12051286
Chicago/Turabian StyleJia, Yufeng, Zhongqin Li, Shuang Jin, Chunhai Xu, Haijun Deng, and Mingjun Zhang. 2020. "Runoff Changes from Urumqi Glacier No. 1 over the Past 60 Years, Eastern Tianshan, Central Asia" Water 12, no. 5: 1286. https://doi.org/10.3390/w12051286
Note that from the first issue of 2016, this journal uses article numbers instead of page numbers. See further details here.