The Effect of Climate Change and Urbanization on the Demand for Low Impact Development for Three Canadian Cities


1
Department of Civil Engineering, Lassonde School of Engineering, York University, Toronto, ON M3J 1P3, Canada
2
Geomatics Engineering, Department of Earth & Space Science & Engineering, Lassonde School of Engineering, York University, Toronto, ON M3J 1P3, Canada
*
Author to whom correspondence should be addressed.
Water 2020, 12(5), 1280; https://doi.org/10.3390/w12051280
Submission received: 20 March 2020
/
Revised: 24 April 2020
/
Accepted: 28 April 2020
/
Published: 30 April 2020
(This article belongs to the Special Issue Urbanization under a Changing Climate – Impacts on Urban Hydrology
)
Abstract
:Climate change and urbanization are increasing the intensity and frequency of floods in urban areas. Low Impact Development (LID) is a technique which attenuates runoff and manages urban flooding. However, the impact of climate change and urbanization on the demand or need for LID in cities for both current and future conditions is not known. The primary goal of this research was to evaluate the demand for LID under different climate change and urban growth scenarios based on a physical-based geospatial framework called the hydrological-hydraulic index (HHI). To do this, 12 scenarios considering four climate change and three urbanization conditions were developed. The HHI for three cities in Canada (Toronto, Montreal, and Vancouver) were estimated, evaluated, and compared for these scenarios. The results show that both urbanization and climate change increase the demand for LID. The contribution of climate change and urbanization on LID demand, measured using HHI, varies for each city: in Toronto and Montreal, high rainfall intensity and low permeability mean that climate change is dominant, whereas, in Vancouver, both climate change and urbanization have a similar impact on LID demand. Toronto and Montreal also have a higher overall demand for LID and the rate of increase in demand is higher over the study period. The results of this study provide us with a comprehensive understanding of the effect of climate and urbanization on the demand for LID, which can be used for flood management, urban planning, and sustainable development of cities.
1. Introduction
Floods are a major growing natural hazard that causes the loss of human lives and properties. The proportion of flood occurrence was the highest of all types of natural disasters from 1995 to 2015 [1]. The frequency of flooding has increased during the last two decades (1995 to 2015) [2]. During the same period, floods caused 157,000 fatalities globally (accounting for 26% of all weather-related disasters). In addition, it affected the quality of life of 2.3 billion people, which is the highest share (56%) among weather-related disasters [1]. In terms of economic losses, based on UNISDR (2016), between 2006 and 2016, the average annual costs associated with flooding were about 50 billion USD. This ranks first among all natural disasters. These damages include all types of regions (i.e., land uses) including urban areas [3].
There exist several key drivers of urban flood risk such as urbanization, urban sprawl, increasingly unresponsive engineering, global climate change, and fluvial and pluvial changes [4]. Urbanization causes changes to terrains, slopes, soil type, and vegetative cover, which result in a change of the hydrologic behavior of urbanized areas [5]. Among these changes, the expansion of impervious surfaces dramatically increases the volume of surface runoff [6,7,8,9]. The expansion of impervious surfaces can occur in two contexts: (1) within a constant area (by an increase of the imperviousness densification within a fixed area); and (2) by increasing the area of the city (expansion of impervious area). However, in our research, we only considered the first context. On the other hand, due to a higher population density and valuable properties in urban areas, the influence of floods on these environments is intensive and excessively costly. Thus, urban areas are more vulnerable to the effect of floods, and, by the growth of the urban population, therefore, vulnerability and exposure are also significantly higher [2]. Climate change and the increase of rainfall intensity have also increased flood risk associated with the frequency of the occurrence of the flood [2], and this trend is expected to continue in many regions.
To cope with this, the traditional and most common approach is using a stormwater collection network (SCN). The objective of SCN is to collect and rapidly convey surface runoff to a predetermined outfall (e.g., receiving water bodies such as rivers, lakes, or ponds) [10]. However, several issues are associated with SCN. SCN is designed for a specific rainfall event; thus, there is an evident limitation of the capacity to manage extreme flood events which are likely due to climate change. This issue is exacerbated by the fact that existing SCNs are aging and performing at a lower capacity. Besides, SCN collects polluted runoff from urban surfaces, which causes environmental damages and financial losses. These losses are either due to contamination of receiving waters or treating the collected runoff at stormwater treatment plants. Even though using SCN is a well-known and well-documented method [11,12], it has several issues, which necessitate a different approach to managing runoff in urban areas.
The smart and sustainable urban growth approach commonly known as Low Impact Development (LID) is an innovative solution to complement SCN, which is increasingly being adopted in cities around the world [13,14,15,16,17]. LID can be incorporated with existing SCN to increase the capacity of the SCN and, thus, improve their performance. LID allows for reducing the risk of floods by reducing urban runoff [14,17,18,19,20,21,22]. This is achieved by reducing imperviousness, conserving natural resources and ecosystems, maintaining natural drainage courses, reducing the use of pipes, and minimizing clearing and grading during the development process. Structural techniques such as bioretention cells, rain gardens, green roofs, and permeable pavements are also used to increase infiltration, thereby decreasing the amount of runoff and delaying the time to peak [15,23,24].
Demand for LID in different locations varies based on different factors such as land cover type, topography, etc. [25,26,27]. From a hydrological-hydraulic point of view, this demand is associated with the extent of the runoff generated in each site. That is, the higher is the generated runoff, the higher is the demand for capturing the runoff at the source (the site) [18,25]. The change in rainfall intensity and depth (caused by climate change) and land cover type (caused by urbanization) are the two main factors that affect the extent of this demand. In a specific site, if the rainfall or the land cover changes, the demand for LID will change accordingly [25]. This is due to the change in the volume of runoff generated at that site, which is a function of both climate and land cover.
At the city-scale additional complexity is introduced due to numerous LID sites, constant urban change (and growth), global climate change, and the non-uniform spatial distribution of land cover and rainfall [2,28,29,30,31,32]. Thus, it is extremely important to be able to quantify this complexity to attain insight into how changes in climate and urban land cover influence the demand for LID. Such information is useful for urban planning, designing multifunctional urban infrastructure, policymaking regarding urban growth, and the optimal assignment of financial resources for runoff and flood risk management. Therefore, the objective of our study was to investigate the effect of climate change and urbanization on the demand for LID.
The results of such an investigation will provide us with an insight into the effect of climate and urbanization on the demand for LID. This article holistically covers the scenarios under which either only one change takes place (i.e., climate or urbanization) or both (i.e., climate and urbanization), and discusses the causes and effects of the future demand for LID for three selected Canadian cities. It also discusses the contribution of climate change and urbanization factors on the change of hydrological and hydraulic processes. The manuscript is organized as follows. Section 2 presents the methods including the study area, the geospatial data, and the development of climate change and urban growth scenarios. Section 3 and Section 4 include the results and discussion, respectively, followed with the conclusion in Section 5.
2. Methods
In our study, we used a physical-based geospatial index called the hydrological-hydraulic index (HHI) [25]. We estimated HHI for three Canadian cities (Toronto, Montreal, and Vancouver) using the approach proposed Kaykhosravi et al. [25]. The HHI was generated for these cities under various climate and urbanization scenarios. For urbanization, we developed different land cover scenarios to represent different degrees of future urbanization, by modifying existing pervious areas to impervious areas. For the climate change scenarios, we created spatial rainfall distribution maps based on the projected Intensity–Duration–Frequency (IDF) curves for each city. These maps included historical data as well as three future climate change scenarios. The urbanization and climate change scenarios were integrated and used to estimate, evaluate, and compare the HHI (a measure of LID demand [25]) for each city.
2.1. Description of the Three Canadian Cities
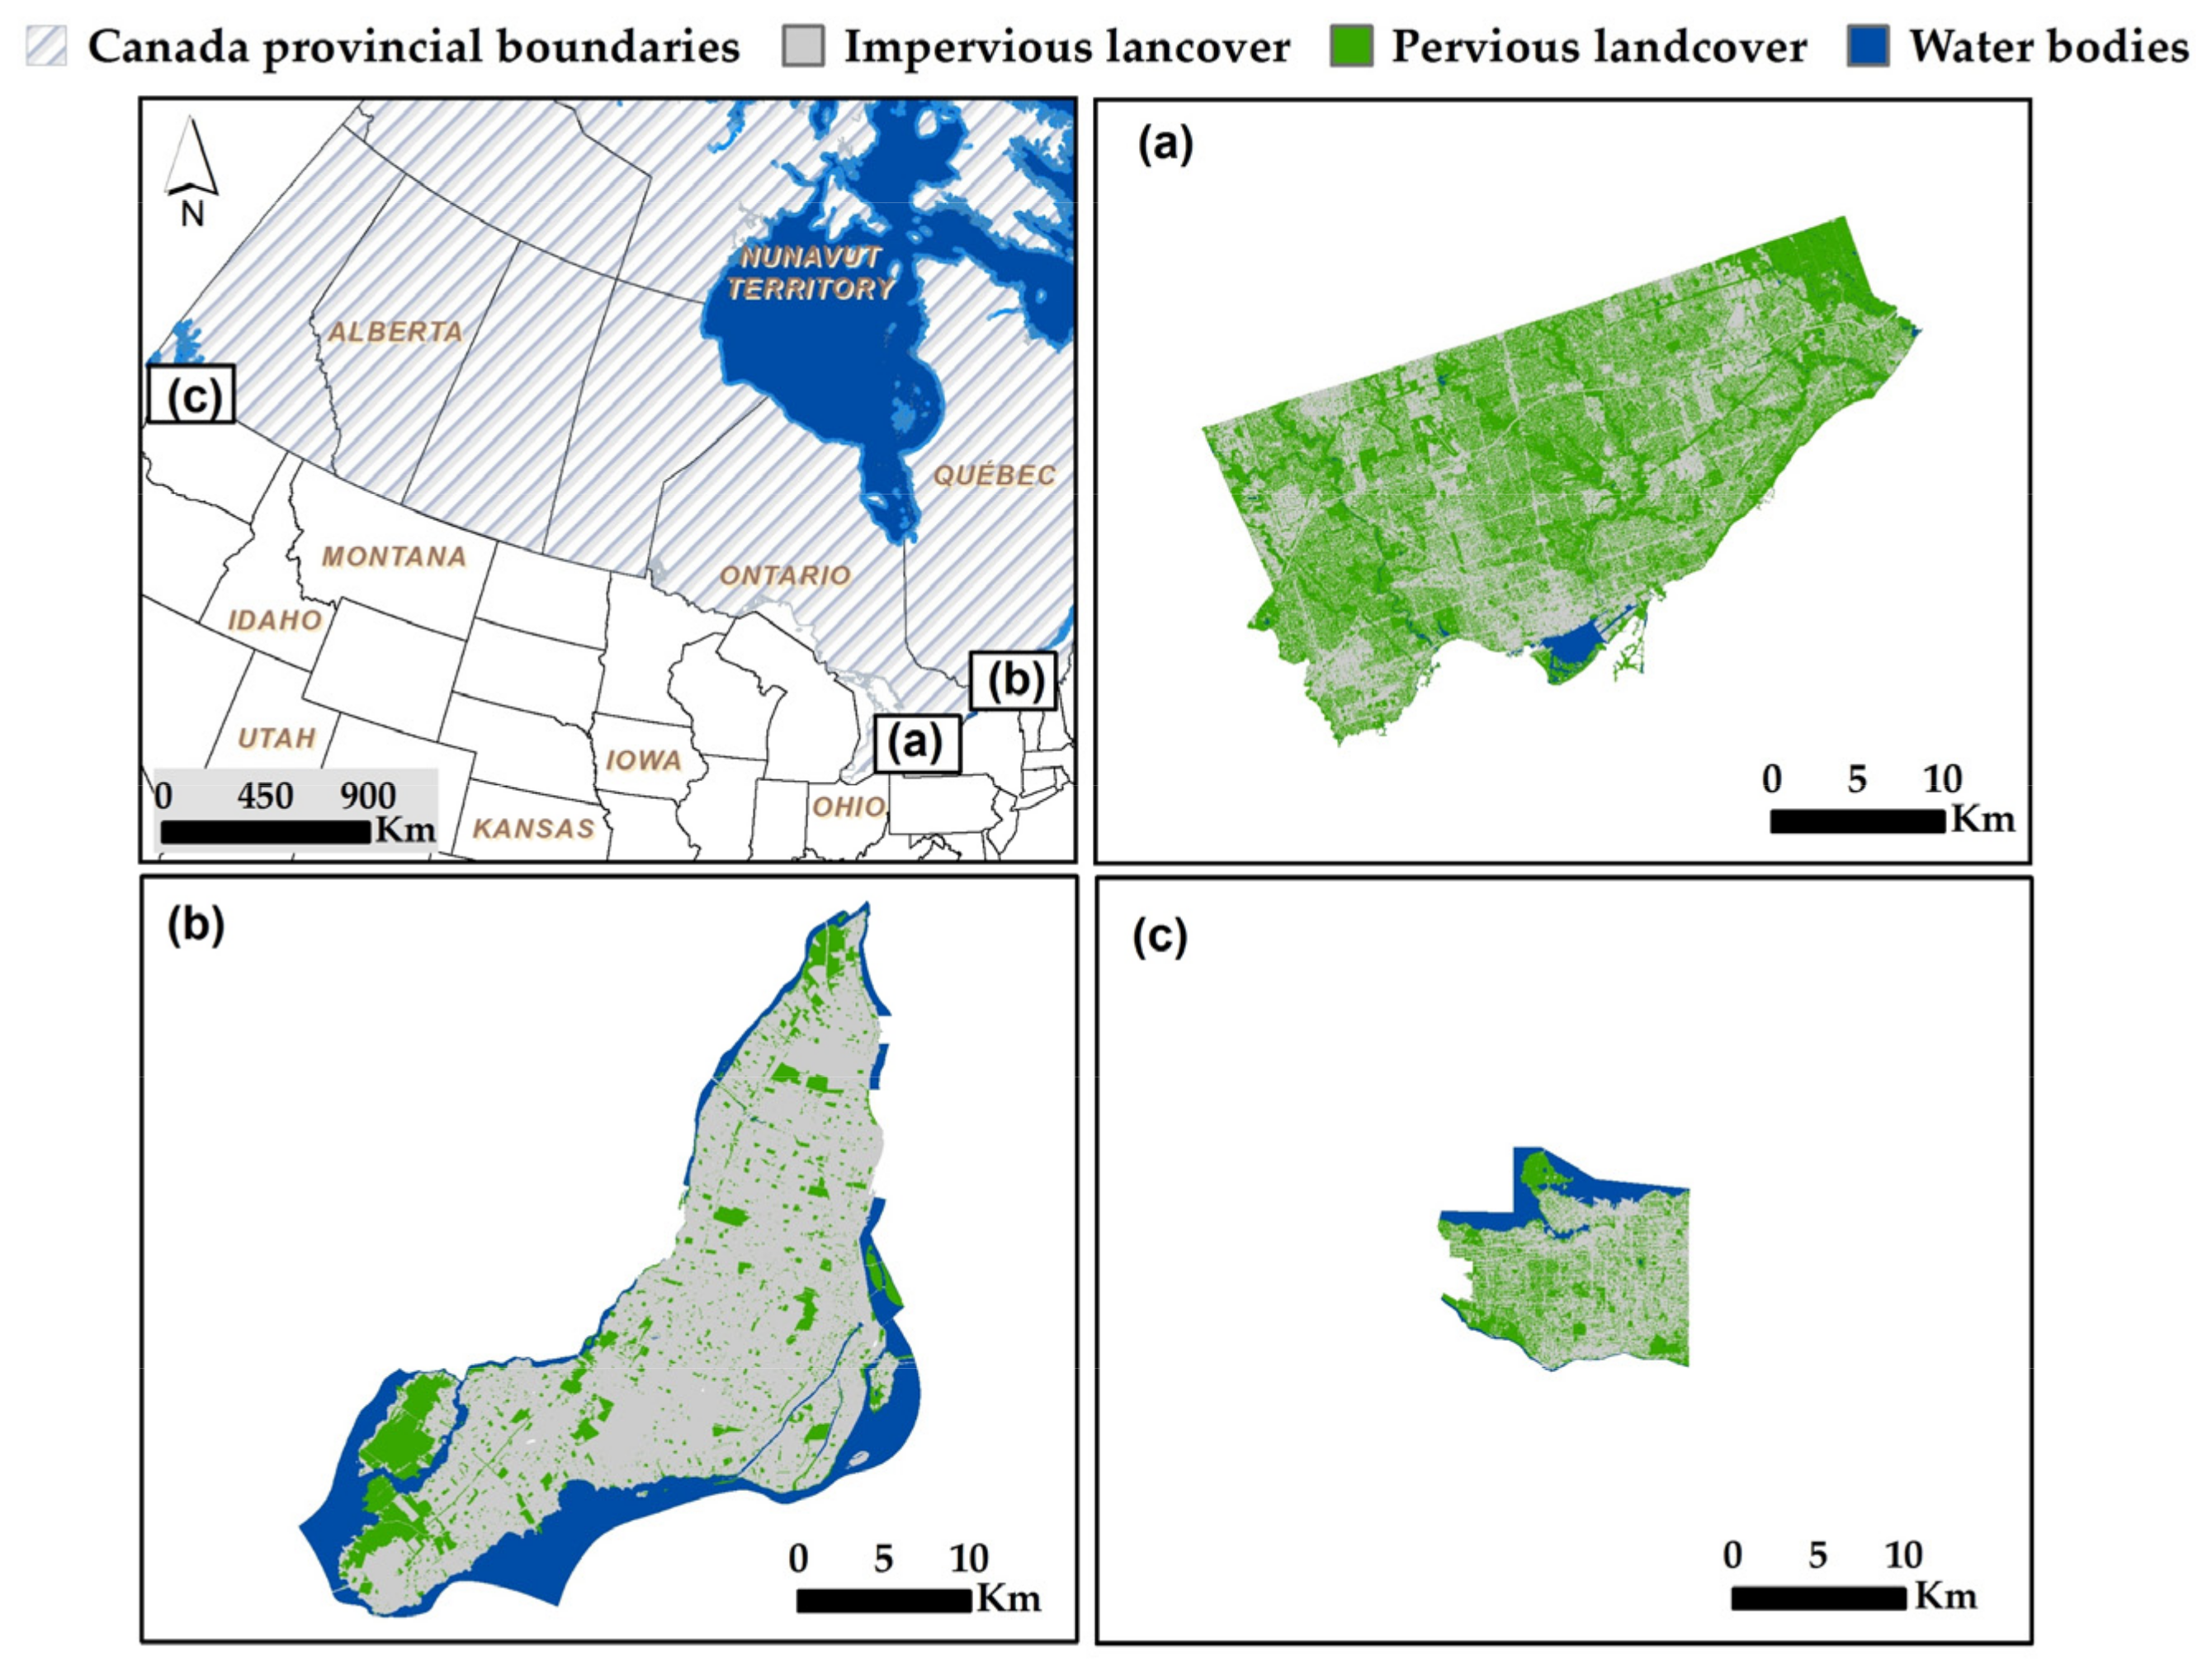
The study area in this research includes three metropolitan Canadian cities: Toronto, Montreal, and Vancouver. The location of all cities and their administrative border are presented in Figure 1. The figure illustrates the current status of land cover in all cities, categorized into three classes: impervious lands, pervious lands, and water bodies.
The area of Toronto is 633.5 km2 and the population of the city in 2019 was 2.96 million [33]. The average annual precipitation of Toronto for the 1951–1980 period is 814 mm [34] which is the lowest precipitation among the three cities. The pervious to impervious ratio (PIR) (ratio of areas excluding water bodies) is about 1.17 based on the available land cover data (from 2007) meaning that land cover in Toronto is dominated by pervious land cover.
The area of Montreal is 624.4 km2, slightly lower than Toronto, and the population of the city in 2016 (based on the most recent census data) is 1.96 million [35]. The average annual precipitation for the 1951–1980 period is 1028 mm [34], which is slightly higher than in Toronto. The PIR for Montreal is 0.21 which is the lowest among all three cities, meaning that the city is highly urbanized or, in other words, dominated by impervious land cover.
Vancouver area is 136.5 km2 and the population of the city in 2016 (based on the most recent census year) is 2.55 million [36]. The average annual precipitation for the 1951–1980 period is 1569 mm [34], which shows the city has the highest precipitation depth among the three cities. The PIR for Vancouver according to the available land cover (from 2014) is 0.64, which is higher than Montreal but lower than Toronto. In addition, this indicates that the land cover of Vancouver is largely dominated by impervious land cover.
2.2. Geospatial Data Used for Generating the HHI
Our analysis in this study was conducted based on geospatial analysis. The HHI model was developed using Python and the ArcPy package was used to perform the analysis. The data used to estimate HHI included:
- Meteorological station data: To estimate rainfall intensity
- Surficial geology: To estimate the depth to restrictive layer and the hydraulic conductivity
- Groundwater tables: To estimate the depth to groundwater
- Digital Elevation Model (DEM) data: To estimate the slope
All geospatial data used in this study are publicly available and were downloaded from various open data sources [37,38,39,40,41,42,43]. All datasets were converted into raster format with a ground resolution of 5 m × 5 m (to align with the digital elevation model of Toronto). This resolution was used as the reference resolution for this research.
The raster maps that were derived from these data were overlaid using Equation (1) [25] to generate the HHI. HHI ranks the cells (i.e., the pixels of the raster data) by their runoff generation potential. Thus, cells with higher HHI generate higher volume and peak runoff flow rate. Ranking the cells based on HHI values highlights the cells that are the main source of runoff generation. On this basis, we can target the high HHI cells for LID implementation, and thereby effectively maximize runoff reduction [25]. Since the demand for implementation of LID corresponds to the HHI values, site with higher HHI values are considered as sites with higher demand for LID [25]. The HHI index accounts for seven variables, as presented in Equation (1).
In Equation (1), j is the cell number; HHIj is HHI at cell j; Rj is rainfall intensity (mm/h) at cell j; (Ks)j is saturated hydraulic conductivity of the surficial soil (mm/h) at cell j; (Ki)j is the hydraulic conductivity of impervious areas (e.g., roads, parking lots, and building rooftops) at cell j, which is set equal to zero for impervious cells; nj is the soil porosity at cell j; (Dg)j and (Dr)j are, respectively, depth to groundwater (mm) and depth to the first restrictive soil layer (mm) at cell j; and S is the terrain slope (degrees) at cell j [25].
2.3. Developing Scenarios for Investigating the Integrated Effect of Climate Change and Urbanization
2.3.1. Climate Change Scenarios
The pattern of the effective rainfall (rainfall with losses deducted) can have a significant influence on the runoff hydrograph [44]. The pattern is typically determined by selecting the position of the maximum rainfall block (in the hyetograph) and rainfall duration [45]. For hydrological modeling of a catchment, it is important to determine the duration of the rainfall to which flood generation is assumed to occur [46]. Generally, for catchments above 40 km2, the effective daily rainfall duration is in the order of 12 h (with the time of concentration between 4 and 12 h); for catchments larger than 500 km2, or slow-reacting catchments, a sub-daily distribution is not needed. Smaller catchments are reactive to short but intensive rainfall events in producing their highest peaks [46]. For example, the recommended duration is 10 min inlet time for small (micro-scale) catchments, whereas the actual time of concentration should be used for larger-scale catchments, according to the Wet Weather Flow Management Guidelines for Toronto [47]. In this study, the catchments were generally small and, therefore, shorter durations (less than the time of concentration) were used for the analysis. However, due to the lack of such fine resolution data for all three cities, a duration of 60 min was used for effective rainfall for each city for the HHI analysis. In addition, a 10-year return period (RP) was selected because this is the most extreme scenario suggested by Canadian guidelines for the design of small wet weather systems including LID. The RPs suggested by these guidelines include 2 [47,48,49], 5 [48], or 10-year [47,50].
For the projected IDF data, we used the IDF_CC Tool 4.0 (Computerized Tool for the Development of Intensity-Duration-Frequency Curves under Climate Change—Version 4.0) [51]. The available range of IDF data available through this tool are the years 2006–2100. Generating IDF curves based on stationary historical data cannot capture the changing climate conditions; thus, this tool uses two other models: Global Climate Models (GCMs) and Regional Climate Models (RCMs) [52]. Both GCMs and RCMs need spatial and temporal downscaling, which relies on the historically observed data for the time-period of observations [52]. Downscaling links GCM/RCM grid scales and local study areas for the generation of IDF curves under changing climate conditions. For temporal downscaling of precipitation data, a modified version of the equidistant quantile-matching (EQM) method is used in this tool. For spatial downscaling, the tool utilizes a statistical downscaling method. The first future climate that this tool provides is for the period 2006–2036 (referred to as Scenario 2036 in this study), which was selected as our first future scenario [53]. In addition, projections for the period 2036–2066 (referred to as Scenario 2066 in this study) as the mid-term scenario and the period 2066–2096 (referred to as Scenario 2096 in this study) for the long-term period were also selected. Data from the Canadian Climate Model (CanESM 2) were selected from among several available climate models within the tool. The tool generates the IDF for three different values of the Representative Concentration Pathways (RCP) [54] including RCP2.6, RCP4.5, and RCP8.5. The comparison of IDF for these three RCPs for various RPs (2, 5, 10, 25, 50, and 100) provided by the tool shows that the lower the RP the smaller is the difference between IDFs with different RCPs [51]. Thus, for the RPs of 2–10 years, the difference between IDF for different RCPs is almost negligible. Thus, we selected the 10-year RP and the highest RCP (8.5 W/m2) to derive the projected IDF values for the selected scenarios (2036, 2066, and 2096).
Following the derivation of rainfall intensity using the IDF_CC Tool 4.0 at each meteorological station within or near the cities, the geospatial distribution of rainfall across each city was estimated using the stations listed in Table 1, Table 2 and Table 3 for each city. This process was as follows: First, using the IDF tables, the rainfall intensities for the 10-year RP and 60 min duration were derived. Second, a geospatial analysis (using Inverse Distance Weighted method, IDW) was used to develop the distribution of the rainfall intensity across the study areas based on the location of the stations. This resulted in 12 different rainfall distribution maps (four for each city for the selected years including historical IDF and projected IDF for Scenarios 2036, 2066, and 2096).
2.3.2. Urban Growth Scenarios
The projected land cover of each city was required to investigate the influence of future urbanization on runoff generation potential. To develop these projected scenarios, there were several limitations due to inconsistent and/or complete lack of data for the study periods. To account for the inconsistencies in the land cover categories, we generalized the land covers into three categories: impervious (buildings, roads, parking lots, and other paved surfaces), pervious (tree canopies, parks, golfs, grass shrubs, bare earth, etc.), and water body (lakes, ponds, streams, etc.). For example, in Toronto, all trees (street, park, and forest trees) are considered as one category (tree canopy), whereas, in other two cities, trees are not distinguished from other green spaces, and are part of open spaces or park areas. Thus, due to this inconsistency, comparing the land covers directly for each city is not feasible. Table 4, Table 5 and Table 6 illustrate these differences for each city. These tables show 8 categories of land cover for Toronto and Montreal and 13 for Vancouver, each with a different taxonomy.
Another limitation was that the future urban growth data (which were used to estimate future urbanization) for the selected years were not available. To address this, we used a systematic urban growth model to generate this data. In the proposed model, we estimated the future state of cells (i.e., locations within each city). Our model is a grid-based discretization method [57] which is different from conventional urban growth models such as cellular automata (CA), land use/transportation (LUT), or agent-based (ABM) models [58]. The selection and priority of the “converted lands” were made based on a combination of three parameters including the hydrological state of the lands (pervious or impervious) considering the land cover (i.e., pervious lands such as bare earth were selected for conversion); the functional importance of the land cover (e.g., tree canopy had priority to bare earth for conversion to impervious cover); and finally the total geometrical area of the selected land cover (e.g., tree canopy in Toronto has a significant share in the area of the city which is greater than the area of all other pervious lands such as grass shrubs, bare earth, etc.). We divided the conversion process into two steps. In Step 1 (Scenario 1, representing medium urbanization), a few land covers are converted to impervious surfaces, whereas in Step 2 (Scenario 2, representing high urbanization) more land covers follow (shown red colored text in Table 4, Table 5 and Table 6). Subsequently, the corresponding area of conversions is calculated, leading to different values for different cities. The PIR values for all three cities and scenarios are presented in Table 4, Table 5 and Table 6. Overall, as expected, PIR decreases with urbanization in all cities.
For Toronto, the impervious area increased by 28% and 48% for Scenarios 1 and 2, respectively. For Montreal, the impervious area increased by 5% and 10% for Scenarios 1 and 2, respectively. Lastly, for Vancouver, the impervious area increased by 19% and 48% for Scenarios 1 and 2, respectively. In each of these cases, the increase in impervious area is measured by comparison with the base scenario for each city. The difference among the “added impervious areas” of the cities for the same scenario is due to two reasons: (1) the limited capacity of the cities in terms of available pervious land cover; and (2) the inconsistency in the base maps in terms of the types of land cover (as described above). This limited the consistent conversion for the same scenario for all cities. For example, “grass shrub” in Toronto does not have a similar land cover type in Montreal (“Golf” can be considered a similar class), whereas “shrub”, “modified grass herb”, or “natural grass herb” can be considered as similar cover types in Vancouver.
In the highly urbanized state (Scenario 2), the PIR is 0.47, 0.10, and 0.11 for Toronto, Montreal, and Vancouver, respectively. These ratios reveal how far the cities are from the highly urbanized state. Both Montreal and Vancouver have similar PIR values for the most critical condition (i.e., Scenario 2) with the lowest pervious land cover, whereas Toronto has a significantly high proportion of pervious land cover. Overall, in Scenario 2, in all three cities, the area of impervious lands dominates the pervious area.
To verify that the urban growth scenarios do not overestimate future urban areas, the computed scenarios described above were compared to a population-based metric. This metric denoted as the Additional Required Impervious Lands (ARIL) is presented in Equations (2) and (3). ARIL estimates how much impervious area is needed on top of the base land cover (i.e., current conditions) to accommodate the projected population in the future. To calculate ARIL, a linear relationship between population growth and impervious area (km2) was assumed using similar methods proposed in previous studies (e.g., [60,61]). In addition, we assumed that the population distribution over impervious lands is homogenous, the population density in the future remains the same, and the future area of impervious lands is a linear function of the current area and population density. In other words, future urbanization and urban growth will continue in the future as they are currently.
where Aibase is the area of impervious lands at the base year, Px is the projected population at year x, Pbase is the population at year b, and PPI is the population per impervious land (Equation (2)).
PPI (capita/ha) = Pbase (capita)/Aibase (km2)
ARIL = (Px − Pbase)/PPI
The projected populations for Toronto, Montreal, and Vancouver are needed to estimate the ARIL (Table 7). The available data for these projections for each city had several inconsistencies creating a challenge in data integration, particularly due to missing data for the three future periods. To overcome this, the missing data were estimated using a linear function to the available data (which included historical population data for each city as well as projected data for certain future years), for each city. The project data are specified in Table 7, which also identifies which data were estimated using the linear function.
Based on Equations (2) and (3), PPI in 2007 (the base year) for Toronto is estimated as 8255.9 capita/km2. For Montreal, the PPI calculated in the year 2016, for which both population and land cover data are available, was estimated as 5159.8 capita/km2. Vancouver had a PPI of 34,084.5 capita/km2 in year 2016, for which both population and land cover data are available. Using PPI values, the ARIL of each city for all projected years were estimated and are presented in Table 8. We compared the ARIL against the developed scenarios. This revealed that the added impervious lands (by converting pervious lands) in two scenarios are not adequate to accommodate the projected population with an assumption of constant PPI. In all cases, the ARILs in Scenarios 2066 and 2096 are larger than the added impervious area presented in Table 4, Table 5 and Table 6. From this, we learned that for the future land cover scenarios, only converting the pervious to impervious lands is not sufficient to accommodate such projected populations and the PPI needs to increase. In other words, the current lifestyles will need to be modified in each city to account for the increase in population, e.g., through the vertical development of buildings (i.e., densification) or an increase in population density.
2.3.3. Integrated Urban Growth and Climate Change Scenarios
We investigated all possible combinations of our selected urbanization and climate change scenarios. Using this, the influence of the sole change of any scenario as well as the combined change of any land cover and climate scenarios can be analyzed. The developed scenarios are labeled and presented in Table 9.
3. Results
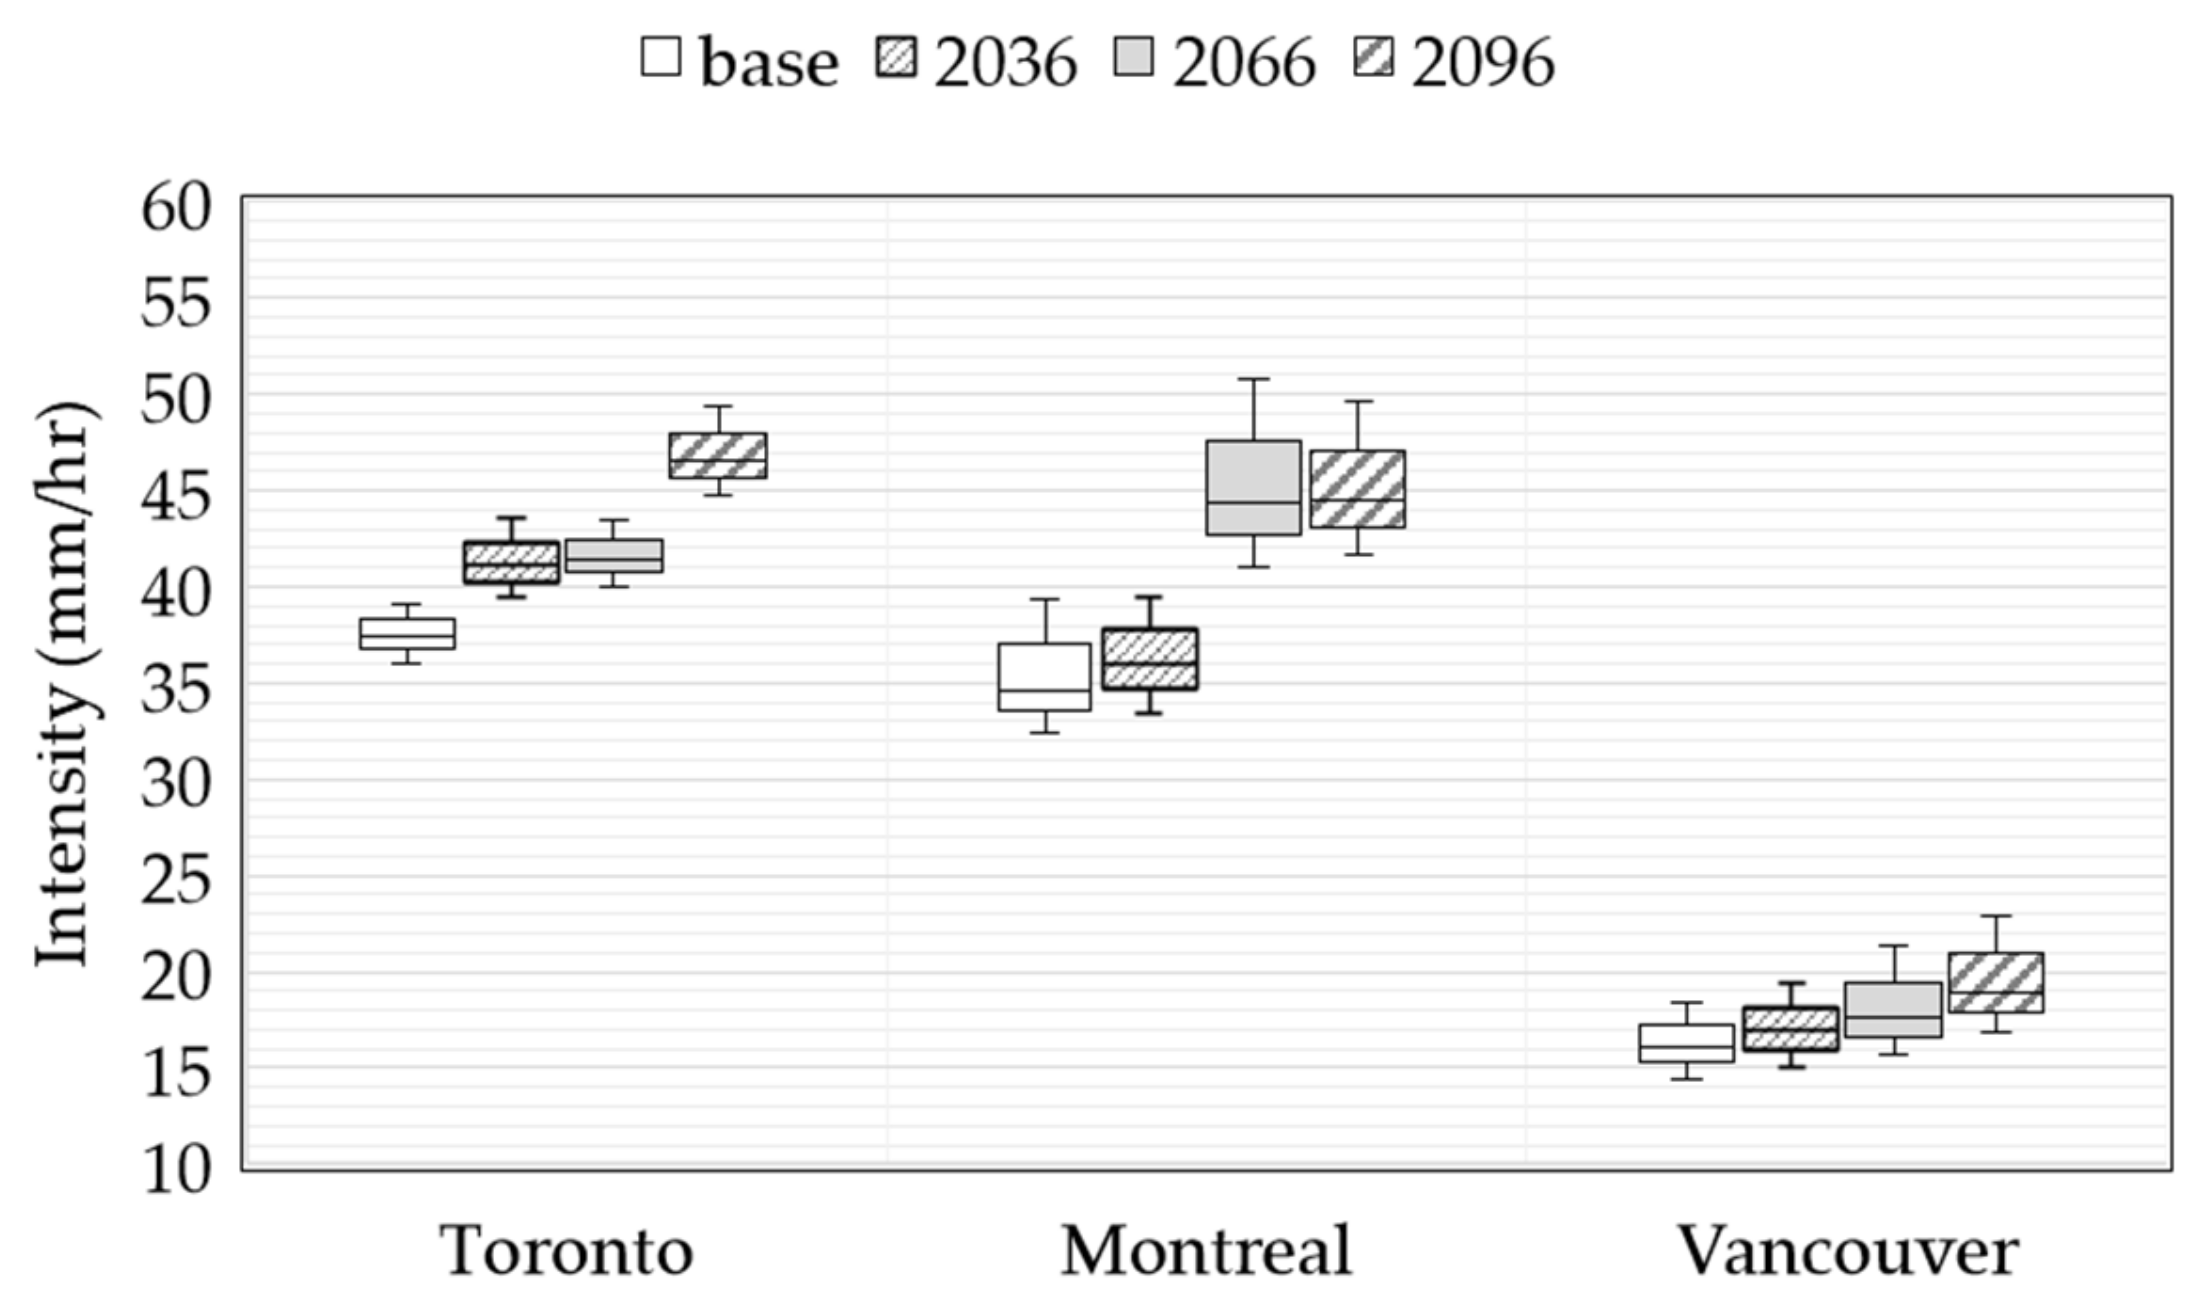
A brief comparison of climate condition and urbanization under different scenarios is presented in Figure 2 and Figure 3. The mean rainfall intensity of the cities shows that the rainfall intensity of Toronto is slightly higher than that of Montreal and more than double the rainfall intensity of Vancouver. However, Vancouver has a maximum average annual rainfall of 1569 mm, about 90% higher than Toronto and 50% higher than Montreal. Overall, the trend of projected mean rainfall intensity presents an increase in the intensity of rainfall in the future for each city for each future period. However, there is an exception for Toronto in Scenario 2066, where the intensity is shown to remain almost constant compared to the previous scenario (2036). This is similar to Montreal for Scenario 2096 compared to the previous scenario (2066). Note that the variability of rainfall intensity is higher in Montreal compared to the other two cities.
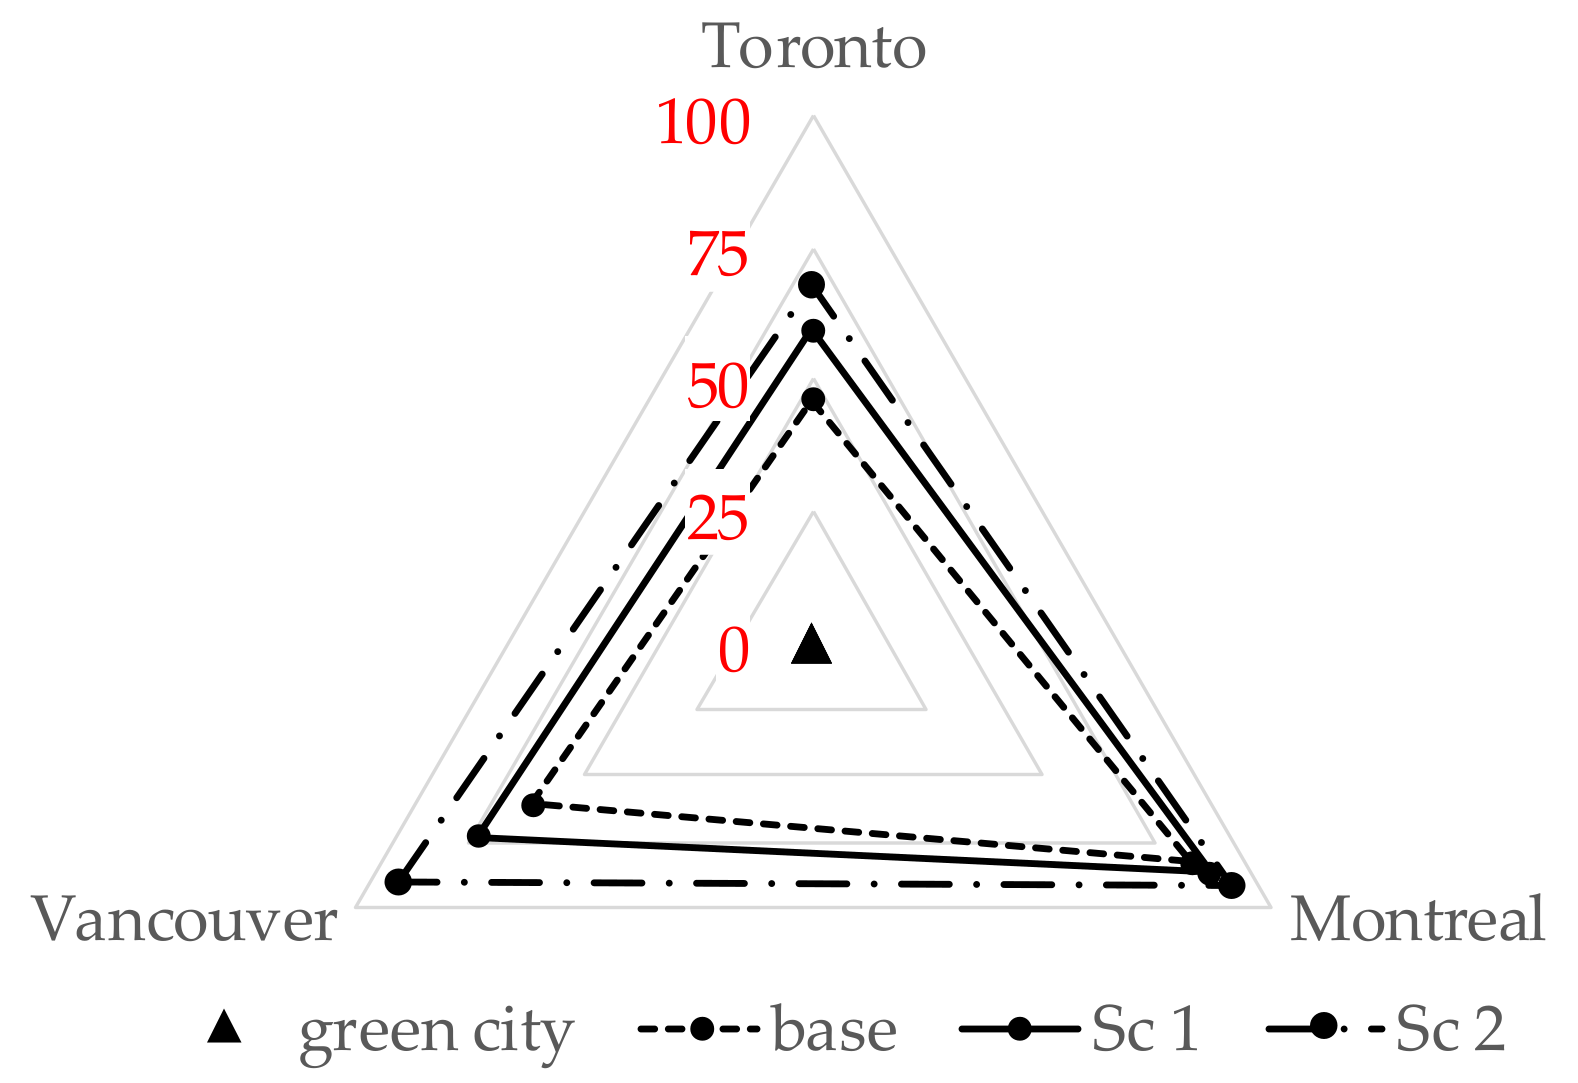
Figure 3 presents an overall comparison of all urbanization scenarios for the three cities. If zero impervious surface is defined as the “green city”, Figure 3 shows that Toronto (for the base scenario) is the closest to the “green city” and Montreal is the most urbanized city (closest to 100% impervious cover). As expected, the two projected scenarios (Sc1 and Sc2 representing medium and high urbanization) move each city further away from the “green city”.
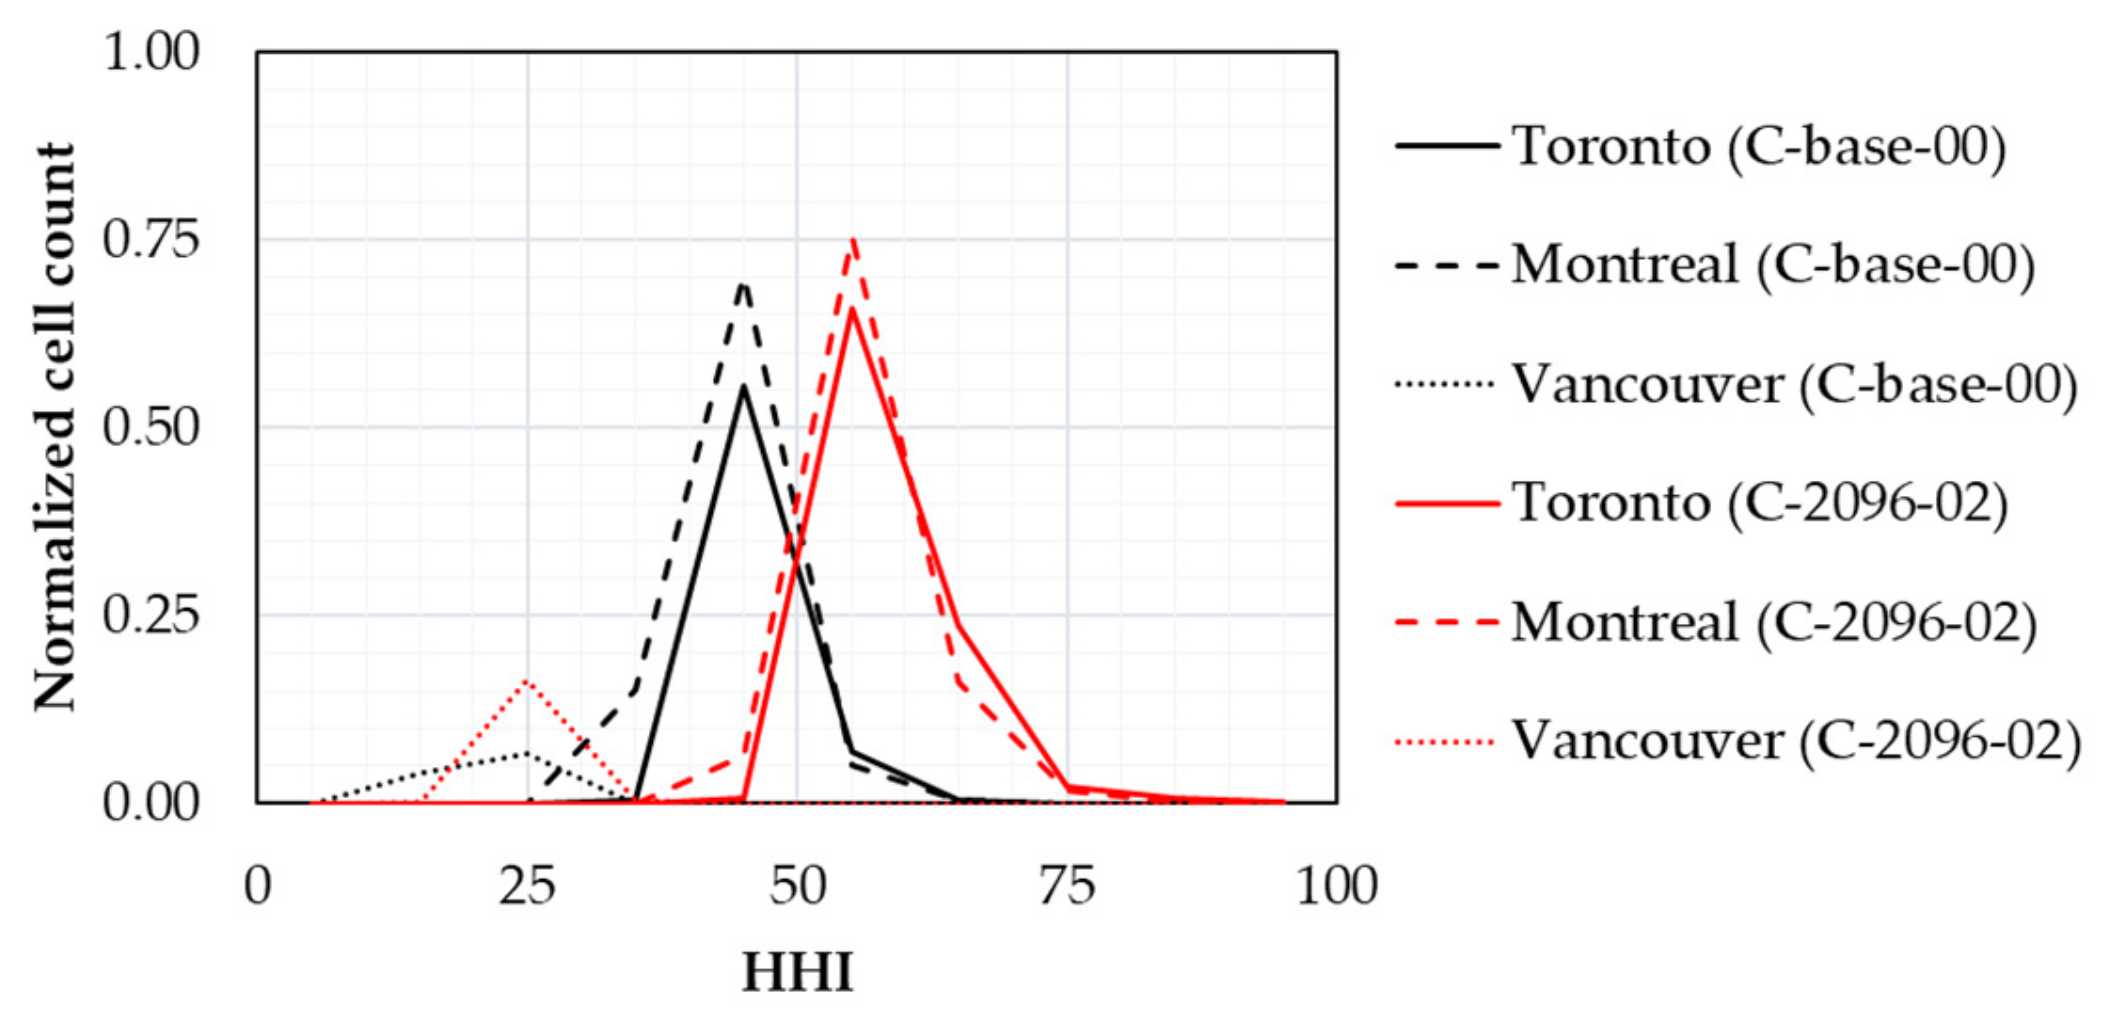
For the HHI, first, a general comparison of the three cities is presented in Figure 4 which shows the current state (C-base-00, i.e., the base climate and the base urbanization scenarios) as well as the worst-case scenario (C-2096-02, i.e., Scenario 2096 climate and high urbanization, Scenario 2). Note that, as identified above, the C-base-00 comparison has some limitations: the base land cover for these cities is not for the same year, while the rainfall intensity is based on available historical data (which differs for each city).
This comparison was made based on the mean and frequency of HHI in each city. Figure 4 shows the normalized histogram of HHI for each city for the two scenarios listed above; a low HHI value represents a lower demand for LID, and a higher value represents a higher demand. Generally, there a higher demand for LID in Montreal, with a slight difference compared to Toronto, and Vancouver has the lowest demand for LID. The mean HHI values for the C-base-00 and C-2096-02 scenarios range from 46.2 to 58.2 (a 26% increase) for Toronto, from 44.0 to 56.4 (a 28.2% increase) for Montreal, and from 21.3 to 25.1 (a 17.8% increase) for Vancouver.
Toronto and Montreal present a similar pattern in response to climate change and urbanization. For example, in both cities, a significant proportion of the C-2096-02 histograms is higher than an HHI value of 50, which shows a higher demand for LID compared with the C-base-00 scenarios. In addition, there is a general change towards a higher frequency of HHI for the C-2096-02 from the C-base-00 scenario. In Vancouver, if an HHI value of 25 is used for comparison, the histogram does not show that the proportion of the C-2096-02 histogram for values greater than 25 has changed. Both the initial and final HHI values for Vancouver are much lower than both Toronto and Vancouver. The C-2096-02 demand is higher, as expected, for Vancouver, but with lower variance than the C-base-00 scenario.
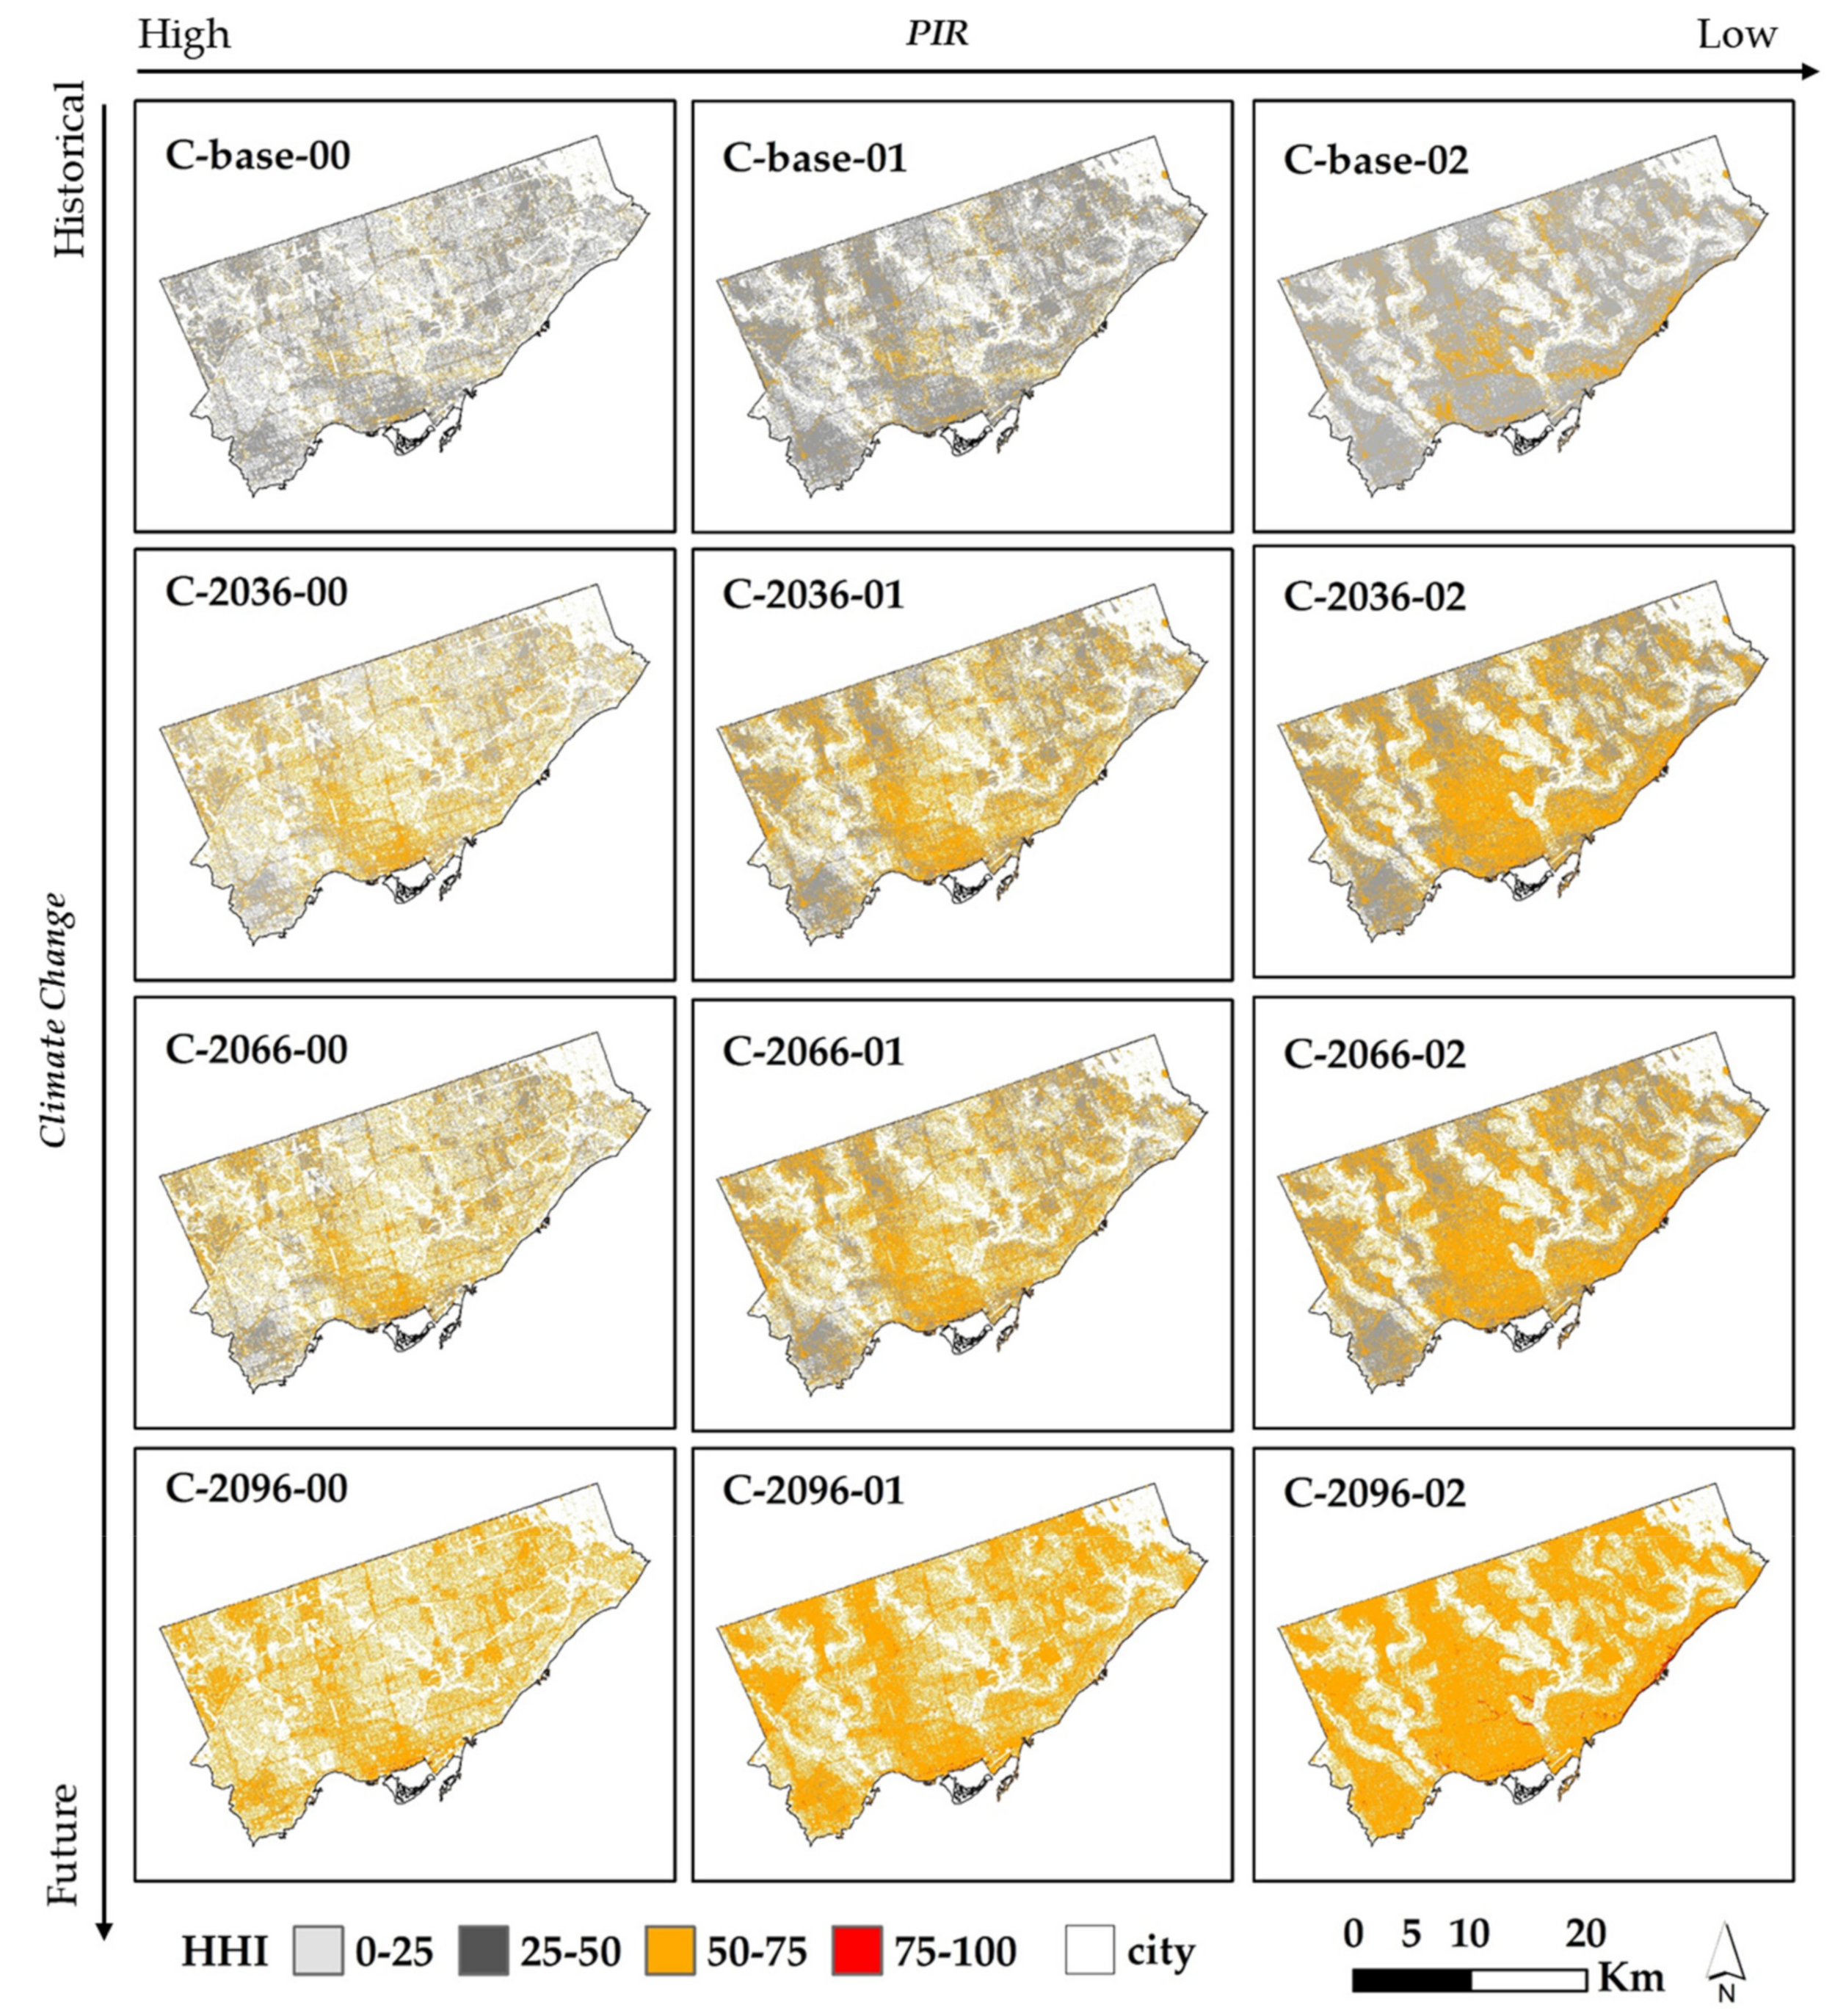
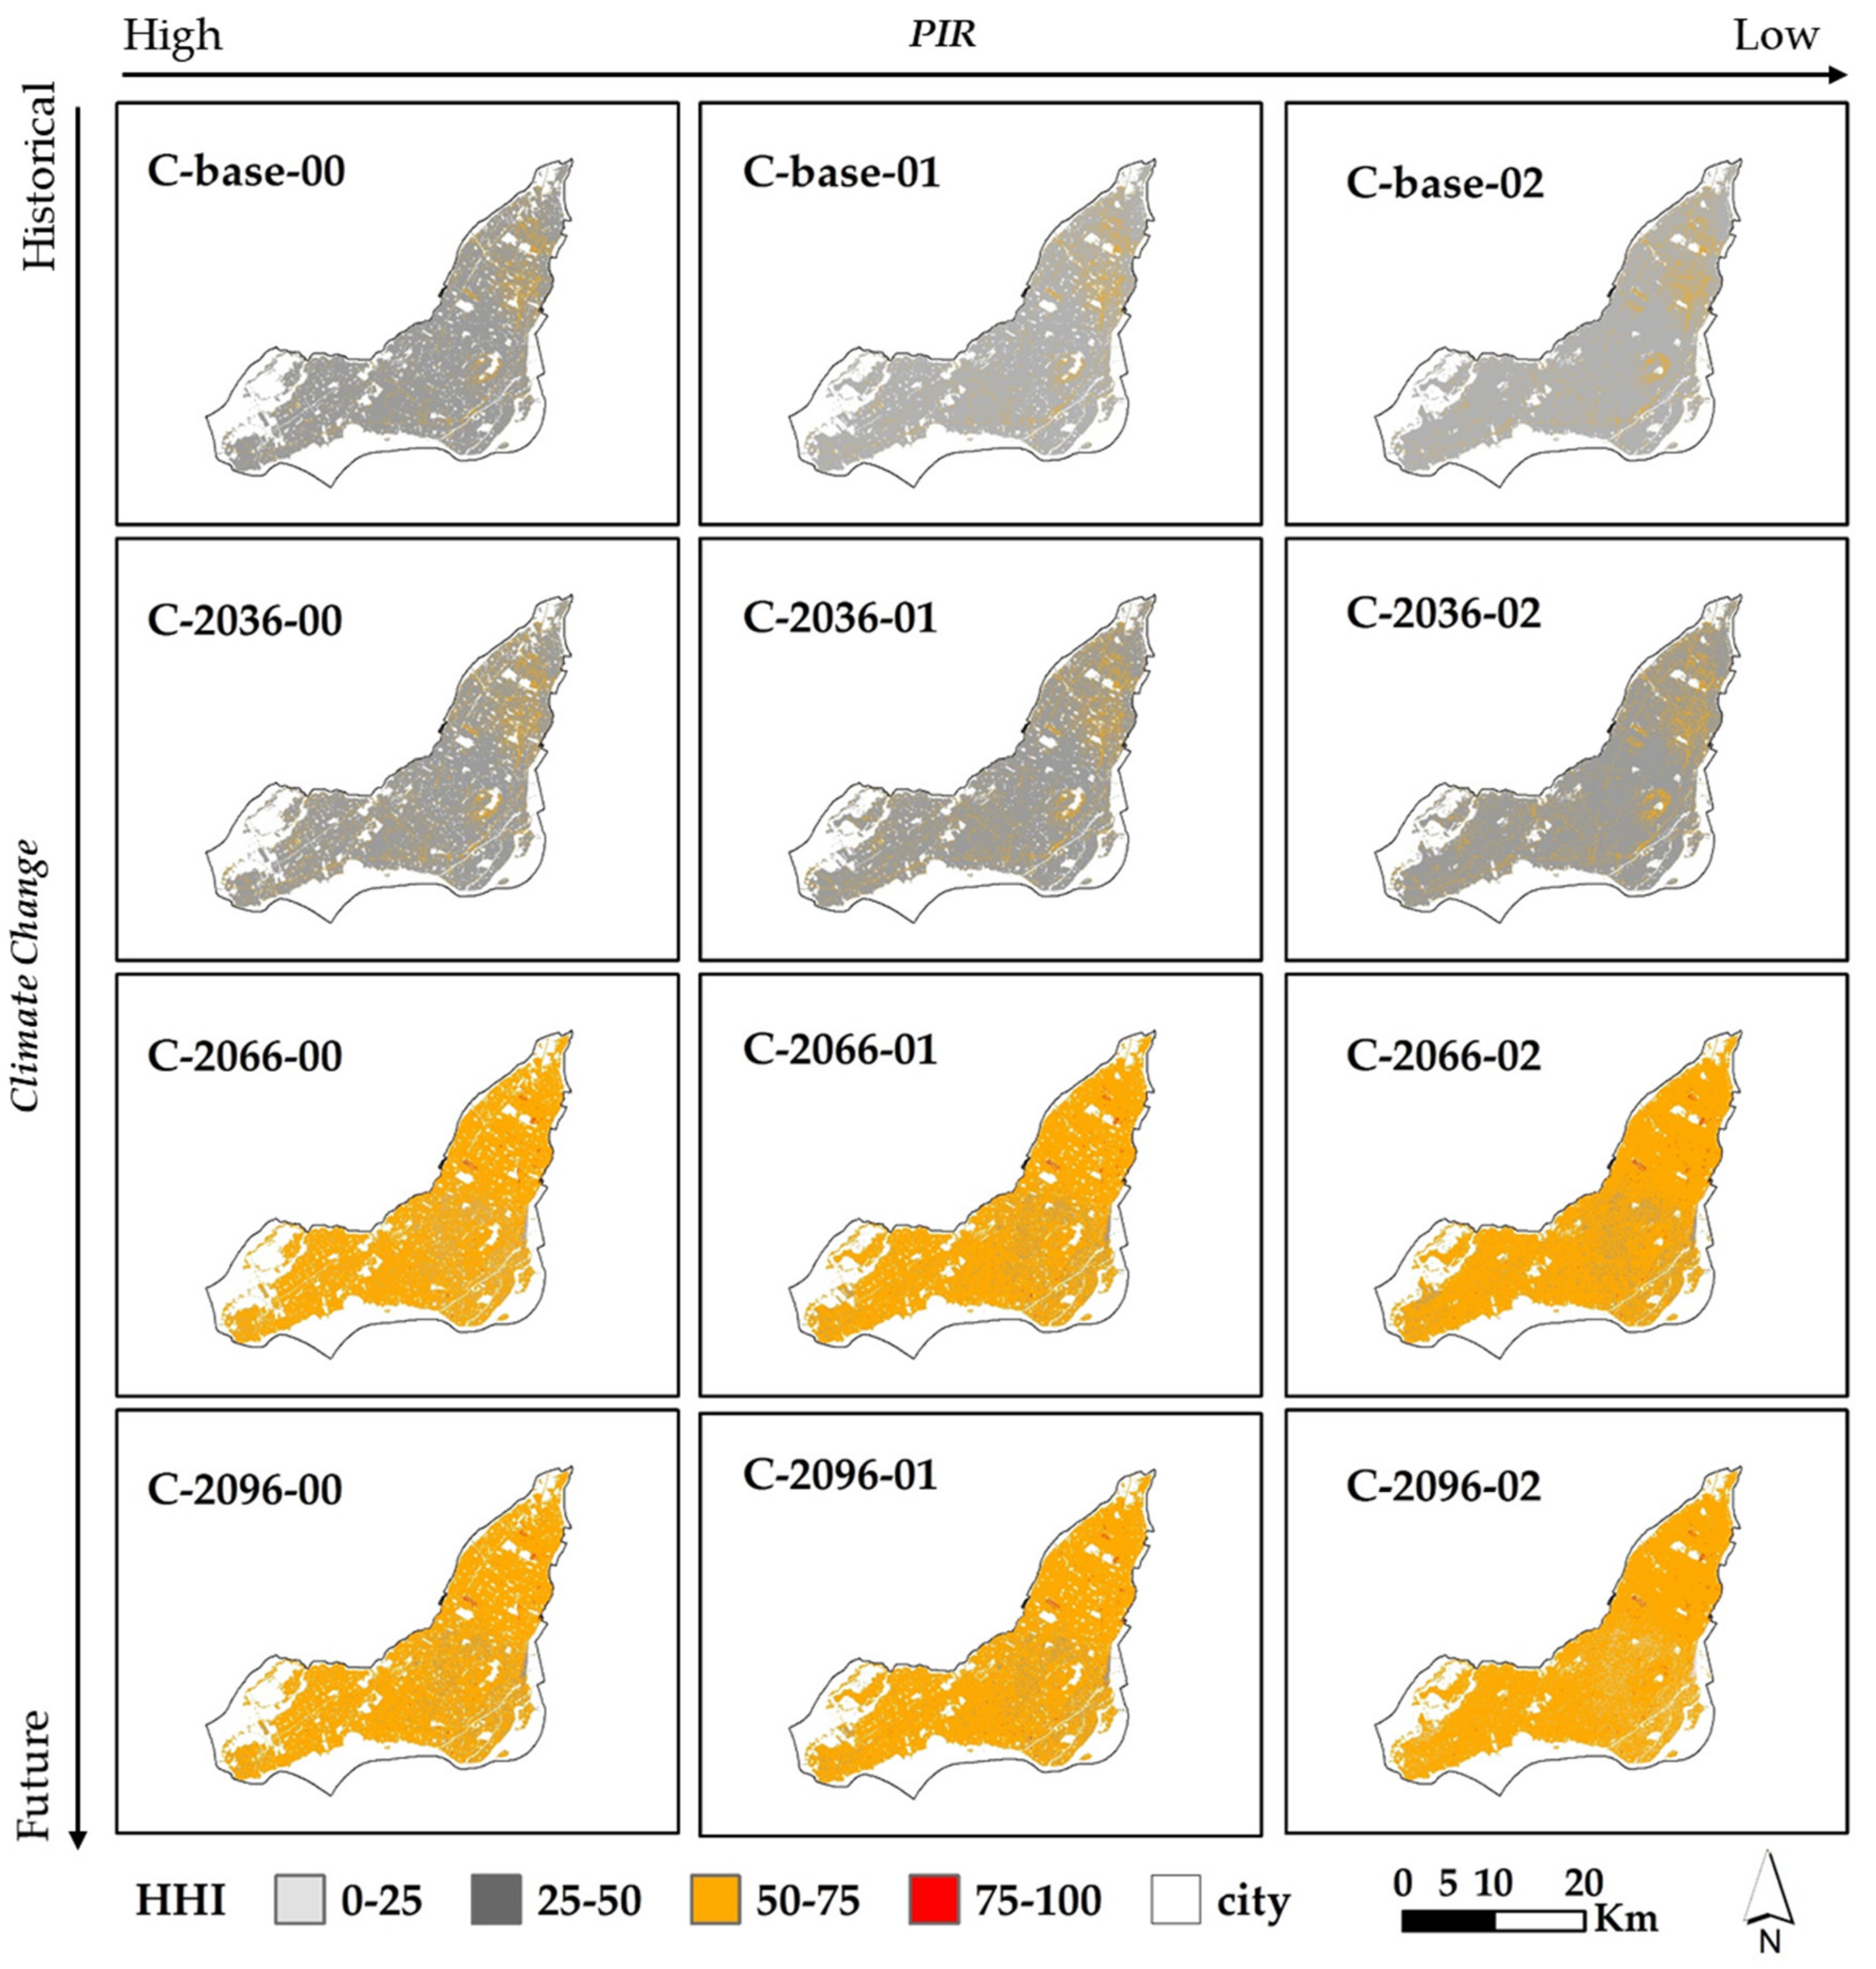
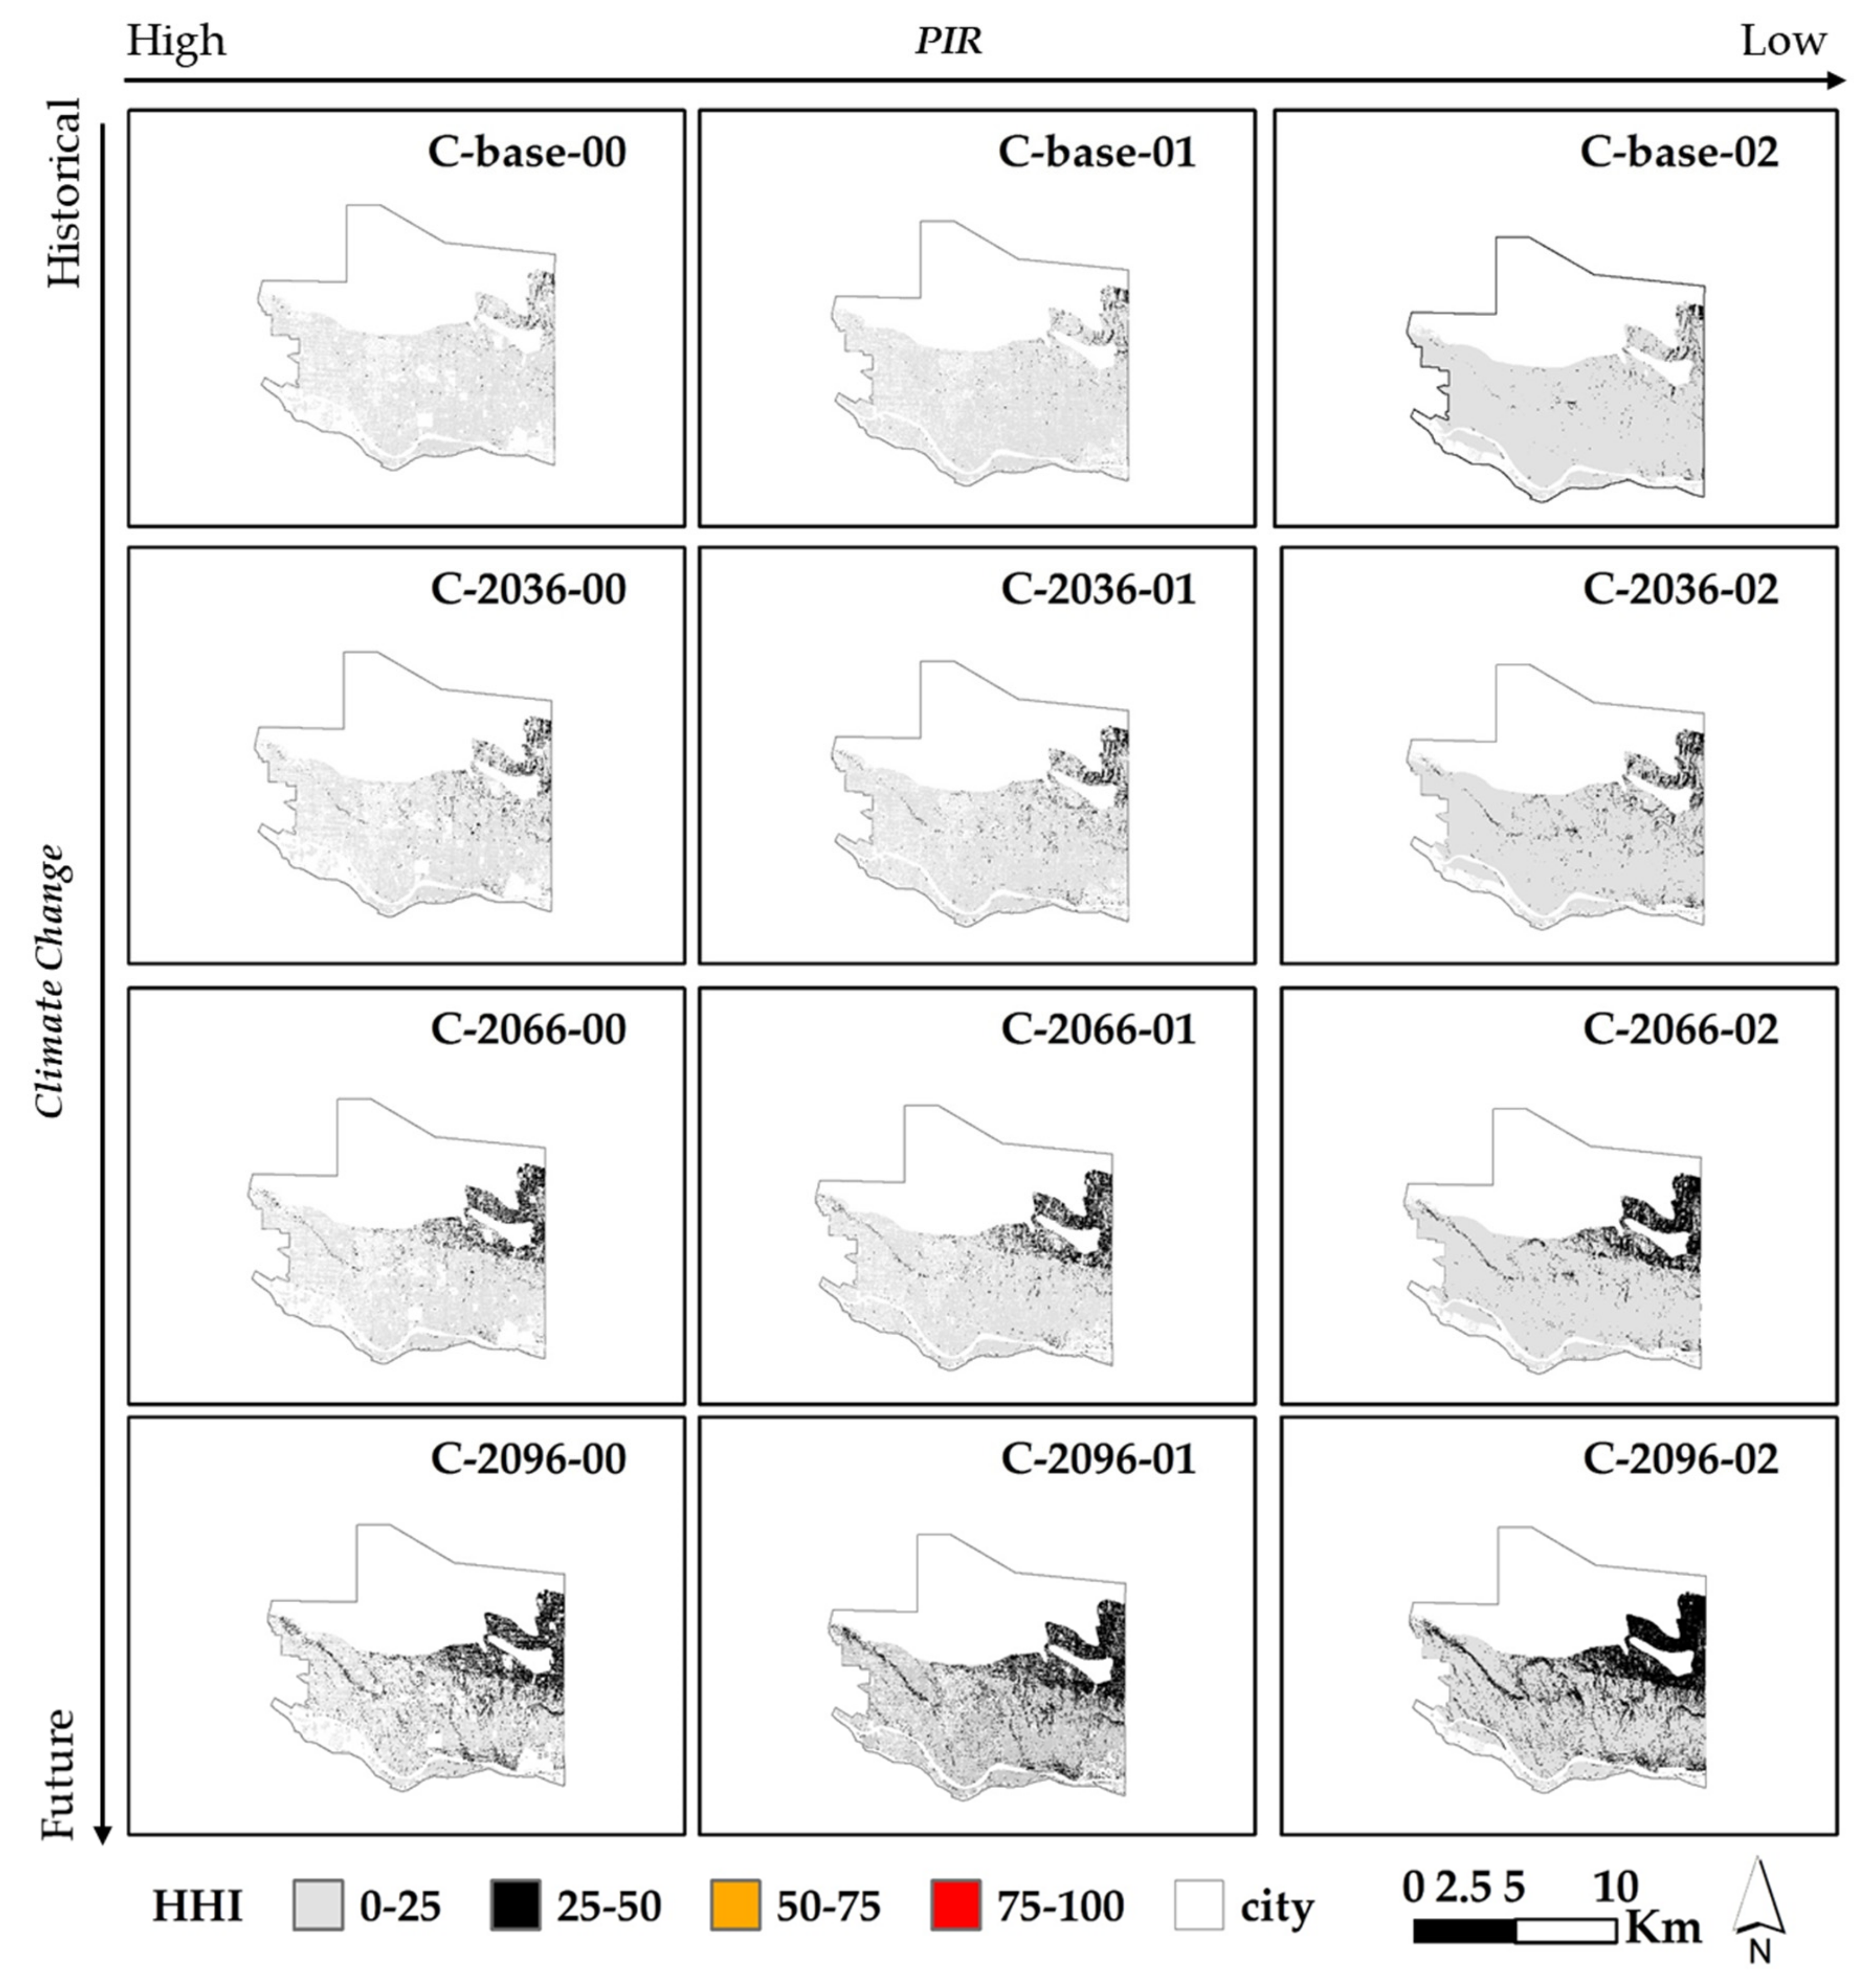
The HHI values for all three cities are visualized in maps presented in Figure 5, Figure 6 and Figure 7. As expected, all scenario results indicate that climate change and urbanization increase the HHI and, thus, the runoff generation potential in each city, leading to a higher demand for LID for source control. Climate change also significantly impacts HHI more than urbanization in Toronto and Montreal. This can be due to two reasons: first, Montreal is already highly urbanized and, thus, the room for future change in land cover is limited; and, second, while Toronto has a high share of pervious land cover, most of the natural soil has low permeability (clayey silt till or silty clay to silt till [63]), thus increasing the HHI further. Therefore, considering the current state of the land cover of these cities, urbanization has a lower effect than the change in the magnitude of rainfall intensity. Vancouver (results are shown in Figure 7) responded to the integrated climate change and urbanization similarly to the other two cities (an increase of HHI), but with lower values of HHI overall. The difference between the sole effect of urbanization and climate change in this city was not as significant as the other two cities. This is because Vancouver has a lower rainfall intensity compared to the other two cities, so the HHI value is about half the values for Toronto and Montreal, which decreases the effect of climate change. Note that Vancouver is more pervious compared to the other two cities, thus it has more room for urbanization (Figure 3).
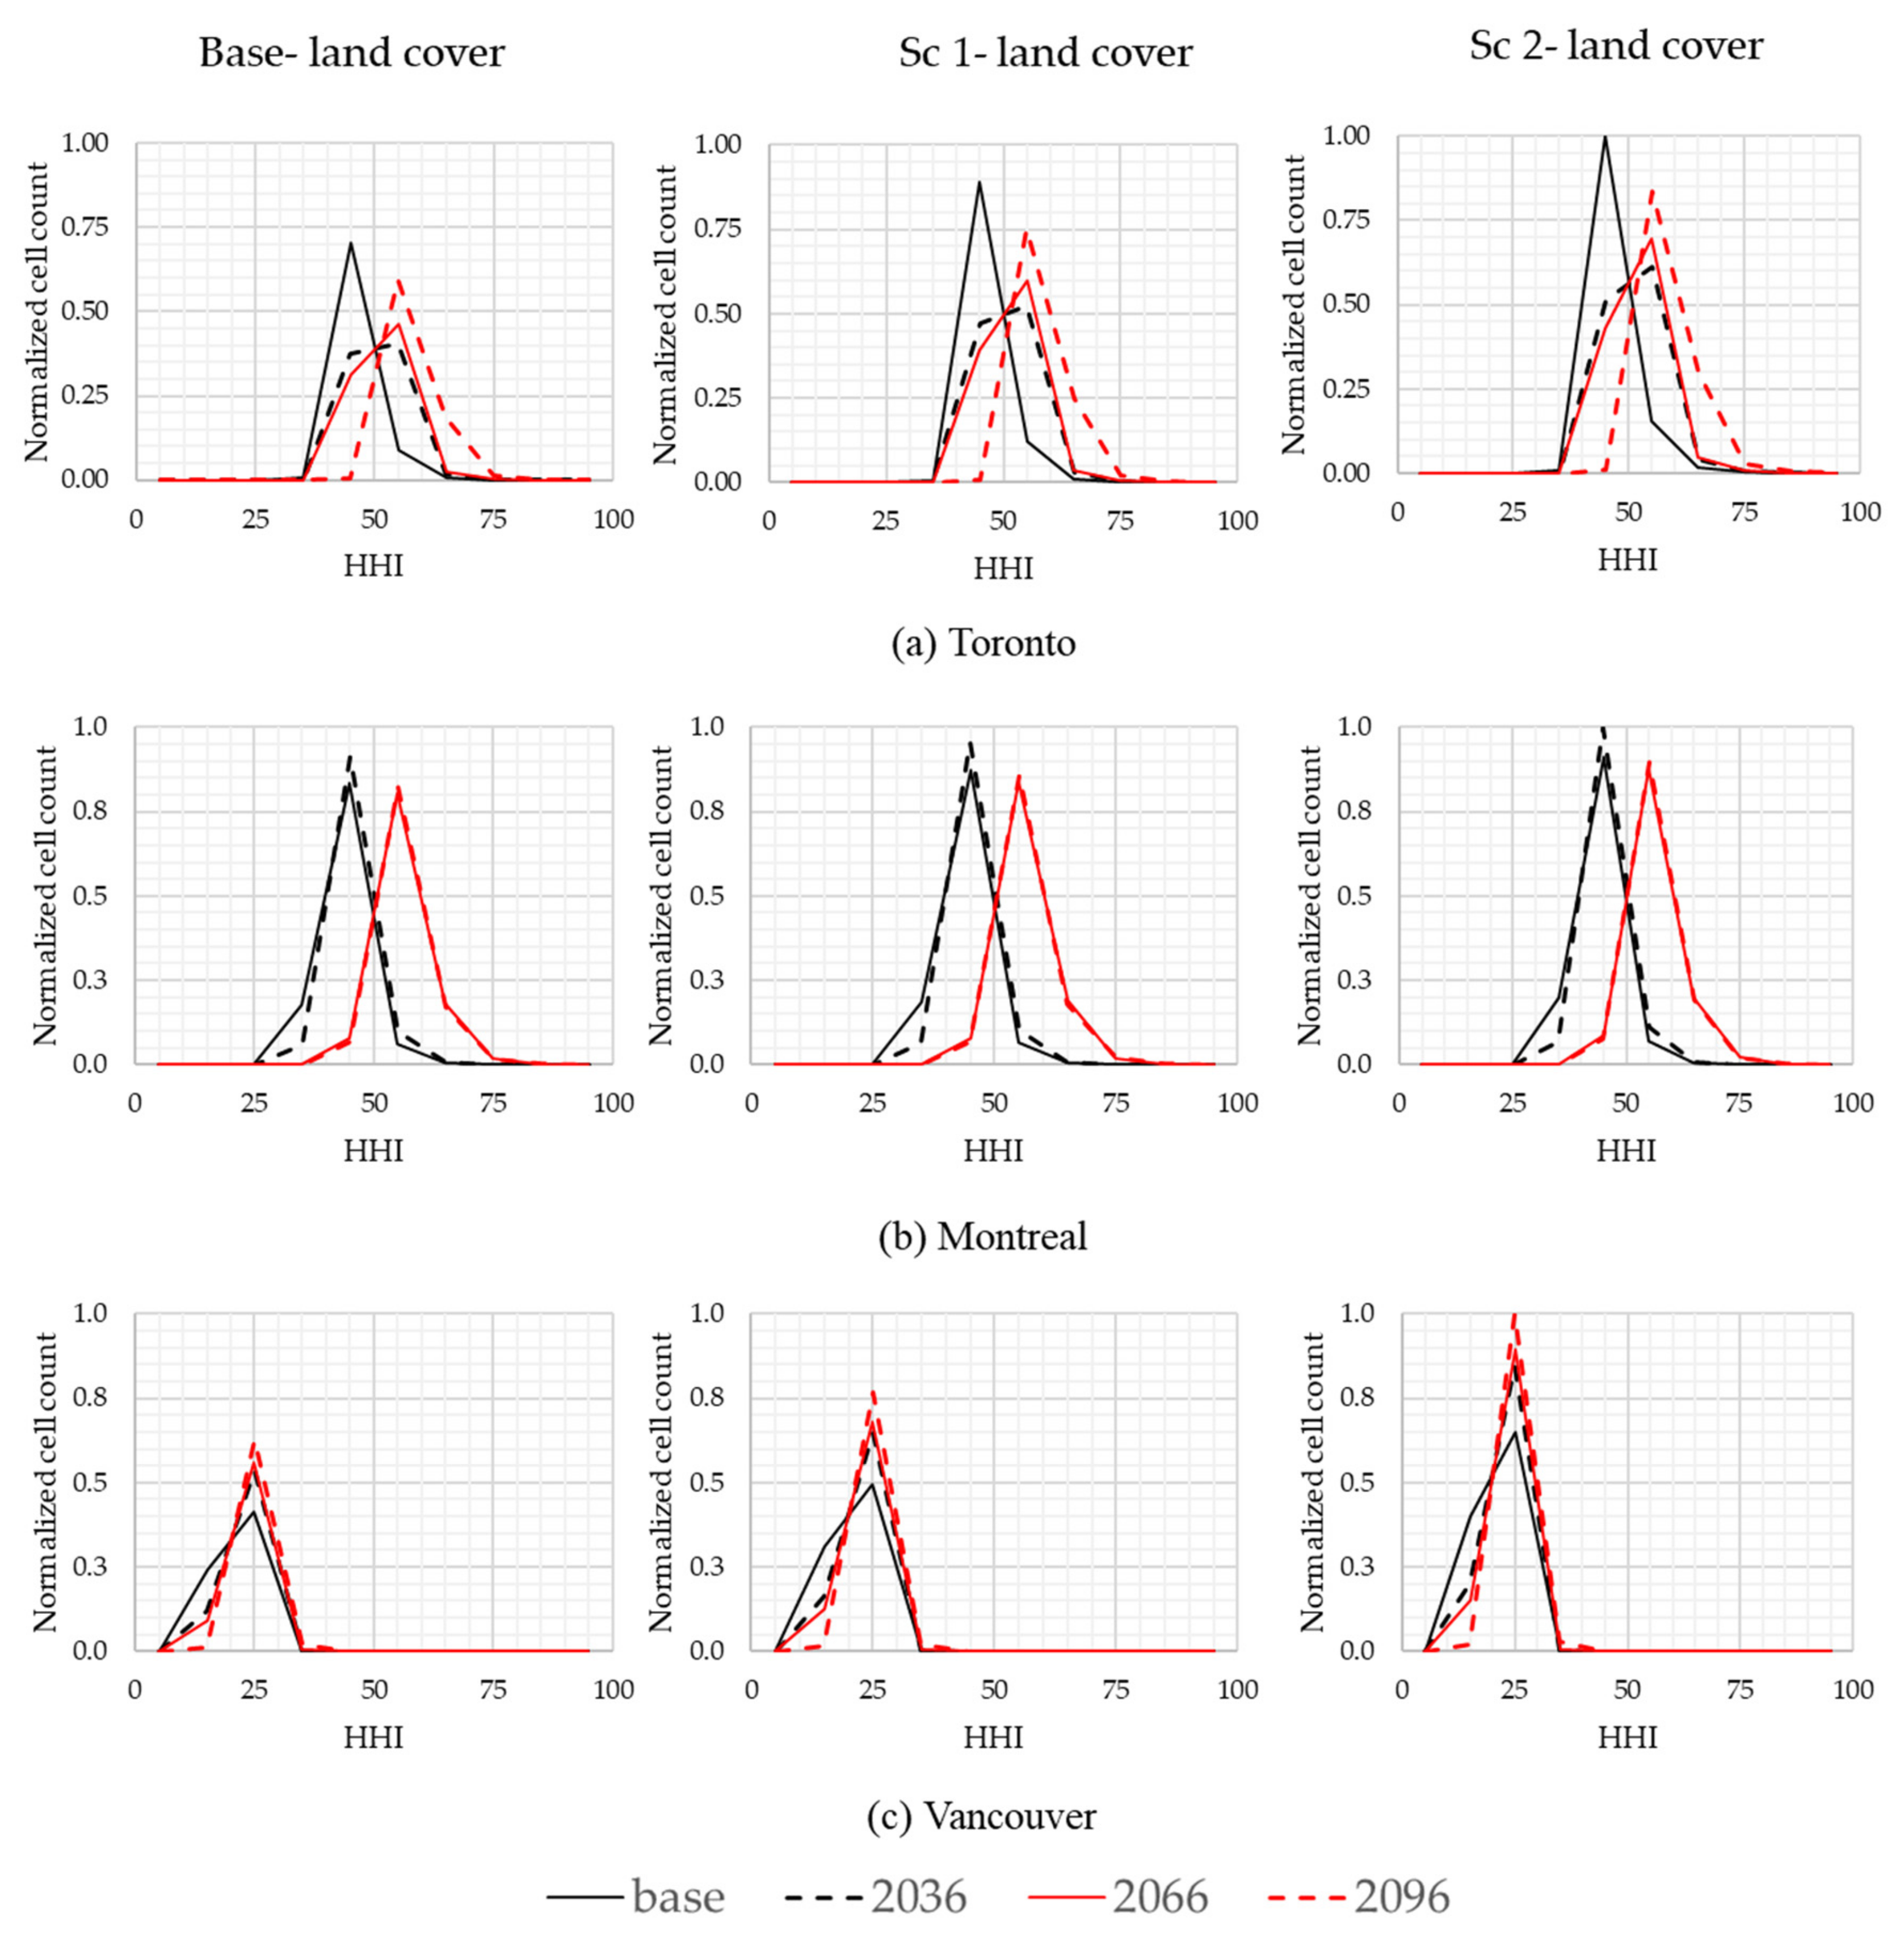
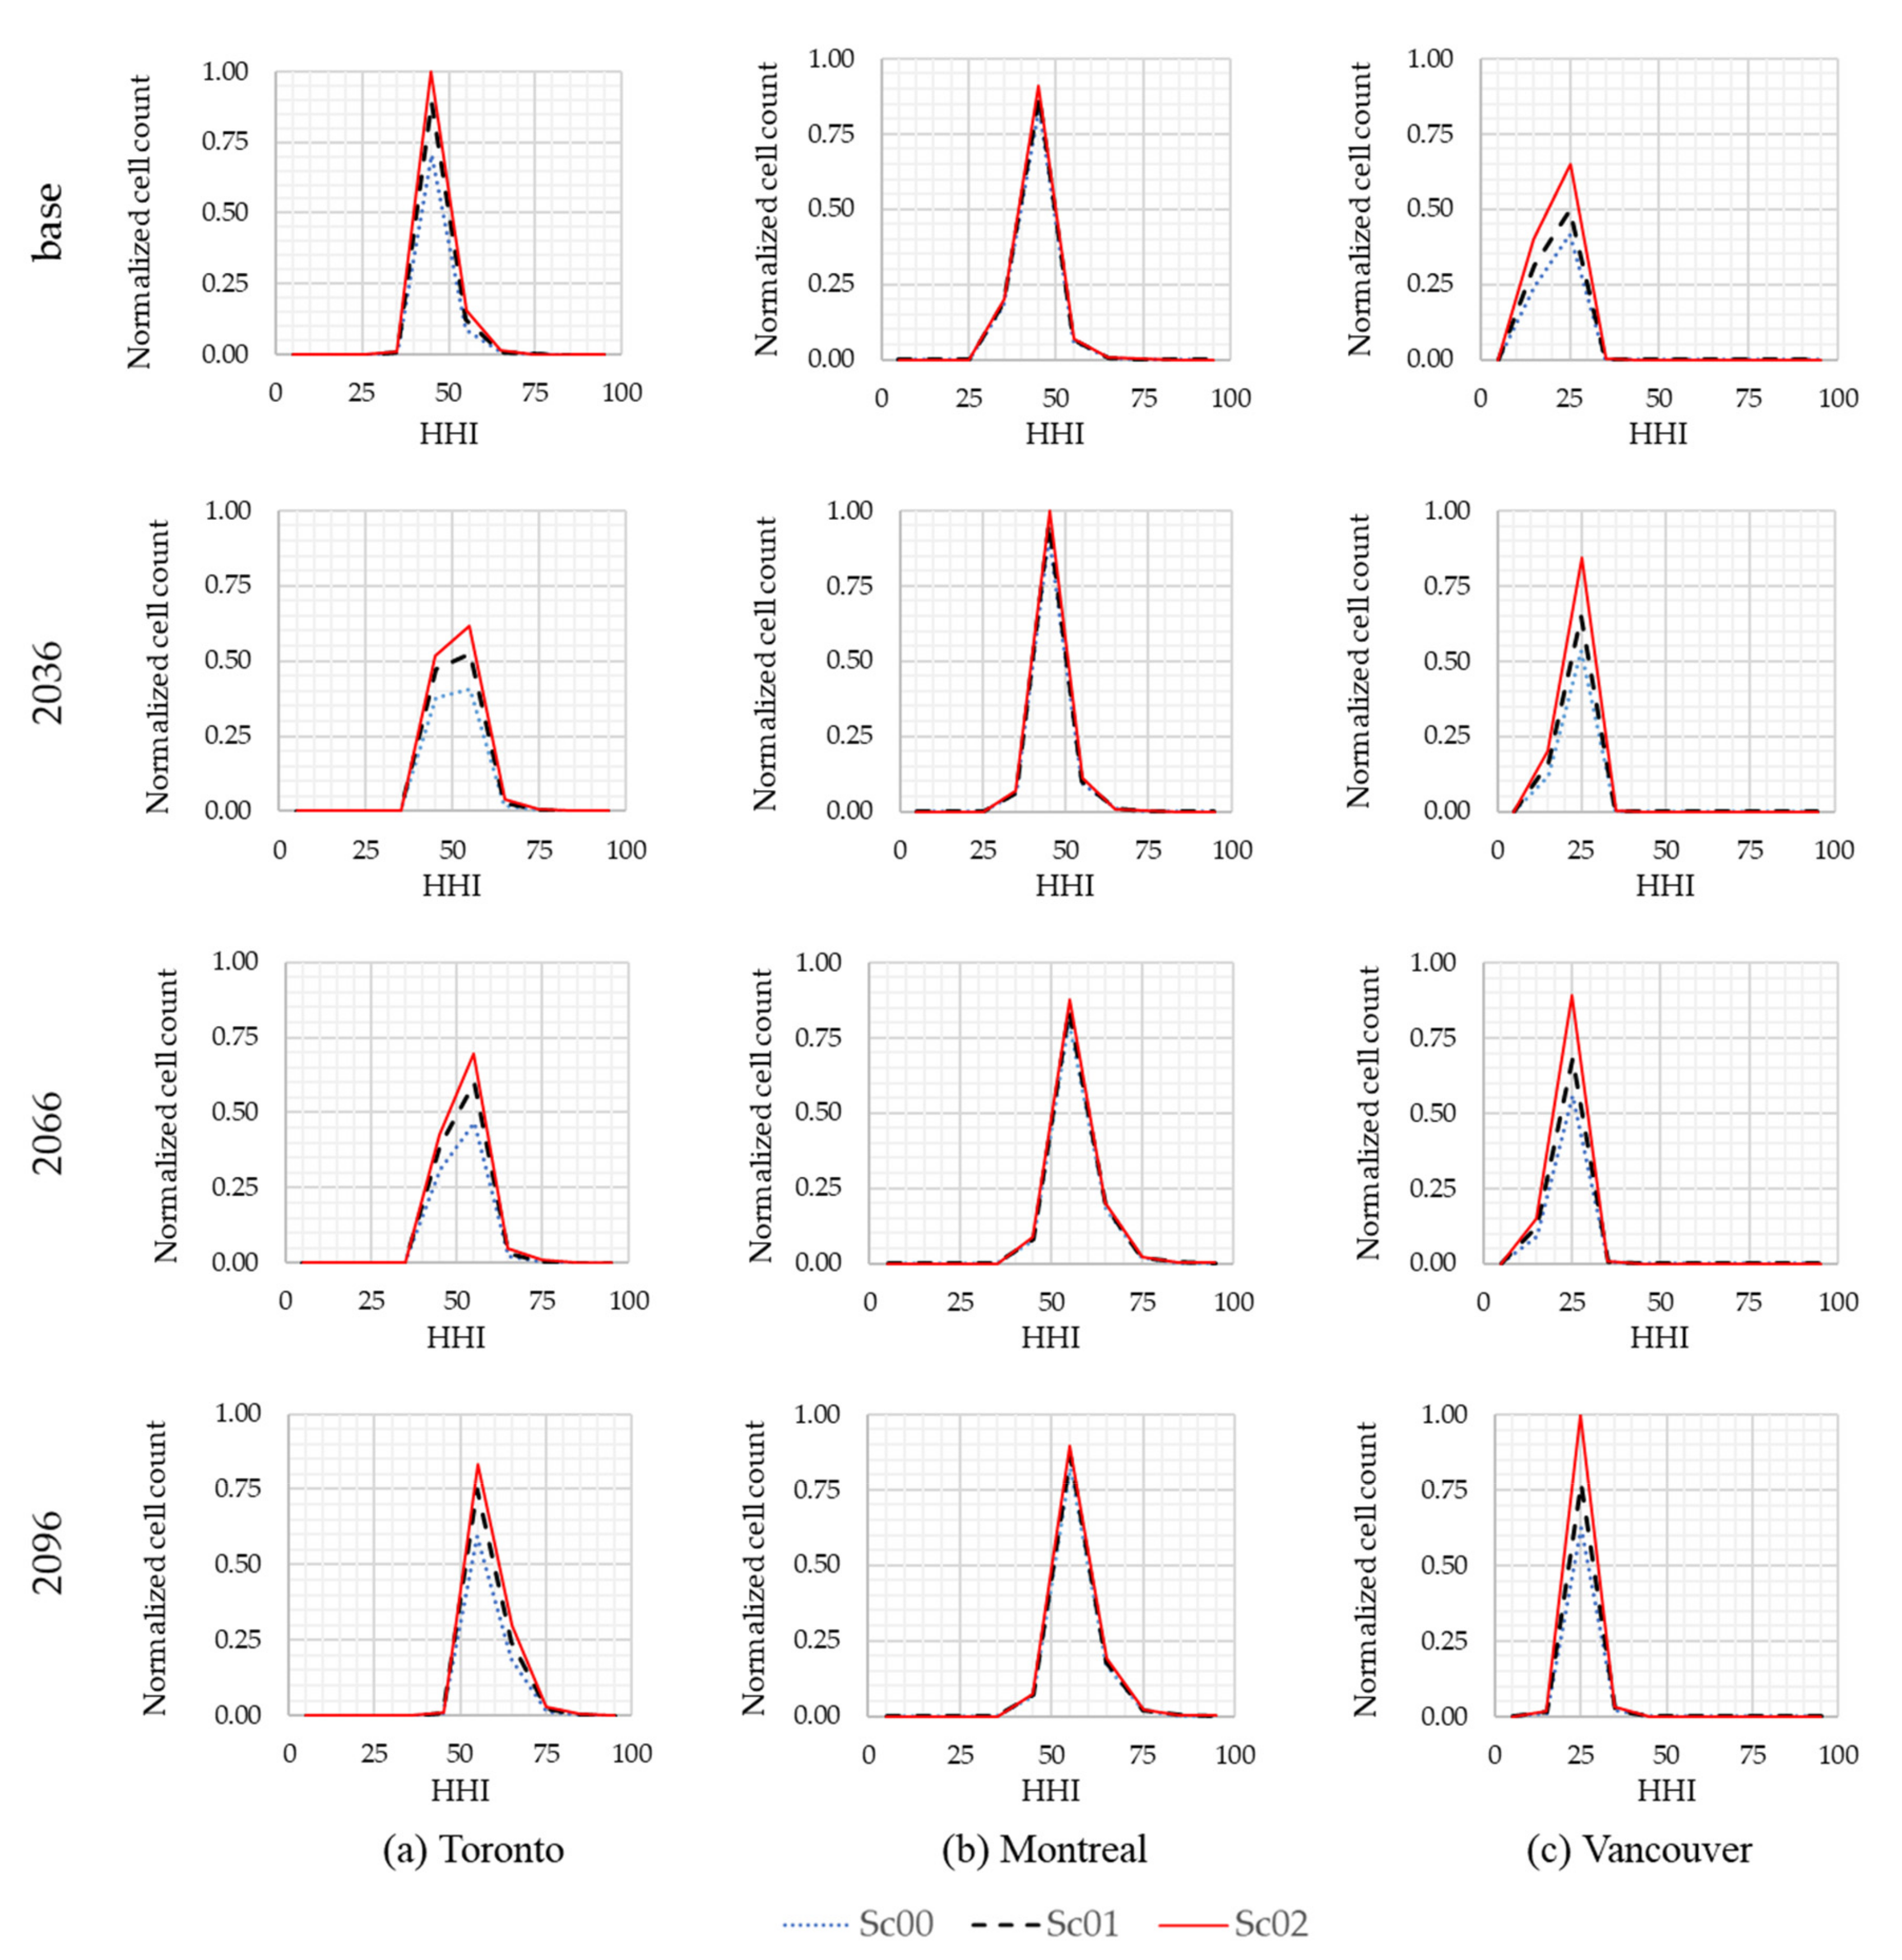
Figure 8 compares the histogram of HHI for each city, for each urbanization scenario, for the four climate periods. The results show that, with time (from the base time to 2096), the HHI values increase (i.e., have a higher mean), i.e. the histograms shift to the right, which indicates higher runoff generation potential and, thus, an increase in demand for LID for source control. This shift is the lowest for Vancouver compared with the other two cities. There is an exception in the observed trend in Toronto for the 2066 scenario for which the mean HHI change compared with the previous scenario (2036) is minor due to the similarity of the rainfall intensity of these scenarios. Likewise, in Montreal, Scenario 2096 has slightly followed the overall pattern because the rainfall intensity in this scenario has not increased compared with the previous scenario (2066). In addition, with urbanization, the number of cells (i.e., locations within the cities) generating runoff is increasing as well. This is because pervious areas have been converted to impervious areas—and thus, are generating runoff in areas that did not under the base urbanization scenario (resulting in higher peaks of the histograms).
Figure 9 shows a comparison of the climate change scenarios (i.e., rainfall intensity) for each city versus the different urbanization scenarios. This figure demonstrates that the change in climate has a relatively minor impact on the HHI frequency, as compared to the results shown in Figure 8. An increase in urbanization results in an increase in the frequency of HHI as well as an increase in the number of cells generating runoff; this is more evident in Toronto and Vancouver than in Montreal. While the increasing rainfall intensity for each city results in higher HHI values for each urbanization scenario, the change is relatively smaller than the effect illustrated in Figure 8.
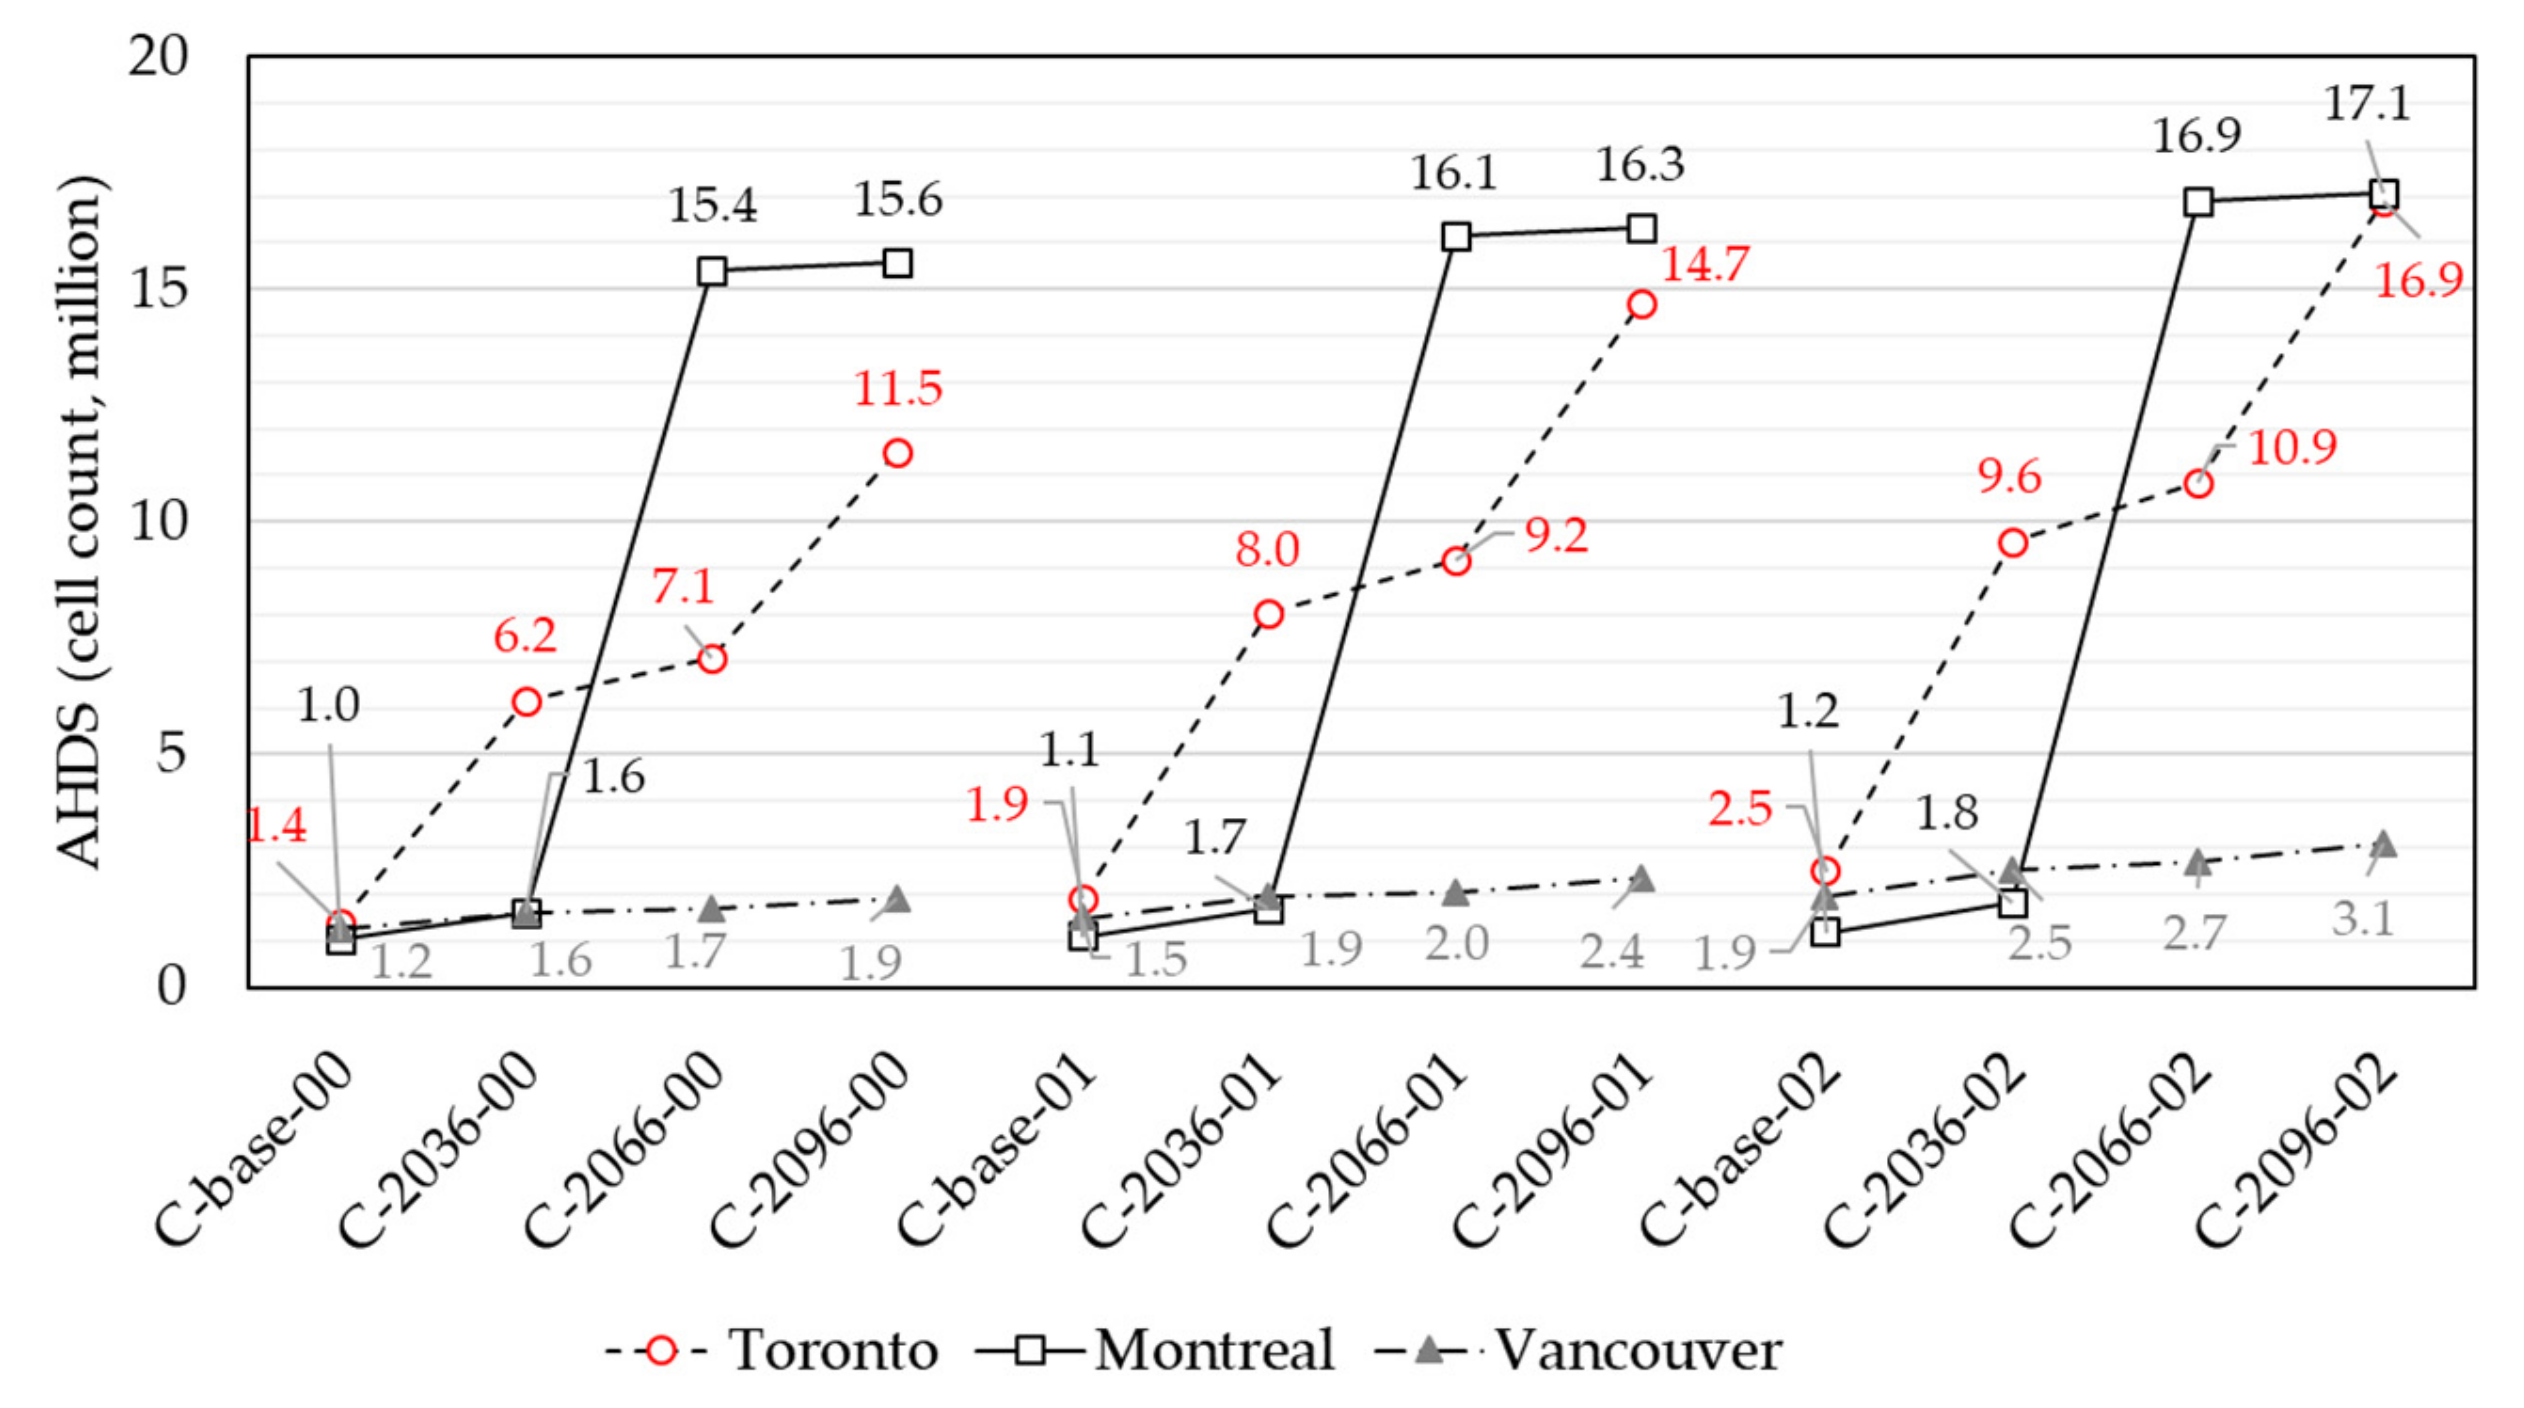
A comparison of all scenarios was conducted to determine the influence of urbanization and climate change on the magnitude of the area of sites that have a high demand for LID (referred to as high demand sites, HDS). To do this, the area of sites that have a value of HHI greater than a threshold value was calculated. The threshold was set at an HHI value of 50 for Toronto and Montreal and an HHI value of 20 for Vancouver (these values are the approximate mean HHI value for the C-base-00 scenario for each city). The area of HDS (AHDS) sites, the count of cells with an area of 25 m2, was calculated for all scenarios and compared to AHDS of the baseline C-base-00 scenario. This comparison is shown in Figure 10.
Overall, in Figure 10, all three cities show an increasing trend of AHDS under integrated climate change and urbanization as well as the sole effect of these scenarios. The overall pattern under the climate change only scenarios is similar to the corresponding rainfall patterns in Figure 2. For Toronto, urbanization seems to have a slight effect on AHDS, e.g., starting from 1.4 million cells for C-base-00 and reaching 2.5 million cells for C-base-02. In contrast, an increase in rainfall intensity due to climate change has a significant influence on increasing AHDS, e.g., the AHDS is 11.5 million cells for C-2096-00 and rises to 16.9 million cells for C-2096-02. Montreal presents similar behavior as Toronto; the AHDS of this city also has a notable increase with time for different climate scenarios. However, Vancouver’s responses to climate change are similar to the impact of urbanization (from 1.2 million to 1.9 million cells in both cases) and are lower than in the other two cities. The reason is related to the low rainfall intensity of this city, which is a key difference between Vancouver and the other two cities.
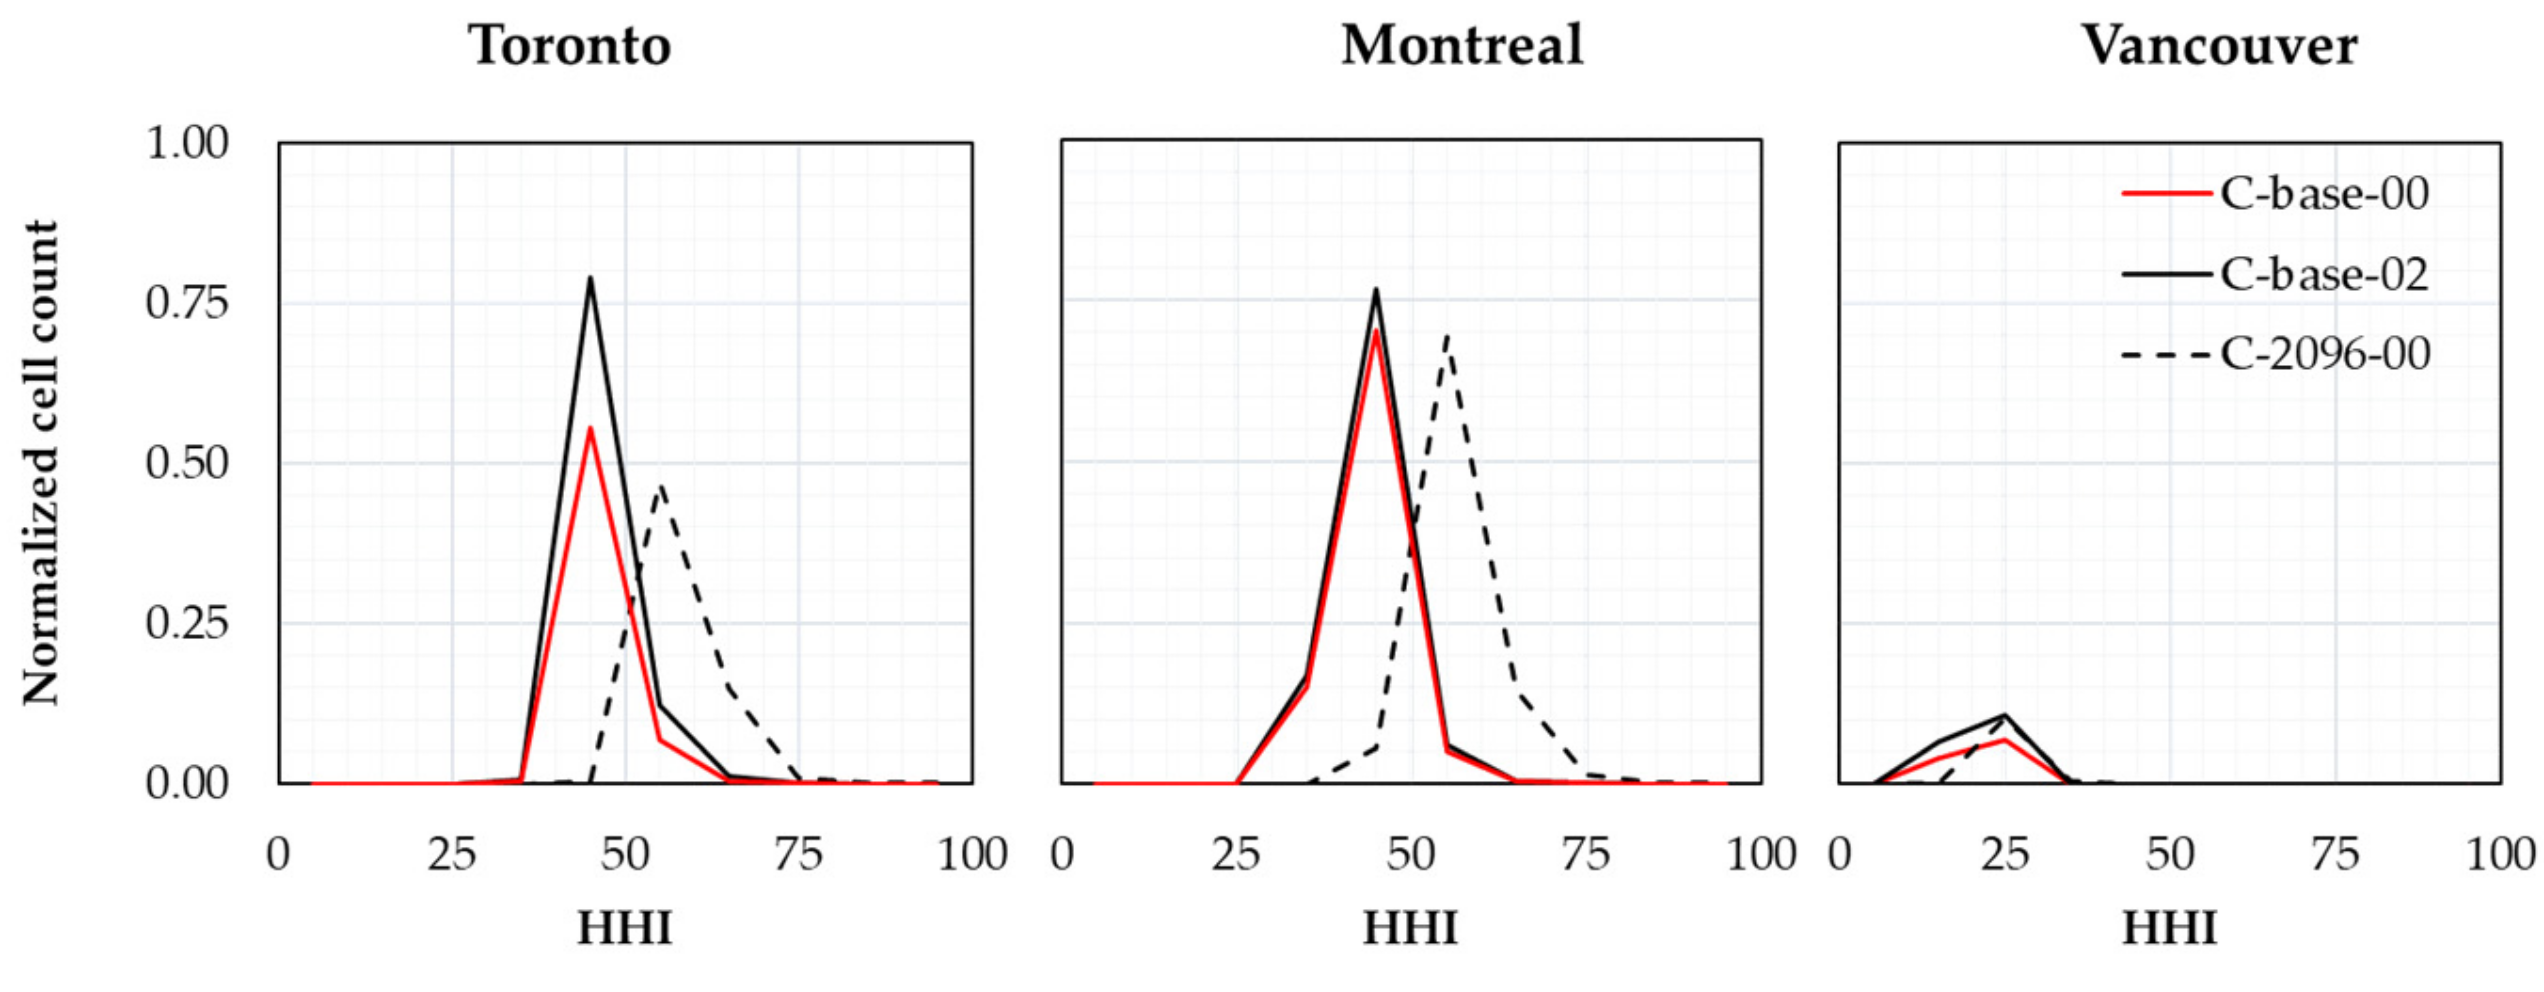
To further investigate the sole effect of urbanization and climate change on each city, the normalized histogram of the worst case climate change scenario (C-2096-00) versus the worst case urbanization scenario (C-base-02) was compared, as presented in Figure 11. As concluded above, in response to the effects of climate change, Toronto and Montreal present an increase of HHI value with a shift of the histograms to the right, whereas this shift is lower in Vancouver. In terms of urbanization, it is evident that in all three cities the frequency of HHI has increased (i.e., higher peaks). As mentioned above, this increase is due to the increase in the number of cells that are generating runoff (non-zero runoff cells).
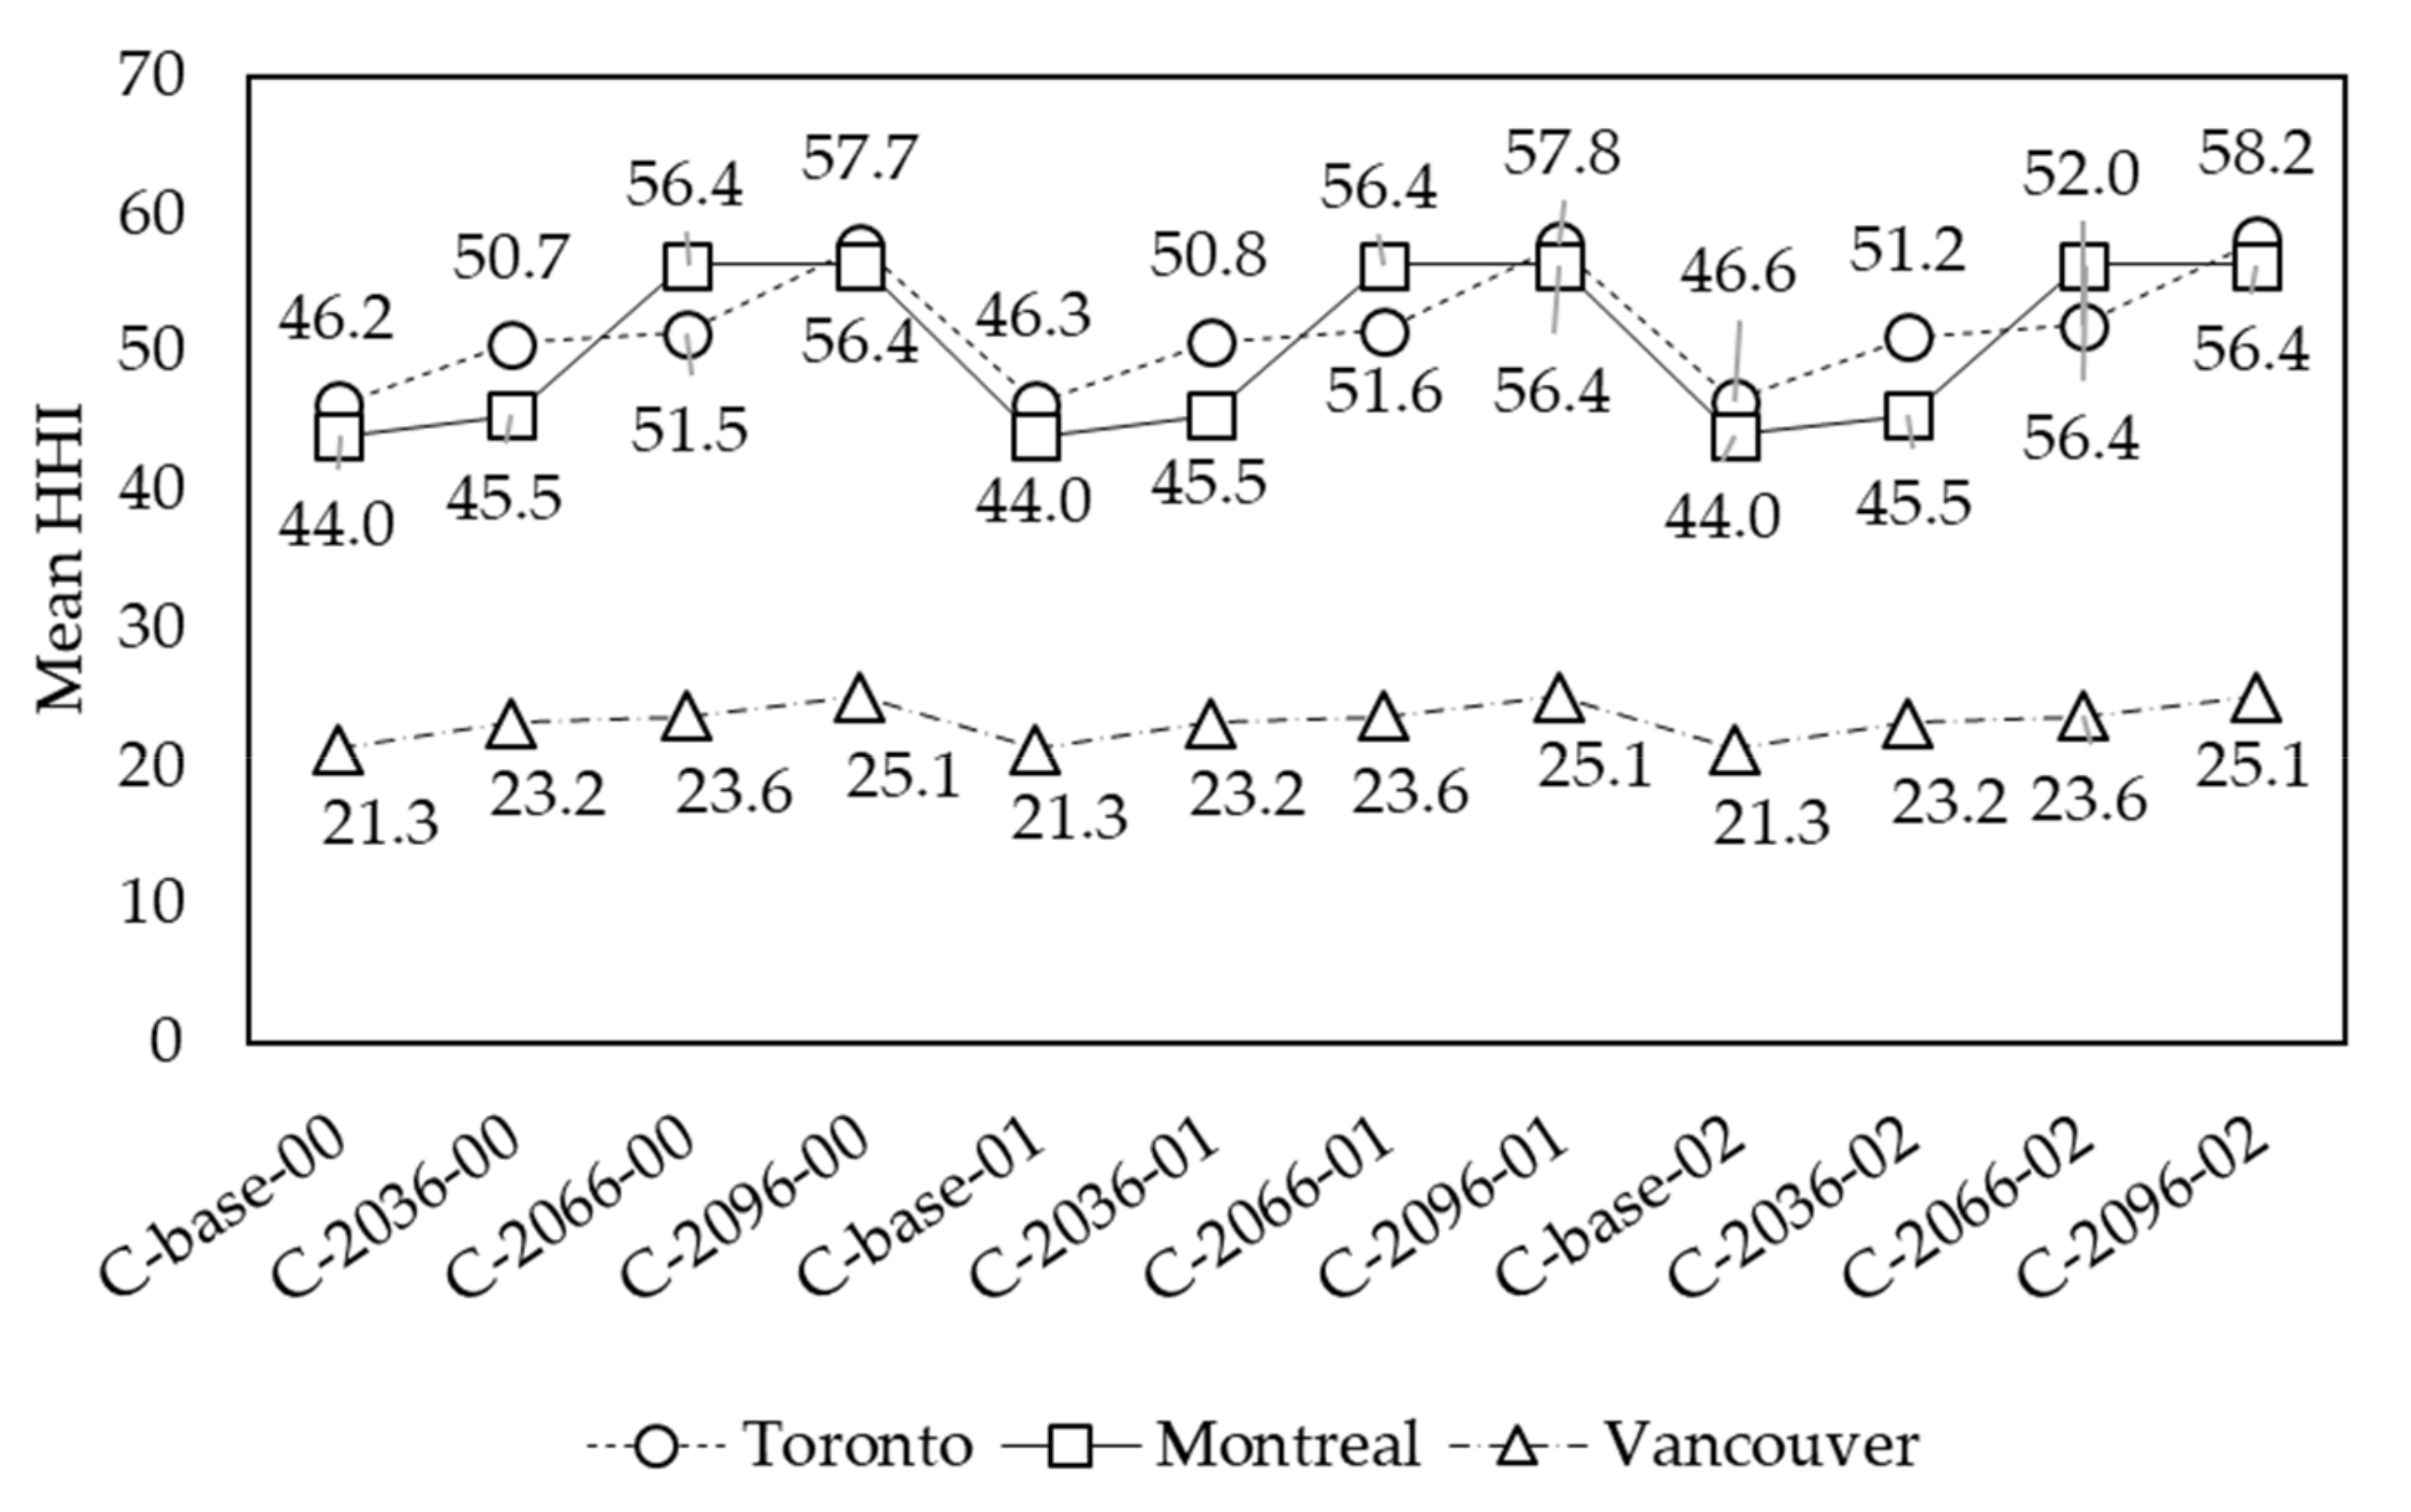
The trend of the mean HHI values for each city for all scenarios was also analyzed and is presented in Figure 12. The base scenario (C-base-00) shows that Toronto has a high HHI with a mean of 46.2. The mean HHI increases to 57.7 (a 24.9% increase) due solely to climate change (C-2096-00) and slightly rises to 46.6 (a 0.9% increase) solely with urbanization (C-base-02). The integrated influence of climate change and urbanization raises HHI to 58.2 (C-2096-02) (a 26.0% increase). These results show that in Toronto the increase in mean HHI is due to climate change rather than urbanization. This is because the city has a high rainfall intensity and the natural soil has low permeability. The consequence of increasing the HHI is that the total area of sites that need LID is increasing (since more sites are generating runoff). In this respect, the AHDS of C-base-00 for this city is 1.4 million cells (0.2% of the city area) and reaches 11.5 million cells (8.4 times higher than the C-base-00) with the change of climate (C-2096-00). On the other hand, the AHDS growth is 78.6% by reaching 2.5 million cells with urbanization (C-base-02). The integrated effect of climate change and urbanization increases AHDS to 16.9 million, which is 12.3 times higher than AHDS of the current state.
Montreal has a mean HHI of 44.0 in the state of the base scenario. This value rises to 56.4 with only climate change (a 28.2% increase) and remains almost unchanged with only urbanization. The integrated effect of climate change and urbanization causes the increase of HHI value to the 56.4 (a 28.2% increase), which reveals the significant and dominant effect of climate change on HHI in Montreal. The highly urbanized land cover of Montreal leaves limited room for more urbanization; thus, the land cover of this city has a limited change in Scenarios 1 and 2. Thus, HHI in Montreal is more sensitive to climate change scenarios rather than urbanization. Regarding AHDS, in the base scenario, Montreal has AHDS of 1.0 million cells, which increases to 15.6 million cells with only climate change and 1.2 million cells with only urbanization. The AHDS for this city rises to 17.1 million cells in the integrated climate change and urbanization scenario.
The mean HHI value for Vancouver at the base scenario is 21.3, and this increases with climate change to 25.1 (a 17.8% increase) and remains unchanged with urbanization. The mean HHI rises to 25.1 (a 17.8%) for the integrated climate change and urbanization scenarios. The AHDS for this city at the current state is 1.2 million cells (0.9% of the city area), which increases to 1.9 million cells (1.6 times higher than the C-base-00) for only climate change scenarios and to 1.9 million cells (1.6 times higher than the C-base-00) for only urbanization scenario. The integrated climate change and urbanization scenario raises AHDS to 3.1 million cells, i.e., 2.5 times higher than the AHDS of the base scenario. The near-equal values of AHDS under the climate and urbanization scenarios indicate that the effect of both factors on HHI is similar. Although the mean HHI of urbanization scenarios remained the same, the increase of frequency of HHI has increased the overall AHDS.
4. Discussions
An overall comparison of the cities reveals the fact that the demand for LID (which is estimated using the HHI) in Toronto and Montreal is relatively similar and is about twice the demand for LID in Vancouver. This growth in demand is represented via AHDS: the AHDS increases from 2.5% to 16.8%, from the base scenario (C-base-00) to the worst-case scenario (C-2096-02), respectively, for all three cities, which indicates that all cities similarly respond to the integrated climate change and urbanization scenarios. The highest growth in AHDS is for Montreal (16.8 times higher than the C-base-00), followed by Toronto (12.3 times higher than the C-base-00), and last Vancouver (2.5 times higher than the C-base-00). The growth in LID demand is also shown in the increase of the mean HHI values, which increased by 26%, 28.2%, and 17.8% in Toronto, Montreal, and Vancouver, respectively. In addition, we showed that the demand for LID highly depends on the rainfall intensity rather than the overall mean annual rainfall. Vancouver, which has the highest mean annual precipitation among the selected cities, has the lowest demand for LID, which is due to its low rainfall intensity.
Generally, we showed that, if we retain the land cover as it is in these three cities, climate change will cause an increase in demand for LID since the runoff generation potential for each city will increase. With climate change only, urbanization only, and an integrated change of both, the three cities showed similar behavior: an increase in HHI, which indicates an increase in runoff generation potential, as has been reported in previous studies [64,65,66,67,68,69,70].
However, the standalone effects of climate change and urbanization were different for these cities. Toronto and Montreal were more sensitive to climate change compared with urbanization, and Vancouver was sensitive to both factors. Thus, depending on the rainfall intensity and the extent of urbanization in the study area the dominance of these two factors varies. Which factor is likely to have a greater influence on runoff generation has been reported in previous studies. Some studies found that urbanization likely exerts a greater impact on runoff than climate change [65,71,72,73], whereas other studies confirmed that climate change impact dominates the urbanization in runoff change [67,69,70]. Our finding is that the key factor is the rainfall intensity. Based on this, climate change dominates urbanization levels wherein the rainfall intensity is high (e.g., Toronto and Montreal) and adversely wherein the rainfall intensity is low (e.g., Vancouver). It is notable that, if the land cover of the study area is already impermeable (such as Toronto and Montreal), the dominance of climate change increases. In this context, the room for further urbanization is limited and climate change is the only factor that can alter the runoff.
In this study, we investigated the effect of poor urbanization by converting pervious land covers to impervious. By poor urbanization, we mean urban development by increasing impervious surfaces without either decreasing imperviousness in other locations or implementing LID. Therefore, for future research, we suggest the study of more city-scale cases such as areas with both high permeability and runoff intensity (which were not included in three case studies) to further investigate the dominance of urbanization and climate change.
In addition, in contrast to the poor urbanization scenarios, a study on smart urban growth [13] is recommended. From the hydrological point of view, smart growth consists of measures such as preventing urban sprawl in future development (e.g., poor urban planning such as designing wide streets) [13] as well as using integrated stormwater management strategies such as LID [74]. Smart growth is related to the early stages of urban planning [74] and strategies that need to be considered for future development. LID techniques, a component of smart growth, can be a solution for both pre- and post-development conditions, i.e., they can be retrofitted into highly urbanized areas or be designed in the initial planning stages of new developments. Cities similar to Montreal that are already highly urbanized have limited options for new developments wherein LID can be installed; however, LID can be retrofitted into existing areas. Retrofitting LID broadly across the city will help reduce the negative impacts of poor urbanization by increasing the overall permeability of the city. Cities such as Toronto, which are not as highly urbanized and have low permeability of the natural soil, have a high demand for LID. Thus, for this city, smart growth for future development as well as retrofitting existing areas with LID are both viable options. For Vancouver, which has a low demand for LID compared to the other two cities, the actual need for LID should be investigated in more detail using detailed design studies and hydrological modeling. However, similar to the other two cities, smart growth is suggested, since there is demand for LID and the impervious land cover in the city is dominant (61% of the city area).
Overall, the future urban growth (increase in the proportion of impervious surfaces) needs to be limited in order to reduce the runoff generation potential, and, hence, the risk of urban floods. Additionally, where possible, the current impervious land cover should be converted to natural, permeable surfaces. The increase in permeability (through the use of LID techniques) will help reduce runoff generation and offset the impacts of urbanization and climate change impacts.
5. Conclusions
In this study, we investigated the effect of climate change and urbanization on urban runoff generation potential using a geospatial framework for three Canadian cities (Toronto, Montreal, and Vancouver). The analysis was performed using a recently developed geospatial index (called HHI) using publicly available data. Four climate change scenarios (base, 2036, 2066, and 2096) and three urbanization scenarios (base land cover, Scenario 1, and Scenario 2) were developed. The HHI was estimated for the three cities for the 12 integrated climate change and urbanization scenarios.
In our study, we showed that climate change increases the mean HHI of the study area while urbanization raises the frequency of HHI. The extent of these changes varied based on the study area. Those with high rainfall intensity (Toronto and Montreal) showed a more significant increase in mean HHI compared with the study area with low rainfall intensity (Vancouver). In addition, the current impermeableness and room for further development within a city affected the extent of increasing the frequency of HHI.
The results agree with previous findings on the influence of climate change and urbanization on increasing the runoff and hence, the demand for LID. However, the magnitude of the effect of climate change and urbanization on the HHI varied in each city, which is also in agreement with results of previous studies. For example, in cities such as Toronto and Montreal with high rainfall intensity and low permeability, climate change is a dominant factor compared with urbanization. This is different from Vancouver that has low rainfall intensity climate change and urbanization level. In this city, HHI is sensitive to both factors. We also concluded that Toronto and Montreal have a higher demand for LID and this increases significantly with climate change and urbanization. Vancouver has a lower demand for LID and a lower rate of HHI change with the scenarios. The results of this study provide us with an insight into the contribution and the effect of climate and urbanization on the demand for LID.
These results, and the proposed methods, can be used in flood management, urban planning and for the sustainable development of cities. It is notable that, in addition to the rainfall and urbanization, HHI accounts for hydraulic conductivity, depth to the groundwater, and depth to the soil restrictive layer such as bedrock. In this study, we only investigated the effect of climate and urbanization on HHI and demand for LID, whereas modification of those parameters (hydraulic conductivity and depth to groundwater) in the future is possible and should also be studied.
Author Contributions
Conceptualization, S.K., U.T.K., and M.A.J.; Data curation, S.K.; Funding acquisition, U.T.K. and M.A.J.; Investigation, S.K.; Methodology, S.K., U.T.K., and M.A.J.; Resources, U.T.K. and M.A.J.; Software, S.K.; Supervision, U.T.K. and M.A.J.; Validation, S.K.; Visualization, S.K.; Writing—original draft, S.K.; and Writing—review and editing, U.T.K. and M.A.J. All authors have read and agreed to the published version of the manuscript.
Funding
This research was funded by the Natural Sciences and Engineering Research Council of Canada and York University.
Acknowledgments
The authors would like to thank the ESRI Inc. for granting the student version of ArcGIS. We would also like to thank York University Libraries for assisting with data collection. Lastly, we would like to thank three anonymous reviewers for their helpful suggestions which have led to an improved manuscript.
Conflicts of Interest
The authors declare no conflict of interest.
References
- The United Nations Office for Disaster Risk Reduction (UNISDR). The Human Costs of Weather Related Disasters 1995–2015; The United Nations Office for Disaster Risk Reduction (UNISDR): Geneva, Switzerland, 2015; pp. 1–30. [Google Scholar]
- Jha, A.K.; Bloch, R.; Lamond, J. Cities and Flooding, A Guide to Integrated Urban Flood Risk Management for the 21st Century; The World Bank: Washington, DC, USA, 2012; ISBN 978-0-8213-8866-2. [Google Scholar]
- Aon Benfield. 2016 Annual Global Climate and Catastrophe Report; Aon Benfield: London, UK, 2016; pp. 1–75. [Google Scholar]
- Berndtsson, R.; Becker, P.; Persson, A.; Aspegren, H.; Haghighatafshar, S.; Jönsson, K.; Larsson, R.; Mobini, S.; Mottaghi, M.; Nilsson, J.; et al. Drivers of changing urban flood risk: A framework for action. J. Environ. Manag. 2019, 240, 47–56. [Google Scholar] [CrossRef]
- Sarma, A.K.; Singh, V.P.; Kartha, S.A.; Bhattacharjya, R.K. Urban Hydrology, Watershed Management and Socio-Economic Aspects; Springer International Publishing: Basel, Switzerland, 2016; ISBN 9783319401942. [Google Scholar]
- Ahiablame, L.; Shakya, R. Modeling flood reduction effects of low impact development at a watershed scale. J. Environ. Manag. 2016, 171, 81–91. [Google Scholar] [CrossRef] [PubMed]
- Bailey, J.F.; Thomas, W.O.; Wetzel, K.L.; Ross, T.J. Estimation of Flood-Frequency Characteristics and the Effects of Urbanization for Streams in the Philadelphia, Pennsylvania Area: U.S. Geological Survey Water-Resources Investigations Report 87-4194; U.S. Geological Survey: Harrisburge, PA, USA, 1989; p. 76. [Google Scholar]
- Brander, K.E.; Owen, K.E.; Potter, K.W. Modeled Impacts of Development Type on Runoff Volume and Infiltration Performance. J. Am. Water Resour. Assoc. 2004, 40, 961–969. [Google Scholar] [CrossRef]
- Hamel, P.; Daly, E.; Fletcher, T.D. Source-Control Stormwater Management for Mitigating the Impacts of Urbanisation on Baseflow: A Review. J. Hydrol. 2013, 485, 201–211. [Google Scholar] [CrossRef]
- Holman-Dodds, J.K.; Bradley, A.A.; Potter, K.W. Evaluation of Hydrologic Benefits of Infiltration Based Urban Storm Water Management. J. Am. Water Resour. Assoc. 2003, 39, 205–215. [Google Scholar] [CrossRef]
- Bakhshipour, A.E.; Dittmer, U.; Haghighi, A.; Nowak, W. Hybrid green-blue-gray decentralized urban drainage systems design, a simulation-optimization framework. J. Environ. Manag. 2019, 249, 109364. [Google Scholar] [CrossRef] [PubMed]
- Dietz, M.E. Low Impact Development Practices: A Review of Current Research and Recommendations for Future Directions. Water Air Soil Pollut. 2007, 186, 351–363. [Google Scholar] [CrossRef]
- McCuen, R.H. Smart Growth: Hydrologic Perspective. J. Prof. Issues Eng. Educ. Pract. 2003, 129, 151–154. [Google Scholar] [CrossRef]
- Coffman, L.S.; Goo, R.; Frederick, R. Low-Impact Development An Innovative Alternative Approach to Stormwater Management. In Proceedings of the 29th Annual Water Resources Planning and Management Conference (WRPMD), Tempe, AZ, USA, 6–9 June 1999; Volume 99, pp. 1–10. [Google Scholar]
- Prince George’s County Maryland. Low-Impact Development Design Strategies An Integrated Design Approach Low-Impact Development: An Integrated Design Approach; Department of Environmental Resources, Programs and Planning Division, Prince George’s County: Prince George’s County, MD, USA, 1999; pp. 1–150. [Google Scholar]
- Heal, K.; Mclean, N.; D’arcy, B. SUDS and Sustainability. In Proceedings of the 26th Meeting of the Standing Conference on Stormwater Source Control, Copenhagen, Denmark, 21–26 August 2004; pp. 1–9. [Google Scholar]
- Fletcher, T.D.; Shuster, W.; Hunt, W.F.; Ashley, R.; Butler, D.; Arthur, S.; Trowsdale, S.; Barraud, S.; Semadeni-Davies, A.; Bertrand-Krajewski, J.-L.; et al. SUDS, LID, BMPs, WSUD and more—The Evolution And Application Of Terminology Surrounding Urban Drainage. Urban Water J. 2015, 12, 525–542. [Google Scholar] [CrossRef]
- Kaykhosravi, S.; Khan, U.; Jadidi, A. A Comprehensive Review of Low Impact Development Models for Research, Conceptual, Preliminary and Detailed Design Applications. Water 2018, 10, 1541. [Google Scholar] [CrossRef] [Green Version]
- Ishaq, S.; Hewage, K.; Farooq, S.; Sadiq, R. State of provincial regulations and guidelines to promote low impact development (LID) alternatives across Canada: Content analysis and comparative assessment. J. Environ. Manag. 2019, 235, 389–402. [Google Scholar] [CrossRef] [PubMed]
- Elliott, A.H.; Trowsdale, S.A. A Review Of Models For Low Impact Urban Stormwater Drainage. Environ. Model. Softw. 2007, 22, 394–405. [Google Scholar] [CrossRef]
- Vogel, J.R.; Moore, T.L.; Coffman, R.R.; Rodie, S.N.; Hutchinson, S.L.; McDonough, K.R.; McLemore, A.J.; McMaine, J.T. Critical Review of Technical Questions Facing Low Impact Development and Green Infrastructure: A Perspective from the Great Plains. Water Environ. Res. 2015, 87, 849–862. [Google Scholar] [CrossRef]
- Johns, C.; Shaheen, F.; Woodhouse, M. Green Infrastructure and Stormwater Management in Toronto: Policy Context and Instruments; Centre for Urban Research and Land Development: Toronto, ON, Canada, 2018; pp. 1–68. [Google Scholar]
- Cheng, M.-S.; Coffman, L.S.; Clar, M.L. Low-Impact Development Hydrologic Analysis. Urban Drain. Model. 2001, 659–681. [Google Scholar] [CrossRef]
- Khan, U.T.; Valeo, C.; Chu, A.; van Duin, B. Bioretention Cell Efficacy In Cold Climates: Part 1—Hydrologic Performance. Can. J. Civ. Eng. 2012, 39, 1210–1221. [Google Scholar] [CrossRef]
- Kaykhosravi, S.; Abogadil, K.; Khan, U.T.; Jadidi, M.A. The Low-Impact Development Demand Index: A New Approach to Identifying Locations for LID. Water 2019, 11, 2341. [Google Scholar] [CrossRef] [Green Version]
- Kuller, M.; Bach, P.M.; Ramirez-Lovering, D.; Deletic, A. Framing water sensitive urban design as part of the urban form: A critical review of tools for best planning practice. Environ. Model. Softw. 2017, 96, 265–282. [Google Scholar] [CrossRef]
- Kuller, M.; Bach, P.M.; Roberts, S.; Browne, D.; Deletic, A. A planning-support tool for spatial suitability assessment of green urban stormwater infrastructure. Sci. Total Environ. 2019, 686, 856–868. [Google Scholar] [CrossRef]
- Liu, L.; Liu, Y.; Wang, X.; Yu, D.; Liu, K.; Huang, H.; Hu, G. Developing an effective 2-D urban flood inundation model for city emergency management based on cellular automata. Nat. Hazards Earth Syst. Sci. 2015, 15, 381–391. [Google Scholar] [CrossRef] [Green Version]
- Esogbue, A.O.; Theologidu, M.; Guo, K. On the application of fuzzy sets theory to the optimal flood control problem arising in water resources systems. Fuzzy Sets Syst. 1992, 48, 155–172. [Google Scholar] [CrossRef]
- Huang, C.; Hsu, N.; Liu, H.; Huang, Y. Optimization of Low Impact Development Layout Designs for Megacity Flood Mitigation. J. Hydrol. 2018, 564, 542–558. [Google Scholar] [CrossRef]
- Haghighatafshar, S.; Yamanee-Nolin, M.; Klinting, A.; Roldin, M.; Gustafsson, L.G.; Aspegren, H.; Jönsson, K. Hydroeconomic optimization of mesoscale blue-green stormwater systems at the city level. J. Hydrol. 2019, 578, 124125. [Google Scholar] [CrossRef]
- Eckart, K.B.C. Multiobjective Optimization of Low Impact Development Stormwater Controls under Climate Change Conditions. Master’s Thesis, University of Windsor, Windsor, ON, Canada, 2015. Volume 562. [Google Scholar]
- Ontario Ministry of Finance. Ontario Population Projections, 2018–2046; Ontario Ministry of Finance: Toronto, ON, Canada, 2019; pp. 3–111. [Google Scholar]
- Government of Canada Climate Data for a Resilient Canada. Available online: https://climatedata.ca/ (accessed on 29 April 2020).
- Institut De La Statistique Du Québec. Forestière Française; Institut De La Statistique Du Québec: Montreal, QC, Canada, 2019; pp. 1–18. [Google Scholar]
- Metrovancouver Metro Vancouver Growth Projections—A Backgrounder. Available online: http://www.metrovancouver.org/services/regional-planning/PlanningPublications/OverviewofMetroVancouversMethodsinProjectingRegionalGrowth.pdf (accessed on 29 April 2020).
- Government of Canada. Available online: https://www.canada.ca/en.html (accessed on 29 April 2020).
- Government of Ontario. Available online: https://www.ontario.ca/page/government-ontario (accessed on 29 April 2020).
- City of Toronto. Available online: https://www.toronto.ca/ (accessed on 29 April 2020).
- City of Montreal National Hydrographic Network (NHN). Available online: http://donnees.ville.montreal.qc.ca/dataset/hydrographie/resource/8d563c07-02e0-4d2d-b1f9-733b132a6c03 (accessed on 29 April 2020).
- Government of Quebec. Available online: http://www.environnement.gouv.qc.ca/index.asp (accessed on 29 April 2020).
- Government of British Columbia. Available online: https://www2.gov.bc.ca/gov/content/home (accessed on 29 April 2020).
- City of Vancouver Open Data Portal. Available online: https://opendata.vancouver.ca/pages/home/ (accessed on 29 April 2020).
- Šraj, M.; Dirnbek, L.; Brilly, M. The Influence Of Effective Rainfall On Modeled Runoff Hydrograph. J. Hydrol. Hydromech. 2010, 58, 3–14. [Google Scholar] [CrossRef] [Green Version]
- Bezak, N.; Šraj, M.; Rusjan, S.; Mikoš, M. Impact of the rainfall duration and temporal rainfall distribution defined using the Huff curves on the hydraulic flood modelling results. Geosciences 2018, 8, 1–15. [Google Scholar] [CrossRef] [Green Version]
- Sikorska, A.E.; Viviroli, D.; Seibert, J. Effective precipitation duration for runoff peaks based on catchment modeling. J. Hydrol. 2018, 556, 510–522. [Google Scholar] [CrossRef]
- City of Toronto. Wet Weather Flow Management Guidelines; City of Toronto: Toronto, ON, Canada, 2006; pp. 1–117. [Google Scholar]
- The City of Edmonton. Low Impact Development Best Management Practices Design Guide Edition 1.1; The City of Edmonton: Edmonton, AB, Canada, 2014; pp. 1–269. [Google Scholar]
- City of Saskatoon. Low Impact Development: Design Guide for Saskatoon Prepared by City of Saskatoon November 2016 Preface; City of Saskatoon: Saskatoon, SK, Canada, 2016; pp. 1–64. [Google Scholar]
- Toronto and Region Conservation for The Living City; Credit Valley Conservation. Low Impact Development Stormwater Management Planning and Design Guide Version 1.0; Toronto and Region Conservation Authority: Toronto, ON, Canada, 2010; pp. 1–300. [Google Scholar]
- Institute for Catastrophic Loss Reduction; Western University Computerized Tool for the Development of Intensity-Duration-Frequency Curves under Climate Change—Version 4.0, IDF_CC Tool 4.0. Available online: https://www.idf-cc-uwo.ca/home.aspx (accessed on 29 April 2020).
- IDF_CC Tool 4.0, Computerized Tool for the Development of Intensity-Duration-Frequency Curves Under a Changing Climate, Technical Manual v.3. Available online: https://www.eng.uwo.ca/research/iclr/fids/publications/products/103.pdf. (accessed on 29 April 2020).
- IDF_CC Tool 4.0, Computerized Tool for the Development of Intensity-Duration-Frequency Curves Under a Changing Climate, User’s Manual v.3. Available online: https://www.eng.uwo.ca/research/iclr/fids/publications/products/104.pdf. (accessed on 29 April 2020).
- van Vuuren, D.P.; Edmonds, J.; Kainuma, M.; Riahi, K.; Thomson, A.; Hibbard, K.; Hurtt, G.C.; Kram, T.; Krey, V.; Lamarque, J.F.; et al. The representative concentration pathways: An overview. Clim. Chang. 2011, 109, 5–31. [Google Scholar] [CrossRef]
- Coulibaly, P.; Burn, D.H.; Switzman, H.; Henderson, J.; Fausto, E. A Comparison of Future IDF Curves for Southern Ontario Addendum—IDF Statistics, Curves and Equations; Toronto and Region Conservation Authority (TRCA); Essex Region Conservation Authority (ERCA): Toronto, Canada, 2016; pp. 1–244. [Google Scholar]
- Climate Change (2050) Adjusted IDF Curves: Metro Vancouver Climate Stations; BGS Engineering Inc.: Vancouver, BC, Canada, 2009; pp. 1–36.
- Jadidi, A.; Mostafavi, M.; Bédard, Y.; Shahriari, K. Spatial Representation of Coastal Risk: A Fuzzy Approach to Deal with Uncertainty. ISPRS Int. J. Geo-Inf. 2014, 3, 1077–1100. [Google Scholar] [CrossRef]
- Li, X.; Gong, P. Urban growth models: Progress and perspective. Sci. Bull. 2016, 61, 1637–1650. [Google Scholar] [CrossRef]
- Metro Vancouver Metro Vancouver Open Data. Available online: http://www.metrovancouver.org/data (accessed on 29 April 2020).
- Chabaeva, A.; Civco, D.; Prisloe, S. Development of a population density and land use based regression model to calculate the amount of imperviousness. In Proceedings of the 2004 ASPRS Annual Convention Denver, Denver, CO, USA, 23–28 May 2004; p. 9. [Google Scholar]
- Huang, H.; Cheng, S.; Wen, J.; Lee, J. Effect of growing watershed imperviousness on hydrograph parameters and peak discharge. Hydrol. Process. 2007, 22, 2075–2085. [Google Scholar] [CrossRef]
- Ontario Ministry of Finance. Ontario Population Projections, 2018–2046: Based on the 2016 Census, for Ontario and Its 49 Census Divisions; Ontario Ministry of Finance: Toronto, ON, Canada, 2019; pp. 1–109. [Google Scholar]
- Ministry of Northern Development and Mines. Province of Ontario’s Ministry of Northern Development and Mines (MNDM). Available online: http://www.geologyontario.mndm.gov.on.ca/mndmfiles/pub/data/imaging/P2204/p2204.pdf (accessed on 29 April 2020).
- Yin, J.; He, F.; Jiu Xiong, Y.; Yu Qiu, G. Effects of land use/land cover and climate changes on surface runoff in a semi-humid and semi-arid transition zone in northwest China. Hydrol. Earth Syst. Sci. 2017, 21, 183–196. [Google Scholar] [CrossRef] [Green Version]
- Zhou, Q.; Leng, G.; Su, J.; Ren, Y. Comparison of urbanization and climate change impacts on urban flood volumes: Importance of urban planning and drainage adaptation. Sci. Total Environ. 2019, 658, 24–33. [Google Scholar] [CrossRef] [PubMed]
- Zhang, Y.; Xia, J.; Yu, J.; Randall, M.; Zhang, Y.; Zhao, T.; Pan, X.; Zhai, X.; Shao, Q. Simulation and assessment of urbanization impacts on runoff metrics: Insights from landuse changes. J. Hydrol. 2018, 560, 247–258. [Google Scholar] [CrossRef]
- Zhou, Y.; Lai, C.; Wang, Z.; Chen, X.; Zeng, Z.; Chen, J.; Bai, X. Quantitative evaluation of the impact of climate change and human activity on runoff change in the Dongjiang River Basin, China. Water (Switzerland) 2018, 10, 571. [Google Scholar] [CrossRef] [Green Version]
- Al-Zahrani, M.A. Assessing the impacts of rainfall intensity and urbanization on storm runoff in an arid catchment. Arab. J. Geosci. 2018, 11, 208. [Google Scholar] [CrossRef]
- Yang, W.; Long, D.; Bai, P. Impacts of future land cover and climate changes on runoff in the mostly afforested river basin in North China. J. Hydrol. 2019, 570, 201–219. [Google Scholar] [CrossRef]
- Arnone, E.; Pumo, D.; Francipane, A.; La Loggia, G.; Noto, L.V. The role of urban growth, climate change, and their interplay in altering runoff extremes. Hydrol. Process. 2018, 32, 1755–1770. [Google Scholar] [CrossRef]
- Wang, M.; Zhang, D.Q.; Su, J.; Trzcinski, A.P.; Dong, J.W.; Tan, S.K. Future Scenarios Modeling of Urban Stormwater Management Response to Impacts of Climate Change and Urbanization. Clean Soil Air Water 2017, 45, 1700111. [Google Scholar] [CrossRef] [Green Version]
- Wang, M.; Zhang, D.; Adhityan, A.; Ng, W.J.; Dong, J.; Tan, S.K. Assessing cost-effectiveness of bioretention on stormwater in response to climate change and urbanization for future scenarios. J. Hydrol. 2016, 543, 423–432. [Google Scholar] [CrossRef]
- Gao, C.; Ruan, T. The influence of climate change and human activities on runoff in the middle reaches of the Huaihe River Basin, China. J. Geogr. Sci. 2018, 28, 79–92. [Google Scholar] [CrossRef] [Green Version]
- Ahiablame, L.M.; Engel, B.A.; Chaubey, I. Effectiveness of low impact development practices: Literature review and suggestions for future research. Water Air Soil Pollut. 2012, 223, 4253–4273. [Google Scholar] [CrossRef]
Figure 1.
The location of the three case-study cities within Canada showing three land cover categories: (a) Toronto; (b) Montreal; and (c) Vancouver.
Figure 1.
The location of the three case-study cities within Canada showing three land cover categories: (a) Toronto; (b) Montreal; and (c) Vancouver.

Figure 2.
Comparison of rainfall intensity (for the 60 min duration and 10-year RP event) for the three cities in selected years.
Figure 2.
Comparison of rainfall intensity (for the 60 min duration and 10-year RP event) for the three cities in selected years.

Figure 3.
Normalized ratio of impervious area to the city area (water bodies excluded) for Toronto, Montreal, and Vancouver.
Figure 3.
Normalized ratio of impervious area to the city area (water bodies excluded) for Toronto, Montreal, and Vancouver.

Figure 4.
Normalized (to the maximum overall cell count of the three cities) histogram of HHI of comparing the current state (C-base-00) and the worst-case scenario (C-2096-02) among Toronto, Montreal, and Vancouver.
Figure 4.
Normalized (to the maximum overall cell count of the three cities) histogram of HHI of comparing the current state (C-base-00) and the worst-case scenario (C-2096-02) among Toronto, Montreal, and Vancouver.

Figure 5.
The HHI maps for Toronto under different climate (base year, 2036, 2066, and 2096) and land cover scenarios (base, Scenario 1, and Scenario 2).
Figure 5.
The HHI maps for Toronto under different climate (base year, 2036, 2066, and 2096) and land cover scenarios (base, Scenario 1, and Scenario 2).

Figure 6.
The HHI maps for Montreal under different climate (base year, 2036, 2066, and 2096) and land cover scenarios (base, Scenario 1, and Scenario 2).
Figure 6.
The HHI maps for Montreal under different climate (base year, 2036, 2066, and 2096) and land cover scenarios (base, Scenario 1, and Scenario 2).

Figure 7.
The HHI maps for Vancouver under different climate (base year, 2036, 2066, and 2096) and land cover scenarios (base, Scenario 1, and Scenario 2).
Figure 7.
The HHI maps for Vancouver under different climate (base year, 2036, 2066, and 2096) and land cover scenarios (base, Scenario 1, and Scenario 2).

Figure 8.
Normalized histograms of HHI (to the maximum HHI frequency of the cities) comparing the same urbanization scenarios (base, Scenario 1, and Scenario 2) and different Climate scenarios (base, 2036, 2066, and 2096) for: (a) Toronto; (b) Montreal; and (c) Vancouver.
Figure 8.
Normalized histograms of HHI (to the maximum HHI frequency of the cities) comparing the same urbanization scenarios (base, Scenario 1, and Scenario 2) and different Climate scenarios (base, 2036, 2066, and 2096) for: (a) Toronto; (b) Montreal; and (c) Vancouver.

Figure 9.
Normalized histograms of HHI (to the maximum HHI frequency of the cities) comparing the same climate scenarios (base, 2036, 2066, and 2096) and different urbanization scenarios (base, Scenario 1, and Scenario 2) for: (a) Toronto; (b) Montreal; and (c) Vancouver.
Figure 9.
Normalized histograms of HHI (to the maximum HHI frequency of the cities) comparing the same climate scenarios (base, 2036, 2066, and 2096) and different urbanization scenarios (base, Scenario 1, and Scenario 2) for: (a) Toronto; (b) Montreal; and (c) Vancouver.

Figure 10.
The total count of cells with HHI greater than the mean HHI for Toronto, Montreal, and Vancouver.
Figure 10.
The total count of cells with HHI greater than the mean HHI for Toronto, Montreal, and Vancouver.

Figure 11.
Normalized histograms of HHI (to the maximum count of three cities) of base scenario (C-base-00), the worst case of only the climate change scenario (C-2096-00) and the worst case of only urbanization (C-base-02) for the three cities (Toronto, Montreal, and Vancouver).
Figure 11.
Normalized histograms of HHI (to the maximum count of three cities) of base scenario (C-base-00), the worst case of only the climate change scenario (C-2096-00) and the worst case of only urbanization (C-base-02) for the three cities (Toronto, Montreal, and Vancouver).

Figure 12.
Comparing the trend of mean HHI of all twelve scenarios in Toronto, Montreal, and Vancouver.
Figure 12.
Comparing the trend of mean HHI of all twelve scenarios in Toronto, Montreal, and Vancouver.


Table 1.
Projected rainfall intensity for Toronto for Scenarios 2036, 2066, and 2096 [51,55], 60 min duration, and 10-year RP. The coordinates are in NAD_1983_UTM_Zone_17N.
| ID | Station Name | Historical Data Range | Coordinates | Rainfall Intensity (mm/h) | ||||
|---|---|---|---|---|---|---|---|---|
| X (m) | Y (m) | Historical | 2036 | 2066 | 2096 | |||
| 1 | Oshawa WPCP | 1970–2006 | 674,358.9 | 4,859,722 | 32.17 | 35.00 | 35.45 | 42.12 |
| 2 | Toronto City | 1940–2007 | 628,988.2 | 4,836,464 | 39.12 | 43.54 | 43.59 | 49.43 |
| 3 | Toronto-INTL A | 1950–2017 | 610,427.6 | 4,837,243 | 38.12 | 42.06 | 42.99 | 47.39 |
| 4 | Toronto Buttonville A | 1986–2007 | 630,991.4 | 4,857,614 | 37.50 | 39.56 | 39.94 | 45.49 |
| 5 | Oakville Southeast | 1965–1976 | 610,793.8 | 4,815,031 | 32.33 | 35.70 | 36.48 | 40.10 |
| 6 | Etobicoke | 1964–1980 | 618,586.5 | 4,831,829 | 36.05 | 39.77 | 40.09 | 45.12 |
| 7 | Toronto Met Res Stn | 1966–1987 | 616,643.0 | 4,850,681 | 36.91 | 40.62 | 41.62 | 45.96 |
Table 2.
Projected rainfall intensity for Montreal for Scenarios 2036, 2066, and 2096, 60 min duration [51], and 10-year RP. The coordinates are in NAD_1983_UTM_Zone_18N.
Table 2.
Projected rainfall intensity for Montreal for Scenarios 2036, 2066, and 2096, 60 min duration [51], and 10-year RP. The coordinates are in NAD_1983_UTM_Zone_18N.
| ID | Station Name | Historical Data Range | Coordinates | Rainfall Intensity (mm/h) | ||||
|---|---|---|---|---|---|---|---|---|
| X (m) | Y (m) | Historical | 2036 | 2066 | 2096 | |||
| 1 | McGill | 1906–1992 | 609,377.3 | 5,039,448 | 42.20 | 45.70 | 55.45 | 55.70 |
| 2 | Mirabel Int. A. | 1976–2008 | 575,554.5 | 5,057,840 | 32.41 | 33.70 | 40.93 | 41.58 |
| 3 | P. E. T. Int. A. | 1943–2014 | 598,491.9 | 5,035,934 | 34.90 | 36.66 | 45.37 | 45.66 |
| 4 | St Hubert A. | 1956–1995 | 623,396.3 | 5,041,931 | 34.60 | 36.42 | 44.99 | 44.81 |
| 5 | Jean Brebeuf | 1969–1984 | 609,377.3 | 5,039,448 | 32.50 | 33.91 | 41.70 | 42.14 |
| 6 | Lafontaine | 1973–1991 | 609,338.6 | 5,041,670 | 32.35 | 33.46 | 41.63 | 41.99 |
| 7 | Jar Bot | 1977–1989 | 613,143.1 | 5,047,295 | 39.35 | 39.54 | 50.80 | 49.64 |
| 8 | Valleyfield | 1986–1998 | 570,587.7 | 5,014,450 | 32.61 | 34.99 | 41.20 | 41.62 |
| 9 | L’Assomption | 1963–2017 | 621,983.8 | 5,074,136 | 36.28 | 38.29 | 47.44 | 47.43 |
Table 3.
Projected rainfall intensity for Vancouver for Scenarios 2036, 2066, and 2096 [51,56], 60 min duration, and 10-year RP. The coordinates are in NAD_1983_UTM_Zone_10N.
| ID | Station Name | Historical Data Range | Coordinates | Rainfall Intensity (mm/h) | ||||
|---|---|---|---|---|---|---|---|---|
| X (m) | Y (m) | Historical | 2036 | 2066 | 2096 | |||
| 1 | UBC | 1958–1990 | 481,806.10 | 5,455,276 | 14.35 | 14.98 | 15.60 | 16.84 |
| 2 | Lynn Creek | 1964–1983 | 497,822.00 | 5,468,587 | 19.89 | 21.05 | 21.94 | 23.65 |
| 3 | Ladner Bchpa | 1963–1978 | 503,651.30 | 5,436,349 | 11.02 | 11.68 | 11.99 | 13.04 |
| 4 | Surrey Kwantlen Park | 1962–1999 | 510,200.90 | 5,448,586 | 15.79 | 16.59 | 17.27 | 18.53 |
| 5 | Buntzen Lake | 1969–1983 | 509,436.00 | 5,469,707 | 21.30 | 22.35 | 23.43 | 25.03 |
Table 4.
Land cover data of Toronto at the year 2007 and its projected changes due to the urban growth for two scenarios.
Table 4.
Land cover data of Toronto at the year 2007 and its projected changes due to the urban growth for two scenarios.
| ID | Land Cover | Area (km2) | Base | Scenario 1 | Scenario 2 |
|---|---|---|---|---|---|
| 1 | Buildings | 103 | impervious | impervious | impervious |
| 2 | Roads | 79.8 | impervious | impervious | impervious |
| 3 | Paved surfaces | 108 | impervious | impervious | impervious |
| 4 | Tree canopy | 179.2 | pervious | pervious | impervious |
| 5 | Grass shrub | 149.4 | pervious | impervious | impervious |
| 6 | Agriculture | 6.2 | pervious | impervious | impervious |
| 7 | Bare earth | 4.1 | pervious | impervious | impervious |
| 8 | Water bodies | 3.8 | - | - | - |
| Total | 633.5 | ||||
| Added impervious | 0 | 82.4 1 | 139 1 | ||
| Total impervious | 290.7 | 373.1 | 429.7 | ||
| Total pervious | 338.9 | 256.6 | 200.4 | ||
| PIR | 1.17 | 0.69 | 0.47 | ||
1 Pervious lands within a buffer of 500 m from the streams were not converted to impervious.
Table 5.
Land cover data of Montreal at the year 2016 and its projected changes due to the urban growth for two scenarios.
Table 5.
Land cover data of Montreal at the year 2016 and its projected changes due to the urban growth for two scenarios.
| ID | Land Cover | Area (ha) | Base | Scenario 1 | Scenario 2 |
|---|---|---|---|---|---|
| 1 | Buildings | 264.6 | impervious | impervious | impervious |
| 2 | Roads | 103.5 | impervious | impervious | impervious |
| 3 | Paved surfaces | 47 | impervious | impervious | impervious |
| 4 | Parks and open spaces | 41.1 | pervious | pervious | impervious |
| 5 | Golf | 12.5 | pervious | impervious | impervious |
| 6 | Agriculture | 6.1 | pervious | impervious | impervious |
| 7 | Bare earth | 25.3 | pervious | impervious | impervious |
| 8 | Water bodies | 124.5 | - | - | - |
| Total | 624.6 | ||||
| Added impervious | 0 | 19.5 1 | 41.1 1 | ||
| Total impervious | 415.1 | 434.6 | 456.2 | ||
| Total pervious | 85.1 | 65.3 | 43.8 | ||
| PIR | 0.21 | 0.15 | 0.10 | ||
1 Pervious lands within a buffer of 500 m from the streams were not converted to impervious.
Table 6.
Land cover data of Vancouver at the year 2014 [59] and its projected changes due to the urban growth for Scenario 1.
Table 6.
Land cover data of Vancouver at the year 2014 [59] and its projected changes due to the urban growth for Scenario 1.
| ID | Land Cover | Area (ha) | Base | Scenario 1 | Scenario 2 |
|---|---|---|---|---|---|
| 1 | Buildings | 37.5 | impervious | impervious | impervious |
| 2 | Other Built | 0.1 | impervious | impervious | impervious |
| 3 | Paved | 33.3 | impervious | impervious | impervious |
| 4 | Coniferous | 6 | pervious | pervious | impervious |
| 5 | Deciduous | 21.8 | pervious | pervious | impervious |
| 6 | Barren | 1.9 | pervious | pervious | impervious |
| 7 | Shrub | 0.7 | pervious | impervious | impervious |
| 8 | Shadow (considered as shrub) | 1.5 | pervious | pervious | impervious |
| 9 | Modified Grass-herb | 13 | pervious | impervious | impervious |
| 10 | Natural Grass-herb | 0.2 | pervious | impervious | impervious |
| 11 | Non-photosynthetic vegetation | 0.1 | pervious | pervious | impervious |
| 12 | Soil | 0.3 | pervious | pervious | impervious |
| 13 | Water | 20.1 | - | - | - |
| Total | 136.5 | ||||
| Added impervious | 0 | 13.8 | 34.3 1 | ||
| Total impervious | 71 | 84.8 | 105.3 | ||
| Total pervious | 45.4 | 31.6 | 11.1 | ||
| PIR | 0.64 | 0.37 | 0.11 | ||
1 Pervious lands within a buffer of 500 m from the streams were not converted to impervious.
Table 7.
The projected population for Toronto, Montreal, and Vancouver scenarios 2036, 2066, and 2096 [35,36,62].
| Scenario | |||||
|---|---|---|---|---|---|
| Base | 2036 | 2066 | 2096 | ||
| Population (million) | Toronto | 2.40 2 (year 2007) | 3.81 1 | 5.10 2 | 6.47 2 |
| Montreal | 1.96 3 (year 2016) | 2.27 1 | 2.702 | 3.14 2 | |
| Vancouver | 2.42 3 (year 2014) | 3.40 1 | 4.35 2 | 5.47 2 | |
1 Based on projected data. 2 Estimated using a linear function. 3 Based on available historical data.
Table 8.
Land cover data of Toronto, Montreal, and Vancouver on the base year (2007, 2016, and 2014, respectively for each city) and its projected changes due to the urban growth in years 2030, 2066, and 2096.
Table 8.
Land cover data of Toronto, Montreal, and Vancouver on the base year (2007, 2016, and 2014, respectively for each city) and its projected changes due to the urban growth in years 2030, 2066, and 2096.
| Base | 2036 | 2066 | 2096 | ||
|---|---|---|---|---|---|
| Toronto | ARIL (km2) | 0.0 | 170.8 | 327.2 | 493.1 |
| Total impervious (km2) | 290.7 | 461.5 | 788.6 | 1281.7 | |
| Total pervious area (km2) | 338.9 | 168.1 | −159.0 | −652.1 | |
| Montreal | ARIL (km2) | 0 | 60.08 | 143.61 | 228.89 |
| Total impervious (km2) | 379.86 | 439.94 | 583.55 | 812.44 | |
| Total pervious area (km2) | 120.13 | 60 | −84 | −312 | |
| Vancouver | ARIL (km2) | 0 | 28.75 | 56.62 | 89.51 |
| Total impervious (km2) | 71 | 99.75 | 156.38 | 245.89 | |
| Total pervious area (km2) | 45.4 | 17 | −40 | −129 |
Table 9.
The 12 combinations of climate change and urbanization scenarios.
| Climate Change | |||||
|---|---|---|---|---|---|
| Base Year | Sc 2036 | Sc 2066 | Sc 2096 | ||
| Urbanization Scenarios | Sc00 (base land cover) | C-base-00 | C-2036-00 | C-2066-00 | C-2096-00 |
| Sc01 (medium urbanized) | C-base-01 | C-2036-01 | C-2066-01 | C-2096-01 | |
| Sc02 (highly urbanized) | C-base-02 | C-2036-02 | C-2066-02 | C-2096-02 | |
© 2020 by the authors. Licensee MDPI, Basel, Switzerland. This article is an open access article distributed under the terms and conditions of the Creative Commons Attribution (CC BY) license (http://creativecommons.org/licenses/by/4.0/).
Share and Cite
MDPI and ACS Style
Kaykhosravi, S.; Khan, U.T.; Jadidi, M.A. The Effect of Climate Change and Urbanization on the Demand for Low Impact Development for Three Canadian Cities. Water 2020, 12, 1280. https://doi.org/10.3390/w12051280
AMA Style
Kaykhosravi S, Khan UT, Jadidi MA. The Effect of Climate Change and Urbanization on the Demand for Low Impact Development for Three Canadian Cities. Water. 2020; 12(5):1280. https://doi.org/10.3390/w12051280
Chicago/Turabian StyleKaykhosravi, Sarah, Usman T. Khan, and Mojgan A. Jadidi. 2020. "The Effect of Climate Change and Urbanization on the Demand for Low Impact Development for Three Canadian Cities" Water 12, no. 5: 1280. https://doi.org/10.3390/w12051280
Note that from the first issue of 2016, this journal uses article numbers instead of page numbers. See further details here.