Spatial Differentiation and Multiannual Dynamics of Water Conductivity in Lakes of the Suwałki Landscape Park

1
Department of Limnology, Institute of Geography, University of Gdańsk, Bażyńskiego 4, 80-309 Gdańsk, Poland
2
Limnological Station in Borucino, Institute of Geography, University of Gdańsk, 83-323 Kamienica Szlachecka, Poland
*
Author to whom correspondence should be addressed.
Water 2020, 12(5), 1277; https://doi.org/10.3390/w12051277
Submission received: 27 February 2020
/
Revised: 23 April 2020
/
Accepted: 27 April 2020
/
Published: 30 April 2020
(This article belongs to the Special Issue Processes Influencing Water Quality in Surface Catchments in the Context of the Local and Global Distribution of Pollutants)
Abstract
:Water conductivity in 23 lakes of the Suwałki Landscape Park (SLP) was tested in the years 2012–2014. Conductivity profiles were made at the deepest place every two months between spring and autumn water mixing. The collected measurement data, supplemented with historical data, were used to identify factors that shape the spatial variability of water conductivity and to reconstruct its multiannual changes. The range of variability of the mean conductivity of surface water of the SLP lakes ranged from 178 to 522 µS cm−1. The strong negative relationship between conductivity and lake elevation (R = 0.816, p < 0.000) suggests that in the territorially compact complex of the SLP lakes, conductivity is a consequence of the location of the lake in the catchment, which, in turn, affects the structure of its water supply. However, the physical and environmental parameters of the catchment and morphometric parameters of lake basins are of secondary importance. In dimictic lakes and in those showing signs of “spring meromixis”, the magnitude of conductivity differences in the water column is determined by the lakes’ susceptibility to wind mixing expressed by the exposure index value. The developed climate models have also shown that conductivity, an indicator of water quality, is very sensitive to climate change. The analysis of the reconstructed chronological conductivity sequences shows that the deterioration of the quality of the waters of the SLP lakes first occurred at the beginning of the 21st century and a clear increasing trend has been maintained over the last decade.
1. Introduction
Electrical conductivity (EC), also called specific conductance (SEC) or simply conductivity (COND), is easily measurable. Thus, in limnological practice, it is one of the more useful and commonly used parameters of water quality assessment. Conductivity is widely used for calculating water salinity [1,2] and estimating total dissolved solids (TDS) in different water types [3,4,5]. In addition, Håkanson shows that the variability of conductivity (coefficient of variation) between lakes is 3.6 times greater than its variability within individual lakes [6]. The ratio of CVINTER to CVINTRA calculated for conductivity turns out to be the highest among all analysed water quality parameters. Therefore, the above premises allow conductivity to be considered as the most conservative measure of water quality.
In streams and rivers, conductivity is primarily a function of the catchment geology, its size, and flow [7]. In lakes, catchment features also play a dominant role in shaping its value [6]. However, since the conductivity of lake waters is the effect of complex streams of the inflow of inorganic dissolved matter from the catchment (underground inflow, river inflow, surface runoff, precipitation), it remains in a genetic relationship with the structure of the water balance of lakes. Thus, it is a convenient indicator for identifying the main water supply sources of lakes [8,9,10,11,12]. In natural conditions, low conductivity values are represented by endorheic lakes fed mainly by rainfall. An increase in the catchment area and the connection of lakes with a river network causes conductivity to increase. On the other hand, in Poland, the highest conductivity is characteristic for coastal lakes having a dynamic connection with the sea [13,14].
Furthermore, conductivity measurements are applied in studies of seawater intrusions into coastal aquifers [15] and lakes [16], genetic dissection of the flow hydrograph [17,18,19], natural precipitation of calcium from epilimnion [20], and dilution of sewage and pollutants in receiver reservoirs [21].
Conductivity changes are most often the first visible symptoms of deterioration in the ecological status of water systems, affecting both overall water quality and aquatic organisms [22,23]. Thus, conductivity is used in monitoring studies as an indicator of general inorganic pollution of the water system (catchment pressure), and sometimes as an auxiliary indicator of the advancement of cultural eutrophication [24,25,26,27].
Previous studies of the conductivity of lake waters in Poland were comparative, showing only interregional differentiation of this water quality parameter [12,26,28,29]. Attempts to explain the reasons for existing differences or trends in multiannual changes were sporadic and showed a generally high degree of generality [28,29].
Bearing the above in mind and using historical and the authors’ own results of water conductivity measurements from 2012–2014, collected during comprehensive studies of the lakes of the Suwałki Landscape Park (SLP), the following was undertaken: (i) explanation of the impact of physical and environmental parameters of the catchment on water conductivity, (ii) identification of the main factors affecting its spatial variability, (iii) reconstruction of multiannual changes in the territorially compact lake grouping, and (iv) assessment of the potential impact of currently observed climate changes on the water quality of future aquatic ecosystems.
2. Materials and Methods
2.1. Research Area
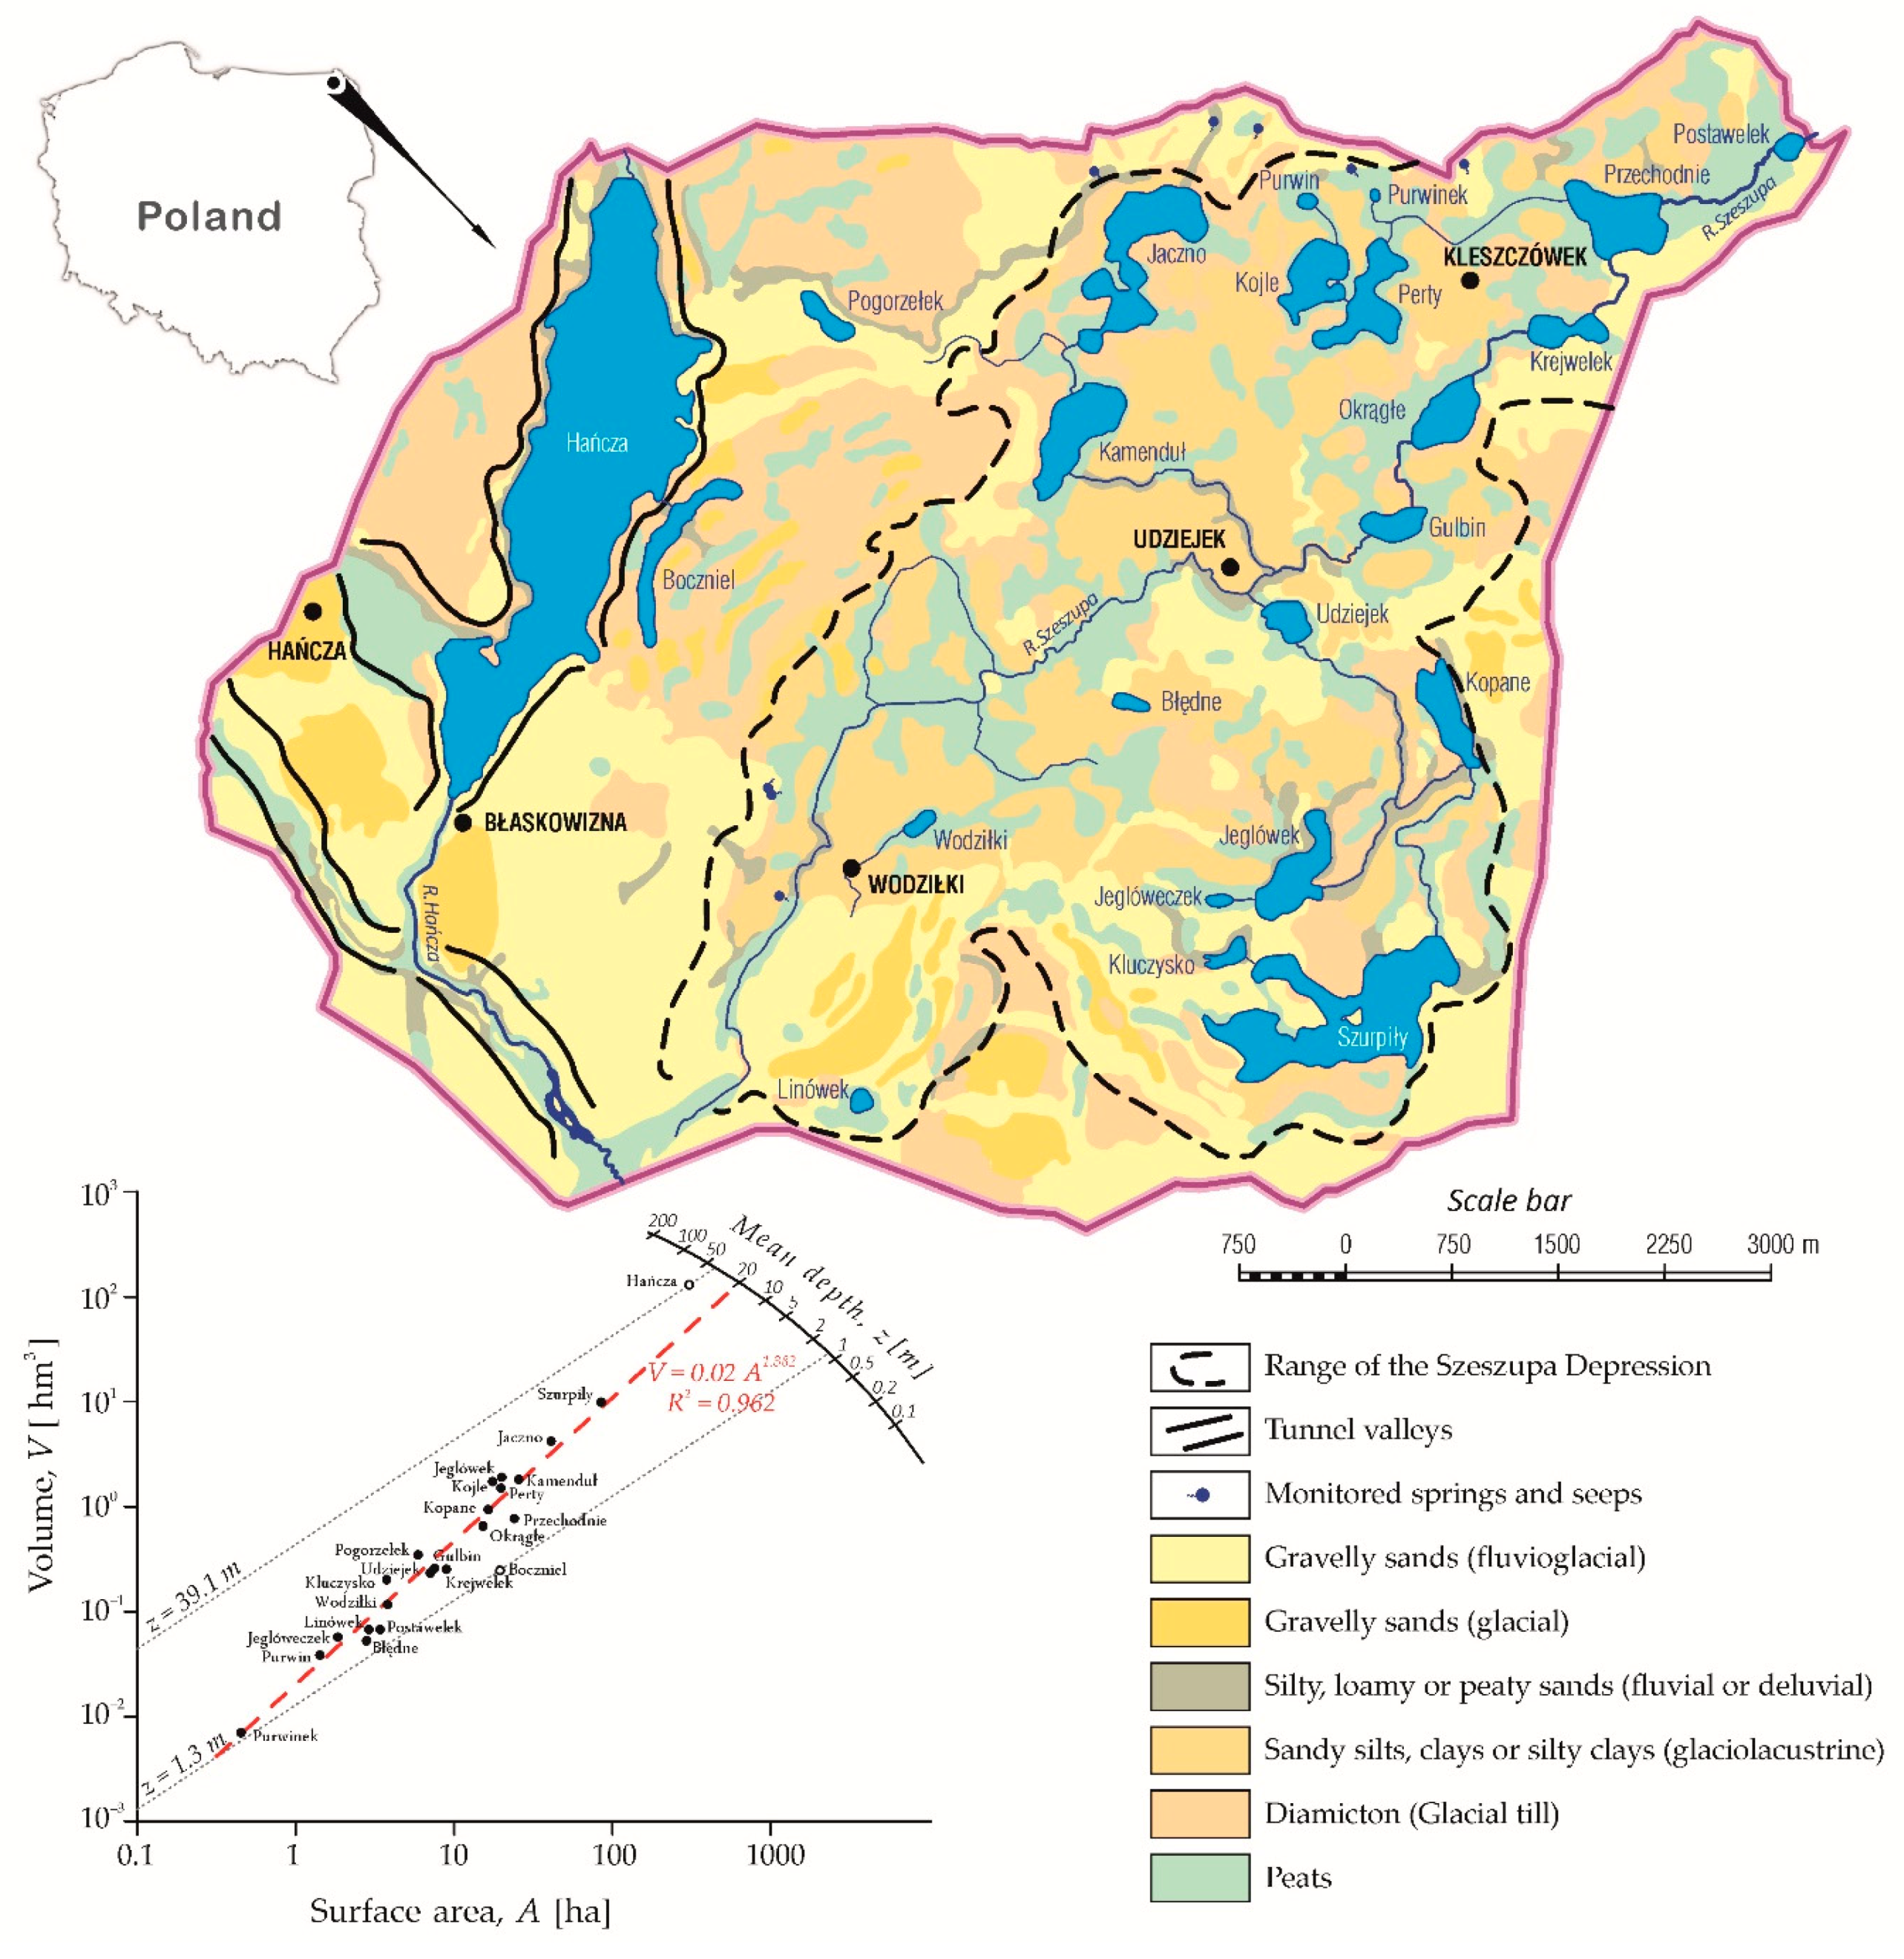
The study covered 23 lakes forming a compact complex within the borders of the Suwałki Landscape Park (SLP). The surface area of the park is 62.8 km2. It is located in the western part of the East Suwałki Lakeland mesoregion, which is a fragment of the Lithuanian Lakeland macroregion. This area represents agricultural landscape (60% is arable land) with a distinct hilly terrain (elevation differences up to 130 m), diverse geology, and variable conditions of underground and surface runoff [30,31]. The numerous springs and seepage areas found in the slopes and at the foot of the moraine plateaus play an essential role in the water circulation in this area. Pleistocene sediments from the Weichselian Glaciation dominate in the surface rock formations. These consist of tills, fluvioglacial sands, and gravels as well as lacustrine-glacial clays. Holocene sediments are represented by peat and sands of fluvial and deluvial accumulation (Figure 1).
In terms of climate regionalisation of Poland, the SLP belongs to the Masurian-Podlachian region [32] and is located on its northernmost edge. It is the coldest region of lowland Poland due to harsher and longer winters (100–120 days). The average annual air temperature is 6.6 °C (range: 4.4–8.8), and the annual precipitation is 600 mm (range: 394–856). On average, the growing season lasts about 200 days.
In terms of hydrography, the area includes the catchments of the upper reaches of the Szeszupa and Czarna Hańcza rivers, which are tributaries of the Nemunas. The Szeszupa drains an extensive (about 50 km2) glacitectonic depression surrounded by terminal moraines [33], while the Czarna Hańcza uses a narrow and very deep subglacial channel. The uneven distribution of lakes is a manifestation of the morphogenetic differences between the two hydrographic units. Most of them are located in the Szeszupa catchment (the so-called Kleszczówek group). The Kleszczówek lakes show significant similarity in morphometric features due to their similar genesis (Figure 1). These are mainly lakes occupying depressions formed after dead ice blocks had melted out. The Hańcza lakes are represented only by two extremely different reservoirs, Hańcza and Boczniel. Lake Hańcza occupies a former subglacial channel, while Lake Boczniel—A shallow depression between terminal moraines.
2.2. Field Measurements
Water quality monitoring in the Suwałki lakes was carried out in the years 2012–2014. Each annual series began at the end of the spring homothermal phase (April/May), within about 2–3 weeks of the disappearance of the ice cover. Measurements continued until October/November at two-month intervals. Vertical profiles of conductivity and chlorophyll a, as well as temperature, dissolved oxygen, and pH were made on-site using the YSI EXO 2 multi-parameter probe. Measuring stations were located in the deepest parts of the lakes. Water transparency (Secchi depth) was also measured as standard.
In spring and summer, lake water samples were taken from the surface layer (1 m below the surface) and the bottom layer (1 m above the bottom) for further laboratory determinations of basic anions (HCO3−, SO42−, Cl−) and cations (Ca2+, Mg2+, Na+, K+).
Lake monitoring was supplemented by non-cyclical measurements of the conductivity and water temperature of springs flowing from the slopes of the Szeszupa Depression. The measurements included eight springs and seeps, for which a total of 26 conductivity measurements were collected.
In addition, flow rates were measured at the lake outflows. On larger watercourses, the German OTT Nautilus velocity sensor was used. For small, often periodic watercourses, a 30-degree Thomson V-notch weir was used.
2.3. Laboratory Analyses
Water for the determination of basic ionic composition, with a volume of 1 L, was collected in the field in polyethylene containers. Samples were not preserved during sampling. Until the determinations were carried out they were stored in the dark at 4 °C. Chemical analyses were performed no later than seven days after sampling.
Determination of metals, sulphates, and chlorides was performed by ion chromatography (Dionex DX-500 IC System). Bicarbonates were determined by titration with concentrated hydrochloric acid in the presence of methyl orange as an indicator. The sample volume used for the analysis was 100 mL.
2.4. Archival Data
In order to reconstruct the old values of water conductivity of the SLP lakes, historical data of water chemical analyses were used [35,36,37] and statistical relationships established on the basis of the measurements binding conductivity with bicarbonate concentrations. All results (historical and contemporary) of the water conductivity measurements of the lakes and springs were standardised to the reference temperature, t = 25 °C.
In the modelling of the multiannual trends in conductivity changes, the results of climate parameter measurements (temperature, precipitation) were used. They were made available by the Institute of Meteorology and Water Management-National Research Institute (IMGW-PIB) as public data available at https://dane.imgw.pl/data/dane_pomiarowo_observational/.
2.5. Statistical Analysis
Statistical analysis was performed using the STATISTICA software package ver. 5.5 (Statsoft. Inc., Tulsa, OK, USA). Basic descriptive statistics (mean, median, skewness, distribution normality) were used for the general characteristics of the measurement data set. Statistical relationships between conductivity and physical and environmental parameters of the catchment were determined using multiple regression methods and nonlinear estimation (power function, quasi-Newton estimation).
When comparing two sets of the conductivity data grouped by year of measurements, the non-parametric Mann–Whitney test was used. However, the Kruskal–Wallis test was used while comparing more than two sets. These tests were used to assess the differences between the means from the past and present observation sets.
3. Results
3.1. Changes in Surface Water Conductivity
The values of the average multiannual conductivity in the surface layer in the SLP lakes ranged from 178 to 522 µS cm−1. The lowest conductivity was recorded in lakes Boczniel and Pogorzełek located on the moraine plateau in the watershed zone of the Czarna Hańcza and Szeszupa (Table 2). These lakes, together with Lake Hańcza, form a group of lakes located at the highest elevations. The ordinates of their water levels lie at an elevation exceeding 225 m a.s.l. Both lakes have one of the smallest total catchments, which are 0.64 and 1.24 km2 for Lake Pogorzełek and Lake Boczniel, respectively. In the latter, the lowest conductivity in the entire study period was found to be 155 µS cm−1 (June 2012).
The highest conductivity was recorded in the waters of Lake Purwinek, the only lake in which the average multiannual conductivity exceeded 500 µS cm−1. The absolute maximum conductivity in this lake was as much as 574 µS cm−1 (March 2013). Periodically, conductivity greater than 500 µS cm−1 was recorded in three other lakes: Gulbin (504 µS cm−1), Purwin (530 µS cm−1) and Wodziłki (541 µS cm−1).
Average multiannual conductivity below 200 µS cm−1 was observed in only two lakes, and in the next three (Hańcza, Linówek, Jeglóweczek) it was in the range of 200–300 µS cm−1. The most numerous community (43.5%) included lakes with water conductivity ranging from 401 to 500 µS cm−1. In six lakes it ranged from 301 to 400 µS cm−1.
During the spring holomixis, surface water conductivity values were higher than those in the mid-summer from 9 (Pogorzełek) to 66 µS cm−1 (Kluczysko); on average it was 32 µS cm−1 (Table 2).
The largest conductivity stability over the long term, expressed by the coefficient of variation, was found in the largest lakes in the SLP, such as Hańcza (CVINTRA = 0.48), Jaczno (0.51) and Szurpiły (0.53). The most varied were lakes Kluczysko (0.114) and Boczniel (0.109). The average value within the lake conductivity variability in the entire study group was CVINTRA = 0.072.
Inter-lake conductivity variation (CVINTER) was much larger, ranging from 0.248 (March 2014) to 0.265 µS cm−1 (November 1013). In average conditions it was 0.255 µS cm−1. Therefore, the ratio between inter- to intra-lake variability was 3.54. This value was almost identical to the one calculated by Håkanson [6].
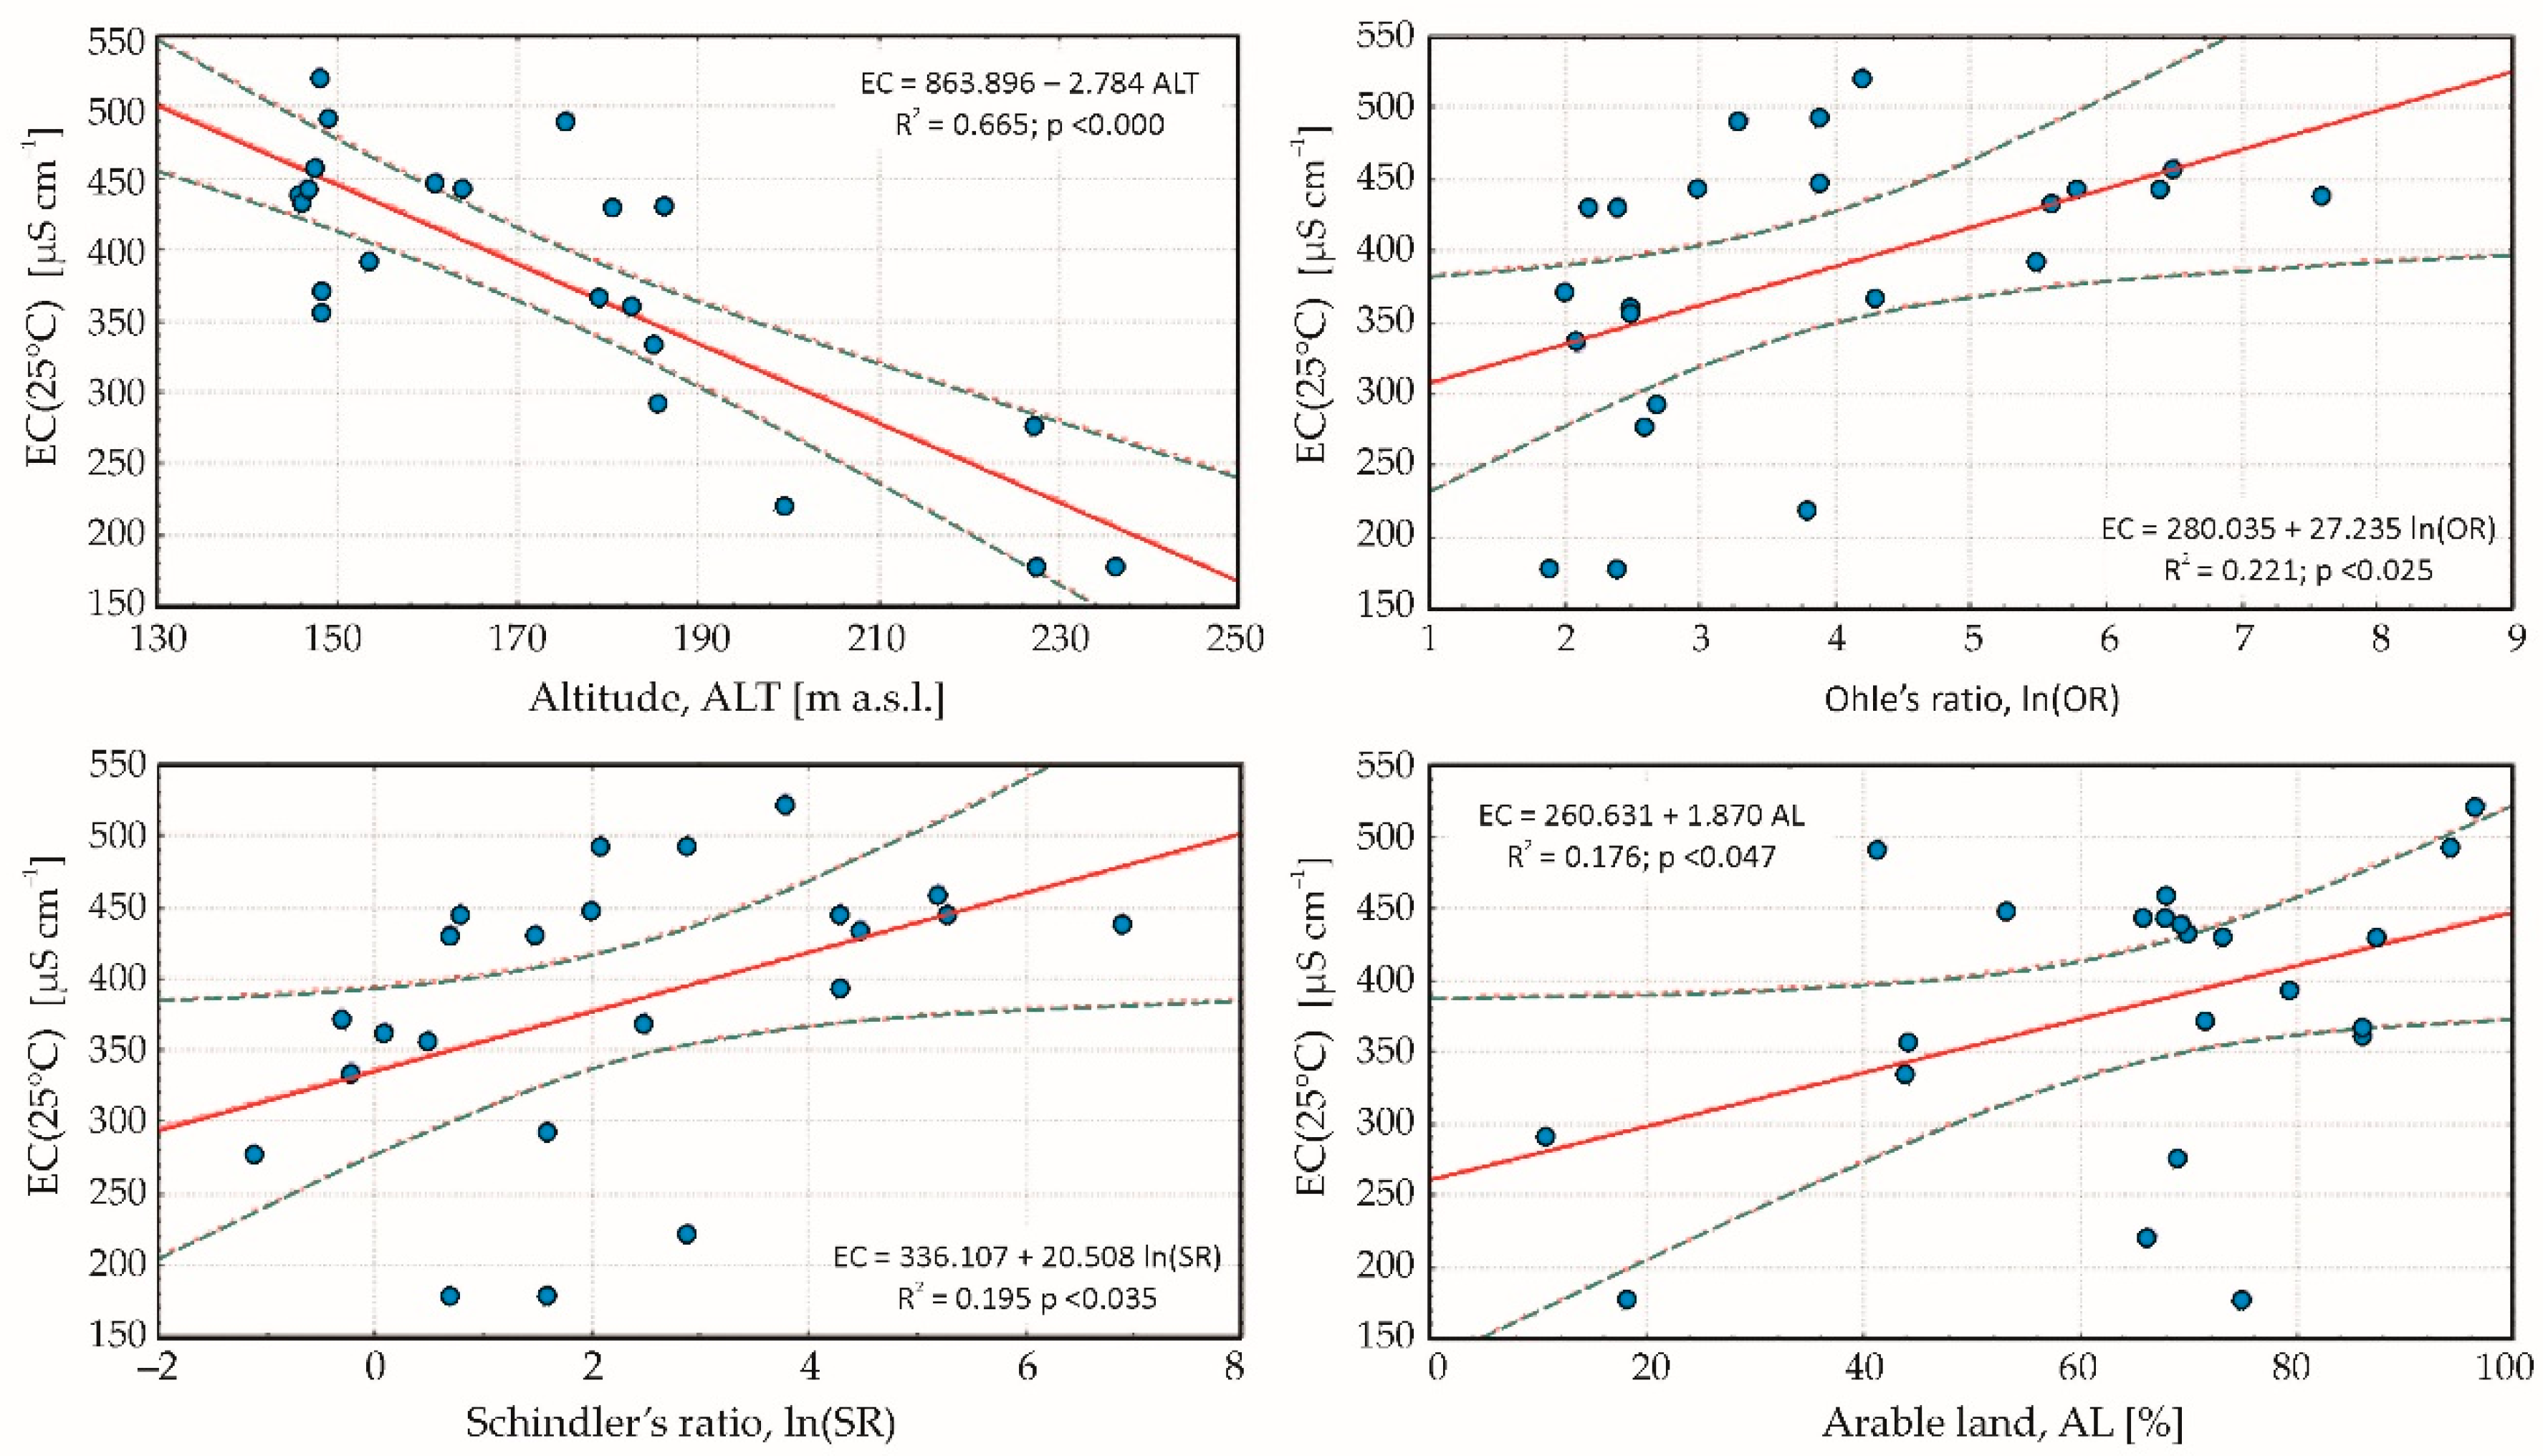
The statistical analysis showed that the main factor affecting the diversity of water conductivity of the studied lakes is the lake’s elevation. This relationship is described by a strong negative linear regression (R2 = 0.665, p < 0.000). Thus, higher positioned lakes have a generally lower conductivity than those positioned lower in the basin (Figure 2). On the other hand, parameters such as the Ohle ratio (quotient of the catchment area to the lake surface), the Schindler ratio (quotient of the catchment area to the lake volume) and the percentage share of arable land in the catchment area have a smaller impact on conductivity differentiation (Figure 2).
Multiple regression analyses showed that the variation in water conductivity of the SLP lakes up to nearly 70% can be explained by only two parameters, i.e., the elevation of the lake (ALT in m a.s.l.) and the share of arable land in its total catchment (AL in percentages). This relationship is described by the following equation: EC25 = 778.265 − 2.591 ALT + 0.797 AL (R2 = 0.694; p < 0.000).
3.2. Changes in the Conductivity of Bottom Waters
Average conductivity of the bottom waters of the lakes ranged from 190 to 1943 µS cm−1. The highest conductivity was characteristic of the waters of the meromictic Lake Jeglóweczek, in which below the 5 m isobath a layer of chemolimnion accumulated, gathering 9.9% of the lake’s waters. Conductivity gradients in the chemocline were 501–712 µS cm−1 m−1.
Conductivity in the range of 501–600 µS cm−1 was observed in 8 lakes. Conductivity gradients of 30–100 µS cm−1 m−1 (Figure 3) were often observed in the bottom layer of these lakes at the end of the mixing period, and dissolved oxygen concentrations indicated anoxia conditions (<1–2 mg O2 L−1). At that time, in completely mixed lakes, dissolved oxygen concentrations at the bottom exceeded 9.0 mg O2 L−1. Thus, in Lake Hańcza it was 10.3–12.0 mg O2 L−1, in Lake Szurpiły 10.5–10.8 mg O2 L−1, and in Lake Kamenduł 9.4–10.6 mg O2 L−1.
Lakes with conductivity ranging from 401 to 500 µS cm−1 dominated. The conductivity classes of 301–400 and 201–300 µS cm−1 had two representatives. Only in Lake Boczniel, whose water balance was limited mainly to atmospheric exchange, was conductivity less than 200 µS cm−1.
Intra-lake variability of the conductivity of bottom waters was only slightly higher than for surface waters. Coefficients of variation (CVINTRA) ranged from 0.030 to 0.164 µS cm−1 (mean 0.080, median 0.75). The main factor affecting changes in the conductivity of the bottom waters was lake morphometry, in particular: relative depth (R2 = 0.43, p < 0.001) and maximum depth (R2 = 0.23, p < 0.03). Lakes with greater depths (relative and maximum) generally showed less variability of conductivity in the multiannual and seasonal cycles.
3.3. Conductivity Changes in the Water Column
The maximum absolute differences in conductivity in the water column were on average 131 µS cm−1. During summer stagnation, the vertical differences in conductivity were slightly larger and were expressed by changes up to 143 µS cm−1 (Table 2). In percentage terms, the relative differences (expressed as the ratio of the maximum difference in conductivity in the water column to the conductivity above the bottom) were 25.5 and 28.2%, respectively. The maximum vertical water stratification was observed in the meromictic Lake Jeglóweczek, in which in mid-summer the absolute differences in conductivity were as much as 1666 µS cm−1 (85.0%). The following lakes also had very high changes in conductivity: Kluczysko—184 µS cm−1 (32.1%), Jeglówek—176 µS cm−1 (35.0%), Jaczno—130 µS cm−1 (23.4%), Okrągłe—116 µS cm−1 (21.6%), Pogorzełek—111 µS cm−1 (39.1%) and Krejwelek—110 µS cm−1 (20.8%).
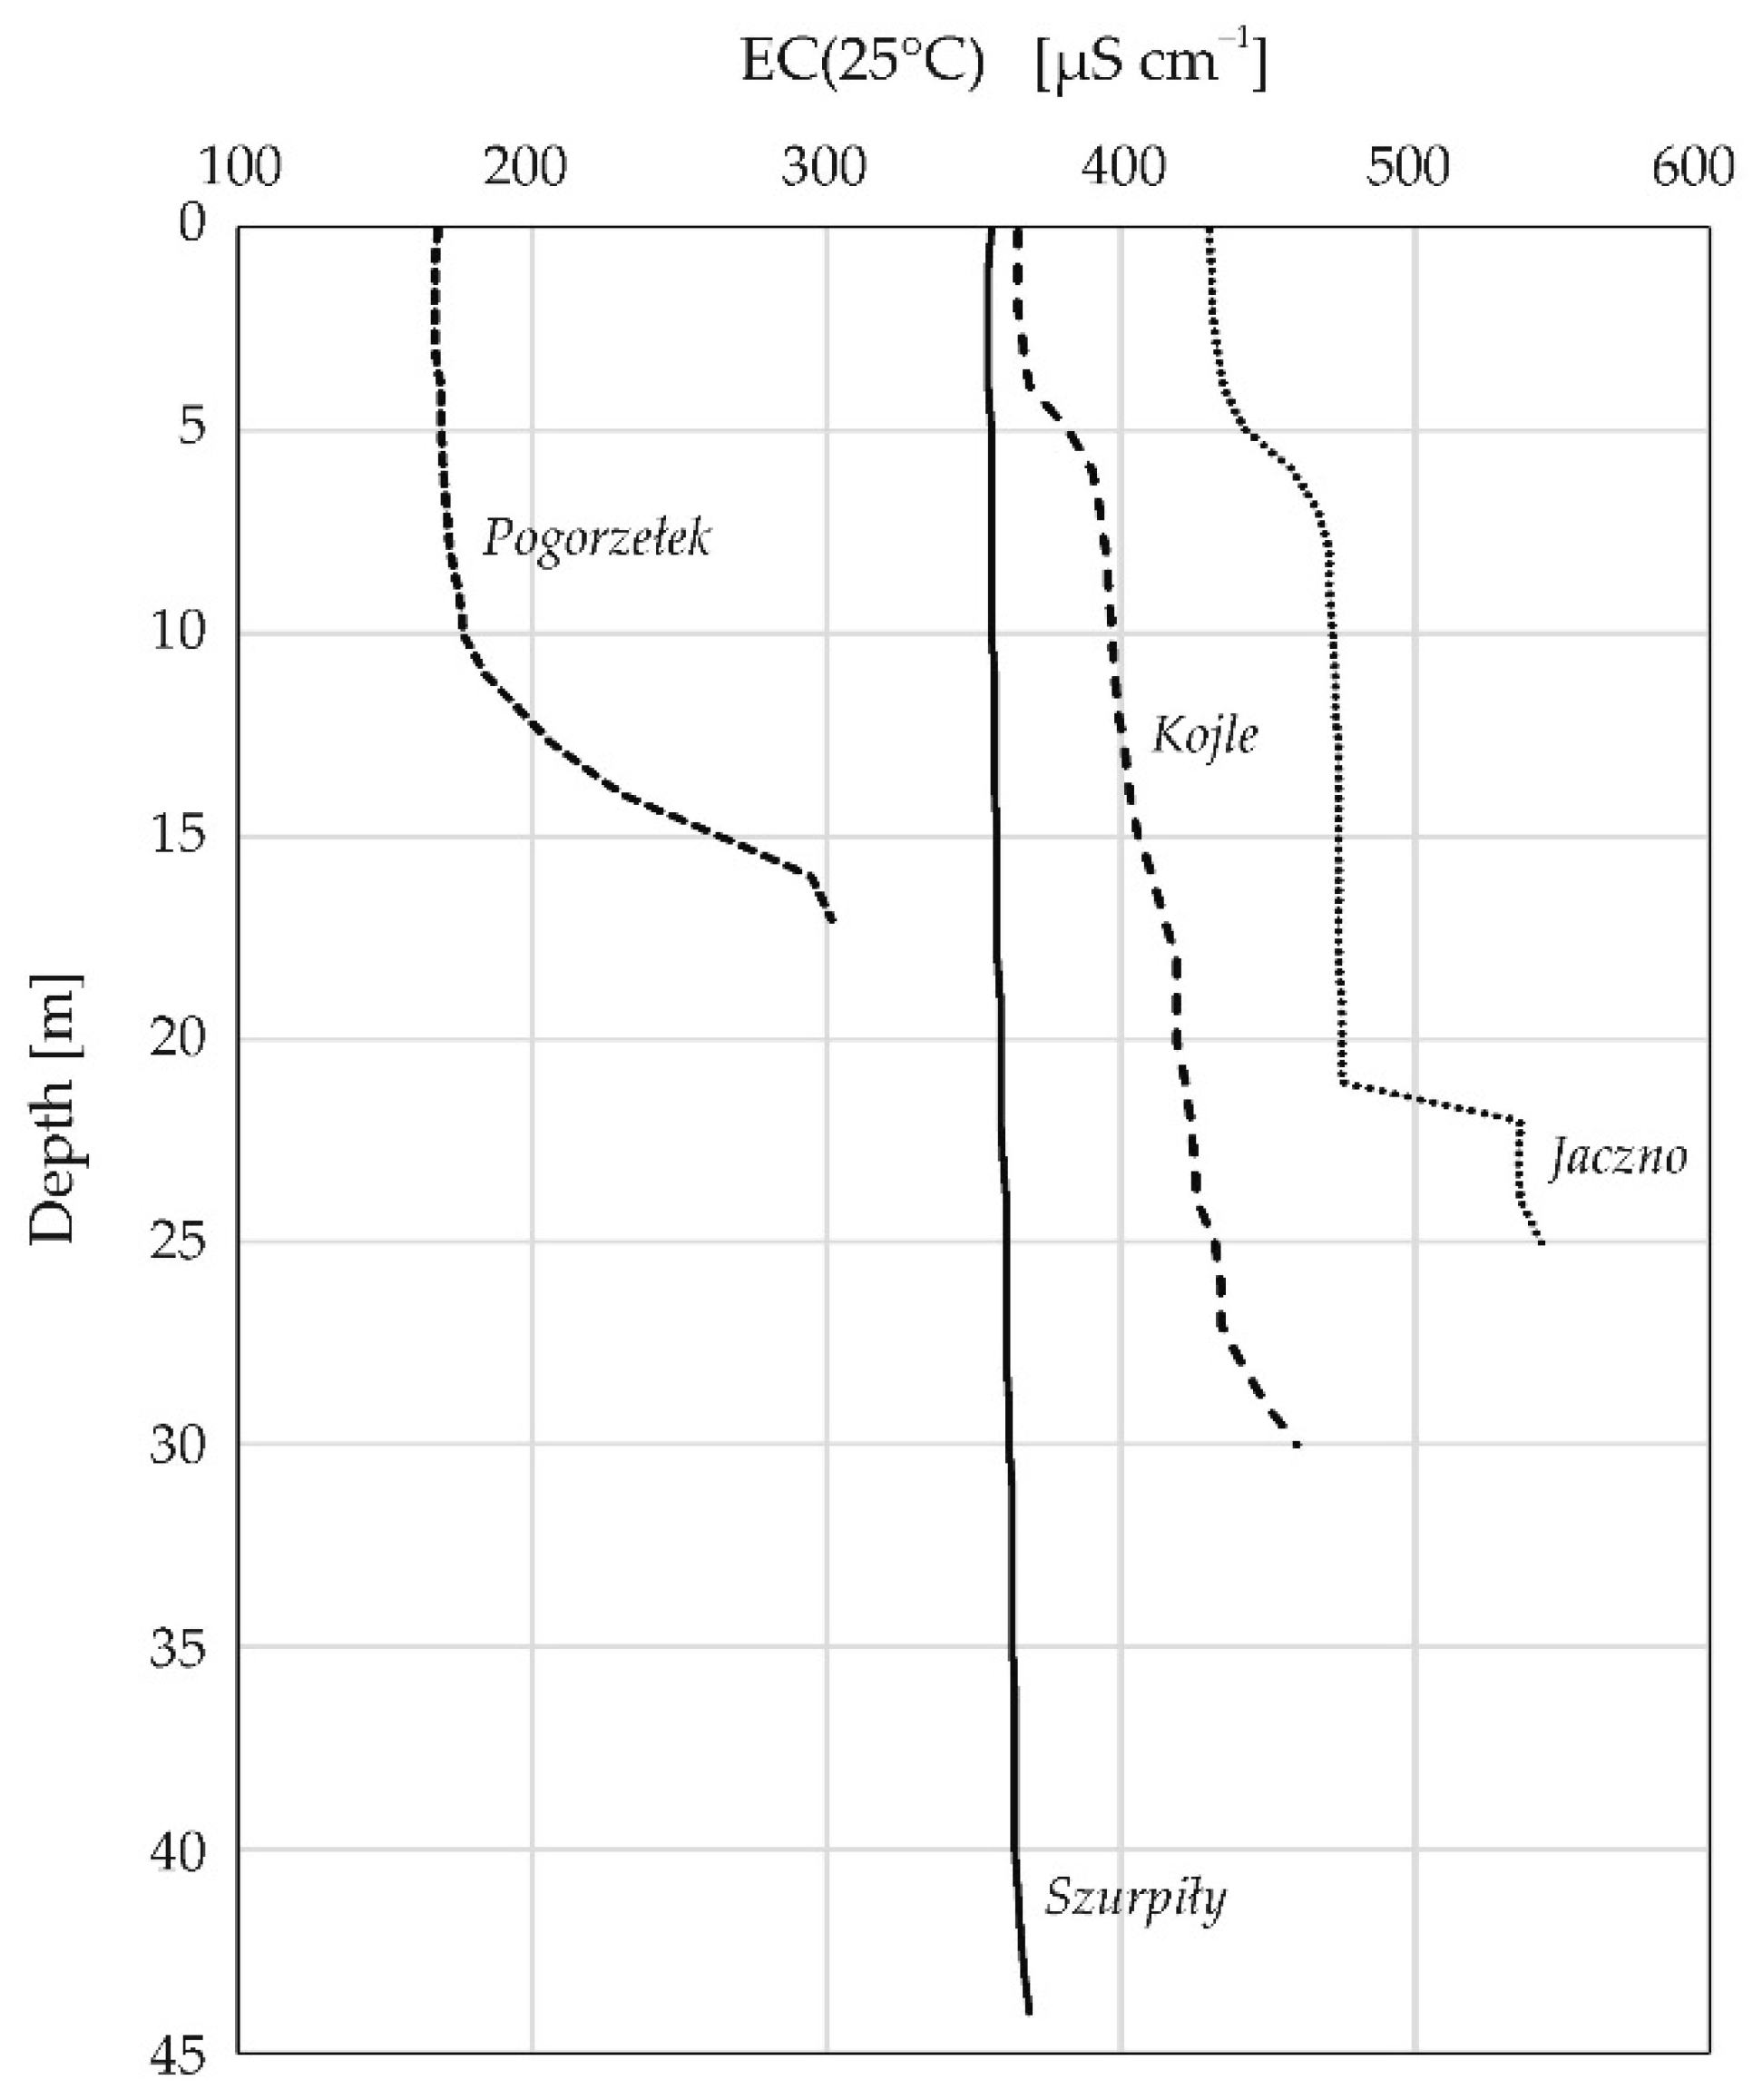
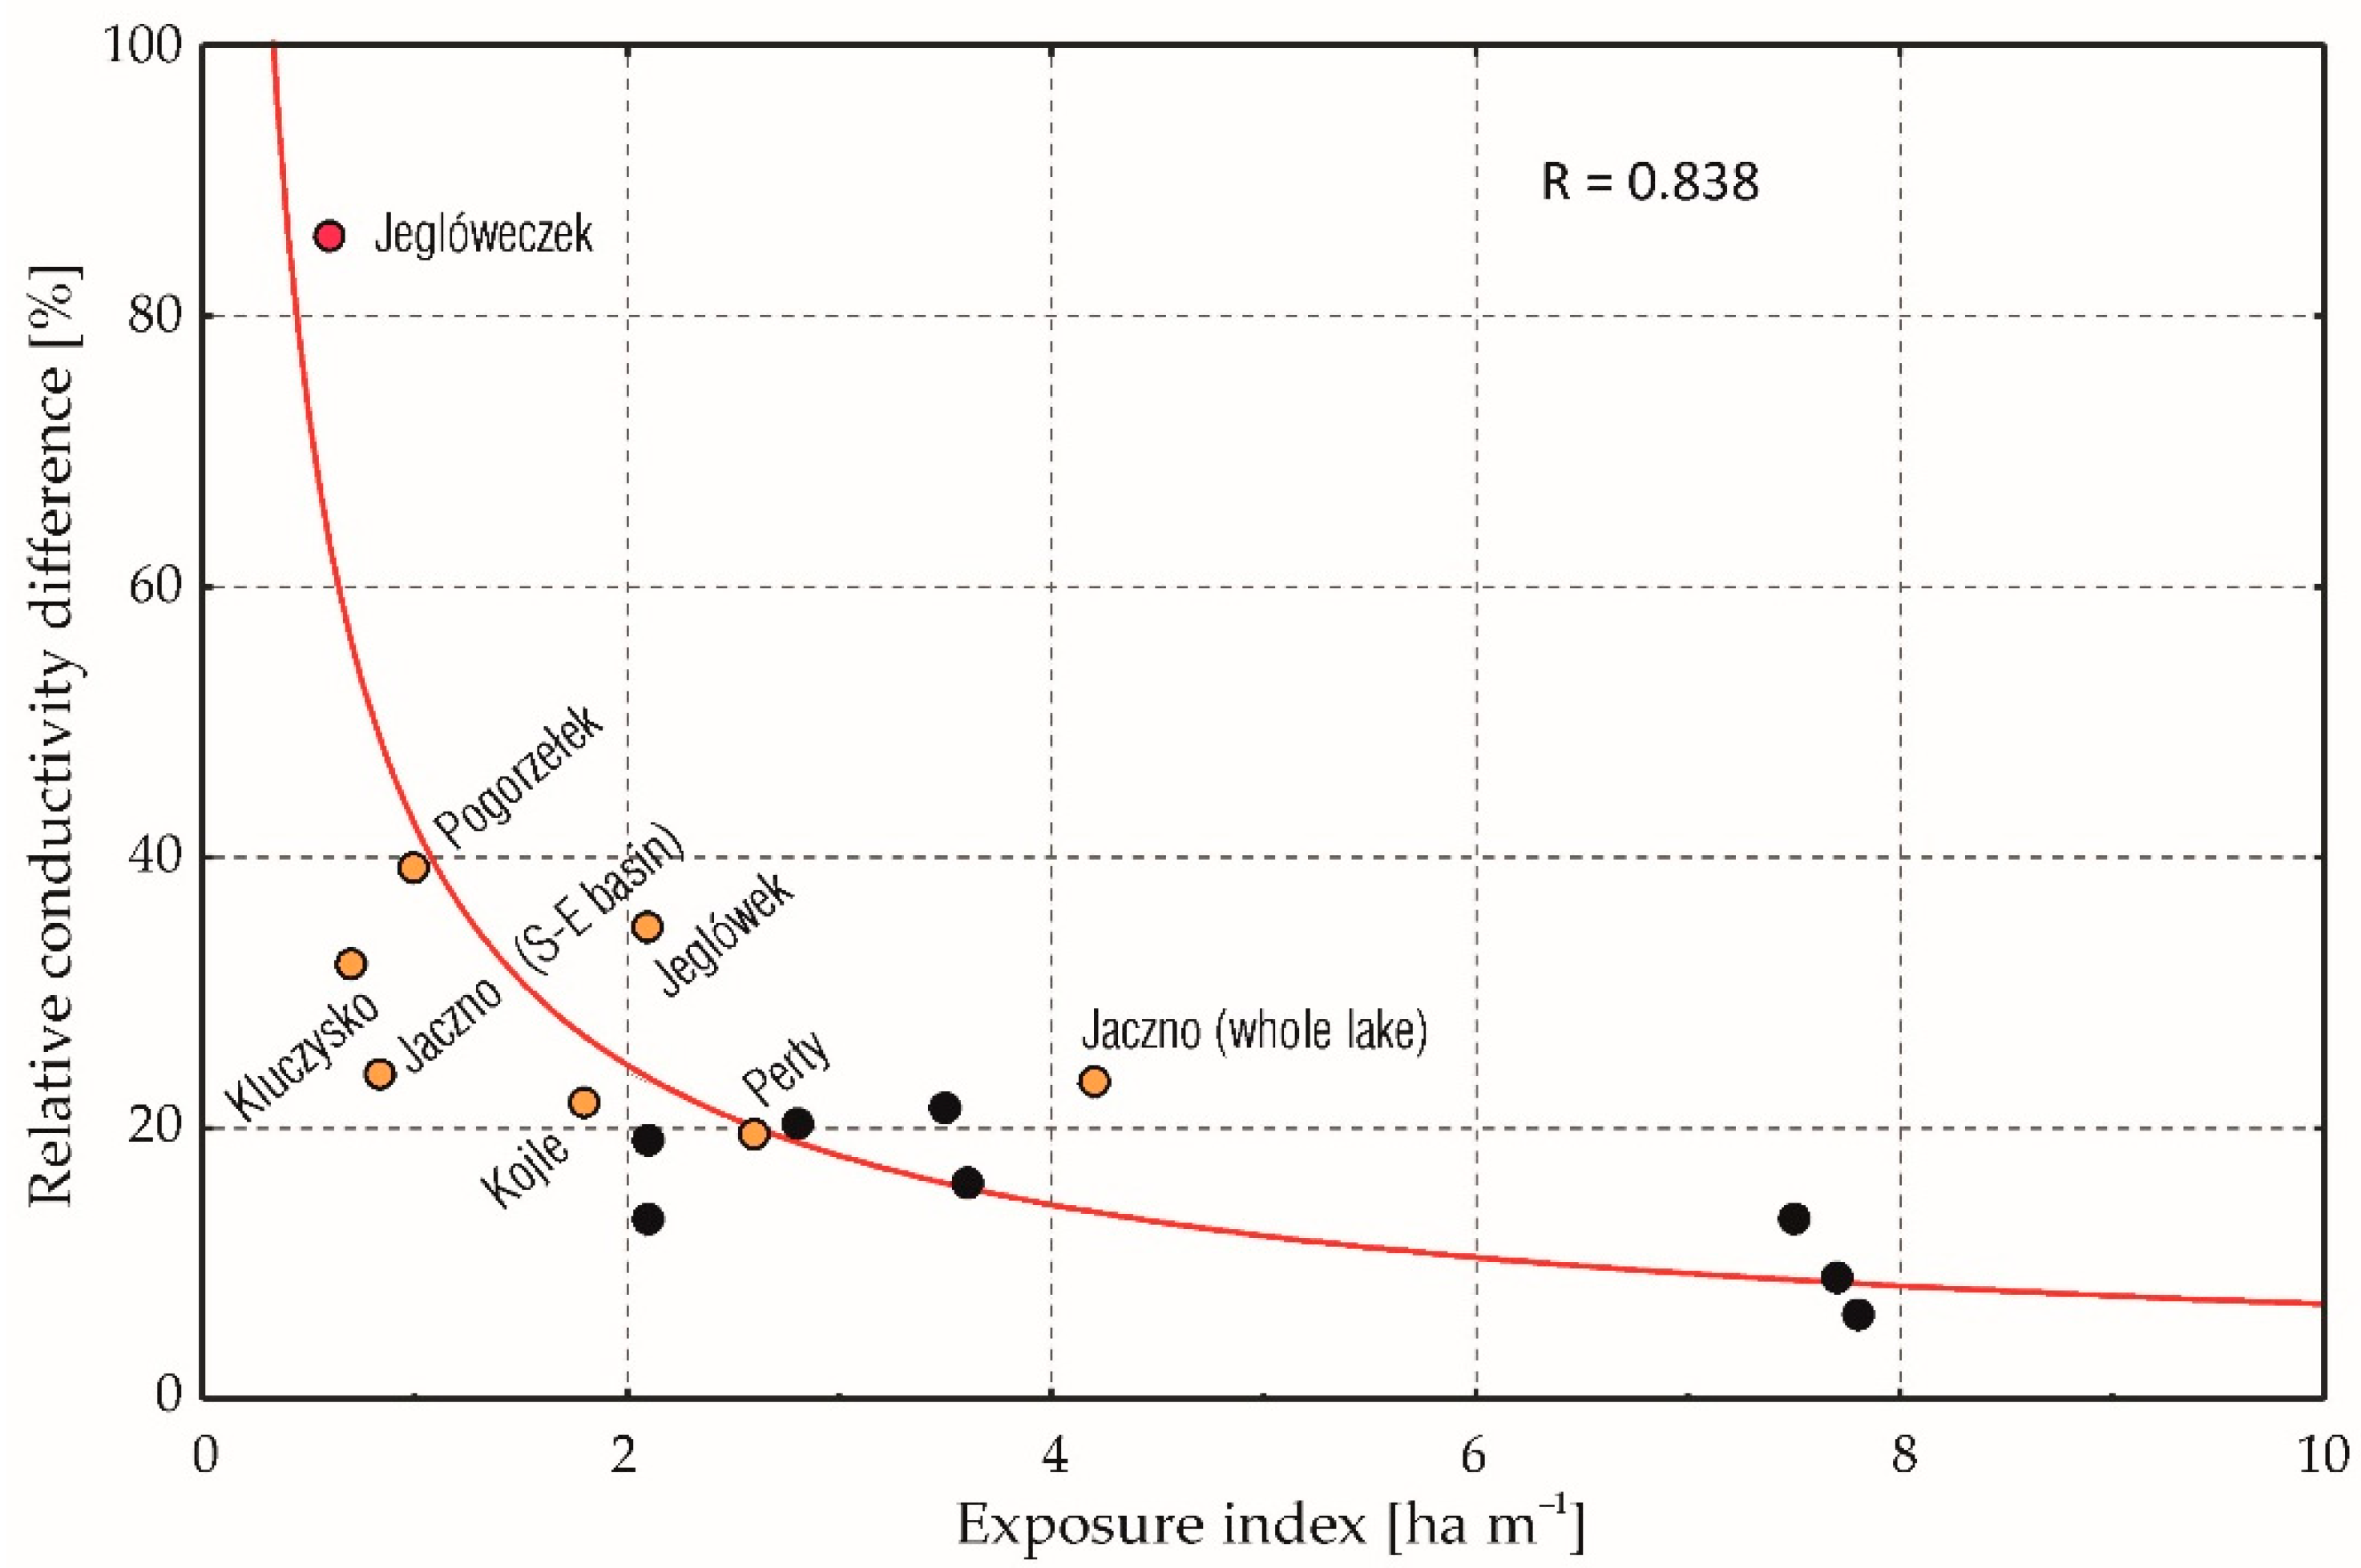
Diversity of conductivity in the depth profile was basically associated with the morphometric parameters of lake basins. However, statistical relationships were much weaker than in the case of water conductivity above the bottom. The maximum value of the coefficient of determination (R2 = 0.21, p < 0.03) was obtained for linear regression describing relative changes in conductivity as a function of relative depth. By limiting statistical analysis separately to dimictic and polymictic lakes, more explicit relationships were obtained. In the case of dimictic lakes, relative changes in conductivity in the water column were strongly correlated with the exposure coefficient (ratio of the lake surface in hectares to the average depth in metres) (Figure 4). Lakes with low exposure factors showed a greater variation in conductivity in the water column. Lakes poorly mixed in spring and autumn, being in the transition phase between dimictic and meromictic type (bradymictic type according to Passowicz [38]) recorded relative conductivity differences of 20–35%. In spring, all these lakes were not completely mixed (Figure 3). In typical dimictic lakes, the differences did not generally exceed 20%. Lakes showing signs of “spring meromixis” are objects of quiet lake sedimentation, which is indicated by the presence of annually laminated sediments [39]. The multi-basin Lake Jaczno turned out to be a special case. Its location on the chart changes depending on whether it is considered as one undivided reservoir or each of the individual pools is considered separately (measurements were carried out in the deepest south-east pool). For polymictic lakes, the determined correlations were statistically insignificant (p > 0.05).
3.4. Conductivity and Total Dissolved Ions
The waters of the studied lakes represent the hydrochemical type of bicarbonate-calcium-magnesium characteristic of this region (Table 3). Bicarbonates represented on average 93% of anions and calcium 71% of cations (in meq L−1). The lowest concentrations were observed in relation to potassium ions (0.9–2.0 mg L−1) on the cation side, and chloride ions (0.3–4.0 mg L−1) on the anion side.
Very strong positive linear conductivity correlations with concentrations of all the major ions were found. The relationships were statistically significant at the level of p < 0.0001, and the values of determination coefficients that described their strength were higher than 0.77. A statistical model linking conductivity with HCO3− ion concentrations (used later to estimate historical conductivity values) is described by the equation: EC25 (µS cm−1) = 1.69 HCO3− (mg L−1) + 20.10; R2 = 0.984; p < 0.0001.
The sum of total dissolved ion concentrations (TDI) ranged from 128.0 (in Lake Boczniel fed mainly by precipitation) to 394.8 mg L−1 in Lake Purwinek in the catchment where arable land dominates (over 94%). The mean and median values were 288.7 and 318.2 mg L−1, respectively. TDI to conductivity ratios averaged 0.77 and varied from 0.73 (Hańcza) to 0.80 (Purwin) (Table 3). The extreme TDI/EC25 values were 0.70 (Hańcza—summer 2014) and 0.83 (Kluczysko—spring 2013).
3.5. Spring Monitoring
In the SLP area, springs drain three aquifers of the Quaternary system: subsurficial, inter-moraine upper, and inter-moraine lower. These springs show low yield. The maximum measured discharge was only 6 L s−1. Their low yield results from the high lithological variability of surface deposits (Figure 1) and, common in this region, the discontinuity of aquifers which most often form isolated reservoirs of various volumes [40]. Subsurficial aquifers are phreatic, and the deeper ones are confined or partially confined.
Thermal characteristics indicated that the springs studied were hydrogeologically associated with the two upper aquifers. The conductivity of springs fed from the upper inter-moraine level ranged from 430 to 550 µS cm−1, and the water temperature from 5.8 to 8.2 °C. The middle 50% of conductivity measurements had values in the range of 460–530 µS cm−1. The groundwater table of this aquifer is located at an elevation of 150–230 m a.s.l. [30,41]. Groundwater flow directions are often incompatible with the terrain topography and are not always oriented towards the natural depression occupied by deep lakes [30]. Springs draining the subsurficial aquifers showed slightly increased conductivity (470–630 µS cm−1) and higher seasonal temperature fluctuations (4.0–11.2 °C).
The vertical distribution of springs in the edge zone of the Szeszupa Depression was determined by elevations of 150–210 m.
4. Discussion
Research on the regional differentiation of surface water conductivity of the largest lakes in northern Poland (N = 237, A0 > 50 ha) indicate its variability in the range from 52 to 4047 µS cm−1 [29]. However, in the small (A0 < 8 ha), atmospherically controlled, soft-water lakes of the Bytów Lakeland, conductivities of 31–40 [42] were noted, and in the Dreńskie Lakes (Olsztyn Lakeland), 21–29 µS cm−1 [28]. For the Lithuanian Lakeland, within which the Suwałki Landscape Park is located, the recorded variability ranges are smaller and amount to 175–497 [29] or 157–455 µS cm−1 [28]. The latter values refer to a group of lakes that is more diverse in terms of the surface area (A0 > 20 ha). The SLP lakes with an average conductivity of 178 to 522 µS cm−1 can be considered a representative group for this region, although lakes with a conductivity of 400–450 µS cm−1 dominate (35%) and the distribution shows a negative skewness (median—430, average—383 µS cm−1).
The time-spatial description of abiotic elements of lake ecosystems in north-eastern Poland by Marszelewski [28] showed that in the second half of the 20th century most of the water quality parameters underwent adverse changes. The trends observed in the Lithuanian Lakeland were not as spectacular as in other geographical regions of Poland, but they were nevertheless very clear. In the 1960s, the average conductivity of surface waters of the lakes of the Lithuanian Lakeland (N = 40) was 254, while at the end of the century it was already 318 µS cm−1 (original values were converted to reference temperature t = 25 °C). In just 30 years the conductivity of the lakes of this mesoregion increased by nearly 25%.
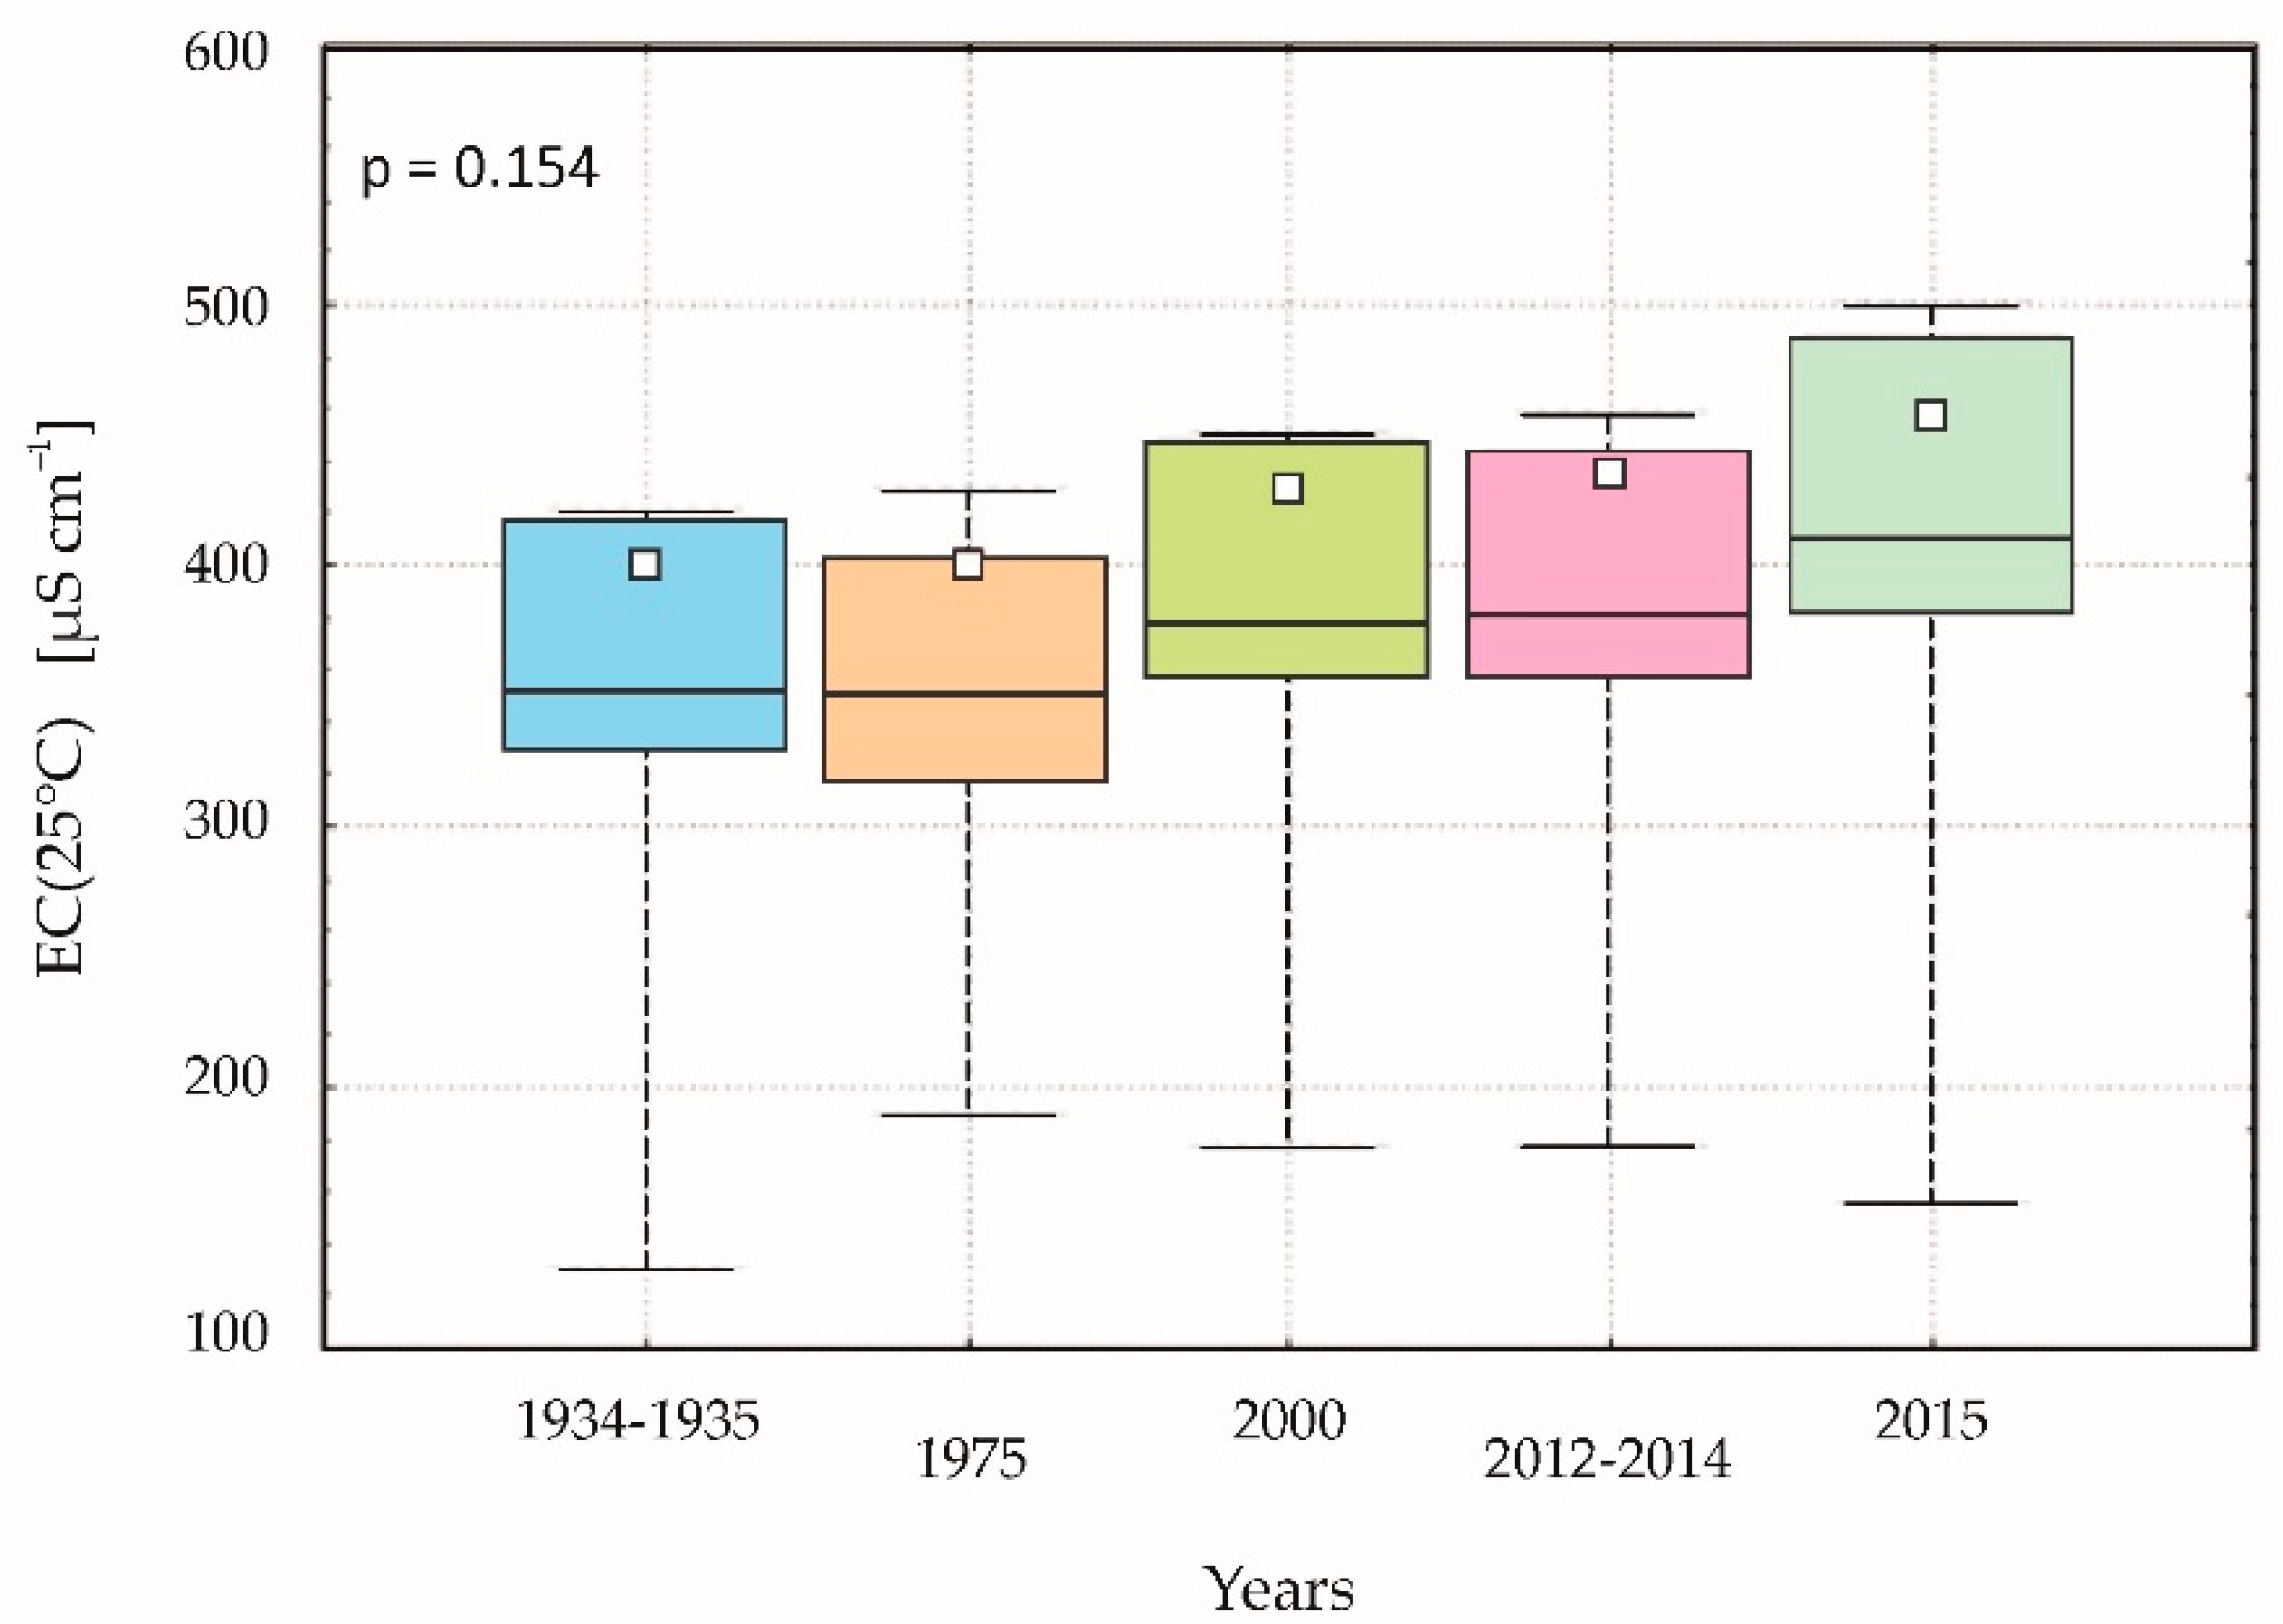
Analysing historical data collected for 11 SLP lakes, it can be seen that the multiannual changes in surface conductivity of these lakes were smaller. Until the mid-1970s, their average conductivity was stable at 352–353 µS cm−1, and then increased to 383 in the years 2012–2014 and 413 µS cm−1 in 2015 (Figure 5). Until 2014, the average conductivity increased by ~30 µS cm−1, i.e., by about 8.5%. Absolute changes were comparable in lakes with good quality waters (<350 µS cm−1) and lakes with worse quality parameters (>400 µS cm−1), and amounted to 28 and 32 µS cm−1, respectively. The rate of increase in conductivity in the SLP lakes was three times lower than in the lakes of the Lithuanian Lakeland or the Suwałki Lakeland (24%). Analysis of the mean values using the Kruskal–Wallis ANOVA test did not show that the conductivity differences between the time series considered were statistically significant (p = 0.154), similarly to the pair comparison (Mann–Whitney U test; p = 0.124).
In the years 2012–2015, the observed directions of inter-year conductivity changes in most of the SLP lakes were the same, regardless of the lake’s location in the hydrographic system, the size of its catchment area, and the geology and land use structure in the catchment area. Despite the fact that arable land is the dominant area in land use, and cattle breeding has intensified in recent years, SLP lakes are characterised by a relatively low degree of anthropopressure. The export of nutrients from the Szeszupa catchment is one of the lowest compared to other lakeland areas in northern Poland and is at the level of 3.8 kg N ha−1 and 0.12 kg P ha−1 [44]. The precipitation is the main source of supply of lakes with nutrients [45].
Such a reaction of the SLP lake systems suggests the existence of a common influencing factor, which in this spatially compact and subjected to low human impact territory is the climate. Taken separately, the average annual air temperature and the annual precipitation do not show a statistically significant effect on conductivity. However, the combined effect of both these factors explains the observed multiannual changes in conductivity in ~87% (Table 4). Inter-annual fluctuations and permanent changes in climate elements shape the intensity of chemical denudation in lake catchments and the loads of dissolved salts that flow into them. Thermal-humidity conditions also explain the significant increase in average water conductivity in the SLP lakes observed in 2015 [43] (Figure 5). That year was extremely warm (8.2 °C) and at the same time normal in terms of humidity (593 mm).
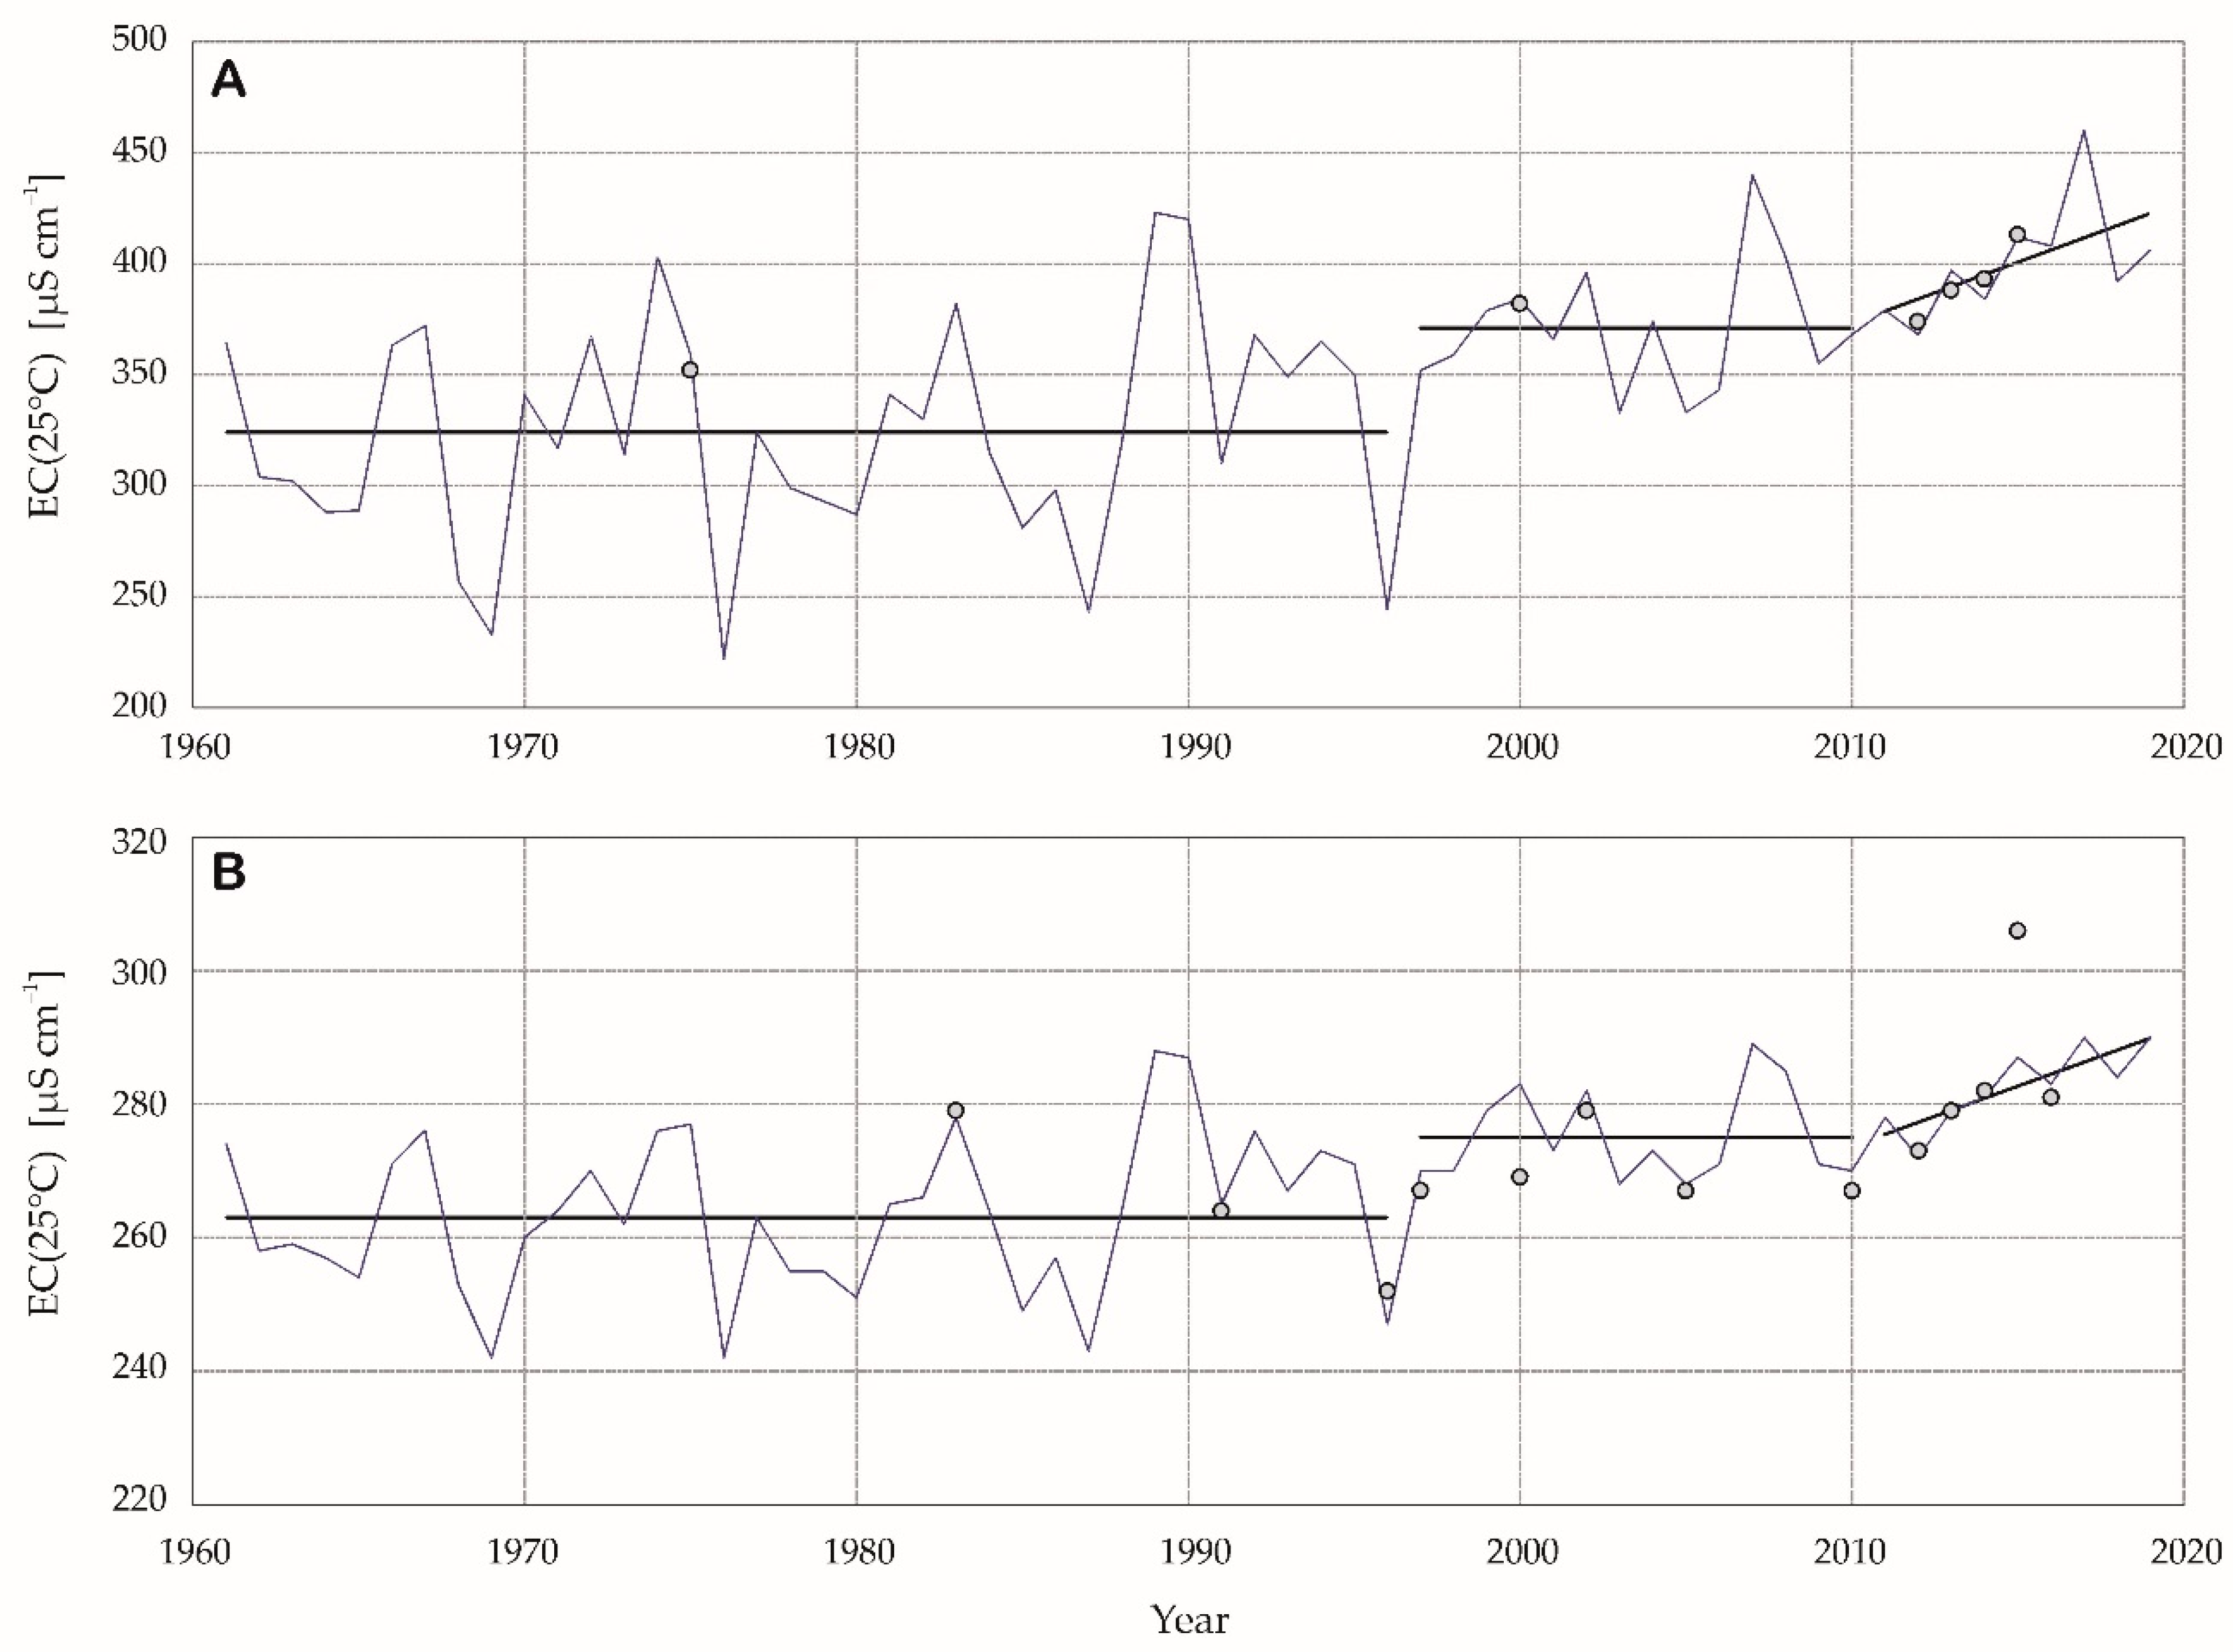
Using empirical climate models, the multiannual trend of changes in the average conductivity of surface waters of the SLP lakes was recreated (Figure 6A). Analysis of the chart shows that the accelerated deterioration of the water quality in the SLP lakes began in the second half of the 1990s. Similar results were obtained from the analysis of trends observed in individual lakes (Figure 6B). This tendency is also confirmed by many years of changes in other limnological parameters observed in other lakes, such as Lake Hańcza. In 1983–1985, at the peak of the growing season, the phytoplankton biomass in the lake was 0.1 [46], it then increased to 0.6 (1999–2002), and reached 1.8 mg L−1 in 2006–2007 [47]. In the second half of the last century, changes in phytoplankton biomass were not directional as evidenced by measured chlorophyll a concentrations. During this period, chlorophyll pigment concentrations ranged from less than 1 (in 1984) to about 3 µg L−1 in 1956 and 1991 [48,49]. A comparison of changes in phytoplankton biomass from 1983–1985 and 2006 in a larger group of SLP lakes also indicates its increase from 1.6 (range: 0.1–6.2) to 1.9 (0.2–8.2) mg L−1 [41,46]. In addition, in Lake Hańcza, considered as a-mesotrophic in the 1980s, drastic changes in the optical properties of water were also observed. In the 1990s, Secchi’s minimum depths reached 2–3 m, while in the 1960s and 1970s they were greater than 5 m [50].
As can be seen from Figure 6, until the mid-1990s, the surface conductivity values of the SLP lakes showed inter-year instability due to climate fluctuations. The conductivity values fluctuated around the multiannual average of 324 µS cm−1 (in Lake Hańcza—263 µS cm−1). After this period, conductivity increased abruptly to 371 µS cm−1 (Lake Hańcza—275 µS cm−1) to shape a lasting upward trend in the second decade of the 21st century. In recent years, the rate of conductivity increase in the entire group of the SLP lakes has been about 53 µS cm−1 per decade, and in Lake Hańcza 18 µS cm−1 per decade.
However, climate models do not explain conductivity differences between lakes. These differences are shaped at the lake catchment level reflecting local differences in the natural environment and water circulation conditions. Catchment size parameters cited in the literature [7], land use structure [6,28] and morphometric parameters of lake basins [6,11] do not determine inter-lake differences in water conductivity in the studied group of lakes. These parameters only nuance the impact of the main factor which is the location of the lake in the hydrographic system of the Czarna Hańcza and Szeszupa. The location of the lake, expressed by its elevation, primarily affects the conditions of supplying the lakes with water and the size of the inflow of dissolved salts.
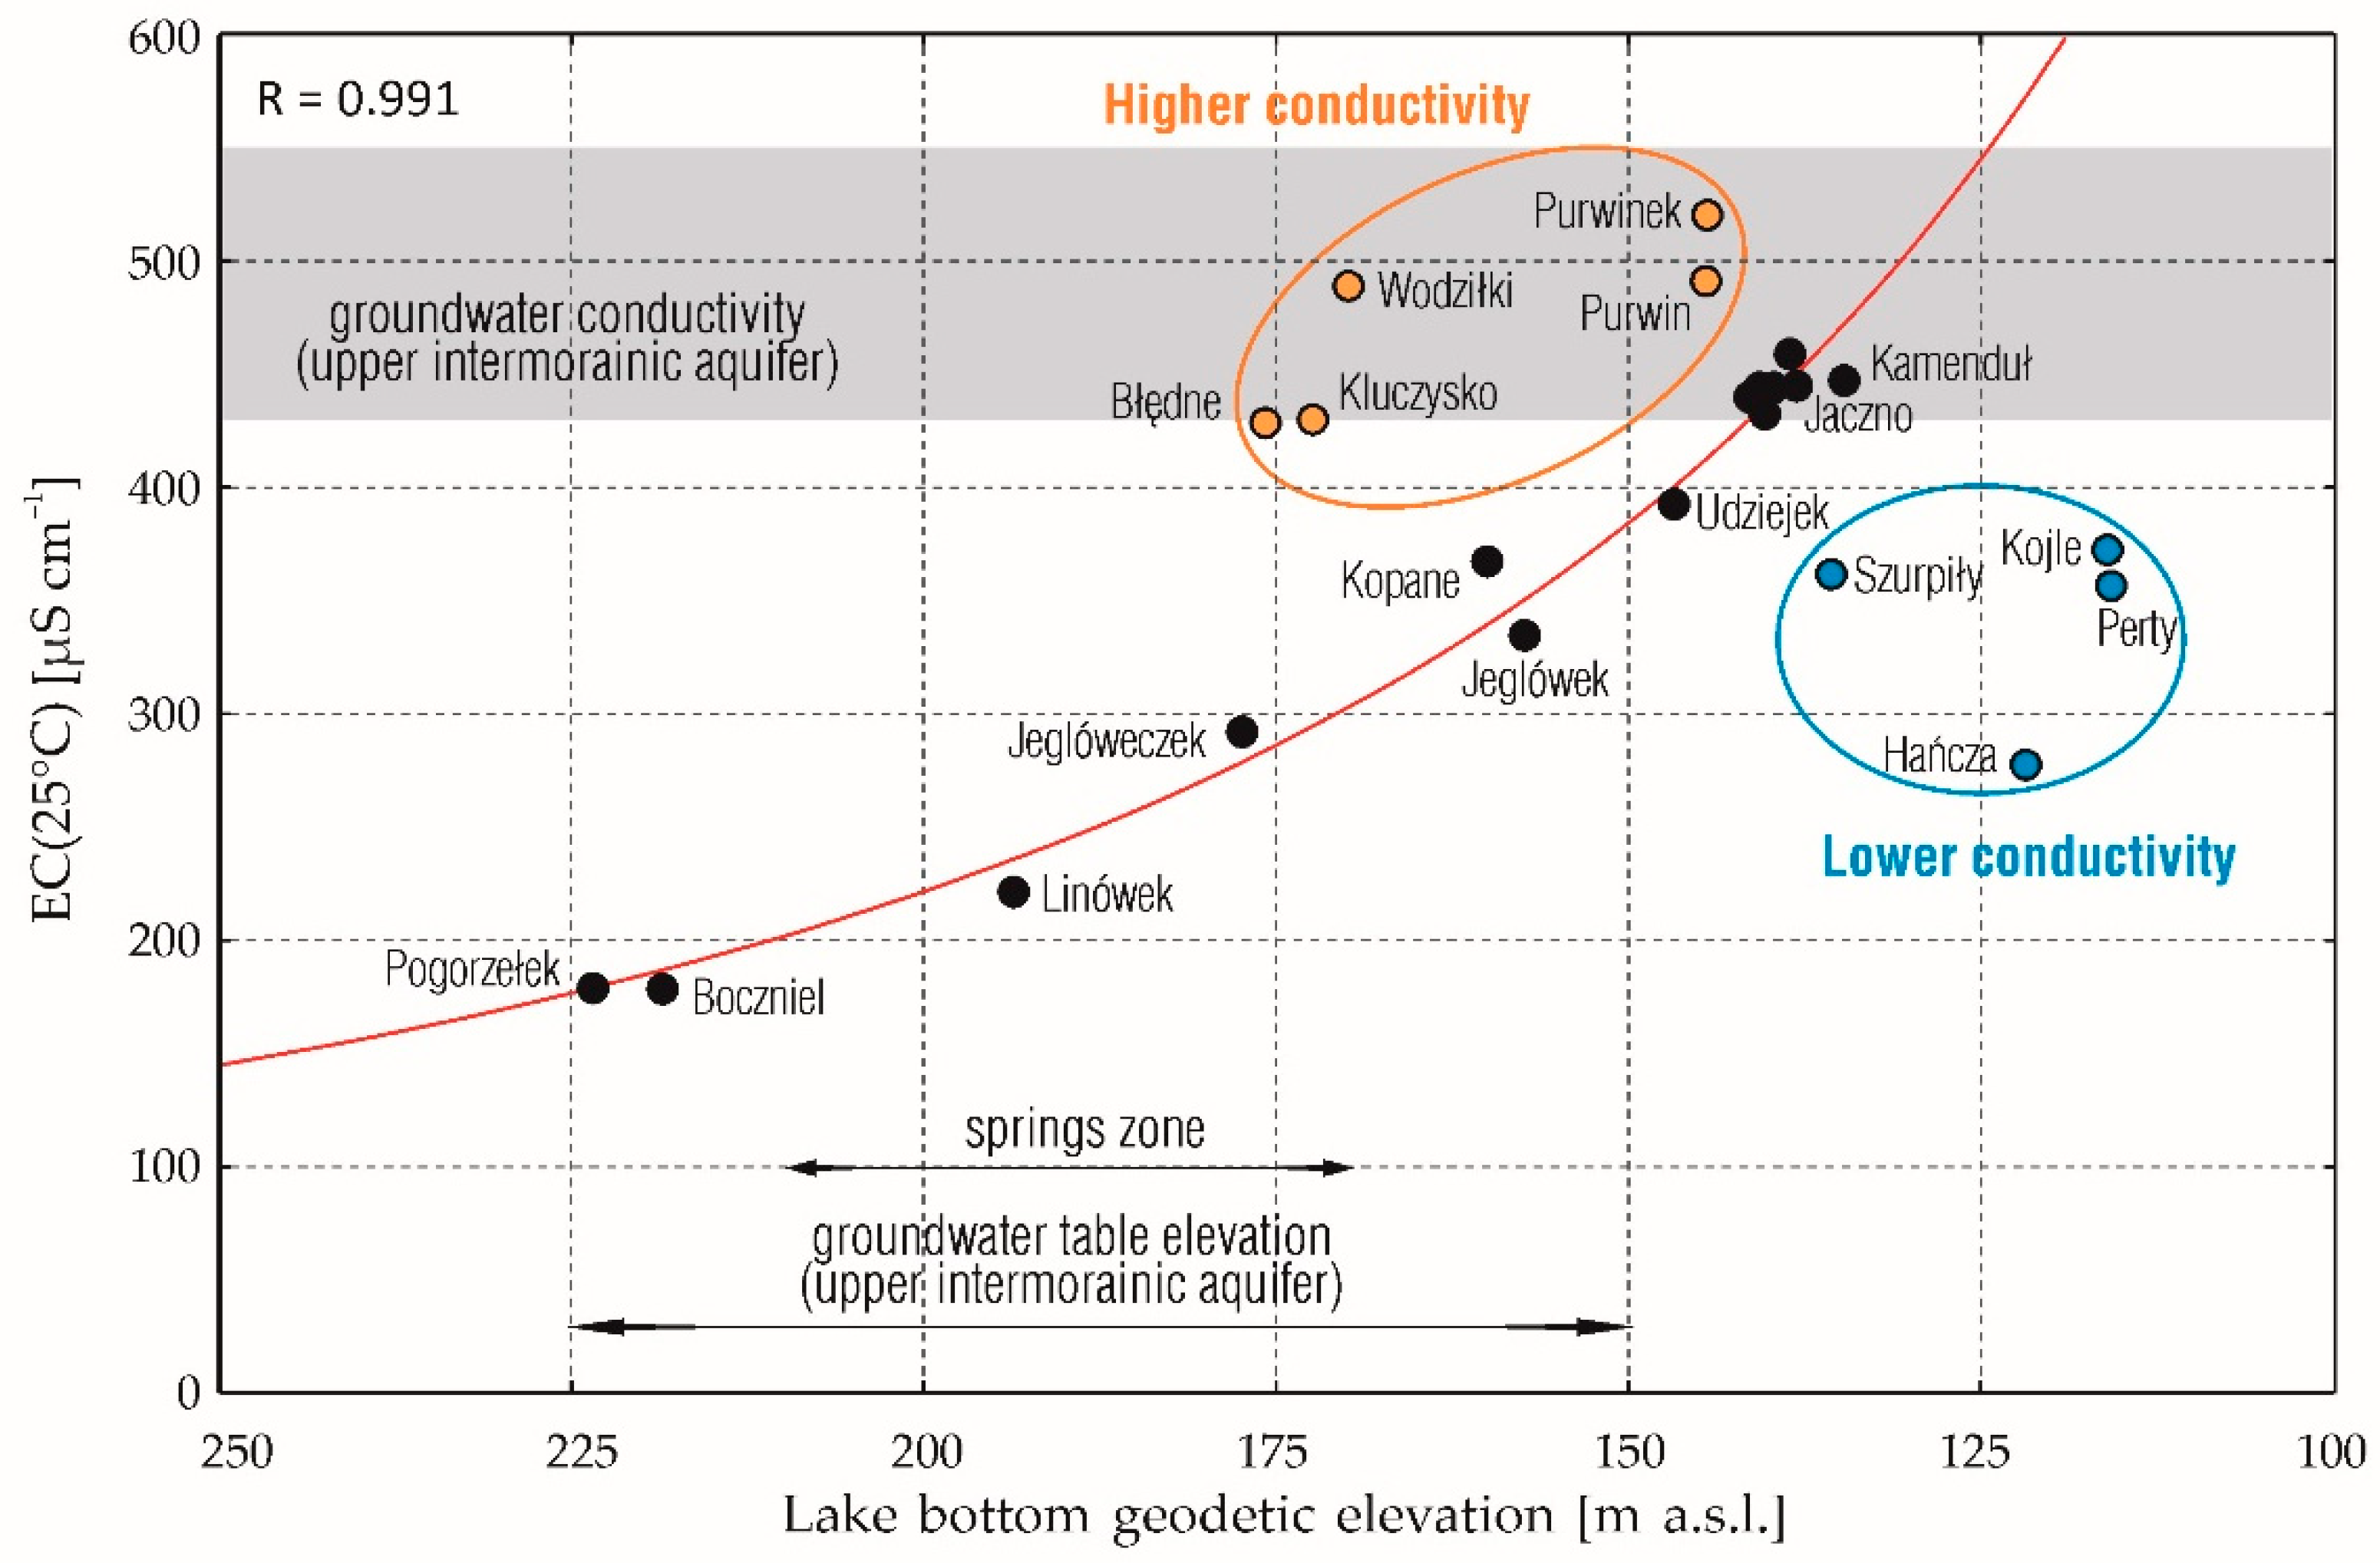
Comparing the average conductivity of surface waters of the SLP lakes with the geodetic heights of the location of the bottom of lake basins, showing their potential hydrological bond with groundwater, one can notice a constant tendency of increasing conductivity progressing along with the lower location of the lakes relative to the sea level (Figure 7). Located in the watershed zone and fed mainly atmospherically and from local suspended aquifers, the periodically closed and closed lakes of Pogorzełek, Boczniel, and Linówek have the lowest conductivities of 178–221 µS cm−1. Poor groundwater supply of the lakes located in the watershed zone within the frontal moraines is also confirmed by studies from other lakelands [51]. In these lakes, there are also frequent instances of water outflow to aquifers by means of percolation. With the increase in the catchment area and the lower elevation, the lakes included in the course of the Szeszupa and its tributary, the Jacznówka, as well as most of the lakes drained by the Szurpiłówka, increase their conductivity. The supply structure of these lakes indicates a gradual increase in the share of the outflow component originating from groundwater drainage, which is manifested in the increase in the hydrological activity of the lakes [52]. The lakes closing the river-lake system of the upper Szeszupa (Gulbin, Okrągłe, Krejwelek, Przechodnie, and Postawelek) have an average conductivity of 434–459 µS cm−1, i.e., twice as high. These are the values observed in the springs draining the upper aquifers (420–530 µS cm−1). The water residence time (WRT) of these lakes is extremely short and ranges from 1.5 (Postawelek) to 17 days (Przechodnie) (Table 1). In turn, Lake Jaczno, characterised by one of the highest averages of water conductivity, is fed mainly by surface (~68%) by several small watercourses [53]. They originate from springs and seeps in the immediate vicinity of the lake. These waters are therefore genetically linked to the upper inter-moraine level. The residence time of the Jaczno lake water is much longer and amounts to 1.755 years.
Two groups of lakes diverge from the presented diagram, one of which has lower and the other higher conductivity values than would result from their position in the catchment. Despite morphometry, potentially favourable to the drainage of shallower and deeper aquifers [54], the largest and deepest lakes of the SLP (Hańcza, Szurpiły, Kojle, Perty) have average conductivity values (277–372 µS cm−1). This demonstrates the clear isolation of the lake basins from groundwater. In the Kojle-Perty lake complex, whose basins were formed in the sandy loam of lacustrine-glacial accumulation (Figure 1), the surface runoff in the years 2012–2014 accounted for only ~57% of the river inflow. A significant share in the water balance of both lakes was taken by the atmospheric inflow, which accounted for ~75% of the river inflow. In turn, according to the balance assessment of the water resources conducted by Bajkiewicz-Grabowska [55], Lake Hańcza, whose basin cuts into the Quaternary formations to a depth of over 100 m, is losing water through underground exchange. On average, the difference between the annual underground outflow and inflow is ~78.9 dam3, which corresponds to a water layer of 26 mm. In addition, Lake Hańcza shows a positive balance of atmospheric water exchange. In the case of Lake Szurpiły, hydrogeological studies have shown that the groundwater outflow from the upper aquifers lying at the eastern edges of the Szeszupa Depression is directed towards the higher parts of the moraine plateau, not the natural depression of the lake basin. In addition, the groundwater flow directed towards the Szeszupa Depression at the lower inter-moraine level completely bypasses the lake [30].
In this group of lakes, the most important factor shaping water conductivity turned out to be lithology and the resulting variability of hydrogeological structures. In the SLP region, groundwater does not form one compact hydrogeological unit, but a number of local independent circulatory systems [30,40]. The links between the systems are maintained mainly through vertical hydraulic connections [30], which significantly limits the relationships of deep lakes with groundwater. These lakes are mainly fed with atmospheric water and from surface runoff and drainage of shallow groundwater (surface layer). A common feature of the lakes in question is the long water residence time, with a range from 5.82 to 14.07 years in lakes Szurpiły and Hańcza, respectively.
Lakes with higher water conductivities than those resulting from the model are the smallest, albeit hydrologically, and morphometrically diversified SLP lakes (Table 1). These lakes have total catchments smaller than 1 km2, in which the land use structure is dominated by agricultural land (73–97%). The exception is Lake Wodziłki with a less-developed agricultural catchment (41%). The catchment area of this lake is located on the groundwater flow route, and groundwater flows out in the form of springs supplying the watercourse flowing directly into the lake. It is the only closed lake with a constant inflow. The lithology of the catchment areas of most of these lakes is conducive to underground water inflow or the lakes are fed by short sections of watercourses flowing from springs or directly from springs and seeps (Wodziłki, Purwinek, Purwin). The maximum conductivities found in Lake Purwinek were similar to the conductivities measured in the watercourse feeding it and the spring from which it flows (550–560 µS cm−1). Judging by the conductivity values recorded in this group of lakes and in groundwater outflows it can be concluded that in those with a constant outflow conductivity is determined almost exclusively by the underground inflow. In Lake Kluczysko, showing the highest seasonal and inter-yearly conductivity variability (CV = 0.114) of all the lakes, the inflow of pollution from nonpoint sources is visible. Since the topographic catchments of these lakes are very small, and the recorded conductivity values are among the highest, it is also likely that the actual areas of lake supply are much larger than would result from the topography of the area.
5. Conclusions
The research carried out in 2012–2014 covered a set of 23 lakes located within the borders of the Suwałki Landscape Park (SLP). The lakes show a variety of features of the natural environment, typical for a young glacial lakeland landscape. The SLP is a territorial unit compact enough and abundant in numerous lakes to be an ideal object of analyses of the internal differentiation of the properties of the aquatic environment of its lakes and their response to the currently observed climate changes. It can also be a reference unit for similar future research in other geographical regions.
The study examined the spatial diversity and multiannual variability of the water quality parameter commonly used in monitoring water ecosystems, which is conductivity. The test results showed that: (i) the range of spatial variability of the average surface conductivity of the SLP lakes (178–522 µS cm−1) is typical for lakes in the northern region of Poland (Lithuanian Lakeland), while the inter-lake variability is 3.5 times greater than intra-lake variability; (ii) the factor determining the differences in conductivity is the location of the lakes in the drainage basin, which affects the structure of their supply. The most descriptive parameter is the elevation of the water table/bottom of the lake basin; (iii) physical and environmental parameters of the catchment and morphometric parameters of the lakes have a nuanced influence in relation to the main factor and only to a small extent explain the observed spatial variability of water conductivity; (iv) in dimictic lakes and those showing signs of “spring meromixis” the size of conductivity differences in the water column is determined by the susceptibility of the lakes to wind mixing expressed by the exposure index value; (v) the conductivity of lake waters can be considered as one of those water quality parameters that are sensitive to climate change which significantly expands its interpretative value going far beyond a simple assessment of the degree of loading of aquatic ecosystems with inorganic compounds. As SLP aquatic ecosystems are not subjected to excessive anthropopressure, conductivity can be used to identify the main streams of water supply. Changes over time will primarily reflect qualitative changes in the structure of lake supply caused by climate change. Thus, the analysis of long-term changes in climate parameters (precipitation, temperature) can be useful in assessing the direction and rate of these transformations.
Author Contributions
Conceptualization: M.B. and D.B.; Methodology: D.B. and M.B.; Formal Analysis: D.B.; Investigation: K.N., D.B. and M.B.; Resources: M.B., D.B. and K.N.; Data Curation: K.N. and D.B.; Writing—Original Draft Preparation: M.B. and D.B.; Writing—Review and Editing: M.B., D.B. and K.N.; Visualization: D.B.; Supervision: D.B.; Project Administration: M.B. All authors have read and agreed to the published version of the manuscript.
Funding
This research received no external funding.
Conflicts of Interest
The authors declare no conflict of interest.
References
- Lewis, E.L.; Perkin, R.G. Salinity: Its definition and calculation. J. Geophys. Res. 1978, 83, 466–478. [Google Scholar] [CrossRef]
- McNeil, V.H.; Cox, M.E. Relationship between conductivity and analysed composition in a large set of natural surface-water samples, Queensland, Australia. Environ. Geol. 2000, 39, 1325–1333. [Google Scholar] [CrossRef]
- Lystrom, D.G.; Rinella, R.A.; Knox, W.D. Definition of regional relationships between dissolved solids and specific conductance, Susquehanna River and New York. US Geol. Surv. J. Res. 1978, 6, 541–545. [Google Scholar]
- Day, B.A.; Nightingale, H.I. Relationships between ground-water silica, total dissolved solids, and specific electrical conductivity. Ground Water 1984, 22, 80–85. [Google Scholar] [CrossRef]
- Williams, W.D. Conductivity and salinity of Australian salt lakes. Aust. J. Mar. Freshwat. Res. 1986, 37, 177–182. [Google Scholar] [CrossRef]
- Håkanson, L. Lakes: Form and Function; Blackburn Press: Caldwell, NJ, USA, 2004. [Google Scholar]
- Duarte, C.M.; Kalff, J. The influence of catchment geology and lake depth on phytoplankton biomass. Arch. Hydrobiol. 1989, 115, 27–40. [Google Scholar]
- Juday, C.; Birge, E.A. The transparency, the color and the specific conductance of the lake waters of northeastern Wisconsin. Trans. Wis. Acad. Sci. 1933, 28, 205–259. [Google Scholar]
- Hooper, F.F. Limnological features of a Minnesota seepage lake. Am. Midl. Nat. 1951, 46, 462–481. [Google Scholar] [CrossRef]
- Nowiński, K. The Role of Lakes in the Transformation of Water Quality in the Radunia River System. Ph.D. Thesis, University of Gdańsk, Gdańsk, Poland, 2009. (In Polish). [Google Scholar]
- Nowiński, K. Effect of the lake location within the territorial hydrographic system on the water conductivity. In Water Resources and Wetlands, Proceedings of 2nd Conference on Water Resources and Wetlands, Tulcea, Romania, 11–13 September 2014; Gâştescu, P., Marszelewski, W., Bretcan, P., Eds.; Transversal Publish House: Targoviste, Romania, 2014; pp. 116–123. [Google Scholar]
- Dawidek, J. Limnetic Processes in the Zone of Bug River Fluvial Activity between Dorohusk and Włodawa; Wydaw. UMCS: Lublin, Poland, 2013; (In Polish, English summary). [Google Scholar]
- Korycka, A. Characteristics of the chemical composition of water in lakes of northern Poland. Rocz. Nauk Rol. H 1991, 102, 7–112, (In Polish, English summary). [Google Scholar]
- Kolada, A.; Soszka, H.; Cydzik, D.; Gołub, M. Abiotic typology of Polish lakes. Limnologica 2005, 35, 145–150. [Google Scholar] [CrossRef] [Green Version]
- Garing, C.; Luquot, L.; Pezard, P.A.; Gouze, P. Geochemical investigations of saltwater intrusion into the coastal carbonate aquifer of Mallorca, Spain. Appl. Geochem. 2013, 39, 1–10. [Google Scholar] [CrossRef]
- Borowiak, D.; Borowiak, M. Hydrochemical distinctive characteristics of Lake Druzno. Limnol. Rev. 2002, 2, 45–56. [Google Scholar]
- Kunkle, G.R. Computation of ground-water discharge to streams during floods, or to individual reaches during base flow, by use of specific conductance. US Geol. Surv. Prof. Pap. 1965, 525D, D207–D210. [Google Scholar]
- Collins, D.N. Hydrology of an alpine glacier as indicated by the chemical composition of meltwater. Z. Gletscherkd. Glazialgeol. 1977, 13, 219–238. [Google Scholar]
- Gonzales, A.L.; Nonner, J.; Heijkers, J.; Uhlenbrook, S. Comparison of different base flow separation methods in a lowland catchment. Hydrol. Earth Syst. Sci. 2009, 13, 2055–2068. [Google Scholar] [CrossRef] [Green Version]
- Groleau, A.; Sarazin, G.; Vinçon-Leite, B.; Tassin, B.; Quiblier-Llobéras, C. Tracing calcite precipitation with specific conductance in a hard water alpine lake (Lake Bourget). Water Res. 2000, 34, 4151–4160. [Google Scholar] [CrossRef] [Green Version]
- Ort, C.; Siegrist, H. Assessing wastewater dilution in small rivers with high resolution conductivity probes. Water Sci. Technol. 2009, 59, 1593–1601. [Google Scholar] [CrossRef] [PubMed]
- Bos, D.G.; Cumming, B.F.; Watters, C.E.; Smol, J.P. The relationship between zooplankton, conductivity and lake-water ionic composition in 111 lakes from the Interior Plateau of British Columbia, Canada. Int. J. Salt Lake Res. 1996, 5, 1–15. [Google Scholar] [CrossRef]
- Kefford, B.J. The relationship between electrical conductivity and selected macroinvertebrate communities in four river systems of south-west Victoria, Australia. Int. J. Salt Lake Res. 1998, 7, 153–170. [Google Scholar] [CrossRef]
- Beeton, A.M. Eutrophication of the St. Lawrence Great Lakes. Limnol. Oceanogr. 1965, 10, 240–254. [Google Scholar] [CrossRef]
- Shannon, E.E.; Brezonik, P.L. Eutrophication analysis: A multivariate approach. J. Sanit. Eng. Div. Am. Soc. Civ. Eng. 1972, 98, 37–57. [Google Scholar]
- Korycka, A.; Dembiński, W. Water conductivity in the lakes of northern Poland. Rocz. Nauk Rol. H 1974, 96, 59–74, (In Polish, English summary). [Google Scholar]
- Rast, W.; Holland, M.; Ryding, S.-O. Eutrophication management framework for the policy-maker. In MAB Digest 1; UNESCO: Paris, France, 1989. [Google Scholar]
- Marszelewski, W. Changes of the Abiotic Conditions in the Lakes of North-East Poland; Wydaw. UMK: Toruń, Poland, 2005; (In Polish, English summary). [Google Scholar]
- Sobolewski, W.; Borowiak, D.; Borowiak, M.; Skowron, R. Database of Polish Lakes and Its Use in Limnological Research; Wydaw. UMCS: Lublin, Poland, 2014; (In Polish only). [Google Scholar]
- Mitręga, J.; Paczyński, B.; Płochniewski, Z. Groundwaters of the Suwałki Region. Pr. Geol. 1993, 41, 569–574, (In Polish only). [Google Scholar]
- Bajkiewicz-Grabowska, E. Evaluation of the drainage basins of lakes in Suwałki Landskape Park, and of their susceptibility to degradation. Zesz. Nauk. PAN Człowiek i środowisko 1994, 7, 47–54, (In Polish, English summary). [Google Scholar]
- Woś, A. Climate of Poland; Wydaw. Nauk. PWN: Warszawa, Poland, 1999; (In Polish only). [Google Scholar]
- Ber, A. Stratigraphy of the Quaternary of the Suwalki Lakeland and its substrate based on recent data. Kwart. Geol. 1989, 33, 463–478. [Google Scholar]
- Borowiak, D.; Nowiński, K.; Grabowska, K. A new bathymetric survey of the Suwałki Landscape Park lakes. Limnol. Rev. 2016, 16, 185–197. [Google Scholar] [CrossRef] [Green Version]
- Stangenberg, M. Limnological study against the hydrochemical conditions of the Suwałki Lakeland. Lakes Suchar and Jeziorko as a transitional stage of lake disappearance. Pr. Inst. Bad. Lasów Państw. A 1936, 19, 1–85, (In Polish, German summary). [Google Scholar]
- Stangenberg, M. Limnological characteristics of the Kleszczówek and Hańcza lake groups in the Suwałki Lakeland. Pr. Inst. Bad. Lasów Państw. A 1937, 23, 1–17, (In Polish, German summary). [Google Scholar]
- Sokołowski, A.W. Guidelines for the Spatial Development Plan of the Suwałki Landscape Park; Typescript; IBL: Białowieża, Poland, 1976; (In Polish only). [Google Scholar]
- Passowicz, K. A meromictic lake in the Suwałki region, Poland. Arch. Hydrobiol. Ryb. 1938, 11, 210–214, (In German only). [Google Scholar]
- Tylmann, W.; Kinder, M.; Żarczyński, M.; Poraj-Górska, A. Preliminary characteristics of laminations in recent sediments from lakes Kamenduł and Perty in the Suwałki Landscape Park, northern Poland. Limnol. Rev. 2016, 4, 237–245. [Google Scholar] [CrossRef] [Green Version]
- Nowakowski, C. Characteristics of output of springs in front-moraine zone in Suwałki Lake District. Biul. Geol. 1976, 21, 177–191, (In Polish, English summary). [Google Scholar]
- Jekatierynczuk-Rudczyk, E.; Zieliński, P.; Grabowska, M.; Ejsmont-Karabin, J.; Karpowicz, M.; Więcko, A. The trophic status of Suwałki Landscape Park lakes basedon selected parameters (NE Poland). Environ. Monit. Assess. 2014, 186, 5101–5121. [Google Scholar] [CrossRef] [Green Version]
- Borowiak, D.; Nowiński, K.; Borowiak, M.; Grabowska, K. Abiotic environment of lobelia lake ecosystems. In Lobelia Lakes in the Second Decade of the 21st Century; Bociąg, K., Borowiak, D., Eds.; Wydaw. FRUG: Gdańsk, Poland, 2016; pp. 20–51, (In Polish, English summary). [Google Scholar]
- Górniak, A.; Więcko, A.; Karpowicz, M. Changes in the trophic status of lakes in the Suwałki Landscape Park (NE Poland). Limnol. Rev. 2016, 16, 221–227. [Google Scholar] [CrossRef]
- Górniak, A. Export of nutrients from the catchment of upper Szeszupa River (drainage basin of the Neman River) and its seasonality. Limnol. Rev. 2016, 4, 213–2019. [Google Scholar] [CrossRef] [Green Version]
- Zdanowski, B.; Stawecki, K.; Pyka, J.P. Abiotic environment of Lake Hańcza. In Environment and Ichthyofauna of Lake Hańcza; Kozłowski, J., Poczyczyński, P., Zdanowski, B., Eds.; Wydaw. IRS: Olsztyn, Poland, 2008; pp. 59–73, (In Polish only). [Google Scholar]
- Hillbricht-Ilkowska, A.; Wiśniewski, R.J. Trophic diversityof the lakes of SLP and its buffer zone. Current state, long-term variability and place in the trophic classification of lakes. Zesz. Nauk. PAN Człowiek Środowisko 1994, 7, 181–200, (In Polish, English summary). [Google Scholar]
- Hutorowicz, A.; Napiórkowska-Krzebietke, A. Phytoplankton communities in Lake Hańcza. In Environment and Ichthyofauna of Lake Hańcza; Kozłowski, J., Poczyczyński, P., Zdanowski, B., Eds.; Wydaw. IRS: Olsztyn, Poland, 2008; pp. 93–102, (In Polish only). [Google Scholar]
- Solski, A. Chlorophyll in the sestone of some Polish lakes as an indicator of productivity. Pol. Arch. Hydrobiol. 1962, 10, 111–165, (In Polish, English summary). [Google Scholar]
- Spodniewska, I. Phytoplankton as an indicator of lake eutrophication. I. Summer situation in 34 Masurian lakes in 1973. Ekol. Pol. 1978, 26, 53–70. [Google Scholar]
- Borowiak, D.; Borowiak, M. Comparative studies of underwater light regimes in lakes of the East-Suwałki Lakeland. Limnol. Rev. 2016, 16, 173–183. [Google Scholar] [CrossRef] [Green Version]
- Kilkus, K. Hydrogeological approach in limnology. In Degradation Hazards and Lakes Protection; Lange, W., Borowiak, D., Eds.; Wydaw. DJ: Gdańsk, Poland, 1998; pp. 51–59. [Google Scholar]
- Pasławski, Z. Hydrological typology of lakes in Great Poland Lakeland. Prz. Geof. 1975, 20, 271–280, (In Polish, English summary). [Google Scholar]
- Byczkowski, A. Water budget of the headwater lake on the example of Lake Jaczno in the Suwałki Lakeland. In Water Circulation in the Catchments of the Pomeranian Rivers and the Lower Vistula Basin with Particular Emphasis on Water Management of Lakes; Friedrich, M., Ed.; Wydaw. IMGW: Słupsk, Poland, 1980; pp. 257–266, (In Polish only). [Google Scholar]
- Jankowska, H. The role of lakes in the development of underground outflow in the upper Radunia drainage area. Zesz. Nauk. Wydz. BGiO Geogr. 1985, 14, 57–68, (In Polish, English summary). [Google Scholar]
- Bajkiewicz-Grabowska, E. Water budget of Lake Hańcza. In Environment and Ichthyofauna of Lake Hańcza; Kozłowski, J., Poczyczyński, P., Zdanowski, B., Eds.; Wydaw. IRS: Olsztyn, Poland, 2008; pp. 25–36, (In Polish only). [Google Scholar]
Figure 1.
Location of the study area with a general lithology map of the Suwałki Landscape Park (SLP) and a graph showing the relationship between the major morphological parameters of the lake basins. The red broken line denotes the regression line between lake volume and the surface area defined for lakes of the Szeszupa Depression.

Figure 2.
Scatter plots with 95% confidence intervals representing the statistical relationships between the conductivity of surface waters and the selected catchment characteristics based on data from the 23 SLP lakes.
Figure 2.
Scatter plots with 95% confidence intervals representing the statistical relationships between the conductivity of surface waters and the selected catchment characteristics based on data from the 23 SLP lakes.

Figure 3.
Vertical conductivity temperature profiles at the end of spring mixing period in some SLP lakes in April 2012. Out of all the presented lakes, only the deepest one (Lake Szurpiły) was completely mixed that spring.
Figure 3.
Vertical conductivity temperature profiles at the end of spring mixing period in some SLP lakes in April 2012. Out of all the presented lakes, only the deepest one (Lake Szurpiły) was completely mixed that spring.

Figure 4.
Relationship between maximum conductivity difference along the water column in summer (August) and exposure index determined for 15 SLP lakes. Black circles denote typical dimictic lakes, orange circles denote lakes in transition (dimictic/meromictic), and a red circle denotes a meromictic lake.

Figure 5.
Boxplots (with p-value from the Kruskal–Wallis non-parametric test) for long term changes of surface water conductivity (EC25) in 11 SLP lakes. All boxplots show the median value with the box denoting interquartile range, the whiskers denote minimum and maximum, and the horizontal bars are mean values. Conductivity values for 1934–1935 and 1975 were estimated from the conductivity-bicarbonate statistical model based on data from [35,36] and [37], values for 2015 according to [43].

Figure 6.
Multiannual dynamics of the mean surface water conductivity of all SLP lakes (A) and Lake Hańcza (B) calculated from climatic models (Table 4). Circles mark the observed data. Black lines denote multiannual averages and trend lines in the last decade.
Figure 6.
Multiannual dynamics of the mean surface water conductivity of all SLP lakes (A) and Lake Hańcza (B) calculated from climatic models (Table 4). Circles mark the observed data. Black lines denote multiannual averages and trend lines in the last decade.

Figure 7.
Influence of altitudinal location of lakes in a catchment on the mean conductivity of surface water in the SLP lakes.
Figure 7.
Influence of altitudinal location of lakes in a catchment on the mean conductivity of surface water in the SLP lakes.


Table 1.
Basic morphometric characteristics of the Suwałki Landscape Park lakes, and their division based on mixing and hydrology. Denotations: Alt—geodetic elevation of the water surface, A0—lake water surface area (without islands), V—lake volume, zmax—maximum depth, z—mean depth, and WRT—water residence time.
| Lake | Alt | A0 | V | zmax | z | WTR | Mixing Type | Hydrologic Type |
|---|---|---|---|---|---|---|---|---|
| (m a.s.l.) | (ha) | (dam3) | (m) | (m) | (years) | |||
| Błędne | 180.7 | 2.74 | 52.6 | 4.8 | 1.9 | – | polymictic | closed lake |
| Boczniel | 227.6 | 19.17 | 243.2 | 3.9 | 1.3 | 24.271 | polymictic | semiclosed lake |
| Gulbin | 147.7 | 7.38 | 254.7 | 9.1 | 3.5 | 0.023 | dimictic | flowthrough lake |
| Hańcza | 227.5 | 303.56 | 118,648.0 | 105.6 | 39.1 | 14.070 | dimictic | flowthrough lake |
| Jaczno | 163.9 | 40.64 | 3980.6 | 25.7 | 9.8 | 1.755 | dimictic/meromictic | flowthrough lake |
| Jeglóweczek | 185.7 | 1.81 | 56.9 | 8.3 | 3.1 | 2.557 | meromictic | lake with outflow |
| Jeglówek | 185.1 | 19.81 | 1835.2 | 27.7 | 9.9 | 7.139 | dimictic/meromictic | flowthrough lake |
| Kamenduł | 161.0 | 25.26 | 1767.4 | 26.2 | 7.0 | 0.520 | dimictic | flowthrough lake |
| Kluczysko | 186.4 | 3.67 | 199.7 | 13.8 | 5.4 | 1.845 | dimictic/meromictic | lake with outflow |
| Kojle | 148.3 | 17.26 | 1679.4 | 32.3 | 9.7 | 6.858 | dimictic/meromictic | flowthrough lake |
| Kopane | 179.0 | 16.15 | 918.4 | 18.8 | 5.7 | 0.354 | dimictic | flowthrough lake |
| Krejwelek | 146.4 | 8.76 | 249.3 | 5.5 | 2.8 | 0.016 | polymictic | flowthrough lake |
| Linówek | 199.7 | 2.85 | 67.6 | 5.9 | 2.4 | – | polymictic | closed lake |
| Okrągłe | 146.9 | 15.03 | 645.9 | 7.4 | 4.3 | 0.041 | dimictic | flowthrough lake |
| Perty | 148.3 | 19.51 | 1446.2 | 32.6 | 7.4 | 8.102 | dimictic/meromictic | flowthrough lake |
| Pogorzełek | 236.4 | 5.79 | 340.8 | 17.6 | 5.9 | 29.609 | dimictic/meromictic | semiclosed lake |
| Postawelek | 145.7 | 3.35 | 67.9 | 4.0 | 2.0 | 0.004 | polymictic | flowthrough lake |
| Przechodnie | 146.0 | 23.89 | 747.2 | 5.4 | 3.1 | 0.046 | dimictic | flowthrough lake |
| Purwin | 149.0 | 1.41 | 38.9 | 4.3 | 2.8 | 0.125 | polymictic | lake with outflow |
| Purwinek | 148.0 | 0.44 | 6.8 | 3.3 | 1.5 | 0.054 | polymictic | flowthrough lake |
| Szurpiły | 182.8 | 84.35 | 9450.8 | 47.1 | 11.2 | 5.852 | dimictic | flowthrough lake |
| Udziejek | 153.6 | 7.01 | 230.7 | 6.9 | 3.3 | 0.067 | dimictic | flowthrough lake |
| Wodziłki | 175.5 | 3.73 | 115.7 | 5.4 | 3.1 | – | polymictic | lake with inflow |
Table 2.
Conductivity characteristics of surface and bottom waters of the studied lakes calculated for the period of 2012–2014. Diff. is the difference in conductivity during the spring homothermy and during summer stratification (spring−summer in table), CV = coefficient of variation.
Table 2.
Conductivity characteristics of surface and bottom waters of the studied lakes calculated for the period of 2012–2014. Diff. is the difference in conductivity during the spring homothermy and during summer stratification (spring−summer in table), CV = coefficient of variation.
| Lake | Surface (1 m below) | Bottom (1 m above) | ||||||
|---|---|---|---|---|---|---|---|---|
| Mean | Spring | Summer | Diff. | CV | Mean | Summer | CV | |
| Błędne | 430 | 442 | 412 | 30 | 0.068 | 511 | 484 | 0.098 |
| Boczniel | 178 | 186 | 171 | 15 | 0.109 | 190 | 180 | 0.164 |
| Gulbin | 459 | 471 | 443 | 28 | 0.072 | 503 | 512 | 0.073 |
| Hańcza | 277 | 284 | 268 | 16 | 0.048 | 294 | 286 | 0.041 |
| Jaczno | 444 | 455 | 426 | 29 | 0.051 | 593 | 556 | 0.131 |
| Jeglóweczek | 292 | 301 | 279 | 22 | 0.084 | 1943 | 1945 | 0.075 |
| Jeglówek | 335 | 342 | 327 | 15 | 0.062 | 503 | 503 | 0.030 |
| Kamenduł | 448 | 466 | 420 | 46 | 0.064 | 505 | 501 | 0.052 |
| Kluczysko | 431 | 456 | 390 | 66 | 0.114 | 576 | 574 | 0.058 |
| Kojle | 372 | 385 | 349 | 36 | 0.062 | 454 | 447 | 0.047 |
| Kopane | 368 | 382 | 345 | 37 | 0.067 | 434 | 433 | 0.085 |
| Krejwelek | 444 | 459 | 420 | 39 | 0.080 | 498 | 530 | 0.098 |
| Linówek | 221 | 227 | 211 | 16 | 0.072 | 259 | 246 | 0.131 |
| Okrągłe | 444 | 459 | 421 | 38 | 0.077 | 494 | 537 | 0.098 |
| Perty | 357 | 365 | 347 | 18 | 0.056 | 438 | 432 | 0.047 |
| Pogorzełek | 178 | 182 | 173 | 9 | 0.067 | 317 | 284 | 0.088 |
| Postawelek | 439 | 453 | 416 | 37 | 0.085 | 459 | 438 | 0.081 |
| Przechodnie | 434 | 450 | 403 | 47 | 0.095 | 457 | 444 | 0.102 |
| Purwin | 493 | 506 | 474 | 32 | 0.058 | 516 | 493 | 0.068 |
| Purwinek | 522 | 542 | 487 | 55 | 0.070 | 535 | 503 | 0.072 |
| Szurpiły | 362 | 375 | 342 | 33 | 0.053 | 399 | 394 | 0.055 |
| Udziejek | 393 | 402 | 378 | 24 | 0.071 | 444 | 469 | 0.081 |
| Wodziłki | 492 | 509 | 465 | 44 | 0.068 | 495 | 471 | 0.069 |
Table 3.
The average chemical composition of surface water of the Suvalkian lakes examined in the years 2012–2014 (spring and summer). Ion concentrations and Total Dissolved Ions, TDI, are given in mg L−1, and conductivity, EC(25 °C), in µS cm−1.
Table 3.
The average chemical composition of surface water of the Suvalkian lakes examined in the years 2012–2014 (spring and summer). Ion concentrations and Total Dissolved Ions, TDI, are given in mg L−1, and conductivity, EC(25 °C), in µS cm−1.
| Lake | EC(25 °C) | Ca | Mg | Na | K | HCO3 | SO4 | Cl | TDI | TDI/EC(25 °C) |
|---|---|---|---|---|---|---|---|---|---|---|
| Błędne | 413.0 | 58.1 | 11.4 | 4.5 | 1.6 | 229.1 | 9.7 | 3.8 | 318.2 | 0.77 |
| Boczniel | 171.4 | 25.0 | 4.2 | 1.9 | 0.9 | 93.5 | 2.1 | 0.4 | 128.0 | 0.75 |
| Gulbin | 447.0 | 64.3 | 12.3 | 5.1 | 1.6 | 254.2 | 10.3 | 3.1 | 350.9 | 0.79 |
| Hańcza | 272.4 | 38.3 | 6.9 | 2.6 | 1.3 | 142.1 | 6.2 | 1.6 | 199.0 | 0.73 |
| Jaczno | 436.4 | 61.1 | 12.8 | 4.6 | 1.6 | 246.2 | 10.2 | 3.4 | 339.9 | 0.78 |
| Jeglóweczek | 293.8 | 43.2 | 7.2 | 3.3 | 1.2 | 163.9 | 4.4 | 1.2 | 224.4 | 0.76 |
| Jeglówek | 330.9 | 45.9 | 9.1 | 3.5 | 1.4 | 182.5 | 6.1 | 2.2 | 250.7 | 0.76 |
| Kamenduł | 439.3 | 61.5 | 12.8 | 4.7 | 1.6 | 243.1 | 9.3 | 3.5 | 336.5 | 0.77 |
| Kluczysko | 417.6 | 60.1 | 11.8 | 4.9 | 1.7 | 236.5 | 10.1 | 3.3 | 328.4 | 0.79 |
| Kojle | 366.4 | 50.8 | 10.4 | 4.4 | 1.5 | 205.1 | 7.0 | 2.9 | 282.1 | 0.77 |
| Kopane | 360.1 | 49.7 | 10.7 | 4.1 | 1.5 | 200.9 | 9.4 | 2.6 | 278.9 | 0.77 |
| Krejwelek | 429.4 | 61.4 | 12.0 | 4.9 | 1.5 | 244.6 | 10.0 | 3.3 | 337.7 | 0.79 |
| Linówek | 218.3 | 31.4 | 6.2 | 1.9 | 1.0 | 121.0 | 3.6 | 0.8 | 165.9 | 0.76 |
| Okrągłe | 430.3 | 62.6 | 11.9 | 4.9 | 1.5 | 245.6 | 9.0 | 3.1 | 338.6 | 0.79 |
| Perty | 352.6 | 49.7 | 9.8 | 4.3 | 1.4 | 197.9 | 6.2 | 2.7 | 272.0 | 0.77 |
| Pogorzełek | 172.7 | 25.1 | 4.3 | 1.9 | 1.0 | 94.1 | 2.2 | 0.3 | 128.9 | 0.75 |
| Postawelek | 418.7 | 61.3 | 11.6 | 4.2 | 1.6 | 235.2 | 8.0 | 3.6 | 325.5 | 0.78 |
| Przechodnie | 418.0 | 61.1 | 11.6 | 4.7 | 1.5 | 236.6 | 8.9 | 3.7 | 328.1 | 0.78 |
| Purwin | 473.0 | 69.4 | 12.0 | 5.2 | 1.9 | 276.4 | 10.5 | 3.9 | 379.3 | 0.80 |
| Purwinek | 503.0 | 72.5 | 13.5 | 5.1 | 2.0 | 285.3 | 12.4 | 4.0 | 394.8 | 0.78 |
| Szurpiły | 356.7 | 49.0 | 10.5 | 4.1 | 1.5 | 192.9 | 8.8 | 2.5 | 269.3 | 0.75 |
| Udziejek | 380.1 | 53.1 | 11.3 | 4.7 | 1.6 | 213.9 | 9.0 | 2.6 | 296.2 | 0.78 |
| Wodziłki | 467.0 | 65.7 | 12.3 | 5.1 | 1.7 | 268.3 | 8.8 | 3.9 | 365.8 | 0.78 |
Table 4.
Climatic models for estimation of multiannual changes of mean surface water conductivity of all SLP lakes (EC) and Lake Hańcza (ECLH). Explanations: T—Average annual temperature (°C), PP—Total annual precipitation (mm).
Table 4.
Climatic models for estimation of multiannual changes of mean surface water conductivity of all SLP lakes (EC) and Lake Hańcza (ECLH). Explanations: T—Average annual temperature (°C), PP—Total annual precipitation (mm).
| Model Type | Model | R2 | p | N |
|---|---|---|---|---|
| EC(25 °C) = f (T) | EC(25 °C) = 12.035 T + 292.4 | 0.134 | 0.476 | 6 |
| EC(25 °C) = f (PP) | EC(25 °C) = 0.077 PP + 338.4 | 0.109 | 0.524 | 6 |
| EC(25 °C) = f (T,PP) | EC(25 °C) = 41.495 T + 0.291 PP − 101.5 | 0.867 | 0.047 | 6 |
| EC(25 °C)LH = f (T,PP) | EC(25 °C)LH = 11.416 T + 0.041 PP + 169.2 | 0.694 | 0.003 | 13 |
© 2020 by the authors. Licensee MDPI, Basel, Switzerland. This article is an open access article distributed under the terms and conditions of the Creative Commons Attribution (CC BY) license (http://creativecommons.org/licenses/by/4.0/).
Share and Cite
MDPI and ACS Style
Borowiak, M.; Borowiak, D.; Nowiński, K. Spatial Differentiation and Multiannual Dynamics of Water Conductivity in Lakes of the Suwałki Landscape Park. Water 2020, 12, 1277. https://doi.org/10.3390/w12051277
AMA Style
Borowiak M, Borowiak D, Nowiński K. Spatial Differentiation and Multiannual Dynamics of Water Conductivity in Lakes of the Suwałki Landscape Park. Water. 2020; 12(5):1277. https://doi.org/10.3390/w12051277
Chicago/Turabian StyleBorowiak, Magdalena, Dariusz Borowiak, and Kamil Nowiński. 2020. "Spatial Differentiation and Multiannual Dynamics of Water Conductivity in Lakes of the Suwałki Landscape Park" Water 12, no. 5: 1277. https://doi.org/10.3390/w12051277
Note that from the first issue of 2016, this journal uses article numbers instead of page numbers. See further details here.