Article

Capacity of Two Ornamental Species (Iris sibirica and Zantedeschia aethiopica) to Take up, Translocate, and Accumulate Carbamazepine under Hydroponic Conditions

Quality Environmental Laboratory, Centro Universitario de la Ciénega, University of Guadalajara, Ocotlan, Jalisco 47810, Mexico
*
Author to whom correspondence should be addressed.
Water 2020, 12(5), 1272; https://doi.org/10.3390/w12051272
Submission received: 14 April 2020 / Revised: 24 April 2020 / Accepted: 27 April 2020 / Published: 30 April 2020

Abstract

:
Iris sibirica and Zantedeschia aethiopica are ornamental species that have previously been used in pilot-scale treatment wetlands (TWs) focused on the removal of carbamazepine (CBZ), in which good results were obtained; however, the plant influence was not completely determined. In addition, plant uptake has been reported to play a crucial role in CBZ removal in comparison to other mechanisms. Therefore, the aim of this study was to evaluate the capacity of I. sibirica and Z. aethiopica to take up, translocate, and accumulate CBZ in hydroponic conditions using a nutrient solution spiked with the drug. The maximum CBZ tolerance threshold for the two species was found to be 10 mg/L, which was used to carry out the uptake experiments. The results showed a better performance of I. sibirica compared to Z. aethiopica reaching 31.1% and 20.9% of removal efficiency, respectively. The parent compound accumulated mainly on the leaves of both species. Furthermore, a high proportion of the CBZ taken up by the plants (up to 70%) was metabolized by both species. The performance of the two species suggests the importance of plant harvesting in TWs in order to promote CBZ removal and indicates the need for future works.

1. Introduction

Nowadays, pharmaceuticals represent a group of aquatic environment pollutants of great concern mainly due to their massive use, worldwide occurrence in aquatic environments at trace levels, and physicochemical characteristics [1]. A production of more than 2 million of tons per year of a diversity of these compounds has been reported; this quantity increases every year [2,3] and includes more than 6 million of commercial products [4]. The physicochemical characteristics are very variable among pharmaceutical products, but all of them are biological active substances in low concentrations and, therefore, may cause adverse effects on human health and species exposed to polluted environments [4]. Even now, however, their effects individually or together on living beings are not fully understood. In addition, the major concern is with regard to recalcitrant drugs, such as carbamazepine (CBZ), which persist in reclaimed water after conventional wastewater treatments [5]. Effluents from wastewater treatment plants represent the main source for the entry of CBZ into aquatic ecosystems [6]. CBZ is a drug used to treat a large number of mental diseases and compulsive disorders [5,7] and it is widely consumed worldwide, reaching up to 96% of the world pharmaceutical market [8]. As a consequence, according to some studies, CBZ is one of the drugs that is most frequently detected in aquatic environments around the world [9,10]. Therefore, for more than a decade, CBZ has been categorized as an anthropogenic marker in aquatic environments [11]. Moreover, several studies that have assessed the effects of CBZ on different living organisms indicate that this drug is among the most dangerous in aquatic ecosystems [6,12,13,14,15,16].
On the other hand, treatment wetlands (TWs) have been evaluated in many studies for the removal of a large list of pharmaceuticals and have proven to be effective at different levels, with a very high removal of some drugs. However, CBZ is commonly found among drugs with low removal efficiencies, generally lower than 50% with an average of 30% [17]. Nevertheless, a previous study performed by this research group found a CBZ removal efficiency of 62% in a pilot-scale hybrid TW. In this study, the greater removal was obtained in horizontal subsurface flow wetlands (48%) planted with a polyculture that included Iris sibirica, Typha latifolia, and Zantedeschia aethiopica. The horizontal subsurface flow wetland was located as the first stage and operated with a flow rate of 33.3 L/d, a theoretical hydraulic retention time of three days and a hydraulic loading rate of 6.9 cm/d [18]. It is very likely that the plants played a very important role in obtaining such efficiencies, because at the end of the experimentation period, CBZ was found in the roots and aerial tissues of the three species, with higher values in the ornamental plants. CBZ uptake by emergent vegetation in both hydroponic studies and TWs has already been reported in the literature [19], as well as the recognition of plants capacity to uptake, translocate, accumulate, and even metabolize organic compounds [1,17]. However, currently there is insufficient information regarding the contribution of plants to the elimination of pharmaceuticals, as most studies are based solely on the comparison of concentrations between influents and effluents. In addition, for CBZ removal, according to [19], plant uptake is an especially important mechanism in comparison to other degradation mechanisms.
Due to the aforementioned reasons, and to optimize the removal of CBZ in TWs, a deeper understanding of plant performance is required when continuously exposed to the drug. This would allow determining the real potential of the species as a part of CBZ removal mechanisms by knowing the final destination of CBZ after the uptake process, at least partially. This can be carried out under hydroponic conditions that have demonstrated to be a good strategy to obtain information regarding plant potential for phytoremediation [20]. Therefore, the aim of this study was to evaluate the CBZ tolerance by I. sibirica and Z. aethiopica (two species that were already used in TWs for CBZ removal), as well as to study the capacity of the plants to uptake, translocate, and accumulate CBZ under hydroponic conditions.

2. Materials and Methods

2.1. Tests to Assess CBZ Tolerance by I. sibirica and Z. aethiopica

In order to determine the maximum concentration of CBZ tolerated by each macrophyte species, the plants were exposed in triplicate, to three different concentrations of CBZ, i.e., 5, 10, and 15 mg/L, for 21 days. Control plants without exposure to CBZ were included. The plants were placed individually in 1 L plastic containers with 500 mL of modified Hoagland nutrient solution [21]. Each concentration of CBZ was obtained by adding aliquots from a stock solution of methanol, with a concentration of 20 g/L (CBZ standard 99% purity, Sigma–Aldrich reagent, Saint Louis, MO, USA). The initial pH was adjusted to 6 in each container using solutions of citric acid and sodium hydroxide, before the addition of the plants. The plants for the tests were selected from the laboratory nursery and had a height of approximately 30 cm and an average weight of 39.74 ± 7.9 g and 37.11 ± 4.1 g for I. sibirica and Z. aethiopica, respectively. The tests were performed under controlled conditions in a plant growth chamber with fluorescent lamps at 20.1 ± 1 °C and 70 ± 6% relative humidity (% RH). The photoperiod was 13 h light per day with a photosynthetic photon flux density (PPFD) of approximately 154 µmol/m2, measured by a LI-COR LI-250A light portable meter couple (LI-COR Bioscience, Lincoln, NE, USA) to a LI-COR LI-109R quantum sensor (LI-COR Bioscience, Lincoln, NE, USA).
The tolerance of CBZ by plants was measured through daily monitoring of the relative chlorophyll content (RChlC), evapotranspiration rate (ET), and pH solution. Additionally, the relative growth rate (RGR) was calculated at the end of the exposure period. RChlC was selected as a control parameter due to the impossibility of using destructive tests along the experimentation. However, before the experiment, a correlation between the real chlorophyll content (mg/g dry weight) and RChlC was obtained, where the latter parameter was measured with a portable KONICA MINOLTA Spad 502 Plus meter (Konica Minolta, Inc., Chiyoda-Ku, Tokyo, Japan) and the real chlorophyll content was determined following the methodology reported by [22]. With regard to ET, the reduction in the volume of nutrient solution was quantified and then recovered with distilled water in order to maintain the same volume along the experiment. With respect to pH readings, they were taken once the volume of nutrient solution was adjusted to the initial value using a HI-pH211 pH Hanna meter (Scientific Instrumentation, Woonsocket, MA, USA). Finally, after 21 days of experimentation, the plants were removed from each container, dried with paper towels and weighed to obtain the fresh weight in order to calculate the RGR values according to the equation reported by [23].
The values of RChlC, ET, and pH were used as response variables for statistical analysis in a randomized complete block design. A significance level of p = 0.05 was used for all statistical tests. An analysis of variance (ANOVA) was performed using the STATGRAPHICS CENTURION XVII software (StatPoint Technologies, Inc., Warrenton, VA, USA). When a significant difference was observed between treatments in the ANOVA procedure, multiple comparisons were made using the least significant difference (LSD) test for differences between means.

2.2. Assessment of CBZ Uptake, Translocation, and Accumulation by I. sibirica and Z. aethiopica

The experiments were carried out with both species of macrophytes following the same methodology, as well as the operating conditions of temperature, % RH, PPFD and photoperiod reported in the previous section. The concentration of CBZ that was used at this stage of the study was determined from the tolerance tests described in the previous section, selecting the maximum concentration tolerated by each species. The exposure times to CBZ were 0.5, 1, 3, 7, 14, and 21 days; four plants were individually exposed to the drug and two control plants were exposed only to the Hoagland nutrient solution for each exposure time. A uniform plant size was maintained by selecting individuals with a height of around 30 cm and a mean weight of 41.5 ± 4.64 g and 38.7 ± 3.97 g for I. sibirica and Z. aethiopica, respectively. Additionally, similar to the tolerance tests, RChlC, ET, RGR, and pH were measured in each assay to confirm the plant’s tolerance to CBZ at the selected concentration.
After each exposure time, the plants were removed from the containers and the nutrient solution was collected to measure the residual CBZ concentration. In addition, the roots of two plants per each test of exposure time were washed with 50 mL of acetone, which was recovered and diluted with distilled water (in a 1:3 proportion) to obtain an aqueous sample and quantify the CBZ adsorbed externally on the roots. Then, the four plants per each exposure time were dried with paper towels and separated in aerial (leaves and stem for Z. aethiopica and leaves for I. sibirica) and underground part. These plants were dried at 40 °C for 120 h and ground with a coffee grinder, and mortar and pestle and then kept in a desiccator until their analysis for CBZ concentration.

2.3. Quantification of CBZ in Aqueous Samples and Plant Tissues

The quantification of CBZ in aqueous samples and plant tissues was carried out based on what was reported by [18] previously. First, a sample of 10 mL of each nutrient solution and the entire volume of acetone–water (from the washed roots) were taken. Then, each sample was filtered through 1.6 µm GF/A Whatman fiber glass filter (Whatman Inc., Piscataway, NJ, USA). Thereafter, it was submitted to a solid phase extraction (SPE) using Strata-X cartridges (200 mg/6 cc, Phenomenex, Torrance, CA, USA) that were conditioned with 5 mL of methanol and then 5 mL of deionized water. The sample was eluted at 2 mL/min and once it passed through the cartridges, 5 mL of deionized water was added again to remove any impurity that could cause interferences in the final analysis. Finally, after 60 min of the vacuum dry process, the CBZ was eluted by 10 mL of methanol; 1 mL of this final elution was filtered through 0.2 µm polytetrafluoroethylene (PTFE) syringe filter to be used for CBZ detection and quantification by high pressure liquid chromatography (HPLC).
On the other hand, the procedure for plant tissues was very similar to that mentioned above; however in this case, the first step was to carry out an extraction by sonication on the different samples of dry biomass. The totality of each dry biomass sample was processed, however, the original sample was divided into a smaller quantity of approximately 1 g to carry out the extraction process. The 1 g subsamples were transferred to a 50 mL corning tube and sonicated twice for 20 min, first with 15 mL of methanol and then with 15 mL of acetone.
The organic phases obtained after the extraction process from the same sample were mixed and then diluted with deionized water in a proportion of 1:3. This dilution was filtered and submitted to SPE as mentioned previously. The final elution was concentrated to near dryness with a rotary evaporator (IKA HB 10, IKA Works, Inc., Wilmington, NC, USA) at 40 °C. Then it was recovered to 1 mL with methanol which was filtered using 0.2 µm PTFE filter for further analysis.
The quantification of CBZ was conducted in a Waters HPLC with a binary pump (Waters 1525, Waters Corporation, Milford, MS, USA) and a UV-Vis detector with diode array (Waters 2998, Waters Corporation, Milford, MS, USA). The detection method for aqueous samples was a modification from those reported by [24] and [25], while for samples obtained from biomass extraction, the method was a modification from [26]. The method consisted of a reverse-phase, therefore a C18 symmetry column (75 mm long, 4.6 mm internal diameter, and 3.5 µm particle size) was used. Additionally, acetonitrile and acidified water by orthophosphoric acid in a proportion of 55:45:0.1, was used as the mobile phase. The flow rate was 1 and 0.7 mL/min for aqueous and biomass extraction samples, respectively, using a gradient configuration. The retention times were 3.4 min and 28 min, respectively; and a wavelength of 285 nm was used for CBZ detection.

3. Results and Discussion

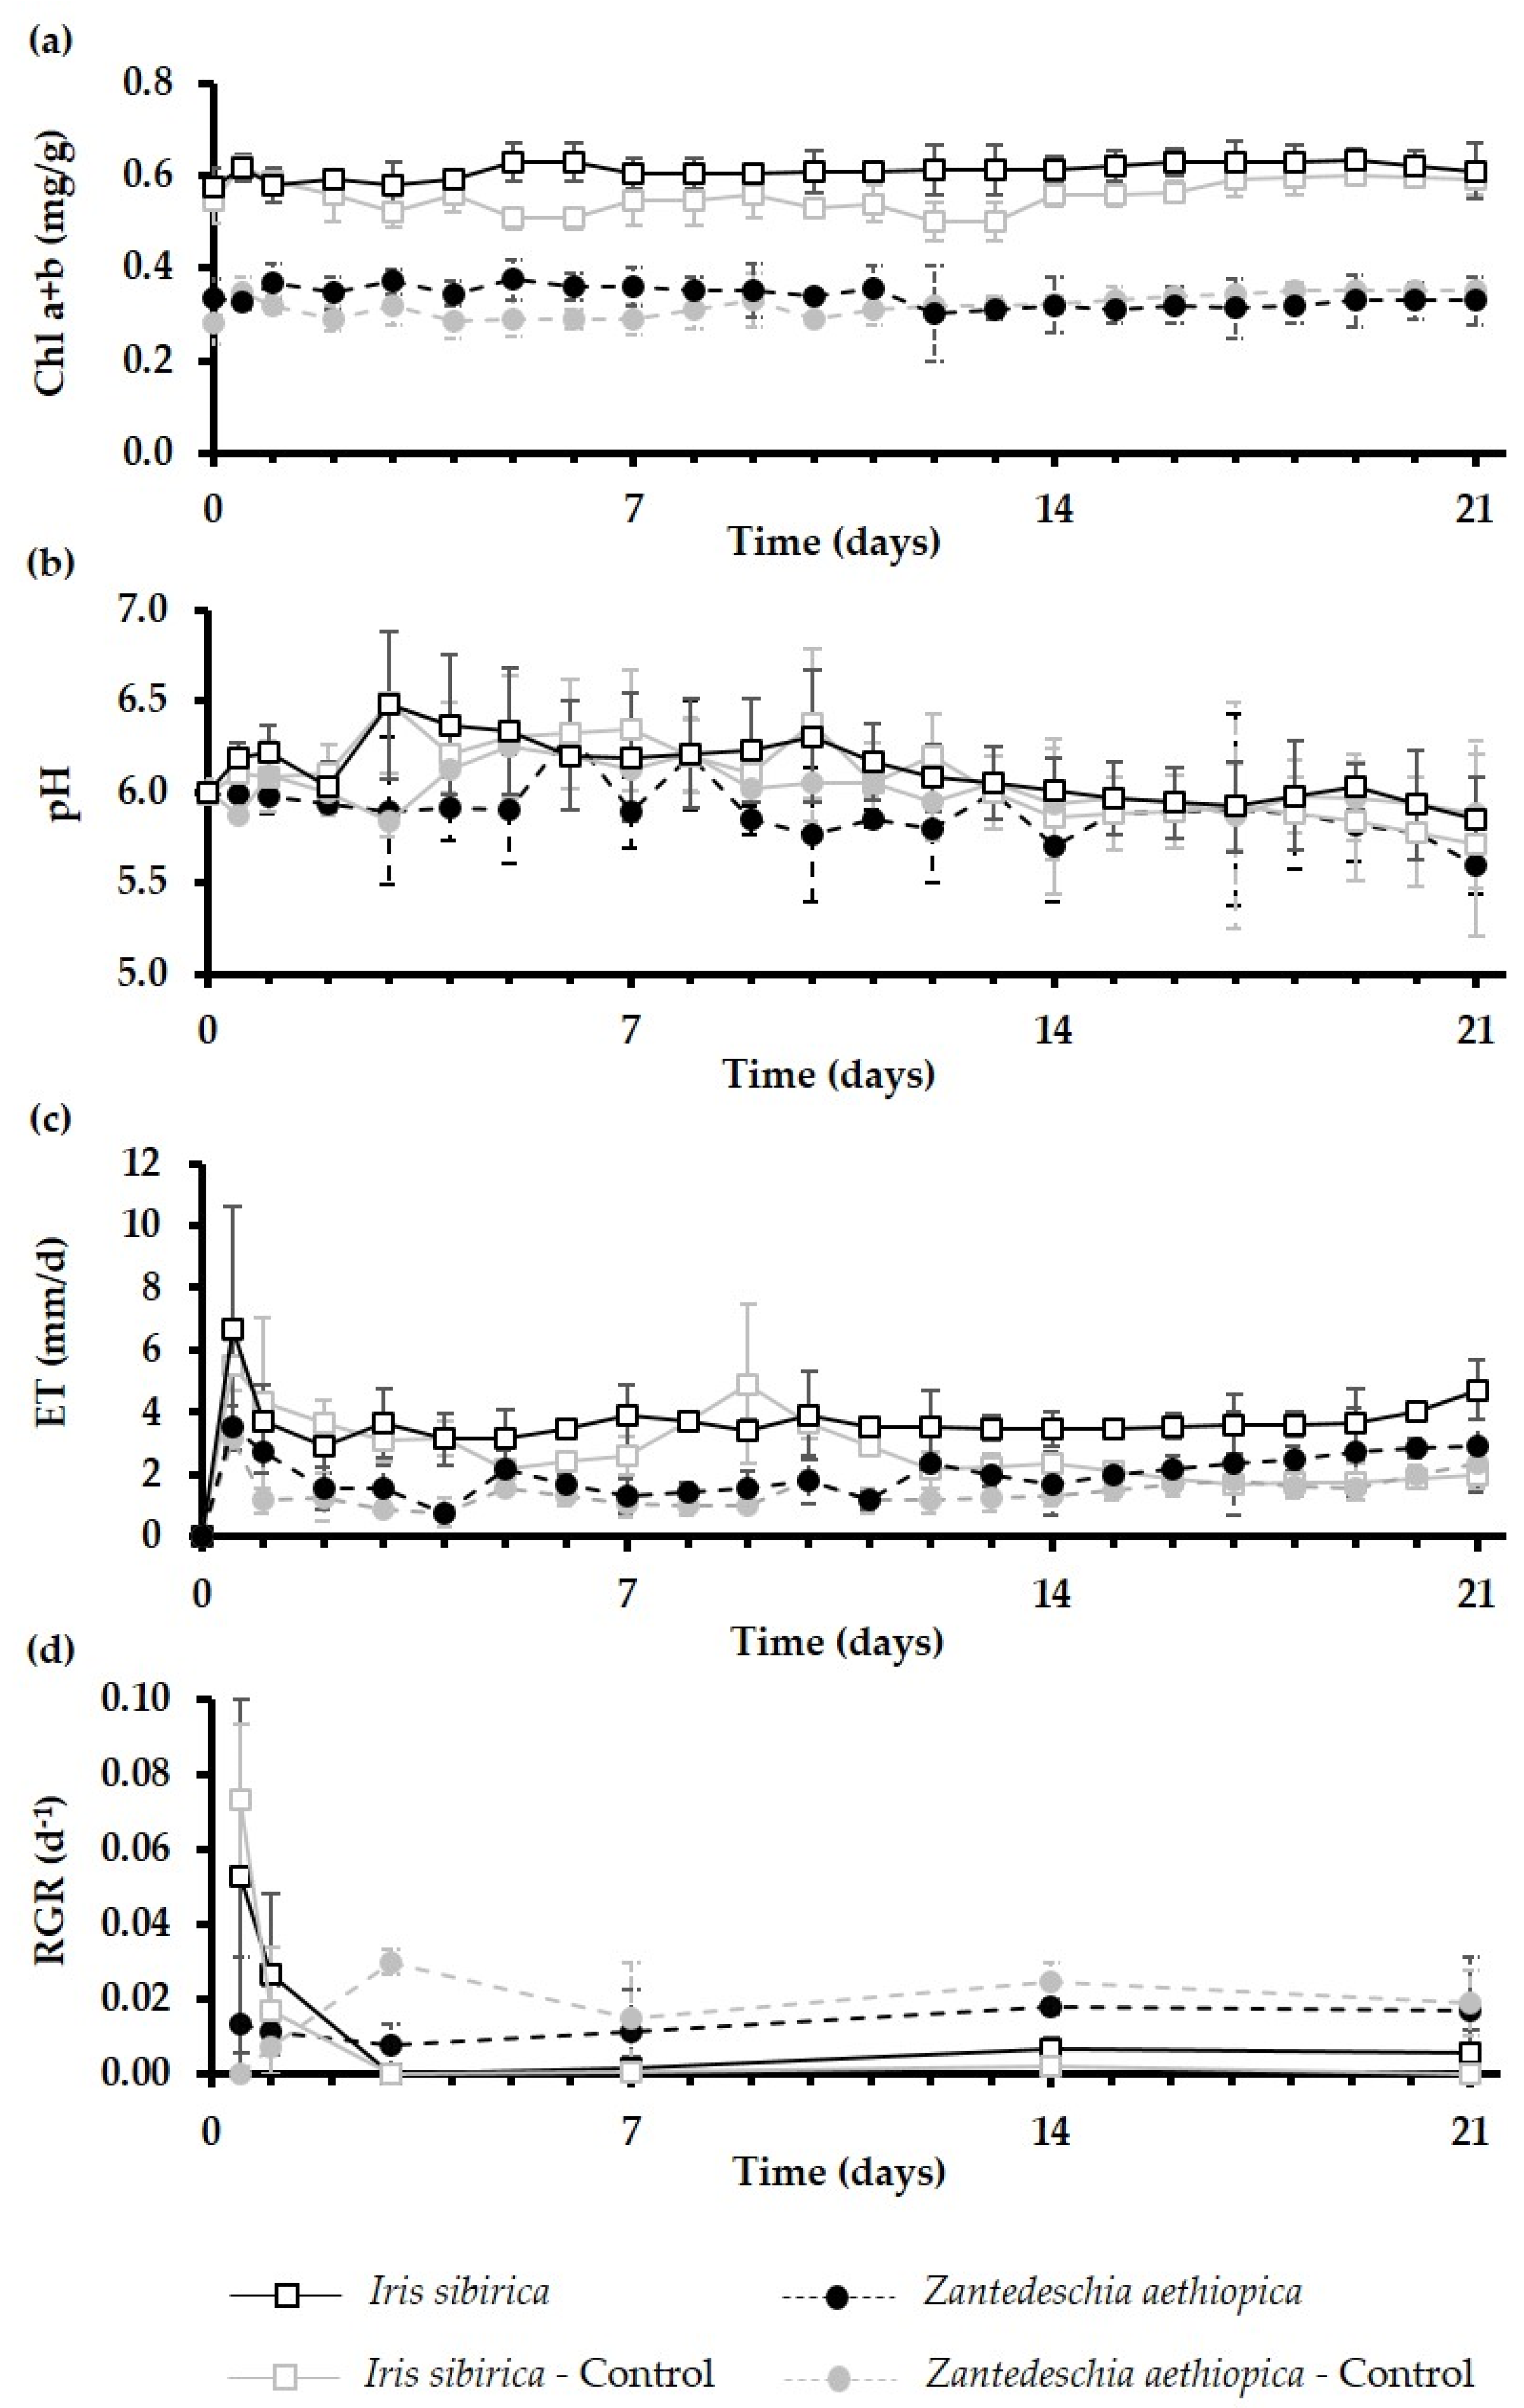
3.1. CBZ Tolerance by I. sibirica and Z. aethiopica

The results corresponding to I. sibirica showed a significant difference in three of the evaluated parameters (Table 1), two of which were RChlC and ET that exhibited a tendency towards lower values as the CBZ concentration increased. The third parameter was pH, that in contrast, showed an increasing tendency. In opposition to these parameters, RGR showed no significant differences, indicating a similar biomass production between plants exposed and not exposed to CBZ.
With regard to Z. aethiopica, the results are reported in Table 2. In this case, the statistical analysis revealed significant differences only for RChlC and ET, which showed a trend towards lower values as the CBZ concentration increased. According to these results, it is possible to determine that a CBZ concentration of 10 mg/L is the maximum tolerance threshold for both species, due to the statistical equality between the tests with 5 and 10 mg/L of CBZ (that even in some cases showed values similar to those obtained in the control tests). The tolerance of these two ornamental species to CBZ is higher in comparison to Typha spp. and Scirpus validus, whose maximum tolerated concentration was 2 mg/L [27,28]. This could probably indicate better resistance when exposed to CBZ over a prolonged period, as found by [18] in a 12-month study where Thypha latifolia did not survive.
On the other hand, the changes in the parameters evaluated are involved in the detoxification process in plants [20], which is reflected in the decrease of ET rate and RChlC for both species. This reduction in the ET rate, probably generated an alteration in the electron transport chain, diminishing the production of NADPH (Nicotineamide Adenine Dinucleotide Phosphate) and ATP (Adenosine Triphosphate) due to the lesser amount of water available, which is a crucial in the process conducted by photosystem II [29,30]. Additionally, this effect in plants may also be related to a lower uptake of inorganic nutrients, as both are transported by xylem [31] and, in consequence affect the chlorophyll content. According to [32], nitrogen deficiency can cause chlorophyll reduction and even chloroplast alterations, since this nutrient is closely related to the content of this pigment in plants; this could be an explanation of the decrease in RChlC registered in this study. Moreover, this reduction in chlorophyll was probably intensified by the deficient photosynthetic activity [32] mentioned above.

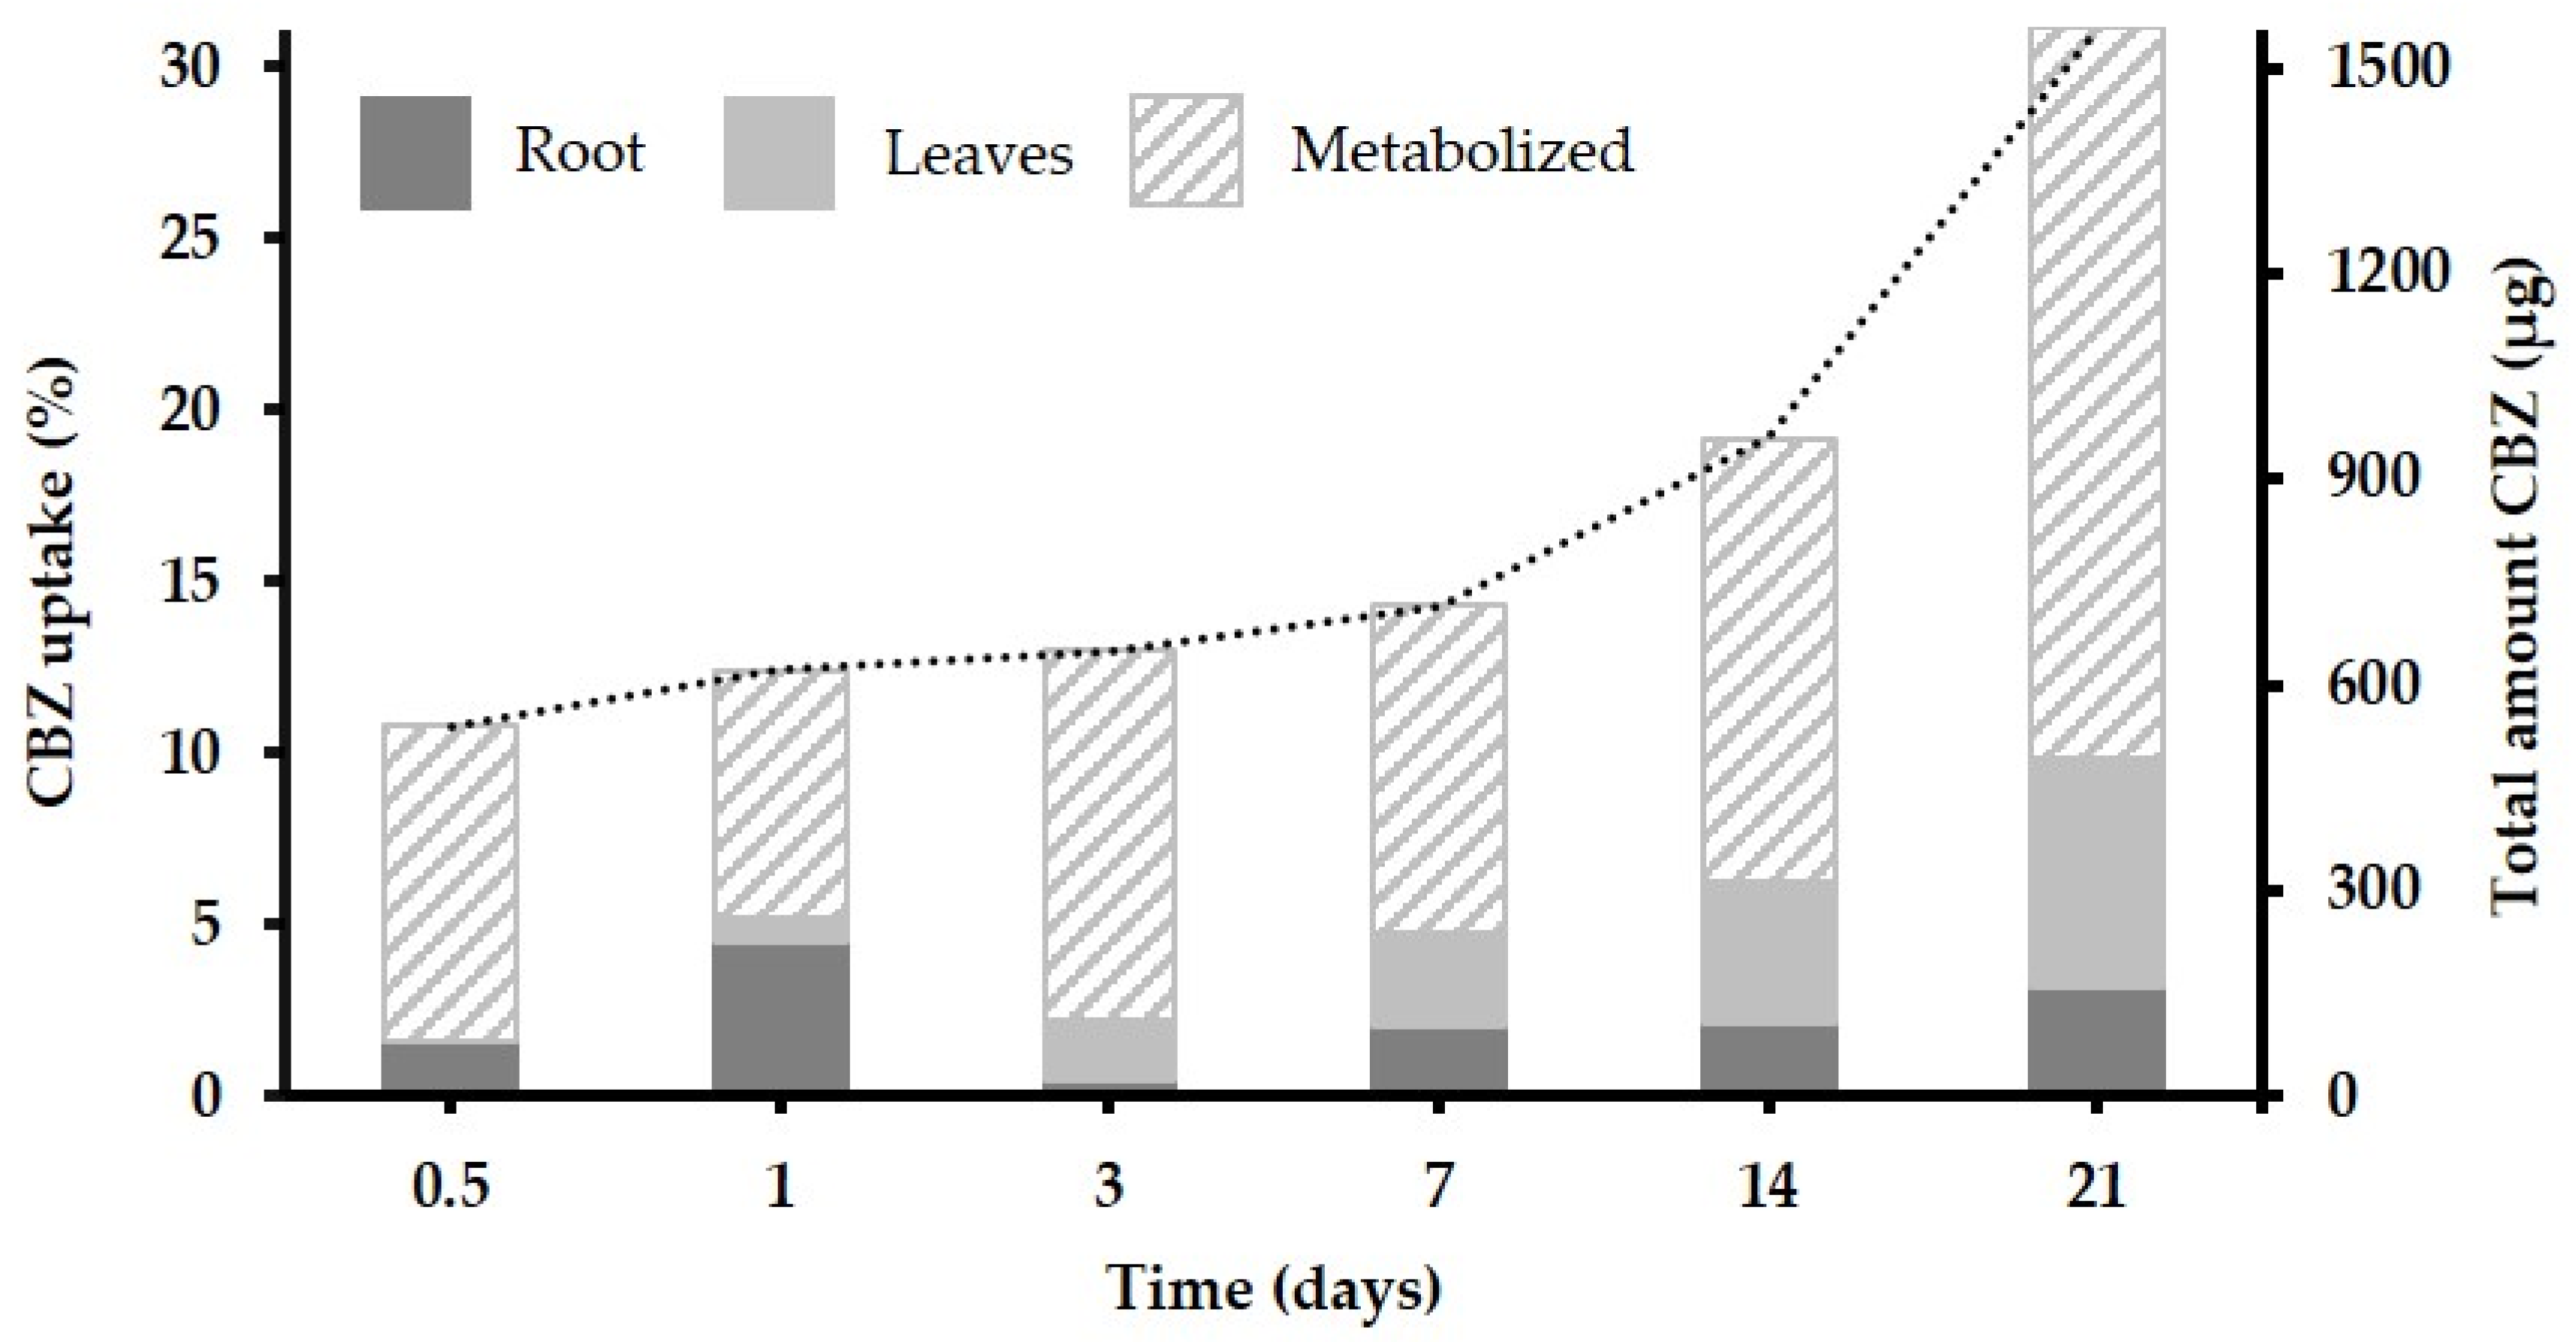
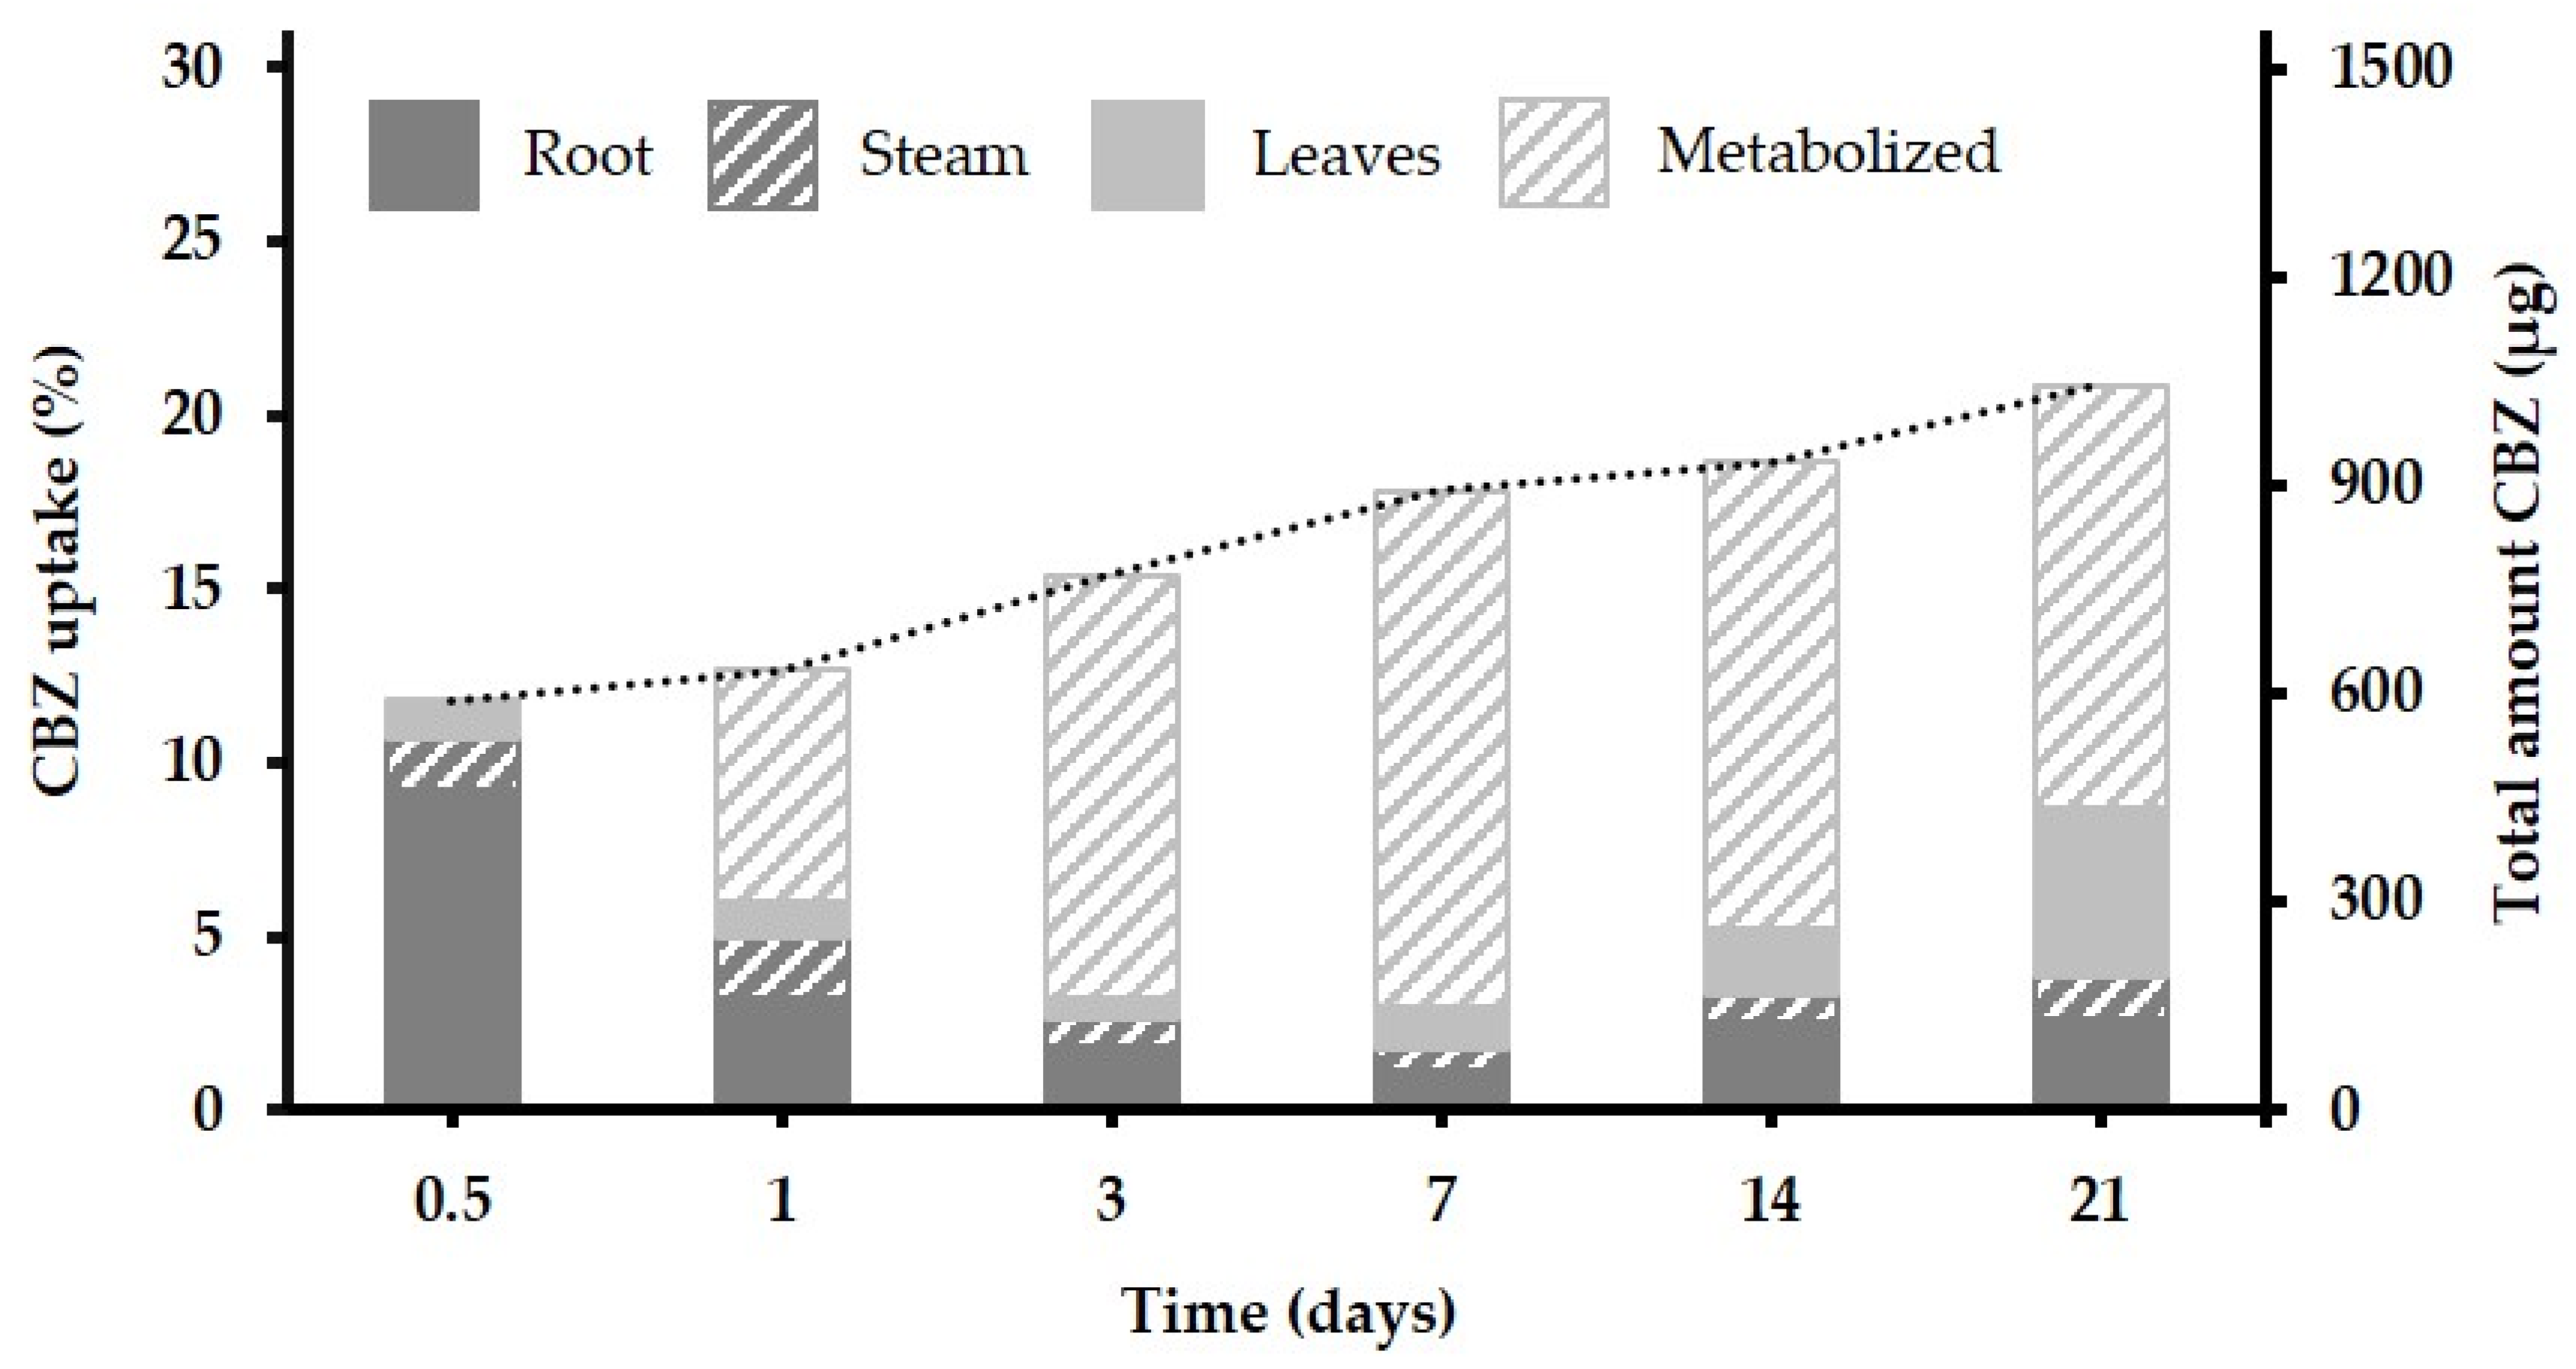
3.2. Uptake, Translocation and Accumulation of CBZ

As previously mentioned, the measurements of control parameters were taken once again in this part of the study performed with the selected concentration of 10 mg/L of CBZ. The results confirmed that the species have capacity to cope with this concentration of CBZ, as they did not show important physiological alterations in this new exposure to the drug (Figure 1).
Regarding the performance of the plants, each species showed a particular behavior; which it is an expected fact. According to different reports, micro-pollutant uptake depends on the species of the plant as well as the specific drug [33].
With regard to I. sibirica, a constant increase in the percentage of CBZ uptake was observed as the exposure time increased, reaching a value of 31.1 ± 1.9% after 21 d, which corresponds to a total of 1557 ± 97 µg of CBZ (Figure 2) removed from the nutrient solution. This amount is greater than those removed by one plant in similar experiments with Typha spp. [27] and Scirpus validus [28]. On the other hand, CBZ was detected in roots since the first 12 h of exposure and in each exposure time, reaching an accumulation of 161 ± 46 µg after 21 d (approximately 3.2% of the CBZ initial mass), with a final mean concentration of 13 µg/g fresh weight (FW) roots. The analysis of samples from washed roots indicated that CBZ was located primarily within root tissues and that only a minimal percentage was superficially adsorbed, i.e., 0.04%. In addition, it can be observed that the highest and lowest uptake percentages were obtained at 1 day and 3 days, respectively, which probably indicates the activation of detoxification reactions in this interval of time. This can probably be linked to the mechanisms of nutrient transports from the root to the xylem and even related to ET, which was one of the most affected parameters according to the results registered for the control parameters (Figure 1), as well as those obtained in the previous section (Table 1). Furthermore, after 3 days of exposure, the uptake by the roots showed a slight increase as time increased; this behavior partially adjusts to a linear trend (R2 = 0.84) that has been previously reported as an expected behavior in the absorption of neutral molecules such as CBZ [20]. Regarding the leaves, the presence of CBZ was detected after the first day of exposure, showing a continuous increase as the period of exposition increased, reaching an accumulation of 332 ± 36 µg with 21 days (approximately 6.6% of the initial amount of CBZ in the nutrient solution) and an average concentration of 15.4 µg/g FW leaves. The molecule of CBZ is slightly hydrophilic with a log Kow of 2.45 [27], therefore it can be transported to aerial tissues by transpiration [20].
Finally, as Figure 2 shows, for each exposure time, the highest proportion of the CBZ taken up by the plants was probably transformed or even phytodegraded. This metabolized part showed a tendency to increase along the 21 d, and the highest value was reached with 21 days of exposure (with 21.2% of the initial mass). This is approximately 1 mg of CBZ that it is not present as a parent compound in the plant tissue and represents approximately 70% of the CBZ uptake by I. sibirica. A greater transformation percentage of CBZ (86%) by Typha spp. was reported by [27], who argue that CBZ may probably be transformed into the metabolite 10,11-dihydro-10,11-epoxycarbamazepine (CBZ-EP). The latter is in line with the literature where it has been reported that the transformation of micro-pollutants or their conjugation with small biomolecules, such as glucose and amino acids, represents the second stage of detoxification process in plants. The third and last stage is related to the transport, accumulation, and even degradation of the molecules generated in the second stage [20], which may explain the results mentioned above as well as those reported bellow.
With respect to Z. aethiopica (Figure 3), this species showed a similar trend to an increase in the uptake of CBZ as the exposure time increased; however, its capacity was lower in comparison to I. sibirica, reaching a maximum uptake of 20.9 ± 3.5% of the initial mass of the drug, equivalent to 1044 ± 175 µg of CBZ. In this case, the presence of the drug in the roots was detected in all periods of exposure, but the highest uptake was found at 0.5 day, from where it decreased to the lowest value at 7 days. Such behavior might be considered as an adaptation period of the plant, because after that, a slight increase was observed, but with similar uptake rates at 14 and 21 days, reaching 133 ± 51 µg (approximately 2.6% of the initial CBZ mass) with an average concentration of 12.3 µg/g of FW roots along the experiment. The probable adaptation of the plant is supported by the work of [27], who reported that CBZ affects the normal growth of plants when suddenly exposed, but plants eventually have the capacity to cope with its toxic effects and continue to extensively remove the compound, as well as to recover their normal growth rate, as shown in Figure 1d. Similar to I. sibirica, the CBZ adsorbed superficially on the roots was only 0.03% of the initial mass. Regarding the stems, evaluated only for Z. aethiopica due to its morphology, they contributed with the lowest accumulation of CBZ, with 61 ± 22 µg after 21 days of exposure that represents approximately 1.2% of initial mass and only 8.5 µg/g of FW steams. With regard to the leaves, the presence of CBZ was detected in all periods of exposure, in contrast to the results with I. sibirica. After 21 days, the highest proportion of the parent molecule was accumulated in this tissue with an amount of 242 ± 39 µg, approximately 4.85% of the initial mass, and a mean concentration of 14.4 µg/g of FW leaves showing a close performance to that of I. sibirica. Another similarity between the two species was the high proportion of CBZ that was transformed. The results of CBZ detection in roots, stems, and leaves revealed a difference between the amount removed from the nutrient solution and the amount quantified in the plant tissues. In this case, the highest amount of transformed CBZ (21.1% of the initial mass) was reached after 21 days (Figure 3). This is approximately 0.6 mg of CBZ and represents the 58% of the CBZ taken up by Z. aethiopica.

4. Conclusions

In general, the two ornamental species showed a high tolerance to CBZ as the plants survived the periods of exposure where the drug concentration was close to its maximum solubility in water, i.e., 17.7 mg/L at 25 °C [5]. However, a CBZ concentration of 10 mg/L was the maximum tolerance threshold for both species. Additionally, the result obtained from the experiments confirmed the capacity of I. sibirica and Z. aethiopica to take up, translocate, and accumulate CBZ as well as to demonstrate that the leaves are the main part for the accumulation of the parent compound. Furthermore, the capacity of the species was higher than that of common wetland macrophytes. Moreover, I. sibirica showed a higher capacity for CBZ uptake than Z. aethiopica, such that these two species removed up to 31.1% and 20.9%, respectively, of the initial amount of CBZ in the nutrient solution. Therefore, I. sibirica would be a better alternative to increase the removal of CBZ in real scale TWs. More importantly, it was also evident that a high proportion of the CBZ taken up by the plants (up to 70%) was metabolized by both species in a process that probably includes phytodegradation. Finally, this study contributes to a better understanding of the processes involved in pharmaceutical removal in TWs and in particular validates the crucial role of vegetation that has been hypothesized in scientific literature. In addition, the capacity of these two ornamental macrophytes for CBZ uptake suggests the importance of plant harvesting in TWs in order to promote the removal efficiency. Nevertheless, future works are needed in order to detect and quantify the metabolites produced in the process as well as to study the probable mineralization of the drug.

Author Contributions

F.Z. conceived and designed the experiments, as well as reviewed and edited the manuscript; A.T. performed the experiments, analyzed the data, and wrote the paper under the supervision of F.Z. All authors have read and agreed to the published version of the manuscript.

Funding

This research received no external funding.

Acknowledgments

Graduate scholarship for Allan Tejeda was provided by National Council for Science and Technology of México.

Conflicts of Interest

The authors declare no conflict of interest.

References

  1. Zhang, D.Q.; Gersberg, R.M.; Hua, T.; Zhu, J.; Goyal, M.K.; Ng, W.J.; Tan, S.K. Fate of pharmaceutical compounds in hydroponic mesocosms planted with Scirpus validus. Environ. Pollut. 2013, 181, 98–106. [Google Scholar] [CrossRef] [PubMed]
  2. Rienzie, R.; Ramanayaka, S.; Adassooriya, N.M. 12—Nanotechnology applications for the removal of environmental contaminants from pharmaceuticals and personal care products. In Pharmaceuticals and Personal Care Products: Waste Management and Treatment Technology; Prasad, M.N.V., Vithanage, M., Kapley, A., Eds.; Butterworth-Heinemann: Oxford, UK, 2019; pp. 279–296. [Google Scholar]
  3. Wang, J.; Wang, S. Removal of pharmaceuticals and personal care products (PPCPs) from wastewater: A review. J. Environ. Manag. 2016, 182, 620–640. [Google Scholar] [CrossRef] [PubMed]
  4. Wang, Y.; Yin, T.; Kelly, B.C.; Gin, K.Y.-H. Bioaccumulation behaviour of pharmaceuticals and personal care products in a constructed wetland. Chemosphere 2019, 222, 275–285. [Google Scholar] [CrossRef]
  5. Zhang, Y.; Geißen, S.-U.; Gal, C. Carbamazepine and diclofenac: Removal in wastewater treatment plants and occurrence in water bodies. Chemosphere 2008, 73, 1151–1161. [Google Scholar] [CrossRef] [PubMed]
  6. Chen, X.; Hu, Z.; Zhang, Y.; Zhuang, L.; Zhang, J.; Li, J.; Hu, H. Removal processes of carbamazepine in constructed wetlands treating secondary effluent: A review. Water 2018, 10, 1351. [Google Scholar] [CrossRef]
  7. Dordio, A.V.; Estêvão Candeias, A.J.; Pinto, A.P.; Teixeira da Costa, C.; Palace Carvalho, A.J. Preliminary media screening for application in the removal of clofibric acid, carbamazepine and ibuprofen by SSF-constructed wetlands. Ecol. Eng. 2009, 35, 290–302. [Google Scholar] [CrossRef]
  8. Mohapatra, D.P.; Brar, S.K.; Tyagi, R.D.; Picard, P.; Surampalli, R.Y. Carbamazepine in municipal wastewater and wastewater sludge: Ultrafast quantification by laser diode thermal desorption-atmospheric pressure chemical ionization coupled with tandem mass spectrometry. Talanta 2012, 99, 247–255. [Google Scholar] [CrossRef]
  9. Fent, K.; Weston, A.A.; Caminada, D. Ecotoxicology of human pharmaceuticals. Aquat. Toxicol. 2006, 76, 122–159. [Google Scholar] [CrossRef]
  10. Li, W.C. Occurrence, sources, and fate of pharmaceuticals in aquatic environment and soil. Environ. Pollut. 2014, 187, 193–201. [Google Scholar] [CrossRef]
  11. Clara, M.; Strenn, B.; Ausserleitner, M.; Kreuzinger, N. Comparison of the behaviour of selected micropollutants in a membrane bioreactor and a conventional wastewater treatment plant. Water Sci. Technol. 2004, 50, 29–36. [Google Scholar] [CrossRef]
  12. Ferrari, B.; Paxéus, N.; Lo Giudice, R.; Pollio, A.; Garric, J. Ecotoxicological impact of pharmaceuticals found in treated wastewaters: Study of carbamazepine, clofibric acid, and diclofenac. Ecotoxicol. Environ. Saf. 2003, 55, 359–370. [Google Scholar] [CrossRef]
  13. Houeto, P.; Carton, A.; Guerbet, M.; Mauclaire, A.-C.; Gatignol, C.; Lechat, P.; Masset, D. Assessment of the health risks related to the presence of drug residues in water for human consumption: Application to carbamazepine. Regul. Toxicol. Pharmacol. 2012, 62, 41–48. [Google Scholar] [CrossRef] [PubMed]
  14. Isidori, M.; Lavorgna, M.; Nardelli, A.; Pascarella, L.; Parrella, A. Toxic and genotoxic evaluation of six antibiotics on non-target organisms. Sci. Total Environ. 2005, 346, 87–98. [Google Scholar] [CrossRef] [PubMed]
  15. Thacker, P.D. Pharmaceutical data elude researchers. Environ. Sci. Technol. 2005, 39, 193A–194A. [Google Scholar] [CrossRef] [PubMed] [Green Version]
  16. Triebskorn, R.; Casper, H.; Scheil, V.; Schwaiger, J. Ultrastructural effects of pharmaceuticals (carbamazepine, clofibric acid, metoprolol, diclofenac) in rainbow trout (Oncorhynchus mykiss) and common carp (Cyprinus carpio). Anal. Bioanal. Chem. 2007, 387, 1405–1416. [Google Scholar] [CrossRef]
  17. Li, Y.; Zhu, G.; Ng, W.J.; Tan, S.K. A review on removing pharmaceutical contaminants from wastewater by constructed wetlands: Design, performance and mechanism. Sci. Total Environ. 2014, 468, 908–932. [Google Scholar] [CrossRef] [PubMed]
  18. Tejeda, A.; Torres-Bojorges, Á.X.; Zurita, F. Carbamazepine removal in three pilot-scale hybrid wetlands planted with ornamental species. Ecol. Eng. 2017, 98, 410–417. [Google Scholar] [CrossRef]
  19. Vo, H.-N.-P.; Bui, X.-T.; Nguyen, T.-M.-H.; Koottatep, T.; Bandyopadhyay, A. Insights of the Removal Mechanisms of Pharmaceutical and Personal Care Products in Constructed Wetlands. Curr. Pollut. Rep. 2018, 4, 93–103. [Google Scholar] [CrossRef]
  20. Wu, X.; Dodgen, L.K.; Conkle, J.L.; Gan, J. Plant uptake of pharmaceutical and personal care products from recycled water and biosolids: A review. Sci. Total Environ. 2015, 536, 655–666. [Google Scholar] [CrossRef]
  21. Dordio, A.V.; Duarte, C.; Barreiros, M.; Carvalho, A.J.P.; Pinto, A.P.; da Costa, C.T. Toxicity and removal efficiency of pharmaceutical metabolite clofibric acid by Typha spp.—Potential use for phytoremediation? Bioresour. Technol. 2009, 100, 1156–1161. [Google Scholar] [CrossRef]
  22. Porra, R.J. The chequered history of the development and use of simultaneous equations for the accurate determination of chlorophylls a and b. Photosynth. Res. 2002, 73, 149–156. [Google Scholar] [CrossRef]
  23. Turnbull, L.A.; Philipson, C.D.; Purves, D.W.; Atkinson, R.L.; Cunniff, J.; Goodenough, A.; Hautier, Y.; Houghton, J.; Marthews, T.R.; Osborne, C.P.; et al. Plant growth rates and seed size: A re-evaluation. Ecology 2012, 93, 1283–1289. [Google Scholar] [CrossRef]
  24. Dordio, A.; Carvalho, A.J.P.; Teixeira, D.M.; Dias, C.B.; Pinto, A.P. Removal of pharmaceuticals in microcosm constructed wetlands using Typha spp. and LECA. Bioresour. Technol. 2010, 101, 886–892. [Google Scholar] [CrossRef] [PubMed]
  25. Đorđević, S.; Kilibarda, V.; Stojanovic, T. Determination of carbamazepine in serum and saliva samples by high performance liquid chromatography with ultraviolet detection. Vojnosanit. Pregl. 2009, 66, 347–352. [Google Scholar] [CrossRef] [PubMed]
  26. Mattila, P.; Kumpulainen, J. Determination of free and total phenolic acids in plant-derived foods by HPLC with diode-array detection. J. Agric. Food Chem. 2002, 50, 3660–3667. [Google Scholar] [CrossRef] [PubMed]
  27. Dordio, A.V.; Belo, M.; Martins Teixeira, D.; Palace Carvalho, A.J.; Dias, C.M.B.; Picó, Y.; Pinto, A.P. Evaluation of carbamazepine uptake and metabolization by Typha spp., a plant with potential use in phytotreatment. Bioresour. Technol. 2011, 102, 7827–7834. [Google Scholar] [CrossRef] [PubMed]
  28. Zhang, D.Q.; Hua, T.; Gersberg, R.M.; Zhu, J.; Ng, W.J.; Tan, S.K. Carbamazepine and naproxen: Fate in wetland mesocosms planted with Scirpus validus. Chemosphere 2013, 91, 14–21. [Google Scholar] [CrossRef] [PubMed]
  29. Haehnel, W. Photosynthetic electron transport in higher plants. Annu. Rev. Plant Physiol. 1984, 35, 659–693. [Google Scholar] [CrossRef]
  30. Yamori, W.; Shikanai, T. Physiological functions of cyclic electron transport around photosystem I in sustaining photosynthesis and plant growth. Annu. Rev. Plant Biol. 2016, 67, 81–106. [Google Scholar] [CrossRef]
  31. Rodríguez-Celma, J.; Ceballos-Laita, L.; Grusak, M.A.; Abadía, J.; López-Millán, A.-F. Plant fluid proteomics: Delving into the xylem sap, phloem sap and apoplastic fluid proteomes. Biochim. Biophys. Acta (BBA) Proteins Proteom. 2016, 1864, 991–1002. [Google Scholar] [CrossRef] [Green Version]
  32. Fernández-Falcón, M.; Hernández, M.; Alvarez, C.E.; Borges, A.A. Variation in nutrition along time and relative chlorophyll content of Leucospermum cordifolium cv. ‘High Gold’, and their relationship with chlorotic sypmptoms. Sci. Hortic. 2006, 107, 373–379. [Google Scholar] [CrossRef]
  33. Carvalho, P.N.; Basto, M.C.P.; Almeida, C.M.R.; Brix, H. A review of plant–pharmaceutical interactions: From uptake and effects in crop plants to phytoremediation in constructed wetlands. Environ. Sci. Pollut. Res. 2014, 21, 11729–11763. [Google Scholar] [CrossRef] [PubMed]
Figure 1. Evolution of the control parameters throughout the experiments for carbamazepine (CBZ) uptake by two ornamental species (mean ± standard deviation). (a) chlorophyll content; (b) potential of hydrogen; (c) evapotranspiration rate; (d) relative growth rate.
Water 12 01272 g001
Figure 2. Percentage of carbamazepine (CBZ) uptake by Iris sibirica from the nutrient solution at the different exposure times and its corresponding total amount of CBZ (µg).
Water 12 01272 g002
Figure 3. Percentage of carbamazepine (CBZ) uptake by Zantedeschia aethiopica from the nutrient solution at the different exposure times and its corresponding total amount of CBZ (µg).
Water 12 01272 g003
Table 1. Summary of the parameters evaluated throughout the exposure of Iris sibirica to different concentrations of carbamazepine (CBZ) (mean ± standard error of the mean).
ParametersTreatments
Control5 mg/L10 mg/L15 mg/L
Relative Chlorophyll Content (mg/g)
Chl a + b0.62 ± 0.018 a0.60 ± 0.018 a,b0.60 ± 0.018 a,b0.58 ± 0.018 b
Chl a0.34 ± 0.009 a0.33 ± 0.009 a,b0.33 ± 0.009 a,b0.32 ± 0.009 b
Chl b0.28 ± 0.009 a0.27 ± 0.009 a,b0.27 ± 0.009 a,b0.26 ± 0.009 b
RGR (d−1)0.010 ± 0.0010.010 ± 0.0010.003 ± 0.0180.003 ± 0.018
ET (mm/d)5.07 ± 0.90 a3.81 ± 0.53 a,b3.57 ± 0.55 b2.48 ± 0.26 c
pH5.51 ± 0.25 a5.90 ± 0.21 a,b6.11 ± 0.07 b6.09 ± 0.07 b
Different alphabetic superscripts indicate a significant difference between treatments (p < 0.05). Chl: chlorophyll content; RGR: relative growth rate; ET: evapotranspiration rate; pH: potential of hydrogen.
Table 2. Summary of the parameters evaluated throughout the exposure of Zantedeschia aethiopica to different concentrations of carbamazepine (CBZ) (mean ± standard error of the mean).
ParametersTreatments
Control5 mg/L10 mg/L15 mg/L
Relative Chlorophyll Content (mg/g)
Chl a + b0.36 ± 0.011 a0.33 ± 0.011 b,c0.35 ± 0.010 a,b0.32 ± 0.010 c
Chl a0.14 ± 0.004 a0.14 ± 0.004 b,c0.14 ± 0.003 a,b0.13 ± 0.003 c
Chl b0.21 ± 0.006 a0.20 ± 0.006 b,c0.21 ± 0.005 a,b0.19 ± 0.005 c
RGR (d−1)0.021 ± 0.0120.020 ± 0.0010.020 ± 0.0010.017 ± 0.014
ET (mm/d)3.04 ± 0.19 a3.12 ± 0.25 a2.81 ± 0.44 a,b2.42 ± 0.22 b
pH5.98 ± 0.075.96 ± 0.086.01 ± 0.085.96 ± 0.07
Different alphabetic superscripts indicate a significant difference between treatments (p < 0.05). Chl: chlorophyll content; RGR: relative growth rate; ET: evapotranspiration rate; pH: potential of hydrogen.

