Hydrologic Validation of MERGE Precipitation Products over Anthropogenic Watersheds
by
 , and
, and
Felício Cassalho
1,*, 
Camilo Daleles Rennó
2,
João Bosco Coura dos Reis
3 and
Benedito Cláudio da Silva
4 1
Remote Sensing Division (DSR), National Institute for Space Research (INPE), Av. Dos Astronautas, 1758, Jardim da Granja, São José dos Campos 12227-010, Brazil
2
Image Processing Division (DPI), National Institute for Space Research (INPE), Av. Dos Astronautas, 1758, Jardim da Granja, São José dos Campos 12227-010, Brazil
3
National Center for Monitoring and Early Warning of Natural Disasters (CEMADEN), Estrada Dr Altino Bondesan, 500, Distrito de Eugênio de Melo, São José dos Campos 12247-016, Brazil
4
Natural Resources Institute (IRN), Federal University of Itajubá (UNIFEI), Av. BPS, 1303, Pinheirinho, Itajubá 37500-903, Brazil
*
Author to whom correspondence should be addressed.
Water 2020, 12(5), 1268; https://doi.org/10.3390/w12051268
Submission received: 19 November 2019
/
Revised: 19 December 2019
/
Accepted: 27 December 2019
/
Published: 29 April 2020
(This article belongs to the Section Hydrology)
Abstract
:Satellite rainfall estimates (SRFE) are a promising alternative for the lack of reliable, densely distributed, precipitation data common in developing countries and remote locations. SRFE may be significantly improved when corrected based on rain gauge data. In the present study the first complete validation of the Tropical Rainfall Measuring Mission (TRMM) 3B42-based MERGE product is performed by means of ground truthing and hydrological modeling-based applications. Four distinct, highly anthropogenic watersheds were selected in the Upper Paraíba do Sul River Basin (UPSRB)—Brazil. The results show that when compared to TRMM Multi-Satellite Precipitation Analysis (TMPA) 3B42V7 at the watershed scale, MERGE has a higher correlation with observed data. Likewise, root mean square errors and bias are significantly lower for MERGE products. When hydrologically validated, MERGE-based streamflow simulations have shown the capacity of reproducing the overall hydrological regime with “good” to “very good” results for the downstream lowland sections. Limitations were observed in the hydrological modeling of the upstream, highly anthropogenic, dammed watersheds. However, such limitations may not be attributed to MERGE precipitation since they were also obtained for the individually calibrated rain gauge-based simulations. The results indicate that the used MERGE dataset as a hydrological model input is better suited for application in the UPSRB than the TMPA 3B42V7.
1. Introduction
Precipitation is constantly referred as the most important water input to the hydrological cycle [1,2,3] as it regulates the renewable water resources distribution and consequently affects many aspects of human, ecological, and economic development [4]. In addition, its intensity, duration, and frequency abnormalities often result in natural disasters (e.g., floods, droughts, and landslides) [5], thus making its estimation indispensable for a variety of hydrological, as well as agronomic, meteorological, and climatological applications [6,7]; including the mitigation of extreme hydrological events and design of hydraulics structures [8]. However, the scarcity and unreliability of precipitation measurements present a challenge to the proper water resources management and engineering [9].
Rain gauges, weather radars and satellite sensors are the main instruments used for measuring precipitation [10]. According to Price et al. [11] rain gauges and weather radars are the most adequate data sources for catchment modeling. This superiority may be attributed to their better accuracy, thus being conventionally used as reference for hydrological applications [12]. Yet, the punctual characteristic of rain gauges often limits their ability to represent the spatial structure of precipitation events, especially in complex terrains and tropical regions where precipitation is highly variable [13] and developing countries or remote locations where reliable data is usually scarce [14]. The usage of a network of weather radars, on the other hand, may be limited by the blockage by mountains or the problem of inter-radar calibration [15]. Therefore, there is an evident demand for reliable spatially distributed precipitation estimates, which is potentially fulfilled by remote sensing technologies [16].
The wavelengths referent to the passive microwave (PMW) and thermal infrared (TIR) bands of the electromagnetic spectrum are the most widely used for satellite rainfall estimations [17]. According to Bitew and Gebremichael [18] data on both bands show complementary strengths and limitations. For instance, PMW data, which are derived from the direct physical relationship between PMW scattered signal and ice particles present in precipitation clouds [19], are better in measuring the amount of precipitation, while capturing them in a coarse temporal and spatial resolution [20]. On the other hand, cloud top brightness temperature data (i.e., TIR data), which by definition do not take any internal cloud property into account, result in poor precipitation amount estimates [19]. However, such data have high temporal and spatial resolution and are particularly helpful for discriminating raining and non-raining events [20]. Combining the polar orbiting PMW satellite data with the geostationary TIR systems is a common solution for obtaining a reliable high-resolution precipitation product by overcoming the limitations of each particular data source [2].
Launched in November 1997 the Tropical Rainfall Measuring Mission (TRMM) made sub-daily satellite precipitation data available from January 1998 to April 2015 [21]. Orbiting in an angle of 35° to the Equator, the TRMM covered an area between 50° S and 50° N, with a spatial and temporal resolution of 0.25° and 3 h, respectively [2,9,20]. The TRMM Multi-Satellite Precipitation Analysis (TMPA) algorithm uses the calibration of TRMM Combined Instruments (TCI) and the TRMM Microwave Imager (TMI) to create the product 3B42 [1]. According to Maggioni et al. [21] this procedure is executed in five stages: (i) the Goddard profiling algorithm is used to calculate the PMW precipitation rates; (ii) the resulting data are cross calibrated and combined; (iii) the calibrated PMW data are used to create the TIR estimates; (iv) TIR and PMW data are combined; and (v) the resulting product is corrected for bias based on a global rain gauge network (not performed in the real time version). The latest TMPA version 3B42V7, which has shown considerable improvements over its previous versions, has been extensively used worldwide in a variety of hydrological applications [3,4,22,23]. However, regional errors are still found, leading to the development of a range of post analysis merging methods [24]. For instance, Rozante et al. [25] when analyzing the TMPA 3B42 products in South America observed a systematic underestimation of precipitations in some regions, such as in northeastern Brazil, and overestimation in others (e.g., between the junction of Brazil, Argentina, and Paraguay). The authors then developed the MERGE based on a technique for blending satellite and surface observations that resulted in a daily, 20 km spatial resolution, precipitation product. Despite all the advantages MERGE has over TMPA products, as demonstrated by Rozante et al. [25], it still has not been used to its full potential.
One of the main limitations to the usage of satellite-based rainfall estimates (SRFE) is that they require (even when bias-corrected) a complete validation as they are likely susceptible to a variety of errors sources, such as nonuniform field-of-view, gaps in revisit times, atmospheric effects, system errors in the instruments, and weak relationship between remotely sensed signals and precipitation rate [21,26,27]. Bitew and Gebremichael [18] present three main categories of satellite precipitation validation methods based on: (i) field experiments to measure individual error sources; (ii) the direct comparison between satellite and rain gauge estimates; and (iii) the evaluation of satellite precipitation predictive ability by means of streamflow simulation. Stisen and Sandholt [28] state that the latter is more advantageous as it is implemented at the watershed scale, thus reducing discrepancy problems that are common in point to pixel validations, as well as, being evaluated in a practical rainfall-runoff modeling application.
Many studies have been conducted to evaluate and validate SRFE products over different areas. However, none of these studies have evaluated the MERGE precipitation product by exposing it to well-stablished robust validation methods applied to reportedly problematic regions (i.e., tropical/sub-tropical, mountainous, and anthropogenic watersheds). In this context, the main objective of the present study is to assess the MERGE’s applicability towards hydrological applications by: (i) a watershed scale comparison between the TMPA 3B42V7 and MERGE products by means of widely used ground truthing methods; and (ii) a hydrological validation of the MERGE product over four contrasting, highly anthropogenic, watersheds in the Upper Paraíba do Sul River Basin (UPSRB), Southeastern Brazil. The present study stands out as the first hydrological validation of MERGE product, assessing its potential as an input for the large scale distributed hydrological model MGB-IPH.
2. Material and Methods
2.1. Study Area
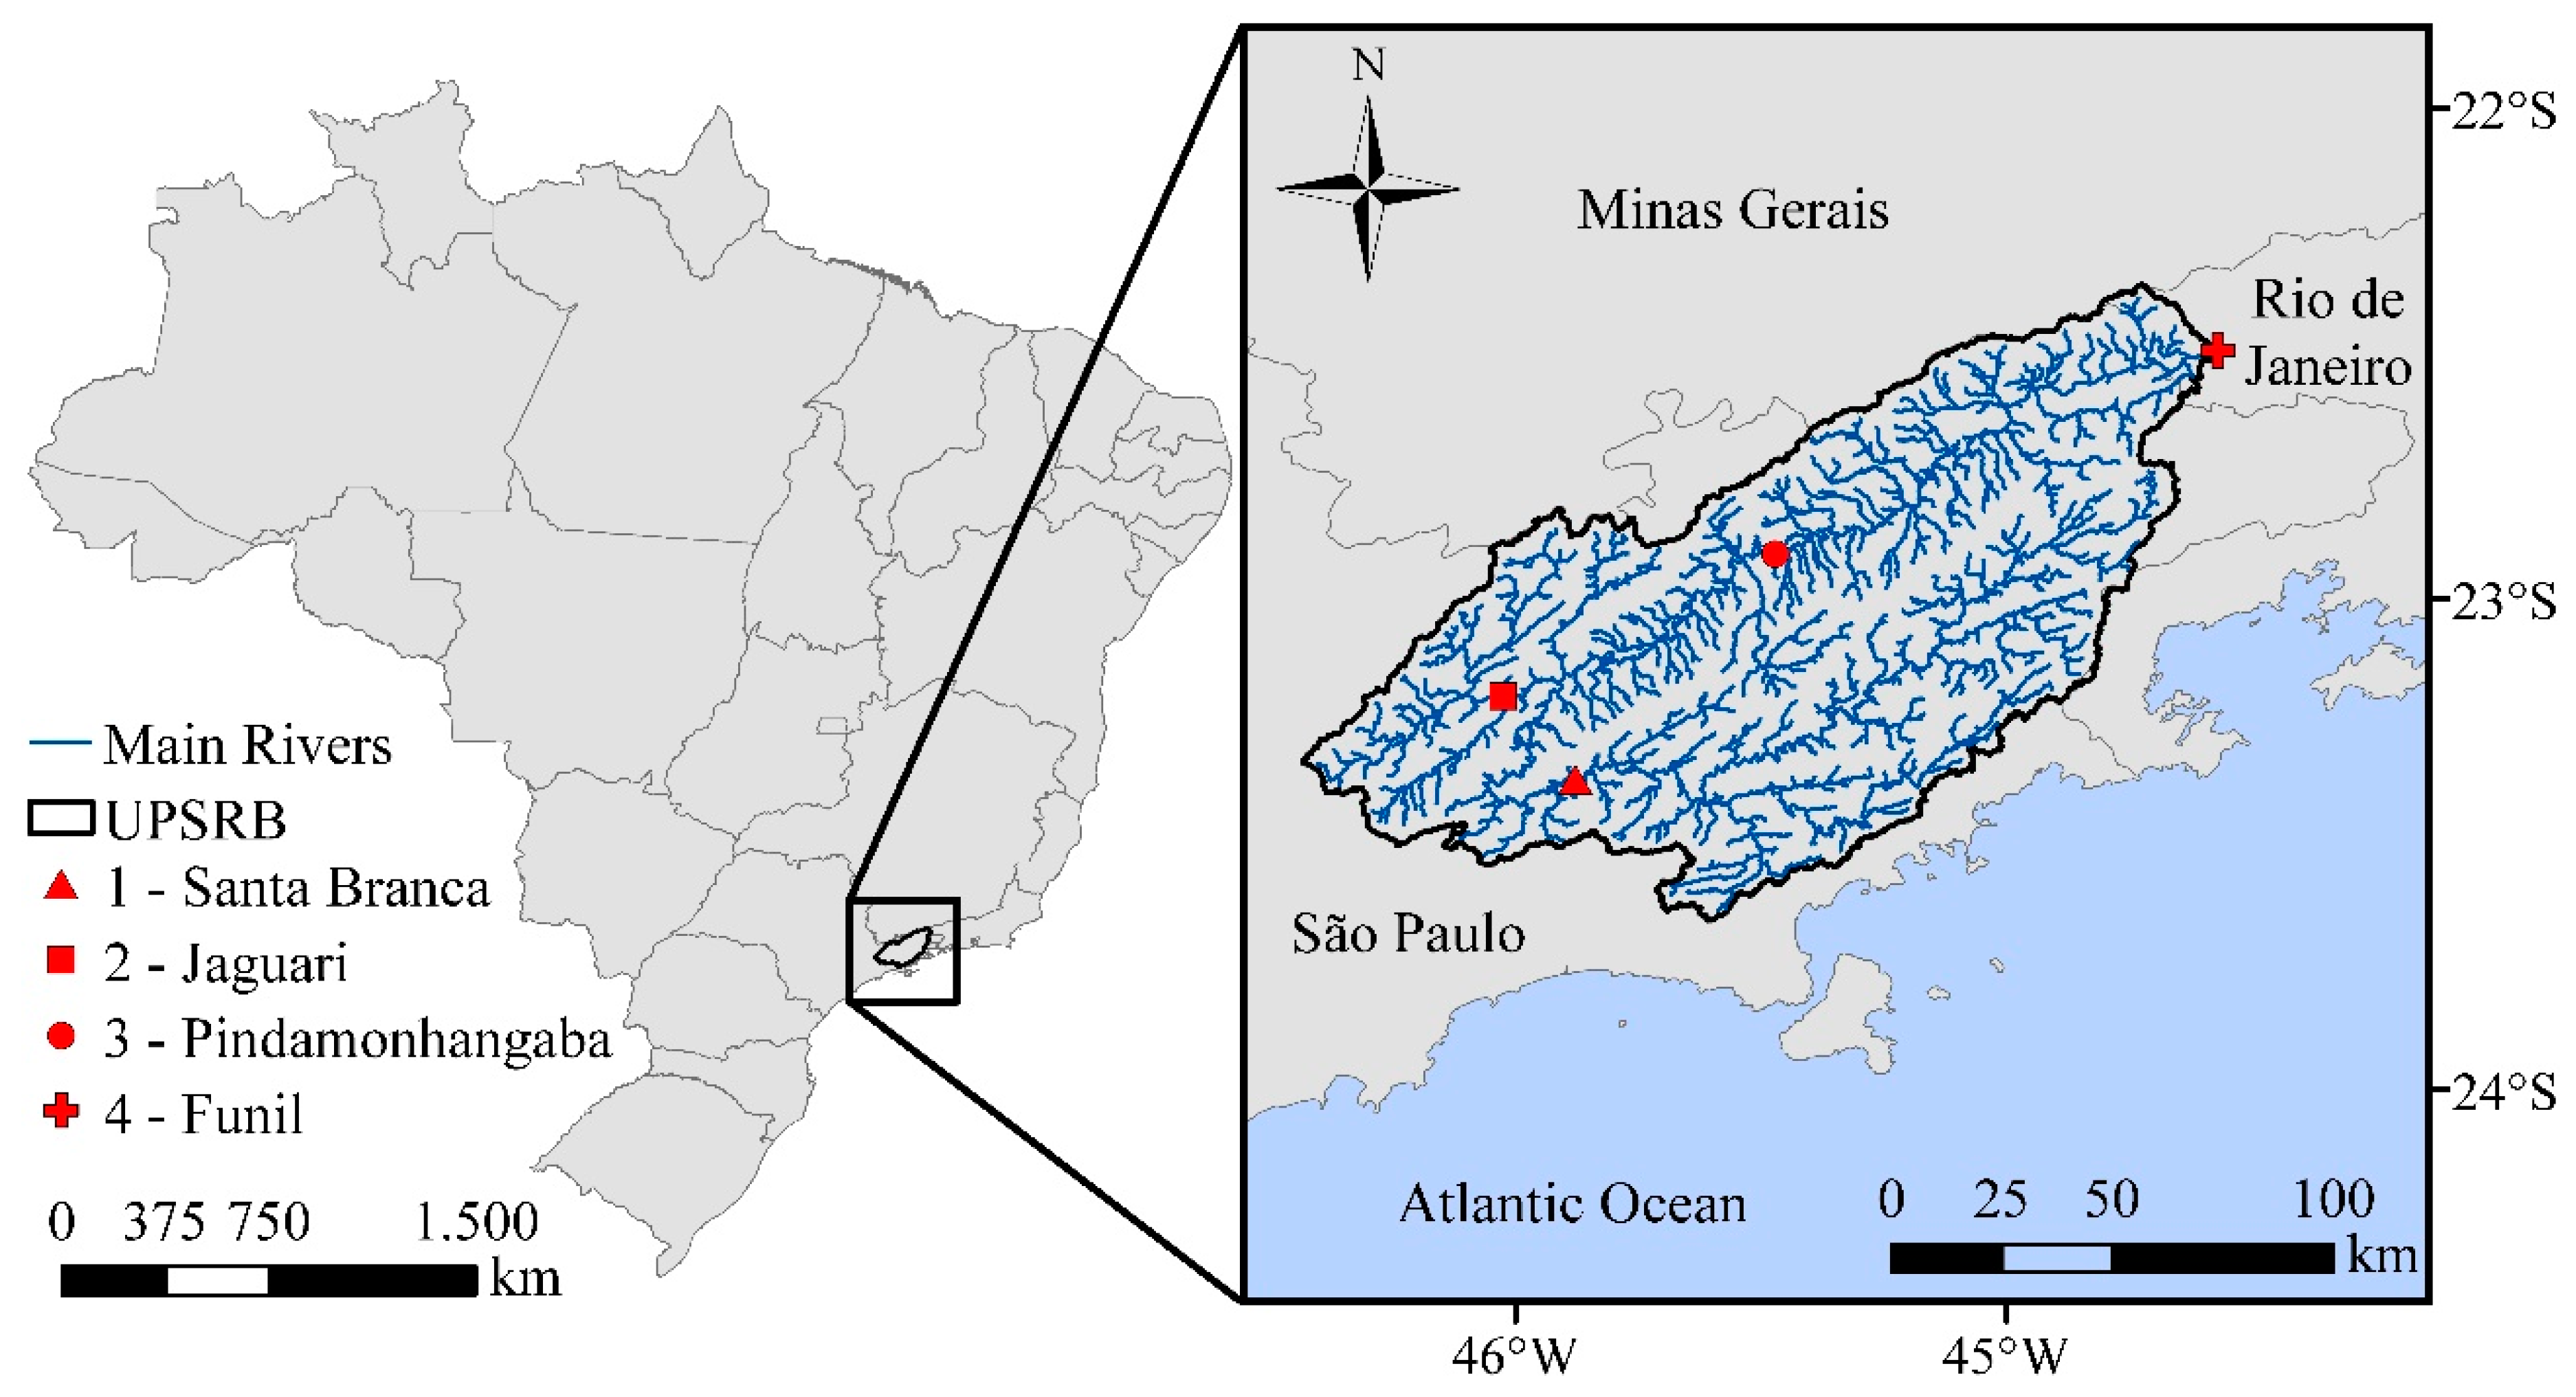
With a total extension of approximately 1150 km, the Paraíba do Sul River is formed by the junctions of the Paraitinga and Paraíbuna rivers. The Paraíba do Sul River Basin (PSRB) is a highly anthropogenic river basins, covering a total area of around 57,000 km2, corresponding to 63% of the State of Rio de Janeiro’s total area, 5% of São Paulo, and 4% of Minas Gerais [29], encompassing a total population of 5 million people [30]. In a long-term hydrological analysis of the Paraíba do Sul River (i.e., from 1920 to 2004), Marengo and Alves [31] observed a significant decrease in streamflow mainly after 1955. This decreased showed a strong correlation with the construction of large hydraulic structures, as well as periods of urbanization and economic development, which reflected in significant interventions in the natural streamflow in terms of large dams, increase in water withdraws, and changes in land cover. To evaluate the PSRB most anthropogenic areas, four cross section in the UPSRB were considered, including the Santa Branca dam (4907 km2) (cross Section 1), Jaguari dam (1313 km2) (cross Section 2), Pindamonhangaba (3354 km2) (cross Section 3), and the Funil hydroelectric power plant (3679 km2) (cross Section 4) (Figure 1).
According to the Köppen’s climate classification, the UPSRB may be divided into Cfa (i.e., humid, oceanic climate with dry season and with hot summer) in the upstream regions, and Cwa (i.e., humid, with dry winter and hot summer) and Cfb (i.e., humid, oceanic climate with dry season and with temperate summer) downstream [32]. Entisols and Inceptisols are predominant in the most mountainous region, whereas Oxisols and Ultisols are found in less complex terrains, fluvic soils are found throughout the main riverbank [33]. The major land cover is pasture (60.3%) followed by forested (34.8%) and urbanized (2.8%) areas [34]. Watershed 1 is mostly covered by pastures (57.9%), with significant portions of forests (38.7%) and water bodies (3.4%). Watershed 2 is also mainly covered by pasture (49.2%), forests (49.7%), and water bodies (3.2%), with a small fraction of urban areas (0.9%). The downstream watershed 3 is composed by 63.1% of pastures, 28.7% of forests, and 7.6% or urban areas, followed by small portions of water bodies, rock outcrops, and agriculture, with 0.4%, 0.1%, and 0.1%, respectively. Lastly, watershed 4 is covered by 64.9% of pastures, 31.0% of forests, 2.6% of urbanized areas, 0.8% of agriculture, 0.6% of waterbodies, and 0.1% of rock outcrops [34].
2.2. Evaluation of Satellite Precipitation Data
2.2.1. Precipitation Data Sources and Preparation
The data collected from 115 conventional rain gauges made available by the Brazilian National Water Agency (ANA) were used as reference throughout the present study [35]. These data represent the accumulated daily precipitation (mm day−1) at 10 a.m. (UTC) [22] and was collected for the whole period considered, i.e., from 01/01/2001 to 12/31/2012. It should be mentioned that this period was selected because it comprehends the largest number of rain gauges with no more than 5% of missing data, which were filled based on the inverse square distance approach described by Viessman and Lewis [36]. It should be mentioned that the MGB-IPH model uses a precipitation interpolation approach based on the nearest interpolation method. Therefore, to keep a certain consistency between the evaluation of satellite precipitation data and their hydrologic validation, the Thiessen polygon interpolation method was adopted for obtaining the weighted daily averages for each watershed.
The TMPA 3B42V7 released in May 2012 has several advantages when compared to its predecessors, including a new TIR dataset and additional satellite inputs, a latitude band calibration system, and a new gauge analysis based on the Global Precipitation Climatology Centre (GPCC) data [21,27]. These advantages result in a product with higher correlation coefficient (), lower relative bias and root mean square error () against rain gauge data, especially in mountainous regions [27,37]. To spatially rescale the TMPA 3B42V7 data to the watershed level, as implemented for the ANA rain gauge network, 3-hourly weighted averages had to be calculated for each watershed. Every day a total of eight TMPA 3B42V7 files are made available from 10:30 p.m. (UTC, the day before) to 10:29 p.m. (UTC). These data do not temporally match the ANA precipitation data and thus had to be rearranged. Following the routine proposed by Reis et al. [22] the TMPA 3-h data was grouped from 10:30 a.m. (UTC, the day before) to 10:29 a.m. (UTC), minimizing the initial shift between the daily TMPA SRFE and the ANA network of 11 h and 30 min to only 30 min.
Finally, the MERGE data, derived from the TMPA 3B42RT SRFE and corrected for 1500 rain gauge stations in South America [25], were evaluated against the rain gauge observations. The MERGE data were also rescaled to the watershed level based on the pixel area weighted average to be compared to the gauge observations. According to Rozante et al. [25] the MERGE data were built following five main steps: (i) the TRMM grid cells whose location matches those of gauge station were identified; (ii) these grid cells had their precipitation values switched to those of gauge stations; (iii) the precipitation data from the two adjacent rows and columns were erased; (iv) the resulting map was then interpolated using the Barnes objective analysis method; and (v) the precipitation estimates were cross-validated. It should be mentioned that both MERGE, provided by the Center for Weather Forecast and Climatic Studies (CPTEC) [38], and TRMM [39] data were considered for the same period (i.e., 01/01/2001 to 12/31/2012) as the rain gauge data.
2.2.2. Statistical Evaluation
Once the precipitation data has been prepared, they should have their accuracy assessed before having their impacts evaluated as model inputs [37]. In addition to the visual interpretation, the precipitation data were evaluated based on several extensively used validation statistical indices [3,9,12]. The following statistical indices were selected based on the recommendations Gilewski and Nawalany [10], since they allow performing a multi-aspect analysis of the results. First, the correlation coefficient () was used to assess the de degree of linear agreement between observations. The is particularly used for evaluating the timing of observed events [10]. The value of may vary from −1 to +1, where the closest to +1 or −1 the higher the positive or negative correlation, respectively. Complementarily, the was used to measure the average error magnitude between the satellite-based and the gauge data. The relative bias (), which corresponds to the absolute bias divided by the amount of rain gauge precipitation depth, was chosen since it is not dependent on the amount of precipitation. The is recommended for investigating positive or negative tendency in estimated values [10], this index in particularly important for validating satellite-based estimates due to the recurrent presence of systematic errors in SRFE. Positive percentages imply overestimation of precipitation by satellite instruments whereas negative indicate its underestimation. The equations that represent these indices are [9,37]:
where is the satellite precipitation estimate and is the gauge station measurement for day from a total time period of days. and are the long-term precipitation averages for the satellite and rain gauge estimates, respectively. As adopted by Gilewski and Nawalany [10] correlations may be considered “very good” if > 0.85, “good” if > 0.70 and ≤ 0.85, “satisfactory” if > 0.60 and ≤ 0.70, “acceptable” if > 0.40 and ≤ 0.60 and “unsatisfactory” if ≤ 0.40; while is considered “acceptable” is equal or lower than 20% and “unacceptable” if higher than 20%. To classify the estimates the relative was used, where values lower than 50% represent reliable SRFE estimates [40].
2.3. Hydrologic Validation of Satellite Precipitation Data
2.3.1. Hydrologic Data Sources and Preparation
The distributed rainfall-runoff model MGB-IPH, developed for large, tropical/sub-tropical basins, was selected to hydrologically validate the SRFE. The MGB-IPH [41,42] has been extensively used in developing countries due to its adequacy for scarcely monitored areas, capacity to satisfactorily simulate runoff with the calibration of a reduced number of parameters, and the fact it runs with easily obtained and widely available inputs. In addition to the precipitation data described in the previous section, the MGB-IPH requires elevation, land cover, soil, daily runoff, and monthly meteorological data. The data used, as well as their main characteristics, are presented in Table 1.
The data presented in Table 1 are also displayed in Figure 2. The four streamflow cross-sections (Figure 1) were defined based on streamflow data availability and watershed characteristics. Due to the large dams found in cross-sections 1 (Santa Branca dam) and 2 (Jaguari dam) (Figure 1), the observed streamflows could not be used in the model, since it does not reflect the watersheds’ natural hydrological regime. Instead, indirect streamflow estimates called naturalized streamflows were used. According to Guilhon et al. [43] naturalized streamflows are those that would occur if there were no anthropogenic activities in the watershed (e.g., reservoirs, irrigation, consumptive water withdraws, etc.). These estimates are made available by the National Electric System Operator (ONS) [44], which coordinates the generation and transmission of electric energy in Brazil, and are derived from an approach that incorporates the simulations from 96 stochastic models [45]. The remaining streamflow data were obtained from the ANA’s HidroWeb platform [34].
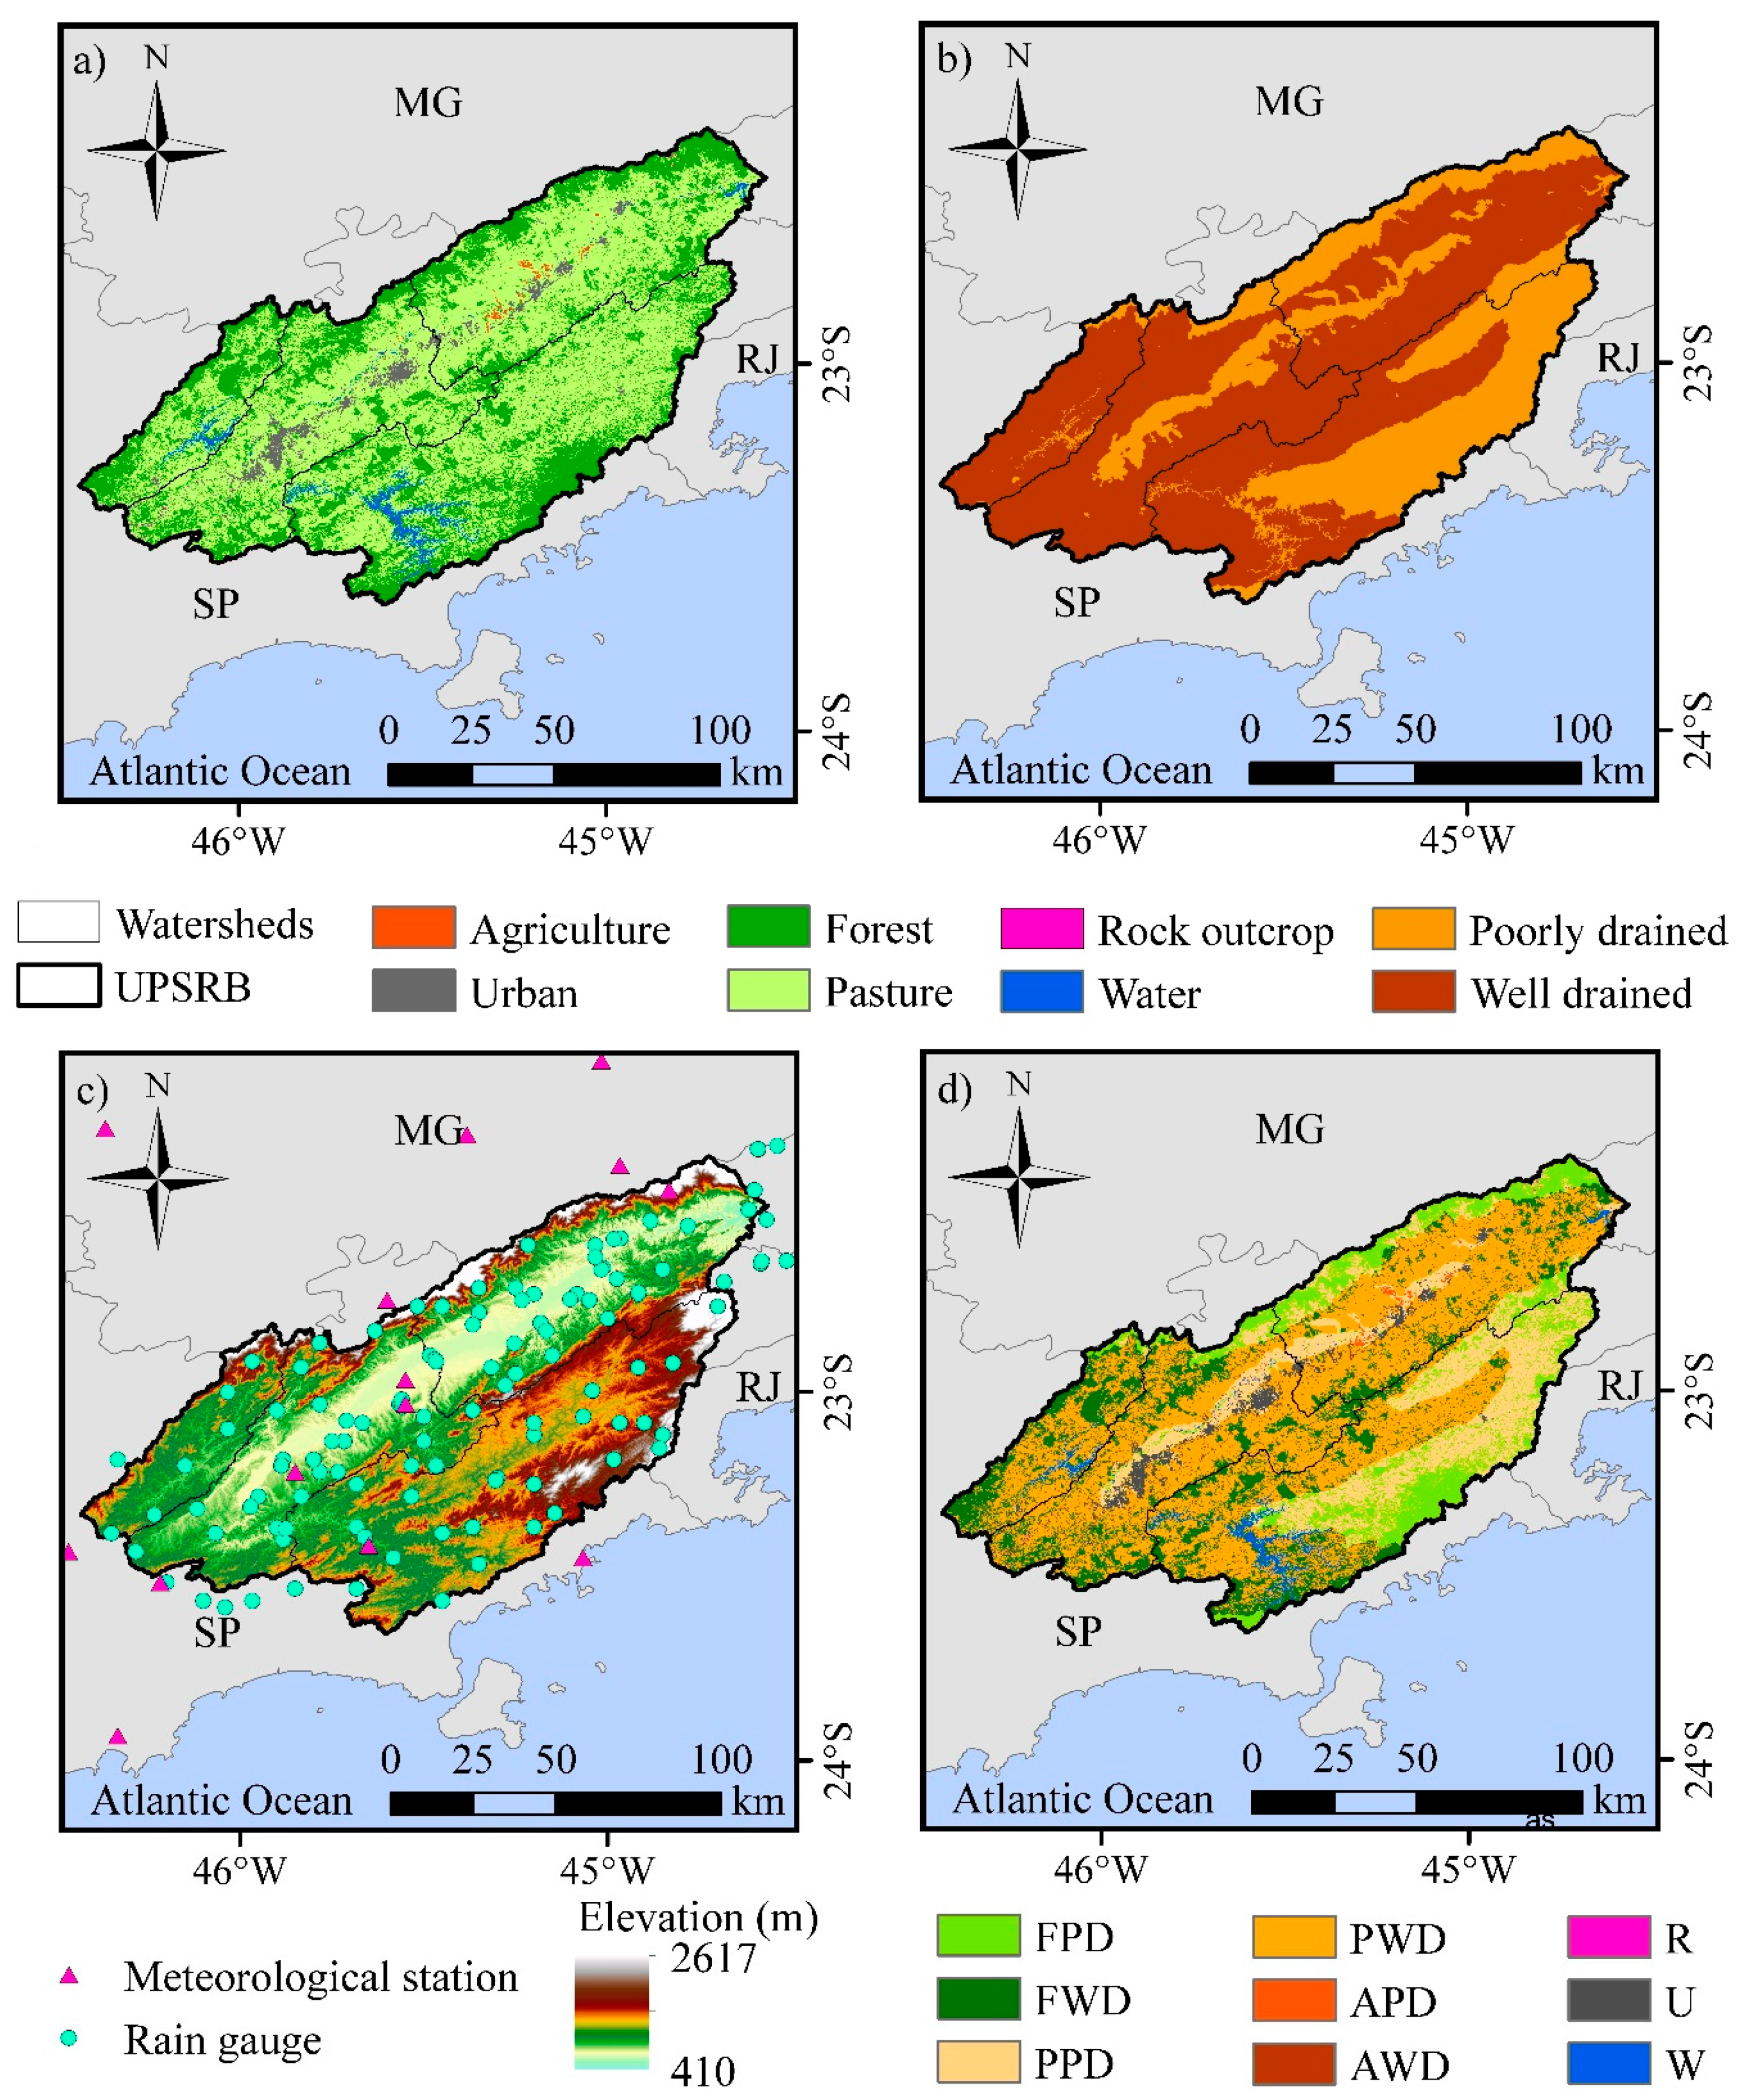
The land cover data used in the present study were provided by the MapBiomas Project. The MapBiomas Project is a supra-institutional initiative for developing a reliable, long-term, land cover historical series for Brazil based on Landsat family satellite observations. The year of 2006 was taken as reference [34] and regroup to fulfill the model implementation recommendations [46]. Analogously, the 1:250,000 soil map made available by the Brazilian Institute of Geography and Statistics (IBGE) [33], was reclassified into the drainage conditions proposed by Medeiros et al. [46]. The reclassified land cover and soil maps are presented in Figure 2a,b. Finally, climatological variables necessary for the model evapotranspiration calculations were extracted from the Brazil National Institute of Meteorology (INMET) database [47] (Figure 2c).
2.3.2. MGB-IPH
The MGB-IPH model is structured based on unit-catchments which are composed by a single-river reach, extracted from the DEM, and its respective floodplain [42]. According to these authors, each unit-catchment is composed by fractions of hydrological response units (HRUs) (i.e., areas of equal soil type and land cover). The evapotranspiration for each HRU is calculated based on the Penman-Monteith equation and the resulting unit-catchment water budget is computed as the sum of each HRU contribution. Linear reservoirs are used to propagate the groundwater, sub-surface, and surface outflows to the main river. Once these individual outflows reach the main river, they are summed and routed to through the river system using the Muskigum–Cunge method. The soil water balance was computed independently for each HRU in a unit-catchment [41,42] as:
where , , and are the time, unit-catchment, and HRU indexes, respectively; is the length of the time step (daily); (mm) is the water storage in the soil layer at the end of the th time step of the th HRU in the th unit-catchment; (mm) is the water storage in the soil layer at the previous time step; (mm day−1) is the amount of precipitation that reaches the soil surface and (mm day−1), (mm day−1), (mm day−1), and (mm day−1) are the water loses for evapotranspiration, surface, sub-surface, and groundwater outflows, respectively. The variables and are known for each time step, the remaining variables are calculated according to the soil water storage at the beginning of the time step and the following model parameters [41]:
Where (mm) and (-) are calibrated parameters referent to the maximum water storage in the upper soil layer, and the adjustment of statistical distribution of soil water storage capacity, respectively [41]. Sub-surface flow is computed based on a modified version of the Brooks and Corey non-saturated hydraulic conductivity equation [41,42]:
where (mm day−1) is a calibrated parameter that controls the sub-surface flows when the soil is saturated; (mm) is the lower limit from which there is no sub-surface flow; and is the soil porosity index. The groundwater flow is estimated based on a simple linear relation between soil water storage and maximum soil water storage [41,42]:
The calibration of MGB-IPH model parameters can be automatically executed using the Multiple-Objective Complex Evolution—University of Arizona optimization algorithm (MOCOM-UA). In the present study three objective functions were used for automatic model calibration, the Nash-Sutcliffe efficiency coefficient () (indicated to the fit of maximum streamflows), and its logarithmic version ( (related to the fit of recession periods [42] and the relative error of the total volume () [41], which reflect the effects of long-term bias:
where is the respective daily time step; is the total number of time steps; are the observed streamflows and are the simulated ones. values range from −ꝏ to 1, whereas between 0 and 1 imply some degree of model predictably [48]. Analogously, values close to 1 also mean a better fit between observed and simulated streamflows. However, this metric is more sensitive to recession and dry period and thus it is indicated for a better fit of minimum streamflows [42]. According to Moriasi et al. [48] the resulting values for the aforementioned statistics may be classified as “very good” if >0.75, “good” if >0.65 and ≤0.75, “satisfactory” if >0.50 and ≤0.65, and “unsatisfactory” if ≤0.50. Negative and positive values represent streamflow underestimation and overestimation, respectively. According to Van Liew et al. [49] absolute ≤ 10% can be classified as “very good”, 15% ≤ < 10% are classified as “good”, 25% ≤ < 15% are classified “satisfactory”, and absolute > 25% should be classified as “unsatisfactory”.
3. Results and Discussion
3.1. Statistical Validation of TMPA 3b42v7 and MERGE Products
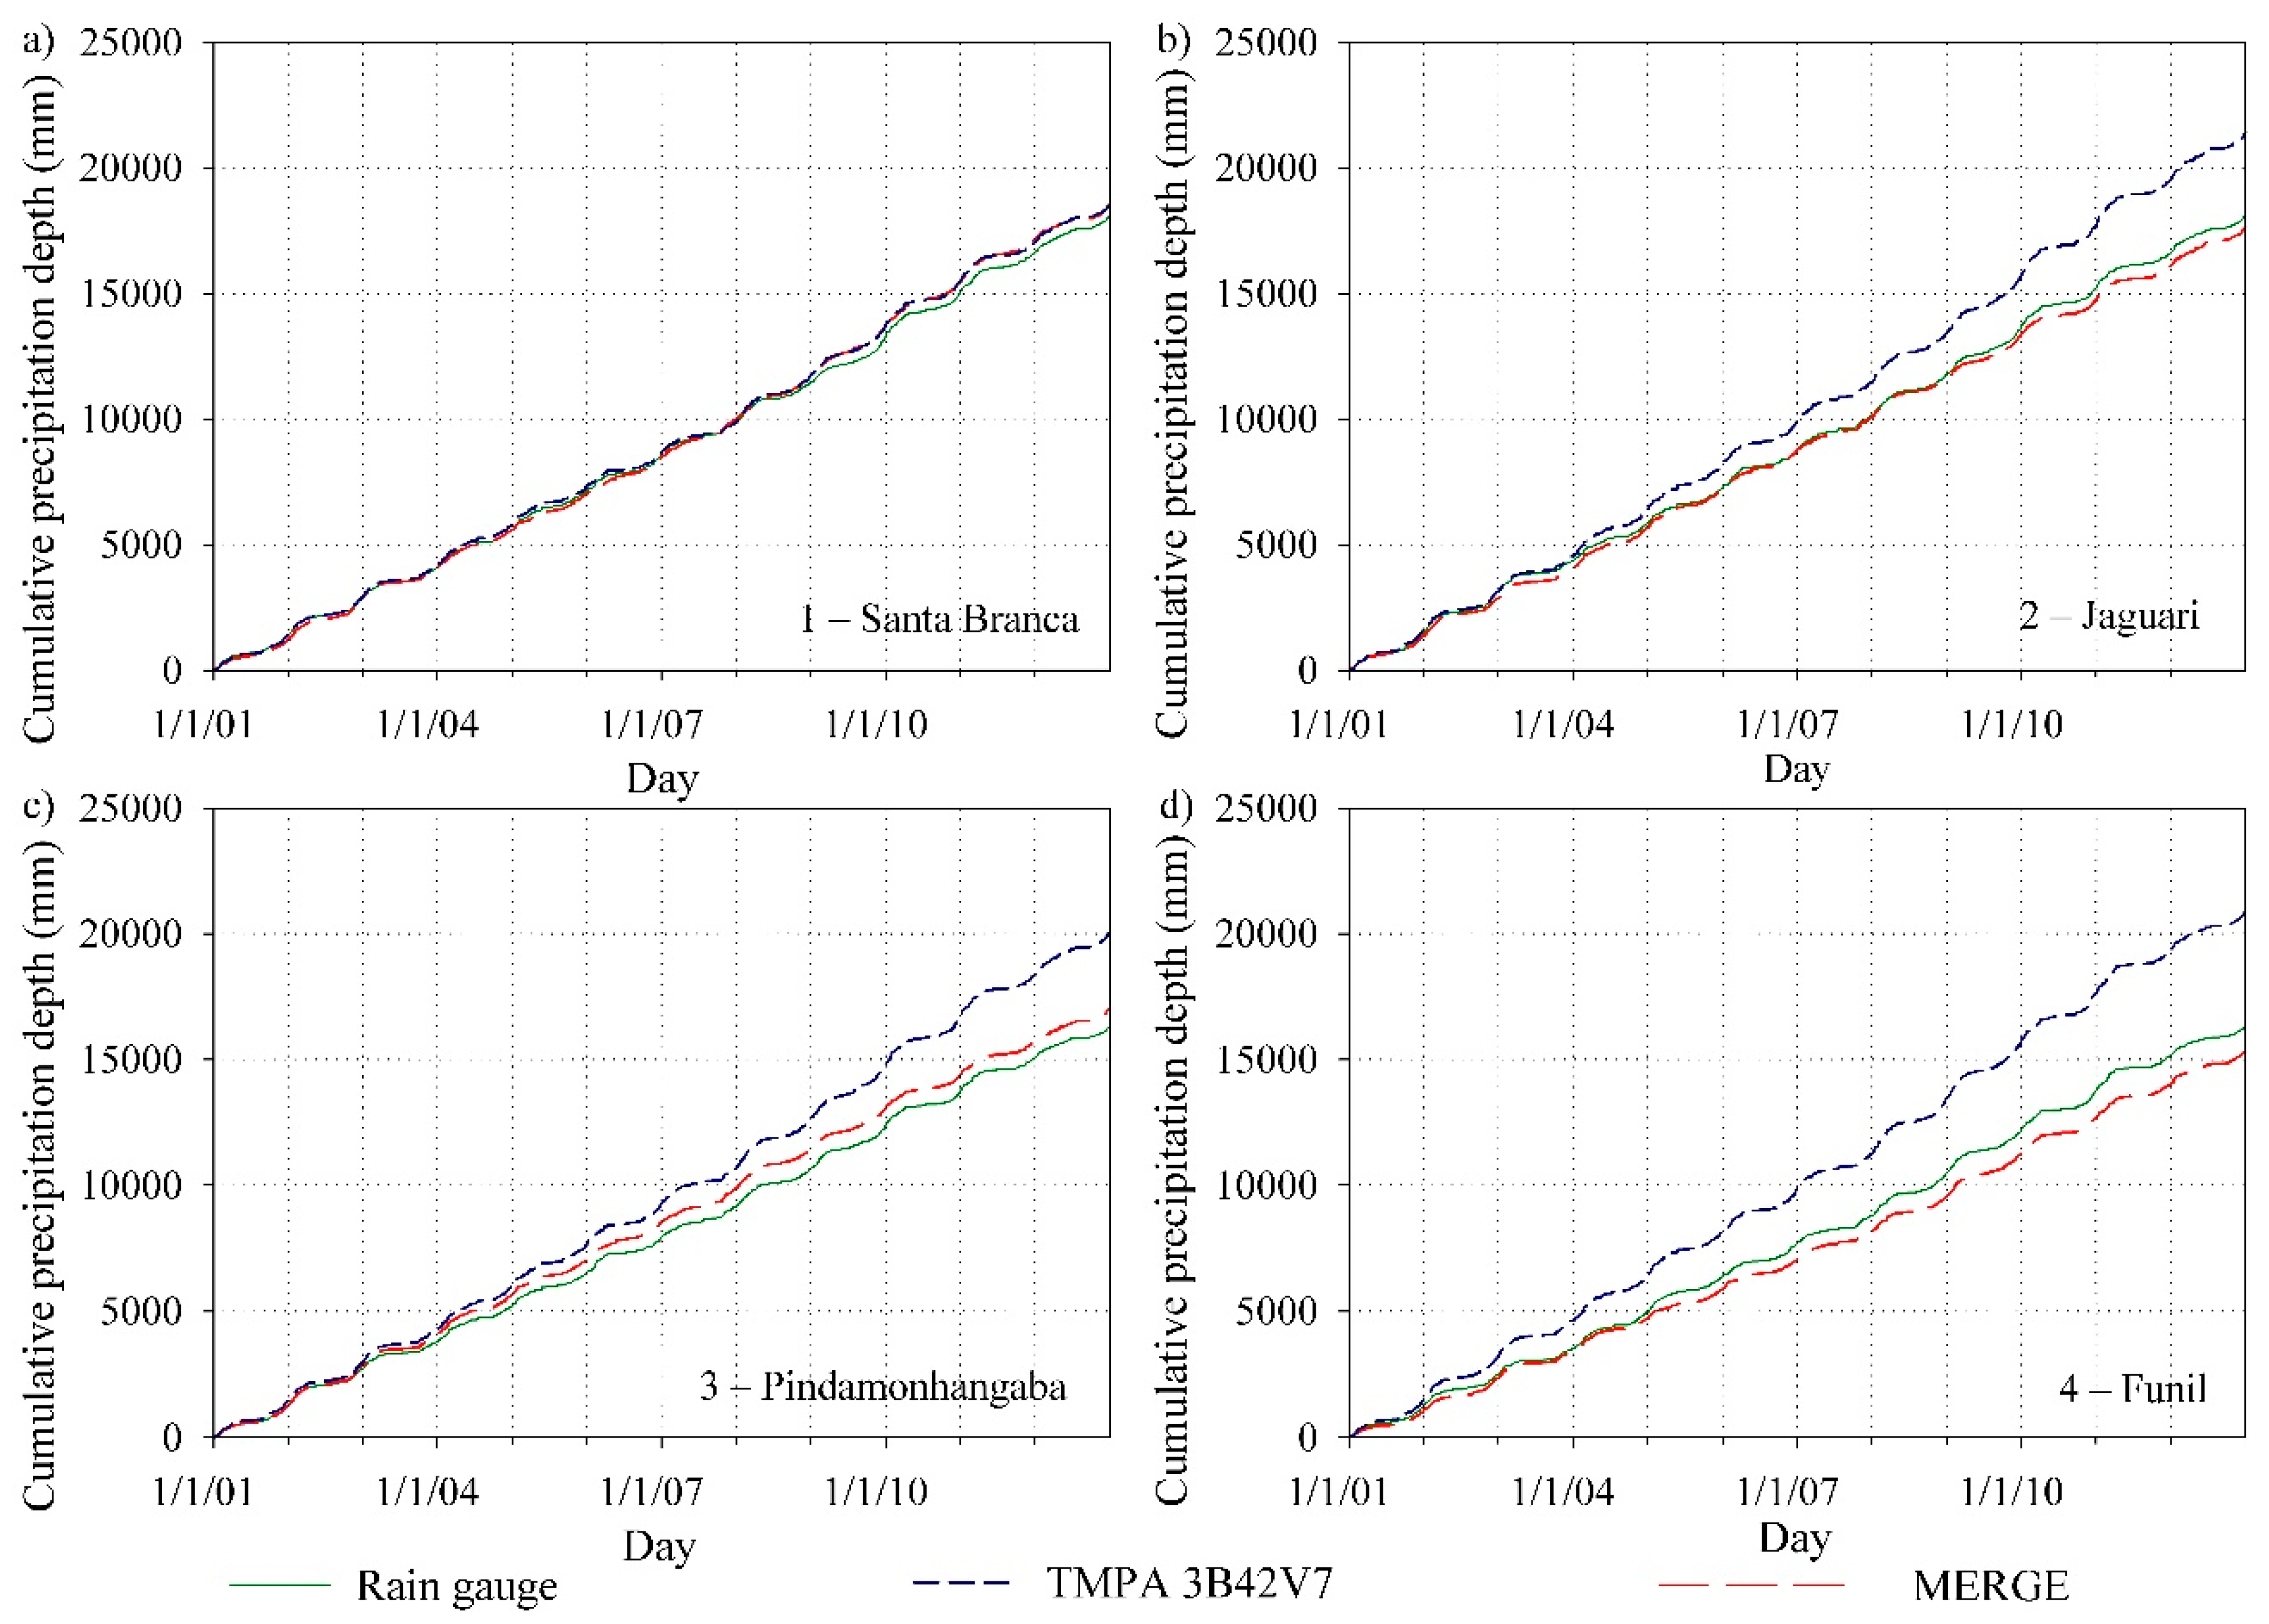
Tong et al. [12] suggest that a preliminary visual interpretation should be performed prior to the precipitation statistical validation. Among the possible graphic data representations, the cumulative precipitation depths evaluation stands out as it allows the identification of data bias, seasonality, and overall errors. Figure 3 represents the cumulative precipitation depths for both TMPA 3B42V7 and MERGE products in comparison to the observed rain gauge daily measurements for all UPSRB watersheds.
As depicted in Figure 3a a better agreement between TMPA 3B42V7-based precipitation estimates and gauge measurements was obtained for watershed 1 when compared to watersheds 2, 3, and 4 (Figure 3b–d). The overestimations made by TMPA 3B42V7 in the lowland valley areas after the 12-year period reached thousands of millimeters, thus compromising eventual hydrological data applications, especially those related to water balance calculation. Similarly, Falck et al. [50] also observed large cumulative overestimations of TMPA 3B42 estimates in 19 watersheds located within the Tocantins-Araguaia river basin. The same behavior is not found for MERGE precipitations, where close fits were observed for all watersheds. Thiemig et al. [20], in a study applied to four watersheds in Africa, also found a better performance of merged precipitation products (i.e., remote sensing-based precipitation products corrected with gauge observations) in lowland catchments when compared to those that do not ingest any ground observations. The authors argue that the adjustment of SRFE, even when based on a small number of ground observations, may significantly improve the intrinsic data quality. In this context, one can infer that MERGE products, which are adjusted from 1500 rain gauges mainly located in Southeastern and Northeastern Brazil (see Rozante et al. [25]), have the potential to provide SRFEs very close to the observed rainfall given the high density of rain gauges in certain areas and the fact it is built in a way that favors ground observations.
The seasonal dependence of errors may also be identified in Figure 3, where cumulative precipitation depths tend to be parallel during dry seasons (from April to September) and steep during wet seasons (from October to March). In addition, one may see that differences tend to be larger during wet season as the curve slopes are usually steeper for such periods. A clearer representation for the seasonality of precipitation and its estimation errors is depicted in Figure 4.
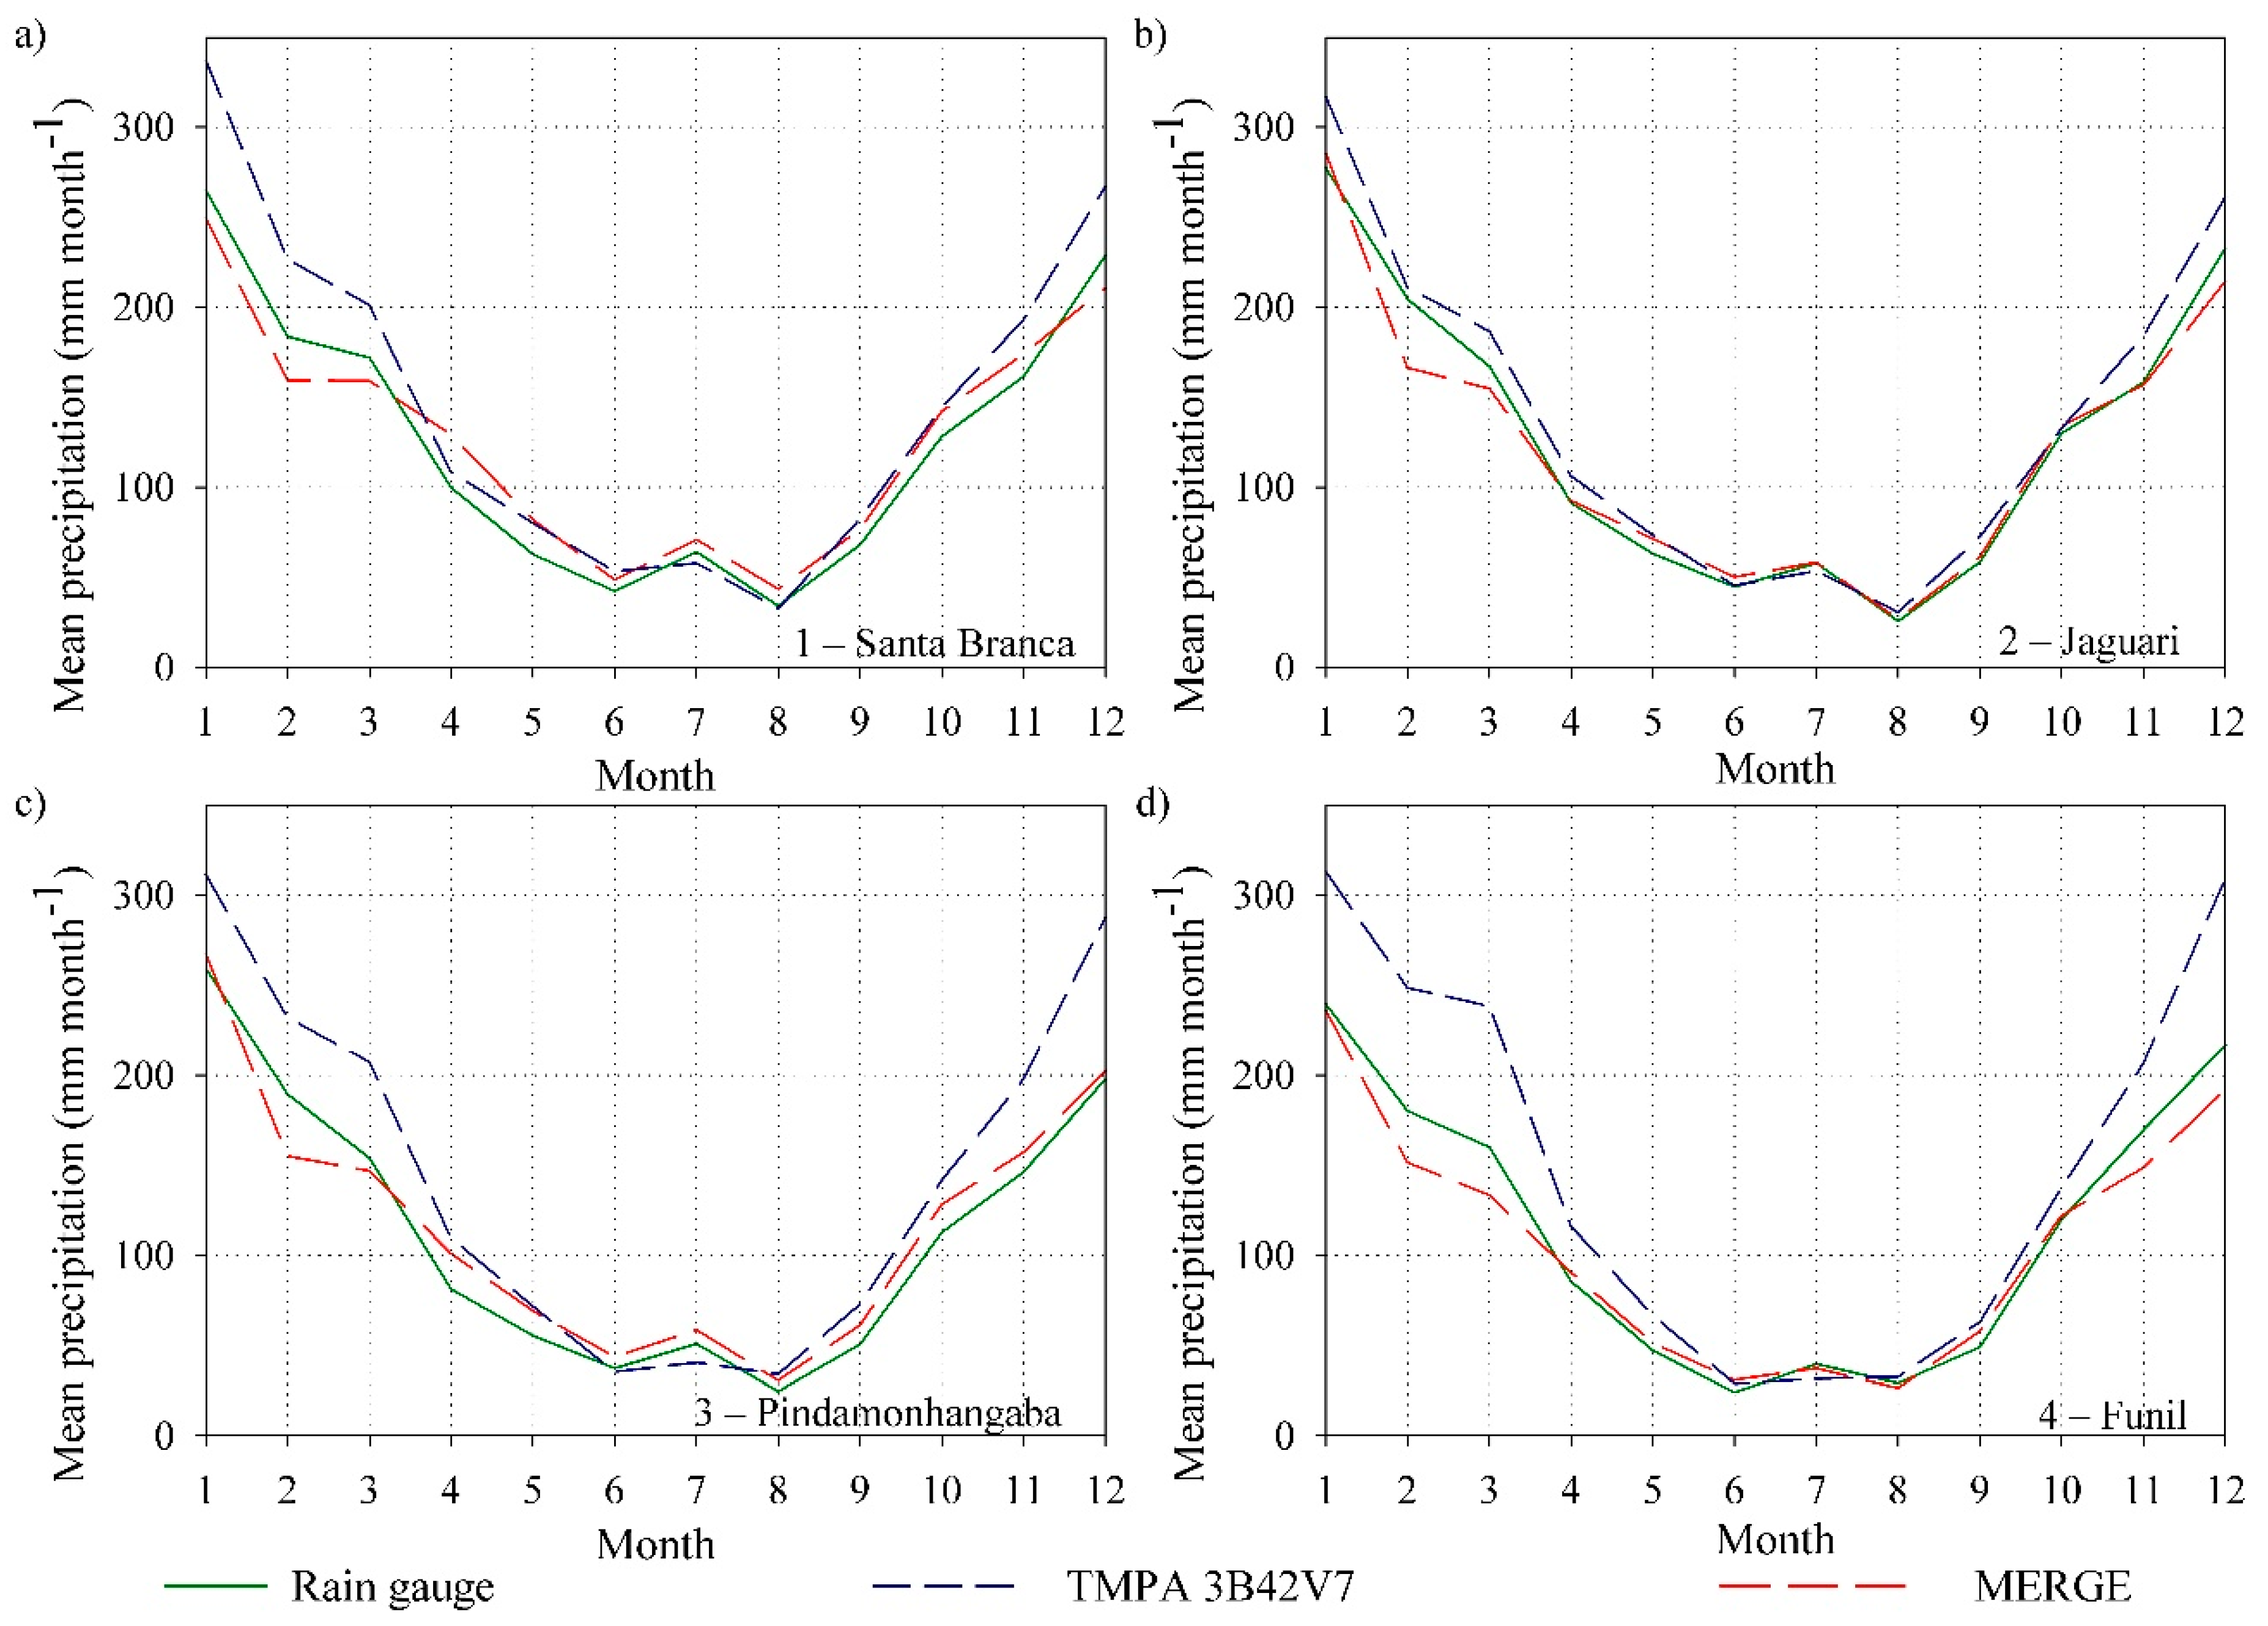
Figure 4 represents the mean monthly precipitation for all four watersheds. The results presented in Figure 4 corroborates the conclusions made for Figure 3. The strong seasonality, characteristic of tropical/sub-tropical regions, is also evident for the study area. In addition, the TMPA 3B42V7 largely overestimates precipitation, especially during the wet season. The MERGE, on the other hand, shows closer fit to the observed mean monthly precipitation for the whole area. As stated by Maggioni et al. [21], seasonality and topography play an important role in SRFE performance. For instance, regions characterized by complex terrains and sharp precipitation gradients may result in weak rain detection and large errors since SRFE errors are magnitude dependent [21]. This characteristic along with the strong seasonality observed for UPSRB may result in the large errors in wet seasons depicted in Figure 4.
In addition to the visual interpretation of precipitation data, a more robust evaluation of SRFE was developed based on statistical validation methods. The statistical validation of SRFE in the present study followed the approach adopted by Reis et al. [22], Tong et al. [12], and Shukla et al. [3]. Figure 5 and Figure 6 present the statistical analysis by means of , , and developed for both TMPA 3B42V7 and MERGE, respectively.
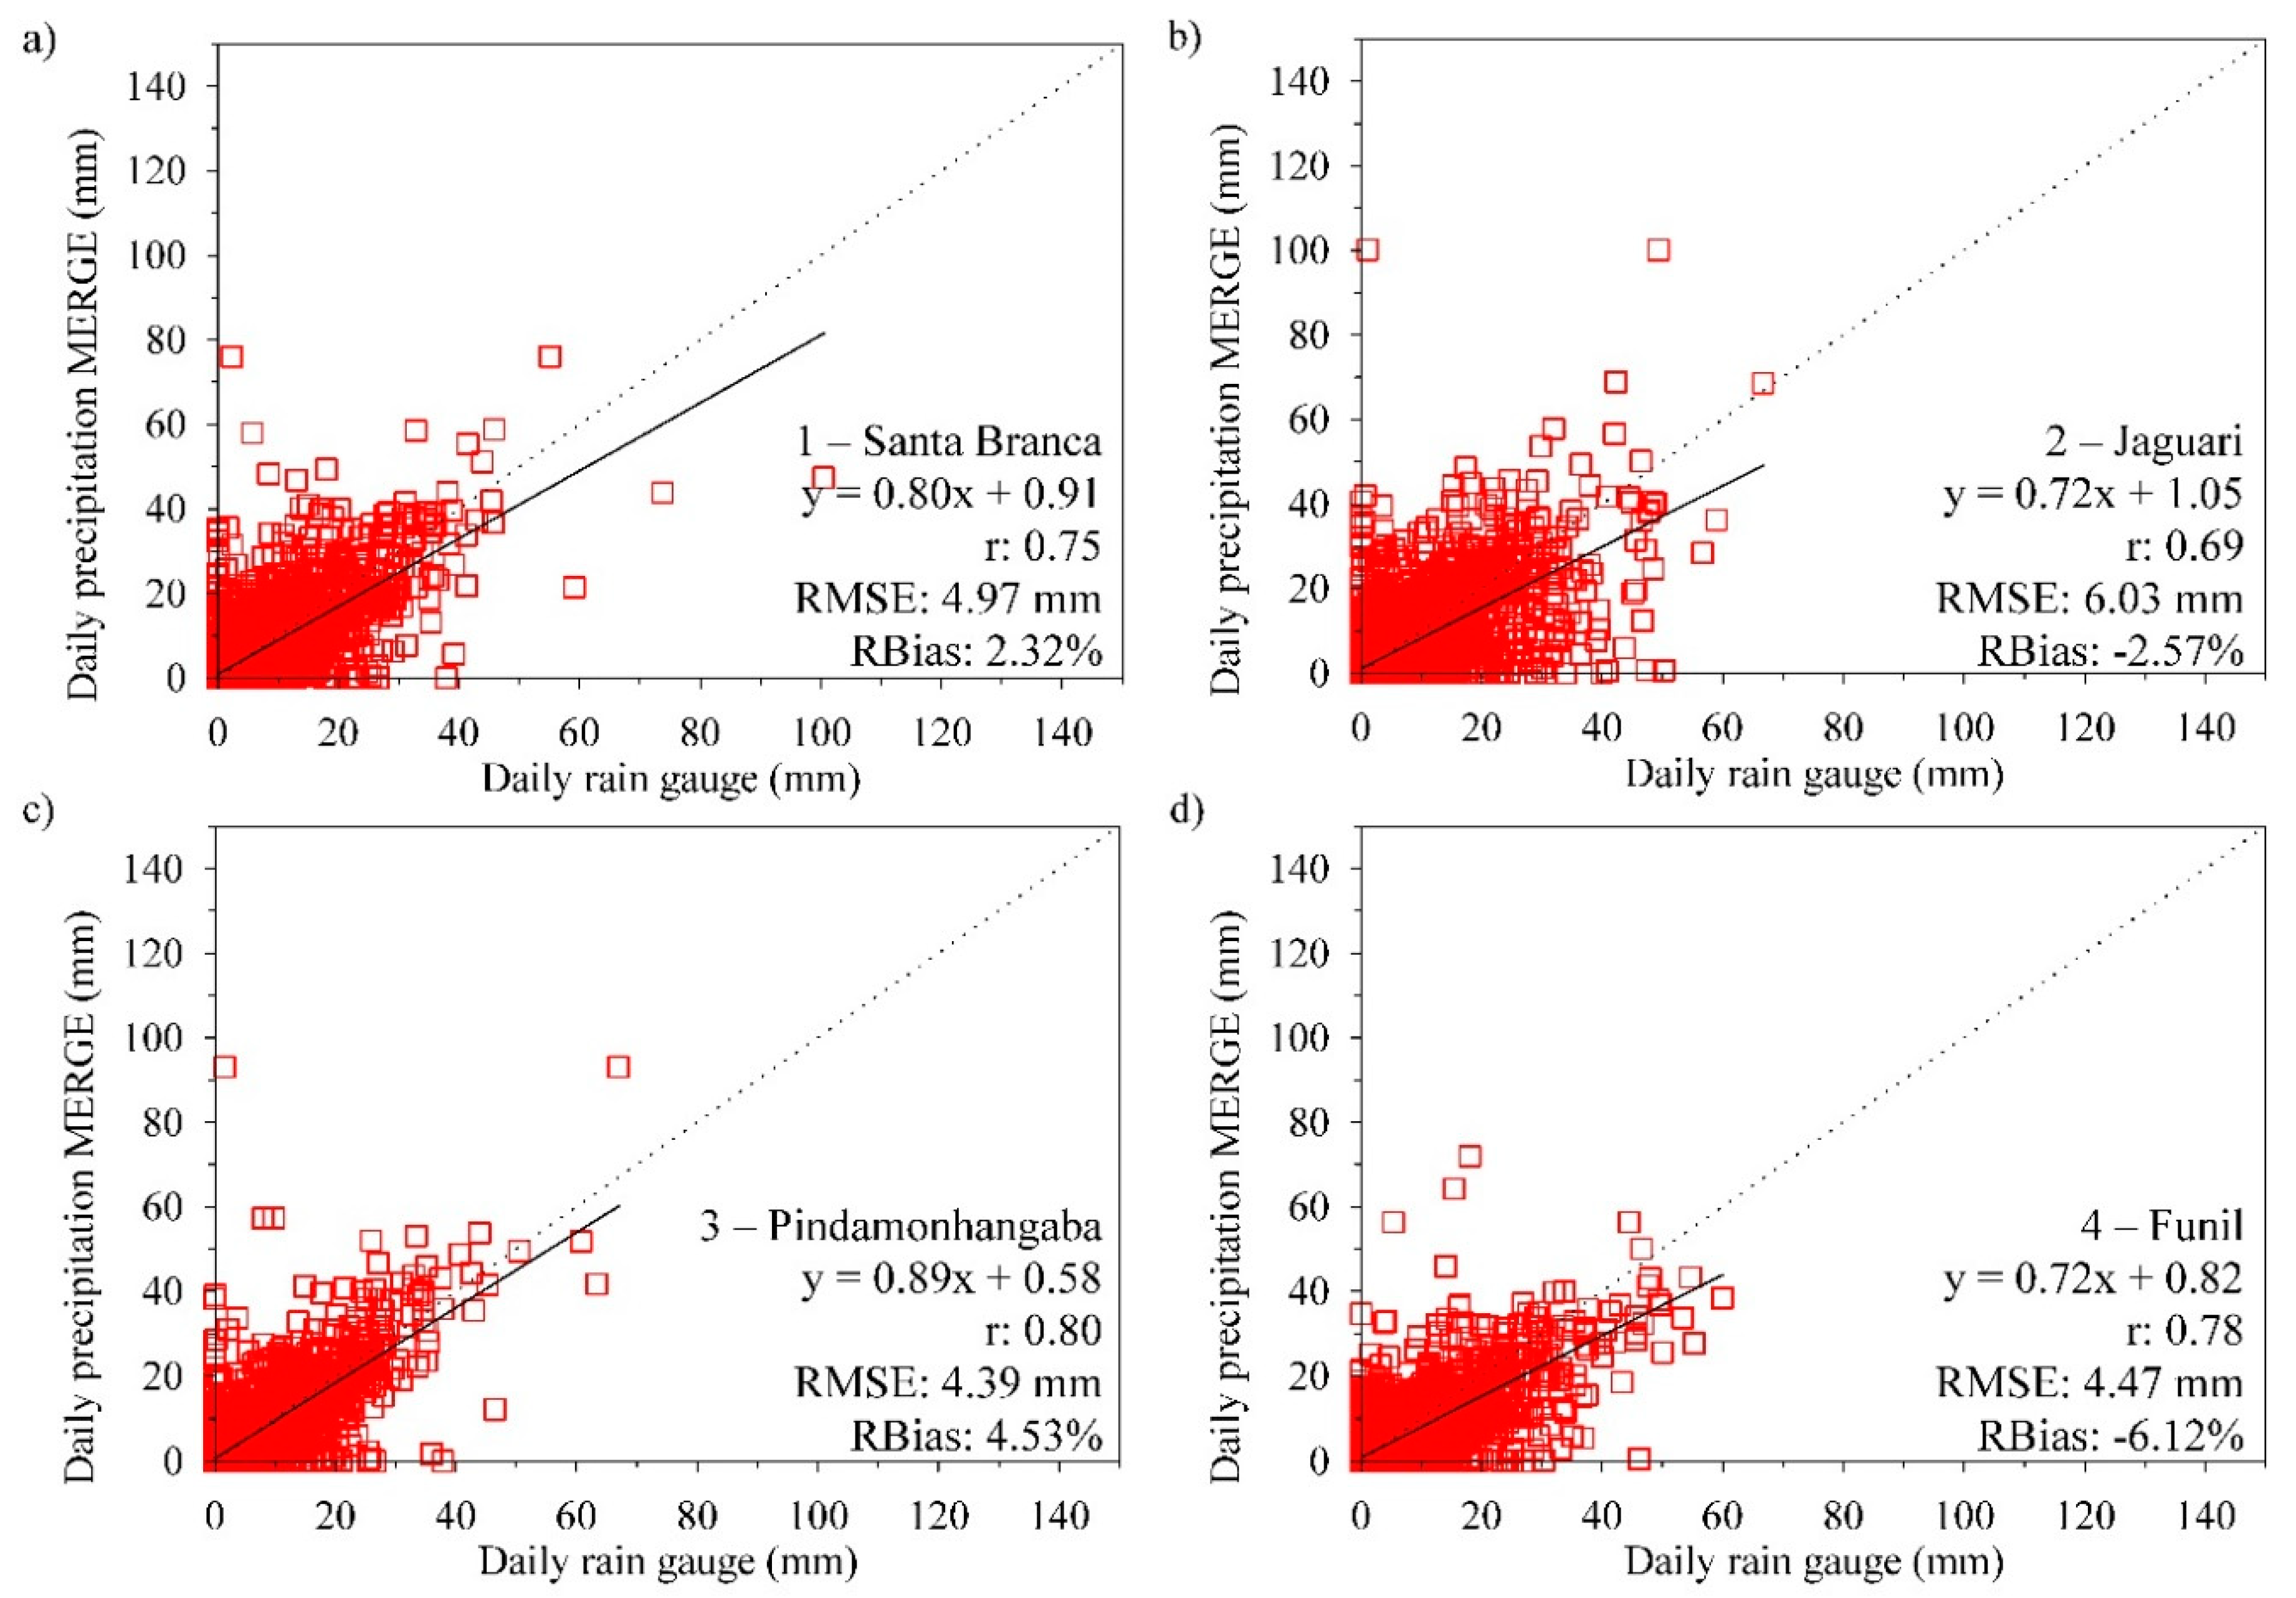
The correlations () achieved for the MERGE estimates and the rain gauge observations are stronger than those between TMPA 3B42V7 and the observed data for all watersheds considered. Correlations coefficient of 0.69 and 0.80 were found for MERGE while 0.66 and 0.76 were calculated for TMPA 3B42V7 for watersheds 2 and 3, respectively (Figure 5b,c and Figure 6b,c). Smaller improvements were observed for watersheds 1 where MERGE estimates reached a of around 0.75 while TMPA 3B42V7 resulted in a value of about 0.73 (Figure 5a and Figure 6a). The largest difference between products was found for the downstream watershed 4 where TMPA 3B42V7 is equal to 0.72 and that of MERGE is equal to 0.78 (Figure 5d and Figure 6d). All correlations found for TMPA 3B42V7 and MERGE are significant for a p-value < 0.001. Similarly, the daily errors in terms of are substantially smaller for MERGE in comparison to TMPA 3B42V7 for all watersheds. In fact, the average for TMPA 3B42V7 is equivalent to 6.91 mm. The average for MERGE, on the other hand, is as low as 4.96 mm. When analyzed in terms of relative TMPA 3B42V7 products resulted in values 54.25%, 95.01%, 76.62%, 77.18% higher than the observed precipitation average for watersheds 1, 2, 3, and 4, respectively. However, relative for MERGE was 20.15%, 45.71%, 17.98%, and 19.85% higher than the observed precipitation average for watersheds 1, 2, 3, and 4, respectively. As already presented in Figure 3, the bias of TMPA 3B42V7 daily estimates is considerably superior than that of MERGE (Figure 5 and Figure 6). for TMPA 3B42V7 may reach values of up to 28% in the lowland downstream sections, whereas MERGE’s may make underestimations of around −6% and overestimations of on average no more than 5%.
In a study applied to lower latitudes watersheds, Dinku et al. [17] identified that TMPA 3B42 multi-sensors poorly estimate precipitations from warm orographic rain clouds. According to the aforementioned authors, as the TIR sensors are used to estimate precipitation from the inverse relation between cloud top temperature and the amount of precipitation, warm convective clouds, especially in costal and mountainous regions, are likely underestimated. In addition, as tropical orographic clouds normally result in heavy rainfall amounts without the formation of much ice aloft, even the more accurate PMW SRFE which are derived from the scattering of PMW by ice particles, are miscalculated. However, the statistical behavior described in Figure 5 and Figure 6 is contrary to that reported by Dinku et al. [17] for equatorial regions. In fact, the patterns observed in the present study are similar to those found by Reis et al. [22] for mountainous sub-tropical watersheds for Minas Gerais State—Brazil. Therefore, one may infer that the rainfall generating mechanisms of UPSRB are more closely related to those of higher latitude sub-tropical regions rather than those of tropical lower latitudes. Reis et al. [22] found values of 0.7 and of 6.6 (mm day−1) for TMPA 3B42V7 in an 860 km2 watershed located in Southern Minas Gerais. The results obtained by these authors for the TMPA 3B42V7 are superior than the ones found in the present study. However, the statistics found for MERGE products in the present study outperforms the ones found by Reis et al. [22].
Given the proven superiority of MERGE for all analysis performed, this product was adopted as MGB-IPH model input to evaluate its SRFE capability in hydrological applications. The runoff simulations derived from MERGE were compared to those derived from the rain gauge network as well as observed streamflows. The results for the objective functions, simulated hydrograph characteristics, and the plausibility of calibrated model parameters were used as evaluation criteria for SRFE applicability.
3.2. Hydrologic Validation of MERGE Products
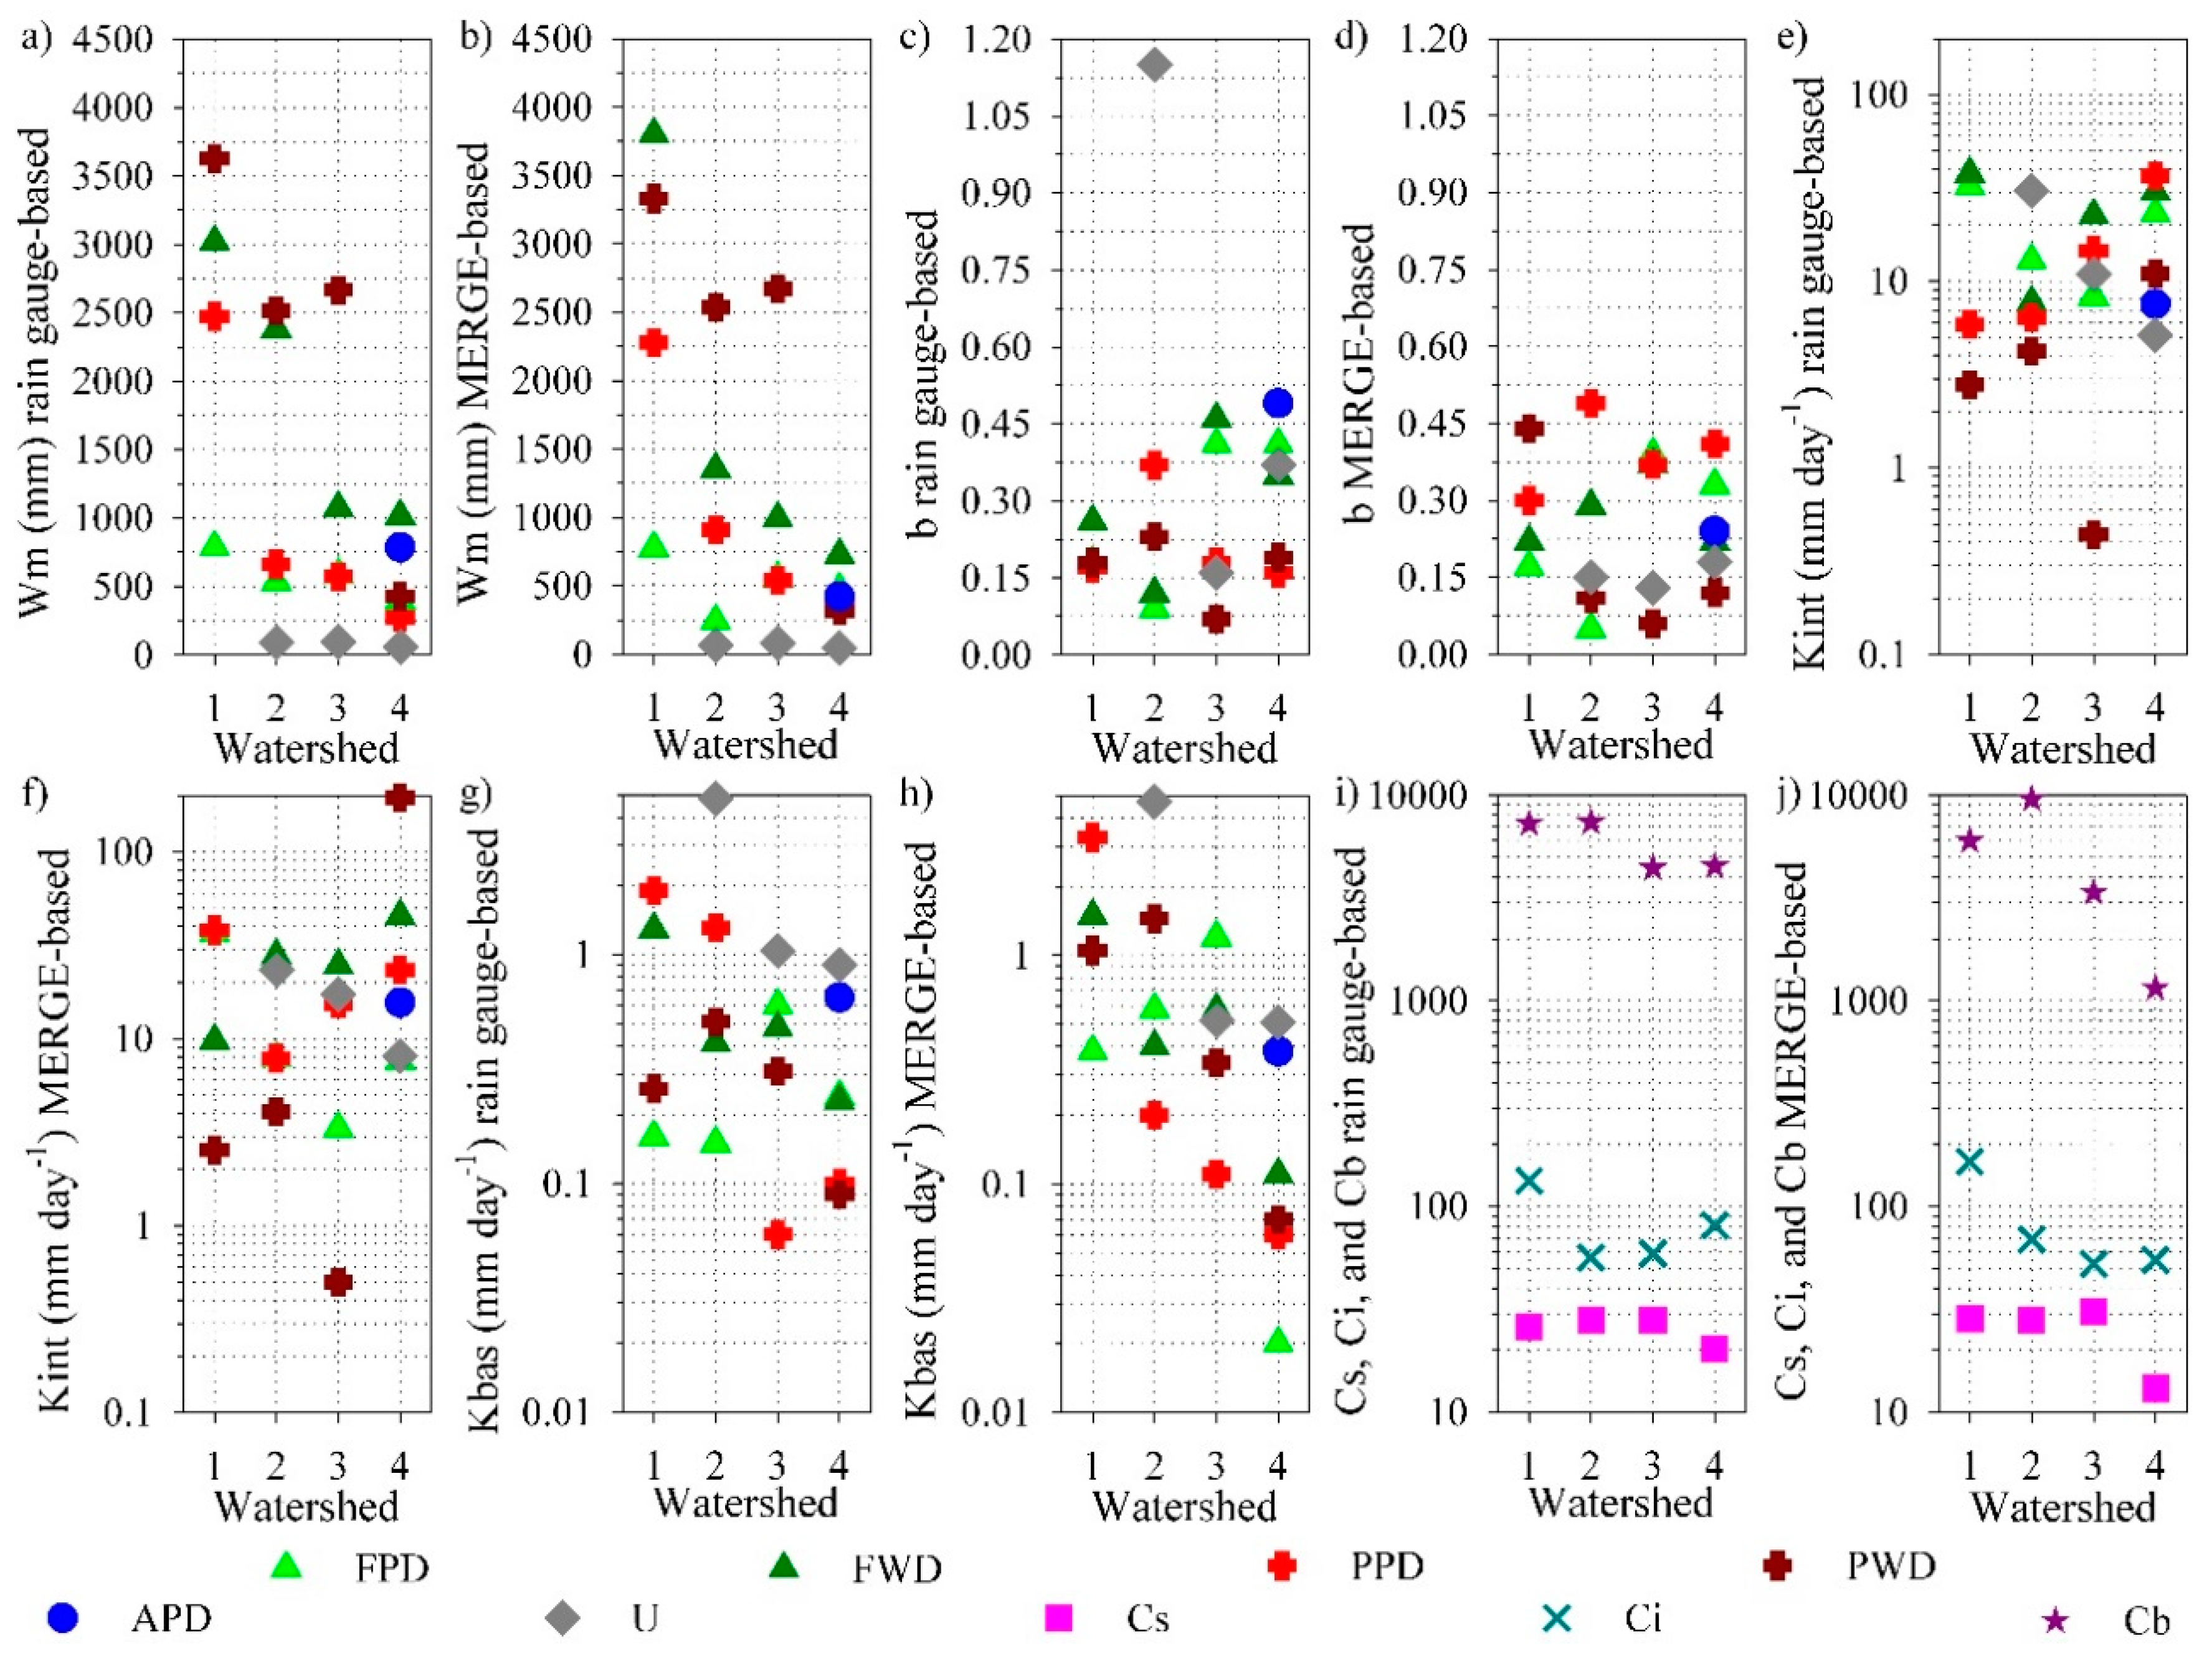
As stated in Section 2.3.2, the MGB-IPH was automatically calibrated using the MOCOM-UA algorithm applied to the objective functions , , and in order to take peak flows, recession, and long-term bias into account. The watersheds were calibrated individually following the topological order of watersheds 1 to 4, starting with reference parameter values [46] and respecting thresholds used in the literature [51,52]. The MGB-IPH is calibrated based on 7 parameters, where 4 are HRU dependent (i.e., , , , and ) and 3 are fixed for the entire watershed (i.e., , , and ). It is worthwhile to mention that the percentage of each HRU in the watershed plays an important role on model calibration as the larger the presence of an HRU the more influential its parameters potentially are. Figure 7 depicts the calibrated parameters for each HRU in each watershed for both rain gauge and MERGE-based simulations. For simplicity reasons only HRUs covering more than 0.5% of the total watershed area are considered. Table 2 presents the percentage of each HRU over watersheds 1 to 4.
The calibrated, HRU dependent, parameter (mm) is reportedly the most sensitive in MGB-IPH model [51]. The maximum upper soil water storage capacity parameter () defines the amount of water available for evapotranspiration as well as being related to soil drainage properties. Parameter , on the other hand, describes the statistical distribution of water storage capacity, where equals to zero correspond to the whole HRU area with a water storage capacity of , while > 0 means that parts of the HRU will generate runoff before the is reached [41]. Parameters and (mm day−1) refer to saturated soil sub-surface and groundwater drainage, respectively. Finally, parameters , , and are non-dimensional values for surface, sub-surface, and groundwater flow retention time. A detailed description of MGB-IPH parameters are found in Collischonn et al. [41,51].
Based on Figure 7 it is possible to affirm that rain gauge and MERGE-based simulations have similar magnitudes, indicating that although adjustments were necessary, the MERGE-based simulation maintained the overall reference calibration characteristics. In addition, consistent values were obtained for parameter as maximum upper soil water storage capacity was calibrated higher for well drained soil when compared to poorly drained ones (Figure 7a,b). Furthermore, higher values are seen for the mountainous watersheds 1 and 2. This characteristic associated with the fact that most of these watersheds are covered by expectedly higher HRUs (i.e., FWD and PWD) indicate that high soil water storage capacity may in fact occur in the upstream watersheds. However, it should be considered that the large reservoirs in such watersheds (Table 2), which attenuate the propagation of floods, may have had an impact on the high calibrated . Moreover, these cross-sections were calibrated for naturalized streamflow estimates which by definition contain errors that are not present in direct natural streamflow measurements.
Another important calibration feature that reinforces the consistency of MERGE-based simulations is that as with the rain gauge-based simulations, higher values were calibrated for shallower, poorly drained, and anthropic HRUs (e.g., PPD, FPD, U, and APD) (Figure 7c,d, Table 2). According to Collischonn et al. [51] higher values result in an increase in the number flood peaks, which is a characteristic of not only urbanized regions but also compacted agricultural lands, mechanized cultivated forests, and hydromorphic soils. Higher calibrated values for the aforementioned HRUs were also observed for parameters and for both precipitation data sources (Figure 7e–h). This characteristic suggests that the most vulnerable and anthropogenic soils (e.g., PPD, FPD, U, and APD), which cover vast areas of all watersheds (Figure 2d, Table 2), are the ones that proportionally most contribute to the streamflow maintenance in terms of sub-surface and groundwater flows. Finally, the discussion of , , and parameters (Figure 7i,j) is hampered by the fact they are HRU independent, thus being influenced by the overall resulting watersheds response. However, the fact they have similar calibrated values both precipitation data sources may indicate the calibrations are consistent to the hydrology of UPSRB.
During preliminary streamflow simulations it was noticed that simulated and observed streamflows begun to converge after a period of approximately 2 years. Viola et al. [53] attributed this characteristic to the impossibility of stablishing specific initial values for soil water storage, thus requiring a certain period of time so the model can overcome the influence of initial conditions. Such behavior may be related to the watershed memory, which is a watershed property derived from a set of climatological forcing and physiographic attributes (e.g., vegetation, slope, soil depth, etc.) that can influence present and future hydrologic responses [54], i.e., the influence of past precipitation (not taken into account) over current streamflows. To avoid misrepresenting simulated streamflows as well as reducing the current period analyzed (1 January 2001 to 31 December 2010), a 2 years period from 1 January 1999 to 31 December 2000 was added for model warm-up. The Split Sample Test method [55] was used for streamflow validation, in which the analyzed period is divided into calibration and independent validation intervals. Individual calibrations were developed for both the reference simulation based on rain gauge data and MERGE derived one as it is the most recommended approach since hydrological performance is always higher when the model is individually calibrated for different precipitation sources [20].
It is worthwhile to mention that a particular routine had to be developed to incorporate watersheds 1 and 2 due to their anthropogenic aspects, i.e., dammed main river. The simulations for watersheds 1 and 2, which are based on naturalized streamflows, do not reflect the flows that are actually propagated downstream, instead they are simulations of what would have happened if there were no anthropogenic interventions. Therefore, the downstream propagation of naturalized streamflow-based simulations would result in unrealistic estimates. Thus, substitutions of naturalized streamflow-based simulations by total dam daily discharges [43] had to be made to preserve the anthropogenic hydrological aspects of UPSRB. Naturalized streamflows have been vastly used in hydrological modeling studies worldwide. Foy et al. [56] successfully applied the Soil and Water Assessment Tool (SWAT) model to four snow-dominated, mountainous basins in Colorado—USA based on naturalized streamflows over a 15 years period. Weedon et al. [57] evaluated nine distributed hydrological models from 1963–2001 for the Thames basin using naturalized streamflows. The authors identified a variety of issues that could be addressed to improve specific models’ performance. Likewise, several studies based on naturalized streamflows have been developed for Brazil. Falck et al. [50] evaluated the propagation of satellite precipitation uncertainties through a hydrological model employing the naturalized streamflows of the Tocantins-Araguaia river basin. Lastly, Oliveira et al. [45] assessed the impacts of climate change on the hydropower potential of Furnas hydropower system in Minas Gerais—Brazil using the SWAT model coupled with naturalized streamflow estimates.
The simulated streamflows based on the reference rain gauge observations and MERGE products and their respective , , and , for both calibration and a 2 years validation period, are presented in Figure 8.
In the previous section, the validation analysis for the MERGE product applied to watershed 1 had provided the closest cumulative precipitation depths, an overall good representation of precipitation seasonality, as well as high values and low and . However, when used in the MGB-IPH model it resulted in “unsatisfactory” simulations for the calibration period, with “satisfactory” results during validation (Figure 8a). Similarly, low , , and values were also obtained for the rain gauge-based simulations. Therefore, these poor results should not be attributed to precipitation uncertainties since the MERGE product has presented a good fit with rain gauge observations which are densely available for watershed 1 (Figure 2c). Even though watershed 1 is sparsely populated and mostly covered by pastures and forested areas, it can be considered to be highly anthropogenic as it encompasses two large reservoirs (i.e., Paraíbuna upstream and Santa Branca downstream) covering more than 3% of the total watershed area. The influences these large reservoirs have on the hydrologic cycle, along with the error propagation and limitation of naturalized streamflows in such cascade of dams, may have restricted the models’ ability to simulate the hydrological outputs. This hypothesis is corroborated by the fact that simulations based on rain gauge precipitation obtained for watershed 2 (Figure 8b), which has a smaller single reservoir, resulted in “good” to “very good” calibrations. However, a sharp decrease in all objective functions was observed for the validation period of watershed 2 indicating a loss of predictive capacity possibly due to naturalized streamflow uncertainty and lack of hydrological model representativity.
For the downstream watershed 3 “very good” fits were obtained for all the objective functions, indicating a very good representations of peak flows, hydrograph recessions, and overall water output volume (Figure 8c) from both rain gauge and MERGE-based simulations. A drop to “satisfactory” and “good” representations was observed during validation, thus implying that the unpredictability of upstream discharges may jeopardize the model’s downstream predictive capacity. “Good” estimates of maximum streamflow and for the validation period are seen for watershed 4, nevertheless “unsatisfactory” are also evident (Figure 8d). The small positive of watershed 4 contradicts the actual bias of MERGE products. According to Figure 3, Figure 4, Figure 5 and Figure 6, the SRFE for MERGE in fact underestimates precipitation in about −6.12%. This clear divergency between the actual SRFE characteristics (Section 3.1) and its corresponding simulations (Section 3.2), along with the fact the modeling results for MERGE and the rain gauge network are relatively similar, reinforces the idea that the large anthropogenic interventions found in watersheds 1 and 2 impose a much larger limitation to a proper hydrological modeling in the region than the SRFE source.
The results observed for the present study corroborates what has been described in recent studies worldwide. Tong et al. [12] evaluated SRFE over the Nanliu River in China using the Xinanjiang hydrological model. These authors obtained “very good” simulations in terms of when using rain gauges as model input. The authors then calibrated the model for SRFE and obtained “satisfactory” simulations that although inferior, preserved the basic features of observed streamflows. Like the present study, Bui et al. [58] also observed a drop in the objective functions during calibration and validation periods using the HBV model with SRFE as input, for four watersheds located in Vietnam, South Korea, and Japan. Zhang et al. [23] compared SRFE (e.g., TMPA 3B42V6 and V7 and GPM) using two hydrological models (i.e., Xinanjiang and VIC) in the Ganjiang River—China. The authors observed significant improvement of TMPA 3B42V7 over its previous version. Moreover, better simulations were obtained when using the VIC model. The result of Zhang et al. [23] are similar to those of watershed 4, where “good” simulations were achieved with MERGE for both calibration and validation periods.
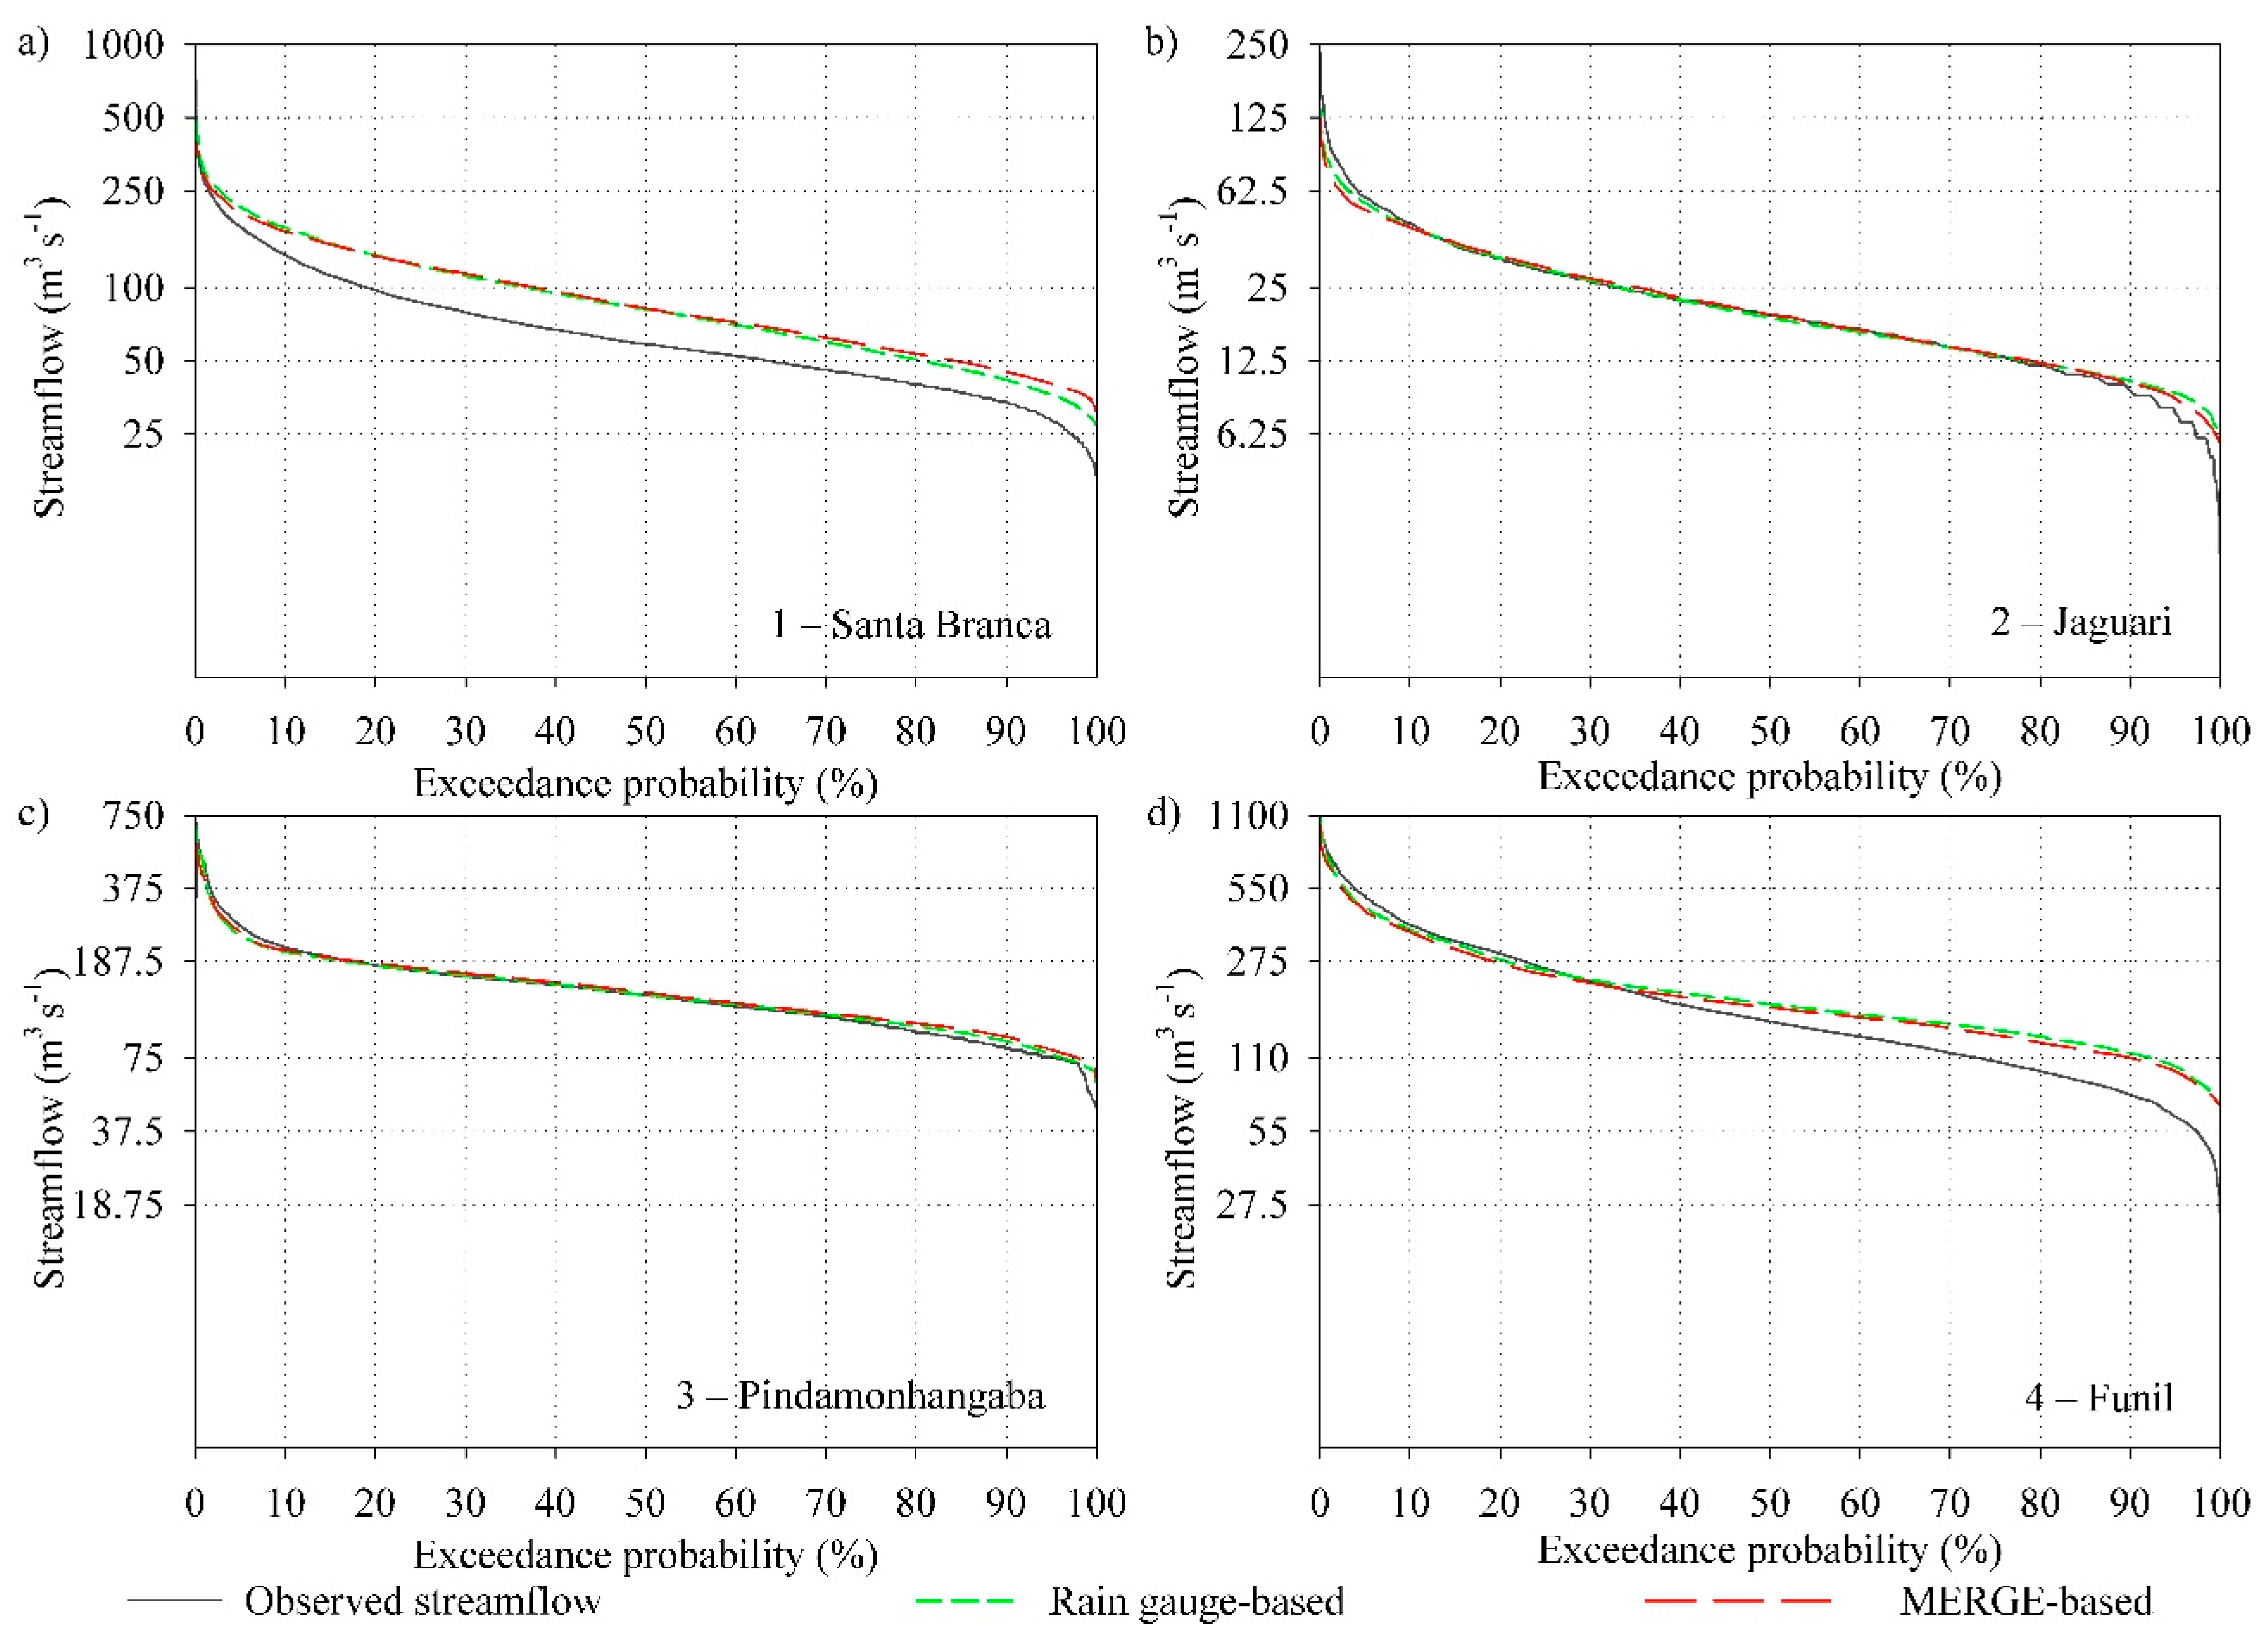
In addition to the daily streamflows, cumulative frequency curves can be used for evaluating model’s performance since they are an important tool for understanding the frequency and magnitude of extreme events. Therefore, a model capable of reproducing such characteristics has the potential for being used in water resources management, hydrological hazards mitigation, and hydrological engineering. Figure 9 presents the cumulative frequency curves for the observed and simulated streamflows.
The cumulative frequency curve for watersheds 1 (Figure 9a) clearly depicts the influence of the , , and values presented in Figure 8a. The low and observed for watershed 1 result in largely different streamflow magnitudes for almost all exceedance probabilities, i.e., unrealistic streamflow estimates for different return periods. Moreover, the large values for watershed 1 result in notable streamflow overestimations as suggested in Figure 9a. Nevertheless, close fits were obtained between the observed and simulated cumulative frequency curves for watersheds 2 and 3 (Figure 9b,c). The ability to represent streamflow frequency and magnitude observed for the MERGE-based simulations for watersheds 2 and 3 imply that although there are clear limitations for SRFE in the highly anthropogenic watersheds of UPSRB, it still has important strengths for a water sources management and engineering. Finally, close fits for watershed 4 (Figure 9d) were only possible for low exceedance probabilities, i.e., higher return periods. This characteristic is expected since , which is related to maximum flows, for watersheds 4 are much higher than , which is related to minimum flows, thus reflecting a better fit of flood events than recessions.
4. Conclusions
In the present study the MERGE satellite rainfall product was hydrologically validated in four contrasting watersheds in the UPSRB for a period from January 2001 to December 2012. This validation was based on the direct comparison of MERGE with TMPA 3B42V7 and rain gauge data at the watershed scale and the hydrological validation of streamflow simulations using the MGB-IPH model.
The MERGE daily product could capture the overall temporal and spatial precipitation aspects. Based on the visual interpretation of data one may conclude that MERGE is superior than TMPA 3B42V7 for the UPSRB by means of better representing precipitation seasonality as well as being much more faithful to the observed precipitation accumulated amounts. When statistically evaluated MERGE also presented superior features. Higher correlations were observed for MERGE when compared to TMPA 3B42V7 products. However, both products resulted in “good” correlations for watersheds 1, 3, and 4, and “satisfactory” correlation for watershed 2. In addition, lower root mean square errors were obtained from MERGE for all watersheds evaluated. Relative are classified as “unreliable” for TMPA 3B42V7 when applied to the four watersheds under analysis, while MERGE-based relative classified as “reliable”. Lastly, much lower biases were observed for MERGE products. In fact, for the TMPA 3B42V7 both watersheds 3 and 4 presented “unacceptable” . MERGE-based precipitation, on the other hand, resulted in “acceptable” relative bias for all watersheds, thus demonstrating the clear superiority of MERGE over TMPA 3B42V7.
The streamflow simulation from MERGE was able to capture the overall hydrological regimes in the watersheds of UPSRB. Unsatisfactory , , and results were obtained for watersheds 1. However, such poor representations may not be attributed to the precipitation input (i.e., MERGE) since the reference simulations, based on rain gauge data, also was not satisfactory. Thus, one may infer that large reservoir found for this watershed, along with the fact simulation are made based on naturalized streamflow estimates, have hampered the MGB-IPH model ability to simulate reliable streamflows. On the other hand, “satisfactory” to “very good” results were obtained from MERGE-based streamflow simulations when applied to downstream watersheds, for both calibration validation periods. Finally, close calibrated parameters were found for the individually calibrated MERGE and rain-gauge-based simulations, indicating a certain degree of hydrological representativeness for SRFE derived simulations.
This study is the first to perform a through validation of MERGE towards hydrological applications. Several limitations were identified for this product when applied to hydrological modeling in anthropogenic watersheds. However, as with other rain gauge adjusted SRFE described in the literature, MERGE has proven to be superior than “pure” TMPA 3B42V7 data and therefore is preferable over the UPSRB.
Author Contributions
F.C. and C.D.R designed the study; J.B.C.d.R. and F.C. performed the precipitation data preparation and analysis; F.C. and B.C.d.S. conducted the hydrological modeling; the manuscript was written by F.C. with significant contributions from all coauthors; the manuscript was revised by C.D.R., B.C.d.S., and J.B.C.d.R. All authors have read and agreed to the published version of the manuscript.
Funding
APC was funded by the Coordenação-Geral de Observação da Terra of the National Institute for Space Research (INPE).
Acknowledgments
The authors would like to thank the Brazilian National Council for Scientific and Technological Development (CNPq) for the graduate scholarship given to the first author [130481/2018-1].
Conflicts of Interest
The authors declare no conflicts of interest.
References
- Tong, K.; Fengge, S.; Yang, D.; Hao, Z. Evaluation of satellite precipitation retrievals and their potential utilities in hydrologic modeling over the Tibetan Plateau. J. Hydrol. 2014, 519, 423–437. [Google Scholar] [CrossRef]
- Worqlul, A.W.; Maathuis, B.; Adem, A.A.; Demissie, S.S.; Langan, S.; Steenhuis, T.S. Comparison of rainfall estimations by TRMM 3B42, MPEG and CFSR with ground-observed data for the Lake Tana basin in Ethiopia. Hydrol. Earth Syst. Sci. 2014, 18, 4871–4881. [Google Scholar] [CrossRef] [Green Version]
- Shukla, A.K.; Ojha, P.S.C.; Singh, R.P.; Pal, L.; Fu, D. Evaluation of TRMM Precipitation Dataser over Himalayan Catchment: The Upper Ganga Basin, India. Water 2019, 11, 613. [Google Scholar] [CrossRef] [Green Version]
- Li, D.; Christakos, G.; Ding, X.; Wu, J. Adequacy of TRMM satellite data in driving the SWAT modeling of Tiaoxi catchment (Taihu lake basin, China). J. Hydrol. 2018, 556, 1139–1152. [Google Scholar] [CrossRef]
- Li, Y.; Wang, W.; Lu, H.; Khem, S.; Yang, K.; Huang, X. Evaluation of Three Satellite-Based Precipitation Products Over the Lower Mekong River Basin Using Rain Gauge Observations and Hydrological Modeling. IEEE J. Sel. Top. Appl. Earth Obs. Remote Sens. 2019, 12, 2357–2373. [Google Scholar] [CrossRef]
- Scheel, M.L.M.; Rohrer, M.; Huggel, C.; Villar, D.S.; Silvestre, E.; Huffman, G.J. Evaluation of TRMM Multi-satellite Precipitation Analysis (TMPA) performance in the Central Andes region and its dependency on spatial and temporal resolution. Hydrol. Earth Syst. Sci. 2011, 15, 2649–2663. [Google Scholar] [CrossRef] [Green Version]
- Ouma, Y.O.; Owiti, T.; Kipkorir, E.; Kibiiy, J.; Tateishi, R. Multitemporal comparative analysis of TRMM-3B42 satellite-estimated rainfall with surface gauge data at basin scales: Daily, decadal and monthly evaluations. Int. J. Remote Sens. 2012, 33, 7662–7684. [Google Scholar] [CrossRef]
- Młyński, D.; Wałęga, A.; Petroselli, A.; Tauro, F.; Cebulska, M. Estimating Maximum Daily Precipitation in the Upper Vistula Basin, Poland. Atmosphere 2019, 10, 43. [Google Scholar] [CrossRef] [Green Version]
- Moazami, S.; Golian, S.; Kavianpour, M.R.; Hong, Y. Comparison of PERSIANN and V7 TRMM Multi-satellite Precipitation Analysis (TMPA) products with rain gauge data over Iran. Int. J. Remote Sens. 2013, 34, 8156–8171. [Google Scholar] [CrossRef]
- Gilewski, P.; Nawalany, M. Inter-Comparison of Rain-Gauge, Radar, and Satellite (IMERG GPM) Precipitation Estimates Performance for Rainfall-Runoff Modeling in a Mountainous Catchment in Poland. Water 2018, 10, 1665. [Google Scholar] [CrossRef] [Green Version]
- Price, K.; Purucker, S.T.; Kraemer, S.R.; Babendreier, J.E.; Knightes, C.D. Comparison of radar and gauge precipitation data in watershed models across varying spatial and temporal scales. Hydrol. Process. 2014, 28, 3505–3520. [Google Scholar] [CrossRef]
- Tong, K.; Zhao, Y.; Wei, Y.; Hu, B.; Lu, Y. Evaluation and Hydrological Validation of GPM Precipitation Products over the Nanliu River Basin, Beibu Gulf. Water 2018, 10, 1777. [Google Scholar] [CrossRef] [Green Version]
- Nikolopoulos, E.I.; Anagnostou, E.N.; Hossain, F.; Gebremichael, M.; Borga, M. Understanding the Scale Relationships of Uncertainty Propagation of Satellite Rainfall through a Distributed Hydrologic Model. J. Hydrometeor. 2010, 11, 520–532. [Google Scholar] [CrossRef]
- Li, X.H.; Zhang, Q.; Xu, C.Y. Suitability of the TRMM satellite rainfalls in driving a distributed hydrological model for water balance computations in Xinjiang catchment, Poyang lake basin. J. Hydrol. 2012, 426, 28–38. [Google Scholar] [CrossRef]
- Chokngamwong, R.; Chiu, L.S. Thailand Daily Rainfall and Comparison with TRMM Products. J. Hydrometeor. 2008, 9, 256–266. [Google Scholar] [CrossRef]
- Tobin, K.J.; Bennett, M.E. Using SWAT to model streamflow in two river basins with ground and satellite precipitation data. J. Am. Water Resour. Assoc. 2009, 45, 253–271. [Google Scholar] [CrossRef]
- Dinku, T.; Connor, S.J.; Ceccato, P. Comparison of CMORPH and TRMM-3B42 over Mountainous Regions of Africa and South America. In Satellite Rainfall Applications for Surface Hydrology, 1st ed.; Gebremichael, M., Hossain, F., Eds.; Springer: Dordrecht, The Netherlands, 2010; pp. 193–204. [Google Scholar]
- Bitew, M.M.; Gebremichael, M. Evaluation of satellite rainfall products through hydrologic simulation in a fully distributed hydrologic model. Water Resour. Res. 2011, 47, W06526. [Google Scholar] [CrossRef]
- Liechti, T.C.; Matos, J.P.; Boillat, J.L.; Schleiss, A.J. Comparison and evaluation of satellite derived precipitation products for hydrological modeling of the Zambezi River Basin. Hydrol. Earth Syst. Sci. 2012, 16, 489–500. [Google Scholar] [CrossRef] [Green Version]
- Thiemig, V.; Rojas, R.; Zambrano-Bigiarini, M.; Roo, A.D. Hydrological evaluation of satellite-based rainfall estimates over the Volta and Boro-Akobo Basin. J. Hydrol. 2013, 499, 324–338. [Google Scholar] [CrossRef]
- Maggioni, V.; Meyers, P.C.; Robinson, M.D. A Review of Merged High-Resolution Satellite Precipitation Product Accuracy during the Tropical Rainfall Measuring Mission (TRMM) Era. J. Hydrometeor. 2016, 17, 1101–1117. [Google Scholar] [CrossRef]
- Reis, J.B.C.; Rennó, C.D.; Lopes, E.S.S. Validation of Satellite Rainfall Products over a Mountainous Watershed in a Humid Subtropical Climate Region of Brazil. Remote Sens. 2017, 9, 1240. [Google Scholar] [CrossRef] [Green Version]
- Zhang, Z.; Tian, J.; Huang, Y.; Chen, X.; Chen, S.; Duan, Z. Hydrologic Evaluation of TRMM and GPM IMERG Satellite-Based Precipitation in a Humid Basin of China. Remote Sens. 2019, 11, 431. [Google Scholar] [CrossRef] [Green Version]
- Nerini, D.; Zulkafli, Z.; Wang, L.P.; Onof, C.; Buytaert, W.; Lavado-Casimiro, W.; Guyot, J.L. A Comparative Analysis of TRMM-Rain Gauge Data Merging Techniques at the Daily Time Scale for Distributed Rainfall-Runoff Modeling Applications. J. Hydrometeor. 2015, 16, 2153–2168. [Google Scholar] [CrossRef] [Green Version]
- Rozante, J.R.; Moreira, D.S.; Gonçalves, L.G.G.; Vila, D.A. Combining TRMM and Surface Observations of Precipitation: Technique and Validation over South America. Weather Forecast 2010, 25, 885–894. [Google Scholar] [CrossRef] [Green Version]
- Nair, S.; Srinivasan, G.; Nemani, R. Evaluation of Multi-Satellite TRMM Derived Rainfall Estimates over a Western State of India. J. Meteorol. Soc. Jpn. 2009, 87, 927–939. [Google Scholar] [CrossRef] [Green Version]
- Chen, S.; Hong, Y.; Gourley, J.J.; Huffman, G.J.; Tian, Y.; Cao, Q.; Yong, B.; Kirstetter, P.E.; Hu, J.; Hardy, J.; et al. Evaluation of the successive V6 and V7 TRMM multisatellite precipitation analysis over the Continental United States. Water Resour. Res. 2013, 49, 8174–8186. [Google Scholar] [CrossRef]
- Stisen, S.; Sandholt, I. Evaluation of remote-sensing-based rainfall products through predictive capacity in hydrological runoff modelling. Hydrol. Process. 2010, 24, 879–891. [Google Scholar] [CrossRef]
- Kahn, J.R.; Vásquez, W.F.; Rezende, C.E. Choice modeling of system-wide or large scale environmental change in a developing country context: Lessons from Paraíba do Sul River. Sci. Total Environ. 2017, 598, 488–496. [Google Scholar] [CrossRef]
- Marques, J.S.J.; Dittmar, T.; Niggemann, J.; Almeida, M.G.; Gomez-Saez, G.V.G.; Rezende, C.E. Dissolved Black Carbon in the Headwaters-to-Ocean Continuum of Paraíba Do Sul River, Brazil. Front. Earth Sci. 2017, 5, 11. [Google Scholar] [CrossRef] [Green Version]
- Marengo, J.A.; Alves, L.M. Tendências Hidrológicas da Bacia do Rio Paraíba do Sul. Rev. Bras. Meteorol. 2005, 2, 215–226. [Google Scholar]
- Alvares, C.A.; Stape, J.L.; Sentelhas, P.C.; Gonçalves, J.L.M.; Sparovek, G. Köppen’s climate classification map for Brazil. Meteorol. Z. 2013, 22, 711–728. [Google Scholar] [CrossRef]
- Projeto RADAMBRASIL—Folhas SF. 23/24, Rio de Janeiro/Vitória: Geologia, Geomorfologia, Pedologia, Vegetação, uso Potencial da Terra. 1983. Available online: https://biblioteca.ibge.gov.br/index.php/bibliotecacatalogo?view=detalhes&id=217129 (accessed on 1 April 2019).
- MapBiomas Project—Collection [Version 3.1] of the Annual Land Use Land Cover Maps of Brazil. Available online: http://mapbiomas.org/en (accessed on 25 March 2019).
- ANA—Agência Nacional de Águas, Sistema Nacional de Informações sobre Recursos Hídricos, Portal Hidroweb. Available online: http://www.snirh.gov.br/hidroweb/publico/apresentacao.jsf (accessed on 5 April 2019).
- Viessman, G.; Lewis, G.L. Introduction to Hydrology, 5th ed.; Prentice Hall: Upper Saddle River, NJ, USA, 2003; p. 624. [Google Scholar]
- Xue, X.; Hong, Y.; Limaye, A.S.; Gourley, J.J.; Huffman, G.J.; Khan, S.I.; Dorji, C.; Chen, S. Statistical and hydrological evaluation of TRMM-based Multi-satellite Precipitation Analysis over the Wangchu Basin of Bhutan: Ate the latest satellite precipitation products 3B42V7 ready for use in ungauged basins? J. Hydrol. 2013, 499, 91–99. [Google Scholar] [CrossRef]
- CPTEC—MERGE, Centro de Previsão de Tempo e Estudos Climáticos. Available online: http://ftp.cptec.inpe.br/modelos/io/produtos/MERGE/ (accessed on 12 April 2019).
- NASA—National Aeronautics and Space Administration, TRMM. Available online: https://pmm.nasa.gov/data-access/downloads/trmm (accessed on 2 May 2019).
- Franchito, S.H.; Rao, V.B.; Vasques, A.C.; Santo, C.M.E.; Conforte, J.V. Validation of TRMM precipitation radar monthly rainfall estimates over Brazil. J. Geophys. Res. 2009, 144, D02105. [Google Scholar] [CrossRef] [Green Version]
- Collischonn, W.; Allasia, D.; Silva, B.C.; Tucci, E.M. The MGB-IPH model for large-scale raingall-runoff modelling. Hydrol. Sci. J. 2007, 52, 878–895. [Google Scholar] [CrossRef] [Green Version]
- Pontes, P.R.M.P.; Fan, F.M.; Fleischmann, A.S.; Paiva, R.C.D.; Buarque, D.C.; Siqueira, V.A.; Jardim, P.F.; Sorribas, M.V.; Collischonn, W. MGB-IPH model for hydrological and hydraulic simulations of large floodplain river systems coupled with open source GIS. Environ. Model. Softw. 2017, 94, 1–20. [Google Scholar] [CrossRef]
- Guilhon, L.G.F.; Rocha, V.F.; Moreira, J.C. Comparação de Métodos de Previsão de Vazões Naturais Afluentes a Aproveitamentos Hidroelétricos. Rev. Bras. Recur. Hídricos 2007, 12, 13–20. [Google Scholar]
- ONS—Operador Nacional do Sistema Elétrico. Available online: https://www.ana.gov.br/sar/sin/b_paraiba-do-sul (accessed on 1 August 2019).
- Oliveira, V.A.; Mello, C.R.; Viola, M.R.; Srinivasan, R. Assessment of climate change impacts on streamflows and hydrolpower potential in the headwater region of the Grande river basin, Southeastern Brazil. Int. J. Climatol. 2017, 37, 5005–5023. [Google Scholar] [CrossRef]
- Medeiros, M.S.; Fleischmann, A.S.; Oliveira, A.M.; Corati, B.K.; Fan, F.M.; Martinbiacho, G.K.; Jargim, P.F.; Correa, S.W.; Siqueira, V.A.; Collischonn, W. Personal Communication, Manual de Exemplo de Aplicação do Modelo MGB 2018 Utilizando o IPH-Hydro Tools; Hidrologia de Grande Escala-Instituto de Pesquisas Hidráulicas UFRGS: Porto Alegre, Brazil, 2018. [Google Scholar]
- INMET—Instituto Nacional de Meteorologia, Normais Climatológicas do Brasil 1961–1990. Available online: http://www.inmet.gov.br/portal/index.php?r=clima/normaisClimatologicas (accessed on 14 May 2019).
- Moriasi, D.N.; Arnold, J.G.; Van Liew, M.W.; Bingner, R.L.; Harmel, R.D.; Veith, T.L. Model evaluation guidelines for systematic quantification of accuracy in watershed simulations. Trans. ASABE 2007, 50, 885–900. [Google Scholar]
- Van Liew, M.W.; Arnold, J.G.; Garbrecht, J.D. Hydrologic simulations on agricultural watersheds: Choosing between two models. Trans. ASABE 2003, 46, 1539–1551. [Google Scholar] [CrossRef]
- Falck, A.S.; Maggioni, V.; Tomasella, J.; Vila, D.A.; Diniz, F.L.R. Propagation of satellite precipitation uncertainties through a distributed hydrologic model: A case study in the Tocantins-Araguaia Basin in Brazil. J. Hydrol. 2015, 527, 943–957. [Google Scholar] [CrossRef]
- Collischonn, W. Simulação Hidrológica de Grandes Bacias. Ph.D. Thesis, Universidade Federal do Rio Grande do Sul, Porto Alegre, Brazil, December 2001. [Google Scholar]
- Silva, B.C. Previsão Hidroclimática de Vazão para a Bacia do Rio São Francisco. Ph.D. Thesis, Universidade Federal do Rio Grande do Sul, Porto Alegre, Brazil, October 2005. [Google Scholar]
- Viola, M.R.; Mello, C.R.; Chow, S.C.; Yanagi, S.C.; Gomes, J.L. Assessing climate change impacts on Upper Grande River Basin hydrology, Southeastern Brazil. Int. J. Climatol. 2015, 35, 1054–1068. [Google Scholar] [CrossRef]
- Nippgen, F.; McGlynn, B.L.; Emanuel, R.E.; Vose, J.M. Watershed memory at the Coweeta Hydrology Laboratory: The effect of past precipitation and storage on hydrologic response. Water Resour. Res. 2016, 52, 1673–1695. [Google Scholar] [CrossRef] [Green Version]
- Klemeš, V. Operational testing of hydrological simulation. Hydrol. Sci. J. 1986, 31, 13–24. [Google Scholar] [CrossRef]
- Foy, C.; Arabi, M.; Yen, H.; Gironás, J.; Bailey, R.T. Multisite Assessment of Hydrologic Processes in Snow-Dominated Mountainous River Basins in Colorado Using a Watersheds Model. J. Hydrol. Eng. 2015, 20, 04015017. [Google Scholar] [CrossRef]
- Weedon, G.P.; Prudhomme, C.; Crooks, S.; Ellis, R.J.; Folwell, S.S.; Best, M.J. Evaluating the Performance of Hydrological Models via Cross-Spectral Analysis: Case Study of the Thames Basin, United Kingdom. J. Hydrometeor. 2015, 16, 214–231. [Google Scholar] [CrossRef] [Green Version]
- Bui, H.T.; Ishidaira, H.; Shaowei, N. Evaluation of the use of global satellite-gauge and satellite-only precipitation products in stream flow simulations. Appl. Water Sci. 2019, 9, 1–15. [Google Scholar] [CrossRef] [Green Version]
Figure 1.
Cross-sections of the UPSRB.

Figure 2.
Model input data, including (a) land use and land cover, (b) drainage condition, (c) DEM, meteorological stations and rain gauges, and (d) hydrological response units (HRU) based on the combination of soil and land use and land cover maps: forest poorly drained (FPD), forest well drained (FWD), pasture poorly drained (PPD), pasture well drained (PWD), agriculture poorly drained (APD), agriculture well drained (AWD), rock outcrop (R), urban (U), and water bodies (W).

Figure 3.
Cumulated precipitation depths for watersheds (a) 1, (b) 2, (c) 3, and (d) 4.

Figure 4.
Mean monthly precipitation for watersheds (a) 1, (b) 2, (c) 3, and (d) 4.

Figure 5.
Scatterplot between daily TMPA 3B42V7 and rain gauge data for watersheds (a) 1, (b) 2, (c) 3, and (d) 4.
Figure 5.
Scatterplot between daily TMPA 3B42V7 and rain gauge data for watersheds (a) 1, (b) 2, (c) 3, and (d) 4.

Figure 6.
Scatterplot between daily MERGE and rain gauge data for watersheds (a) 1, (b) 2, (c) 3, and (d) 4.
Figure 6.
Scatterplot between daily MERGE and rain gauge data for watersheds (a) 1, (b) 2, (c) 3, and (d) 4.

Figure 7.
Calibrated parameters for the rain gauge and MERGE-based simulations. For parameters (a,b) , (c,d) , (e,f) , (g,h) , and (i,j) , , .
Figure 7.
Calibrated parameters for the rain gauge and MERGE-based simulations. For parameters (a,b) , (c,d) , (e,f) , (g,h) , and (i,j) , , .

Figure 8.
Observed and simulated streamflow for watersheds 1 to 4 for watersheds (a) 1, (b) 2, (c) 3, and (d) 4.
Figure 8.
Observed and simulated streamflow for watersheds 1 to 4 for watersheds (a) 1, (b) 2, (c) 3, and (d) 4.

Figure 9.
Cumulative frequency curves for the observed and simulated streamflows for watersheds (a) 1, (b) 2, (c) 3, and (d) 4.
Figure 9.
Cumulative frequency curves for the observed and simulated streamflows for watersheds (a) 1, (b) 2, (c) 3, and (d) 4.


Table 1.
Model input data.
| Data | Variable (Unit) | Spatial Resolution | Agency |
|---|---|---|---|
| SRTM—DEM | Altitude (m) | 30 m | USGS |
| MapBiomas | Land cover class (-) | 30 m | MapBiomas |
| RADAMBRASIL | Soil class (-) | 1:250,000 | IBGE |
| Rain gauge network | Precipitation (mm day−1) | Point | ANA |
| TMPA 3B42 | Precipitation (mm day−1) | ~25 km | NASA |
| MERGE | Precipitation (mm day−1) | 20 km | CPTEC |
| Observed streamflow | Streamflow (m3 s−1) | Point | ANA |
| Naturalized streamflow | Streamflow (m3 s−1) | Point | ONS |
| Meteorological variables | Temperature (°C), relative humidity (%), insolation (h day−1), wind speed (m s−1) e atmospheric pressure (kPa) | Point | INMET |
Table 2.
Percentages of HRU in each watershed.
| Watershed | HRU (%) | ||||||||
|---|---|---|---|---|---|---|---|---|---|
| FPD | FWD | PPD | PWD | APD | AWD | R | U | W | |
| 1 | 20.64 | 17.99 | 27.33 | 30.57 | 0.01 | 0.00 | 0.01 | 0.24 | 3.21 |
| 2 | 3.33 | 43.46 | 1.22 | 47.87 | 0.00 | 0.00 | 0.03 | 0.91 | 3.17 |
| 3 | 4.05 | 24.65 | 10.06 | 53.02 | 0.05 | 0.01 | 0.07 | 7.53 | 0.55 |
| 4 | 16.97 | 14.02 | 14.69 | 50.17 | 0.75 | 0.10 | 0.06 | 2.69 | 0.55 |
© 2020 by the authors. Licensee MDPI, Basel, Switzerland. This article is an open access article distributed under the terms and conditions of the Creative Commons Attribution (CC BY) license (http://creativecommons.org/licenses/by/4.0/).
Share and Cite
MDPI and ACS Style
Cassalho, F.; Daleles Rennó, C.; Bosco Coura dos Reis, J.; Cláudio da Silva, B. Hydrologic Validation of MERGE Precipitation Products over Anthropogenic Watersheds. Water 2020, 12, 1268. https://doi.org/10.3390/w12051268
AMA Style
Cassalho F, Daleles Rennó C, Bosco Coura dos Reis J, Cláudio da Silva B. Hydrologic Validation of MERGE Precipitation Products over Anthropogenic Watersheds. Water. 2020; 12(5):1268. https://doi.org/10.3390/w12051268
Chicago/Turabian StyleCassalho, Felício, Camilo Daleles Rennó, João Bosco Coura dos Reis, and Benedito Cláudio da Silva. 2020. "Hydrologic Validation of MERGE Precipitation Products over Anthropogenic Watersheds" Water 12, no. 5: 1268. https://doi.org/10.3390/w12051268
Note that from the first issue of 2016, this journal uses article numbers instead of page numbers. See further details here.