Article

Response of Drainage Water Quality to Fertilizer Applications on a Switchgrass Intercropped Coastal Pine Forest

1
Department of Geology and Environmental Geosciences, College of Charleston, Charleston, SC 29424, USA
2
Center for Forested Wetland Research, Southern Research Station, USDA Forest Service, Cordesville, SC 29434, USA
3
Department of Biological and Agricultural Engineering, North Carolina State University, Raleigh, NC 27695, USA
4
Weyerhaeuser Company, Columbus, MS 39701, USA
5
North Carolina Department of Environment and Natural Resources, Raleigh, NC 27699, USA
6
College of Engineering, University of Georgia, Athens, GA 30602, USA
7
Oshkosh Corporation, Oshkosh 5, WI 4901, USA
*
Author to whom correspondence should be addressed.
Water 2020, 12(5), 1265; https://doi.org/10.3390/w12051265
Submission received: 4 March 2020 / Revised: 4 April 2020 / Accepted: 17 April 2020 / Published: 29 April 2020
(This article belongs to the Special Issue Water and Nutrient Balance, Flow/Loading Dynamics in Forest System)

Abstract

:
The objectives of this study were (1) to test the hypothesis that fertilizer applications do not increase nutrient fluxes on a switchgrass/pine forest (IC) when compared to a mature pine forest (MP) and (2) to evaluate post-fertilization (post-fert, 2014–2016) fluxes of nitrogen (N) and phosphorus (P) on IC and compare them to those observed during switchgrass growth prior to fertilization (pre-fert, 2012–2014) and site preparation for switchgrass establishment (site prep, 2009–2012). Nitrogen and P were applied to IC, a paired pure switchgrass site (SG), and MP, each about 25 ha in size, in June 2014, and again in June 2015 for the IC and SG sites only. Nitrogen and P concentrations were measured biweekly and rainfall and drainage outflow were measured continuously. During post-fert, the mean N concentrations and total loads were lower (p < 0.05) in IC than in SG and MP. The mean NO3-N concentration and loads in IC were lower during post-fert than during site prep. The post-fert phosphate concentrations in IC were lower than they were during pre-fert and site prep. Frequent N and P applications in IC did not significantly (α = 0.05) increase N and P fluxes, likely due to plant uptake and sorption on the acidic site.

1. Introduction

Traditional loblolly pine (Pinus taeda) forest management requires infrequent nitrogen (N) and phosphorus (P) applications, preferably two to three times during a 25 to 30 year growth cycle [1], unlike a switchgrass (Panicum virgatum L.)/pine system, which requires annual N and P fertilizer applications to maximize production [2]. Understanding how drainage water exports N and P after fertilizer application and how it affects switchgrass/pine systems is important for land management and for insuring sustainable downstream water quality and other ecosystem functions [1]. Other studies have documented the effects of fertilizer application in pure switchgrass sites and forests with natural understory on plant growth, soil properties, and water quality and quantity. Greater N and P fluxes for a 10-year fertilized loblolly pine stand were observed when compared to a non-fertilized forest in Scotland County, NC [3]. Plot scale soil data [4,5] in fertilized switchgrass/pine sites located in coastal North Carolina revealed a short-lived spike in soil ammonium-N (NH4-N) and nitrate-N (NO3-N) concentrations. The greater short-lived drainage water N concentrations of a pine-forested watershed in Carteret County, NC were attributed to N fertilizer application followed by three consecutive storm events right after fertilization [1]. In this study, we hypothesized that frequent fertilizer application in switchgrass/pine forest does not lead to significant differences in water N and P concentrations and loads compared to traditionally managed pure switchgrass and/or mature pine forest sites.
Given adequate nutrients, including fertilization after a three-year maturity period, switchgrass can be harvested every year [6]. Switchgrass regenerates from the root stocks after harvesting due to the allocation of large amounts of resources in the root system during establishment [6] and senescence. In the pre-fertilization period, switchgrass plants germinate from broadcasted seeds; during the post-fertilization period, mature switchgrass is harvested, and regenerates from the root stocks. During pre-fertilization, switchgrass grows using nutrients from the mineralization of harvest residues incorporated into the soil during site preparation. These biological processes, resulting from switchgrass growth and from the growth of young pine trees on the intercropped site and their interactions with added nutrients from fertilization, may alter hydrologic and nutrient cycling, potentially influencing the nutrient discharges from these systems. Comparing nutrient levels for the post-fertilization period with levels from pre-fertilization and site preparation is necessary to evaluate the overall effects of these operational periods of switchgrass intercropping for biofuel production on the watershed-scale responses of water quality variables before its large-scale implementation.
Other watershed scale studies have examined the effects of site preparation for switchgrass establishment that involved shearing and bedding on N and P, and found an initial increase in N fluxes that gradually decreased after switchgrass establishment during the pre-fertilization period [7]. However, the watershed-scale effects of fertilizer application on water quality discharged from switchgrass/pine systems compared to a fertilized traditional pine forest have not yet been explored. This information is critical because the effects of pine/switchgrass systems on water resources are yet to be evaluated, although growing and harvesting such crops on vast areas of forestland in the Southeastern U.S.A appears to be very attractive. Therefore, the objectives of the study were to: (1) test the hypothesis that fertilizer applications do not increase nutrient fluxes in a switchgrass/pine forest compared to the managed pine forest as well as pure switchgrass and (2) evaluate watershed-scale post-fertilization N and P fluxes on the intercropped site and compare them to levels at prior periods (switchgrass growth without fertilizer applied and site preparation for switchgrass establishment). If the hypothesis in objective (1) is true, we can confidently use the space between pine rows to produce switchgrass as a cellulosic biofuel, by replacing natural understory between pine rows in a traditional pine forests with switchgrass. In addition, part of the land that would have been otherwise used for pure switchgrass can be used for food production and other land uses. In this study, we used a fertilized switchgrass intercropped pine forest (IC), a pure switchgrass site (SG), and a traditionally managed mature thinned pine (MP) forest located in Carteret County, North Carolina to examine the changes in N and P water concentrations and loads associated with adopting a more frequent fertilizer application schedule in an intercropped forest.

2. Materials and Methods

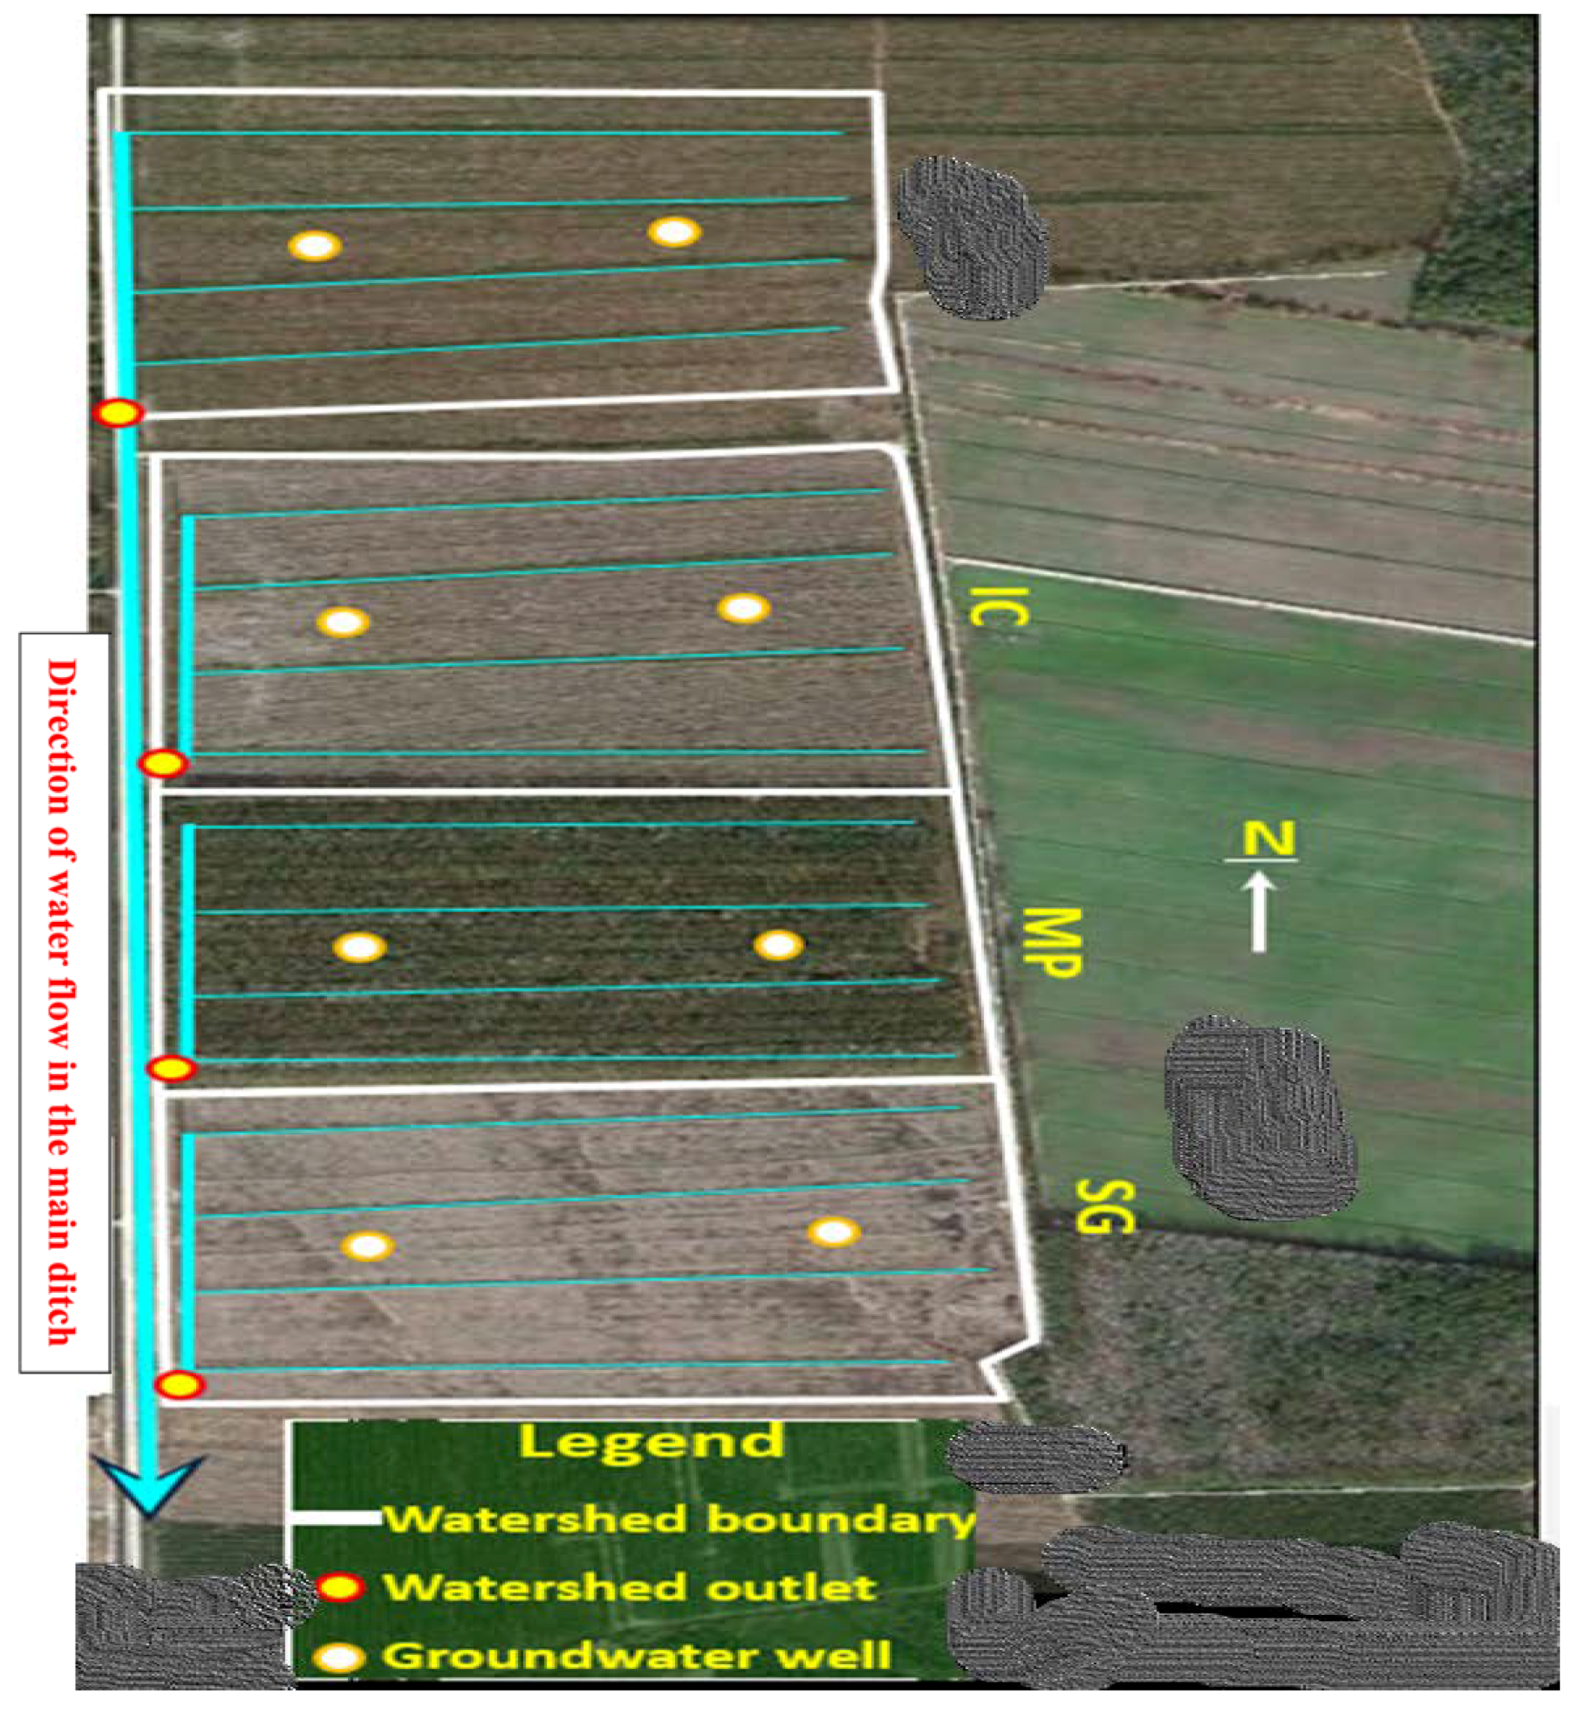
2.1. Site Description

The study site consists of three experimental watersheds (Figure 1) including a mid-rotation thinned loblolly pine forest (MP~25.9 ha) with natural understory (control), switchgrass/loblolly pine (IC~26.3 ha) treatment, and pure switchgrass treatment (SG~27.1 ha) located in Carteret County, North Carolina (34.8° N, 76.7° W) in USA. The site is on a flat coastal plain with a 0.1% gradient and is elevated 3 m above sea level [8]. The soil type at the site is classified as Deloss fine sandy loam (fine loamy, mixed, thermic Typic Umbraquult) and is acidic with a pH of about 4 [1]. The soil properties include poor drainage, shallow water tables, fine sandy loam texture at 0–50 cm depth, an average hydraulic conductivity of 3.9 m d−1, a drainable porosity of 0.05 m m−1, a saturated water content of 0.43 m3 m−3, and a wilting point water content of 0.22 m3 m−3 [1]. Four parallel ditches in each watershed with a spacing of 100 m and average depth of 1.4 m were used to drain the sites. Artificial divides implemented midway between parallel ditches separated the watersheds, and 0.30 m raised beds planted with loblolly pine trees minimized surface runoff toward the watershed outlet [9]. The site is surrounded by forest-dominated areas to the north, south, and west, and an agriculture-dominated area to the east. Historic stand characteristics, drainage design, soil type and properties, and weather parameters for the study site were described elsewhere [1,8,9].

2.2. Management of the Sites

Pine seedlings were planted on the intercropped site (IC) in January 2010. Switchgrass seeds were broadcasted on the IC and pure switchgrass sites (SG) in April 2012. Site preparation (site prep) was performed during November 2009 to April 2012 for switchgrass establishment that involved harvesting 35-yr old mature pine trees, shearing, bedding and root raking on the IC and SG sites as documented in details in [7]. Pre-fertilization (pre-fert, from April 2012 to May 2014) was the period of switchgrass growth in IC and SG without fertilizer applications [10]. Post-fertilization (post-fert) occurred between June 2014 and May 2016. The control site with 12-yr old (in 2009) pine stands planted in 1997 was thinned between the end of 2008 and beginning of 2009 [11].
Nitrogen (N) and phosphorous (P) fertilizers were applied in June 2014 and June 2015 at rates of 65.7 kg N ha−1 and 15.1 kg P ha−1 for IC and SG, and rates of 175 kg N ha−1 and 40.4 kg P ha−1 for mature thinned pine forest (MP) in June 2014. A John Deere skidder with a fertilizer spreader on the back, and a farm tractor (Kubota 3540; Company: Mitchell tractor, Washington, DC, USA) with a farm spreader were used to apply fertilizers in 2014 and 2015, respectively.
In 2014, switchgrass at IC and SG sites was harvested during November to the end of December, and again from November 2015 to end of January 2016. Switchgrass harvest residues were retained on the sites. It took three months to harvest switchgrass in the second year because of wet site conditions. After switchgrass harvesting, based on field observations, it took about a month for complete switchgrass regeneration from the root stocks.

2.3. Field Measurement of Precipitation and Flow

Precipitation was measured by tipping-bucket rain gauges (HOBO; Onset Computer Corporation: 470 MacArthur Blvd., Bourne, MA 02532) backed up by manual gauges placed in open areas near the outlet of each watershed (Figure 1). Drainage outflow was calculated using standard weir equations with stage heights measured downstream and upstream of a 120° V-notch weir at a 12-min interval by In situ Level TROLL 500 (https://in-situ.com); CR200 (Campbell Scientific, Logan, Utah, USA) at each of the watershed ditch outlets (Figure 1). A large pump installed at the main roadside ditch (downstream of all weir outlets) minimized weir submergence during large storm events [9]. Other details of hydro-meteorological measurements were documented [12].

2.4. Field Sampling and Laboratory Analysis of Drainage Water Nitrogen and Phosphorus Concentrations

Biweekly water quality samples were obtained from the field using an automatic sampler (ISCO-2700) that was connected to flow measurement instrumentation (Figure 1) to collect flow proportional composite samples. The sampler was programmed to collect 150 mL after every 200 cm3 (0.8 mm of watershed area-based water depth) of volume flowing over the V-notch weir. The biweekly composited field water samples were collected, stored in ice coolers and taken to the laboratory for N and P analysis on the same day.
Cadmium reduction (EPA standard method- 4500 NO3-E, 1998 [13]) was used for NO3-N analysis with a detection limit of 0.01 mg L−1. The ammonium salicylate method (EPA standard method-4500 NH3G, 1998 [13]) was used for NH4-N analysis with a detection limit of 0.01 mg L−1. The acid digestion method (EPA standard method- 4500 Norg B, 1998 [13]) was used for total Kjedahl nitrogen (TKN) analysis and the detection limit was 0.04 mg L−1. A Bran Luebbe Autoanalyzer II (SEAL Analytical Inc. Mequon Technology Center, 10520-C North Baehr Road, Mequon, Wisconsin 53092) was used for N analysis with colorimetry. The ascorbic acid method (EPA standard method-4500-P, 1998 [13]) was used for phosphate analysis with a detection limit of 0.01 mgL−1. The details of water quality sampling protocols for recent and earlier periods can be found in other studies [1,10].

2.5. Data Processing and Statistical Analyses

Instantaneous precipitation was processed to obtain daily, monthly, and annual totals. Similarly, flow rates calculated on 12-min intervals were integrated to obtain daily flow totals. Daily total flow and total precipitation during site preparation for switchgrass establishment (site prep), the pre-fertilization period (pre-fert), and the post-fertilization period (post-fert) were calculated and used to characterize the patterns/changes in nutrient concentrations and loads. Nitrogen and P loads were calculated by multiplying daily flows with corresponding measured flow proportion-based concentrations from biweekly composite samples. Because a biweekly schedule for water sampling was adopted, days with flow but without measured concentrations were filled with measured concentrations for the following days. Daily loads were summed to obtain annual loads.
The flow-weighted concentrations for a given period were calculated by dividing total load by total flow volume. Exploratory statistics (mean, standard deviation, and ranges) were calculated for all water quality variables. A multiple mean comparison test, Tukey’s Honest Significant Difference (HSD), was used to (1) test the hypothesis that the mean nutrient concentrations and loads on the IC site were equal or smaller than those on the MP Site and (2) examine the significance (α = 0.05) in concentrations and load differences between the three periods (post-fert, pre-fert and site prep), individually, on each watershed with the IC and SG treatments. The total nutrient loads and flow-weighted concentrations for the post-fert period were also compared to that of the site prep and pre-fert, individually.

3. Results and Discussion

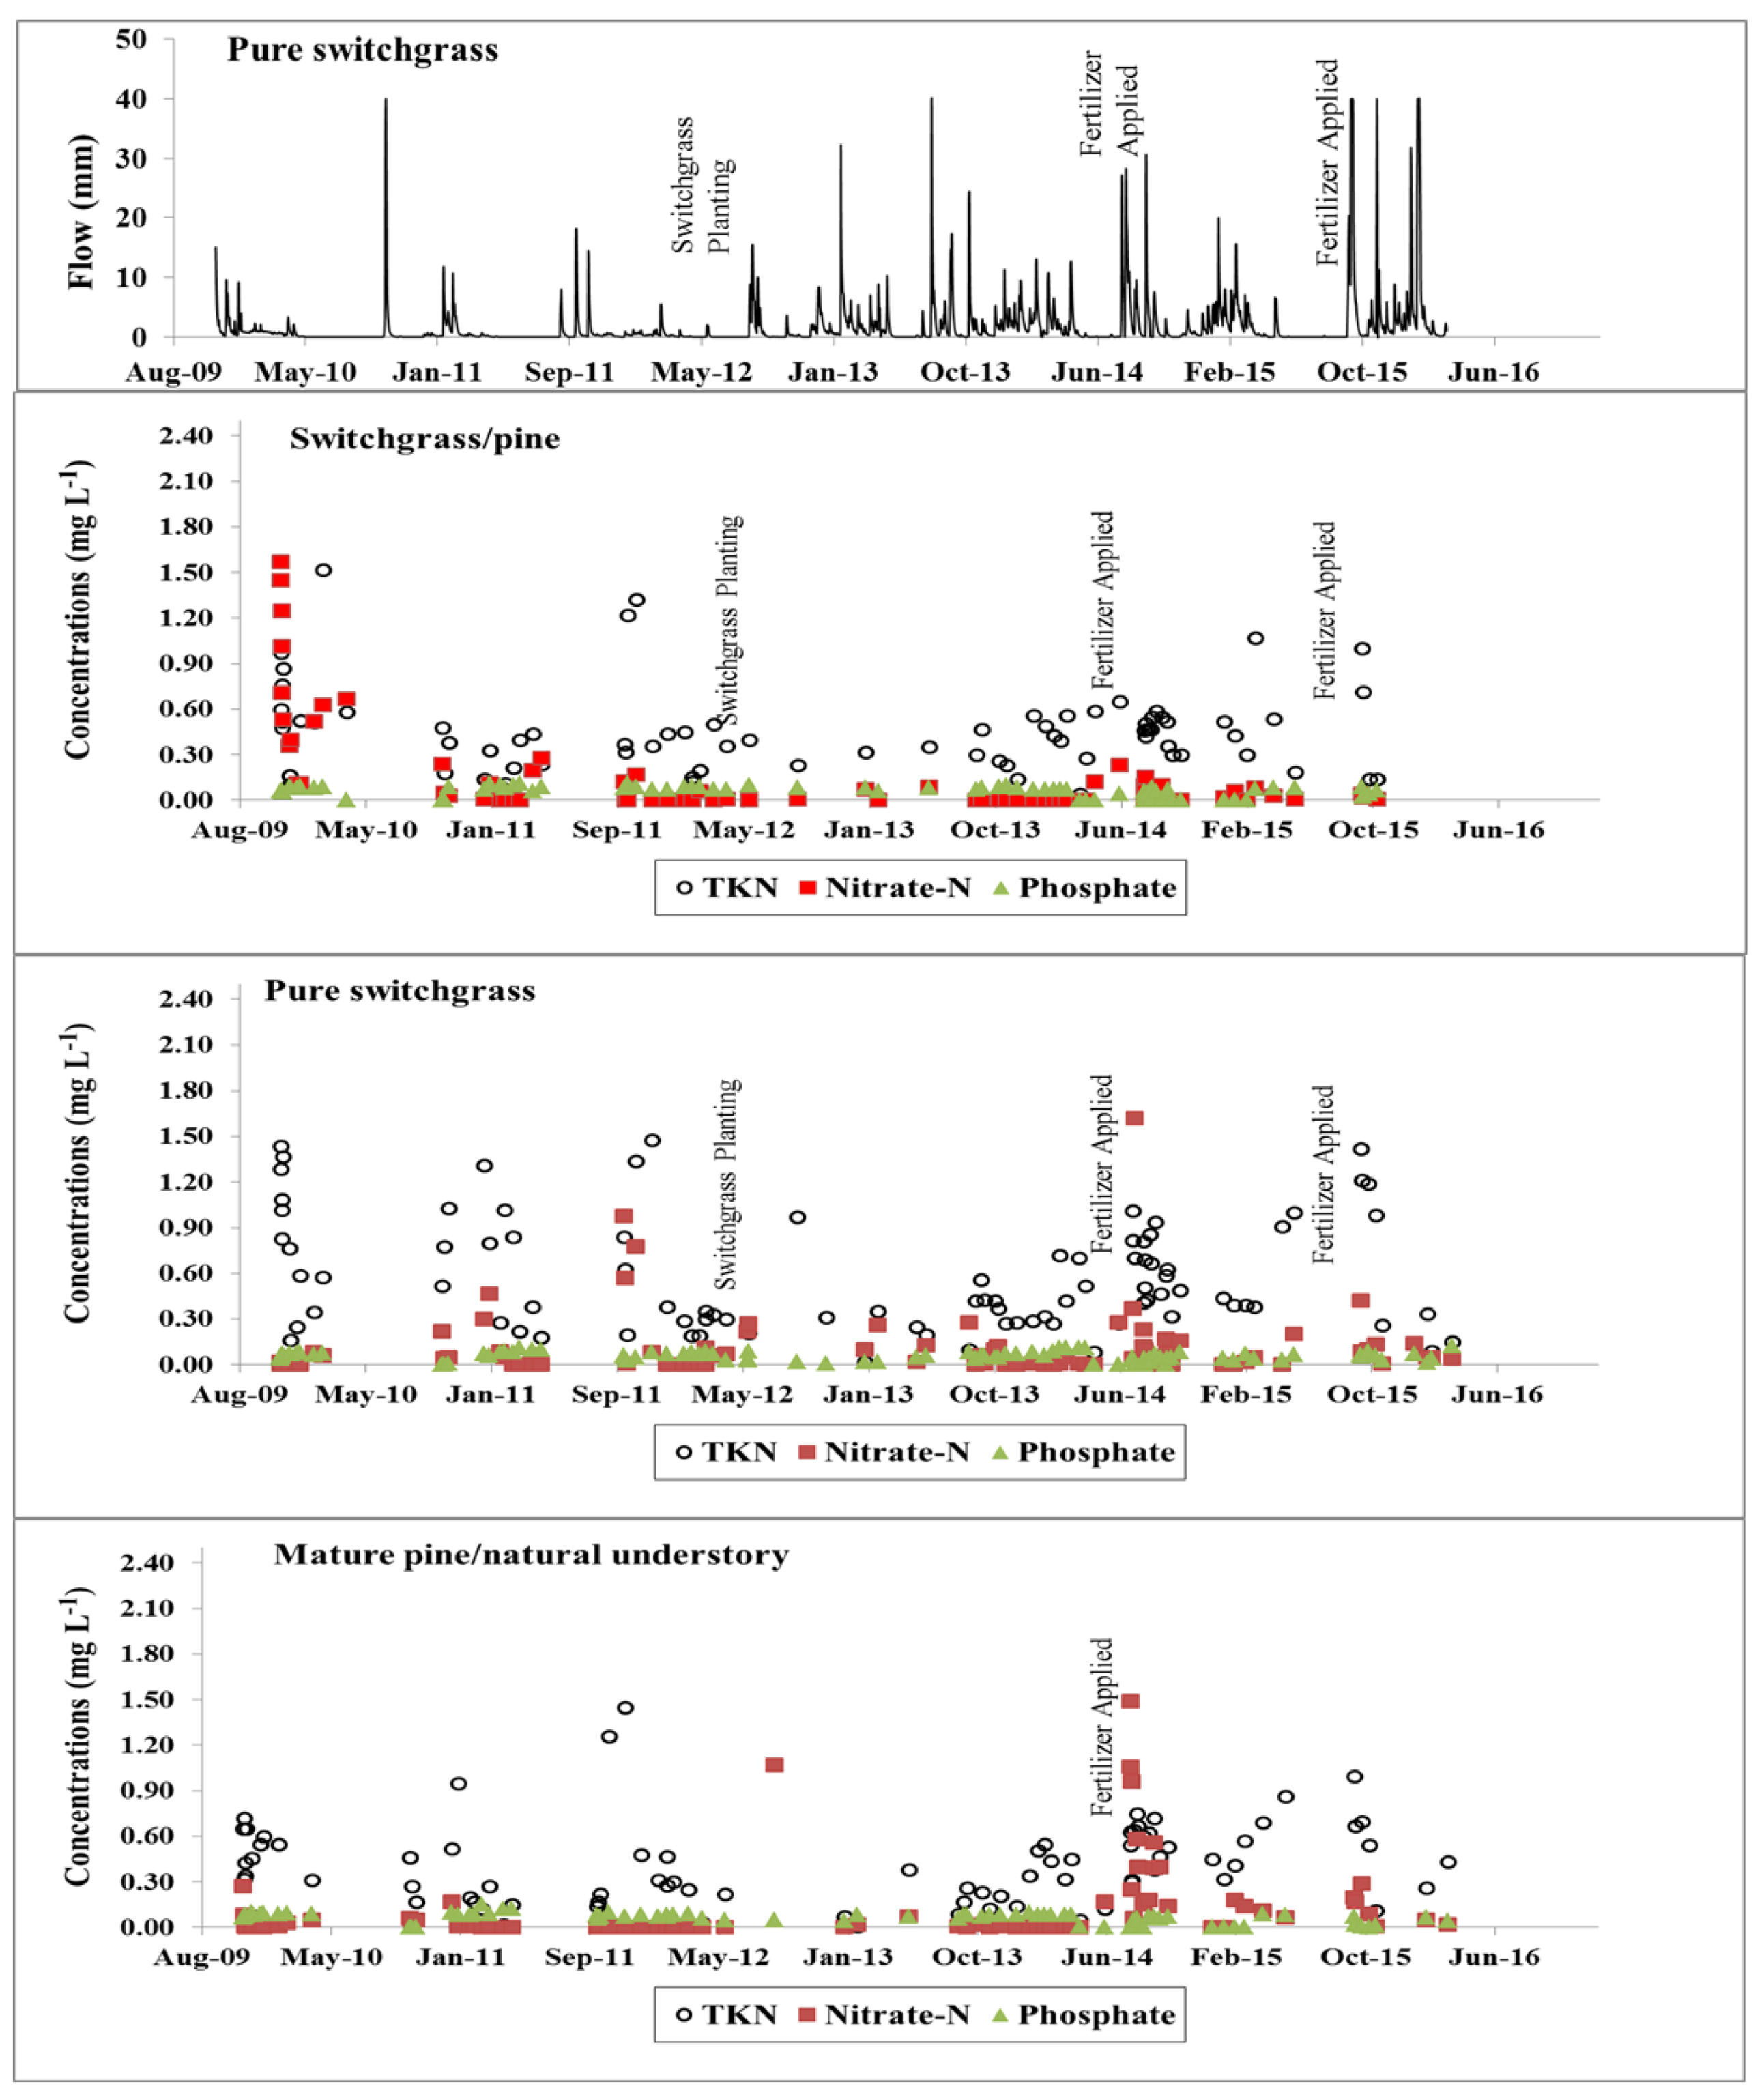
3.1. Drainage Water Nitrogen and Phosphorus Responses to Fertilizer Applications

There was a short-lived (about 30 day) increase in NH4-N (maximum for IC: 0.31 mg L−1, SG: 0.39 mg L−1, and MP: 0.69 mg L−1), NO3-N (maximum for IC: 0.23 mg L−1, SG: 1.62 mg L−1, and MP: 1.49 mg L−1), and TKN (maximum for IC: 1.07 mg L−1, SG:1.42 mg L−1, and MP: 0.99 mg L−1) concentrations after fertilizer application on all the sites, but no increase in phosphate (Figure 2). After this short-lived increase in N following fertilizer application, concentrations decreased during the post-fertilization period (Figure 2). The concentrations of NH4-N, TKN, and NO3-N increased at first flush after every dry period (2014: between May and July; 2015: between May and September), represented by days with no flow (Figure 2). For example, first flush for N was observed in either early October or late September in 2014 and 2015 (Figure 2).
The mean NH4-N, NO3-N, and TKN concentrations in IC were lower than concentration in SG and MP during post-fert (Figure 2; Table 1). The maximum values for NO3-N and TKN on the IC watershed were lower than the average values obtained for the same watershed with a managed pine forest for the 1989-1990 period when the watershed was fertilized in Spring of 1989 [14]. The mean NO3-N concentration for MP during post-fert was greater (p < 0.05) than the concentration for SG (Figure 2; Table 1). There was no significant (α = 0.05) difference in mean phosphate concentrations among the watersheds during the post-fert period (Figure 2; Table 1). This supports the hypothesis of the first objective that fertilizer application did not increase nutrient levels in the IC watershed when compared to the traditional managed pine forest (MP).
In other studies, the first-flush effects on nutrient export were associated with large rainfall events [1,15]. In this study, greater numbers of measurements were made when high amounts of rain were recorded, e.g., between September 2013 and April 2014 (Figure 2). The short-lived increase in NH4-N, NO3-N, and TKN concentrations in all watersheds immediately following fertilization was probably due to the dissolution of applied solid fertilizer. Nitrogen concentrations decreased thereafter, likely due to plant uptake [16], biochemical transformations [17], and dilution effects [18]. The established pine roots and growing roots of switchgrass improved the uptake of the applied fertilizers. The dilution caused by subsequent rain events also decreased nutrient concentrations. The increase in N mineralization in the immediate months after application might have also contributed to the observed short-lived increase in concentration [19]. A short-term increase in NH4-N and NO3-N, with NO3-N peaking at greater soil concentration than NH4-N in the fertilized switchgrass/pine site was observed in a plot located in Lenoir County, NC [5]. Following a short-lived spike, effective utilization of inorganic N by plants older than 2.5 years in switchgrass/pine plots was reported [5], recording 39% and 60% reduction in soil NH4-N and NO3-N, respectively.
A probable explanation for the greater NH4-N and NO3-N concentrations in MP, when compared to IC and SG during the post-fert period was the difference in fertilizer application rates (175 kg N ha−1 and 40.4 kg P ha−1 applied in June 2014 on MP while only 65.7 kg N ha−1 and 15.1 kg P ha−1 in June of 2014 and 2015 on both IC and SG). Recent nutrient cycling studies also recorded a greater net N mineralization rate for pine/natural understory than for pure switchgrass and switchgrass/pine forest [20]. There was potentially no uptake in SG due to complete removal of switchgrass aboveground biomass during harvesting in late 2014 and 2015, unlike in IC, where there was continuous nutrient uptake by pine even after the intercropped switchgrass was harvested. This was the probable reason for the higher NO3-N and TKN concentrations on SG compared to the IC during the post-fert period. There was no significant difference (p < 0.05) in phosphate concentrations among the watersheds during the post-fert period despite applying a greater amount of P (40.4 kg P ha−1) in MP than in IC and SG (15.1 kg P ha−1). This was likely due to the acidic nature of the soil, which enhances fixation of P [7]. Figure 2 shows that TKN and phosphorous were mostly related to surface flow when the first flush flow occurred, and NO3-N, with a greater potential for leaching, was mostly related to lateral flow. This was probably due to low plant uptake coupled with less transpiration, and leaching of NO3-N during winter [21].
The NO3-N, TKN, and phosphate flow-weighted concentrations during post-fert 2 period (June 2015 to May 2016) were greater than corresponding concentrations during post-fert 1 period (June 2014 to May 2015) on IC and SG (Table 2). The above trend in flow concentrations (post-fert 2 > post-fert 1) in IC and SG was likely due to the cumulative effect of the first fertilizer coupled with harvest residues mineralization [20,21,22]. Nitrogen loads in MP during post-fert for our study were lower than other fertilization studies [1], likely due to the effects of three back-to-back large storms right after fertilization as reported in one study [1].
The load trends for NH4-N and NO3-N during post-fert were SG > MP > IC, and MP > SG > IC, respectively (Table 2). The TKN and phosphate loads trend during post-fert were both SG > IC > MP (Table 2). The NO3-N, TKN and phosphate total loads in IC and SG during post-fert 2 were greater than corresponding loads during post-fert 1 (Table 2), partly due to greater flow during post-fert 2. The NH4-N and NO3-N loads in IC were lower than in SG and MP during post-fert, likely due to greater flow in SG, and greater applied N in post-fert 1 coupled with greater rates of N mineralization that led to greater concentrations in MP. There might have been greater net mineralization in MP than in IC and SG due to greater applied N and P. Greater field net mineralization was associated with additional N and P applied to a 14-year-old loblolly pine plantation and 11-year old Pinus radiata [16,19]. Greater soil NH4-N than NO3-N concentrations were reported in a switchgrass/pine plot scale study [20,21,23], and the pattern was attributed to the immobile nature of NH4-N when compared to NO3-N. The TKN and phosphate loads in IC were lower than in SG during post-fert (Table 2), also likely due to greater flow in SG. The TKN and phosphate loads in IC were greater than in MP during post-fert (Table 2), probably due to greater flow in IC. The data for this study showed that the fertilizer application did not increase the nutrient loads on the IC treatment when compared to the MP, except for phosphate, again supporting the above hypothesis. The nutrients concentrations in watershed outflows did not lead to water quality degradation; positive water quality effect was also reported in switchgrass plot scale studies [20,21]. The outflow nutrients load ratios to applied N and P for a 2-year post fertilization period followed the following trends, IC (0.005) < SG (0.012) = MP (0.012) for NO3-N, IC (0.006) < MP (0.009) < SG (0.014) for NH4-N and MP (0.013) < IC (0.048) < SG (0.060) for PO4-P, respectively. The ratios of exported N and P were lower for IC than SG, which showed that switchgrass/loblolly pine forest reduced N and P export during the post-fertilization period.

3.2. Comparisons of Post-Fertilization Water Quality Variables to those of the Pre-Fertilization and Site Preparation Periods

The post-fert mean NH4-N concentration was greater (p < 0.05) than concentration during site prep, and post-fert mean NO3-N and phosphate concentrations were lower than concentrations during site prep in IC treatment (Figure 3; Table 3). The post-fert mean NO3-N concentration was greater (p < 0.05) than concentration during pre-fert, and post-fert phosphate concentration was lower than concentration during pre-fert in IC treatment (Figure 3; Table 3). The post-fert mean NH4-N concentration was significantly greater (p < 0.05) than concentration during site prep, and site prep mean phosphate concentrations were significantly greater than concentration during post-fert in SG treatment (Figure 3; Table 3). The post-fert mean NH4-N, NO3-N, and TKN concentrations were greater (p < 0.05) than corresponding concentrations during pre-fert, and post-fert phosphate concentrations were lower than pre-fert concentrations in SG treatment (Figure 3; Table 3). The post-fert mean NH4-N, NO3-N, and TKN measured concentrations in MP were greater (p < 0.05) than corresponding concentrations during pre-fert. The post-fert mean phosphate measured concentrations in MP forest were lower (p < 0.05) than concentrations during pre-fert (Figure 3; Table 3).
Data in Table 4 show the nutrient loads for the three watersheds during three experimental periods. The post-fert NH4-N and TKN loads in IC and SG were greater than both the site prep and pre-fert loads. The post-fert NO3-N loads were greater than pre-fert loads, but lower than site prep loads in IC. The post-fert NO3-N loads were greater than pre-fert and site prep loads in SG. The post-fert NH4-N, NO3-N, and TKN loads were greater than pre-fert loads in MP. The post-fert phosphate loads were lower than pre-fert loads, and greater than site prep loads in IC. The post-fert phosphate loads were greater than pre-fert and site prep loads in SG, but were lower than pre-fert loads in MP.
The trend of post-fert > site prep for mean NH4-N concentration in IC and SG was likely due to additional N during post-fert period coupled with the low pH of the soil, which reduces nitrification rates. The post-fert mean NH4-N concentration in IC and mean NH4-N, NO3-N, and TKN concentrations in SG were greater than corresponding concentrations during pre-fert, probably also due to additional N. The post-fert mean NO3-N concentration was lower than that for site prep with young and small trees in IC, likely due to greater plant nutrient uptake during post-fert [7,24]. Newly planted tree seedlings require minimal nutrients due to their small size, and nutrient uptake rates subsequently increased with an increase in tree size [24]. The post-fert NH4-N, NO3-N, and TKN concentrations in MP were greater than those for the pre-fert, also likely due to additional N applied during post-fert. For all the watersheds, post-fert mean phosphate concentration was lower than those for the prior periods, likely due to inherent low pH, such that even after P application, there might have been rapid plant uptake coupled with sorption on soil [20,21,25].
Differences in concentrations and total flow volumes (Table 2 and Table 4) as a result of the corresponding rainfall amounts and vegetation types played an important role in differences in nutrient loads among experimental periods [26]. The total rainfall amounts during site preparation were 3188 mm for IC, 3007 mm for SG, and 3071 mm for MP. The total rainfall amounts during pre-fertilization were 3298 mm for IC, 3302 mm for SG, and 3289 mm for MP. The total rainfall amounts during post-fertilization were 10,027 mm for IC, 10,025 mm for SG, and 10,072 mm for MP. For instance, post-fert total flow and NH4-N and TKN mean concentrations (Figure 3) and loads (Table 2), in all the watersheds were greater than those for the pre-fert and site prep periods. The post-fert total flows (Table 2) were greater than pre-fert (1615 mm for IC, 1931 mm for SG and 1442 mm for MP) and site prep (693 mm for IC, 489 mm for SG and 698 mm for MP). Post-fert NO3-N loads (Table 2) in IC were lower than site prep loads, likely due to greater concentrations for the later period, despite the fertilization effects on the former period (Figure 3). However, the post-fert total NO3-N loads and mean concentration in IC were greater than during pre-fert, potentially due to fertilization effects, but it is important to note that outflow was also higher. The post-fert NO3-N load was five times lower than the site prep on the IC, despite more than double the amount of flow for post-fert than the site prep and pre-fert, mainly because of substantially reduced concentrations (Figure 2). It was the opposite for NH4-N, which yielded 3.5 to 7 times higher loads for post-fert than the site prep in all three vegetation treatments, likely due to both increased flow and higher concentrations than for the former period. Interestingly, for the MP site, higher outflow coupled with greater applied N during the post-fert period was likely responsible for increased loads for TKN, NO3-N, and NH4-N.

4. Conclusions

Fertilizer application did not increase the nutrient concentrations and loads on the switchgrass intercropped (IC) treatment when compared to the mature pine (MP) forest, except for the phosphate loads. The lower flow-weighted concentrations and loads of NH4-N and NO3-N for the IC treatment compared to the pure switchgrass treatment (SG) and the MP site, indicated greater retention through plant uptake in the IC. The short-lived increase of N concentrations after fertilization on IC was not observed in P, likely due to greater P sorption by the site’s acidic soils. Lower N concentrations were observed in IC during the post-fertilization period than were observed for the site preparation period with younger pine trees, indicating that adverse effects due to reduced plant uptake during the latter period may be critical in water quality management. High precipitation events, for example in September and October of 2015, might have influenced the variability in N and P exports during the post-fertilization period. Annual fertilization and switchgrass harvesting in a switchgrass/pine plantation forest did not result in greater N and P concentrations in drainage water when compared to the traditional mature pine forest on this coastal landscape. The enhanced water quality data for intercropping switchgrass on this coastal pine forest showed that switchgrass can be produced on managed pine forests, while allocating more land that would have otherwise been used for pure switchgrass sites to other land uses.

Author Contributions

A.M. wrote the earlier drafts of the paper including literature review, methods, results and discussion, analyzed data with graphs and tables and interpreted results, revised couple of versions based on internal reviews by coauthors and the journal reviewers. D.M.A. participated in overall project goals and field experimental design, helped develop hypotheses and objectives and in some statistical analyses, reviewed/edited various versions of the drafts. G.M.C. Participated in overall project goals and field experimental design, helped edit/review earlier draft versions. J.E.N. funded the study, participated in overall project goals and field experimental design, helped in field site management, data collection and initial quality control, edit/review earlier draft versions. T.A. participated in field experimental design, helped in monitoring installations, and complete data quality control. E.W.T. helped in reviewing/editing the draft versions. H.S. helped in statistical analyses of water quality data. M.A.Y. participated in overall project goals, helped in reviewing/editing the draft versions. F.B. participated in overall project goals and some field experiment with nutrients. T.C.: helped in reviewing the draft version. All authors have read and agreed to the published version of the manuscript.

Funding

The project was funded by Weyerhaeuser Company, U.S. Department of Energy (DOE), and Catch Light Energy LLC- A Chevron|Weyerhaeuser Joint Venture.

Acknowledgments

The authors would like to acknowledge Tyson Cliff for all field monitoring works related to data collection and initial data quality control. The authors would also like to thank Greta Langhenry and Maureen Stuart at the Forest Service Southern Research Station for their help with technical editing and formatting of the manuscript.

Conflicts of Interest

The authors declare no conflict of interest.

References

  1. Beltran, B.J.; Amatya, D.M.; Youssef, M.; Jones, M.; Callahan, T.J.; Skaggs, R.W.; Nettles, J.E. Impacts of fertilization on water quality of a drained pine plantation: A worst case scenario. J. Environ. Qual. 2010, 39, 293–303. [Google Scholar] [CrossRef] [PubMed] [Green Version]
  2. Cacho, J.F.; Youssef, M.A.; Chescheir, G.M.; Skaggs, R.W.; Leggett, Z.H.; Sucre, E.B.; Nettles, J.E.; Arellano, C. Impacts of switchgrass-loblolly pine intercropping on soil physical properties of a drained forest. Trans. ASABE 2015, 58, 1573–1583. [Google Scholar]
  3. Albaugh, T.J.; Allen, H.L.; Stape, J.L.; Fox, T.R.; Rubilar, R.A.; Price, J.W. Intra-annual nutrient flux in Pinus taeda. Tree Physiol. 2012, 32, 1237–1258. [Google Scholar] [CrossRef] [PubMed]
  4. Minick, K.J.; Strahm, B.D.; Fox, T.R.; Sucre, E.B.; Leggett, Z.H. Microbial nitrogen cycling response to forest-based bioenergy production. Ecol. Appl. 2015, 25, 2366–2381. [Google Scholar] [CrossRef] [PubMed]
  5. Minick, K.J.; Strahm, B.D.; Fox, T.R.; Sucre, E.B.; Leggett, Z.H.; Zerpa, J.L. Switchgrass intercropping reduces soil inorganic nitrogen in a young loblolly pine plantation located in coastal North Carolina. For. Ecol. Manag. 2014, 319, 161–168. [Google Scholar] [CrossRef]
  6. McLaughlin, S.B.; Kszos, L.A. Development of switchgrass (Panicum virgatum) as a bioenergy feedstock in the United States. Biomass Bioenergy 2005, 28, 515–535. [Google Scholar] [CrossRef]
  7. Muwamba, A.; Amatya, D.M.; Ssegane, H.; Chescheir, G.M.; Appelboom, T.; Tollner, E.W.; Nettles, J.E.; Youssef, M.A.; Birgand, F.; Skaggs, R.W.; et al. Effects of site preparation for pine forest/switchgrass intercropping on water quality. J. Environ. Qual. 2015, 44, 1263–1272. [Google Scholar] [CrossRef]
  8. McCarthy, E.J.; Skaggs, R.W.; Famum, P. Experimental determination of the hydrologic components of a drained forest watershed. Trans. ASABE 1991, 34, 2031–2039. [Google Scholar] [CrossRef]
  9. Amatya, D.M.; Skaggs, R.W.; Gregory, J.D. Effects of controlled drainage on the hydrology of a drained pine plantation in the North Carolina Coastal Plains. J. Hydrol. 1996, 181, 211–232. [Google Scholar] [CrossRef]
  10. Muwamba, A.; Amatya, D.M.; Chescheir, G.M.; Nettles, J.E.; Appelboom, T.; Ssegane, H.; Tollner, E.W.; Youssef, M.A.; Birgand, F.; Skaggs, R.W.; et al. Water quality effects of switchgrass intercropping on pine forest in Coastal North Carolina. Trans. ASABE 2017, 60, 1607–1620. [Google Scholar] [CrossRef]
  11. Ssegane, H.; Amatya, D.M.; Chescheir, G.M.; Skaggs, W.R.; Tollner, E.W.; Nettles, J.E. Consistency of hydrologic relationships of a paired watershed approach. Am. J. Clim. Chang. 2013, 2, 147–164. [Google Scholar] [CrossRef] [Green Version]
  12. Ssegane, H.; Amatya, D.M.; Muwamba, A.; Chescheir, G.M.; Appelboom, T.; Tollner, E.W.; Nettles, J.E.; Youssef, M.A.; Birgand, F.; Skaggs, R.W. Calibration of paired watersheds: Utility of moving sums in presence of externalities. Hydrol. Process. 2017, 31, 3458–3471. [Google Scholar] [CrossRef]
  13. USEPA. EPA Manual 351.2, with Slight Modifications Including Dialysis or Standard Methods 4500; USEPA: Washington, DC, USA, 1998.
  14. Amatya, D.M.; Gilliam, J.W.; Skaggs, R.W.; Lebo, M.E.; Campbell, R.G. Effects of controlled drainage on forest water quality. J. Environ. Qual. 1998, 27, 923–935. [Google Scholar] [CrossRef]
  15. David, M.B.; Gentry, L.E.; Starks, K.M.; Cooke, R.A. Stream transport of herbicides and metabolites in a tile-drained, agricultural watershed. J. Environ. Qual. 2003, 32, 1790–1801. [Google Scholar] [CrossRef]
  16. Carlyle, J.C. Nutrient management in a Pinus radiata plantation after thinning: The effect of nitrogen fertilizer on soil nitrogen fluxes and tree growth. Can. J. For. Res. 1995, 25, 1673–1683. [Google Scholar] [CrossRef]
  17. Lemus, R.; Parrish, D.J.; Abaye, O. Nitrogen-use dynamics in switchgrass grown for biomass. Bioenergy Res. 2008, 1, 153–162. [Google Scholar] [CrossRef]
  18. Binkley, D.; Burnham, H.; Allen, H.L. Water quality impacts of forest fertilization with nitrogen and phosphorus. For. Ecol. Manag. 1999, 121, 191–213. [Google Scholar] [CrossRef]
  19. Gurlevik, N.; Kelting, D.L.; Allen, H.L. Nitrogen mineralization following vegetation control and fertilization in a 14-year-old loblolly pine plantation. Soil Sci. Soc. Am. J. 2004, 68, 272–281. [Google Scholar] [CrossRef]
  20. Cacho, J.F.; Youssef, M.A.; Shi, W.; Chescheir, G.M.; Skaggs, R.W.; Tian, S.; Leggett, Z.H.; Sucre, E.B.; Nettles, J.E.; Arellano, C. Impacts of forest-based bioenergy feedstock production on soil nitrogen cycling. For. Ecol. Manag. 2018, 419, 227–239. [Google Scholar] [CrossRef] [Green Version]
  21. Cacho, J.F.; Youssef, M.A.; Chescheir, G.M.; Skaggs, R.W.; Appelboom, T.W.; Leggett, Z.H.; Sucre, E.B.; Nettles, J.E.; Arellano, C. Effects of forest-based bioenergy feedstock production on shallow ground water quality of a drained forest soil. Sci. Total Environ. 2018, 631, 13–22. [Google Scholar] [CrossRef]
  22. Miesel, J.R.; Jach-Smith, L.C.; Renz, M.J.; Jackson, R.D. Distribution of switchgrass (Panicum virgatum L.) aboveground biomass in response to nitrogen addition and across harvest dates. Biomass Bioenergy 2017, 100, 74–83. [Google Scholar] [CrossRef] [Green Version]
  23. Cacho, J.F.; Youssef, M.A.; Shi, W.; Chescheir, G.M.; Skaggs, R.W.; Tian, S.; Leggett, Z.H.; Sucre, E.B.; Nettles, J.E.; Arellano, C. Impacts on soil nitrogen availability of converting managed pine plantation into switchgras monoculture for bioenergy. Sci. Total Environ. 2019, 654, 1326–1336. [Google Scholar] [CrossRef] [PubMed]
  24. Fox, T.R.; Allen, H.L.; Albaugh, T.J.; Rubilar, R.; Carlson, C.A. Forest fertilization in southern pine plantations. Better Crops. 2006, 90, 12–15. [Google Scholar]
  25. Fox, T.R.; Comerford, N.B.; Mcfee, W.W. Kinetics of phosphorus release from Spodosols: Effects of oxalate and formate. Soil Sci. Soc. Am. J. 1990, 54, 1441–1446. [Google Scholar] [CrossRef]
  26. Nyakatawa, E.Z.; Mays, D.A.; Tolbert, V.R.; Green, T.H.; Bingham, L. Runoff, sediment, nitrogen, and phosphorus losses from agricultural land converted to sweetgum and switchgrass bioenergy feedstock production in north Alabama. Biomass Bioenergy 2006, 30, 655–664. [Google Scholar] [CrossRef]
Figure 1. Layout of the switchgrass/pine forest (IC), reference mature thinned pine forest (MP), and pure switchgrass (SG) sites.
Water 12 01265 g001
Figure 2. Measured flow for pure switchgrass (SG), and total Kjedahl nitrogen (TKN), nitrate nitrogen (nitrate-N) and phosphate concentrations during three experimental periods of site preparation before switchgrass establishment, switchgrass growth without fertilizer applied, and switchgrass growth with fertilizer on watersheds with (IC) intercropping, (SG) pure switchgrass, and (MP) mature pine forest.
Water 12 01265 g002
Figure 3. Comparison of distribution of measured mean nitrogen concentrations using Box-Whisker plots for experimental periods for (A,C, and E) IC and (B,D, and F) SG sites. The middle horizontal bar in the box represents the median value. The upper and lower edges of the box represent the 75% and 25% percentiles, respectively. The upper and lower ends of the whiskers represent the maximum and minimum values, respectively.
Water 12 01265 g003
Table 1. Tests for significance of paired multiple means for measured N and P concentrations between watersheds for the post-fertilization (post-fert) period and within sites for each experimental period using Tukey’s test.
SiteTKNNH4-NNO3-NPO4-P
Mean (mg L−1)
IC0.490.060.050.04
SG0.700.080.160.04
MP0.560.090.330.03
Between watershedsNH4-NNO3-NTKNPO4-P
Post-fert (mg L−1)
IC vs. MPSSNSNS
IC vs. SGNSSSNS
SG vs. MPNSSNSNS
IC, intercropped watershed; SG, pure switchgrass watershed; MP, mature thinned pine forest; S, significant difference (α = 0.05); NS, not significant.
Table 2. Total outflow, loads and flow-weighted concentrations of N and P during post-fertilization periods 1(post-fert 1) and 2 (post-fert 2).
Sites Sites
PeriodVariableICSGMPICSGMP
Outflow (mm)Outflow (mm)
Post-fertFlow1614.5193114421614.519311442
Post-fert 1Flow640.5856689640.5856689
Post-fert 2Flow974.01075753974.01075753
Loads (kg ha−1)Concentration (mg L−1)
Post-fertNH4-N0.791.831.550.0490.0950.118
Post-fert 1NH4-N0.480.820.750.0740.0960.134
Post-fert 2NH4-N0.311.010.800.0320.0930.106
Post-fertNO3-N0.651.592.150.0400.0820.164
Post-fert 1NO3-N0.230.401.540.0360.0470.276
Post-fert 2NO3-N0.421.190.610.0430.1110.080
Post-fertTKN8.5911.155.690.5320.3770.434
Post-fert 1TKN2.864.932.880.4470.5760.516
Post-fert 2TKN5.736.222.810.5880.5780.373
Post-fertPO4-P0.720.910.540.0440.0470.041
Post-fert 1PO4-P0.150.360.120.0240.0430.021
Post-fert 2PO4-P0.560.550.430.0580.0510.057
Site prep, site preparation; Pre-fert, switchgrass growth without fertilizer; Post-fert, switchgrass growth with fertilizer applied; IC, intercropped site; SG, pure switchgrass site; MP, mature thinned pine forest.
Table 3. Nutrient concentrations for study watersheds during site preparation, pre-fertilization growth, and post-fertilization periods.
PeriodSiteTKNNH4-NNO3-NPO4-P
mg L−1
Site preparationIC0.480.040.50.08
Pre-fertilizationIC0.35 0.06 0.01 0.07
Post-fertilizationIC0.490.060.050.04
Site preparationSG0.69 0.02 0.150.07
Pre-fertilizationSG0.33 0.040.080.06
Post-fertilizationSG0.700.080.160.04
Site preparationMP0.43 0.02 0.060.09
Pre-fertilizationMP0.24 0.040.010.07
Post-fertilizationMP0.560.090.330.03
Between Experimental PeriodsSiteTKNNH4-NNO3-NPO4-P
Significance
Post-fert vs. Site prepICNSSSS
Post-fert vs. Pre-fert ICNSNSSS
Post-fert vs. Site prep SGNSSNSS
Post-fert vs. Pre-fert SGSSSS
Post-fert vs. Pre-fertMPSSSS
MP pre-fert (11/2009 to 5/2014) and post-fert only; IC and SG site prep (11/2009 to 03/2012), pre-fert (04/2012 to 05/2014), and post-fert (06/2014 to 06/2016). Site prep, site preparation; Pre-fert, switchgrass growth without fertilizer; Post-fert, switchgrass growth with fertilizer applied (June 2014 to June 2016); IC, intercropped site; SG, pure switchgrass site; MP, mature thinned pine forest; S, significant difference (α = 0.05); NS, not significant.
Table 4. Nutrient loads per unit area for study watersheds during site preparation, switchgrass growth, and fertilizer application periods.
YearSiteFlow (mm)TKNNH4-NNO3-NPO4-P
kg ha−1
Site preparationIC693.14.990.223.200.64
Pre-fertilizationIC736.03.290.490.300.74
Post-fertilizationIC1614.58.590.790.650.72
Site preparationSG488.84.560.251.480.34
Pre-fertilizationSG965.55.010.491.270.77
Post-fertilizationSG193111.151.831.590.91
Site preparationMP698.33.250.200.290.66
Pre-fertilizationMP700.92.210.580.290.61
Post-fertilizationMP14425.691.552.150.54
MP pre-fert (11/2009 to 5/2014) and post-fert only; IC and SG site prep (11/2009 to 03/2012), pre-fert (04/2012 to 05/2014), and post-fert (06/2014 to 06/2016). Site prep, site preparation; Pre-fert, switchgrass growth without fertilizer; Post-fert, switchgrass growth with fertilizer applied (June 2014 to June 2016); IC, intercropped site; SG, pure switchgrass site; MP, mature thinned pine forest; S, significant difference (α = 0.05); NS, not significant.

