Characterizing Nutrient Composition and Concentration in Tomato-, Basil-, and Lettuce-Based Aquaponic and Hydroponic Systems


Department of Horticulture and Landscape Architecture, Purdue University, West Lafayette, IN 47907-2010, USA
*
Author to whom correspondence should be addressed.
Water 2020, 12(5), 1259; https://doi.org/10.3390/w12051259
Submission received: 8 April 2020
/
Revised: 26 April 2020
/
Accepted: 27 April 2020
/
Published: 29 April 2020
(This article belongs to the Section Water, Agriculture and Aquaculture)
Abstract
:Aquaponic nutrient studies often use various types of water containing high levels of mineral nutrients for water supply, making it difficult to accurately determine deficient nutrients limiting crop yield and quality across the systems. To avoid interference with background nutrients, we used reverse osmosis water in this study. The objectives were to identify critical nutrients that affect the yield and quality of cherry tomato-, basil-, and lettuce by characterizing nutrient composition and concentration in aquaponic systems in comparison to hydroponic systems. Daily release rate (mg L−1) of macronutrients derived from fish feed (41% protein, 1.1% phosphorus, 1% fish weight) was in decreasing order of SO4–S (16) > PO4–P (2.4) > NO3–N (1.0) > K (0.8) > Cl (0.5) > NH4–N (0.4) > Ca (0.2) > NO2–N (0.13) > Na (0.11) > Mg (0.02), in which daily inputs of Mg and Ca in aquaponics were found to be only 1–2% and 4–6%, respectively, of those in hydroponics. Subsequently, the average concentrations of all nutrients were significantly lower in aquaponics than in hydroponics during a 3-month production except for Cl, NH4–N, NO2–N, and Na. The concentration of Mg remained below 5 mg L−1 in all aquaponic systems, while the concentration of Ca rapidly decreased in tomato-based aquaponics, especially during fruiting. SPAD value (chlorophyll content) was associated with concentrations of leaf N, Mg, and/or Ca. Specifically, lower SPAD value was correlated with lower leaf Mg and Ca for tomato and lower leaf Mg for basil but neither Mg nor Ca for lettuce. The aquaponic solution contained nearly six-times higher Na than the hydroponic solution, resulting in three-times higher Na concentration in the edible portion of the crops. Compared to a lettuce-based aquaponic system, tomato- and basil-based systems retained more desirable water quality parameters (i.e., stable pH, lower temperature), had lower electrical conductivity (EC) via greater biomass production and, therefore, more efficient nutrient removal, and had lower feed conversion rate and higher fish biomass increment. Regardless of crop species, vegetative shoot biomass was significantly reduced in aquaponics than in hydroponics. However, the marketable yield of tomatoes was similar between aquaponics and hydroponics, while those of basil and lettuce were reduced in aquaponics by 56% and 67%, respectively, in comparison to hydroponics. Our results highlighted potential solutions to design proper nutrient management practices essential for the development of successful aquaponic production systems. Considering that ingested fish feed does not provide sufficient levels of Mg and/or Ca for crop production, it is suggested to supplement Mg before crop transplanting and Ca before fruiting of fruity crops to improve crop growth and quality in aquaponic systems, especially when high-quality water is used for water supply.
1. Introduction
Aquaponics is an integrated system that combines aquaculture and hydroponics, in which water from the fish tanks enriched with mineral nutrients is used to produce plant crops. Disposal of a considerable amount of nutrient-rich wastewater is a significant problem in fish cultivation, as it is associated with surface and groundwater pollution [1]. Aquaponics not only eliminates wastewater discharge issues but also enables spent water and nutrients to recirculate in the system because the hydroponic component in an aquaponic system performs as a biofilter and effectively controls the accumulation of waste nutrients from the fish culture [2]. As such, fish and plant crop production in a recirculating aquaponic system can achieve a high degree of efficiency of water use [3,4] while allowing the production of additional saleable crops [2]. Aquaponics has the great potential to contribute to both global and urban sustainable food production and to reduce environmental impacts associated with agricultural production. However, commercial aquaponics is a nascent industry, and its crop production practices have yet to be established to reach the levels achieved in the hydroponic industry.
Chemical fertilizers commonly used in hydroponics either require intensive energy inputs for synthesis (i.e., nitrogen fertilizer), are derived from nonrenewable resources (i.e., phosphorus), and/or generate a large carbon footprint for transport [5]. Recirculating aquaponic systems are known to save not only the use of chemical fertilizers but also up to 98% water for crop production compared to that for field production [6,7]. Hydroponic nutrient solutions are formulated to contain excess nutrient concentrations in inorganic forms, making them readily and abundantly available for plant growth [8], and this is considered important in intensive hydroponic systems for high production yield. Hydroponic solutions are regularly adjusted to a desired electrical conductivity (EC) suggested for a particular crop. While this does not guarantee the presence of individual nutrient elements, it is a simple, commonly used method to ensure total soluble salts in the nutrient solution.
In aquaponics, the nutrient composition of fish feed has a major influence on the nutrient composition and concentration in aquaponic solution, directly affecting water chemistry [2] and plant growth [4,9]. While applying fish feed at 1% of body weight per day for fish of more than 100 g body mass is commonly recommended [10], the application rate and method may need to be adjusted in recirculating aquaponics to maintain water quality for fish health and wellbeing [4]. Unfortunately, most aquaponic nutrient studies used various types of water containing high levels of mineral nutrients, making it difficult to properly assess the deficient nutrients in aquaponic systems. In this situation, nutrient profiles in aquaponics are not only derived from the fish feed but also contributed by background nutrients contained in the water, which can interfere with the results and data interpretations and make it impossible to generalize findings across aquaponic systems. The incomplete information might have provided false nutrient guidelines without directing “the deficient nutrients” specific to the system or encouraged to apply excess nutrients to the aquaponic solution, making the systems less sustainable.
Further, the results on crop growth and yield in aquaponic systems are found to be inconsistent among aquaponic studies ranging from lower to higher than those in hydroponics. While many different factors can influence the results, the use of various water sources and resulting nutrient profiles, as well as different crop species, can be also considered some of the factors affecting such variations. For example, basil in aquaponics produced lower yield compared to hydroponics and developed leaf chlorosis, which was speculated due to lower Fe, Mn, and K concentrations in aquaponic solution (tap water was used) [11]. Marketable yields of leafy vegetables (i.e., Chinese cabbage, mizuna, Swiss chard, lettuce, and Pac Choi) and herbs (i.e., basil, chia) were lower or tended to be lower in aquaponics than those in hydroponics and developed leaf yellowing (reverse osmosis (RO) water was used) [4]. Similarly, yields of leafy vegetables (i.e., basil and kale) and fruity vegetables (i.e., tomato and pepper) were lower in a simulated aquaponic solution (low EC and high pH) than in hydroponics (well water was used) [12]. On the contrary, the growth and yield of lettuce grown in aquaponics were higher than those grown in hydroponics (tap water was used) [13]. Savidov et al. (2007) [14] claimed that the yield of aquaponic tomato and mini-cucumber exceeded the reported yield of commercial hydroponic crops; however, actual yield comparisons were not made between the systems. Meanwhile, the yield was similar between aquaponics and hydroponics in lettuce [9,15], cucumber, tomato, and eggplant [16,17,18].
Currently, information on aquaponic nutrient management is extremely limited. Based on the ground that K and Fe are deficient in fish feed [19,20,21], these are considered key nutrients to be supplemented to aquaponic solution as potassium hydroxide and iron chelates or as a foliar spray. Phosphorus (P) is also reported to be deficient in aquaponics due to the precipitation with Ca [22,23]. It is critical to investigate the nexus among nutrients directly derived from the ingested fish feed, aquaponic solution, and plant tissues to characterize nutrient profiles in aquaponic systems. This will aid in designing proper nutrient management practices to improve plant and fish yield and leading to the development of successful aquaponic production systems.
The objectives of our study were to characterize nutrient composition and accumulation in recirculating water and plant parts of tomato, basil, and lettuce grown in aquaponic systems and to compare their growth and yield with those in hydroponic systems. We used RO water for water supply to avoid interference with nutrients from fish feed and determined daily nutrient release rates from fish feed and dynamic changes of nutrient composition throughout the production cycle. This research would provide critical information on nutrient availability in aquaponic systems and suggest potential solutions to design proper nutrient management practices.
2. Materials and Methods
2.1. Experimental Setup and Operation
Six experimental units were operated in the greenhouse in West Lafayette, IN (lat. 40° N, long. 86° W).
Each aquaponic unit was equipped with a fish tank (350 L), a sediment tank (20 L), two-stage biofilter (up-flow and down-flow; total volume = 40 L) [4,24], and a deep-water hydroponic-culture unit (350 L; 1 m2) (Figure 1A). The aquaponic systems were filled with reverse osmosis (RO) water, and its nutrient composition and concentration are shown in Table 1. Aquaculture wastewater was added to each system to raise the initial electrical conductivity (EC) and establish a microbial community, including nitrifying bacteria. Nile tilapia (Oreochromis niloticus L.) fish were obtained from the Animal Sciences Research and Education Center at Purdue University, which had been cultivated in a conventional aquaculture system for 4-months. At the time of receipt, fish fresh weight was measured and evenly distributed to three different fish tanks and acclimatized for over a month. The fish stocking density was adjusted to 20 kg m−3 each (average fish weight of 300 g) before the commencement of the study.
The pH of the aquaponic systems was maintained at around 7 using a combination of base solutions (1N KOH, 0.05 N Ca(OH)2, and 1 N NaOH). During a 3-month production period, a complete diet (41% protein, 1.1% phosphorus) with 4.8-mm floating pellets was used (Table 2). Fish were fed daily at 9:00 am with fish feed (AquaMax Sport Fish 500, Purina Mills, St. Louis, MO, USA), averaging at 1% of body weight.
A peristaltic pump (Masterflex, Cole-Parmer, Vernon Hills, IL, USA) was used to recirculate nutrient solutions within a system unit. The total water volume in an aquaponic and hydroponic unit was 700 L with a flow rate of 138 L h−1, giving a water retention time of 5 h in a fish tank/nutrient-solution reservoir and the floating system unit [4,24]. Water in the clarifier captured the majority of suspended solids from the fish tank. After passing through the clarifier, the aquaculture effluent or nutrient solution flowed into the biofilter filled with biomedia (Kaldnes K1 Media, Aquatic Eco-System, Apopka, FL, USA) and then the hydroponic unit. Plants were held up by a foam board, which was set on the top edges of the hydroponic unit. An air pump was used to provide and maintain dissolved oxygen (DO) concentrations at full saturation using three air diffusers. The fish tanks and nutrient-solution reservoirs were covered with high-density polyethylene (HDPE) board with an opening to permit light to the tank during the daytime. Nutrients dissolved in aquaponics or hydroponics were absorbed by plants in the hydroponic unit, and reclaimed water was then recirculated into the fish tank/nutrient reservoir. The water was recirculated within each unit, and no water was discharged over the experimental period. RO water was added periodically to replenish evapotranspiration losses. Water temperature in aquaponic systems was maintained within the target range (26–28 °C) for tropical tilapia culture using an aquarium thermostat heater (Eheim Jager TruTemp, Eheim GmbH & Co, Deizisau, Germany).
Similarly, each hydroponic system was equipped with a nutrient reservoir (350 L), a clarifier (20 L), two biofilter tanks (20 L each), and a deep-water hydroponic-culture unit (350 L; 1 m2) (Figure 1B). The basic configuration for hydroponics was the same as for aquaponics. In each hydroponic-culture unit, the nutrient-solution reservoir and each hydroponic-culture unit were filled with RO water blended with a nutrient stock solution at 1:100 dilution rate (Table 2), which was used as initial and follow-up daily replenishment for fruity vegetables (CropKing, Lodi, OH, USA) and leafy/herb vegetables (CropKing, Lodi, OH, USA) (Table 1). The EC was maintained at 2 dS m−1 by adding and replenishing nutrient solution daily. The pH of the hydroponic solution was adjusted to approximately 6.
The photoperiod was 14-h (8:00 am to 10:00 pm), consisting of natural daylight with supplemental lighting using high-pressure sodium (HPS) lamps (600-W, P.L. Light Systems Inc., Beamsville, ON, Canada). A supplemental photosynthetic photon flux (PPF) of the greenhouse was measured using a quantum sensor (LI-250A light meter; LI-COR Biosciences, Lincoln, NE, USA), and photosynthetically active radiation in the greenhouse was averaged at 168 µmol m−2 s−1. Day (8:00 am to 10:00 pm) and night (10:00 am to 8:00 am) temperatures were set at 24 °C and 18 °C, respectively, with an hour transition between two temperature regimes. Depending on ambient temperature, the greenhouse was cooled as needed using a pad-and-fan evaporative-cooling system, heated using radiant hot-water-pipe heating, and retractable shade curtains regulated by an environmental control system (Maximizer Precision 10, Priva Computers Inc., Vineland Station, ON, Canada). Environmental data for greenhouse ambient daily light integral (DLI), ambient temperature, and vapor pressure deficit (VPD) were averaged per day and presented in Figure S1.
2.2. Plant and Fish Materials
In this study, cherry tomato (Lycopersicon esculentum ‘Washington Cherry’), basil (Ocimum basilicum ‘Genovese’), and lettuce (Lactuca sativa ‘Cherokee’) were selected for their popularity in aquaponics and hydroponic production systems and their differences in growth and harvest characteristics. For example, tomato plants were grown to maturity, and only fruits were removed, leaving intact roots and shoots in the system, which allowed continuous removal of nutrients from the system. Basil plants were cut back at maturity, and only the top portion of vegetative shoots was harvested on a regular basis, allowing the shoots to grow back and roots to continue to grow. Meanwhile, lettuce plants were grown for approximately 30-d, and mature plants were completely removed, and new lettuce seedlings were transplanted. Seeds were purchased from a commercial source (Johnny’s Selected Seeds, Winslow, ME, USA) and sown in Agrifoam soilless plugs (SteadyGROWpro, Syndicate Sales, Kokomo, IN, USA) with few days interval to ensure uniform seedling size at the time of transplanting. Seeds were initially imbibed with tap water, followed by gradually increasing to a half-strength fertilizer solution once germinated and full-strength fertilizer after seedlings develop true leaves [25]. The fertilizer was irrigated as necessary with a combination of two water-soluble fertilizers (3:1 mixture of 15N–2.2P–12.5K Cal-Mag Special and 21N–2.2P–16.6K Multi-Purpose fertilizers, respectively; Everris NA, Dublin, OH, USA). The fertilizer consisted of (mg L−1): 150 nitrogen (N), 20 phosphorous (P), 122 potassium (K), 38 calcium (Ca), 15 magnesium (Mg), 0.8 iron (Fe), 0.4 manganese (Mn) and zinc (Zn), 0.2 copper (Cu) and boron (B), and 0.1 molybdenum (Mo). Nitrate form was 76% of nitrogen provided. After the third true leaf of seedlings emerged, uniform healthy seedlings were chosen and transplanted into mesh pots (diameter: 7.6 cm, height: 6.4 cm), each containing 85 g clay pebbles, then transferred to a hydroponic unit of aquaponic or hydroponic systems. There were 8 plants per unit for cherry tomato and 24 plants per unit for basil and lettuce. All suckers developing between the axis of the leaf and stem of a tomato plant were removed weekly. Self-pollinations were manually performed daily by agitating flowers with a battery-operated pollinating tool (VBP-01 Garden Pollinator, VegiBee, Maryland Heights, MO, USA).
2.3. Water Parameter Measurements
Water quality parameters were monitored in each aquaponic and hydroponic unit, which included dissolved oxygen (DO), temperature, pH, and electrical conductivity (EC) of the fish tank (or nutrient reservoir in the hydroponic system), and the hydroponic-culture unit was measured daily at 9:00 am before feeding using the HQ40d Portable Water Quality Lab Package (HACH Corp., Loveland, CO, USA).
Water samples were collected from the fish tank (or nutrient reservoir) and hydroponic-culture unit once every 4 days before feeding to monitor total ammonia nitrogen (TAN), nitrite (NO2–N), nitrate (NO3–N), and phosphate (PO4–P) concentrations and were analyzed immediately using HACH reaction kits (Loveland, CO, USA), namely, Ammonia Reagent Powder Pillows, Nitrite Reagent Powder Pillows, Nitrate Reagent Powder Pillows, and Phosphate Reagent Powder Pillows, respectively. This activity was performed to ensure fish health and wellbeing, maintaining water quality. The same water samples were used to analyze macronutrients (i.e., NO3–N, NO2–N, NH4–N, PO4–P, K Ca, Mg, SO4–S, Na, Cl) by ion chromatography (Dionex ICS–5000, Thermo scientific, Waltham, MA, USA), as described below (2.6).
2.4. Daily Nutrient Release Measurements
In the absence of plants, the daily nutrient release rate of fish was examined by placing tilapia fish (stocking density: 20 kg m−3) in a 350 L tank using the recirculating aquaponic systems (Figure 1A). The water condition was maintained the same as the operating conditions, as described above. Fish were fed with the same commercial feed once a day (9:00 am) at 1% of body weight. Water samples were collected from the fish tank before and 24 h after feeding, which allowed fish to digest fish feed and excrete waste into the aquatic phase and the wastewater to be processed through the biofilter. The nutrient profiles in water samples were analyzed using ion chromatography (IC), and the differences in nutrient concentration before and 24 h after feeding were calculated as daily nutrient release rate derived from the fish feed.
2.5. Plant/Fish Growth and Biomass Measurements
The SPAD (soil plant analysis development) value, an index of chlorophyll content per unit leaf area, was measured on three youngest fully expanded leaves using a portable chlorophyll meter (SPAD-502, Minolta Corporation, Ltd., Osaka, Japan) at 90 days after transplanting for tomato and basil and 30 days after transplanting for lettuce. Five readings per leaf were taken at the central point of a leaf between the midrib and the leaf margin for lettuce and basil and the terminal leaflet for tomato, and the values were averaged. At harvest, plant height was measured from the base of the shoot to the terminal growing point. The number of leaves was determined, and the total number of leaves per plant was calculated as the sum of the number of leaves removed during production and at harvest. The fresh mass of leaves was determined immediately at each removal and harvest. Stem fresh mass was also measured. The fresh mass of shoot parts was calculated by summing the fresh mass of the individual part. Plants were oven-dried (over 72 h at 70 °C) and weighed for dry mass.
Days from transplanting to first open flower and fruit harvest were recorded during production. The number of flowers and fruits were counted again at harvest. Fruits were harvested every two days when the fruit was at maturation stage 6 based on USDA (United State Department of Agriculture) Visual Aid TM-L-1 tomato-color standards. The fresh mass of fruits was determined immediately upon harvest, and the total number and weight of fruits per plant was the sum of the number and weight of fruits produced at each harvest. Fruits’ dry mass was obtained by placing them in a drying oven for 1 h at 100 °C, followed by at 65 °C until the fruits were completely dried. All dried plant samples were filtered through a 10-mesh sieve after grinding with a Wiley Mini Mill (Thomas Scientific, Swedesboro, NJ, USA) and kept in plastic vials for nutrient analysis.
Fish weight was measured at the beginning, weekly, and at the end of the experiment by carefully removing an individual fish from the fish tank and transferring them into a bucket filled with water. This procedure was repeated until the weight of at least 50% fish in a fish tank was measured. The average fish weight was used to determine the initial amount of feed and to make adjustments on the feed amount weekly. Feed conversion ratio (FCR) was calculated by the following formula: FCR = total feeding amount (g)/fish biomass increment (g).
2.6. Anion and Cation Measurements
For anion and cation nutrient analysis of water samples, frozen water samples, which were kept in a −20 °C freezer, were thawed at room temperature and centrifuged immediately at 12,000 rpm for 10 min, and then liquid supernatants were collected and subjected for cation and anion nutrients measurement. For cation nutrient analysis of dried plant samples [26], each sample was weighed to the nearest 0.100 g and placed in a 20 mL glass vial with three drops of 5% H2SO4 in ethanol, then ashed in a muffle furnace at 550 °C for 3 h. After the process, an 8 mL aliquot of 5 mM HCl was added, vortexed for 10 seconds, heated near boiling (90 °C), then vortexed again. Plant samples were centrifuged at 12,000 rpm for 10 min, and then liquid supernatants were collected. For anion nutrient analysis of dried ground plant samples [27], each sample was weighed to the nearest 0.1 g and placed in a 50-mL centrifuge tube with 0.1 g decolorizing carbon and 13.3 mL Millipore water. Then, samples were vortexed for 10 seconds and shaken for 30 min. The samples were centrifuged at 12,000 rpm for 10 min, and liquid supernatants were collected. After being diluted with Millipore water to a desirable range, each sample was prepared into an autosampler vial for injection.
Determination and quantification of the nutrient compositions of processed water and plant samples were performed using the ion chromatography system (Thermo Scientific Dionex ICS–5000, Waltham, MA, USA) equipped with capillary pumps, electrolytic eluent generation modules, injection valves, capillary electrochemical suppressors, cation column (IonPac CS12A) and anion column (IonPac AS18 column), and conductivity detectors to determine the concentration of cations (including ammonium, magnesium, calcium, potassium, sodium) and anions (including nitrite, nitrate, phosphate, sulfate, chloride). Flow rates were set at 1 mL min−1, and the column temperature was maintained at 20 °C in an isocratic mode for cations and gradient mode for anions.
The ion chromatography (IC) was coupled to an AS–AP autosampler (Thermo Scientific, Waltham, MA, USA), allowing for continuous sample loading and injection in sequence, including standards and samples. Conditions for IC anion analyses were as follows: eluent (23 mM KOH) flow rate was set at 1 mL min−1, and suppressor current was set at 57 mA and raised to 99 mA during gradient runs of the eluent (40 mM KOH), which was conducted for optimal phosphate analysis. A gradient elution method was employed in which eluent concentration was increased from 23 to 40 mM at 12 min, remained at 40 mM for 3 min, and then decreased to 23 mM for 4 min. Conditions for IC cation analyses were as follows: eluent (20 mM methane sulfonic acid (MSA)) flow rate was set at 1 mL min−1 for isocratic runs, and the suppressor current was set at 59 mA. Chromeleon data management software (version 7.1) was used for data processing.
2.7. Total N and P Measurements
For total N analysis of each plant sample, 30 mg ground sample was measured and transferred into an empty sample tin using a clean small sampling spatula, and then the tin was carefully wrapped up into a ball. The total N contents of the sample were then measured by using the C/N analyzer (FlashEA 1112, Thermo Fisher Scientific, Waltham, MA, USA). When preparing plant samples for total P analysis, each sample was weighed at 0.07 g aliquot, and the aliquot weight was recorded before transferred into a 20 mL glass vial. Then, the samples were ashed in a muffle furnace at 495 °C for 8 h. The total P concentration of each sample was determined using the P-molybdate blue color reaction [28] and analyzed by Epoch microplate spectrophotometer (BioTek Instruments, Inc., Winooski, VT, USA).
2.8. Experimental Design and Data Analysis
Each experiment was conducted for 3 months at three different time blocks: spring (December through February), summer (April through June), and fall (July through September).
Each time, the block consisted of three aquaponic systems (Figure 1A) and three hydroponic systems (Figure 1B). The experimental design was a split-plot randomized complete block design (RCBD) with the production system and plant species as the main plots: tomato-based aquaponics, basil-based aquaponics, lettuce-based aquaponics, tomato-based hydroponics, basil-based hydroponics, and lettuce-based hydroponics, and with research trial as subplots. The experiment was repeated in three-time blocks, and data were pooled across time blocks. Environmental data were presented only for time block 1 (Figure S1).
Data were subjected to analysis of variance (ANOVA) using JMP® for Windows, Version 12.0 (SAS Institute Inc., Cary, NC, USA). Mean separation within each measured parameter was performed by Tukey’s honestly significant difference (HSD) test at p ≤ 0.05. Interactions between system and crop species were tested using two-way ANOVA. Regression analysis was carried out to look for trends in response to days after transplanting. A student’s t-test was conducted to determine significant differences in nutrient concentrations of each part of plants grown in aquaponics and hydroponics. The correlation coefficient was used to describe the effects of leaf total N, Ca, and Mg concentrations on SPAD value. The relationship between SPAD value and other variables (total N, Ca, and Mg) and their interaction terms were analyzed with Pearson’s correlation.
3. Results
3.1. Daily Nutrient Input; Water Physical and Chemical Properties
The daily nutrient release rate from the fish feed, as expressed as EC, was considerably lower in aquaponics than the daily replenishment rate in hydroponics (Table 1). Daily release rate (mg L−1) of macronutrients derived from fish feed was in decreasing order of SO4–S (16) > PO4–P (2.4) > NO3–N (1.0) > K (0.8) > Cl (0.5) > NH4–N (0.4) > Ca (0.2) > NO2–N (0.13) > Na (0.11) > Mg (0.02). As compared to hydroponic systems, concentrations of individual nutrients daily added to the aquaponic systems were considerably low for NO3–N (11%), K (10%), Ca (4%), and Mg (1%); nearly half for PO4–P (49%); but high for Na and Cl, especially in tomato-based aquaponics. Background nutrients contained in RO water were negligible, but Ca, Mg, Na, and Cl included in RO water exceeded those in the ingested fish feed (Table 1).
Water parameters, such as dissolved oxygen (DO), water temperature, pH, and EC, were significantly affected by production system (p < 0.001) and crop species (p < 0.05 for DO, pH, and EC; p < 0.001 for water temperature) (Table 3). All aforementioned parameters were within optimal ranges for a raft aquaponic system producing tilapia [6,29,30]. There were significant interactions between system and crop species in water temperature, pH, and EC, but not in DO. Regardless of the production system, DO and temperature in the fish tank (or nutrient reservoir) remained relatively constant throughout the study period (data not shown). The average DO was significantly (p < 0.0001) lower, but the average water temperature and pH were significantly higher in aquaponics compared to hydroponics due to the setup of the systems (Table 3). Crop species varying in harvest part and method significantly affected EC levels of aquaponic solution over time (Figure 2). The average EC values in tomato-, basil-, and lettuce-based aquaponics were 3.3-, 2.1-, and 1.9-times lower than those in hydroponics, respectively (Table 3). EC levels were significantly lower in aquaponics than in hydroponics during the first month when the systems were relatively new but gradually increased over a 3-month production period (Figure 2). Particularly, EC of lettuce-based aquaponics linearly increased and reached nearly to the level of hydroponics after being operated for 3 months, while those of tomato- and basil-based aquaponics remained relatively constant, averaging 0.63 and 1.23 dS m−1, respectively, during the third month.
3.2. Growth and Yield of Plant and Fish Crops
Compared to hydroponics, aquaponics reduced plant height and leaf length in tomato, reduced the number of leaves in basil but did not affect growth parameters in lettuce (Table 4). Likewise, aquaponics reduced SPAD value in tomato and basil leaves but not in lettuce.
Crop yield, including total fresh and dry mass, was highly influenced by the production system (p < 0.0001) and crop species (p < 0.0001) (Table 5). Regardless of crop species, fresh and dry mass of vegetative shoots were markedly reduced in aquaponics compared to hydroponics.
Tomato plants grown in aquaponics had a reduced time for flowering and harvest by 2 days and for mean peak flowering by 10 days compared to those grown in hydroponics (Table 4; Figure 3). The flowering of hydroponic tomatoes occurred over a wide range of days compared to that of aquaponic tomatoes (Figure 3). The fresh weight of individual fruit and total fruit yield was not significantly different between aquaponics and hydroponics (Table 4 and Table 5). Meanwhile, marketable yields of basil and lettuce (i.e., shoot fresh mass) grown in aquaponics were reduced by 44% and 33%, respectively, as compared to those grown in hydroponics. The yield of lettuce was significantly increased with harvest time (Table 6), which coincided with the maturity of the system. Lettuce yield in aquaponics was 43% of that in hydroponics at the first harvest but increased to 76% at the third harvest. The root-to-shoot ratio was significantly higher in basil and lettuce grown in aquaponics, indicating a proportional increase of roots in these crops (Table 5).
No fish mortality was observed during the study. Fish yields were affected by different crop species in aquaponic systems (Table 3). Although the same amount of fish feed was applied (total fish feed applied: 3680 g) during a 3-month production period, tomato-and basil-based aquaponic systems had lower feed conversion ratio (FCR) and higher total biomass increment rate than those in the lettuce-based system (Table 3). Cumulative water consumption was significantly (p < 0.05) higher in aquaponics compared to hydroponics; however, it was not affected by crop species.
3.3. Nutrient Composition and Concentration in Recirculating Water
Aquaponics had significantly (p < 0.0001) lower average concentrations of NO3–N, PO4–P, K, Ca, Mg, and SO4–S in recirculating water, but significantly (p < 0.0001) higher concentrations of NO2–N, NH4–N, Na, and Cl compared to hydroponics (Table 7). Especially, the average concentrations of Ca and Mg in aquaponics were, respectively, 8- and 25-times lower than those in hydroponics. Aquaponic solution contained the following nutrients in decreasing order: SO4–S (242 mg L−1) > NO3–N (110 mg L−1) > K (75 mg L−1) > Na (70 mg L−1) > PO4–P (30 mg L−1) > Ca (18 mg L−1) > Cl (4.3 mg L−1) > Mg (1.6 mg L−1) (Table 7). Meanwhile, the hydroponic solution contained the following nutrients in descending order: SO4–S (677 mg L−1) > K (333 mg L−1) > NO3–N (200 mg L−1) > Ca (146 mg L−1) > PO4–P (119 mg L−1) > Mg (40 mg L−1) > Na (11 mg L−1).
There were interactions between the production system and crop species in NO3–N, PO4–P, Ca, Mg, and Cl levels (Table 7). Except for PO4–P, the levels of these nutrients in the aquatic phase of the system were significantly affected by crop type (p < 0.001). Especially, the tomato-based aquaponic system had significantly lower NO3–N, Ca, and Mg than did basil- and lettuce-based aquaponic systems.
The concentrations of mineral nutrients in both systems showed an increasing or decreasing trend during the production period depending on the system and nutrient (Figure 4). In general, the concentrations of nutrients gradually increased over time in lettuce-based aquaponics, while it increased to a lesser degree or decreased in tomato-based aquaponics (Figure 4). For example, NO3–N concentrations in the lettuce-based aquaponics increased from 90 to 250 mg L−1 during a 3-month production, and even exceeded those in hydroponics during the third month (Figure 4A). Meanwhile, the concentrations of NO2–N and NH4–N maintained relatively high in aquaponics compared to hydroponics (Figure 4B,C), indicating active nitrification taking place in aquaponic systems. PO4–P concentrations averaged at 30 mg L−1 while showing increasing trends regardless of crop species (Figure 4D). The concentrations of all nutrients were highly maintained in hydroponics throughout the production period regardless of crop species, primarily due to the high initial nutrient concentrations used in the systems (Table 1; Figure 4).
3.4. Nutrient Composition and Concentration in Plant Tissues
Overall, nutrient concentrations in plant tissues were significantly (p < 0.0001) affected by the production system and crop species (Table 8). Crops grown in aquaponics accumulated lower levels of N, P, Ca, and/or Mg in plant tissues than those in hydroponics, but accumulated higher levels of Na and Cl. Meanwhile, there were no significant differences in K accumulation levels between the systems. Lettuce accumulated higher concentrations of N, P, K, Na, and Cl in mg g−1 on a dry matter basis in comparison to tomato plants. There were no differences in N, Ca, and Mg concentrations between aquaponic and hydroponic lettuce.
Nutrient accumulation patterns were varied among tomato, basil, and lettuce grown in aquaponic and hydroponic systems (Figure 5 and Figure 6). In general, most nutrients accumulated in the leaves, while P and S accumulated primarily in the roots and stems, respectively. Crops grown in aquaponic systems had lower concentrations of leaf N, Mg, and/or Ca compared to those in hydroponic systems (Figure 5 and Figure 6). Specifically, tomato plants had significantly lower leaf N, Mg, and Ca; basil had lower N and Mg; lettuce had lower N as compared to their counterparts. SPAD value was positively correlated with N, Ca, and Mg (r = 0.82, 0.78, and 0.65, respectively) for tomato; N and Mg (r = 0.80 and 0.48, respectively) for basil; N (r = 0.59) for lettuce (Table 9). Na accumulation levels varied greatly by crop species. Aquaponic crops accumulated over 2-times higher Na concentration than those in hydroponics in the edible parts (Figure 6).
4. Discussion
4.1. Daily Nutrient Input; Water Physical and Chemical Properties
Water quality parameters directly impact fish health and wellbeing and plant growth in aquaponics and, therefore, are the primary considerations for the improvement of aquaponic production and yield. The deterioration of water quality parameters affects fish physiology, growth rate, and feed efficiency, leading to pathological changes and even mortality under extreme conditions [31]. Dissolved oxygen (DO) concentration in aquaponics decreased by 24% compared to hydroponics regardless of crop species, which was considered due to higher oxygen demands of additional organisms (i.e., fish and microbes) and higher water temperature in aquaponics. DO in aquaponics averaged at 7.1 mg L−1, which was well above 5 mg L−1 suggested for aquaculture [32] and the tolerance limit of 6 mg L−1 suggested by Graber and Junge (2009). In fact, the DO levels in our aquaponic systems were nearly 90% saturated at the water temperature of 26 to 28 °C [33,34], which were suitable for plant and fish growth and nitrification process as evidenced by the rapid conversion of NH4–N to NO3–N (Figure 4A–C).
Water temperature was slightly higher in aquaponics than in hydroponics (Table 3) due to tropical tilapia fish culture, especially in the lettuce-based aquaponics as compared to tomato- and basil-based systems. Although the cause was not clear, less favorable water conditions in the lettuce-based aquaponic systems might have affected the biological capacity of the fish, affecting welfare conditions through complex interactions between water quality parameters [31]. This view could be supported by higher FCR and lower biomass increment in lettuce-based aquaponics compared to other aquaponic systems (Table 3), despite the fact that the same amount of fish feed was applied.
Optimal pH ranges are 6 to 9 for tilapia fish, 5.5 to 6 for plants, and 7 to 8 for nitrifying bacteria, and, therefore, pH 7 is considered an ideal compromise for aquaponics [20]. Although the average pH values did not show the daily differences in pH among aquaponic systems (Table 3), we found that a higher volume of base solution was used to adjust and maintain pH in lettuce-based aquaponics than in tomato- or basil-based systems (Table 3), resulting in a higher K accumulation in the aqueous phase of the lettuce-based system (Figure 4F). These results supported our contention that pH fluctuates more widely in lettuce-based aquaponics. Higher carbon dioxide (CO2) concentrations as a result of increased fish respiration can lower water pH more rapidly [35]. Fish respiration in the lettuce-based system might have been promoted by a less favorable water environment, which could further stress the fish and inhibit nitrifying bacterial activities in the biofilters [36], affecting fish yield, as observed in our study (Table 3).
Aquaponics not only had lower initial concentrations of nutrients but also had considerably lower daily nutrient release rates than did hydroponics (Table 1). Such differences in the nutrient environment, as well as other water chemical properties, could possibly influence seedling establishment after transplanting [4], subsequently affecting plant growth and development, as demonstrated in our study. Although daily nutrient release rate appeared to be a small contribution to nutrient profiles, it had considerable effects on increasing EC levels over time in all aquaponic systems, particularly in lettuce-based aquaponics (Figure 2). Considering that even the nutrients in RO water contributed to EC to some extent, it can be assured that using tap water or well water for aquaponic nutrient studies will lead to inaccuracy in determining nutrients in aquaponic systems.
Our results demonstrated that the EC in aquaponics was contributed by three sources: daily nutrient release from the fish feed, background nutrients contained in RO water, and base solution added for pH corrections. In fact, the volumes needed for pH correction were over 5-fold higher in aquaponics than in hydroponics due to the active nitrification in the systems. These practices promoted the accumulation of SO4–S > NO3–N > K > Na > PO4–P > Ca > Cl > Mg in decreasing order in aquaponic systems (Table 7). Notably, despite the lower daily nutrient inputs compared to hydroponics and continued nutrient uptake through biomass production, most nutrients accumulated in aquaponics except NO3–N, Mg, and/or Ca, of which accumulation pattern greatly differed among crops (Figure 4). It is clear that fish feed provided in this study was beyond the nutritional needs of fish and uptake rate of plants for most nutrients despite the fact that it followed the practices normally suggested for aquaponics [4,10,37]. Entire lettuce plants were harvested from the system at maturity, while the roots of tomato and basil were kept intact, actively removing nutrients. Such differences in harvest method and part also could influence nutrient accumulation in aquaponic systems, justifying the need for proper nutrient management practices for each crop species.
4.2. Growth and Yield of Plant and Fish Crops
In this study, we found that aquaponics reduced crop quality (leaf greenness) and/or yield in comparison to hydroponics regardless of crop growth form and harvest method. Although whole-plant fresh and dry mass of tomato plants significantly decreased in aquaponics, the mean peak flowering date for tomato plants in aquaponics was reduced by 10 days in comparison to hydroponics (Figure 3). It has been demonstrated that reduced biomass allocation to vegetative parts can promote early flowering in greenhouse hydroponic tomato [38]. Similarly, tomato and pepper grown in a simulated aquaponics have reduced vegetative growth compared to those grown in hydroponics [12]; however, its effect on flowering has not been reported. Mild nutrient or salinity stress in aquaponics may have promoted the transition from vegetative to reproductive growth of tomato plants, as demonstrated in soil-based systems [39]. Tomato variety examined in this study exhibited a determinate growth habit, and, therefore, the number of flowers decreased toward the end of production regardless of the system (Figure 3). We did not observe any difference in total fruit yield and individual fruit weight between aquaponic and hydroponic tomato plants during a 90-day evaluation. However, considering a narrower range of peak flowering dates and reduced leaf chlorophyll content of tomato plants in aquaponics, a longer-term evaluation may result in decreasing fruit yield in aquaponics toward the end of the production cycle. Even when indeterminate tomato varieties are grown in aquaponics, some yield reduction is expected due to the leaf yellowing issue unless the crops are supplemented with nutrients (i.e., Mg and Ca) to improve leaf greenness.
Similarly, fresh and dry mass production of basil and lettuce decreased or had a decreasing tendency in aquaponics compared to hydroponics. The EC level was likely to be one of the critical factors affecting yield because lettuce yield increased by 2-times with increasing average EC from 0.37 to 1.44 dS m−1 (Table 6; Figure 2). However, lettuce yield was consistently lower in aquaponics, even when the EC was nearly 70% of that in hydroponics in the third month, in which the average NO3–N level (222 mg L−1) in aquaponic solution was even higher than that in hydroponic solution (204 mg L−1). These results indicated that EC was not a single factor affecting crop yield in aquaponics, and its reduced crop yield was likely to be related to the combinational effects of water chemical properties, including nutrient compositions (i.e., lower NO3–N, Ca, Mg and higher NO2–N, NH4–N, Na), and physical properties, including water temperature. The water temperature in aquaponic systems was higher than those in hydroponics. Lettuce is a cool-season crop, of which growth can be affected by air or root zone temperature [40], and, therefore, the higher water temperatures in aquaponic systems may be one of the causes of the reduced plant growth.
Using novel approaches and careful examinations, we were able to demonstrate the key macronutrient elements (i.e., Mg and/or Ca) that are deficient in aquaponic solution and limit crop growth and yield in aquaponics. It has been reported that fish waste contains low levels of macronutrients, such as K, P, and S, and micronutrients, such as Fe and Mn for plant growth [11,23]. Studies have shown that foliar application with K, Fe, Mn, Zn, Mg, B increases fruit number and yield of tomato plants in decreasing order of effectiveness [21]; however, pH was not adjusted in their study and reported to be ranging from 7 to 7.7, possibly rendering micronutrients less available for plant uptake. Likewise, it has been reported that nutrient supplements, with either Fe or Fe plus macronutrients, have increased lettuce growth and yield [41], supporting the prevalent idea that Fe is one of the critical nutrients limiting crop production in aquaponics. However, it remained to be clarified if these nutrients were actually “the deficient nutrients” in aquaponics or compensated for the deficient nutrients. Nexus between the nutrient profile of aquaponic solution and plant tissues can properly address this issue, and this aspect has been further discussed in the following section.
4.3. Mg and/or Ca Deficiency in Aquaponics
Liebig’s Law of the Minimum states that yield is proportional to the amount of the most limiting nutrient. Macronutrients, i.e., N, P, K, Ca, Mg, S, and Cl, are required in relatively large quantities (>0.1% of dry mass) and essential for plants to complete their life cycle [39,42,43]. These mineral nutrients are taken up by plant roots in ionic forms: N as anionic nitrate (NO3–N) or cation ammonium (NH4–N), P and S as their oxyanions phosphate (PO4–P) and sulfate (SO4–S), and K, Ca, Mg, and Cl as free ions [42,43]. Thus, we postulated that some of these macronutrients are associated with limiting plant growth in aquaponics due to insufficient levels from the ingested fish feed.
Leaf chlorosis is indicative of reduced physiological functions and has been observed in vegetable and herb crops grown in aquaponics [4]. Leaf greenness was significantly correlated with leaf N concentration in tomato (r = 0.82, p < 0.001), basil (r = 0.80, p < 0.01), and lettuce (r = 0.59, p < 0.05) (Table 9), suggesting that aquaponics can negatively affect N status of crops and limit growth and yield. Further, we reported for the first time that leaf yellowing observed in aquaponic crops was associated with Mg and/or Ca deficiency. Although leaf yellowing has been reported in some aquaponic crops, Mg and Ca deficiency has not been explicitly addressed in any aquaponic studies so far. This may be due to the interference with background nutrients contained in water sources or major focus on K and Fe as deficient nutrients in aquaponics. In this study, we provided direct evidence that Mg and Ca were the key nutrient elements limiting crop growth and yield in aquaponic systems, and this was due to the low daily release rates from the fish feed, which comprised only 1.5% to 2.5% and 4% to 10%, respectively, of the daily replenishment rates of those in hydroponics (Table 1). Accordingly, tomato plants grown in aquaponics had significantly lower Mg and Ca concentrations compared to those in hydroponics (Table 8; Figure 6A,B), and the results from the correlation coefficients supported that leaf chlorosis of aquaponic tomato was related to the combinational effects of insufficient Mg (p < 0.05) and Ca (p < 0.01) (Table 9). Leaf yellowing of aquaponic basil was somewhat associated with a deficient level of Mg (p < 0.12). However, aquaponics lettuce developed neither Mg nor Ca deficiency in the leaves despite that aquaponic solution contained only 6% Mg and 13% Ca of hydroponic solution (Table 7). Although hydroponic lettuce contained similar Ca concentration as aquaponic lettuce in our study, we observed that it developed Ca deficiency symptom (a condition known as tip-burn) on the margin of inner leaves a few days before harvest, which was not observed in aquaponic lettuce. This might be due to the following reasons: massive outer leaf growth of hydroponic lettuce covering inner leaves interfering with transpiration and thus Ca uptake, outer leaves competing for Ca with inner leaves, and/or susceptible cultivar to tip-burn. The growth rate of hydroponic lettuce was higher than aquaponic lettuce, as demonstrated by significantly higher yield (Table 5), and, therefore, the imbalance between plant growth rate and nutrient uptake rate in hydroponics might also explain this physiological disorder [44]. Similar results were reported by Pantanella et al. (2012), who observed that aquaponic solution contained significantly lower Ca than did hydroponic solution, but aquaponic lettuce contained a higher concentration of Ca compared to hydroponic lettuce (RO water was used) [9]. Lettuce grown in aquaponics had lower Ca and Mg even when the aquaponic solution was supplemented with mineral salts (rainwater was used) [15]; however, the authors did not pay attention to the important aspects.
Our study demonstrated that leaf yellowing induced by Mg and/or Ca deficiency could be a significant problem in aquaponic crop production, especially when high-quality water, such as RO water, distilled water, and rainwater, is used for water supply. Even when groundwater is used, the levels of Ca and Mg contained in water could be varied by the region [45,46], and, therefore, water source should be taken into consideration for aquaponic nutrient management.
As the central atom of the chlorophyll molecule, the best-known function of Mg in plants is its association with the development of interveinal leaf chlorosis of the lower leaves under Mg deficiency stress [39]. Mg deficiency can be induced not only by a direct result of the lack of Mg but also by the presence of competing cations that prevent Mg uptake. It is well recognized that salinity disrupts mineral relations of plants by reducing nutrient availability, leading to Na-induced Mg, Ca, and/or K deficiencies and Ca-induced Mg deficiencies [47]. The interaction between Na and Ca/Mg may be one of the causes of the reduced shoot biomass of tomato, basil, and lettuce in aquaponics. Mg plays an important role in the partitioning of photosynthates between shoots and roots in plants [48], and this can somewhat explain a relatively higher root-to-shoot ratio of aquaponic crops compared to that of hydroponic crops.
The source of Na in the aquaponic solution was not clearly described in aquaponic studies but was considered either from the fish feed or pH correction solution [15,23]. Our results demonstrated that Na in aquaponic solution was originated from three different sources: fish feed, base solution for pH correction, and water used in the system. While the daily release rate of Na was 0.4% of fish feed applied, it accumulated rapidly in aquaponic solution during the second month (Table 1; Figure 4I). This was caused not only by NaOH for pH adjustment but also by background Na contained in RO water because more frequent replenishment and higher volume of water were required in aquaponics (Table 3). Such a high level of Na in aquaponic solution resulted in a three-fold higher Na concentration in the tissues of plants grown in aquaponics than those in hydroponics (Table 8). A high concentration of Na is commonly known to cause negative impacts on crop yield; however, this appeared to be in a concentration-dependent manner. For example, irrigation with a relatively low salt concentration (i.e., 5 mM; 115 mg L−1) did not reduce its growth and appearance of baby romaine lettuce [49], while irrigating with high Na concentration (i.e.,>100 mM; 2300 mg L−1) for 15 days significantly reduced the yield. Na concentration in our study increased to 110 mg L−1, as the aquaponic system reached maturity. This concentration did not cause any detrimental effects on crop growth, but Na might have played a role in affecting crop growth and yield in aquaponics through the interaction with Ca and Mg.
Fe deficiency, characterized by interveinal chlorosis of the upper leaves, has been reported in commercial aquaponics, and the application of chelated iron is commonly practiced to effectively remediate the issue. However, we did not observe Fe deficiency symptoms in any of the plants grown in our aquaponic systems. Although the reason for the discrepancy was not clear, there were two possible explanations for the lack of Fe deficiency in our aquaponic systems: (1) Fe deficiency in soil can occur at high Ca and carbonate concentrations and high pH, leading to the competition of Ca with Fe uptake by the root [39]. This combined condition typically occurs in many aquaponic systems due to the use of water sources containing high Ca, the addition of sodium bicarbonate (NaHCO3) for pH stability, and the pH adjustment to nearly 7 to maximize nitrification. The water environment in our systems was different from the typical aquaponic systems except for the pH; (2) Fe deficiency may be associated with the nutrient status of seedlings before transplanting. In the current study, the seedlings were provided with full-strength nutrients after true leaves were developed until being transferred to the aquaponic/hydroponic systems. It is speculated that Fe is provided in excess to the young plants, and this “luxury consumption” helps mask its deficiency in the aquaponic system [50]. While this aspect needs further investigation, it suggests the potential to overcome nutrient deficiency and improve plant growth in aquaponic systems.
Our results provided practical implications for crop production in a recirculating aquaponic system. For aquaponic systems where high-quality water is used for water supply, it was suggested that aquaponics should be supplemented with Mg before transplanting regardless of crop type. If long-term crops like tomato are grown in aquaponics, Ca be supplemented before fruiting to improve yield and quality.
4.4. N and P Accumulation in Aquaponics
It is well expected that dissolved nutrients accumulate over time in recirculating aquaponic systems due to daily nutrient and minimal water inputs. We observed greater NO3–N accumulation in lettuce-based aquaponics compared to tomato- and basil-based ones (Figure 4). The results indicated that the N transformation rate from NH3–N to NO3–N mediated by nitrifying bacteria outpaced the NO3–N removal rate of plants in our system and that harvest practice of lettuce encouraged NO3–N accumulation in aquaponic solution. In contrast, NO3–N gradually declined in a tomato-based system, indicating that the NO3–N uptake rate of tomato exceeded its release rate derived from fish feed. Tomato plants continued to actively uptake NO3–N from aquaponic solution to support the growth of developing fruits and vegetative parts. The aquaponic solution contained higher levels of toxic ions (NO2–N and NH4–N) than did hydroponics (Table 7), and such unique chemical properties might also contribute to reduced growth and biomass production of tomato, basil, and lettuce grown in aquaponics.
Lettuce is a well-known nitrate accumulating plant [51], and, in fact, we found that lettuce accumulated higher N, P, K, Na, and Cl in plant tissues relative to basil and/or tomato (Table 8). Considering the linear increase of NO3–N, particularly in lettuce-based aquaponics, nitrate accumulation in the edible parts of vegetables may be expected when growing vegetables in mature aquaponic systems. Therefore, the aquaponic solution needs to be diluted after each harvest and properly managed for long-term crop production.
Many aquaponic studies have demonstrated an initial sharp decline of P concentrations [23] or low P concentrations maintained in recirculating aquaponic solution [5,19]. Typically, the reported P level ranged from 1 to 7 mg L−1 in most aquaponic studies. However, our results showed that the daily P release rate in aquaponics was 26% of the fish feed applied, gradually increasing dissolved P in aquaponic solution at an average concentration of 30 mg L−1 (Table 1; Figure 4D). The discrepancy might be due to the fact that other aquaponic nutrient studies used various sources of water containing high levels of Ca and Mg, such as well water, tap water, and groundwater in the system [6,19,52,53,54,55], interfering with P availability. It is well-known that high availability of Ca and Mg can precipitate P, causing low P availability in aquaponics [5,14,23]. In aquaponic systems, where high-quality water is used, dissolved P from ingested fish feed containing 1.1% P is considered sufficient to support plant growth. This judgment could be further supported by the fact that total P levels in plant tissues of tomato, basil, and lettuce grown in aquaponics were similar or slightly lower than those grown in hydroponics (Table 8; Figure 5). Consistent with our results, Pantanella et al. (2012) reported that the P level was up to 30 mg L−1 after 4-week production of romaine lettuce in aquaponics filled with RO water [9]. This collective information supports the view that P is not a limiting factor in aquaponics, and water source may be the key that affects P availability in aquaponic systems. Low P availability reported in some aquaponic studies may be in part due to the use of plant-based formulations containing high amounts of phytic acid (or phytate), the major storage form of phosphorus in plant tissues.
In a typical soil environment, P is limited by soil depth, and P acquisition is determined by root architectural traits [56]. However, in water-based systems, including aquaponics, P exists mainly in two forms, dissolved and particulate forms, and only phosphates, dissolved form, can be bioavailable for a plant to uptake and remove from the recirculating water. P application rate can be reduced to 20 mg L−1 in soil-based [57] and substrate-based production systems when inert substrates are used [58,59], implying that P levels can be considerably lowered in water-based systems where diffusion gradients are not an issue as long as P is supplied to root zone at a constant rate. This was particularly true for NO3–N, for which a minimum concentration threshold of 1 mg L−1 was reported to maintain root growth in perennial ryegrass (Lolium perenne L.), corn (Zea mays L.), soybeans (Glycine max L.), sorghum (Sorghum bicolor L.), and bromegrass (Bromus inermus L.) [60,61,62]. There were no significant differences in the shoot and root fresh mass of 26 day-old romaine lettuce grown in deep-water culture with varying concentrations of NO3–N that ranged from 5 to 105 mg L−1 [63]. Given that most of the nutrients accumulated in aquaponic solution, it would be desirable to utilize fish feed containing less protein and P for aquaponics or develop fish feed specifically designed for aquaponic production to improve N and P use efficiency of the system.
The design of aquaponic systems follows the guidelines suggested by Rakocy et al. (2006) [20] but is highly variable spanning from a backyard aquaponics to a commercial system. Unlike many commercial aquaponic systems, our experimental system did not include bioreactors in the design and, therefore, lacked the capacity of mineralizing nutrients from the solids. Integrating bioreactors into the design, when combined with proper operating conditions (i.e., oxygen, temperature) for microbial activities, will allow to facilitate mineralization of Mg, Ca, K, and P from the solids into the aquaponic solution and, thus, provide opportunities for more sustainable nutrient management in aquaponic systems.
5. Conclusions
In this study, we characterized nutrient profiles in aquaponics and identified key nutrient elements affecting crop growth and yield. Our direct comparisons with the hydroponic system enabled us to determine nutrients that were deficient or in excess in aquaponic solution and plant tissues. Despite relatively low daily nutrient release rates from the ingested fish feed, most nutrients gradually accumulated in aquaponic solution and subsequently in plant tissues. Aquaponics reduced vegetative shoot growth of all tested crops; however, fruit yield was not affected in tomato despite the reduced shoot growth. We found that N, Mg, and/or Ca were temporarily suboptimal in aquaponics during crop production, limiting crop growth and yield, while P, Na, and Cl were maintained at sufficient or supra-optimal levels. Nutrient management should be established by considering these dynamic changes in nutrients to improve crop production in aquaponic systems. Notably, our results demonstrated that luxuriant nutrient profiles, such as in hydroponics, were not necessary to enhance crop yield in aquaponics as long as key factors affecting crop yield were identified and properly addressed. In summary, aquaponic nutrient management should be considered in accordance with the water source while supplementing target nutrients to enhance crop growth and yield and improve the efficiency of the system. There is still a long way to go until plant production in aquaponic systems reaches the levels obtained in hydroponics. Our results will aid in establishing production guidelines and quality standards for the expansion of commercial aquaponics.
Supplementary Materials
The following are available online at https://www.mdpi.com/2073-4441/12/5/1259/s1, Figure S1: Ambient temperature, daily light integral (DLI), and vapor pressure deficit (VPD) collected in the greenhouse during the experimental period (December through February). The parameters were averaged over the day. A dotted line is the average DLI during the entire production period (8.9 mol m−2 d−1).
Author Contributions
T.Y. conducted an experiment, collected data, undertook data analysis, and drafted the manuscript; H.-J.K. coordinated and supervised the research, undertook data analysis and interpretation, performed critical revisions, and completed the final version of the manuscript. All authors have read and agreed to the published version of the manuscript.
Funding
This research was supported by Indiana Water Resources Research Center (IWRRC) and US Geological Survey 104b grants; USDA National Institute of Food and Agriculture, under award number 2013-67019-21376; USDA National Institute of Food and Agriculture, Hatch/Multi-State project NE-1335 Resource Management in Commercial Greenhouse Production; Purdue University Research Funds.
Acknowledgments
We are grateful to Rob Eddy, Michael Russell, Nathan Deppe, Dan Little, and Nicole De Armond for their technical assistance; Yi-Ju Wang, Gaotian Zhu, Brittany Weerts, Jeff Bates, Youssef Karam, Brandon Horn, and Mitchell Ankney for their help with crop management and data collection; and Bob Rode for the helpful discussions during the research.
Conflicts of Interest
The authors declare that they have no conflicts of interest.
Data Availability
The data that support the findings of this study are available from the corresponding author, H.-J.K., upon reasonable request.
References
- Abdel-Raouf, N.; Al-Homaidan, A.A.; Ibraheem, I.B.M. Microalgae and wastewater treatment. Saudi J. Biol. Sci. 2012, 19, 257–275. [Google Scholar] [CrossRef] [Green Version]
- Rakocy, J.E.; Hargreaves, J.A. Integration of Vegetable Hydroponics with Fish Culture: A Review. In Techniques for Modern Aquaculture; Wang, J., Ed.; American Society for Agricultural Engineers: St. Joseph, MI, USA, 1993. [Google Scholar]
- McMurtry, M.R.; Sanders, D.C.; Cure, J.D.; Hodson, R.G.; Haning, B.C.; St Amand, P.C. Efficiency of water use of an integrated fish/vegetable co-culture system. J. World Aquac. Soc. 1997, 28, 420–428. [Google Scholar] [CrossRef]
- Yang, T.; Kim, H.J. Nutrient management regime affects water quality, crop growth, and nitrogen use efficiency of aquaponic systems. Sci. Hortic. 2019, 256. [Google Scholar] [CrossRef]
- Goddek, S.; Delaide, B.; Mankasingh, U.; Ragnarsdottir, K.V.; Jijakli, H.; Thorarinsdottir, R. Challenges of sustainable and commercial aquaponics. Sustainability 2015, 7, 4199–4224. [Google Scholar] [CrossRef] [Green Version]
- Al-Hafedh, Y.S.; Alam, A.; Beltagi, M.S. Food production and water conservation in a recirculating aquaponic system in Saudi Arabia at different ratios of fish feed to plants. J. World Aquac. Soc. 2008, 39, 510–520. [Google Scholar] [CrossRef]
- Rakocy, J.E.; Bailey, D.S.; Shultz, R.C.; Thoman, E.S. Update on Tilapia and Vegetable Production in the UVI Aquaponic System. In Proceedings of the 6th International Symposium on Tilapia in Aquaculture, New Dimensions on Farmed Tilapia, Manila, Philippines, 12–16 September 2004; pp. 676–690. [Google Scholar]
- Resh, H.M. Hydroponic Food Production: A Definitive Guidebook for the Advanced Home Gardener and the Commercial Hydroponic Grower, 7th ed.; CRC Press: Boca Raton, FL, USA, 2013. [Google Scholar]
- Pantanella, E.; Cardarelli, M.; Colla, G.; Rea, E.; Marcucci, A. Aquaponics vs. hydroponics: Production and quality of lettuce crop. Acta Hortic. 2012, 927, 887–893. [Google Scholar] [CrossRef]
- Somerville, C.; Cohen, M.; Pantanella, E.; Stankus, A.; Lovatelli, A. Small-Scale Aquaponic Food Production Integrated Fish and Plant Farming; FAO Fisheries and Aquaculture Technical Paper; Food and Agriculture Organization of the United Nations (FAO): Rome, Italy, 2014; Volume 589, pp. 1–262. [Google Scholar]
- Roosta, H.R. Comparison of the vegetative growth, eco-physiological characteristics and mineral nutrient content of basil plants in different irrigation ratios of hydroponic: Aquaponic solutions. J. Plant Nutr. 2014, 37, 1782–1803. [Google Scholar] [CrossRef]
- Wortman, S.E. Crop physiological response to nutrient solution electrical conductivity and pH in an ebb-and-flow hydroponic system. Sci. Hortic. 2015, 194, 34–42. [Google Scholar] [CrossRef]
- Alcarraz, E.; Flores, M.; Tapia, M.L.; Bustamante, A.; Wacyk, J.; Escalona, V. Quality of lettuce (Lactuca sativa L.) grown in aquaponic and hydroponic systems. Acta Hortic. 2018, 31–38. [Google Scholar] [CrossRef] [Green Version]
- Savidov, N.A.; Hutchings, E.; Rakocy, J.E. Fish and plant production in a recirculating aquaponic system: A new approach to sustainable agriculture in Canada. Acta Hortic. 2007, 209–221. [Google Scholar] [CrossRef]
- Delaide, B.; Goddek, S.; Gott, J.; Soyeurt, H.; Jijakli, M.H. Lettuce (Lactuca sativa L. var. Sucrine) growth performance in complemented aquaponic solution outperforms hydroponics. Water 2016, 8, 467. [Google Scholar] [CrossRef]
- Graber, A.; Junge, R. Aquaponic systems: Nutrient recycling from fish wastewater by vegetable production. Desalination 2009, 246, 147–156. [Google Scholar] [CrossRef]
- Roosta, H.R.; Hamidpour, M. Mineral nutrient content of tomato plants in aquaponic and hydroponic systems: Effect of foliar application of some macro-and micro-nutrients. J. Plant Nutr. 2013, 36, 2070–2083. [Google Scholar] [CrossRef]
- Suhl, J.; Dannehl, D.; Kloas, W.; Baganz, D.; Jobs, S.; Scheibe, G.; Schmidt, U. Advanced aquaponics: Evaluation of intensive tomato production in aquaponics vs. conventional hydroponics. Agric. Water Manag. 2016, 178, 335–344. [Google Scholar] [CrossRef]
- Rakocy, J.E.; Shultz, R.C.; Bailey, D.S.; Thoman, E.S. Aquaponic production of tilapia and basil: Comparing a batch and staggered cropping system. Acta Hortic. 2004, 648, 63–69. [Google Scholar] [CrossRef]
- Rakocy, J.E.; Masser, M.P.; Losordo, T.M. Recirculating aquaculture tank production systems: Aquaponics-Integrating fish and plant culture. SRAC Publ. South. Reg. Aquac. Cent. Publ. 2006, 454, 1–16. Available online: http://pods.dasnr.okstate.edu/docushare/dsweb/Get/Document-10215/SRAC-454web.pdf (accessed on 1 August 2019).
- Roosta, H.R.; Hamidpour, M. Effects of foliar application of some macro-and micro-nutrients on tomato plants in aquaponic and hydroponic systems. Sci. Hortic. 2011, 129, 396–402. [Google Scholar] [CrossRef]
- Krom, M.D.; Ben David, A.; Ingall, E.D.; Benning, L.G.; Clerici, S.; Bottrell, S.; Davies, C.; Potts, N.J.; Mortimer, R.J.G.; van Rijn, J. Bacterially mediated removal of phosphorus and cycling of nitrate and sulfate in the waste stream of a “zero-discharge” recirculating mariculture system. Water Res. 2014, 56, 109–121. [Google Scholar] [CrossRef]
- Seawright, D.E.; Stickney, R.R.; Walker, R.B. Nutrient dynamics in integrated aquaculture-hydroponics systems. Aquaculture 1998, 160, 215–237. [Google Scholar] [CrossRef]
- Wongkiew, S.; Popp, B.N.; Kim, H.J.; Khanal, S.K. Fate of nitrogen in floating-raft aquaponic systems using natural abundance nitrogen isotopic compositions. Int. Biodeterior. Biodegrad. 2017, 125, 24–32. [Google Scholar] [CrossRef]
- Kim, H.J.; Yang, T.; Lin, M.Y.; Langenhoven, P. Plant propagation for successful hydroponic production. Acta Hortic. 2018, 1212, 109–116. [Google Scholar] [CrossRef]
- Basta, N.T.; Tabatabai, M.A. Determination of total potassium, sodium, calcium, and magnesium in plant materials by ion chromatography. Soil Sci. Soc. Am. J. 1985, 49, 76–81. [Google Scholar] [CrossRef]
- Beke, G.J.; Selles, F. Comparison of ion chromatography and a continuous-flow technique for analysis of chloride and sulfate in plant-samples. Commun. Soil Sci. Plant Anal. 1993, 24, 973–978. [Google Scholar] [CrossRef]
- Murphy, J.; Riley, J.P. A modified single solution method for determination of phosphate in natural waters. Anal. Chim. Acta 1962, 26, 31–36. [Google Scholar] [CrossRef]
- Danaher, J.J.; Shultz, R.C.; Rakocy, J.E.; Bailey, D.S.; Knight, L. Effect of a parabolic screen filter on water quality and production of Nile tilapia (Oreochromis niloticus) and water spinach (Ipomoea aquatica) in a recirculating raft aquaponic system. Int. J. Recirc. Aquac. 2011, 12, 35–53. [Google Scholar] [CrossRef]
- Rakocy, J.E. Integrating Tilapia Culture with Vegetable Hydroponics in Recirculating Systems. In Tilapia Aquaculture in the Americas; Costa Pierce, B.A., Rakocy, J.E., Eds.; The World Aquaculture Society: Baton Rouge, LA, USA, 1997. [Google Scholar]
- Yildiz, H.Y.; Robaina, L.; Pirhonen, J.; Mente, E.; Dominguez, D.; Parisi, G. Fish welfare in aquaponic systems: Its relation to water quality with an emphasis on feed and faeces—A review. Water 2017, 9, 13. [Google Scholar] [CrossRef] [Green Version]
- Boyd, C.E. Water Quality Management for Pond Fish Culture; Elsevier Scientific Publishing Co.: Amsterdam, The Netherlands, 1982. [Google Scholar]
- Fondriest Environmental, Inc. “Dissolved Oxygen”. Fundamentals of Environmental Measurements. 2013. Available online: https://www.fondriest.com/environmental-measurements/parameters/water-quality/dissolved-oxygen/ (accessed on 18 July 2019).
- Schroder, F.G.; Lieth, J.H. Irrigation Control in Hydroponics. In Hydroponic Production of Vegetables and Ornamentals; Savvas, D., Passam, H., Eds.; Embryo Publishing: Athens, Greece, 2002; pp. 265–296. [Google Scholar]
- Wurts, W.A.; Durborow, R.M. Interactions of pH, carbon dioxide, alkalinity and hardness in fish ponds. South. Reg. Aquac. Cent. Publ. 1992, 464, 1–4. [Google Scholar]
- Ebeling, J.M.; Timmons, M.B. Recirculating Aquaculture Systems. In Aquaculture Production Systems; Tidwell, J.H., Ed.; John Wiley & Sons: Hoboken, NJ, USA, 2012; pp. 245–277. [Google Scholar]
- New, M.B. Feed and Feeding of Fish and Shrimp. A Manual on the Preparation and Presentation of Compound Feeds for Shrimp and FISH in Aquaculture; Food and Agriculture Organization of the United Nations: Rome, Italy, 1987; Available online: http://www.fao.org/3/S4314E/S4314E00.htm (accessed on 25 March 2020).
- Kim, H.J.; Lin, M.-Y.; Mitchell, C.A. Light spectral and thermal properties govern biomass allocation in tomato through morphological and physiological changes. Environ. Exp. Bot. 2019, 157, 228–240. [Google Scholar] [CrossRef]
- Marschner, P. Marschner’s Mineral Nutrition of Higher Plants, 3rd ed.; Elsevier/Academic Press: Amsterdam, The Netherlands, 2012. [Google Scholar]
- Yang, T.; Kim, H.J. Effects of hydraulic loading rate on spatial and temporal water quality characteristics and crop growth and yield in aquaponic systems. Horticulturae 2020, 6, 9. [Google Scholar] [CrossRef] [Green Version]
- Nozzi, V.; Graber, A.; Schmautz, Z.; Mathis, A.; Junge, R. Nutrient management in aquaponics: Comparison of three approaches for cultivating lettuce, mint and mushroom herb. Agron. Basel 2018, 8, 27. [Google Scholar] [CrossRef] [Green Version]
- Maathuis, F.J.M. Physiological functions of mineral macronutrients. Curr. Opin. Plant Biol. 2009, 12, 250–258. [Google Scholar] [CrossRef] [PubMed]
- Wege, S.; Gilliham, M.; Henderson, S.W. Chloride: Not simply a ‘cheap osmoticum’, but a beneficial plant macronutrient. J. Exp. Bot. 2017, 68, 3057–3069. [Google Scholar] [CrossRef] [PubMed]
- Halevy, J. Growth-Rate and nutrient-uptake of 2 cotton cultivars grown under irrigation. Agron. J. 1976, 68, 701–705. [Google Scholar] [CrossRef]
- Azoulay, A.; Garzon, P.; Eisenberg, M.J. Comparison of the mineral content of tap water and bottled waters. J. Gen. Intern. Med. 2001, 16, 168–175. [Google Scholar] [CrossRef]
- Pehrsson, P.; Patterson, K. The Mineral Content of U.S. Drinking and Municipal Water. In Proceedings of the 32nd National Nutrient Databank Conference, Ottawa, ON, Canada, 12–14 May 2008. [Google Scholar]
- Grattan, S.R.; Grieve, C.M. Mineral element acquisition and growth-response of plants grown in saline environments. Agric. Ecosyst. Environ. 1992, 38, 275–300. [Google Scholar] [CrossRef]
- Cakmak, I.; Kirkby, E.A. Role of magnesium in carbon partitioning and alleviating photooxidative damage. Physiol. Plant. 2008, 133, 692–704. [Google Scholar] [CrossRef]
- Kim, H.J.; Fonseca, J.M.; Choi, J.H.; Kubota, C.; Kwon, D.Y. Salt in irrigation water affects the nutritional and visual properties of romaine lettuce (Lactuca sativa L.). J. Agric. Food Chem. 2008, 56, 3772–3776. [Google Scholar] [CrossRef]
- Vandendriessche, R. Prediction of mineral nutrient status of trees by foliar analysis. Bot. Rev. 1974, 40, 347–394. [Google Scholar] [CrossRef]
- Colla, G.; Kim, H.J.; Kyriacou, M.C.; Rouphael, Y. Nitrate in fruits and vegetables. Sci. Hortic. 2018, 237, 221–238. [Google Scholar] [CrossRef]
- Delaide, B.; Delhaye, G.; Dermience, M.; Gott, J.; Soyeurt, H.; Jijakli, M.H. Plant and fish production performance, nutrient mass balances, energy and water use of the PAFF Box, a small-scale aquaponic system. Aquac. Eng. 2017, 78, 130–139. [Google Scholar] [CrossRef]
- Goddek, S.; Schmautz, Z.; Scott, B.; Delaide, B.; Keesman, K.J.; Wuertz, S.; Junge, R. The effect of anaerobic and aerobic fish sludge supernatant on hydroponic lettuce. Agron. Basel 2016, 6, 37. [Google Scholar] [CrossRef] [Green Version]
- Lennard, W.A.; Leonard, B.V. A comparison of three different hydroponic sub-systems (gravel bed, floating and nutrient film technique) in an Aquaponic test system. Aquac. Int. 2006, 14, 539–550. [Google Scholar] [CrossRef]
- Rakocy, J.E.; Bailey, D.S.; Shultz, R.C.; Danaher, J.J. Preliminary evaluation of organic waste from two aquaculture systems as a source of inorganic nutrients for hydroponics. Acta Hortic. 2007, 742, 201–207. [Google Scholar] [CrossRef]
- Kim, H.J.; Lynch, J.P.; Brown, K.M. Ethylene insensitivity impedes a subset of responses to phosphorus deficiency in tomato and petunia. Plant Cell Environ. 2008, 31, 1744–1755. [Google Scholar] [CrossRef]
- Santos, B.M.; Dusky, J.A.; Stall, W.M.; Bewick, T.A.; Shilling, D.G.; Gilreath, J.P. Phosphorus absorption in lettuce, smooth pigweed (Amaranthus hybridus), and common purslane (Portulaca oleracea) mixtures. Weed Sci. 2004, 52, 389–394. [Google Scholar] [CrossRef]
- Kim, H.J.; Li, X. Effects of phosphorus on shoot and root growth, partitioning, and phosphorus utilization efficiency in lantana. HortScience 2016, 51, 1001–1009. [Google Scholar] [CrossRef] [Green Version]
- Zhang, J.; Choi, S.; Fan, J.; Kim, H.J. Biomass and phosphorus accumulation and partitioning of geranium and coleus in response to phosphorus availability and growth phase. Agron. Basel 2019, 9, 813. [Google Scholar] [CrossRef] [Green Version]
- Clement, C.R.; Hopper, M.J.; Jones, L.H.P. Uptake of nitrate by Lolium perenne from flowing nutrient solution: 1. Effect of NO3-concentration. J. Exp. Bot. 1978, 29, 453–464. [Google Scholar] [CrossRef]
- Edwards, J.H.; Barber, S.A. Nitrogen uptake characteristics of corn roots at low n-concentration as influenced by plant age. Agronomy J. 1976, 68, 17–19. [Google Scholar] [CrossRef]
- Warncke, D.D.; Barber, S.A. Nitrate uptake effectiveness of 4 plant species. J. Environ. Qual. 1974, 3, 28–30. [Google Scholar] [CrossRef]
- Letey, J.; Jarrell, W.M.; Valoras, N. Nitrogen and water-uptake patterns and growth of plants at various minimum solution nitrate concentrations. J. Plant Nutr. 1982, 5, 73–89. [Google Scholar] [CrossRef]
Figure 1.
Schematic diagram of experimental units: (A) aquaponic system; (B) hydroponic system, adapted from Yang and Kim (2019) [4].
Figure 1.
Schematic diagram of experimental units: (A) aquaponic system; (B) hydroponic system, adapted from Yang and Kim (2019) [4].

Figure 2.
Variations in electrical conductivity (EC) and pH in tomato-, basil-, and lettuce-based aquaponics (left column) and hydroponics (right column) over a 3-month production period. Tomato and basil seedlings were transplanted at day 0, while lettuce seedlings were transplanted at day 0, 30, and 60. Average pH and EC of tomato (T)-, basil (B)-, and lettuce (L)-based systems are given for 30 days in parenthesis. Each data point is the mean of 3 replicates measured from the hydroponic culture unit of each system.

Figure 3.
The number of flowers and tomato fruit harvest in aquaponics and hydroponics over a 3-month production period. Each data point is the mean of 8 replicates.
Figure 3.
The number of flowers and tomato fruit harvest in aquaponics and hydroponics over a 3-month production period. Each data point is the mean of 8 replicates.

Figure 4.
Changes in macronutrient (A–J) levels in the aquatic phase of tomato-, basil-, and lettuce-based aquaponics and hydroponics systems during a 3-month production period. Water samples were collected once every two days at two different locations in the system (fish tank or nutrient reservoir and hydroponic culture unit) and analyzed using ion chromatography (or HACH reaction kits for NO2–N and NH4–N). Each data point is the mean of 3 replicates.

Figure 5.
Total nitrogen (A), total phosphorus (B), sulfate (C), potassium (D) concentrations in leaves, stems, roots, and/or fruit of tomato, basil, lettuce grown for 3-, 3-, and 1-month(s) in an aquaponics or hydroponics system. Data represent the mean of 6 replicates ± SE.
Figure 5.
Total nitrogen (A), total phosphorus (B), sulfate (C), potassium (D) concentrations in leaves, stems, roots, and/or fruit of tomato, basil, lettuce grown for 3-, 3-, and 1-month(s) in an aquaponics or hydroponics system. Data represent the mean of 6 replicates ± SE.

Figure 6.
Calcium (A), magnesium (B), sodium (C), and chloride (D) concentrations in leaves, stems, roots, and/or fruit of tomato, basil, and lettuce grown for 3-, 3-, and 1-month(s) in an aquaponics or hydroponics system. Data represent the mean of 6 replicates ± SE.
Figure 6.
Calcium (A), magnesium (B), sodium (C), and chloride (D) concentrations in leaves, stems, roots, and/or fruit of tomato, basil, and lettuce grown for 3-, 3-, and 1-month(s) in an aquaponics or hydroponics system. Data represent the mean of 6 replicates ± SE.


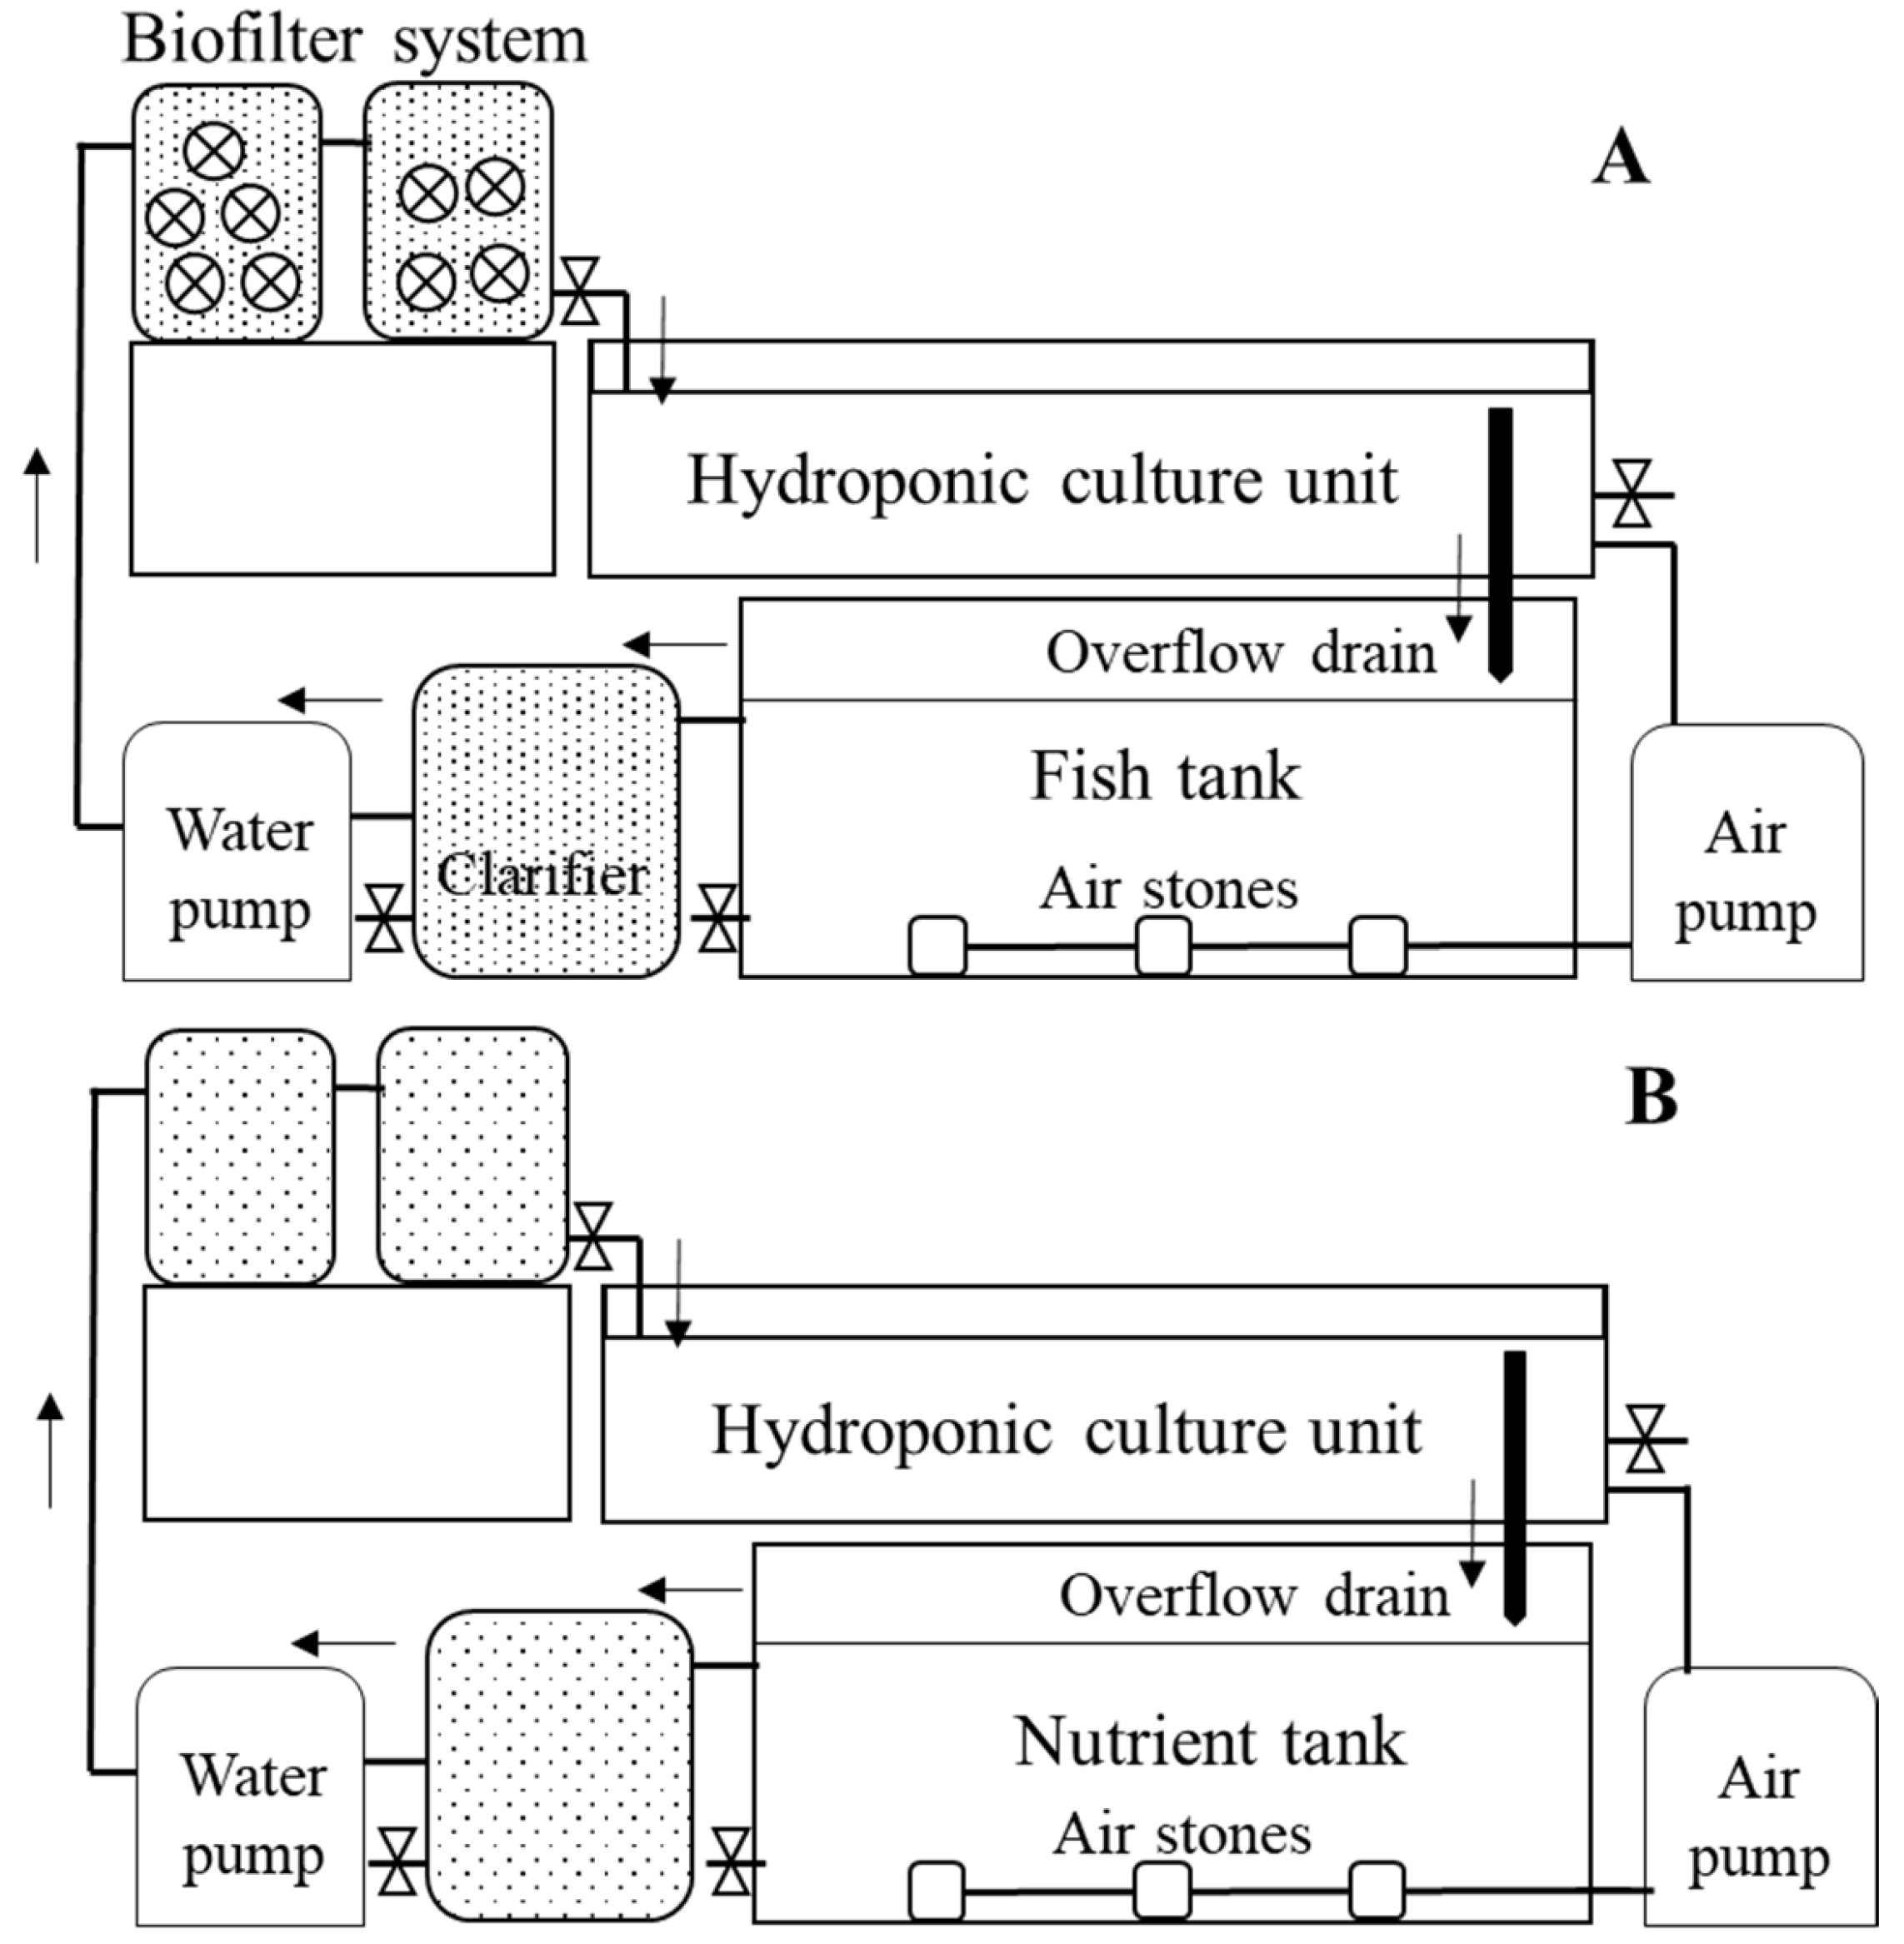
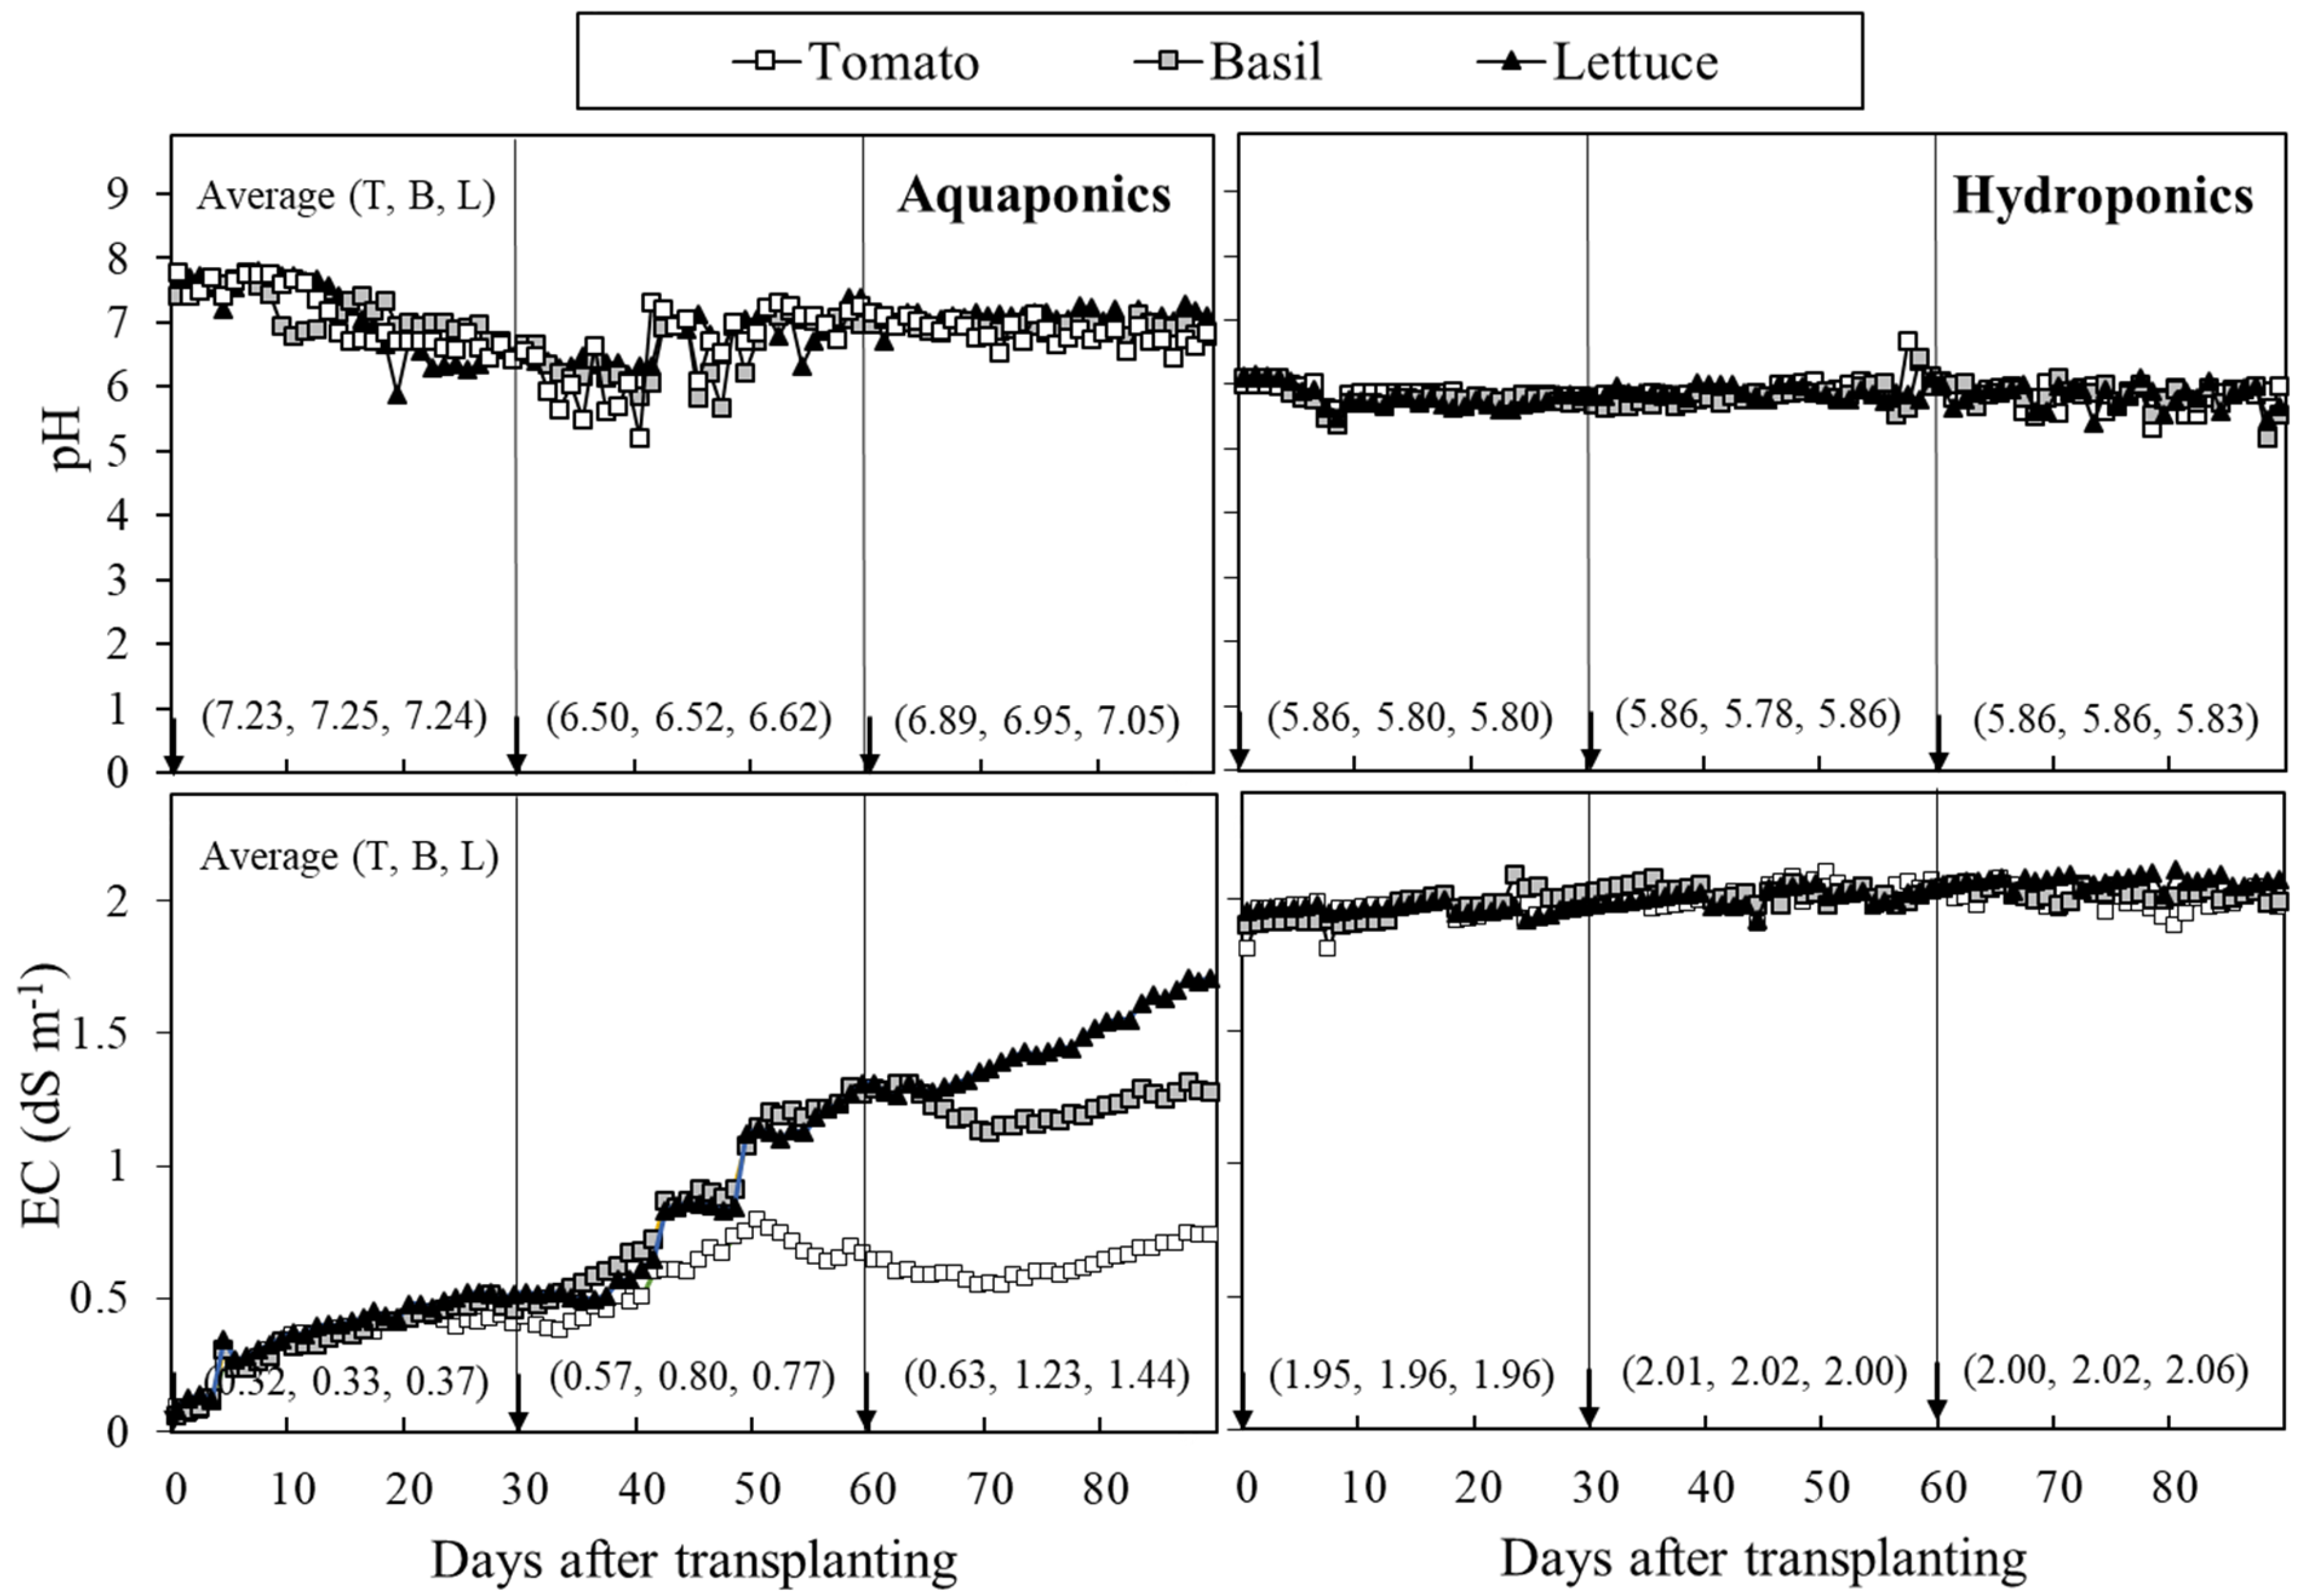
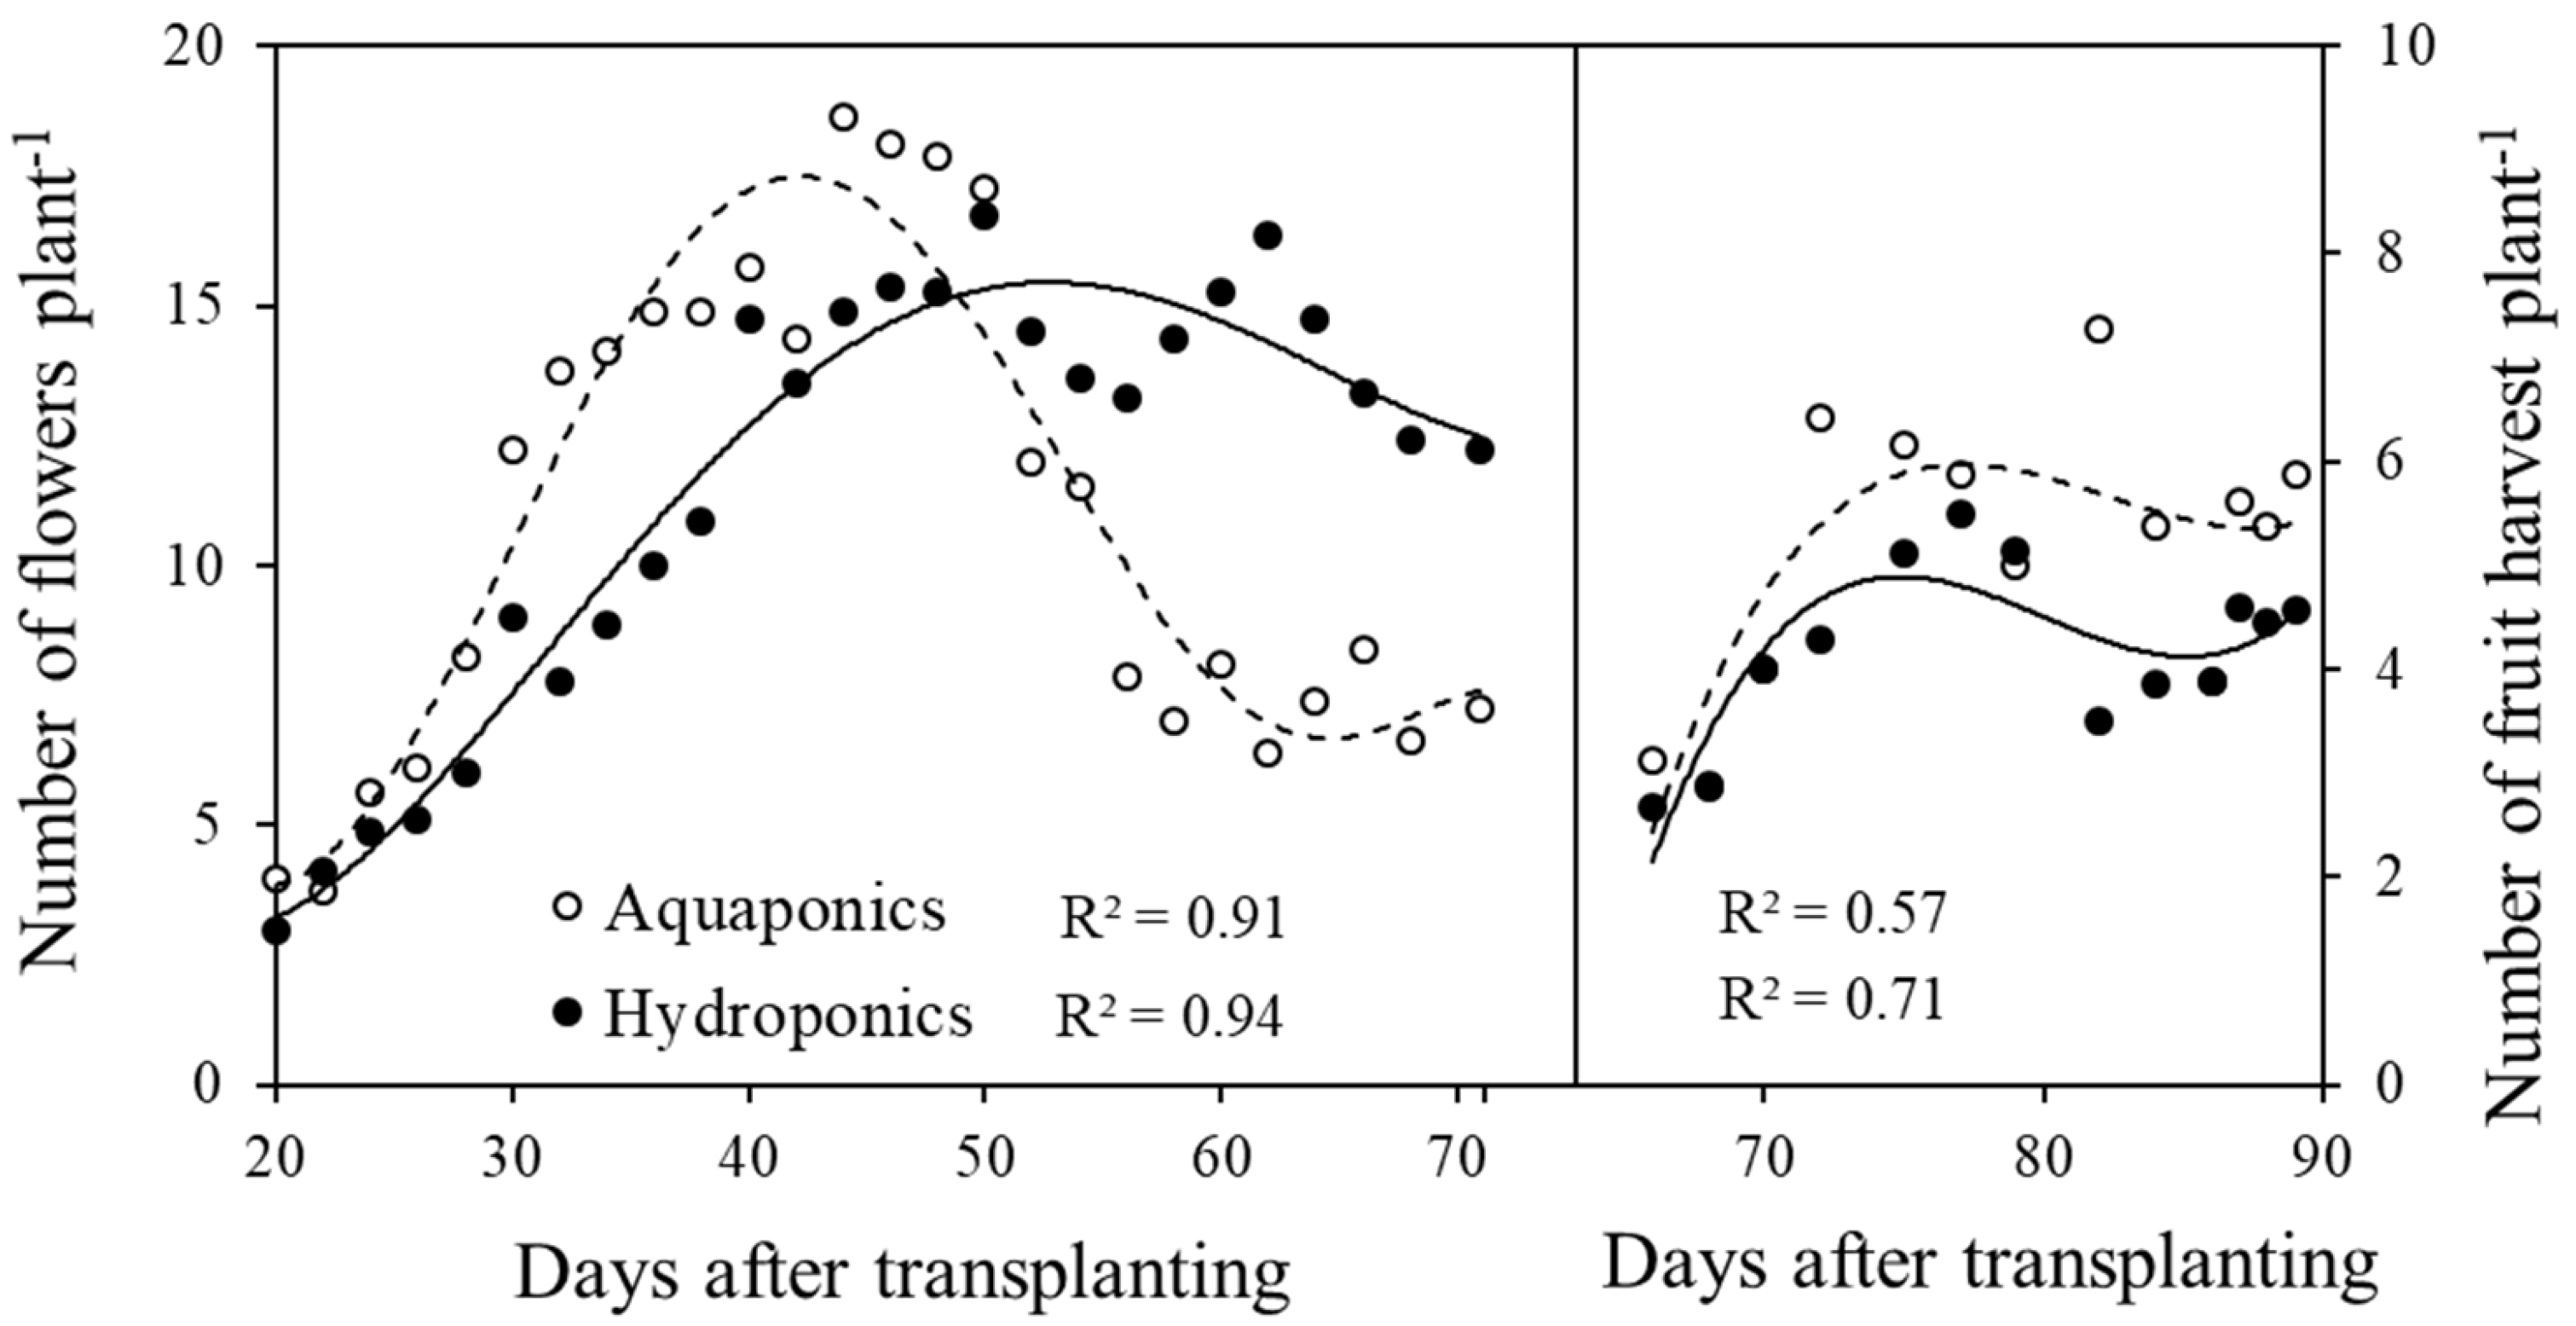
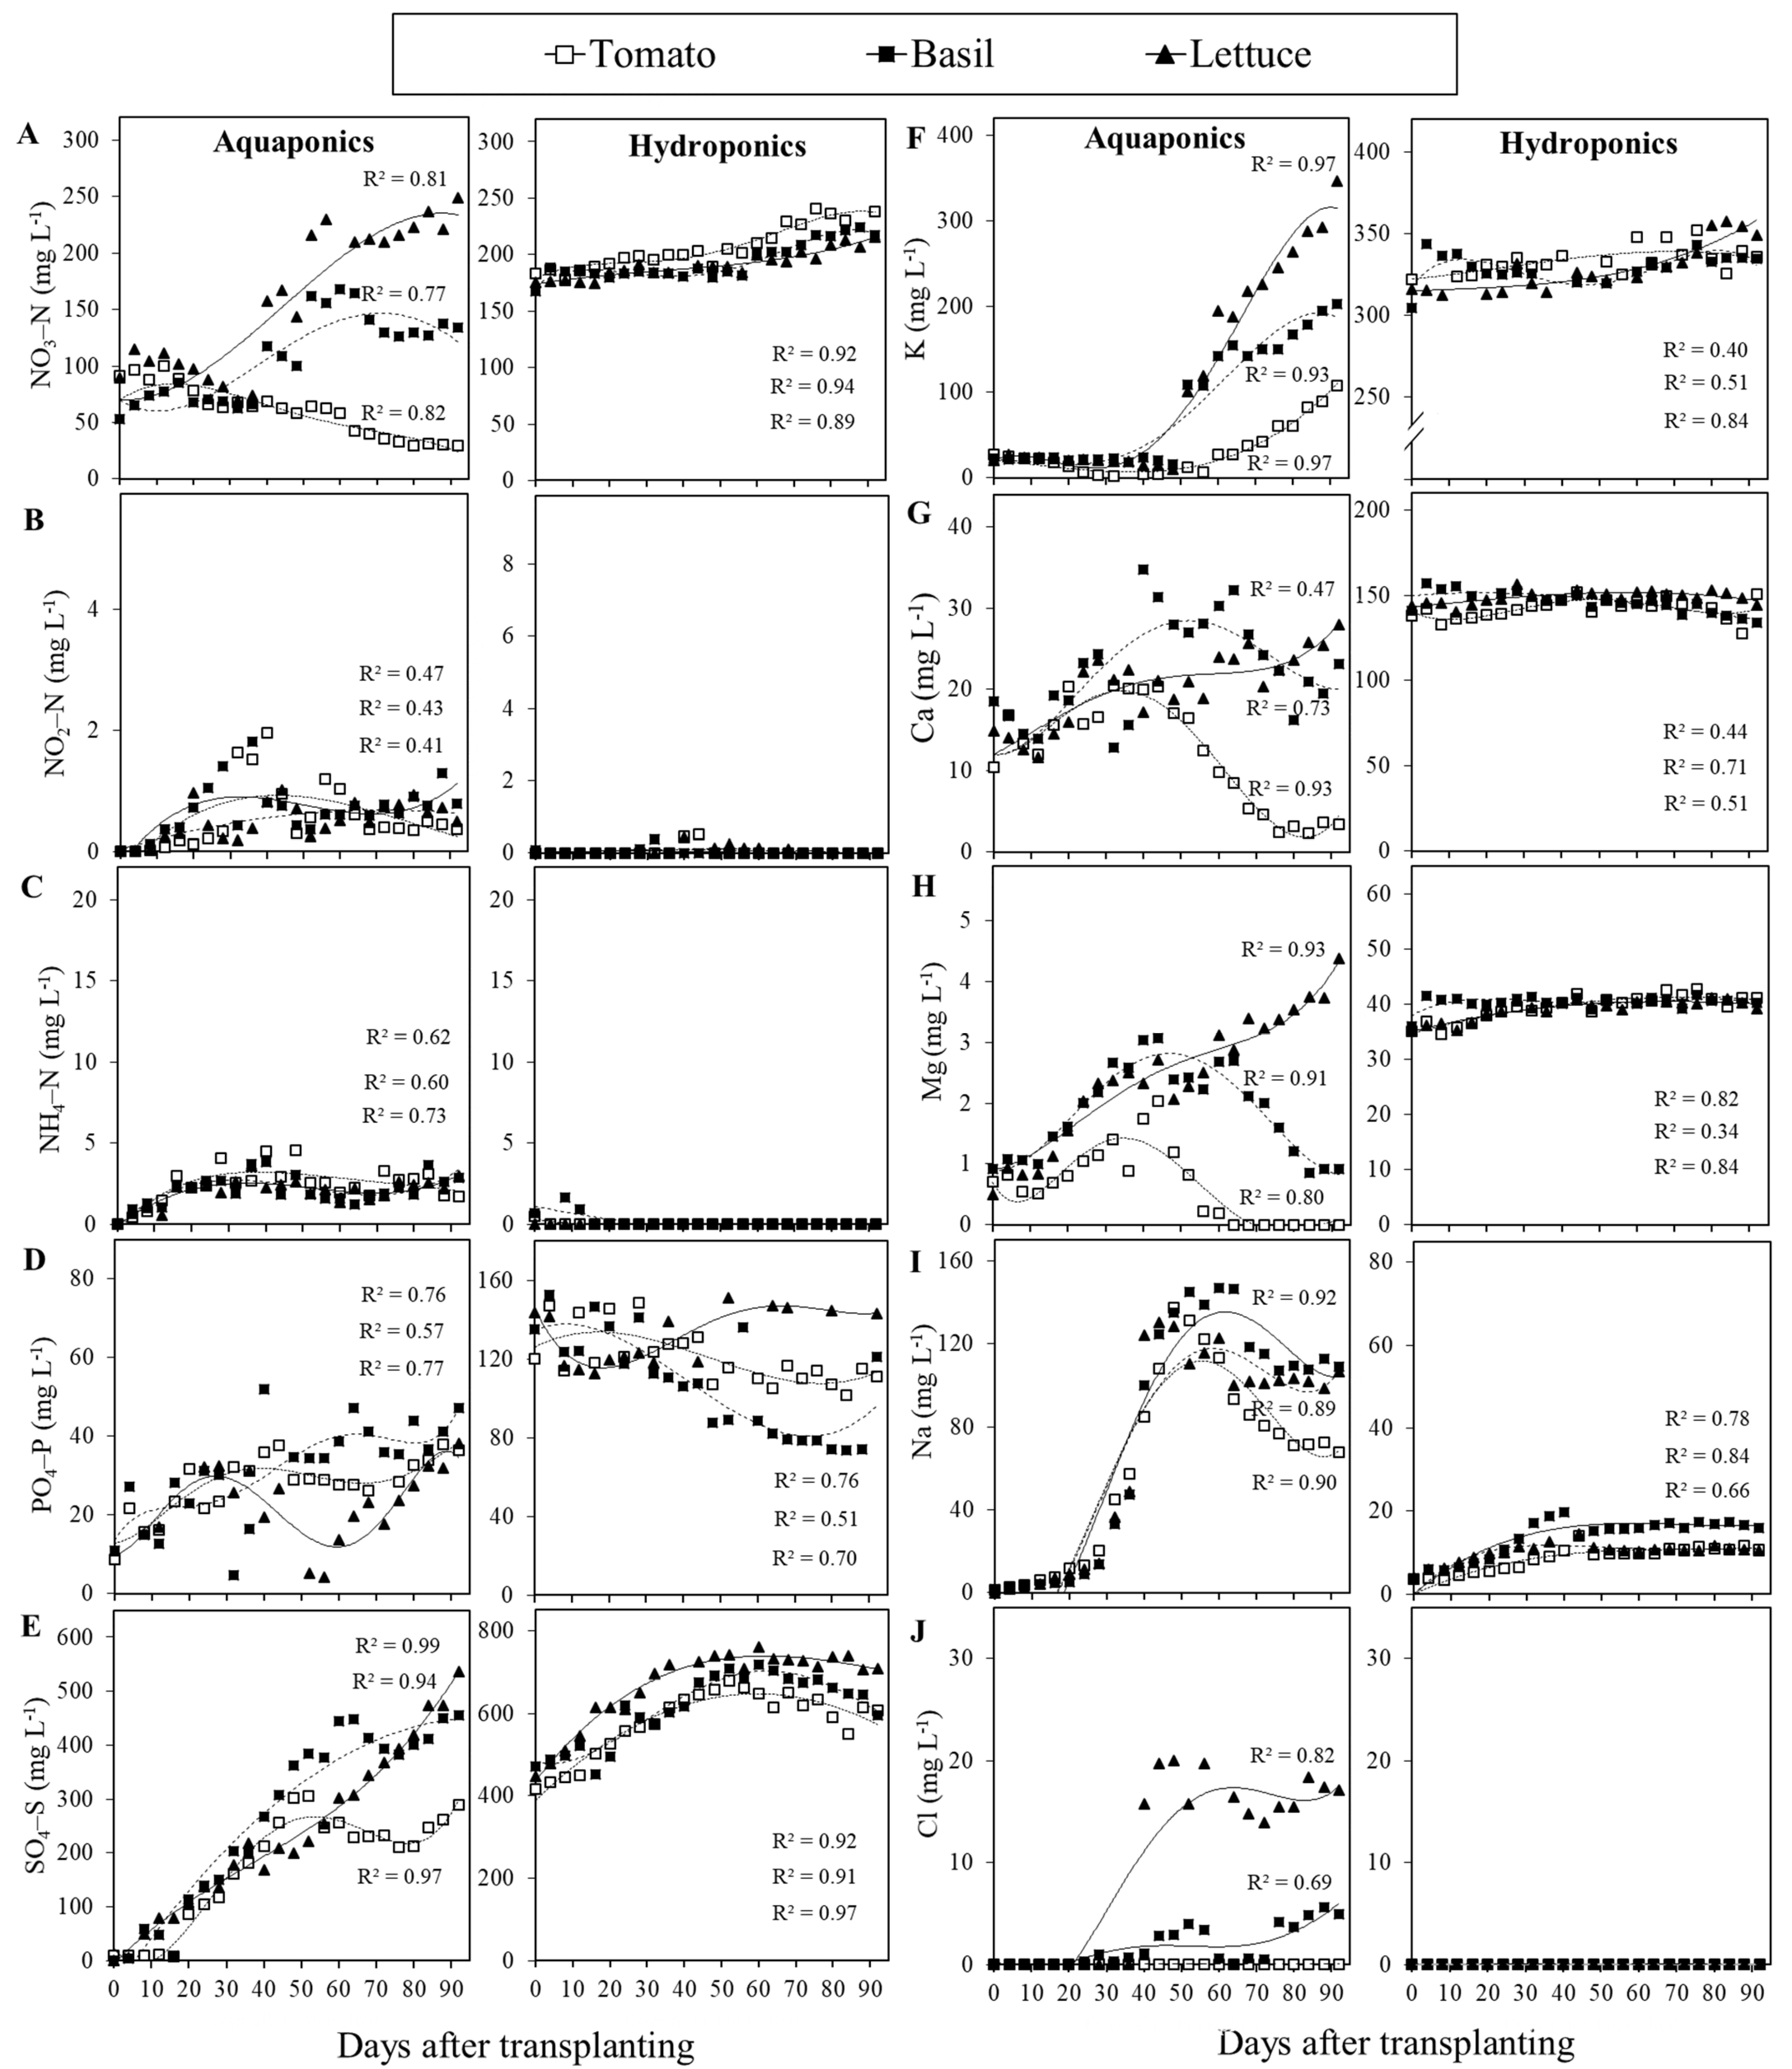
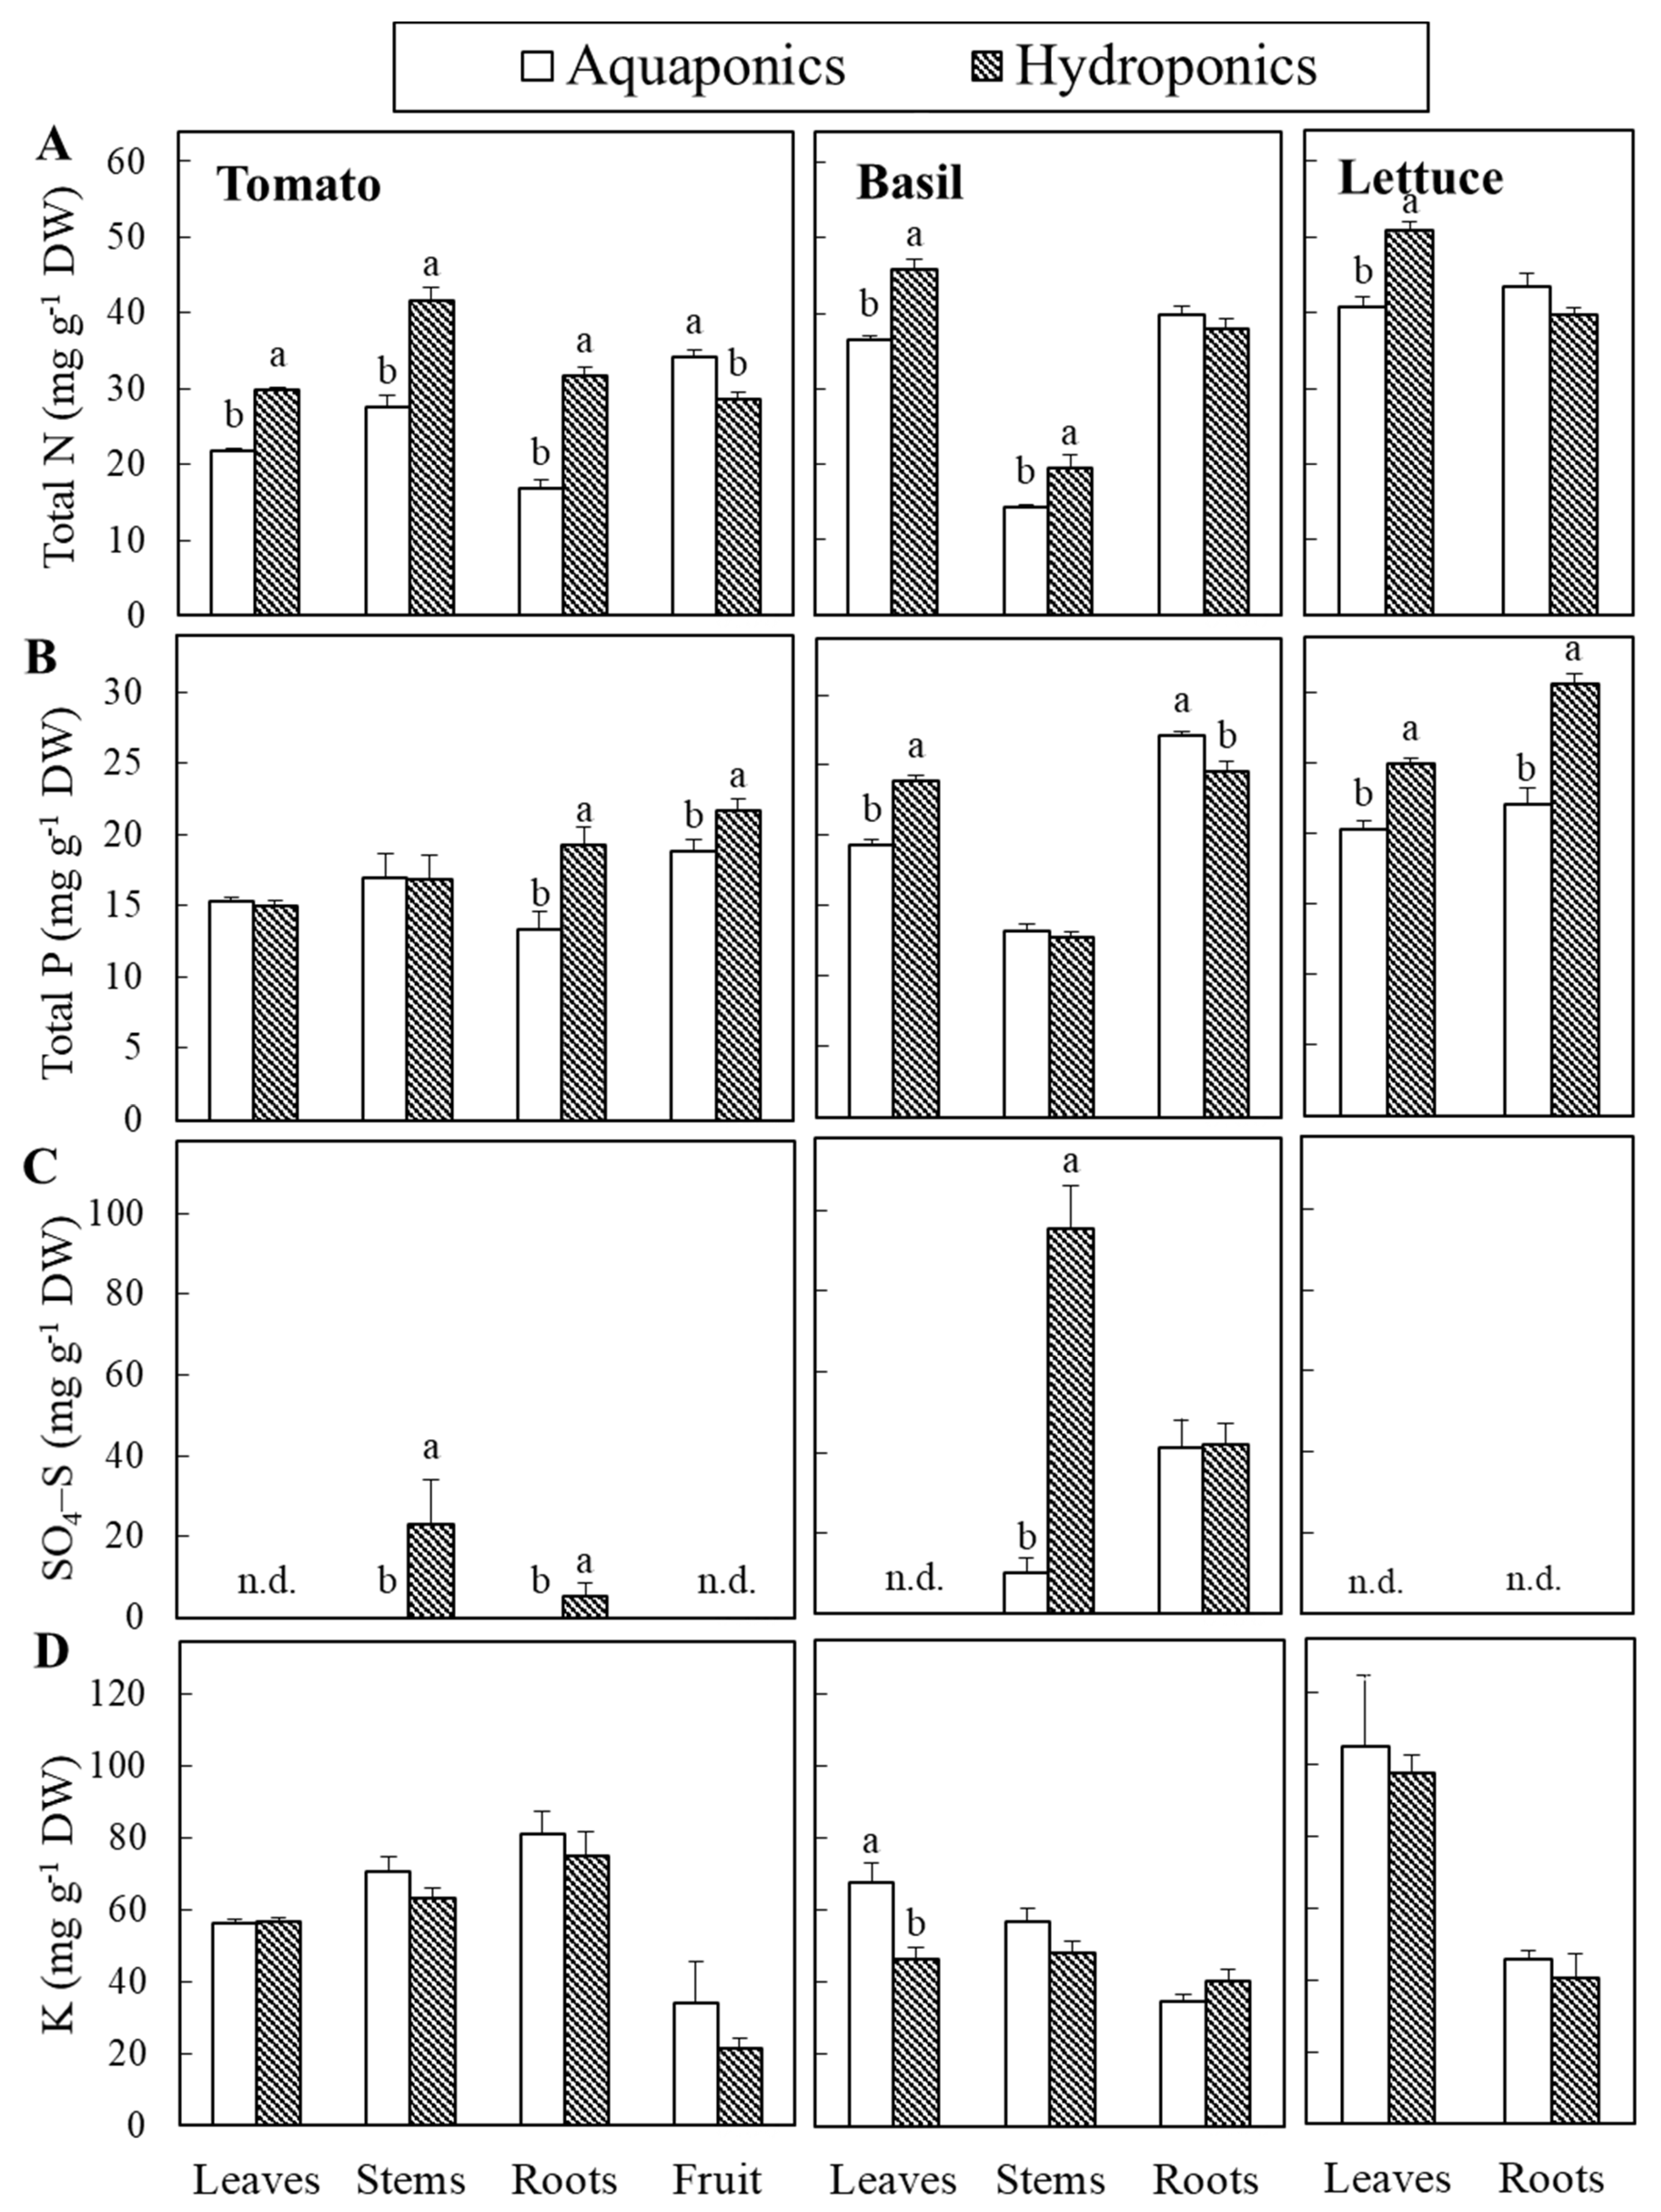
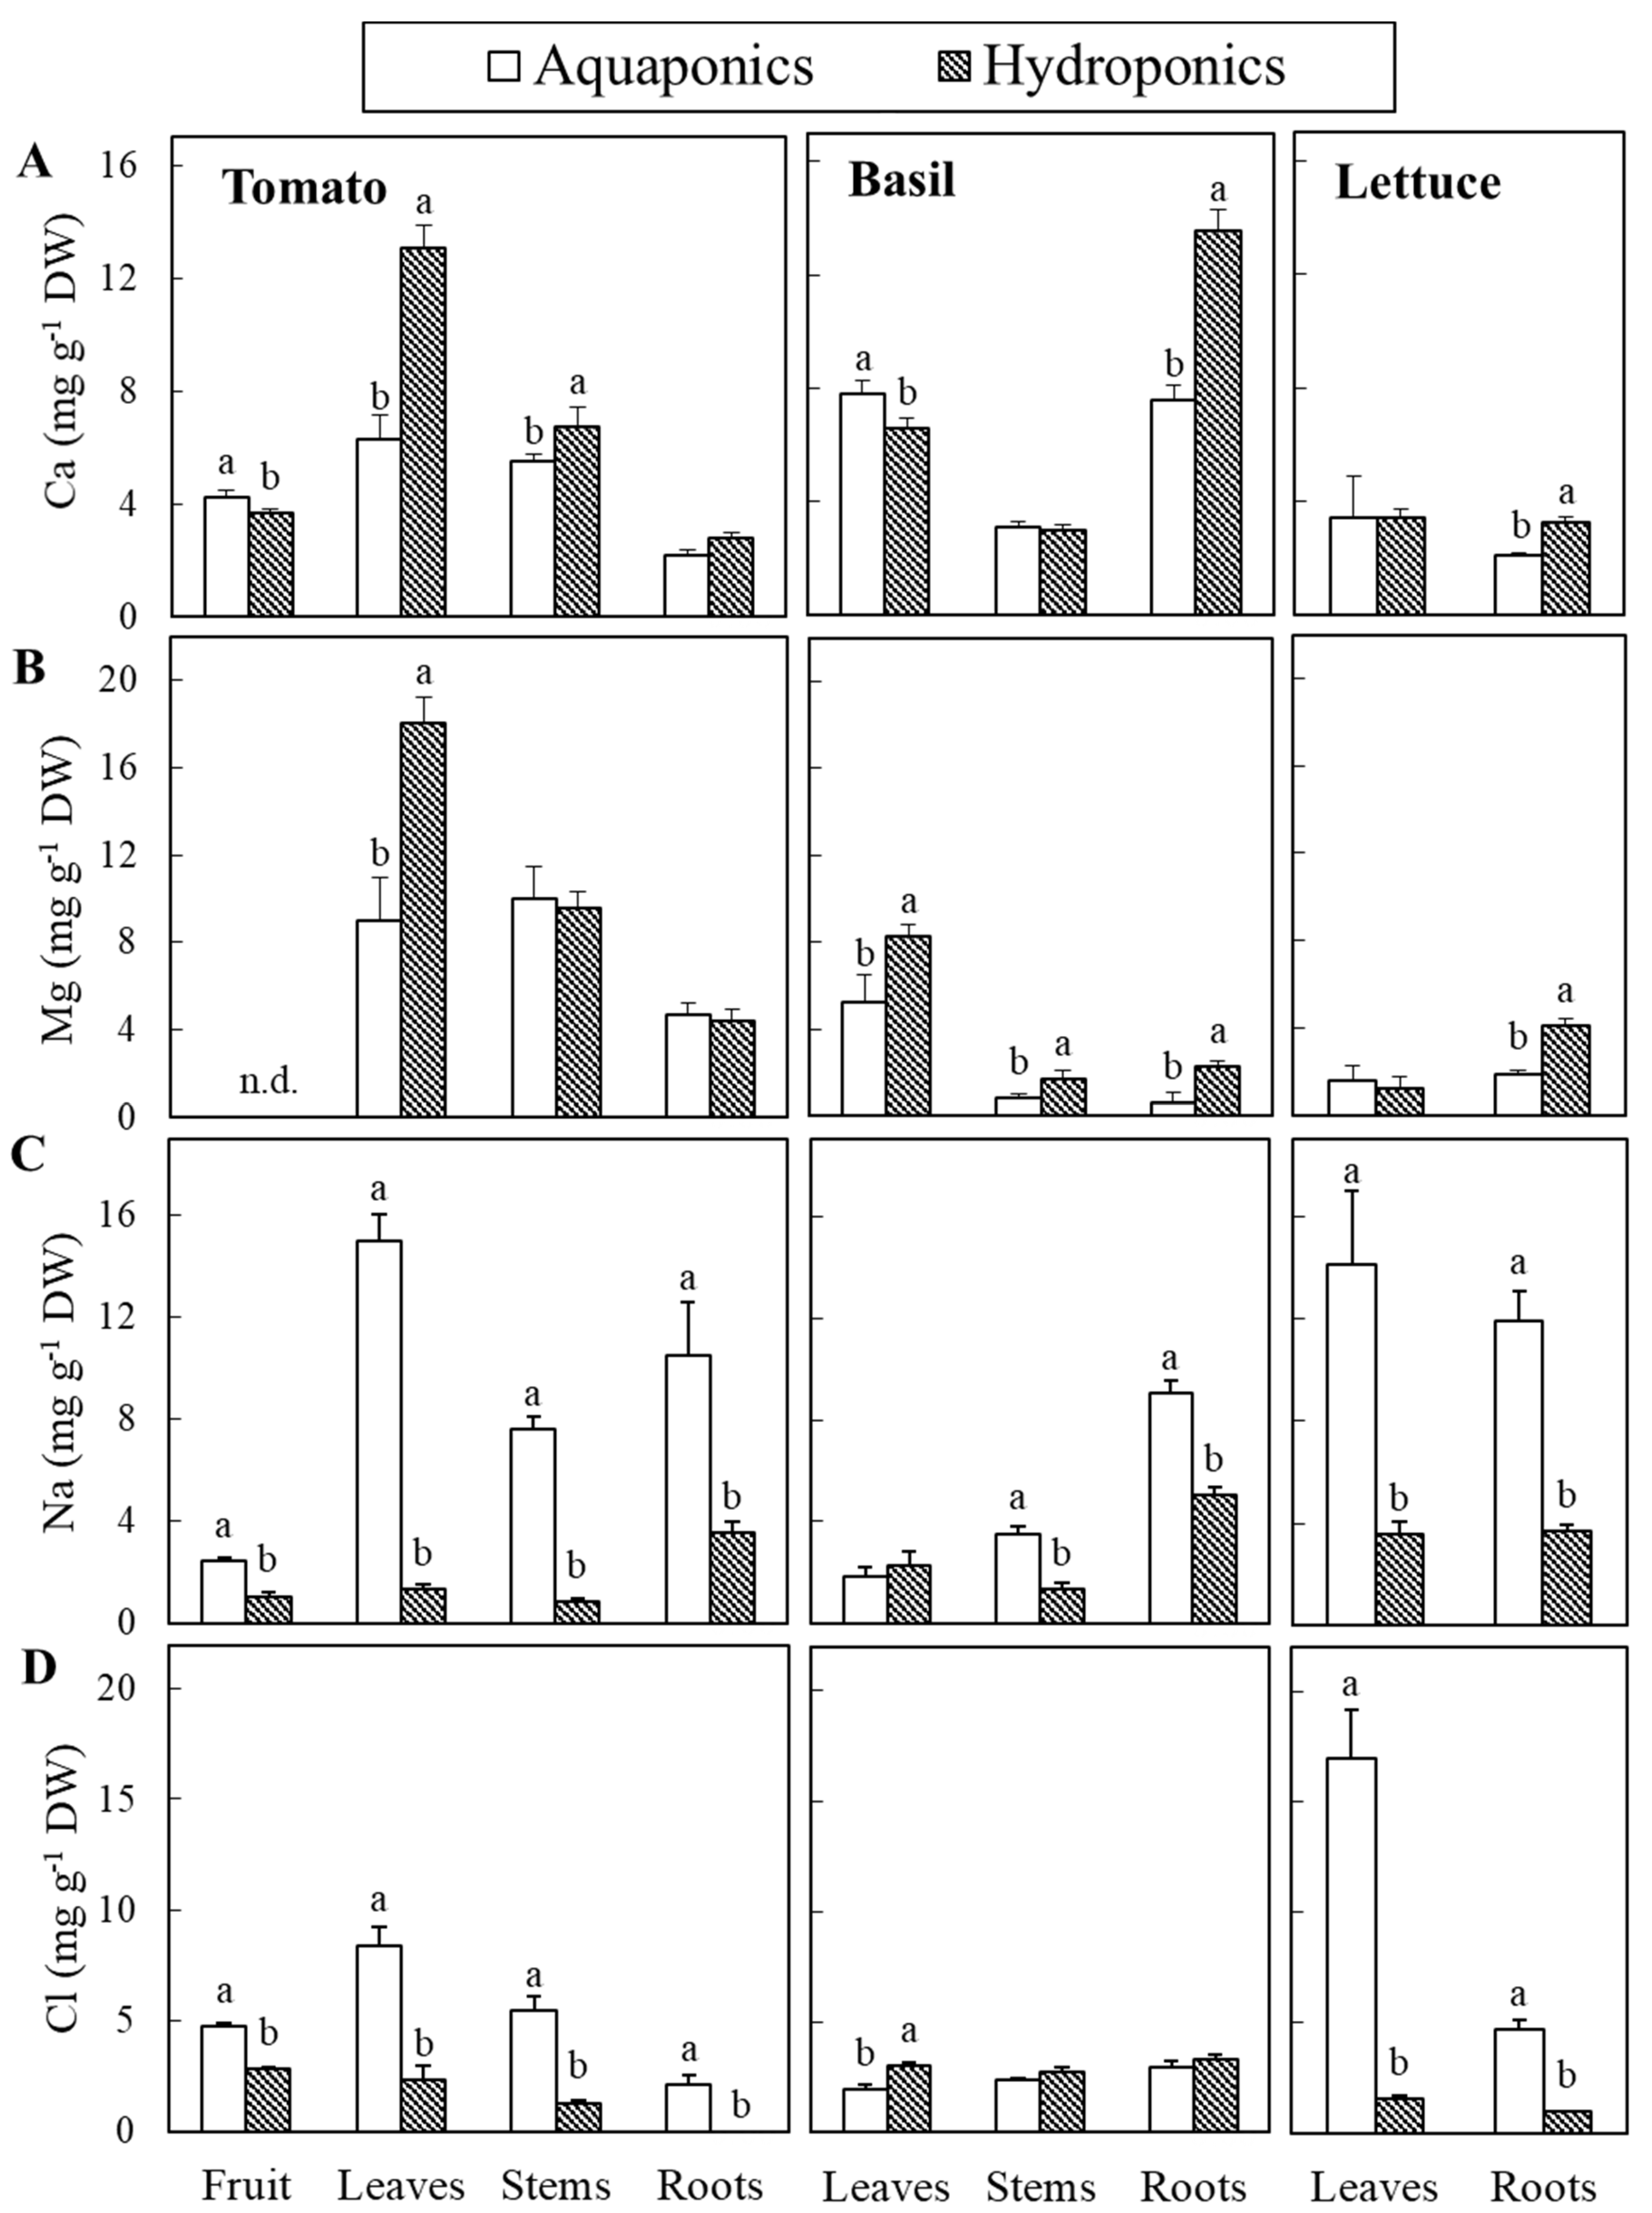
Table 1.
Composition and concentration of nutrient sources used in tomato-, basil-, and lettuce-based aquaponic and hydroponic systems.
Table 1.
Composition and concentration of nutrient sources used in tomato-, basil-, and lettuce-based aquaponic and hydroponic systems.
| Macronutrient | RO Water a (mg L−1) | Aquaponics | Hydroponics | ||||
|---|---|---|---|---|---|---|---|
| Daily Release Rate b (mg L−1) | Daily Replenishment Rate d (mg L−1 day−1) | Initial Concentration (mg L−1) | |||||
| Tomato | Basil | Lettuce | Tomato | Basil/Lettuce | |||
| NO3–N | 0.42 | 1.04 (1.6%) c | 9.29 | 5.00 | 4.52 | 178.7 | 161.4 |
| NO2–N | – | 0.13 (0.2%) | 0.37 | 0.16 | 0.14 | 7.1 | 5.1 |
| NH4–N | 0.02 | 0.40 (0.6%) | 1.15 | 0.44 | 0.39 | 22.2 | 14.1 |
| PO4–P | 0.44 | 2.41 (25.7%) | 4.92 | 2.80 | 2.53 | 94.6 | 90.2 |
| K | 0.34 | 0.82 (7.8%) | 8.41 | 5.59 | 5.05 | 161.7 | 180.3 |
| SO4–S | 1.24 | 15.7 (35.3%) | 21.5 | 14.6 | 13.2 | 413.1 | 471.7 |
| Ca | 2.45 | 0.20 (0.7%) | 5.39 | 3.53 | 3.19 | 103.7 | 113.9 |
| Mg | 0.59 | 0.02 (0.9%) | 1.38 | 0.90 | 0.81 | 26.6 | 29.0 |
| Na | 2.76 | 0.11 (0.4%) | – | – | – | – | – |
| Cl | 2.30 | 0.50 (2.2%) | – | – | – | – | – |
| EC (dS m−1) | 0.03 | 0.1 | 2.0 | 2.0 | |||
| pH | 7.3 | 6.9 | 6.0 | 6.0 | |||
Each value in the table is the mean of 15 replicates for aquaponics and 6 replicates for hydroponics. a Background nutrient concentrations contained in reverse osmosis (RO) water. b Nutrient concentrations (mg L−1 day−1) in the aquatic phase of an aquaponic system released daily when 1% fish feed (41% protein; 1.1% phosphorus) was applied to tilapia fish (average fish weight: 250 g; stocking density: 20 kg m−3). The nutrient release was monitored in the absence of plants, and the average daily release rate was presented here. c Daily nutrient release rate (%) from fish feed applied (100%). d Daily nutrient inputs estimated from the total amount of commercial fertilizer used in hydroponic nutrient solution for a 3-month production period.
Table 2.
Macro- and micronutrient compositions and concentrations used in aquaponic and hydroponic systems.
Table 2.
Macro- and micronutrient compositions and concentrations used in aquaponic and hydroponic systems.
| Parameter | Aquaponics a | Hydroponics b | |
|---|---|---|---|
| Tomato | Basil/Lettuce | ||
| Macronutrient (%) | |||
| Total nitrogen (N) | >6.88 | 0.044 | 0.043 |
| P2O5–P | >1.10 | 0.130 | 0.093 |
| K2O–K | 0.99 | 0.034 | 0.035 |
| SO4–S | 0.43 | – | – |
| Ca | 2.25–2.75 | 0.075 | 0.075 |
| Mg | 0.23 | 0.037 | 0.039 |
| Micronutrient (mg kg−1) | |||
| B | – | 2.75 | 2.00 |
| Cu | 10 | 0.95 | 1.05 |
| Fe | 40 | 10.00 | 21.00 |
| Mn | 80 | 8.00 | 1.90 |
| Mo | – | 0.40 | 0.42 |
| Zn | 153 | 2.70 | 2.10 |
Data obtained from the product description. “–” means not included or no related information. a Nutrient compositions of fish feed used in aquaponics were calculated based on g feed per day. b Nutrient compositions of fertilizer used in hydroponics were calculated based on 1:100 dilution of commercial fertilizer.
Table 3.
Average water quality parameters, fish biomass increment, and cumulative water use of tomato-, basil-, and lettuce-based aquaponic and hydroponic systems during a 3-month production.
Table 3.
Average water quality parameters, fish biomass increment, and cumulative water use of tomato-, basil-, and lettuce-based aquaponic and hydroponic systems during a 3-month production.
| Crop | Production System | DO (mg L−1) | Water Temperature (°C) | pH | EC (dS m−1) | Feed Conversion Ratio (FCR) | Fish Biomass Increment a (%) | pH Correction Solution (L) | Cumulative Water Use b (L) |
|---|---|---|---|---|---|---|---|---|---|
| Tomato | Aquaponics | 7.2 b | 26.9 b | 6.9 a | 0.54 c | 1.3 | 39 a | 5.92 b | 466 |
| Hydroponics | 9.4 a | 22.1 c | 5.8 b | 1.95 a | – | – | 0.50 c | 366 | |
| Basil | Aquaponics | 7.1 b | 26.6 b | 6.7 a | 0.84 b | 1.5 | 33 a | 4.44 b | 418 |
| Hydroponics | 9.3 a | 22.1 c | 5.8 b | 1.94 a | – | – | 0.36 c | 276 | |
| Lettuce | Aquaponics | 7.1 b | 27.5 a | 6.8 a | 0.92 b | 1.8 | 27 b | 8.86 a | 437 |
| Hydroponics | 9.3 a | 22.2 c | 5.8 b | 1.96 a | – | – | 0.40 c | 239 | |
| ANOVA | |||||||||
| System | *** | *** | *** | *** | – | – | – | * | |
| Crop | * | *** | * | * | * | * | *** | ns | |
| System × Crop | ns | *** | ** | * | – | – | – | ns | |
a Feed biomass increment calculated as wet weight gain (final weight − initial weight) × 100 over three months. b Average cumulative water use was calculated based on a 3-month study conducted at three different time blocks. Means within a column followed by the same letter are not significantly different based on Tukey’s honestly significant difference test (α = 0.05). Each value in the table is the mean of 3 replicates. ns, *, **, *** mean no significant or significant at p ≤ 0.05, 0.01, or 0.001, respectively. DO, dissolved oxygen; EC, electrical conductivity.
Table 4.
Growth and harvest parameters of tomato, basil, and lettuce grown in aquaponic and hydroponic systems.
Table 4.
Growth and harvest parameters of tomato, basil, and lettuce grown in aquaponic and hydroponic systems.
| Crop | Production System | Plant Height (cm) | Leaf Length (cm) | Leaf Number (plant−1) | SPAD | Time to Flowering (DAT) | Time to Harvest (DAT) | Fruit Number (plant−1) | Individual Fruit Fresh Mass (g fruit−1) |
|---|---|---|---|---|---|---|---|---|---|
| Tomato | Aquaponics | 87.2 b | 39.5 b | 21.0 c | 24.5 c | 27.5 b | 30.1 b | 61.4 | 19.2 |
| Hydroponics | 103.7 a | 46.3 a | 21.6 c | 38.6 a | 29.4 a | 32.3 a | 51.4 | 21.8 | |
| Basil | Aquaponics | 39.9 c | 11.4 d | 118.3 b | 23.2 c | – | – | – | – |
| Hydroponics | 49.8 c | 12.9 d | 140.7 a | 31.7 b | – | – | – | – | |
| Lettuce | Aquaponics | 16.3 d | 20.5 c | 16.7 c | 24.6 c | – | – | – | – |
| Hydroponics | 18.1 d | 22.1 c | 18.1c | 25.7 c | – | – | – | – | |
| ANOVA | |||||||||
| System | ns | * | ns | *** | – | – | – | – | |
| Crop | ** | *** | ns | *** | ** | ** | ns | ns | |
| System × Crop | *** | *** | *** | *** | – | – | – | – | |
Means within a column followed by the same letter are not significantly different based on Tukey’s honestly significant difference test (α = 0.05). Each value in the table is the mean of 9 replicates for tomato and basil and 27 replicates for lettuce. ns, *, **, *** mean no significant or significant at p ≤ 0.05, 0.01, or 0.001, respectively. SPAD (soil plant analysis development) indicates chlorophyll content or leaf greenness; DAT, days after transplant.
Table 5.
Crop fresh and dry mass of tomato, basil, and lettuce grown in aquaponic and hydroponic systems.
Table 5.
Crop fresh and dry mass of tomato, basil, and lettuce grown in aquaponic and hydroponic systems.
| Crop | Production System | Fresh Mass (g plant−1) | Dry Mass (g plant−1) | Root-to-Shoot Ratio a | ||||||
|---|---|---|---|---|---|---|---|---|---|---|
| Total | Shoots | Roots | Fruits | Total | Shoots | Roots | Fruits | |||
| Tomato | Aquaponics | 1318.5 b | 601.7 b | 316.9 a | 399.9 | 104.7 b | 66.2 b | 13.8 b | 24.8 | 0.18 ab |
| Hydroponics | 2032.8 a | 1300.7 a | 337.0 a | 395.1 | 179.5 a | 130.8 a | 23.2 a | 25.5 | 0.17 ab | |
| Basil | Aquaponics | 306.3 d | 213.9 de | 92.4 c | – | 29.8 d | 25.7 d | 4.1 d | – | 0.19 a |
| Hydroponics | 545.9 c | 385.2 c | 160.7 b | – | 52.4 c | 46.6 c | 5.8 c | – | 0.15 b | |
| Lettuce | Aquaponics | 181.0 d | 152.1 e | 29.0 d | – | 7.0 e | 5.8 e | 1.2 e | – | 0.21 a |
| Hydroponics | 263.5 d | 228.3 d | 35.2 d | – | 9.3 e | 8.2 e | 1.1 e | – | 0.14 b | |
| ANOVA | ||||||||||
| System | *** | *** | *** | ns | *** | *** | *** | ns | *** | |
| Crop | *** | *** | *** | – | *** | *** | *** | – | ns | |
| System × Crop | *** | *** | *** | – | *** | *** | *** | – | *** | |
a The ratios were calculated by g g−1 on a dry matter basis. Means within a column followed by the same letter are not significantly different based on Tukey’s honestly significant difference test (α = 0.05). Each value in the table is the mean of 9 replicates for tomato and basil and 27 replicates for lettuce. ns, *, **, *** mean no significant or significant at p ≤ 0.05, 0.01, or 0.001, respectively.
Table 6.
Yields of lettuce in aquaponics and hydroponics at three harvest times.
| Harvest Time | System | Marketable Yield (g plant−1) | Root Fresh Mass (g plant−1) | Total Yield (g plant−1) |
|---|---|---|---|---|
| First | Aquaponics | 89.7 c | 18.2 d | 107.9 c |
| Hydroponics | 210.3 a | 31.2 b | 241.5 a | |
| Second | Aquaponics | 97.1 c | 26.4 c | 123.5 c |
| Hydroponics | 148.4 b | 26.1 c | 174.5 b | |
| Third | Aquaponics | 177.3 b | 26.9 c | 204.2 b |
| Hydroponics | 233.6 a | 37.0 a | 270.6 a | |
| ANOVA | ||||
| System | *** | *** | *** | |
| Time | *** | *** | *** | |
| System × Time | ns | ns | ns | |
Means within a column followed by the same letter are not significantly different based on Tukey’s honestly significant difference test (α = 0.05). Each value in the table is the mean of 9 replicates for lettuce. ns, *, **, *** mean no significant or significant at p ≤ 0.05, 0.01, or 0.001, respectively.
Table 7.
Average mineral nutrient concentrations in the aquatic phase of tomato-, basil-, or lettuce-based aquaponic and hydroponic systems during a 3-month production period.
Table 7.
Average mineral nutrient concentrations in the aquatic phase of tomato-, basil-, or lettuce-based aquaponic and hydroponic systems during a 3-month production period.
| Crop | Production System | NO3–N | NO2–N | NH4–N | PO4–P | K | Ca | Mg | SO4–S | Na | Cl |
|---|---|---|---|---|---|---|---|---|---|---|---|
| (mg L−1) | |||||||||||
| Tomato | Aquaponics | 60.5 d | 0.8 a | 1.8 a | 30.1 c0 | 29.2 c | 12.1 d0 | 0.6 do | 218.1 b | 61.9 a | 0 c |
| Hydroponics | 207.9 a | 0.07 b | 0.4 bc | 122.8 ab | 334.0 a | 141.9 b0 | 39.4 ab | 627.5 a | 8.6 b | 0 c | |
| Basil | Aquaponics | 108.0 c | 0.9 a | 1.7 ab | 33.0 co | 82.3 b | 22.6 c0 | 1.9 co | 267.8 b | 76.7 a | 1.7 b |
| Hydroponics | 193.8 a | 0.1 b | 0.3 bc | 107.4 b | 326.8 a | 145.8 ab | 40.5 a | 674.5 a | 14.0 b | 0 c | |
| Lettuce | Aquaponics | 161.6 b | 0.8 a | 1.8 a | 27.1 c0 | 114.1 b | 20.4 c0 | 2.4 co | 235.8 b | 70.0 a | 11.2 a |
| Hydroponics | 198.6 a | 0.05 b | 0.2 c | 125.5 a0 | 339.0 a | 148.8 a0 | 39.0 b | 727.8 a | 10.7 b | 0 c | |
| ANOVA | |||||||||||
| System | *** | *** | *** | *** | *** | *** | *** | *** | *** | *** | |
| Crop | *** | ns | ns | ns | ns | *** | ** | ns | ns | *** | |
| System × Crop | *** | ns | ns | ** | ns | *** | *** | ns | ns | *** | |
| Aquaponics | 110.0 b | 0.8 a | 1.8 a | 30.1 b | 75.2 b | 18.4 b | 1.6 b | 242.3 b | 69.5 a | 4.3 a | |
| Hydroponics | 197.6 a | 0.1 b | 0.3 b | 118.6 a | 333.3 a | 145.5 a | 39.6 a | 676.6 a | 11.1 b | 0 b | |
| Cherry Tomato | 134.2 b | 0.5 | 1.6 | 76.5 | 181.6 | 75.6 | 20.0 | 376.6 | 35.2 | 0 b | |
| Basil | 150.9 ab | 0.5 | 1.6 | 70.2 | 204.5 | 81.5 | 20.4 | 403.4 | 45.3 | 0.9 b | |
| Lettuce | 176.0 a | 0.4 | 1.6 | 76.3 | 226.6 | 83.2 | 20.3 | 399.8 | 40.4 | 5.6 a | |
Means within a column followed by the same letter are not significantly different based on Tukey’s honestly significant difference test (α = 0.05). Each value in the table is the mean of 6 replicates. ns, *, **, *** mean no significant or significant at p ≤ 0.05, 0.01, or 0.001, respectively.
Table 8.
Mineral nutrient concentrations in tomato, basil, and lettuce grown in aquaponic and hydroponic systems.
Table 8.
Mineral nutrient concentrations in tomato, basil, and lettuce grown in aquaponic and hydroponic systems.
| Total N | Total P | K | Ca | Mg | SO4–S | Na | Cl | ||
|---|---|---|---|---|---|---|---|---|---|
| (mg g−1) | |||||||||
| Tomato | Aquaponics | 25.7 c | 15.6 c | 60.6 | 4.6 b | 5.9 ab | 1.2 b | 8.9 a | 5.6 b |
| Hydroponics | 33.0 b | 18.0 bc | 54.2 | 6.6 ab | 8.0 a | 6.1 b | 1.7 b | 2.5 c | |
| Basil | Aquaponics | 30.2 bc | 19.8 b | 53.1 | 6.2 ab | 2.2 b | 11.0 b | 4.8 b | 2.6 c |
| Hydroponics | 33.6 b | 19.9 b | 44.9 | 7.7 a | 4.1 ab | 38.2 a | 2.9 b | 3.2 bc | |
| Lettuce | Aquaponics | 42.7 a | 21.2 b | 66.7 | 3.5 b | 2.0 b | 0 b | 11.8 a | 10.8 a |
| Hydroponics | 45.3 a | 26.9 a | 69.3 | 3.4 b | 2.6 b | 0 b | 3.6 b | 1.3 c | |
| ANOVA | |||||||||
| System | * | ** | ns | ns | ns | ** | *** | *** | |
| Crop | *** | *** | * | *** | *** | *** | *** | *** | |
| System × Crop | ns | * | ns | ns | ns | ns | *** | *** | |
| Aquaponics | 31.1 b | 18.1 b | 59.5 | 4.9 b | 3.8 b | 6.9 b | 8.2 a | 5.7 a | |
| Hydroponics | 36.4 a | 20.8 a | 54.5 | 6.2 a | 5.5 a | 23.8 a | 2.5 b | 2.4 b | |
| Cherry Tomato | 29.3 b | 16.9 c | 57.4 ab | 5.6 a | 7.0 a | 9.9 b | 5.3 ab | 3.9 ab | |
| Basil | 32.2 b | 19.8 b | 49.0 b | 6.9 a | 3.1 b | 33.7 a | 3.8 b | 2.9 b | |
| Lettuce | 44.0 a | 24.6 a | 68.0 a | 3.4 b | 2.3 b | 0 b | 7.7 a | 6.1 a | |
Means within a column followed by the same letter are not significantly different based on Tukey’s honestly significant difference test (α = 0.05). Each value in the table is the mean of 6 replicates. ns, *, **, *** mean no significant or significant at p ≤ 0.05, 0.01, or 0.001, respectively.
Table 9.
Pearson’s correlation coefficients of nutrient (total N, Ca, and Mg) concentrations in the leaves of tomato, basil, and lettuce for SPAD value.
Table 9.
Pearson’s correlation coefficients of nutrient (total N, Ca, and Mg) concentrations in the leaves of tomato, basil, and lettuce for SPAD value.
| Treatment | Regression Coefficient | ||||
|---|---|---|---|---|---|
| Crop | Variables | Total N | Ca | Mg | SPAD |
| Tomato | Total N | — | |||
| Ca | 0.93 *** | — | |||
| Mg | 0.86 *** | 0.93 *** | — | ||
| SPAD | 0.82 *** | 0.78 ** | 0.65 * | — | |
| Basil | Total N | — | |||
| Ca | −0.19 ns | — | |||
| Mg | 0.55 ns a | −0.04 ns | — | ||
| SPAD | 0.80 ** | −0.54 ns | 0.48 ns a | — | |
| Lettuce | Total N | — | |||
| Ca | −0.22 ns | — | |||
| Mg | −0.22 ns | 0.84 *** | — | ||
| SPAD | 0.59 * | −0.51 ns | −0.31 ns | — | |
ns, *, **, *** mean no significant or significant at p < 0.05, 0.01, or 0.001, respectively. a Significant at p < 0.1.
© 2020 by the authors. Licensee MDPI, Basel, Switzerland. This article is an open access article distributed under the terms and conditions of the Creative Commons Attribution (CC BY) license (http://creativecommons.org/licenses/by/4.0/).
Share and Cite
MDPI and ACS Style
Yang, T.; Kim, H.-J. Characterizing Nutrient Composition and Concentration in Tomato-, Basil-, and Lettuce-Based Aquaponic and Hydroponic Systems. Water 2020, 12, 1259. https://doi.org/10.3390/w12051259
AMA Style
Yang T, Kim H-J. Characterizing Nutrient Composition and Concentration in Tomato-, Basil-, and Lettuce-Based Aquaponic and Hydroponic Systems. Water. 2020; 12(5):1259. https://doi.org/10.3390/w12051259
Chicago/Turabian StyleYang, Teng, and Hye-Ji Kim. 2020. "Characterizing Nutrient Composition and Concentration in Tomato-, Basil-, and Lettuce-Based Aquaponic and Hydroponic Systems" Water 12, no. 5: 1259. https://doi.org/10.3390/w12051259
Note that from the first issue of 2016, this journal uses article numbers instead of page numbers. See further details here.