Article

Addressing Pluvial Flash Flooding through Community-Based Collaborative Research in Tijuana, Mexico

1
Tijuana River National Estuarine Research Reserve, Imperial Beach, CA 91932, USA
2
UCI Blum Center for Poverty Alleviation, University of California Irvine, Irvine, CA 92697, USA
3
School of Social Ecology, University of California Irvine, Irvine, CA 92697, USA
4
Water UCI, University of California Irvine, Irvine, CA 92697, USA
5
Department of Civil and Environmental Engineering, University of California Irvine, Irvine, CA 92697, USA
6
Zeppelin Floods, Irvine, CA 92691, USA
7
GHD, San Diego, CA 92123, USA
8
California Immigrant Policy Center, Los Angeles, CA 90014, USA
9
Office of Sustainability, University of California Irvine, Irvine, CA 92697, USA
10
City and Regional Planning, Knowlton School of Architecture, Ohio State University, Columbus, OH 43210, USA
11
Department of Earth, Space and Environmental Sciences, Palomar College, San Marcos, CA 92069, USA
12
Department of Earth System Science, University of California Irvine, Irvine, CA 92697, USA
*
Author to whom correspondence should be addressed.
Water 2020, 12(5), 1257; https://doi.org/10.3390/w12051257
Submission received: 11 March 2020 / Revised: 14 April 2020 / Accepted: 16 April 2020 / Published: 28 April 2020
(This article belongs to the Special Issue Urban Water Policy and Flood Risk Communication)

Abstract

:
Pluvial flash flooding (PFF) is a growing hazard facing cities around the world as a result of rapid urbanization and more intense precipitation from global warming, particularly for low-resourced settings in developing countries. We present collaborative modeling (CM) as an iterative process to meet diverse decision-making needs related to PFF through the co-production of flood hazard models and maps. CM resulted in a set of flood hazard maps accessible through an online viewer that end-users found useful and useable for understanding PFF threats, including debris blockages and barriers to mobility and evacuation. End-users of information included individuals concerned with general flood awareness and preparedness, and involved in infrastructure and emergency management, planning, and policy. CM also showed that rain-on-grid hydrodynamic modeling is needed to depict PFF threats in ways that are intuitive to end-users. These outcomes evidence the importance and transferability of public health rationale for community-based research and principles used here including recognizing community as a unit of identity, building on strengths of the community, and integrating knowledge for the benefit of all partners.

1. Introduction

Flooding is a growing challenge around the world [1]. Over the last decade, flooding has accounted for nearly half of all weather-related disasters and affected 2.3 billion people, with Asia and Africa being impacted more than other continents [2]. Di Baldassarre et al. [3] note an order-of-magnitude increase in flood fatalities in Africa between 1950–2010, which points to an important difference from developed countries where trends in flooding are marked by an escalation of flood damages [1,4,5,6]. Beyond threats to life and property, floods pose increased risks of water-borne and vector-borne diseases, mental health disorders, and exposure to toxins [7,8,9].
The impacts of flooding are frequently concentrated in cities [6]. This is mainly attributed to: (a) rapid urban growth over the past two decades leading to more than four billion people (and roughly half of the world’s population) living in cities [10,11,12], (b) the proliferation of impervious surfaces which negatively alters hydrologic regimes [6,13,14], and (c) heightened vulnerabilities of affected communities [15]. Increasing future impacts to coastal cities from the combined effects of urbanization and sea level rise has been well-documented [5,16,17]. However, an emerging challenge is pluvial flash flooding (PFF)—flooding and erosion within cities caused by intense rainfall and runoff that will strengthen in a warming climate that sustains more intense precipitation [18,19,20,21]. PFF is fast-moving—developing over a matter of hours, causing localized damages, disrupting transportation and business activity, and posing threats to public health and safety [19,21]. Low-resourced settings are particularly vulnerable to PFF because urban growth has outpaced the capacity of cities to provide adequate services for citizens, including the management of environmental hazards [10]. Another key issue is that low-resourced communities are often excluded from decision-making processes to prepare for and avert or mitigate flooding [22]. This issue connects to a larger problem: scientific knowledge about flood hazards and vulnerabilities is often not effectively translated into information that is useful for decision-making [23].
Flood simulation technology has now matured to the point where a broad audience can intuitively visualize flooding in relation to familiar reference points and immediately grasp important implications [24,25,26,27]. However, making visualizations useful for decision-making related to flooding requires an iterative process in which modeling experts and end-users of flood visualizations interact [28,29,30,31,32,33,34]. Historically, flood hazard models and maps have been developed iteratively by engineers in consultation with stakeholders—for example, gathering data about the site, building preliminary models, and making improvements over time based on available data and feedback [35]. However, the extent of consultation with stakeholders is highly varied, and increasingly, engineers may work in isolation from the site that they model and never interact with the end-users of the model [36].
Collaborative modeling (CM) of flooding has emerged as a promising, participatory approach to iteratively develop actionable flood hazard information [31,33]. CM is an iterative process whereby engineers and social scientists simultaneously advance flood hazard models and engage end-users to meet decision-making needs related to flooding, and its application in the U.S. has demonstrated the potential to increase awareness about flood hazards, minimize differences in flood perceptions across sub-groups of the community, and meet the diverse needs for decision-making related to flooding [33,37]. With human populations increasingly living in cities [11,37] and exposed to safety and health risks from PFF [18,21], this paper addresses the potential for CM to build flood resilience and reduce the risks of PFF. CM is a deliberate choice—a normative view—among researchers to co-produce knowledge because the process (1) promotes the inclusion of different perspectives and (2) increases knowledge uses in decision-making [38]. There are many examples of community-based research from numerous disciplines, raising questions about the best CM paradigm for addressing PFF. Here, we draw from the public health field given its rationale—maximum adoption and impact [39]. Moreover, given limited examples of community-based research in the engineering field of flood hazard mapping and the public health implications of flooding in this region, the research objectives were to: (1) understand if the public health rationale for community-based research was transferable to flood hazard mapping and (2) develop flood hazard maps that meet decision-making needs related to PFF.
To pursue these objectives, CM was applied in a low-resourced community in North America—Los Laureles Canyon (LLC) in Tijuana, Baja California (B.C.), Mexico—by an interdisciplinary research team as part of the Flood Resilient Infrastructure and Sustainable Environments (FloodRISE) project funded by the National Science Foundation. LLC is an area of informal development along the United States (U.S.)-Mexico border with steep hillsides that experiences significant erosion during intense rainfall and where high concentrations of pathogenic organisms are present in runoff from sewage contamination [40,41]. Moreover, housing on unstable hillsides is particularly vulnerable to health and safety risks from intense rainfall [42]. We find that, with the application of CM and the dissemination of co-generated flood risk maps using an online GIS interface, PFF flood hazards can be communicated in tractable, user-friendly ways that catalyze efforts to reduce vulnerabilities and, in turn, risks. Indeed, we find that CM presents new opportunities to enhance many aspects of PFF management, including planning, preparedness, mitigation, early warning, emergency response, and recovery.

2. Methods

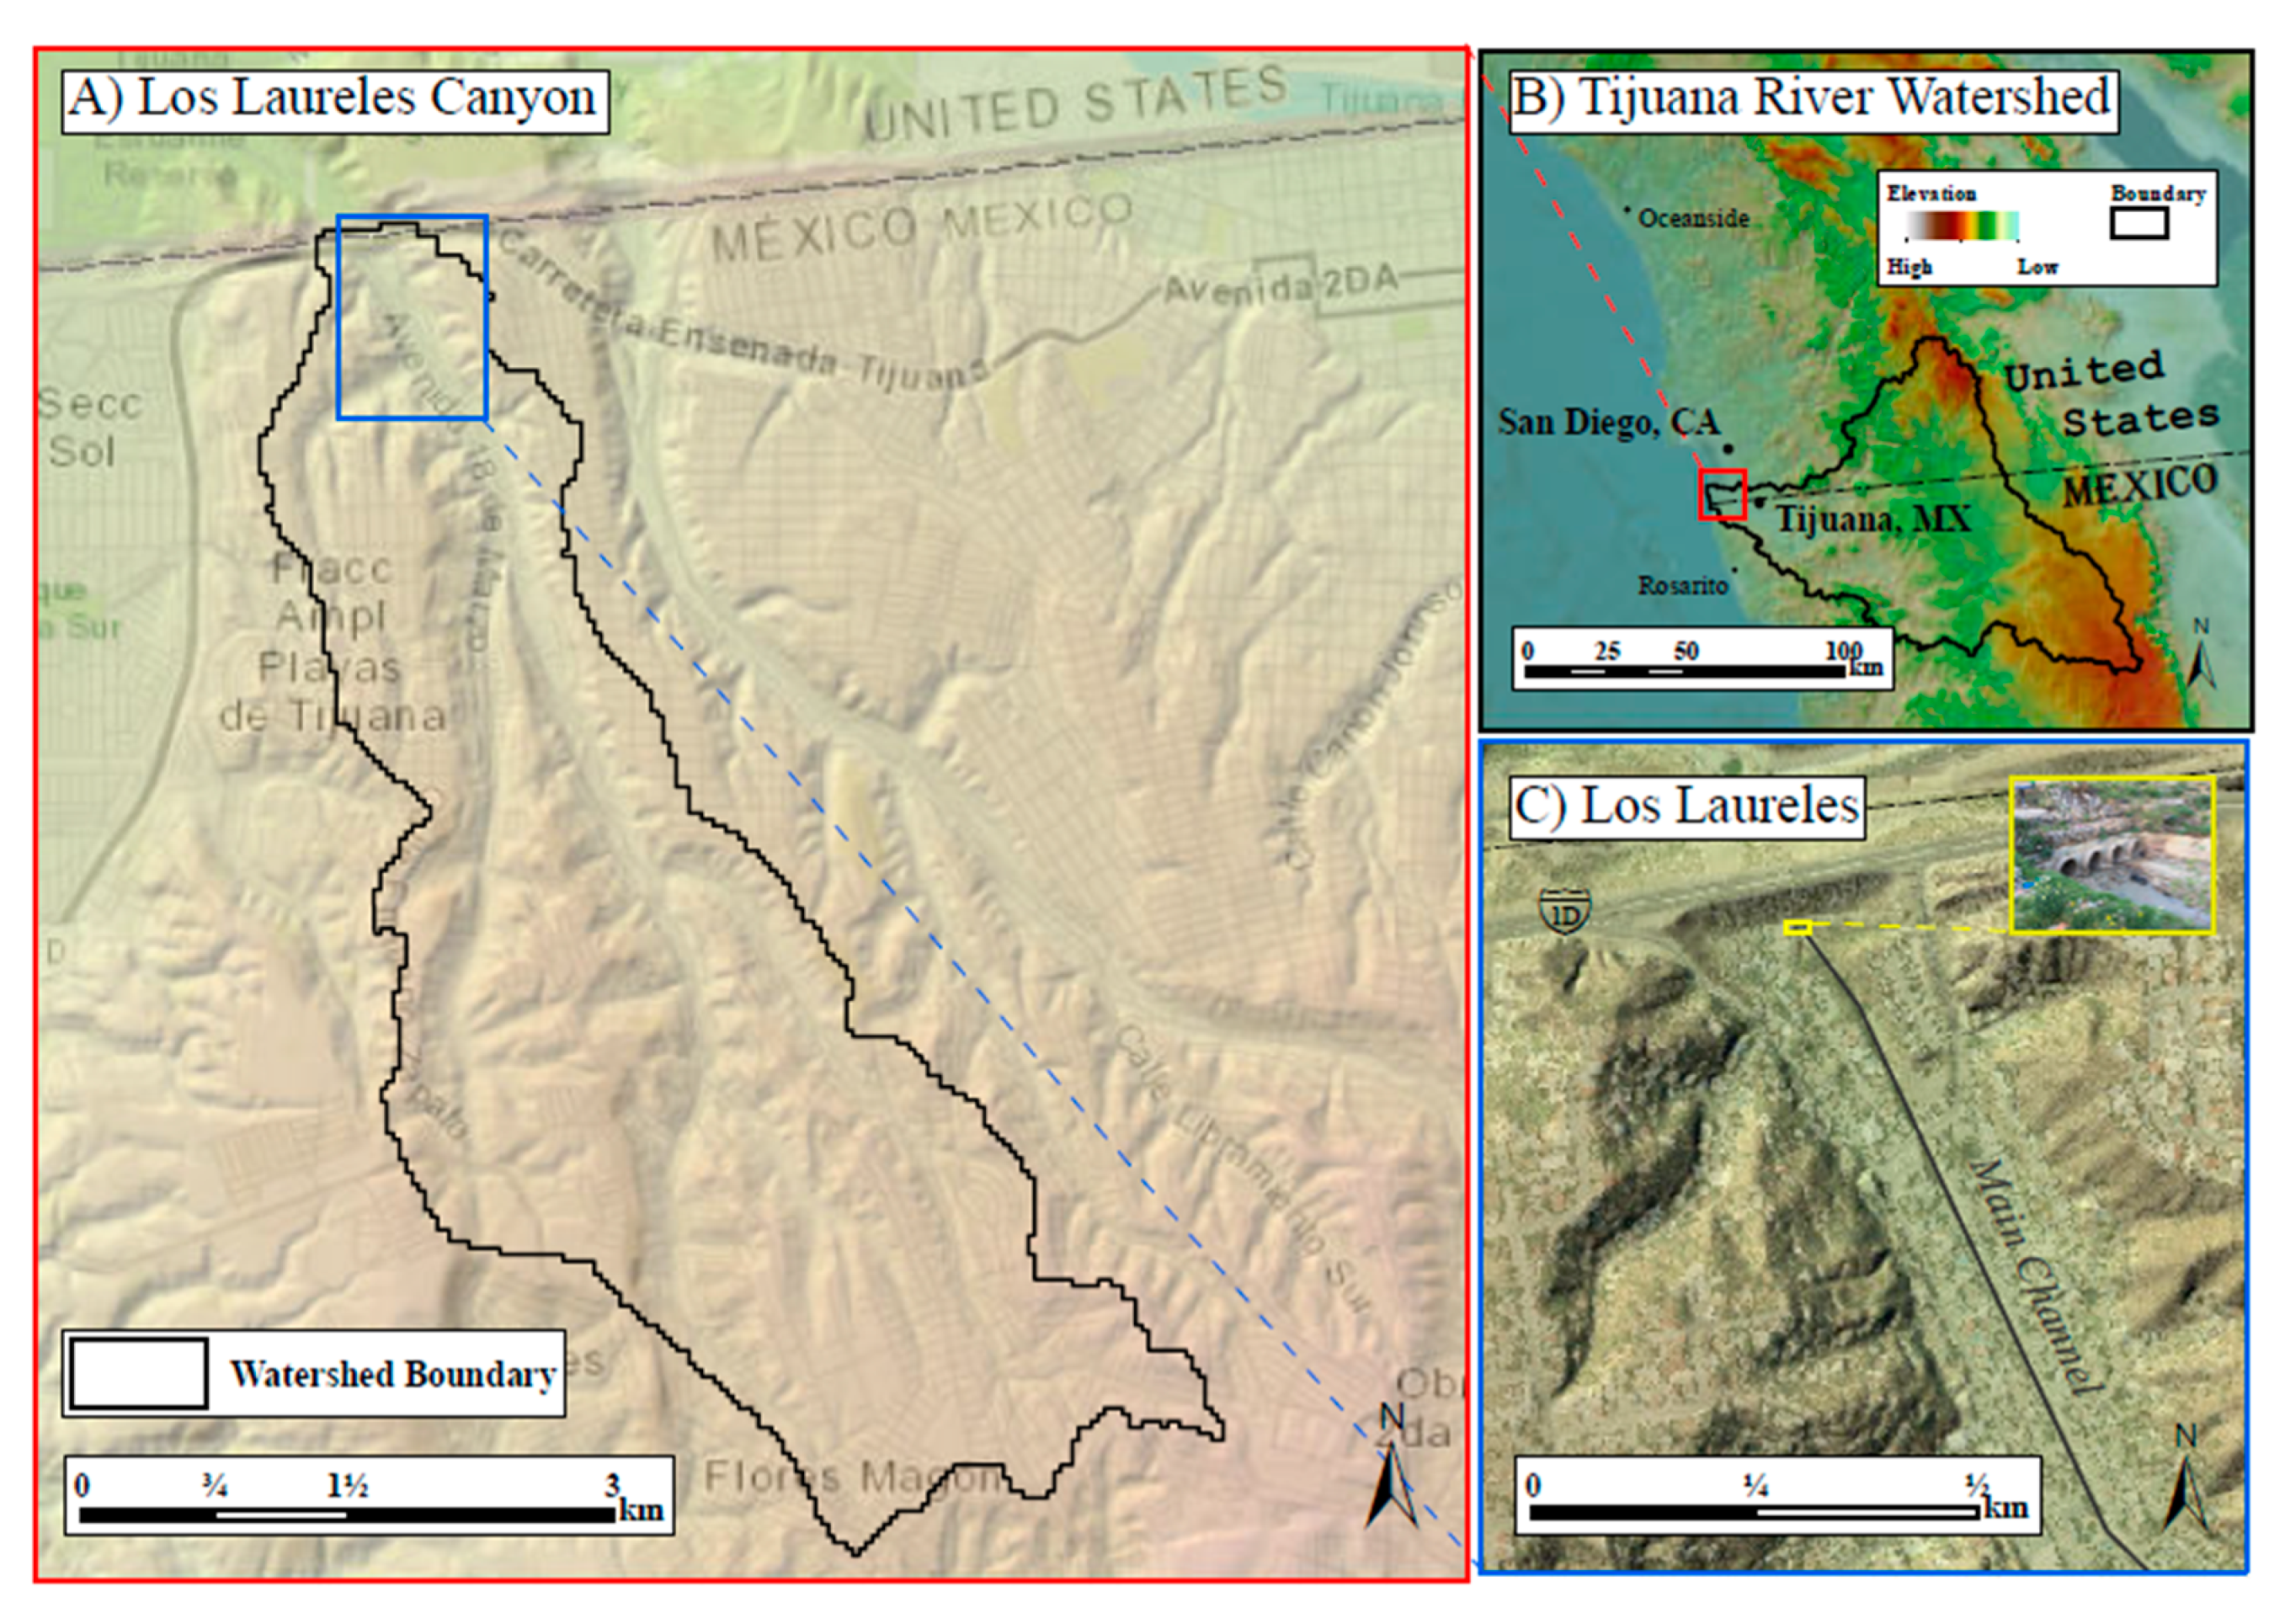
2.1. Site Description

Tijuana is the largest city in Baja California, Mexico, with a reported population of 1,641,570 as of 2015 [43]. Geographically connected to San Diego, California, the city serves as an important industrial and financial center of Mexico, and approximately 90,000 people cross the border northbound into the U.S. each day at the San Ysidro Land Port of Entry [44]. Tijuana experiences a warm, dry summer and a cool, wet winter. Average high/low temperatures for January and July are 23/18 °C and 18/8 °C, respectively, and the average annual precipitation is 27 cm [45]. The Tijuana River drains a 1380 km2 watershed that is approximately 75% in Mexico and discharges to the Pacific Ocean just north of the U.S. border in Imperial Beach, California. Tijuana has experienced fluvial flooding on several occasions prior to the construction of an upstream reservoir and channelization of the Tijuana River through the city and across the U.S. border. Within the city, communities remain vulnerable to PFF and hillslope erosion, especially in canyon areas. LLC, located in the Northwestern part of the city, is one such area that is the focus of this study. LLC is a 10.5-km2 relatively long and narrow catchment that drains north towards the U.S. border and into the Tijuana River Valley, as shown in Figure 1. LLC is primarily a residential community of informal development in a steep canyon terrain with inadequate drainage, sanitation infrastructure, and soil conservation practices. During storms, slope instability and structural failure is common, drainage channels can be blocked by eroding sediment and debris, and sewage is mobilized and transported across the U.S. border and into the Pacific Ocean, where it causes water quality and public health problems. The northern border and outlet of LLC is marked by a roadway embankment approximately 22.5-m-high with a culvert consisting of five stormwater pipes, which are undersized for the 100-year flood discharge and are prone to blockage by debris (Figure 1C). Historically, one such blockage event occurred, resulting in the inundation of many homes and concern about a possible embankment failure, which would have sent a dam-break flood of contaminated water into the Tijuana River Valley; however, the risk of failure passed after the flood peak subsided.

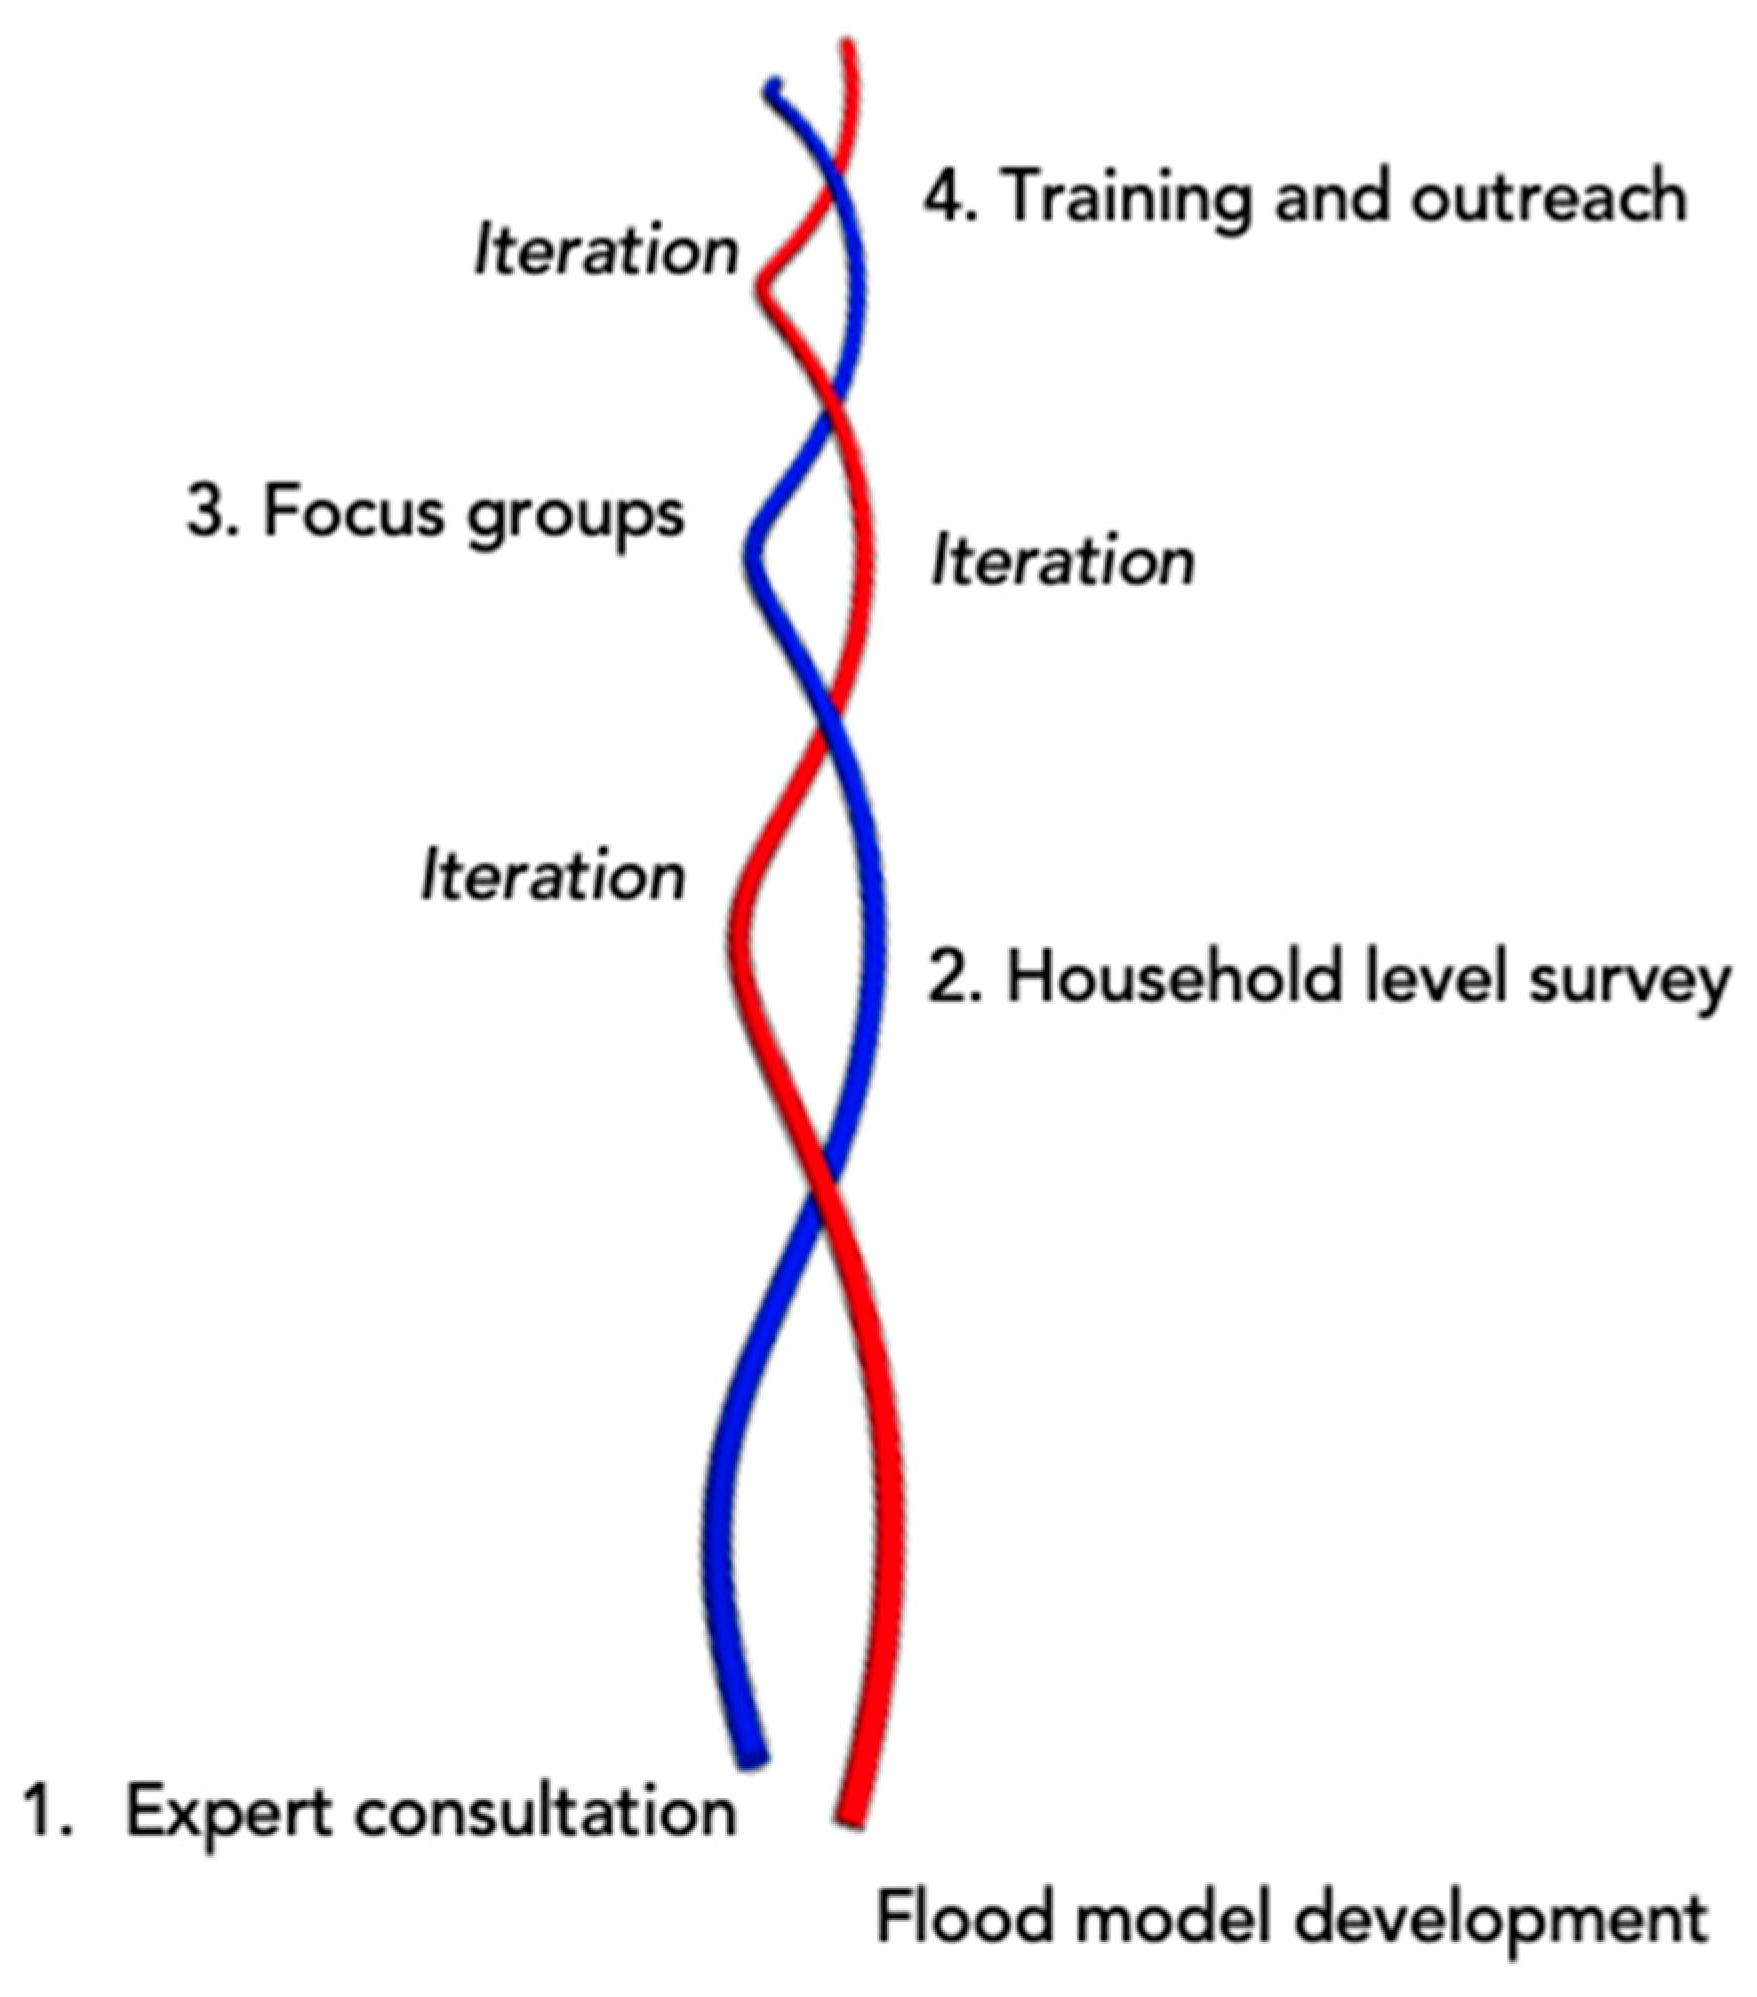
2.2. Collaborative Modeling Process

Successful integration of community needs, research, and education through co-production is no small endeavor, despite the evidence that it increases the likelihood that knowledge will be used in decision-making [38]. Costs are high, time investment is great, constant requests for participation among end-users can lead to fatigue, and “close interaction may be taxing or intimidating for both scientists and stakeholders, who may feel they do not have the training, personal inclination, understanding of each other’s contexts, or organizational support to participate in co-production” ([38], p. 722).
To overcome these obstacles to engaging in a collaborative process related to increasing resilience to flood hazards in LLC, the project team assembled a Research Integration and Impact Team (RIIT) to engage with students, researchers, and communities through careful process design. The CM process was designed using public health principles of and rationale for community-based and participatory research outlined by Israel et al. [39] and Meyer et al. [32]. In their assessment of improving partnership approaches, Israel et al. [39] identify seven key principles: (1) recognize the community as a unit of identity, (2) build on strengths and resources in the community, (3) facilitate collaborative partnerships, (4) integrate knowledge and action for mutual benefit of all parties, (5) promote a co-learning and empowering process that attends to social inequalities, (6) involve a cyclical and iterative process, and 7) disseminate knowledge gained to all partners.
Three of the Israel et al. [39] principles were most instrumental in guiding the development of the CM approach and focus on four stages of end-user interactions and implementations by the RIIT team:
  • Recognize community as a unit of identity: FloodRISE focused its research in communities vulnerable to flooding and included individuals in decision-making roles within LLC as a unit of identity.
  • Build on strengths and resources within the community: Communities of identity contain many individual and organizational resources but may also benefit from skills and resources available from outside of the immediate community of identity [39]. The FloodRISE project team included practitioners at the Tijuana River National Estuarine Research Reserve (TRNERR), individuals who were not necessarily members of the community of identity (LLC). These practitioners provided the partnership structure through their organization to help convene and, in some cases, span boundaries (i.e., a boundary-spanning organization) by operating at the “skin” of their organization interpreting research goals to the community and vice versa, focusing on creating a process that increased the community’s influence in the research, as well as its members’ participation [39,46].
  • Integrate knowledge and action for mutual benefit of all partners: FloodRISE researchers gathered information to inform the development of flood models with the potential to ultimately improve flood resilience and benefit community members of LLC. However, researchers can also gain from community-based projects, including publications, promotions, prestige, and grant funding [47]. While researchers may encounter unique challenges with engaging in community-based research, it is important to note that communities engaged in the research shoulder many burdens, such as (often unpaid) time investment and knowledge sharing. This must be weighed against the benefits the research may bring.
With regard to the development of flood risk management tools, previous research has clearly demonstrated that involving end-users leads to better outcomes because of the importance of including local knowledge, values, and challenges [30,48,49,50]. In our study, end-users refer to community members and authorities in a flood zone with governance, management, planning, design, and/or operations responsibilities. End-users may include residents, businesses, developers, planners, regulators, resource managers, emergency management and public works personnel, and non-governmental organizations. It is important to not only include constituents whose behavior and actions in preparedness, mitigation, and response will influence the outcome of flood events but also those with local knowledge and experience about flooding in the community who are aware of site-specific hazards and vulnerabilities.
Additionally, Meyer et al. [32] describe the development of flood maps in Europe through participatory processes and distinguish between substantive and instrumental rationales when designing participatory processes. The substantive rationale aims to increase the depth and breadth of knowledge that contributes to decisions, while the instrumental rationale emphasizes building trust among end-users and raising awareness and motivation to take action. The FloodRISE approach incorporated both of these rationales. Specifically, the FloodRISE approach consists of four stages of end-user interactions (Figure 2), and model development and iterations (based on end-user interactions) were planned and implemented by an interdisciplinary research team comprised of engineers and social scientists:
  • Expert consultation,
  • Household-level surveys,
  • Focus group meetings with end-users, and
  • Training sessions and outreach with end-users.

2.2.1. Expert Consultation

There were two main goals of expert consultation, the first phase of end-user interaction to: (1) understand what had been done in the past, what the important issues were from the locals’ perspective, and how modeling tools and academic domain knowledge could contribute to the on-going work and (2) build interest in the project among end-users and a spirit of cooperation that is needed for successful outcomes.
To pursue these goals, partners at TRNERR were engaged as members of the research team and acted as liaisons by establishing opportunities for engagement with key contacts in government agencies, including the International Boundary and Water Commission, Protecciόn Civil (safety and weather agency in Tijuana, Mexico), and IMPLAN (planning authority in Tijuana, Mexico), as well as researchers from San Diego State University (SDSU) and El Colegio de la Frontera Norte (COLEF). TRNERR personnel provided a tour of the sites to FloodRISE engineering researchers and shared available data, including recent aerial lidar data and orthoimagery covering both sides of the U.S.–Mexico border. Additionally, SDSU personnel shared valuable data characterizing the geometry of drainage channels.

2.2.2. Household-Level Surveys

Household-level surveys were conducted to measure household perceptions of flood risks (including spatial risk perceptions), the alignment between perceived risks and actual risks, perspectives on flood experience and preparedness, and the potential usefulness of mapped flood risk information for the community. Understanding spatial risk perception is important, not only because of the potential for highly localized flood hazards in the LLC, but because most previous studies generally ask participants to rate the flood risk of their home or community without much spatial specificity [51]). An in-person survey approach was conducted with a sample of households in the LLC. The survey was designed using methods described in Dillman, Smyth, and Christian [52] and conducted by field interviewers recruited and trained specifically for this research. The questionnaire used in the survey was first developed and utilized at a companion site in the U.S., Newport Beach, California [27,33,53], and for this study, the survey was translated into Spanish by a native speaker and was piloted with a sample of the study population [54].

2.2.3. Focus Group Meetings with End-Users

Focus group meetings with end-users were completed to understand the decision-making needs of several groups of end-users within the community: city planners and public works personnel, emergency responders, and community members/non-governmental organizations (NGOs). Luke et al. [31] provide a detailed description of methods and results, and thus, only a synopsis is presented here. The LLC focus groups included a total of 24 participants, with 6 representing governments (planning and public works), 11 representing emergency managers, and 7 representing non-governmental organizations or other community members. Participants were recruited through personal communication and snowball sampling. Each focus group meeting lasted 2.5-h, during which a facilitator elicited information regarding the group’s perceptions of the flood hazard maps. A large-format hardcopy version of each map was distributed to all participants, along with a glossary of terminology. After the participants individually examined each map, the facilitator would ask the modeler who produced the map to explain the map in order to establish a common understanding. Participants were able to ask the modeler questions, while the facilitator would pose prompts to assess understanding. Data were generated from focus groups by the facilitator adhering to a script with questions specific to each baseline hazard map. Data were collected from the focus groups through audio recordings and subsequent transcriptions of all conversation. Furthermore, transcripts were supplemented with hand-written observation notes. After a presentation of all maps, survey data were collected from focus group participants. The surveys gathered information that could be used to improve flood visualizations and reflect alternative cartographic preferences and model scenarios. Participant preferences for different maps were also measured.

2.2.4. Training Sessions and Outreach with End-Users

Through the three rounds of end-user interactions described above, flood models and visualizations were iteratively developed before being uploaded into an online, interactive system for public access. This system was subsequently used in training sessions and outreach with end-users. In the training sessions, held in a computer laboratory, government officials with wide-ranging flood management responsibilities and academics were present and were guided through a tutorial on how to use the online GIS map interface. Participants practiced accessing different maps representing different scenarios, panning and zooming within different areas, and identifying conditions of site locations (such as a street address). Participants also expressed the desire to learn specific ways to operationalize use of the system and develop strategies to expand the system to other parts of the city.

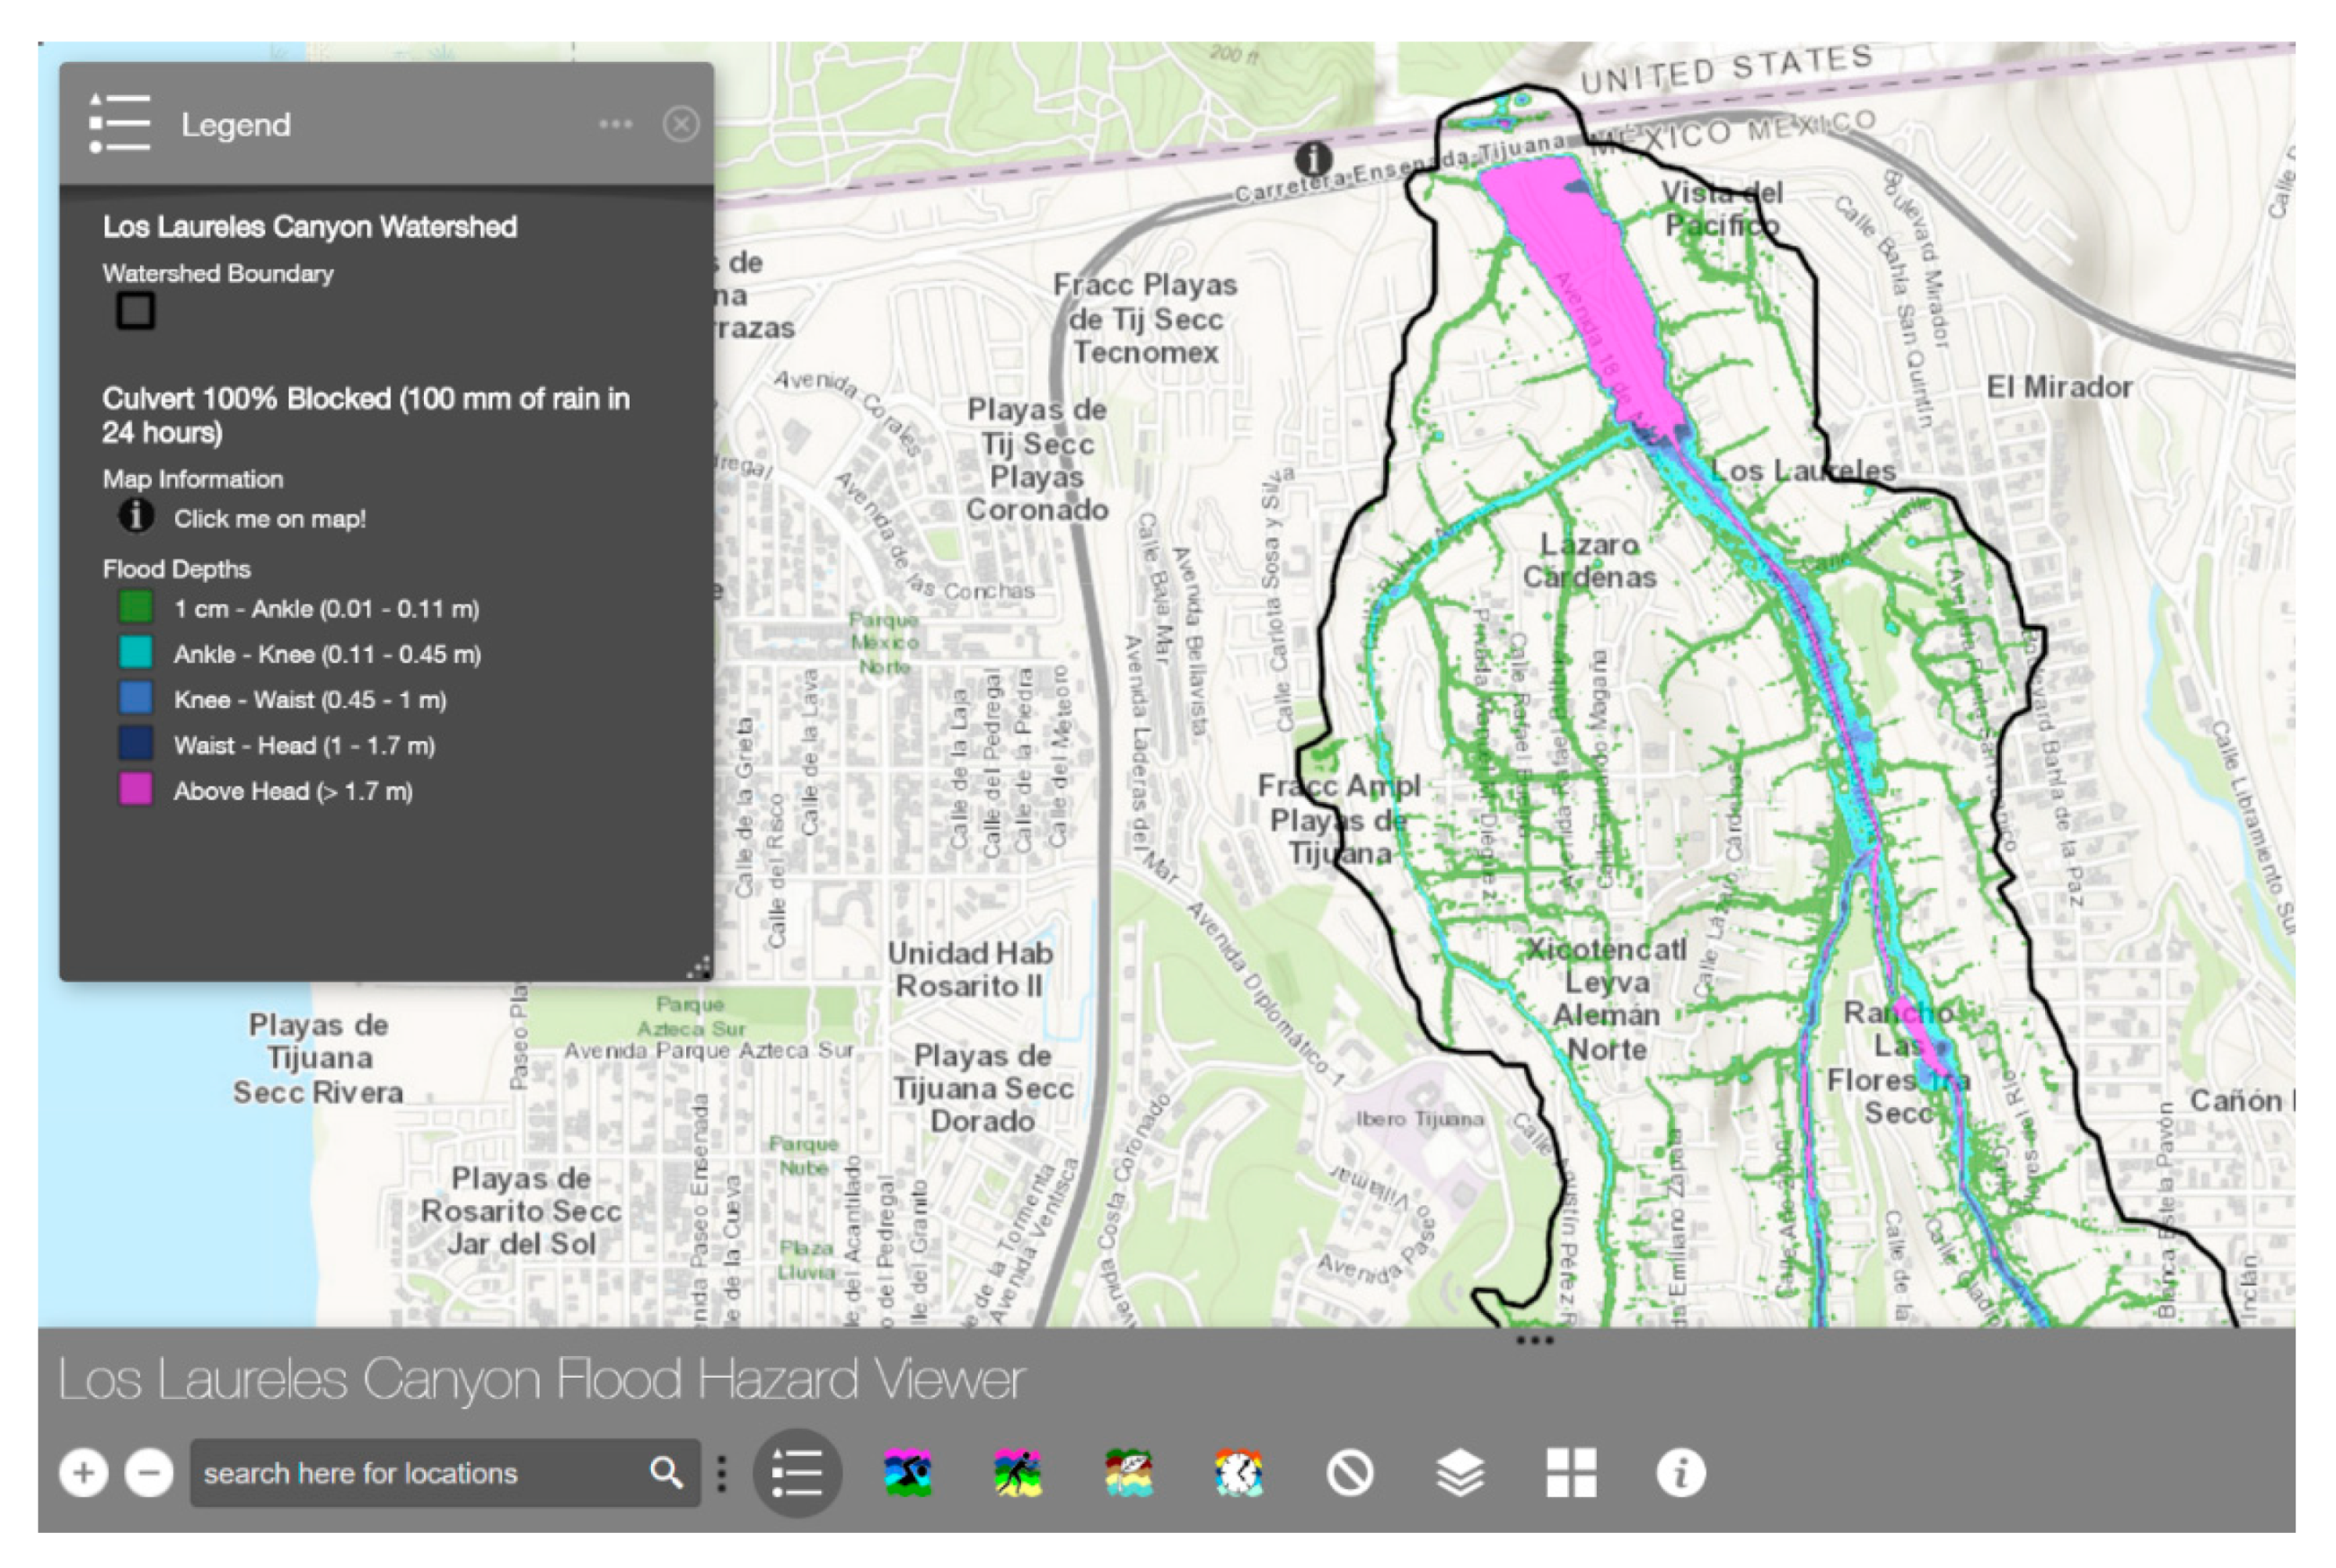
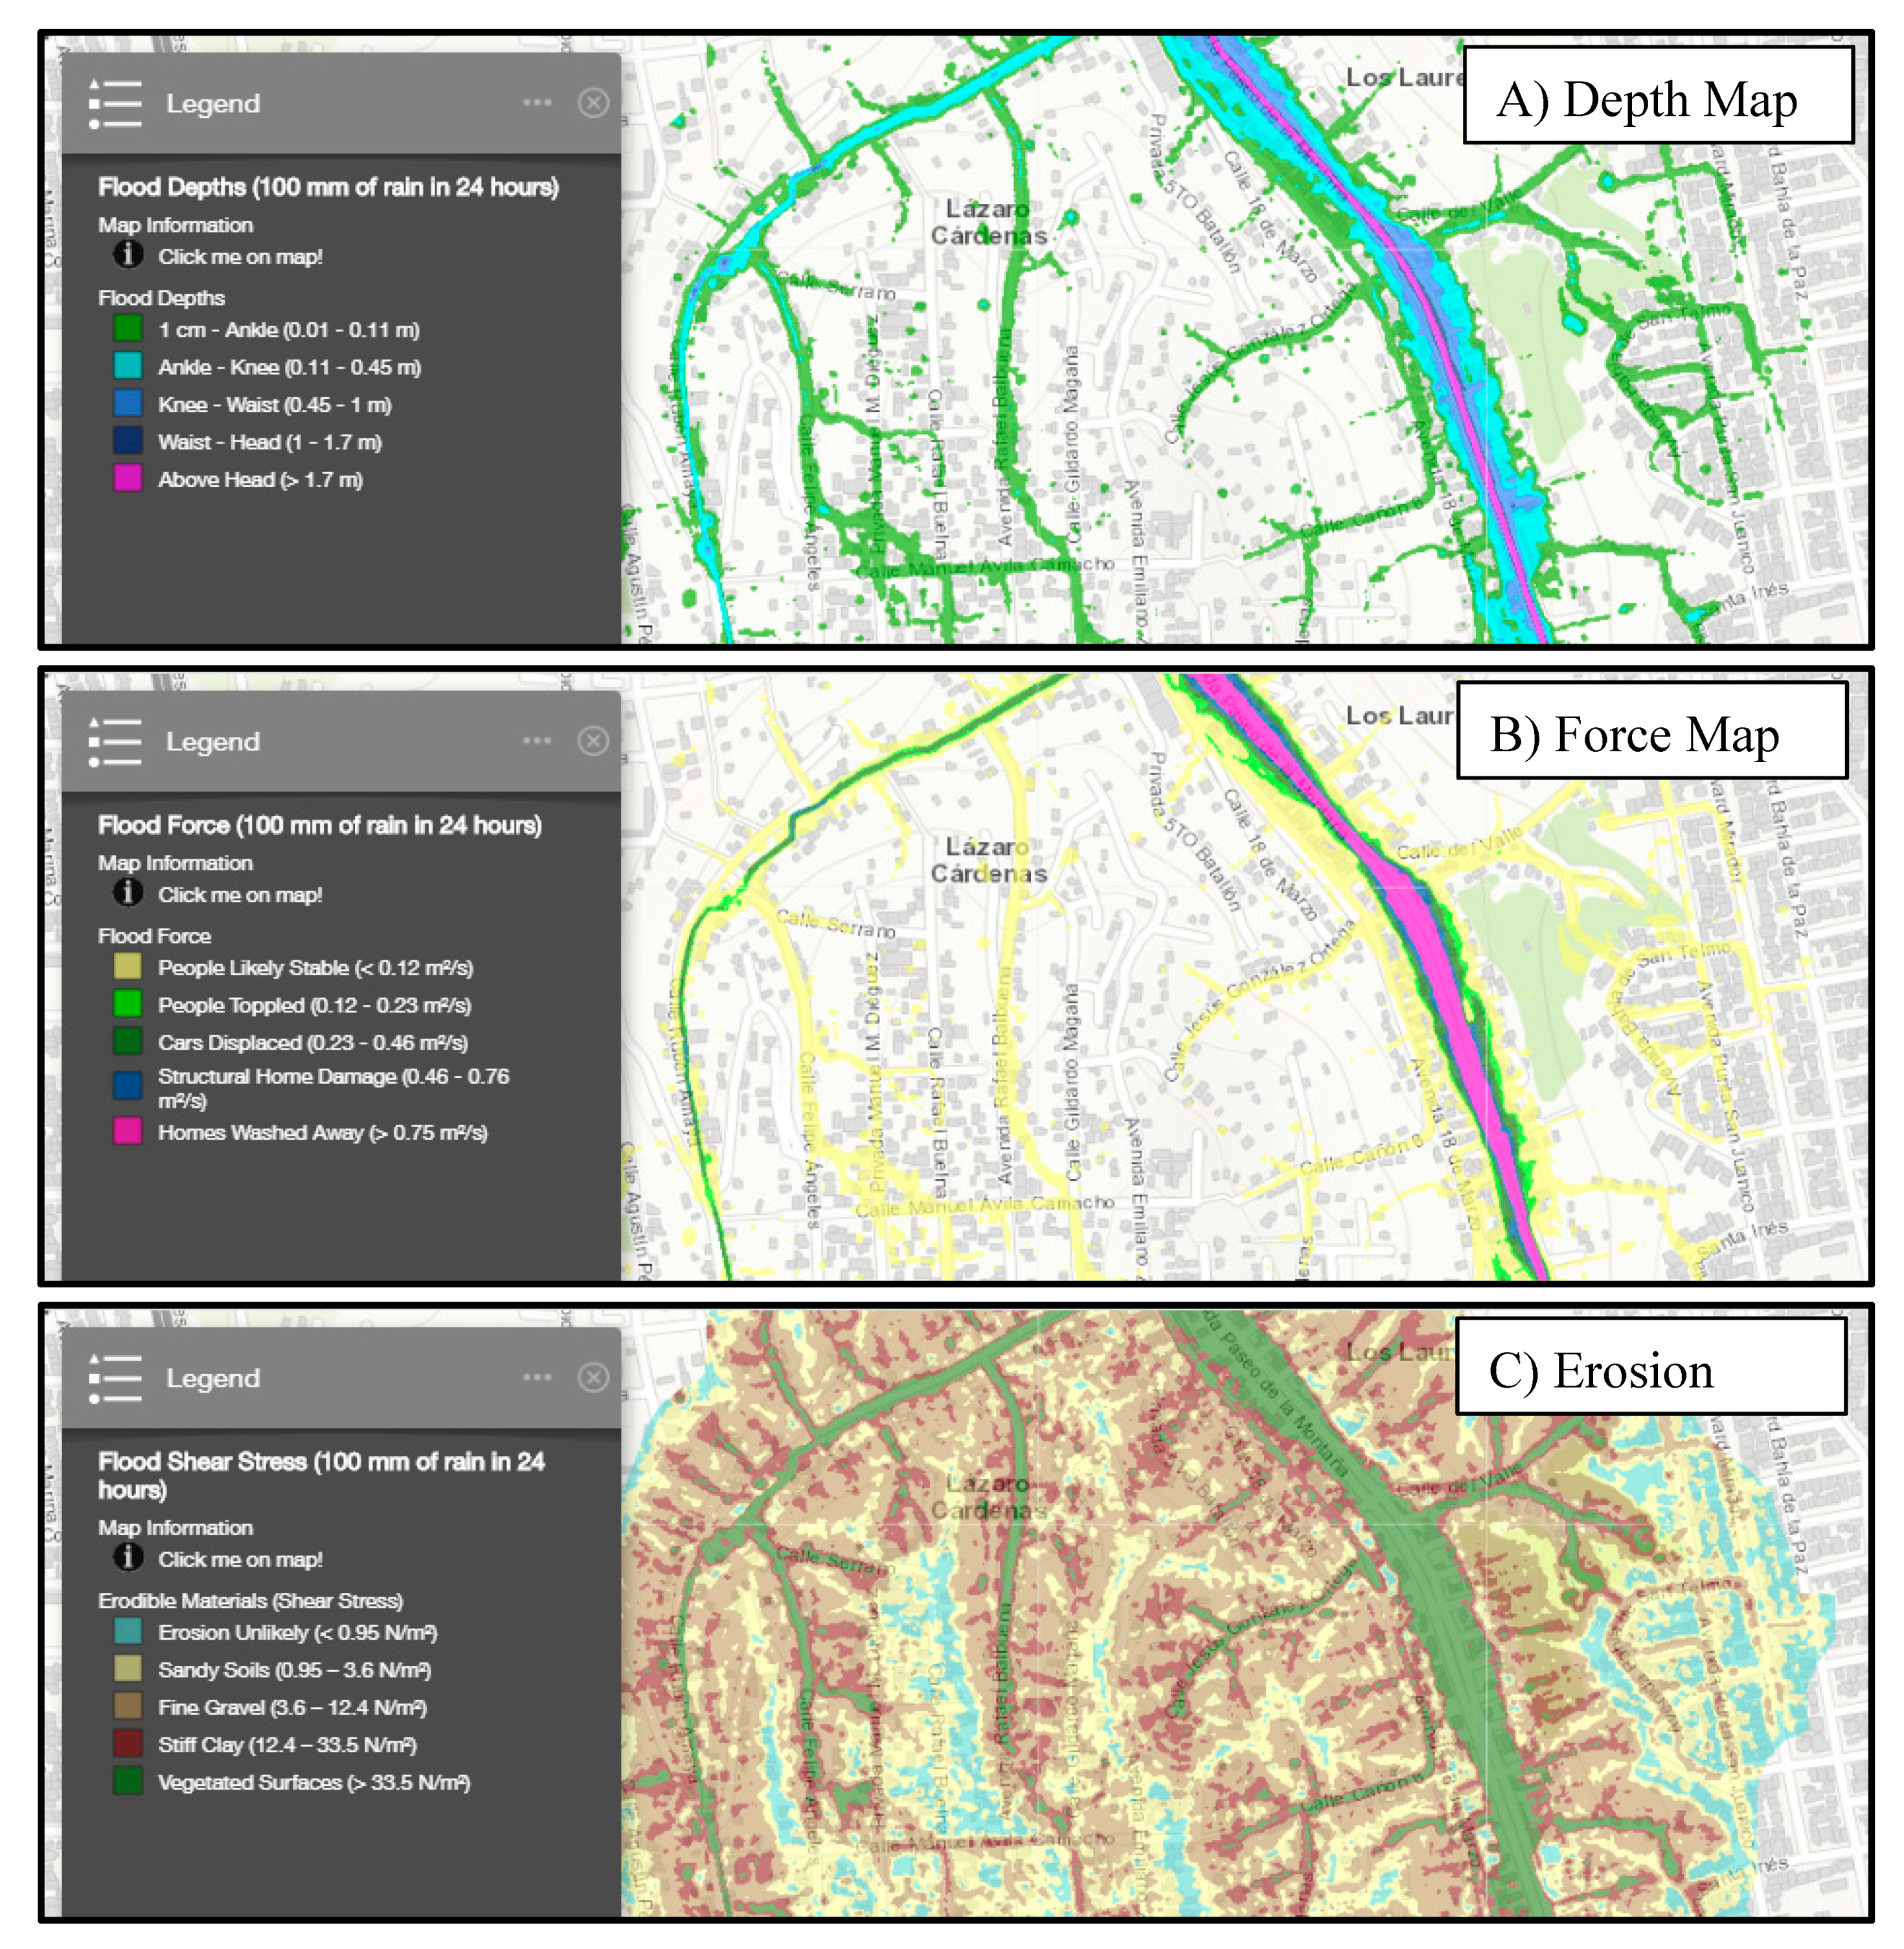
2.3. Flood Model Description

Flooding was simulated in LLC using BreZo [55,56], which solves the 2D shallow water equations using a finite-volume scheme. Simulation methods are described here in detail to distinguish between two slightly different approaches for routing runoff—a difference that proved very important with respect to end-user engagement. A mixed mesh of quadrilateral and triangular computational cells was created using Gmsh [57] to cover the watershed (Figure 1B) with an average cell area of 13.4 m2 and areas of localized refinement for important flow paths. Ground elevation was specified at the vertices of the computational mesh based on: (a) spot GPS measurements of channel bank and bottom elevations with 3 cm vertical root mean square error and (b) an aerial lidar survey data of ground elevation with a 0.76 m horizontal resolution and a 7.6 cm vertical root mean square error [31]. Resistance was characterized using spatially varying Manning’s n values, where a value of 0.015 m−1/3 s was used for concrete surfaces, and 0.035 m−1/3 s was used for natural areas of the floodplain.
The BreZo model was configured in two different ways to simulate three meteorological forcing scenarios corresponding to 24-h rainfall amounts of 50, 80, and 100 mm representative of an annual exceedance probability of 0.01, 0.05, and 0.2, respectively [31]. First, a coupled modeling approach was used whereby a hydrologic model was applied to transform rainfall into a streamflow from one of a dozen sub-basins, and then, BreZo routed streamflow through the valleys of the LLC. Hydrologic modeling adopted a 24-h nested storm hyetograph for each rainfall scenario based on the method of Sholders [58], the Soil Conservation Service (SCS) curve number method was applied to compute losses from interception and infiltration [59], and overland flow and channel flow were routed within each sub-basin using the kinematic wave model described by the United States Army Corps of Engineers [60]. Curve number values were defined based on land use data from the University of Arizona Remote Sensing Center and values from the United States Army Corps of Engineers [60]. Second, BreZo was also configured for “rain-on-grid” modeling of flooding, whereby the hydrodynamic model was relied upon for routing within each sub-basin. In this case, the SCS curve number method was again applied to compute losses, and the effective rainfall was added as a spatially distributed source to BreZo. Hereafter, these two methods are termed: FloodRISE-C and FloodRISE-G, respectively. End-user feedback also prompted the introduction of channel blockage scenarios, since this is a common occurrence during flood events. For these scenarios, the cross-sectional areas of channel culverts were fractionally reduced (50% and 100%) and paired with the meteorological scenario corresponding to 100 mm of rainfall.
Each BreZo simulation was run with a variable time-step that maintained a Courant number less than unity and required several hours to complete using 16 cores of the High-Performance Computing system at UC Irvine. Several attributes of each simulation were mapped spatially, including the maximum flood depth, the maximum flood force represented by the product of flood depth and velocity (a proxy), the maximum shear stress, and the duration of flooding. Each flood attribute was loaded into ArcGIS (ESRI, Redlands, California) for visualization purposes and the preparation of printed maps that were used in household-level surveys and focus group meetings.

3. Results

3.1. Influence of the Collaborative Modeling (CM) Process

It is important to reflect on the challenges associated with the FloodRISE project’s attempt towards implementing a community-based research approach using the principles of and rationale for it. First, we acknowledge that the CM process did not fully actualize all principles of the community-based research; instead, it fell within a spectrum of community-engaged research, which is arguably a novel endeavor in the engineering field. For example, one core principle frequently discussed in community-based research—promoting a co-learning and empowering process that attends to social inequalities—was particularly challenging to implement in the context of the project. For this reason, increasing power and control over the research process, in a case such as this, might look like community members participating as equal members across all phases of the research process (e.g., problem definition, data collection, interpretation of results, and application of the results to address community concerns). Therefore, the FloodRISE process would need to be adapted, enhanced, and certainly extended in order to fully actualize the ideals of community-based research in practice. Thus, for this project, the research teams decided not to pursue this kind of approach.
Within the context of the research teams’ application of a community-based research process, rationale from the public health field were highly transferable to engineering, as evidenced below (Table 1). While the FloodRISE project neither claims to have had the capacity or role to pursue each of these rationales nor reports them all as evidenced in the process, several rationales discussed below in relationship to FloodRISE were reinforced by project outcomes. Increasing and diversifying the commitment to rationale could further enhance project outcomes.
Next, specific ways in which each iteration of end-user consultation shaped these visualizations and contributed to decision-making needs within the community are described.

3.2. Influence of Expert Consultation

Expert consultation was essential for the research team to understand the on-going and previous work at the site. In the LLC, it was found that there was already a broad understanding that flooding and erosion are problems and that local authorities were investing significant effort and resources into flood hazard mitigation (e.g., catch basins and city planning outreach). Had a flood model and visualization tool been developed without input from the local experts, there would have been significant potential of it being duplicative, irrelevant, or perpetuating a model described by Cash et al. [61] as a loading dock, where research is produced that has been conceived, designed, conducted, and interpreted without collaboration [61].
In our study, the prospect for local efforts to be supported by advanced modeling techniques, better data, and access to state-of-the-art computational resources was well-received by end-users. Without interaction with end-users, it is very unlikely modeling tools and visualizations will be relevant to them. Connections with researchers from SDSU were especially important based on several years of experience investigating the causes and dynamics of sediment transport in the LLC and other parts of the watershed.

3.3. Influence of Household-Level Surveys

A number of topics were addressed in the household-level survey (n = 367), including:
(1) perceptions of flooding, (2) attitudes about the role of government, (3) information sources, (4) flood experience, and (5) hazard preparedness. A mapping exercise and experiment were embedded in the questionnaire. Notably, the self-reported level of awareness of flooding among respondents was very strong (mean = 6.22) using a numerical measurement scale (1 = not aware, 7 = strongly aware). Survey respondents were also asked how prepared their household is to deal with a flood. Unlike self-reports of flood awareness, self-reports of levels of preparedness were low (mean = 3.56) (1 = not prepared, 7 = completely prepared). Additional analysis of preparedness is reported by Basolo et al. [54]. Although respondents were very aware of the flood risk, the data suggest that they are not adequately prepared for a flood event. This points to an opportunity for increasing levels of flood preparedness within households poised to act on more specific information about flood hazards through increased engagement, especially through visualization of household-level risks.
Survey results provided early evidence that the FloodRISE-C hazard map did not align well with the spatial awareness of flood hazards within the community. Respondents were asked whether their home was located in an area vulnerable to flooding, and based on household geographical coordinates, it was also determined whether the household was inside or outside the IMPLAN, FloodRISE-C, and FloodRISE-G flood hazard zones. The spatial alignment between respondent awareness of a flooding vulnerability and the three flood hazard models was measured using the critical success index (CSI), a parameter developed to measure warning skills in a spatial map [62], where a CSI of 100% corresponds to perfect skills and 0% represents no skills. This calculation showed a relatively low agreement between the FloodRISE-C map and resident hazard awareness (CSI = 16%), whereas the IMPLAN map (CSI = 59%) and FloodRISE-G map (CSI = 46%) demonstrated better agreement. These survey results revealed that the FloodRISE-C flood hazard map underpredicted the spatial extent of hazardous areas (compared to the resident spatial awareness of areas prone to flooding) because areas predicted to flood were only those where flood flows exceed the capacity of formal drainage channels. Indications that the FloodRISE-C map was deficient would also arise during focus group discussions (described below), and understanding why it was deficient (failure to capture sheet flows at the sub-basin scale) enabled the FloodRISE team to significantly improve the flood hazard maps through the development of the FloodRISE-G approach. This exemplifies how collaboration between experts in flood hazard modeling and end-users of flood hazard information can help improve the model quality.
Additionally—and perhaps, most significantly—open-ended questions embedded within the survey allowed for residents to describe their experience with flooding. Residents who live within proximity of a set of five culverts beneath an earthen berm under the U.S.-Mexico border, and at the confluence of the sub-drainage of LLC, recalled a particularly extreme PFF event of head-high flooding due to the blockage of one of the culverts by large debris (a mattress). In early iterations of the flood modeling, model outputs depicted minimal flood risks in this area. Based on resident experience gathered from the survey, modelers developed entirely new flood scenarios—later termed the “blockage scenarios” (Figure 3)—based on varying percentage blockages of these culverts, an effort that would otherwise have not been pursued. Results were drastically different than the pre-resident consultation, yet reflective of what the researchers were told by residents.

3.4. Influence of Focus Group Meetings with End-Users

Focus groups in LLC included city planners/public works personnel, individuals in academia, emergency responders, and community/NGO groups. Their feedback pointed to a number of ways to improve flood visualizations through changes in cartographic elements (e.g., map titles, legends, and contextual information) and model scenarios in an effort to make the maps more useable, as described by Luke et al. [31]. For example, end-users preferred that the meteorological scenarios be titled based on rainfall depth, not annual exceedance probability, and expressed an interest in using less technical language. Participants wanted more contextual information on maps, including road access, flood channels, sediment basins, and locations of dwellings and shelters. In addition to suggestions about such relatively simple cartographic changes, end-users expressed interest in a map that relates flood conditions to erosion and pluvial hazards, which were absent from the first set of maps. End-users also requested visualizations of different scenarios beyond the three meteorological conditions, including maps depicting channel blockages/obstructions, future channelization, and future land use. For a complete description of end-user preferences, see Luke et al. [31].
Focus group feedback (as well as data from the household-level survey) highlighted the deficiency of the FloodRISE-C approach and the need for the FloodRISE-G approach. This preference, combined with the alignment of perceptions and mapping of risks extracted from household survey data, lead the research team to adopt a pluvial flood modeling approach, which generated the FloodRISE-G maps shown in Figure 4.
The focus groups underscored the importance of tailoring map products to the audience and end-user needs. For example, when focus group participants were presented with a menu of maps and were asked to report which (among several maps) would be most useful, community members selected flood visualizations—specifically, those that depicted a duration of inundation greater than ankle-depth—in greater numbers than any other groups, with reports of the need to know how long the transportation and evacuation routes would be impacted. Emergency responders and government organization representatives selected the government-issued and relatively coarse-resolution IMPLAN map over the finer resolution and more detailed FloodRISE maps similar to those shown in Figure 4. The choice of government products over FloodRISE products suggests the preference for established organizations and their vetted products in guiding decision-making. This was also observed in similarly designed FloodRISE focus groups in the U.S. and described further in Luke et al. [31].

3.5. Adoption for Practice: Training Sessions and Outreach with End-Users

The last phase of the end-user engagement involved training sessions with a presentation, practice, and open dialogue format. End-users were asked to report opportunities for the tool to directly inform and impact individual, organization, and/or community decisions regarding flood risks. Four types of intended uses of the tool were reported by personnel in the following areas: planning (P), water supply and wastewater (W), weather safety (S), military (M), transboundary organizations (T), and academia (A):
  • Policy and Planning Applications
    • Define high-risk flood areas. (S, W, and M).
    • Inform risk mitigation or public safety policies to protect residents (P).
    • Incorporate into the Minute 320 of the International Boundary and Water Commission of the United States and Mexico the general framework for binational cooperation on transboundary issues in the Tijuana river basin (T).
    • Incorporate into the urban development program of the City of Tijuana (P).
    • Plan evacuation routes (S and M).
  • Infrastructure Management
    • Improve design of the storm drain system for new development projects (A).
    • Inform design of the flood resilient infrastructure (W).
  • General Risk Awareness
    • Inform ongoing research into geological and hydrometeorological risks (A).
    • Community awareness and outreach.
    • Increase understanding of flood risks among residents (W).
    • Discourage development in high-risk areas (S and P).
These results indicate that the tool is viewed by end-users as having the potential for a wide range of uses, and this points to considerable value for informing the complex web of decision-making that determines flood risks [63]. Results also indicate that the tool is especially valued for planning, based on the number of personnel citing planning-oriented uses and the total number of cited uses.
The final flood visualizations were organized into an interactive, online, and publicly accessible flood hazard viewer using ArcGIS Online (ESRI, Redlands, CA, USA). Figure 4 shows visualizations of flood depth (Figure 4A), flood force (Figure 4B), and flood shear stress (Figure 4C) [64].
These results build on only a limited number of previous studies that successfully combine community-based research with flood hazard/risk modeling [27,30,31,33] and expands upon models for community-based research from the public health field into engineering research and practices. These results are also in general alignment with the reported need to address flood risks by informing a complex web of decision-makers [63] with actionable information [23].

4. Discussion

End-users including residents, academics, government authorities, and non-governmental organizations expressed a continued interest in and a commitment to co-developing flood hazard visualizations with flood modeling experts. Through a four-step process of coordinated end-user interaction and flood model development and iteration, a set of flood hazard visualizations were co-produced and found useful for meeting a variety of end-user decision-making needs related to pluvial flash flooding (PFF), especially with respect to planning. This fusion of collaborative, community-based research and flood hazard modeling, or CM, was presented here as a new paradigm to characterize and address PFF and blockage scenarios in a low-resourced setting. The outcomes of CM demonstrate that the public health rationale for implementing a community-based research process has transferability across fields and produces useful modeling outputs to address PFF. The significance of this contribution is not just scholarly but also applied. Having community-informed PFF visualizations is crucial and timely for flood risk planning and response, as seen in recent events with debris blockages in Tijuana, Mexico [65].
CM did not lead to a single flood map for flood risk communication but rather a menu of maps, including maps of flood depth, flood force, erosion potential, and flood duration, as well as high levels of interest and intent to apply the information. CM also allowed for incorporation of community-driven interest in different flooding scenarios, such as the possibility of blockages of drainage infrastructure. Furthermore, CM demonstrated the potential for local knowledge to reveal limitations in hydrologic modeling approaches (FloodRISE-C) that could then be corrected (FloodRISE-G). In short, this study of CM for PFF: (1) puts powerful hydrologic modeling systems at the disposal of non-experts to contemplate flooding and strategies to manage risks and (2) allows modeling experts to benefit from local knowledge of hydrologic processes that affect flooding, which, in turn, leads to better-quality models.
Several forms of end-user engagement were used to include the potential end-users of the flood visualizations, such as meetings, household surveys, focus groups, and training sessions. Each form of engagement made distinct contributions towards the production of actionable knowledge. For example, early engagement of authorities created access to useful information, built an atmosphere of cooperation, and resulted in a high level of participation in focus group meetings and training sessions. Surveys provided critical context for understanding how community knowledge could be used in the project and ensured early in the process that the line of research was not misguided (i.e., getting the question right). Focus group meetings contributed to improving model scenarios and formatting visualizations to meet mapping preferences, as described in more detail by Luke et al. [31].
Training sessions were important, not only for increasing end-user awareness of and familiarity with an online decision-support tool, but also for measuring the level of end-user interest in carrying forth the work in their own applied realms and specific opportunities for its use within the complex web of decision-making that affects flood risks. There was interest in learning how to use the modeling tools (i.e., the flood simulation technology), particularly among technically-oriented focus groups and training session members (such as engineers and academics) and going beyond static maps.
There is also an eagerness to expand the efforts to other areas of interest, particularly within the city of Tijuana. These interactions identified the importance of teaching the modeling software to technical professionals in addition to aligning the modeling output to end-user requests. Broadly, the reported uses and the overall positive reception of the tool by end-users reinforce previous findings by Wilkinson et al. [27] that flood information tools co-developed with end-users achieve several important outcomes, such as: (a) builds a greater shared understanding about flood risks, (b) facilitates the exchange of ideas, (c) provides a framework for how to approach development, (d) encourages interactions among scientists and end-users, and (e) provides a wealth of information that is accessible and understandable to end-users.
Through each stage of engagement and corresponding model iteration, improvements and changes to the hydrologic modeling approach became possible—including increased spatial agreement and specific scenarios—which, in turn, benefitted the next stage of engagement. While the four-stage CM process presented herein and shown in Figure 2 generated project outputs of use to its end-users, it is not the only process available to yield such results. In fact, there are many different pathways that respect and apply the principles of and rationale for community-based and participatory research to flood hazard modeling/mapping for a robust, iterative approach. Nevertheless, the four-stage CM approach presents a benchmark for consideration by others interested in producing flood hazard information that is responsive to end-user needs in flood-affected communities.

Author Contributions

Conceptualization, K.A.G, V.B., D.L.F., R.A.M., A.E., K.S., A.S.R, and B.F.S; methodology, K.A.G., V.B., D.L.F., R.A.M., J.E.S., A.L., A.E., D.B., K.S., A.S.R., S.C., D.H., W.C., A.A., and B.F.S.; software, J.E.S., A.L., W.C., and B.F.S.; validation, J.E.S., A.L., A.A., and B.F.S.; formal analysis, K.A.G., V.B., D.L.F., A.E., and B.F.S.; investigation, K.A.G., V.B., D.L.F., A.L., A.E., D.B., K.S., S.C., and B.F.S.; resources, V.B., D.L.F., R.A.M., A.S.R., A.A., and B.F.S.; data curation, K.A.G., V.B., J.E.S., A.L., A.E., S.C., D.H., and W.C.; writing—original draft preparation, K.A.G. and B.F.S.; writing—review and editing, K.A.G., V.B., R.A.M., J.E.S., K.S., A.S.R., S.C., D.H., W.C., and B.F.S.; visualization, J.E.S. and A.L.; supervision, V.B., D.L.F., R.A.M., A.S.R., D.H., and B.F.S.; project administration, R.A.M., K.S., A.S.R., and B.F.S.; funding acquisition, K.A.G., R.A.M., A.S.R., and B.F.S. All authors have read and agreed to the published version of the manuscript.

Funding

This research was made possible by a grant from the National Science Foundation (award DMS 1331611), which is gratefully acknowledged.

Acknowledgments

The authors also acknowledge the communities of Los Laureles Canyon for their time and participation, without which this research would not have been possible.

Conflicts of Interest

The authors declare no conflict of interest.

References

  1. Jongman, B.; Ward, P.J.; Aerts, J.C. Global exposure to river and coastal flooding: Long term trends and changes. Glob. Environ. Chang. 2012, 22, 823–835. [Google Scholar] [CrossRef]
  2. Centre for Research on the Epidemiology of Disasters. The Human Cost of Weather Related Disasters 2015, 1995–2015; The United Nations Office for Disaster Risk Reduction: Brussels, Belgium, 2015. [Google Scholar]
  3. Di Baldassarre, G.; Montanari, A.; Lins, H.; Koutsoyiannis, D.; Brandimarte, L.; Blöschl, G. Flood fatalities in Africa: From diagnosis to mitigation. Geophys. Res. Lett. 2010, 37, 1–5. [Google Scholar] [CrossRef] [Green Version]
  4. Cartwright, L. An examination of flood damage data trends in the United States. J. Contemp. Water Res. Educ. 2005, 130, 20–25. [Google Scholar] [CrossRef] [Green Version]
  5. Hinkel, J.; Lincke, D.; Vafeidis, A.T.; Perrette, M.; Nicholls, R.J.; Tol, R.S.J.; Marzeion, B.; Fettweis, X.; Ionescu, C.; Levermann, A. Coastal flood damage and adaptation costs under 21st century sea-level rise. Proc. Natl. Acad. Sci. USA 2014, 111, 3292–3297. [Google Scholar] [CrossRef] [Green Version]
  6. Sundermann, L.; Schelske, O.; Hausmann, P. Mind the Risk-A Global Ranking of Cities under Threat from Natural Disasters; Swiss Reinsurance Company: Zurich, Switzerland, 2014. [Google Scholar]
  7. Few, R. Flooding, vulnerability and coping strategies: Local responses to a global threat. Prog. Dev. Stud. 2003, 3, 43–58. [Google Scholar] [CrossRef]
  8. Rataj, E.; Kunzweiler, K.; Garthus-Niegel, S. Extreme weather events in developing countries and related injuries and mental health disorders-a systematic review. BMC Public Health 2016, 16, 1020. [Google Scholar] [CrossRef] [Green Version]
  9. World Health Organization. Floods: Climate Change and Adaptation Strategies for Human Health; WHO Regional Office for Europe: Copenhagen, Denmark, 2002. [Google Scholar]
  10. Cohen, B. Urbanization in developing countries: Current trends, future projections, and key challenges for sustainability. Technol. Soc. 2006, 28, 63–80. [Google Scholar] [CrossRef]
  11. Wolsko, C.; Marino, E. Disasters, migrations, and the unintended consequences of urbanization: What’s the harm in getting out of harm’s way? Popul. Environ. 2016, 37, 411–428. [Google Scholar] [CrossRef]
  12. Ritchie, H.; Roser, M. Urbanization. Published Online at OurWorldInData.org. 2019. Available online: https://ourworldindata.org/urbanization (accessed on 24 April 2020).
  13. Fletcher, T.D.; Andrieu, H.; Hamel, P. Understanding, management and modelling of urban hydrology and its consequences for receiving waters: A state of the art. Adv. Water Resour. 2013, 51, 261–279. [Google Scholar] [CrossRef]
  14. Walsh, C.J.; Fletcher, T.D.; Ladson, A.R. Stream restoration in urban catchments through redesigning stormwater systems: Looking to the catchment to save the stream. J. North Am. Benthol. Soc. 2005, 24, 690–705. [Google Scholar] [CrossRef]
  15. White, I. Book reviews: UN-habitat (2009) planning sustainable cities: Global report on human settlements 2009. London: Earthscan. Prog. Hum. Geogr. 2011, 35, 279–280. [Google Scholar] [CrossRef]
  16. Hallegatte, S.; Green, C.; Nichols, R.J.; Corfee-Morlot, J. Future flood losses in major coastal cities. Nat. Clim. Chang. 2013, 3, 802–806. [Google Scholar] [CrossRef]
  17. Hanson, S.; Nicholls, R.; Ranger, N.; Hallegatte, S.; Corfee-Morlot, J.; Herweijer, C.; Chateau, J. A global ranking of port cities with high exposure to climate extremes. Clim. Chang. 2011, 104, 89–111. [Google Scholar] [CrossRef] [Green Version]
  18. Pörtner, H.-O.; Roberts, D.C.; Masson-Delmotte, V.; Zhai, P.; Tignor, M.; Poloczanska, E.; Mintenbeck, K.; Nicolai, M.; Okem, A.; Petzold, J.; et al. (Eds.) IPCC, 2019: Summary for Policymakers. In: IPCC Special Report on the Ocean and Cryosphere in a Changing Climate. 2019. Available online: https://report.ipcc.ch/srocc/pdf/SROCC_SPM_Approved.pdf (accessed on 24 April 2020).
  19. Falconer, R.H.; Cobby, D.; Smyth, P.; Astle, G.; Dent, J.; Golding, B. Pluvial flooding: New approaches in flood warning, mapping and risk management. J. Flood Risk Manag. 2009, 2, 198–208. [Google Scholar] [CrossRef]
  20. Rosenzweig, B.R.; McPhillips, L.; Chang, H.; Cheng, C.; Welty, C.; Matsler, M.; Iwaniec, D.; Davidson, C.I. Pluvial flood risk and opportunities for resilience. Water 2018, 5, e1302. [Google Scholar] [CrossRef]
  21. Yin, J.; Yu, D.; Yin, Z.; Liu, M.; He, Q. Evaluating the impact and risk of pluvial flash flood on intra-urban road network: A case study in the city center of Shanghai, China. J. Hydrol. 2016, 537, 138–145. [Google Scholar] [CrossRef] [Green Version]
  22. Lebel, L.; Anderies, J.; Campbell, B.; Folke, C.; Hatfield-Dodds, S.; Hughes, T.P.; Wilson, J. Governance and the capacity to manage resilience in regional social-ecological systems. Ecol. Soc. 2006, 11, 19. [Google Scholar] [CrossRef] [Green Version]
  23. Spiekermann, R.; Kienberger, S.; Norton, J.; Briones, F.; Weichselgartner, J. The disaster-knowledge matrix—Reframing and evaluating the knowledge challenges in disaster risk reduction. Int. J. Disaster Risk Reduct. 2015, 13, 96–108. [Google Scholar] [CrossRef] [Green Version]
  24. Almoradie, A.; Cortes, V.J.; Jonoski, A. Web-based stakeholder collaboration in flood risk management. J. Flood Risk Manag. 2015, 8, 19–38. [Google Scholar] [CrossRef]
  25. Mackay, E.B.; Wilkinson, M.E.; Macleod, C.J.; Beven, K.; Percy, B.J.; Macklin, M.G.; Sutter, M.; Haygarth, P.M. Digital catchment observatories: A platform for engagement and knowledge exchange between catchment scientists, policy makers, and local communities. Water Resour. Res. 2015, 51, 4815–4822. [Google Scholar] [CrossRef] [Green Version]
  26. Sanders, B.F. Hydrodynamic Modeling of Urban Flood Flows and Disaster Risk Reduction; Oxford Research Encyclopedia of Natural Hazard Science: Oxford, MA, USA, 2017. [Google Scholar]
  27. Wilkinson, M.E.; Mackay, E.; Quinn, P.F.; Stutter, M.; Beven, K.J.; Macleod, C.J.; Macklin, M.G.; Elkhatib, Y.; Percy, B.; Vitolo, C.; et al. A cloud based tool for knowledge exchange on local scale flood risk. J. Environ. Manag. 2015, 161, 38–50. [Google Scholar] [CrossRef] [PubMed] [Green Version]
  28. Campos, I.; Vizinho, A.; Coelho, C.; Alves, F.; Truninger, M.; Pereira, C.; Santos, F.D.; Penha Lopes, G. Participation, scenarios and pathways in long-term planning for climate change adaptation. Plan. Theory Pract. 2016, 17, 537–556. [Google Scholar] [CrossRef]
  29. Dilling, L.; Lemos, M.C. Creating usable science: Opportunities and constraints for climate knowledge use and their implications for science policy. Glob. Environ. Chang. 2011, 21, 680–689. [Google Scholar] [CrossRef]
  30. Evers, M.; Jonoski, A.; Maksimovič, Č.; Lange, L.; Rodriguez, S.O.; Teklesadik, A.; Arevalo, J.C.; Almoradie, A.; Simões, N.E.; Wang, L.; et al. Collaborative modelling for active involvement of stakeholders in urban flood risk management. Nat. Hazards Earth Syst. Sci. 2012, 12, 2821. [Google Scholar] [CrossRef] [Green Version]
  31. Luke, A.; Sanders, B.F.; Goodrich, K.A.; Feldman, D.L.; Boudreau, D.; Eguiarte, A.; Serrano, K.; Reyes, A.; Schubert, J.E.; AghaKouchak, A.; et al. Going beyond the flood insurance rate map: Insights from flood hazard map co-production. Nat. Hazards Earth Syst. Sci. 2018, 18, 1097–1120. [Google Scholar] [CrossRef] [Green Version]
  32. Meyer, V.; Kuhlicke, C.; Luther, J.; Fuchs, S.; Priest, S.; Dorner, W.; Serrhini, K.; Pardoe, J.; McCarthy, S.; Seidel, J.; et al. Recommendations for the user-specific enhancement of flood maps. Nat. Hazards Earth Syst. Sci. 2012, 12, 1701–1716. [Google Scholar] [CrossRef]
  33. Sanders, B.F.; Schubert, J.E.; Goodrich, K.A.; Houston, D.; Feldman, D.L.; Basolo, V.; Luke, A.; Boudreau, D.; Karlin, B.; Cheung, W.; et al. Collaborative modeling with fine-resolution data enhances flood awareness, minimizes differences in flood perception, and produces actionable flood maps. Earth Future 2020, 7, e2019EF001391. [Google Scholar] [CrossRef] [Green Version]
  34. Voinov, A.; Bousquet, F. Modelling with stakeholders. Environ. Model. Softw. 2010, 25, 1268–1281. [Google Scholar] [CrossRef]
  35. National Research Council. Mapping the Zone: Improving Flood Map Accuracy; National Academies Press: Washington, DC, USA, 2009. [Google Scholar]
  36. Soden, R.; Sprain, L.; Palen, L. Thin grey lines: Confrontations with risk on Colorado’s front range. Presented at the 2017 CHI Conference on Human Factors in Computing Systems, Denver, CO, USA, 6–11 May 2017. [Google Scholar]
  37. Houston, D.; Cheung, W.; Basolo, V.; Feldman, D.; Matthew, R.; Sanders, B.F.; Karlin, B.; Schubert, J.E.; Goodrich, K.A.; Contreras, S.; et al. The influence of hazard maps and trust of flood controls on coastal flood spatial awareness and risk perception. Environ. Behav. 2019, 51, 347–375. [Google Scholar] [CrossRef]
  38. Lemos, M.C.; Arnott, J.C.; Ardoin, N.M.; Baja, K.; Bednarek, A.T.; Dewulf, A.; Fieseler, C.; Goodrich, K.A.; Jagannathan, K.; Klenk, N.; et al. To co-produce or not co-produce. Nat. Sustain. 2018, 1, 722–724. [Google Scholar] [CrossRef]
  39. Israel, B.A.; Schulz, A.J.; Parker, E.A.; Becker, A.B. Review of community-based research: Assessing partnership approaches to improve public health. Annu. Rev. Public Health 1998, 19, 173–202. [Google Scholar] [CrossRef] [PubMed] [Green Version]
  40. Gersberg, R.M.; Rose, M.A.; Robles-Sikisaka, R.; Dhar, A.K. Quantitative detection of hepatitis A virus and enteroviruses near the United States-Mexico border and correlation with levels of fecal indicator bacteria. Appl. Environ. Microbiol. 2006, 72, 7438–7444. [Google Scholar] [CrossRef] [PubMed] [Green Version]
  41. Goodrich, K.A.; Boudreau, D.; Crooks, J.; Eguiarte, A.; Lorda, J. The role of community capitals in climate change adaptation in a binational community. In Addressing Climate Change at the Community Level in the United States; Lachapelle, P.R., Albrecht, D.E., Eds.; Routledge: London, UK, 2018; pp. 243–258. [Google Scholar]
  42. Global Facility for Disaster Reduction and Recovery. The Making of a Riskier Future: How Our Decisions Are Shaping Future Disaster Risk; GFDRR: Washington, DC, USA, 2016. [Google Scholar]
  43. Instituto Nacional de Estadística Geografía e Informática de Mexico. Geografia. 2015. Available online: www.inegi.org.mx (accessed on 24 April 2020).
  44. U.S. General Services Administration. San Ysidro Land Port of Entry, Fact Sheet. 2019. Available online: http://www.gsa.gov/SanYsidro (accessed on 24 April 2020).
  45. U.S. Climate Data. Imperial Beach, California. 2019. Available online: https://www.usclimatedata.com/climate/imperial-beach/california/united-states/usca1642 (accessed on 24 April 2020).
  46. Leifer, R.; Huber, G.P. Relations among perceived environmental uncertainty, organization structure, and boundary-spanning behavior. Adm. Sci. Q. 1977, 22, 235–247. [Google Scholar] [CrossRef]
  47. Eissenberg, T. Collaborating across cultures. Am. Psychol. Assoc. Monit. Psychol. 2014, 45, 60. [Google Scholar]
  48. Dawson, R.J.; Ball, T.; Werritty, J.; Werritty, A.; Hall, J.W.; Roche, N. Assessing the effectiveness of non-structural flood management measures in the Thames Estuary under conditions of socio-economic and environmental change. Glob. Environ. Chang. 2011, 21, 628–646. [Google Scholar] [CrossRef]
  49. Pasche, E.; Manojlovic, N.; Schertzer, D.; Deroubaix, J.F.; Tchguirinskaia, I.; El Tabach, E.; Ashley, R.; Newman, R.; Lawson, N.; Douglas, I.; et al. The use of non structural measures for reducing the flood risk in small urban catchments. In Flood Risk Management: Research and Practice; Allsop, W., Samuels, P., Harrop, J., Huntington, S., Eds.; Taylor & Francis: London, UK, 2009; pp. 132–133. [Google Scholar]
  50. Steinführer, A.; de Marchi, B.; Kuhlicke, C.; Scolobig, A.; Tapsell, S.; Tunstall, S. Recommendations for Flood Risk Management with Communities at Risk. 2009. Available online: http://www.floodsite.net/html/partner_area/project_docs/T11_07_14_Recommendations_D11_1_V3_1_P01.pdf (accessed on 24 April 2020).
  51. Kellens, W.; Zaalberg, R.; Neutens, T.; Vanneuville, W.; De Maeyer, P. An analysis of the public perception of flood risk on the Belgian coast. Risk Anal. 2011, 31, 1055–1068. [Google Scholar] [CrossRef] [Green Version]
  52. Dillman, D.A.; Smyth, J.D.; Christian, L.M. Internet, Mail and Mixed-Mode Surveys: The Tailored Design Method, 3rd ed.; John Wiley: Hoboken, NJ, USA, 2009. [Google Scholar]
  53. Feldman, D.; Contreras, S.; Karlin, B.; Basolo, V.; Matthew, R.; Sanders, B.; Houston, D.; Cheung, W.; Goodrich, K.; Reyes, A.; et al. Communicating flood risk: Looking back and forward at traditional and social media outlets. Int. J. Disaster Risk Reduct. 2016, 15, 43–51. [Google Scholar] [CrossRef] [Green Version]
  54. Basolo, V.; Goodrich, K.; Contreras, S.; Matthew, R.; Sanders, B.; Feldman, D. A Cross National Investigation of Flood Risk Perceptions and Hazard Preparedness in Two Urban Communities. Presented at the Meeting of the Urban Affairs Association, San Diego, CA, USA, 16-19 March 2016. [Google Scholar]
  55. Kim, B.; Sanders, B.F.; Schubert, J.E.; Famiglietti, J.S. Mesh type tradeoffs in 2D hydrodynamic modeling of flooding with a Godunov-based flow solver. Adv. Water Resour. 2014, 68, 42–61. [Google Scholar] [CrossRef] [Green Version]
  56. Sanders, B.F.; Schubert, J.E.; Detwiler, R.L. ParBreZo: A parallel, unstructured grid, Godunov-type, shallow-water code for high-resolution flood inundation modeling at the regional scale. Adv. Water Resour. 2010, 33, 1456–1467. [Google Scholar] [CrossRef]
  57. Geuzaine, C.; Remacle, J.-F. Gmsh: A 3-d finite element mesh generator with built-in pre-and post-processing facilities. Int. J. Numer. Methods Eng. 2009, 79, 1309–1331. [Google Scholar] [CrossRef]
  58. Sholders, M. San Diego County Hydrology Manual; Department of Public Works: San Diego, CA, USA, 2003. [Google Scholar]
  59. Ponce, V.M.; Hawkins, R.H. Runoff curve number: Has it reached maturity? J. Hydrol. Eng. 1996, 1, 11–19. [Google Scholar] [CrossRef]
  60. United States Army Corps of Engineers. Hydrologic Modeling System HEC-HMS: Technical Reference Manual. 2000. Available online: https://www.hec.usace.army.mil/software/hec-hms/documentation/HEC-HMS_Technical%20Reference%20Manual_(CPD-74B).pdf (accessed on 24 April 2020).
  61. Cash, D.W.; Adger, W.; Berkes, F.; Garden, P.; Lebel, L.; Olsson, P.; Pritchard, L.; Young, O. Scale and cross-scale dynamics: Governance and information in a multilevel world. Ecol. Soc. 2006, 11, 8. [Google Scholar] [CrossRef] [Green Version]
  62. Schaefer, J.T. The critical success index as an indicator of warning skill. Weather Forecast. 1990, 5, 570–575. [Google Scholar] [CrossRef] [Green Version]
  63. Morss, R.E.; Wilhelmi, O.V.; Downton, M.W.; Gruntfest, E. Flood risk, uncertainty, and scientific information for decision making: Lessons from an interdisciplinary project. Bull. Am. Meteorol. Soc. 2005, 86, 1593–1601. [Google Scholar] [CrossRef]
  64. FloodRISE. Inundación del Cañón de Los Laureles. Available online: http://bit.ly/floodrisell (accessed on 24 April 2020).
  65. IBWC. Update on Storm Drain Blockage at Matadero Canyon. 2020. Available online: http://www.digimperialbeach.com/2020/01/08/294447/update-on-storm-drain-blockage-at-matadero-canyon-mexico (accessed on 24 April 2020).
Figure 1. Los Laureles Canyon (LLC) in Tijuana, Mexico drains north across the U.S. border into the Tijuana River Valley (A), which terminates at the Pacific Ocean. The broader geographic context and the Tijuana River Watershed are shown in (B). A roadway embankment marks the northern border of LLC, and undersized culverts lead to the deep ponding of flood water during extreme events (C). The Los Laureles community is the neighborhood near the Northernmost point of Los Laureles Canyon at the U.S.–Mexico border, roughly represented by the blue box in (A).
Water 12 01257 g001
Figure 2. Collaborative modeling (CM) was developed as a four-stage process of coordinated end-user interaction and flood model development and iteration. This figure depicts an iterative process, a principle of community-based research, as identified in Israel et al. [39].
Water 12 01257 g002
Figure 3. Map of maximum flood depth from a 100 mm rainfall scenario under a complete culvert blockage scenario, resulting in extensive ponding (above head, >1.7 m) near the outlet (northern boundary) of the catchment. Resident interviews generated a report that a mattress previously clogged the main culvert, leading to deep flooding.
Water 12 01257 g003
Figure 4. Visualization of three aspects of pluvial flood flashing (PFF) from 100 mm of rainfall over 24-h: (A) maximum flood depth, (B) maximum flood force, and (C) maximum shear stress visualizations accessed from the Los Laureles Canyon (LLC) online flood hazard viewer, which also includes similar maps for cases involving 50 and 80 mm of rainfall representative of more frequent events. These visualizations are accessible through an online GIS, so browsers can pan, zoom, change the base map, and switch between maps [64].
Water 12 01257 g004
Table 1. Evidence of transferability of community-based research rationale in the Flood Resilient Infrastructure and Sustainable Environments (FloodRISE) project. TRNERR: Tijuana River National Estuarine Research Reserve, RIIT: Research Integration and Impact Team, and PFF: pluvial flash flooding.
Rationale [39]Evidence of transferability
Joining together of partners with diverse skills, knowledge, expertise, and sensitivities to address complex problems.Interdisciplinary nature of the FloodRISE team engaging engineers, social scientists, and practitioners based at TRNERR, the boundary organization.
Strengthening the research and program development capacity of the partners.New skills were gained by boundary organization due to the involvement on the RIIT in each of the four stages.
Providing additional funds and possible employment opportunities for community partners.Community survey enumerators were employed and trained by the project. The high survey response rate (n = 367) is attributed to their experience, skill, and ability to overcome issues of access in the community.
Improving the quality and validity of research by engaging local knowledge and local theory based on the lived experience of the people involved.Flood model scenarios directly informed by information gained through surveys and focus groups. Specific information related to conditions and externalities (e.g., PFF and blockages) would have otherwise not been included in model outputs.
Enhancing the relevance, usefulness, and use of the research data by all partners involved.Through training and outreach, model outputs and technology were shared with end-users and were made publicly accessible via an online viewer. Interest at this training by end-users to apply the FloodRISE products in their work indicates relevance and usefulness.

