Article

Escherichia coli Antimicrobial Resistance Variability in Water Runoff and Soil from a Remnant Native Prairie, an Improved Pasture, and a Cultivated Agricultural Watershed

1
Department of Soil and Crop Sciences, Texas A&M University, College Station, TX 77843, USA
2
School of Biological, Environmental, and Earth Sciences, The University of Southern Mississippi, Long Beach, MS 39560, USA
3
United States Department of Agriculture–Agricultural Research Service (USDA-ARS), Mississippi State, MS 39762, USA
4
United States Department of Agriculture–Agricultural Research Service (USDA-ARS), Fort Collins, CO 80526, USA
5
Texas Water Resources Institute, College Station, TX 77843, USA
6
Oklahoma Water Resources Center, Oklahoma State University, Stillwater, OK 74078, USA
*
Author to whom correspondence should be addressed.
Water 2020, 12(5), 1251; https://doi.org/10.3390/w12051251
Submission received: 11 March 2020 / Revised: 10 April 2020 / Accepted: 25 April 2020 / Published: 28 April 2020
(This article belongs to the Section Water Quality and Contamination)

Abstract

:
Although many previous studies have examined patterns of antimicrobial resistance (AMR) and multidrug resistance (MDR) from domestic animals and farm environments, comparatively little is known about the environmental sources and natural reservoirs of AMR and MDR. In this study, we collected stormwater runoff and soil samples from three watersheds in Texas. Escherichia coli (E. coli) were enumerated, isolated, and analyzed for resistance patterns. E. coli from all sites, irrespective of land use, displayed the presence of AMR/MDR. Higher levels of AMR/MDR were observed in water compared to soil. More isolates were resistant to cephalothin than other antibiotics. For water isolates, 94% was resistant to cephalothin, 27% to tetracycline, and 15% to ampicillin. Across all sites, a large percentage of water isolates demonstrated MDR with 34% resistant to ≥2 antibiotics and 11% to ≥3 antibiotics. All AMR soil isolates were resistant to cephalothin (87% of the total soil isolates), but only 8.9% were MDR. High cephalothin resistance observed in both soil and water suggests the presence of native, cephalothin-resistant E. coli. Higher MDR observed within water compared to the soil populations suggests that resistance sources other than soil, such as more recent fecal depositions as opposed to residual AMR in soil, could have contributed to higher antibiotic-resistant E. coli in runoff.

1. Introduction

Antibiotics are used globally in large quantities to protect human and animal health, and also as feed additives to augment animal productivity. Widespread use of antimicrobial agents has exacerbated the pervasive occurrence and spread of antibiotic-resistant bacteria and emergence of multidrug resistance (MDR). This is increasingly compromising the treatment of life-threatening diseases globally [1,2,3,4].
Antimicrobial resistance (AMR) can spread rapidly through environmental bacteria to pathogenic bacteria via horizontal gene transfer [5,6]. These nonpathogenic environmental bacteria therefore can potentially serve as a ubiquitous natural reservoir of resistance. Environmental reservoirs of AMR persist through a combination of naturally occurring resistance, discharge of human and animal waste into the environment, and transfer of MDR carrying mobile genetic elements [5,7,8]. In recent years, research has gained momentum on the topic of studying AMR and MDR in nonclinical and opportunistic environmental bacteria [5,6,7,8,9,10]. Some of these more recent studies on environmental resistance have revealed the prevalence of AMR and MDR in bacteria in soil [11,12,13], water bodies and watersheds [14,15,16,17,18,19,20,21,22,23,24], oceans [25]; glaciers [26], and animals [27,28]. For example, D’Costa et al. [11] found MDR in all 480 soil isolates they screened for the 21 major classes of antibiotics. Aquatic environments also serve as reservoirs of antibiotic resistant microorganisms—either consisting of intrinsic resistant populations or having such populations transferred from anthropogenic sources such as runoff from contaminated agricultural and aquaculture areas (8–9, 16). Naturally occurring antibiotic resistant bacteria present in the environment including soil, aquatic environments, and aquatic plants and animals may serve as an ideal source for the transfer of resistance and development of new resistant strains by mixing and horizontal gene transfer through various anthropogenic activities and sources [3,4,5].
In a recent report, the U.S. Centers for Disease Control (CDC) deemed tracking and identifying the gaps in our understanding of the environmental dissemination of AMR/MDR as one of the most important tasks for future control of the AMR issue [2]. Compared to clinical sources and transmission of AMR, limited attention has been given thus far to the impact of agricultural activities and land management practices on the prevalence of AMR/MDR among environmental bacteria and the resulting impacts [5,6,7,8,9]. The role of runoff from agricultural watersheds, such as the sites selected for this particular study, is especially critical as it represents a potential route of AMR/MDR transmission from the field to water bodies used for public recreation and/or drinking water sources. Studies such as this one can reflect several important aspects useful for implementing appropriate BMPs, such as the origin, role and distribution of AMR in these environments and the impact of agricultural management practices. Such research will also provide data on how resistance observed in soil contributes to that observed in runoff, how and to what extent AMR exists within the microbiome of lands with practically no externally applied antibiotics, and what factors control the persistence of such resistance in these watersheds.
While AMR/MDR exists within a diverse assortment of microorganisms, it is useful to focus on Escherichia coli (E. coli) as an indicator of AMR/MDR prevalence. E. coli is a natural inhabitant of the intestinal tracts of warm-blooded animals and is released into the environment via fecal deposition [29]. Therefore, E. coli is widely used as an indicator for fecal contamination in water [30]. Sources of E. coli in watersheds can include humans [31], wildlife [32], farm animals [33], and pets [34]. There is also a potential for some E. coli populations to survive in the environment and become naturalized in water, soil, and sediment over time [6]. Previous studies have demonstrated E. coli to be a useful indicator of AMR and MDR in many different natural and managed environments including soil and water sources [15,23,24,35,36,37,38]. Therefore, the objective of this study was to examine and identify the occurrence, distribution and patterns of AMR and MDR within E. coli isolates from soil and runoff samples collected from three different watersheds with varying land uses—i.e., improved hay pasture, native prairie, and cultivated cropland.

2. Materials and Methods

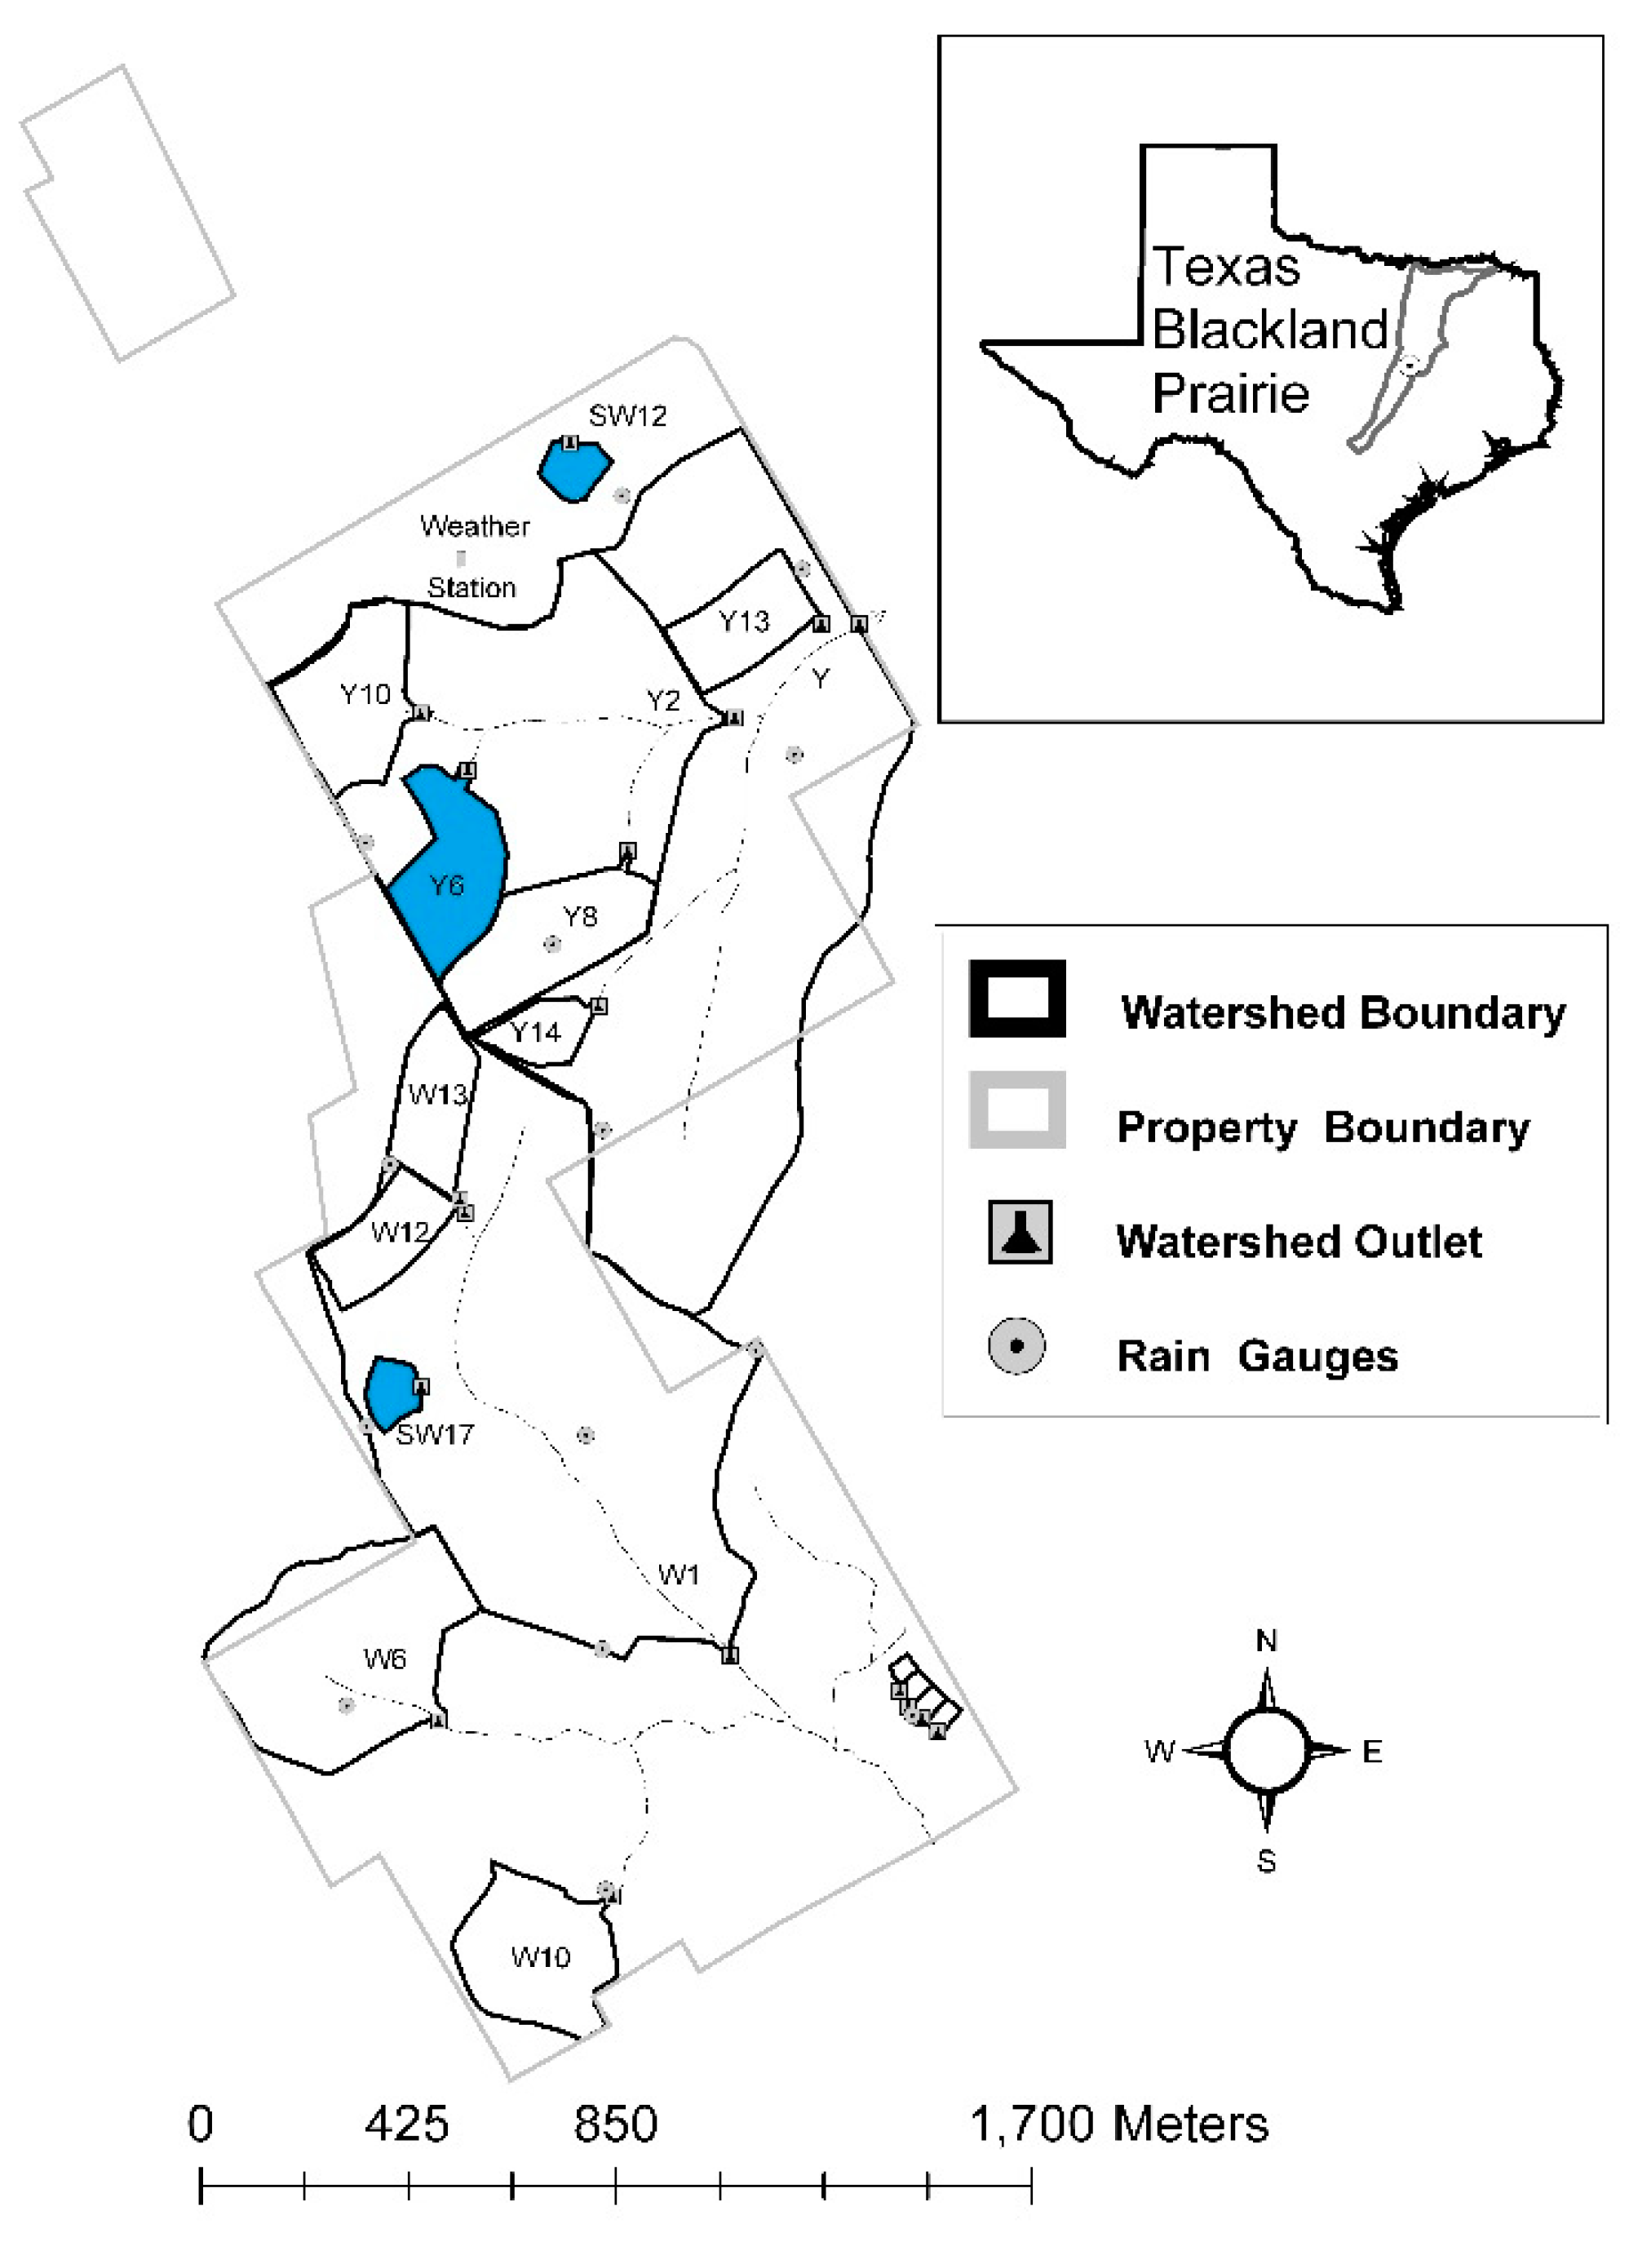
2.1. Site Description

The plots examined in this study are located at United States Department of Agriculture–Agricultural Research Service (USDA ARS) Grassland, Soil and Water Research Laboratory (GSWRL) near Riesel, TX, USA (Figure 1). Within GSWRL, the experimental watersheds representing improved hay pasture, native prairie and cultivated cropland were used for this study.
The native prairie (SW12) is a 1.2 ha remnant native prairie plot with a 3.8% slope that has been consistently managed since 1948 [39,40]. Management practices for the sites include mowing or haying interspersed with intermittent herbicide treatments and prescribed burns. The only manure inputs to this site are from wildlife sources.
The improved hay pasture (SW17) is a 1.2 ha coastal bermudagrass pasture with a 1.8% slope [39] that has predominantly been hayed for more than 50 years. Prior to this period, the plot was cropped to cotton, corn, oats or sorghum using conventional tillage techniques. Records between 1955 and 1999 do not document specific management activity. Cattle were grazed on the site from 2000 to 2010, and poultry litter applied at a rate of 6.8 Mg/ha (3 tons/ac) in 2011 and 2012.
The cultivated cropland field (Y6) is a 6.6 ha, terraced, conventionally cultivated cropland site with 3.2% slope [39,40] that has been continuously cropped since 1943. During the study, corn and wheat were grown. The plot received annual inorganic fertilizer and herbicide treatments as needed. The only manure inputs to this site are from wildlife sources.

2.2. Sampling Duration and Methods

Soil sampling—Soil samples were collected to a depth of approximately 5 cm with a 7.62 cm soil sampling probe along transects within each plot extending upslope from the inlet of the flow control structure to the edge of the plot. Sampling locations were randomly spaced along these transects but were targeted to capture the variability of conditions within each plot. Planned sampling was to occur during two sampling events and yield a total of 75 soil samples; 25 from each site. However, due to lack of culturable E. coli in samples collected during these events, two more sampling events producing 75 additional soil samples were conducted. Soil samples were collected on March 2014, June 2014, October 2014 and February 2015.
Water runoff sampling—Runoff samples for E. coli enumeration were collected October 1, 2013 through June 30, 2015 using automated ISCO Avalanche refrigerated samplers (Teledyne-ISCO, Inc., Lincoln, NE, USA). Runoff volume was measured using an ISCO bubble flow meter. Samplers were programmed to collect samples with each 1.32 mm of volumetric runoff depth produced by the respective plot as it flowed through the flow control structure. Upon each sampler activation, tubing extending from the sampler unit to the flow control structure was rinsed with ambient water prior to collection of a 50 mL sample. Samples collected were composited into a 16 L bottle [41] and were retrieved from the samplers upon cessation of flow or when a 24 h sample holding time approached and taken to the GWSRL laboratory. Bottles were well mixed prior to subsamples being poured into 532 mL Whirl-Pak® bags (Whirl-Pak®, Madison, WI, USA). Samples were then refrigerated at the GWSRL until delivery to SAML (Soil and Aquatic Microbiology Laboratory, Texas A&M University) on ice. A total of 26 samples were collected from the prairie site, 15 from the improved hay pasture and 22 from the cropland site. Runoff samples collected during January, March and April 2015 were used for E. coli isolation.

2.3. E. coli Isolation and Archiving from Environmental Samples

E. coli strains were isolated and enumerated from soil and runoff samples using the USEPA 1603 method [42]. E. coli colonies were isolated on mTEC agar plates from each water and soil sample following the serial dilution with Phosphate Buffer Saline (PBS) and filtering these dilutions using a 0.45 µm grid filter according to USEPA method 1603. The purple colonies appearing on the mTEC agar plates were then enumerated and 2–3 colonies randomly selected and streaked onto nutrient MUG (4-methylumbelliferyl-β-d-glucuronide) agar plates for verification, then archived at −80 °C for future study. A total of 283 E. coli isolates were prepared for AMR testing and DNA fingerprinting.

2.4. Antimicrobial Resistance Analysis

The Kirby Bauer disk diffusion [43] method was used to test for antimicrobial susceptibility in each isolate. Each isolate was streaked onto tryptose soy agar and incubated at 35 °C for 18–24 h. Following this, individual colonies were inoculated into tryptose soy broth and incubated at 37 °C with continuous shaking at 150 rpm in a temperature controlled incubator for 3 h, or until they obtained a turbidity of at least 0.5 McFarland’s standard (approximate concentration of 107–108 cfu mL−1). The culture suspension was then spread onto Mueller Hinton agar using a sterile cotton swab. Antibiotic disks were dispensed onto the agar plates using an automatic sterile disk dispenser and the plates were incubated at 37 °C overnight. Each isolate was tested for resistance to the following antibiotics—tetracycline (TE-30/disk potentcy−30 µg), ampicillin (AM-10/10 µg), cephalothin (CF-30/30 µg), imipenem (IPM-10/10 µg), gentamicin (GM-120/120 µg), sulfamethoxazole (SXT/23.75 µg), and ciprofloxacin (CIP-5/5 µg). These antibiotics were chosen to represent the majority of classes of antimicrobials, as well as known effectivity against wildtype E. coli. Three reference strains, Pseudomonas aeruginosa (ATCC 27853), Staphylococcus aureus (ATCC 25923), and E. coli (ATCC 25922), were used as controls. Images of the plates were obtained by using the UVP GelDoc-It imaging system and the zone diameter measurements were taken using the software ImageJ [44]. Based on the inhibition zone diameter, isolates were grouped as resistant, intermediate or susceptible as per the manufacturer parameters (BD BBL™ Sensi-Disc™, Becton Dickinson and Company, Franklin Lakes, NJ, USA).

2.5. ERIC-PCR/Riboprinting Composite Fingerprinting and BioNumerics Analysis

Cell suspensions from the archived E. coli isolates from both soil and water samples were fingerprinted using ERIC-PCR (Enterobacterial Repetitive Intergenic Consensus-Polymerase Chain Reaction)—Riboprinting method [45,46]. Isolates were PCR amplified using the ERIC primers (ERIC1R-5′ATGTAAGCTCCTGGGGATTCAC and ERIC2-5′AAGTAAGTGACTGGGGTGAGCG). Each reaction was of 50 µL volume consisting of 1X PCR buffer with Mg, 200 µmol L−1 of dNTP (Amersham Biosciences, Piscataway, NJ, USA), 600 nmol L−1 of each ERIC primer (Invitrogen, Carlsbad, CA, USA), 1.5 µg µL−1 bovine serum albumin (BSA), and 2.5 units of AmpliTaq Gold (Applied Biosystems, Foster City, CA, USA). Each reaction consisted of 5 µL of cell suspension to be analyzed in molecular grade water. The PCR cycling conditions used in Eppendorf Mastercycler AG was—initial denaturation at 95 °C for 10 min, followed by 35 cycles of denaturation at 94 °C for 30 s, annealing at 52 °C for 1 min, extension at 72 °C for 5 min, and then a final extension step at 72 °C for 10 min. The PCR products were stored at −20 °C until they were analyzed on 2% agarose gel electrophoresis prepared in Tris-borate-EDTA buffer with ethidium bromide (0.5 µg/mL). The 100 bp increment DNA ladder used was DNA Marker XIV; Roche Molecular, Indianapolis, IN, USA. A quality control strain, E. coli QC101 (ATCC 51739), and a no-template control was run for each PCR batch.
For the Riboprinting method, DNA fingerprints of the same isolates were generated using the DuPont Riboprinter System which automates the restriction fragment length polymorphism method by targeting the rRNA coding region of the bacterial genome ultimately generating an image of the banding pattern. The ERIC-Riboprint composite fingerprints were compared on BioNumerics (Applied Maths) using a similarity matrix based on the Pearson correlation with UPGMA clustering method, to generate a multi-dimensional scaling analysis comparison (MDS) between the soil and water isolates.

2.6. Statistical Analysis

A Chi square test for independence was applied to test for significant differences between E. coli antibiotic susceptibility and resistance proportions based on sites, soil vs. water, between antibiotics tested, and time of sample collection. Time of sample collection was binned to Early and Late Spring 2015 (water isolates), and Spring/Summer 2014 and Early Fall 2014 (soil isolates). Isolates were not further binned to avoid asymptotic Chi square cells. Any tested relationship was considered to be significant at p < 0.05, or when the Chi square sum was greater than 3.84. An exact McNemar’s Chi square test for 2 × 2 tables was included to test for association between isolates based on binned time of sample collection. Post hoc multicomparison tests were carried out, where appropriate, by conducting pairwise Chi square tests with Bonferonni adjusted p-values for site and time of sample collection, respectively.

3. Results

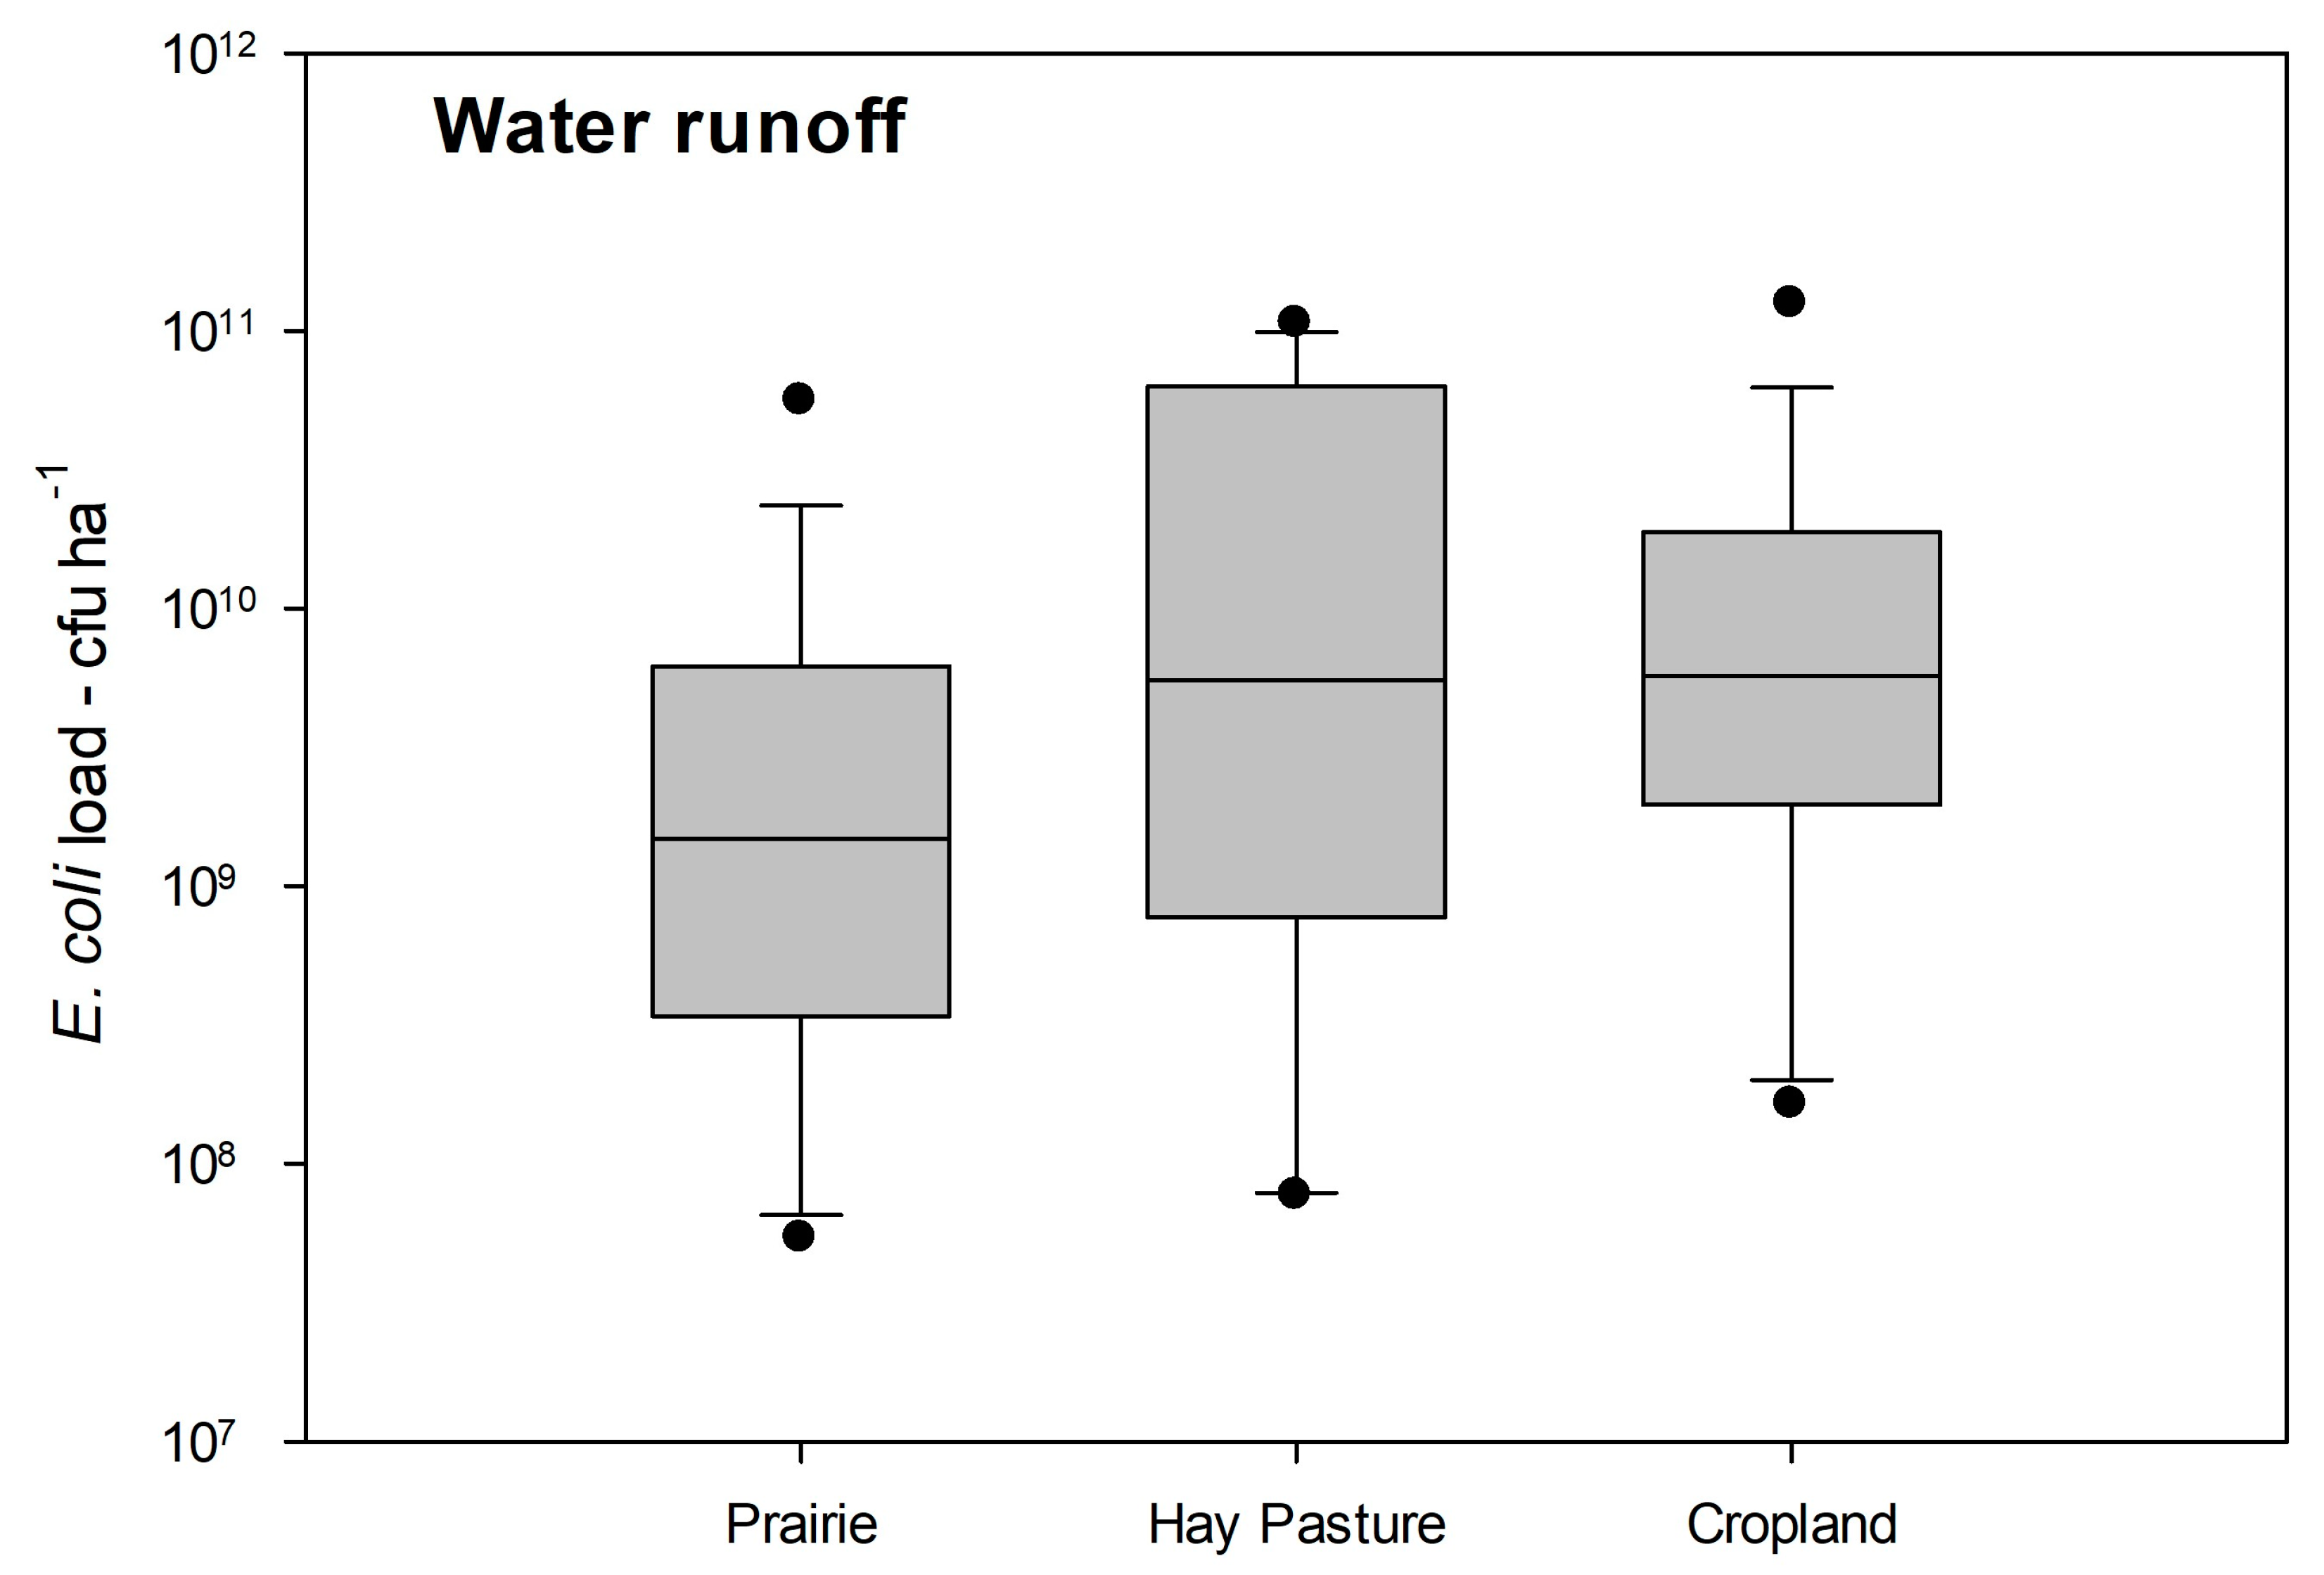
3.1. E. coli Population Within the Three Sites—Water Runoff vs. Soil

The prairie exhibited the lowest E. coli loads in runoff (1.5 × 10⁹ cfu ha−1) relative to the other sites. The hay pasture and cropland displayed little difference in their respective E. coli loads in the runoff (5.5 × 10⁹ and 5.7 × 10⁹ cfu ha−1 in hay pasture and cropland respectively) (Figure 2). Soil E. coli geometric means were generally low with 11 to 16 cfu/g soil at the three sites. The large difference between the E. coli levels in soil and the water runoff samples (Figure 2), demonstrates the limited contribution of soil to E. coli in the runoff samples. This was further supported by the AMR analysis data (Results Section 3.2).

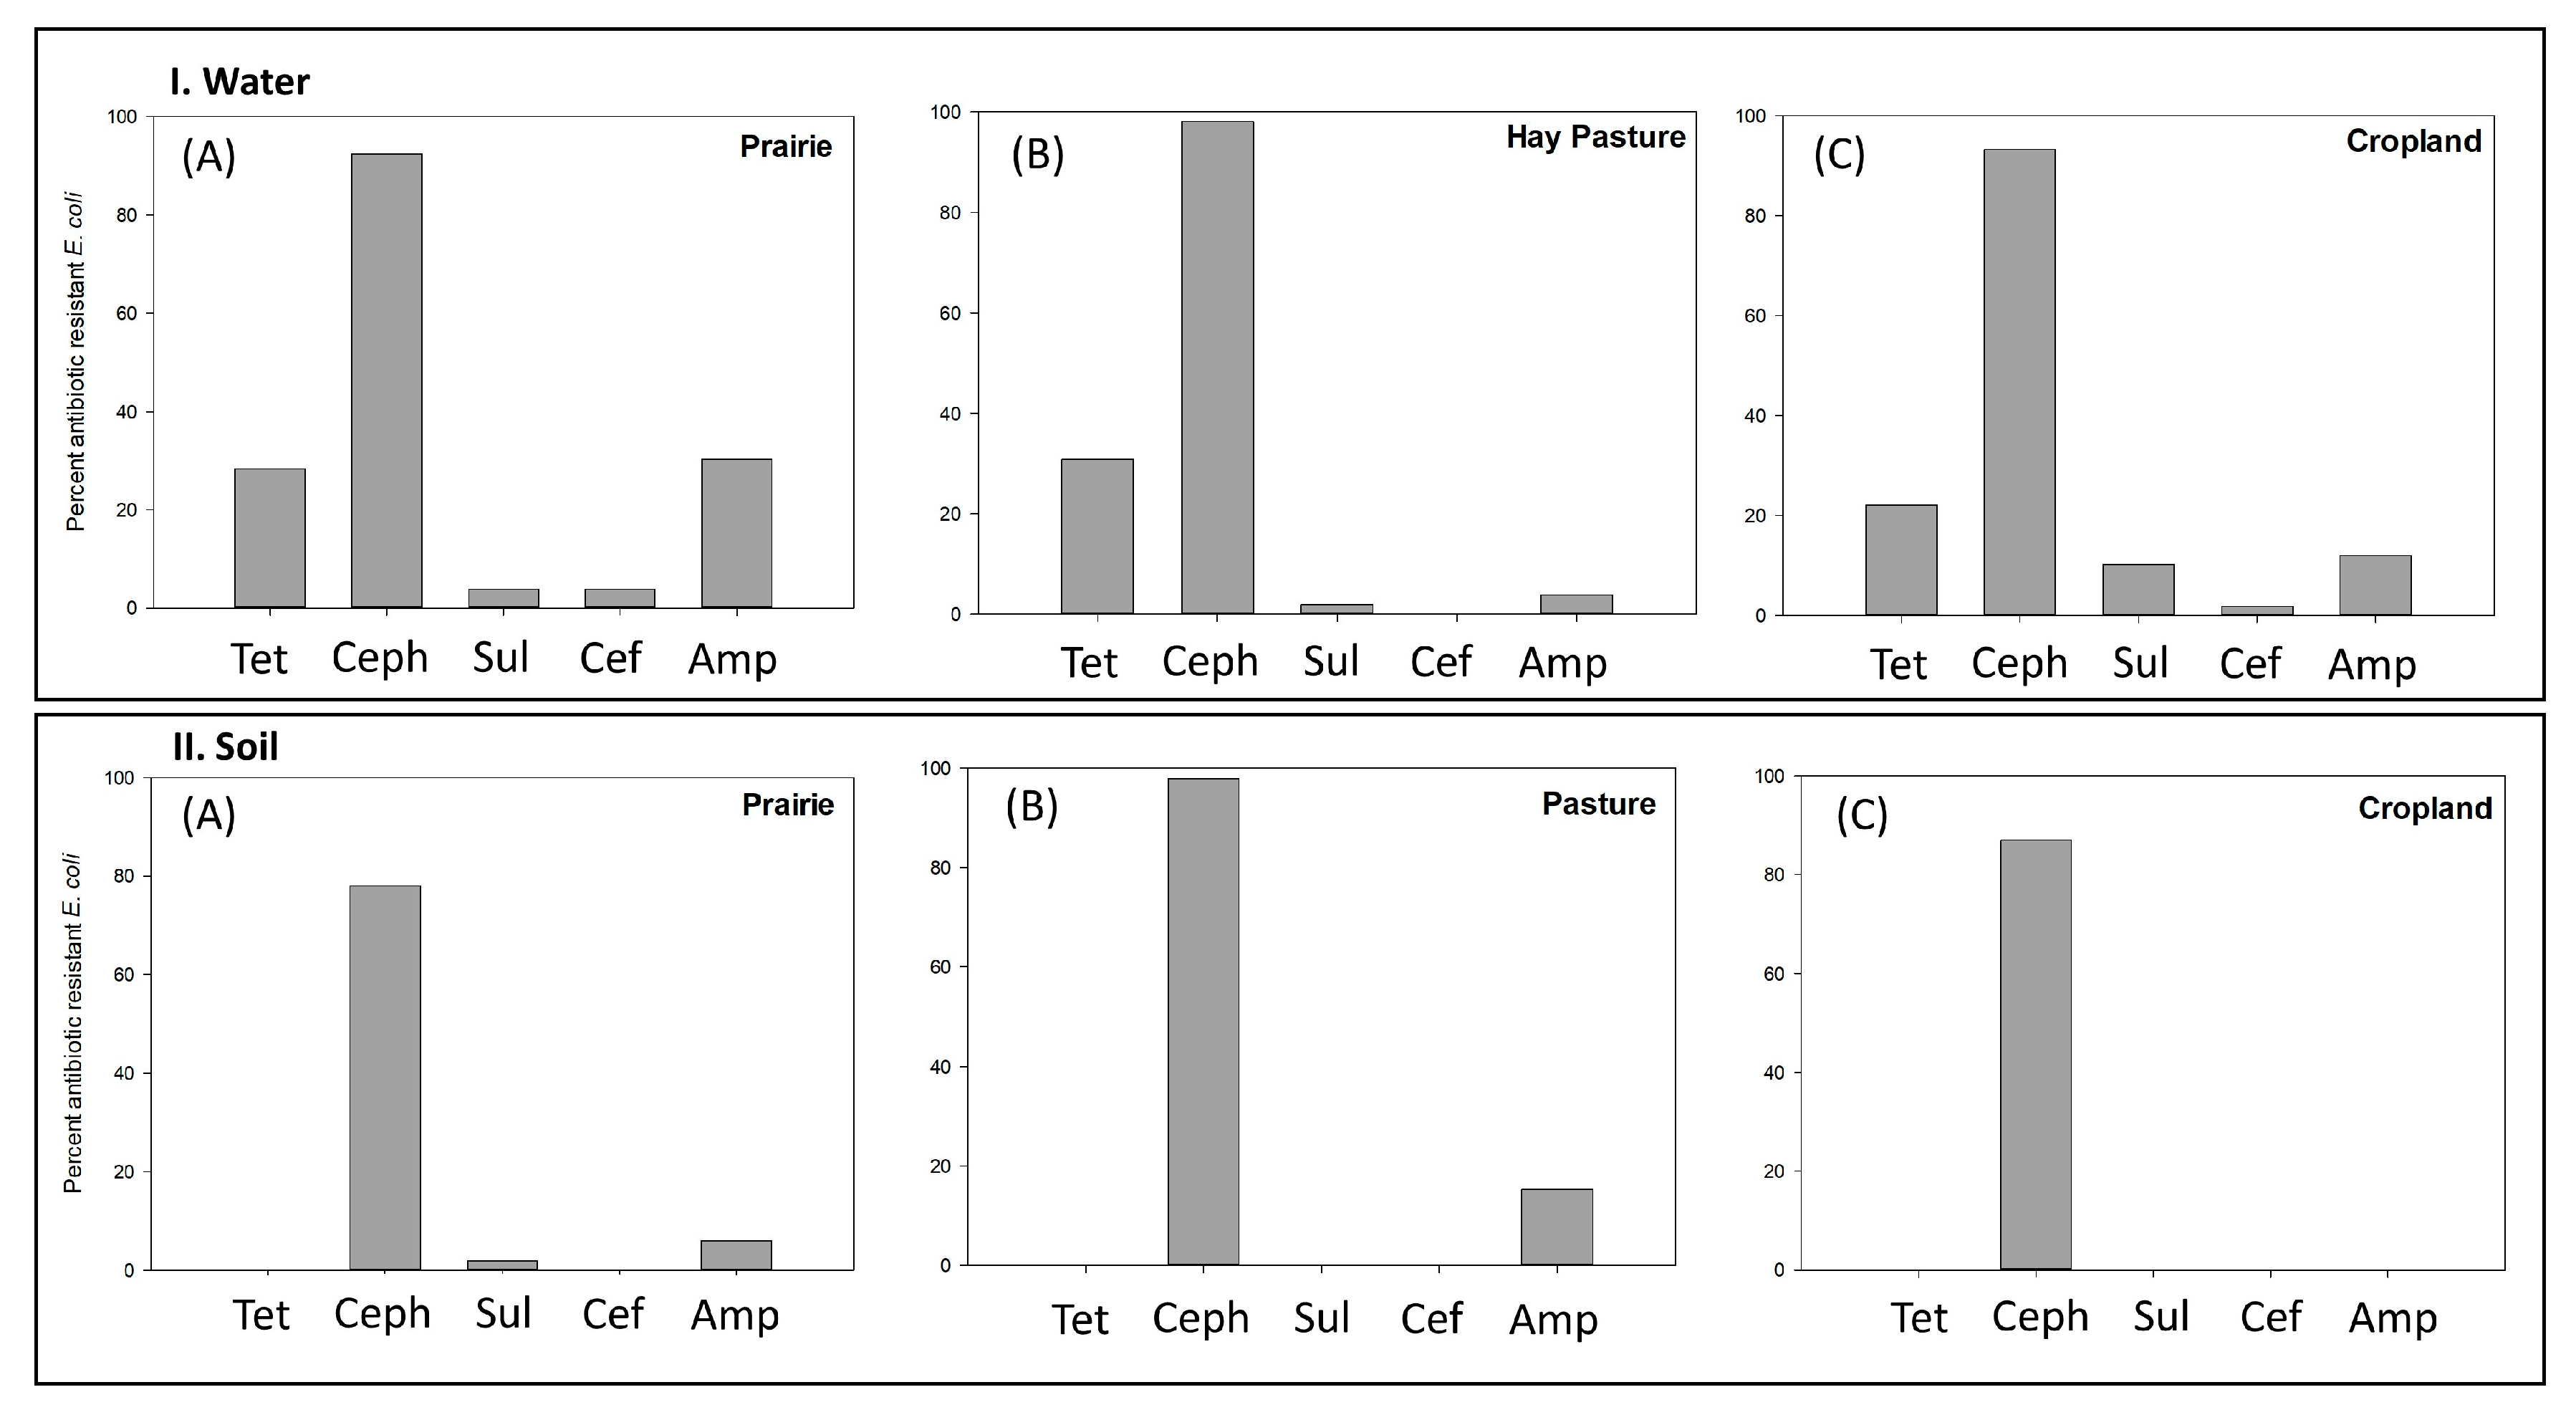
3.2. Percentage of Antimicrobial Resistance within the Three Study Sites—Water Runoff vs. Soil

Overall, E. coli AMR was higher in the water isolates (Figure 3I) than in the soil isolates (Figure 3II). Cephalothin resistance was highest in all samples, both water and soil. The prairie, hay pasture, and cropland sites exhibited 93%, 98.1% and 93.2% cephalothin resistance in the water isolates (Figure 3I), and 78%, 97.8%, and 86.9% in the soil isolates (Figure 3II), respectively. In runoff water, 28.3% of prairie, 30.8% of hay pasture and 22% of cropland isolates were resistant to tetracycline; however, no resistance to tetracycline was observed in the soil isolates. In water runoff samples, ampicillin resistance was present in 30.2% of the prairie isolates, 3.8% of the hay pasture and 11.9% of the cropland isolates. In contrast, 6%, 15.2% and 0% of soil isolates were resistant to ampicillin in the prairie, hay pasture and cropland, respectively. Resistance to sulfamethoxazole was comparatively lower within the water runoff E. coli—3.8%, 1.9% and 10.2% in prairie, hay pasture and cropland respectively, while the prairie site was the only site exhibiting resistance to sulfamethoxazole (2%) among the soil isolates. 3.8% of the isolates were resistant to cefoperazone in prairie runoff, 1.7% in cropland runoff, and 0% in hay pasture runoff. None of the water or soil isolates were resistant to gentamicin, ciprofloxacin or imipenem. When comparing the AMR between the three sites, a Chi square analysis of the runoff samples revealed a significant pairwise difference in ampicillin resistance between the hay pasture and prairie (Figure S1). Runoff isolates from prairie sites demonstrated more ampicillin resistance than pasture sites after multicomparison correction (p < 0.005). Soil isolate resistance to cephalothin was also site dependent, with isolates collected at pasture sites more resistant than ones collected at prairie sites after multicomparison correction (p < 0.05). When comparing resistance between soil and runoff samples, significant differences were observed for tetracycline at all three sites (prairie p < 0.0005; hay pasture p < 0.0005; cropland p < 0.02), as well as cephalothin (p < 0.05) and ampicillin (p < 0.001) in prairie isolates; (Figure S2). Proportions of soil E. coli isolates resistant to ampicillin was also dependent on time of sample collection as samples collected in Early Fall of 2014 were significantly (p < 0.05) more resistant compared with samples collected in the Spring and Summer of 2014. Similarly, runoff isolates were also significantly more resistant to tetracycline and ampicillin when collected in the latter half of Spring 2015 compared with early Spring 2015 (p < 0.005). Results of McNemar’s test indicated that resistance associated with isolates was affected by time of collection (p < 0.01).

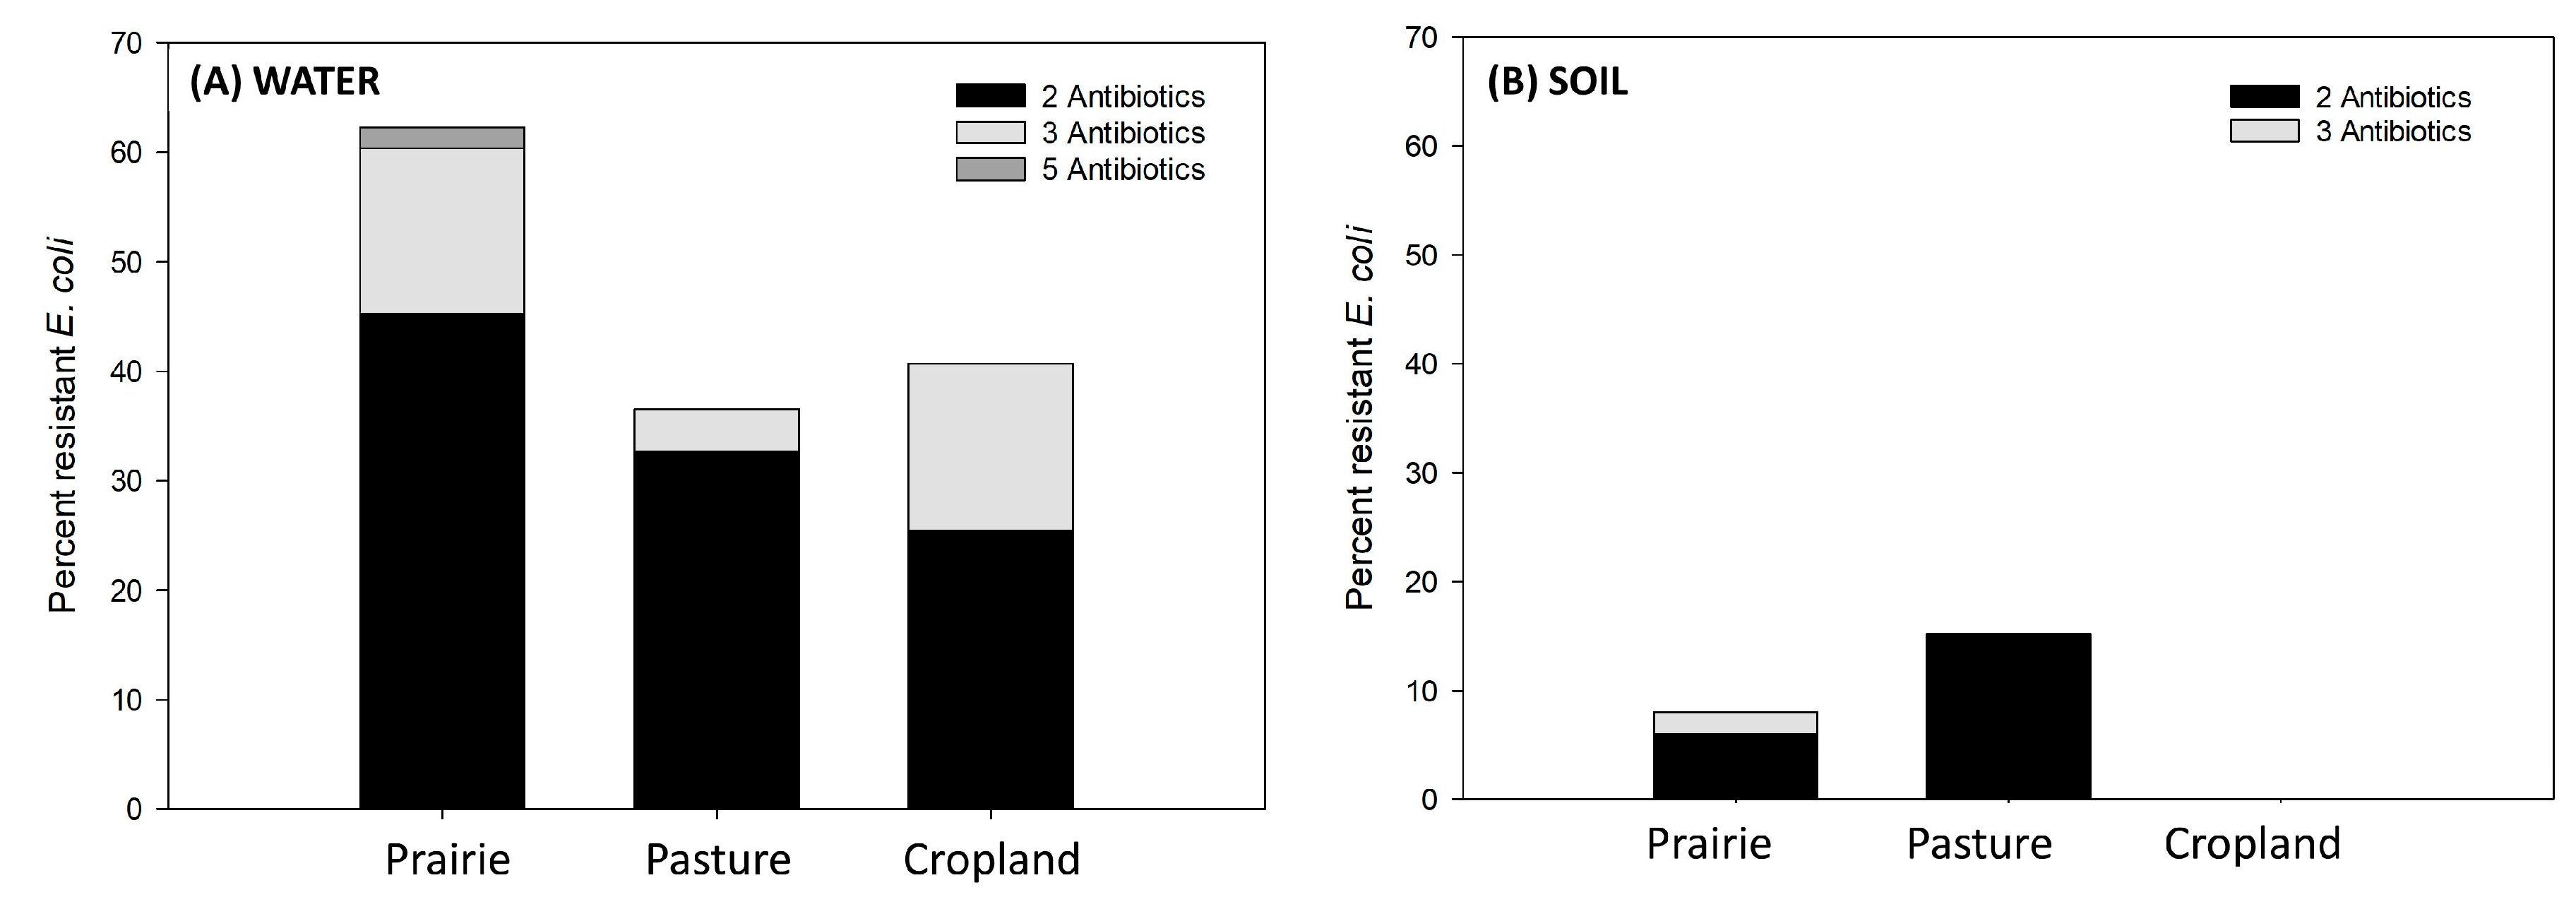
3.3. Percentage of MDR within the Three Study Sites—Water Runoff vs. Soil

Consistent with the findings of the overall differences in AMR between water and soil isolates (Figure 3), the water isolates exhibited higher MDR (resistance to ≥2 antibiotics) (Figure 4A) when compared to the soil population (Figure 4B). Within the water population, the highest overall MDR was observed in prairie runoff (45.3%), followed by hay pasture (32.7%) and cropland runoff (25.4%) (Figure 4A), while in the soil population, MDR was much lower—6% in the prairie, and 15.2% in the hay pasture and none observed in the cultivated cropland site (Figure 4B). Further, within the prairie runoff, 15% were resistant to ≥3 antibiotics, and 1.9% were resistant to 5 antibiotics. Within the hay pasture runoff, 3.8% exhibited resistance to ≥3 antibiotics; and within the cropland site, 15.2% were resistant to ≥3 antibiotics. Only 2% of the soil E. coli population in the prairie site showed resistance to ≥3 antibiotics. No MDR was observed in the soil E. coli population from the cropland site. Statistical analysis using the Chi square test for independence revealed that the water isolates demonstrated a significantly higher MDR compared to the soil isolates within all three sites (p < 0.0005 for resistance to >2, >3 and >4 antibiotics) (Figure S3). Significantly higher MDR was observed for cropland runoff isolates followed by hay pasture and prairie isolates (for ≥3 antibiotics category). Within the soil samples, while the hay pasture demonstrated greater resistance compared to the cropland (p < 0.05 for the ≥2 antibiotics category) and prairie (p < 0.05 for the ≥1 antibiotic category) (Figure S4).

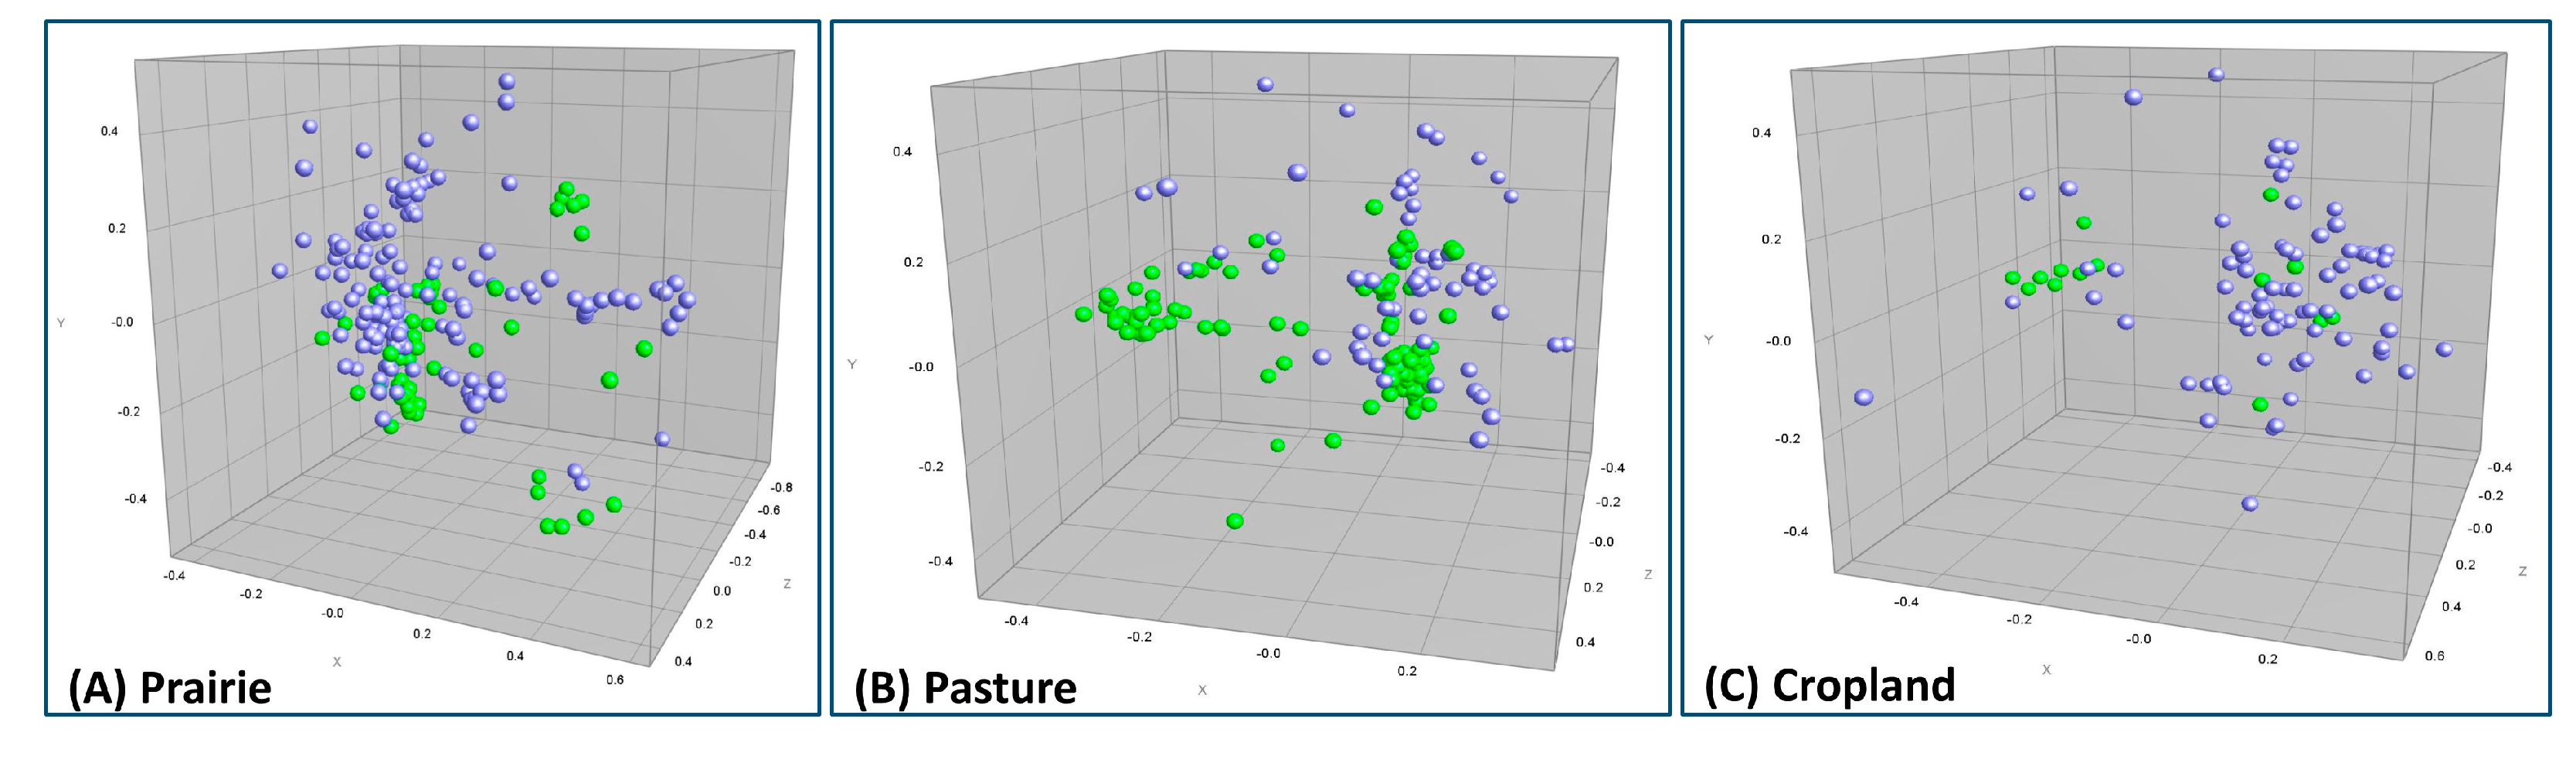
3.4. Composite ERIC-RP Fingerprint Comparison between Runoff and Soil E. coli Isolates

In support of the AMR/MDR and E. coli enumeration results, the MDS analysis (Figure 5) of the E. coli DNA fingerprints revealed that the genotypes of the isolates varied considerably at each site. There was a substantial overlap of the genotypes found in water and soil, as shown by many of the soil isolates grouping within the water isolates. However, several of the water isolates were unique genotypes that were not seen in the soil.

3.5. AMR and MDR within Study Sites per Hectare

Among all of the screened antibiotics, the total load of cephalothin-resistant E. coli was the highest in runoff at all sites (Figure S5). Interestingly, while no tetracycline resistant E. coli was observed within any of the soil samples (Figure 3II), runoff samples showed a high tetracycline resistance (Figure S5) (2 × 10⁹, 9 × 10⁹ and 4 × 10⁹ cfu ha−1 rainfall event−1 in the prairie, hay pasture and cropland sites, respectively). MDR per hectare in the runoff samples was highest overall in the hay pasture (8.4 × 10⁹ cfu ha−1 runoff event−1 for resistance to ≥2 antibiotics, and 1.1 × 10⁹ cfu ha−1 runoff event−1 for resistance to ≥3 antibiotics) (Figure S6). Only the prairie site displayed E. coli resistance to 5 antibiotics (1.4 × 10⁸ cfu ha−1 runoff event−1).

4. Discussion

A large difference was observed in the AMR and MDR patterns of E. coli between the soil and the runoff samples. This is also supported by the observation that soil E. coli levels were far less than in the runoff E. coli, suggesting that a majority of the antibiotic resistant E. coli observed in the runoff samples did not originate from the soil. This is also supported by the variations in E. coli genetic fingerprint records between soil and water runoff. While a substantial difference was observed in AMR between soil and water runoff, not much variance was observed between sites/land uses with the exception of ampicillin in runoff which was 30% in the prairie site compared to 2% in the hay pasture and 12% in cropland. While MDR was higher in runoff isolates than soil isolates, MDR varied largely between the sites. All of this together provides strong evidence that the E. coli populations present in the soil contributed little to the E. coli within the runoff population. Furthermore, the observation that hay pasture and cultivated land uses had similar E. coli AMR levels is interesting because both the native prairie and cultivated cropland did not receive any manure with antibiotics, whereas the improved pasture received manure deposition from cattle that have received antibiotics together with poultry litter, which may also contain antibiotics. There was variability in the proportion of E. coli isolates resistant to some individual antibiotics over time which could be a confounding issue since our water and soil isolates were collected at different time points; however, overall antibiotic resistance and MDR were not impacted by sampling time and were significantly higher in the water isolates. It appears likely that background animal sources, such as recent fecal deposits from wildlife and birds that may have migrated into these sites for a short period of time, may have been predominant sources. This hypothesis is consistently supported by—(A) the large differences in AMR/MDR of E. coli populations observed between the water runoff and soil population, (B) the presence of substantially lower numbers of E. coli in the soil in comparison to the water runoff samples, and (C) the variations between soil vs. runoff observed in the ERIC-Riboprint E. coli fingerprints.
E. coli isolates from all sources in this study displayed a very high resistance to the antibiotic cephalothin, followed by tetracycline and ampicillin. Cephalothin is a first-generation cephalosporin, and a general trend of increasing resistance to this antibiotic in Enterobactericae has been recorded [20,47] (Brooks, unpublished data). The uniform pattern of high cephalothin resistance in the soil and water isolates may suggest the presence of a native population of cephalothin-resistant bacteria within our study sites. The fact that two of the watersheds have little or no inputs of livestock antibiotics also suggests that a large part of the resistance observed originated from a naturalized E. coli population present in these sites. These results are consistent with findings from other studies [15,48,49,50]. Sayah et al. (2005) [15] found very high cephalosporin (cephalothin) resistance (as high as 80.6%) in E. coli isolates—in surface water samples in the Red Cedar watershed in central Michigan. Similarly, Janezic et al. (2013) [49] and an unpublished study in the Carter’s Creek watershed in central Texas [50] reported high cephalothin resistance (80% and 84%, respectively) in surface water samples.
Tetracycline resistance in our water isolates (22.2% averaged over the three sites) was also comparable to previous studies. Sayah et al. 2005 [15] observed a 27.3% tetracycline resistance, whereas another study in the Carter’s Creek watershed in Texas (Sullivan et al., 2013) [19] also found a substantial occurrence of tetracycline resistant genes in both sediment and surface water samples. Holvoet et al. (2013) [51] found only 1.8% of the 171 soil E. coli isolates were resistant to tetracycline, consistent with the observations in this study, where no isolate from the soil samples was found to be resistant to tetracycline.
Holvoet et al. (2013) [51] also observed that 7% of soil isolates were resistant to ampicillin, comparable to the results from this study. In contrast, the water E. coli demonstrated a much higher resistance to ampicillin, particularly in the prairie site. Ibekwe et al. (2011) [35] reported ~5% ampicillin resistance in most of their surface water sites, Castillo et al. (2013) [37] reported a higher rate of ampicillin resistance in the San Pedro river watershed (39.3%), whereas Laird (2016) [50] found ampicillin resistance to be between 5–28% in the Carter’s Creek watershed.
Sulfamethoxazole resistance detected in this study was within the range of lower values reported in earlier studies–Sayah et al. (2005) [15] observed an overall 2.4% resistance, whereas Ibekwe et al. (2011) [35] detected a higher resistance (38% in sediment and 39% in surface water), and Servais et al. (2009) [23] reported an overall 16% resistance to sulfamethoxazole in a Seine river watershed.
Resistance to imipenem, a group 2 carbapenem, is usually considered the last line of defense against resilient Gram-negative pathogens [52], and is therefore used extremely cautiously in treatment. Consequently, within the three sites investigated, where there has been little human or animal intervention in the recent years, except for the intermittent presence of wildlife, resistance to this antibiotic was not observed, as expected.
Occurrence of resistance to multiple antibiotics in E. coli isolated from different sources such as soil, sediment, water, animals and wildlife, have been reported in several previous studies [15,24,36,37,38,53]. Earlier studies have reported the presence of AMR and MDR within ecosystems least affected by agricultural, clinical or industrial practices to exhibit substantial E. coli resistance to antibiotics, and the phenomenon has been attributed to the presence of wildlife, birds and domestic animals in these sites, functioning as reservoirs of AMR with the ability to propagate over longer distances [2,3,4]. MDR in recent years has been defined by ‘resistance to three or more antimicrobial classes’ [54]. In addition to reporting our data in these standard terms, we have also included the category of resistance to ≥ 2 antibiotics in our results with an objective to providing a better resolution of AR observed, in accordance with several other similar studies [15,36,37,53]. The significant differences (p < 0.0005) in MDR observed between the soil and runoff isolates provide additional evidence for the fact that E. coli present in the soil had very little contribution to the E. coli load found in the water runoff samples. The range of resistance to three or more antibiotics observed in the water isolates in the three sites (3.9–13.6%) fell within the range or higher than some of the previously described studies (~0–6% in Sayah et al., 2005 [15], ~0–10% in Blaak et al., 2015 [36], ~0–5% in Maal Bared et al., 2013 [53], and 13% in Castillo et al., 2013 [37]. The resistance to two or more antibiotics we observed in runoff (15–24%) was comparable to that of prior studies—<10% in Sayah et al., 2006 [15], <20% in Maal Bared et al., 2013 [53], and 37.3% in Castillo et al., 2013 [37].

5. Conclusions

Most previous AMR studies have examined sites either engaged in animal agricultural or in close proximity to industrial activities, and consequently, with high potential for prevalence of E. coli with resistance to antibiotics and MDR. This study utilized field-scale research to provide much needed real-world data on bacteria in the environment. While the improved pasture examined in this study has received manure deposition from cattle that have received antibiotics and has received poultry litter, which may contain antibiotics, the native prairie and cultivated cropland sites in this study are not grazed and do not receive animal manure application. Therefore, it was surprising to find that the percentages of AMR and MDR were so high and comparable in these sites, suggesting that even such environments with limited agricultural, human, or industrial influences may also be reservoirs of persistent AMR microbial populations in the environment. It is also important to note here that these results represent AMR detected only within the E. coli population from the three study sites, serving as an indicator of potential presence of other microorganisms displaying similar resistance patterns. Further studies directed towards whole community AMR profiling may shed light on the overall resistance present within the microbial community of such sites.

Supplementary Materials

The following are available online at https://www.mdpi.com/2073-4441/12/5/1251/s1, Figure S1: Chi-square test values for rates of isolate resistance between runoff and soil in sampling sites by antibiotic. A significant difference (p < 0.05) between sites existed for test values > 3.84 (critical value for 1 degree of freedom). Orange shaded cells are tests that reported a significant difference in isolate resistance rates for that antibiotic. Blue shaded values were significant after the Chi-square but not after Bonferonni correction. Cells with no value (-) indicate that no isolate resistance was detected at one of the sites. Figure S2: Chi-square test values for rates of isolate resistance runoff vs. soil in all sampling sites for each antibiotic. A significant difference (p < 0.05) between sites existed for test values > 3.84 (critical value for 1 degree of freedom). Orange shaded cells are tests that reported a significant difference in isolate resistance rates for that antibiotic. Cells with no value (-) indicate that no isolate resistance was detected at one of the sites. Figure S3: Chi-square test values for rates of isolate MDR runoff vs. soil in all sampling sites. A significant difference (p < 0.05) between sites existed for test values > 3.84 (critical value for 1 degree of freedom). Orange shaded cells are tests that reported a significant difference in isolate resistance rates for that antibiotic. Cells with no value (-) indicate that no isolate resistance was detected at one of the sites. Figure S4: Chi-square test values for rates of isolate MDR between all sampling sites within runoff and soil isolates. A significant difference (p < 0.05) between sites existed for test values > 3.84 (critical value for 1 degree of freedom). Orange shaded cells are tests that reported a significant difference in isolate resistance rates for that antibiotic. Cells with no value (-) indicate that no isolate resistance was detected at one of the sites. Figure S5: Total antibiotic resistant E. coli (cfu) observed within each of the three sites, (A) Prairie, (B) Pasture and (C) Cropland in water runoff per rainfall event per hectare. Tet–Tetracycline, Ceph–Cephalothin, Sul–Sulfamethoxazole, Cef–Cefoperazone, Amp–Ampicillin. Figure S6: Total multidrug resistant (MDR) E. coli (cfu) observed, (A) per hectare per rainfall event (runoff) and (B) per hectare of soil within each of the three sites Prairie, Pasture and Cropland.

Author Contributions

Conceptualization, M.M., T.G., D.H., L.G. and K.W.; methodology, M.M., T.G., H.M. and J.P.B.; formal analysis, M.M., H.M. and L.G.; data curation, M.M. and L.G.; writing—original draft preparation, M.M.; writing—review and editing, M.M., T.G., J.P.B., D.H., L.G. and K.W.; supervision, T.G., D.H. and K.W.; project administration, D.H., L.G., K.W. and T.G.; funding acquisition, K.W., D.H. and T.G. All authors have read and agreed to the published version of the manuscript.

Funding

This research was supported by the Texas State Soil and Water Conservation Board and Texas A&M AgriLife Research.

Acknowledgments

We acknowledge Pauline Wanjugi and Emily Martin for laboratory assistance in this work.

Conflicts of Interest

The authors declare no conflict of interest.

References

  1. Kumar, K.; Gupta, S.C.; Chander, Y.; Singh, A.K. Antibiotic use in agriculture and its impact on the terrestrial environment. Advan. Agronom. 2005, 87, 1–54. [Google Scholar]
  2. Center for Disease Control—Antibiotic Resistance Threats in the United States. 2019. Available online: https://www.cdc.gov/drugresistance/pdf/threats-report/2019-ar-threats-report-508.pdf (accessed on 27 April 2020).
  3. Friedman, N.D.; Temkin, E.; Carmeli, Y. The negative impact of antibiotic resistance. Clin. Microbiol. Infect. 2016, 22, 416–422. [Google Scholar] [CrossRef] [PubMed]
  4. Eliopoulos, G.M.; Cosgrove, S.E.; Carmeli, Y. The impact of antimicrobial resistance on health and economic outcomes. Clin. Infec. Dis. 2003, 36, 1433–1437. [Google Scholar] [CrossRef] [PubMed]
  5. Allen, H.K.; Donato, J.; Wang, H.H.; Cloud-Hansen, K.A.; Davies, J.; Handelsman, J. Call of the wild: Antimicrobial resistance genes in natural environments. Nat. Rev. Microbiol. 2010, 8, 251–259. [Google Scholar] [CrossRef]
  6. Wellington, E.M.H.; Boxall, A.B.A.; Cross, P.; Feil, E.J.; Gaze, W.H.; Hawkey, P.M.; Johnson-Rollings, A.S.; Jones, D.L.; Lee, N.M.; Otten, W.; et al. The role of the natural environment in the emergence of antimicrobial resistance in Gram-negative bacteria. Lancet. Infect. Dis. 2013, 13, 155–165. [Google Scholar] [CrossRef]
  7. Martinez, J.L. Antibiotics and antimicrobial resistance genes in natural environments. Science 2008, 321, 365–367. [Google Scholar] [CrossRef]
  8. Wright, G.D. Antimicrobial resistance in the environment: A link to the clinic? Curr. Opin. Microbiol. 2010, 13, 589–594. [Google Scholar] [CrossRef]
  9. Zhang, X.; Zhang, T.; Fang, H.H.P. Antimicrobial resistance genes in water environment. Appl. Microbiol. Biotechnol. 2009, 82, 397–414. [Google Scholar] [CrossRef]
  10. Singer, A.C.; Shaw, H.; Rhodes, V.; Hart, A. Review of antimicrobial resistance in the environment and its relevance to environmental regulators. Front. Microbiol. 2016, 7, 1728. [Google Scholar] [CrossRef] [Green Version]
  11. D’costa, V.M.; McGrann, K.M.; Hughes, D.W.; Wright, G.D. Sampling the antibiotic resistome. Science 2006, 311, 374–377. [Google Scholar] [CrossRef] [Green Version]
  12. Allen, H.K.; Moe, L.A.; Rodbumrer, J.; Gaarder, A.; Handelsman, J. Functional metagenomics reveals diverse beta-lactamases in a remote Alaskan soil. ISME J. 2009, 3, 243–251. [Google Scholar] [CrossRef] [PubMed]
  13. Riesenfeld, C.S.; Goodman, R.M.; Handelsman, J. Uncultured soil bacteria are a reservoir of new antimicrobial resistance genes. Environ. Microbiol. 2004, 6, 981–989. [Google Scholar] [CrossRef] [PubMed]
  14. Vaz-Moreira, I.; Nunes, O.C.; Manaia, C.M. Bacterial diversity and antimicrobial resistance in water habitats: Searching the links with the human microbiome. FEMS Microbiol. Rev. 2014. 38, 761–818.
  15. Sayah, R.S.; Kaneene, J.B.; Johnson, Y.; Miller, R.S. Patterns of antimicrobial resistance observed in Escherichia coli isolates obtained from domestic- and wild-animal fecal samples, human septage, and surface water. Appl. Environ. Microbiol. 2005, 71, 1394–1404. [Google Scholar] [CrossRef] [PubMed] [Green Version]
  16. Baquero, F.; Martınez, J.M.; Canto, R. Antibiotics and antimicrobial resistance in water environments. Curr. Opin. Biotech. 2008, 19, 260–265. [Google Scholar] [CrossRef]
  17. Cho, S.; Hiott, L.M.; McDonald, J.M.; Barrett, J.B.; McMillan, E.A.; House, S.L.; Adams, E.S.; Frye, J.G.; Jackson, C.R. Diversity and antimicrobial resistance of Enterococcus from upper Oconee Watershed, Georgia. J. Appl. Microbiol. 2019, 128, 1221–1233. [Google Scholar] [CrossRef]
  18. Sullivan, B.A.; Karthikeyan, R. Occurrence and prevalence of tetracycline resistant bacteria in a rapidly urbanizing subtropical watershed. J. Nat. Environ. Sci. 2011, 2, 25–31. [Google Scholar]
  19. Sullivan, B.A.; Gentry, T.J.; Karthikeyan, R. Characterization of tetracycline-resistant bacteria in an urbanizing subtropical watershed. J. Appl. Microbiol. 2013, 11, 774–785. [Google Scholar] [CrossRef]
  20. Brooks, J.P.; Adeli, A.; McLaughlin, M.R. Microbial ecology, bacterial pathogens, and antibiotic resistant genes in swine manure wastewater as influenced by three swine management systems. Water Res. 2014, 57, 96–103. [Google Scholar] [CrossRef]
  21. Zhang, X.; Li, Y.; Liu, B.; Wang, J.; Feng, C.; Gao, M.; Wang, L. Prevalence of veterinary antibiotics and antibiotic-resistant Escherichia coli in the surface water of a livestock production region in northern China. PLoS ONE 2014, 9, e111026. [Google Scholar] [CrossRef]
  22. Watkinson, A.J.; Murby, E.J.; Kolpin, D.W.; Costanzo, S.D. The occurrence of antibiotics in an urban watershed: From wastewater to drinking water. Sci. Tot. Environ. 2008, 407, 2711–2723. [Google Scholar] [CrossRef] [PubMed]
  23. Servais, P.; Passerat, J. Antimicrobial resistance of fecal bacteria in waters of the Seine river watershed (France). Sci. Tot. Environ. 2009, 408, 365–372. [Google Scholar] [CrossRef] [PubMed]
  24. Edge, T.A.; Hill, S. Occurrence of antimicrobial resistance in Escherichia coli from surface waters and fecal pollution sources near Hamilton, Ontario. Can. J. Microbiol. 2005, 51, 501–505. [Google Scholar] [CrossRef] [PubMed]
  25. Hatosy, S.M.; Martiny, A.C. The ocean as a global reservoir of antimicrobial resistance genes. Appl. Environ. Microbiol. 2015, 81, 7593–7599. [Google Scholar] [CrossRef] [Green Version]
  26. Segawa, T.; Takeuchi, N.; Rivera, A.; Yamada, A.; Yoshimura, Y.; Barcaza, G.; Shinbori, K.; Motoyama, H.; Kohshima, S.; Ushida, K. Distribution of antimicrobial resistance genes in glacier environments. Environ. Microbiol. Rep. 2013, 5, 127–134. [Google Scholar] [CrossRef]
  27. Miller, R.V.; Gammon, K.; Day, M.J. Antimicrobial resistance among bacteria isolated from seawater and penguin fecal samples collected near Palmer Station, Antarctica. Can. J. Microbiol. 2009, 55, 37–45. [Google Scholar] [CrossRef]
  28. Martiny, A.C.; Martiny, J.B.H.; Weihe, C.; Field, A.; Ellis, J.C. Functional metagenomics reveals previously unrecognized diversity of antimicrobial resistance genes in gulls. Front. Microbiol. 2011, 2, 238. [Google Scholar] [CrossRef] [Green Version]
  29. Harwood, V.J.; Whitlock, J.; Withington, V. Classification of antimicrobial resistance patterns of indicator bacteria by discriminant analysis: Use in predicting the source of fecal contamination in subtropical waters. Appl. Environ. Micro. 2000, 66, 3698–3704. [Google Scholar] [CrossRef] [Green Version]
  30. Price, R.G.; Wideboer, D.E. coli as an indicator of contamination and health risk in environmental waters. In Escherichia coli—Recent Advances on Physiology, Pathogenesis and Biotechnological Applications; IntechOpen: London, UK, 2016. [Google Scholar] [CrossRef] [Green Version]
  31. Bernhard, A.E.; Field, K.G. Identification of nonpoint sources of fecal pollution in coastal waters by using host-specific 16S ribosomal DNA genetic markers from fecal anaerobes. Appl. Environ. Microbiol. 2000, 66, 1587–1594. [Google Scholar] [CrossRef] [Green Version]
  32. Guber, A.K.; Fry, J.; Ives, R.L.; Rose, J.B. Escherichia coli survival in, and release from, white-tailed deer feces. Appl. Environ. Microbiol. 2015, 81, 1168–1176. [Google Scholar] [CrossRef]
  33. Shanks, O.C.; Atikovic, E.; Blackwood, A.D.; Lu, J.; Noble, R.T.; Domingo, J.S.; Seifring, S.; Sivaganesan, M.; Haugland, R.A. Quantitative PCR for detection and enumeration of genetic markers of bovine fecal pollution. Appl. Environ. Microbiol. 2008, 74, 745–752. [Google Scholar] [CrossRef] [PubMed] [Green Version]
  34. Ervin, J.S.; Van De Werfhorst, L.C.; Murray, J.L.; Holden, P.A. Microbial source tracking in coastal California watershed reveals canines as controllable sources of fecal contamination. Environ. Sci. Technol. 2014, 48, 9043–9052. [Google Scholar] [CrossRef] [PubMed]
  35. Ibekwe, A.M.; Murinda, S.E.; Graves, A.K. Genetic diversity and antimicrobial resistance of Escherichia coli from human and animal sources uncovers multiple resistances from human sources. PLoS ONE 2011, 6, e20819. [Google Scholar] [CrossRef] [PubMed] [Green Version]
  36. Blaak, H.; Lynch, G.; Italiaander, R.; Hamidjaja, R.A.; Schets, F.M.; de Roda Husman, A.M. Multidrug-resistant and extended spectrum beta-lactamase-producing Escherichia coli in Dutch surface water and wastewater. PLoS ONE 2015, 10, e0127752. [Google Scholar] [CrossRef] [Green Version]
  37. Ramírez Castillo, F.Y.; Avelar González, F.J.; Garneau, P.; Márquez Díaz, F.; Guerrero Barrera, A.L.; Harel, J. Presence of multidrug resistant pathogenic E. coli in the San Pedro River located in the State of Aguascalientes, Mexico. Front. Microbiol. 2013, 4, 147. [Google Scholar] [CrossRef] [PubMed] [Green Version]
  38. Kappell, A.D.; DeNies, M.S.; Ahuja, N.H.; Ledeboer, N.A.; Newton, R.J.; Hristova, K.R. Detection of multi-drug resistant Escherichia coli in the urban waterways of Milwaukee, WI. Front. Microbiol. 2015, 29, 336. [Google Scholar] [CrossRef] [Green Version]
  39. Harmel, R.D.; Richardson, C.W.; King, K.W.; Allen, P.M. Runoff and soil loss relationships for the Texas Blackland Prairies ecoregion. J. Hydro. 2006, 331, 471–483. [Google Scholar] [CrossRef]
  40. Harmel, D.; Wagner, K.; Martin, E.; Smith, D.; Wanjugi, P.; Gentry, T.; Gregory, L.; Hendon, T. Effects of field storage method on E. coli concentrations measured in storm water runoff. Environ. Monit. Assess. 2016, 188, 170. [Google Scholar] [CrossRef]
  41. Harmel, R.D.; Haney, R.L.; Smith, D.R.; White, M.; King, K.W. USDA-ARS Riesel Watersheds, Riesel, Texas, USA: Water quality research database. Water Resour. Res. 2014, 50, 8374–8382. [Google Scholar] [CrossRef]
  42. USEPA (2005). Method 1603: Escherichia coli (E. coli) in Water by Membrane Filtration Using Modified Membrane-Thermotolerant Escherichia Coli Agar (Modified mTEC); Environmental Protection Agency: Washington, DC, USA, 2005. [Google Scholar]
  43. Bauer, A.W.; Kirby, W.M.M.; Sherris, J.C.; Turck, M. Antibiotic susceptibility testing by a standardized single disk method. Am. J. Clin. Path. 1966, 45, 493–496. [Google Scholar] [CrossRef]
  44. Schneider, C.A.; Rasband, W.S.; Eliceiri, K.W. NIH Image to ImageJ: 25 years of image analysis. Nat. Meth. 2012, 9, 671–675. [Google Scholar] [CrossRef] [PubMed]
  45. Versalovic, J.; Koeuth, T.; Lupski, J.R. Distribution of repetitive DNA-sequences in eubacteria and application to fingerprinting of bacterial genomes. Nucl. Acids Res. 1991, 19, 6823–6831. [Google Scholar] [CrossRef] [PubMed]
  46. Casarez, E.A.; Pillai, S.D.; Mott, J.B.; Vargas, M.; Dean, K.E.; Di Giovanni, G.D. Direct comparison of four bacterial source tracking methods and use of composite data sets. J. Appl. Microbiol. 2007, 103, 350–364. [Google Scholar] [CrossRef] [PubMed]
  47. Brooks, J.P.; McLaughlin, M.R. Antibiotic resistant bacterial profiles of anaerobic swine lagoon effluent. J. Environ. Qual. 2009, 38, 2431–2437. [Google Scholar] [CrossRef] [Green Version]
  48. Navarro-Gonzalez, N.; Porrero, M.C.; Mentaberre, G.; Serrano, E.; Mateos, A.; Domínguez, L.; Lavín, S. Antimicrobial resistance in indicator Escherichia coli isolates from free ranging livestock and sympatric wild ungulates in a natural environment (Northeastern Spain). Appl. Environ. Microbiol. 2013, 79, 6184–6186. [Google Scholar] [CrossRef] [Green Version]
  49. Janezic, K.J.; Ferry, B.; Hendricks, E.W. Phenotypic and genotypic characterization of Escherichia coli isolated from untreated surface waters. Open Microbiol. J. 2013, 7, 9–19. [Google Scholar] [CrossRef]
  50. Laird, D. Characterization of Antimicrobial Resistance Profiles of Surface Water Bacteria in an Urbanizing Watershed. Mastre’s Thesis, Texas A&M University, College Station, TX, USA, 2016. Available online: https://oaktrust.library.tamu.edu/handle/1969.1/157788 (accessed on 27 April 2020).
  51. Holvoet, K.; Sampers, I.; Callens, B.; Dewulf, J.; Uyttendaele, M. Moderate prevalence of antimicrobial resistance in Escherichia coli isolates from lettuce, irrigation water, and soil. Appl. Environ. Microbiol. 2013, 79, 6677–6683. [Google Scholar] [CrossRef] [Green Version]
  52. Nicolau, D.P.; Carmeli, Y.; Crank, C.W.; Goff, D.A.; Graber, C.J.; Lima, A.L.L.; Goldstein, E.J.C. Carbapenem stewardship: Does ertapenem affect Pseudomonas susceptibility to other carbapenems? A review of the evidence. Int. J. Antimicrob. Agents 2012, 39, 11–15. [Google Scholar] [CrossRef]
  53. Maal-Bared, R.; Bartlett, K.H.; Bowie, W.R.; Hall, E.R. Phenotypic antimicrobial resistance of Escherichia coli and E. coli O157 isolated from water, sediment, and biofilms in an agricultural watershed in British Columbia. Sci. Tot. Environ. 2013, 443, 315–323. [Google Scholar] [CrossRef]
  54. Magiorakos, A.P.; Srinivasan, A.; Carey, R.B.; Carmeli, Y.; Falagas, M.E.; Giske, C.G.; Harbarth, S.; Hindler, J.F.; Kahlmeter, G.; Olsson-Liljequist, B.; et al. Multidrug-resistant, extensively drug-resistant and pandrug-resistant bacteria: An international expert proposal for interim standard definitions for acquired resistance. Clin. Microbiol. Infect. 2012, 18, 268–281. [Google Scholar] [CrossRef] [Green Version]
Figure 1. Map of study site near Riesel, TX (USA) with watersheds native prairie (SW12), improved pasture (SW17), and cultivated cropland (Y6) highlighted in blue.
Water 12 01251 g001
Figure 2. Box plots displaying E. coli load within the three sites from water runoff. The line within each box indicates the median value. The whiskers above and below the box indicate the maximum and minimum values of E. coli load within the three sites, and the dots indicate the outliers in the dataset.
Water 12 01251 g002
Figure 3. Percentage of antimicrobial resistance (AMR) in (I) water and (II) Soil within E. coli isolates in the three sites (A) Prairie, (B) Pasture and (C) Cropland. Tet—Tetracycline, Ceph—Cephalothin, Sul—Sulfamethoxazole, Cef—Cefoperazone, Amp—Ampicillin.
Water 12 01251 g003
Figure 4. Percentage of multidrug resistance (MDR) observed within E. coli isolates in the three sites Prairie, Pasture and Cropland isolated from (A) water runoff and (B) soil.
Water 12 01251 g004
Figure 5. Comparison of the composite ERIC-Riboprint DNA fingerprints of the soil (green) and water runoff (purple) E. coli isolates by multidimensional scaling—(A) Prairie, (B) Pasture, and (C) Cropland.
Water 12 01251 g005

