Decision-Making Tools to Manage the Microbiology of Drinking Water Distribution Systems
by
 , , , and
Silvia Carpitella
1,* ,
,
Gonzalo Del Olmo
2 ,
,
Joaquín Izquierdo
3 ,
,
Stewart Husband
2,
Joby Boxall
2 and
Isabel Douterelo
2 1
Department of Engineering, University of Palermo, Viale delle Scienze, 90133 Palermo, Italy
2
Department of Civil and Structural Engineering, University of Sheffield, Sheffield S102TN, UK
3
Institute for Multidisciplinary Mathematics, Universitat Politècnica de València, 46022 Valencia, Spain
*
Author to whom correspondence should be addressed.
Water 2020, 12(5), 1247; https://doi.org/10.3390/w12051247
Submission received: 29 March 2020
/
Revised: 16 April 2020
/
Accepted: 23 April 2020
/
Published: 27 April 2020
(This article belongs to the Special Issue New Perspective on Water Security Management)
Abstract
:This paper uses a two-fold multi-criteria decision-making (MCDM) approach applied for the first time to the field of microbial management of drinking water distribution systems (DWDS). Specifically, the decision-making trial and evaluation laboratory (DEMATEL) was applied removing the need for reliance on expert judgement, and analysed interdependencies among water quality parameters and microbiological characteristics of DWDS composed of different pipe materials. In addition, the fuzzy technique for order preference by similarity to ideal solution (FTOPSIS) ranked the most common bacteria identified during trials in a DWDS according to their relative abundance while managing vagueness affecting the measurements. The novel integrated approach presented and proven here for an initial real world data set provides new insights in the interdependence of environmental conditions and microbial populations. Specifically, the application shows as the bacteria having associated the most significant microbial impact may not be the most abundant. This offers the potential for integrated management strategies to promote favourable microbial conditions to help safeguard drinking water quality.
1. Introduction
1.1. Microbial Quality of Drinking Water
The delivery of good quality water through drinking water distribution systems (DWDS) has fundamental implications for public health. However, it is known that the quality, and hence potential safety of water, deteriorates when travelling through pipes because of interactions with the microbiome in these large and complex engineered systems. The World Health Organisation [1] have published several editions of the Guidelines for drinking water quality, reporting information about standardised microbial analysis of DWDS [2]. Although methods besides the standard analysis such as those based on molecular/genetic information and flow cytometry are starting to be used to monitor systems failures, the current official regulations and guidelines do not provide any guidance on how to use the information gathered from these methods to establish water quality or safety.
Broadly speaking, it is crucial to develop accurate processes of water quality analysis [3], which have to be based on a principle of absence of harmful elements including potential opportunistic pathogens [4]. As explained by McClymont et al. [5], water networks are among the most complex of key infrastructures, being made of a wide set of physical elements such as valves, pipes, joints, pumps, tanks and many other hydraulic devices. Given the complexity of these structures [6], they constantly require effective system management, in terms of control, maintenance and rehabilitation to prevent safety impacting failures, such as contamination [7].
Indeed, once water within DWDS is contaminated it can be difficult and costly to restore back to a safe state. It is therefore desirable that actions aimed at preventing such risks must be implemented in water networks. Potential processes rely on monitoring water quality at regular time intervals [8] at sources of water supply, inputs to the distribution network after treatment and within the DWDS [9].
Regarding the microbial ecology of DWDS, most microorganisms inhabiting these systems can be found in biofilms [10]. Biofilms can be defined as a dynamic sessile community of cells attached, in this case, to the walls of the pipes, and embedded in a matrix of extracellular polymeric substances that they have produced [11]. Biofilm accumulation on pipe surfaces can be influenced by different DWDS properties, like pipe characteristics including composition, diameter, roughness, etc., hydrodynamic conditions or nutrient availability like phosphate [12]. Also, they can alter the quality of water, participating in metal bio-corrosion processes [13], discolouration events [14] and act as reservoirs for opportunistic pathogens [15,16]. Water companies use various methods to manage the presence of microorganisms in DWDS, like chemical disinfection such as keeping a chlorine residual to limit planktonic regrowth, or physical cleaning techniques such as flushing to remove material. However, biofilms have mechanisms that protect them from such adverse conditions that allows them to persist in DWDS [17,18].
Microorganisms in drinking water systems must be monitored and regularly tested by law [19]. However, most of the testing occurs by very infrequently sampling bulk water, thus not sampling biofilms, and using culturing methods that are not representative of the actual microbial ecology [20]. Various approaches aimed at detecting microbial contamination in DWDS have been proposed in the literature. For example, Ikonen et al. [21] proposed a pilot-scale DWDS endowed with an on-line control system making use of pH and temperature sensors as an alternative to traditional water quality monitoring frameworks to reveal bacterial intrusion, whilst Wang et al. [22] led a study about antibiotic contaminants released in DWDS aimed at implementing an environmental risk management plan for drinking water sources.
The survival and regrowth of microorganisms in DWDS will be affected not only by microbiological factors, but also the interaction with various physicochemical factors [12,23]. In this regard, a study aimed at bounding the main parameters of water networks and the presence of particular bacteria would be valuable to understand how these two aspects influence each other and could result in the implementation of an effective risk management plan [24].
1.2. Multi Criteria Decision-Making
Given the complexity of the DWDS environment that is created inside the pipes and the high number of interacting variables, a multi-criteria decision-making (MCDM)-based approach may provide an efficient management support tool. Several studies based on modelling with decision-making in DWDS management can be found. For example, Henriques and Louis [25] developed a decision-making model based on a capacity factor analysis to select the most appropriate drinking water supply and greywater reuse technology for developing communities. Ramos-Martínez et al. [26] integrated meta-analysis and multi-agent system label propagation via discriminant analysis to identify areas with different biofilm development trends in a water supply system. The same authors also designed a biofilm formation model in DWDS using multi-agent systems [27] and machine learning techniques [28].
The decision-making trial and evaluation laboratory (DEMATEL), first implemented by Fontela and Gabus [29,30], is recognised as a tool to identify cause-effect elements of a complex decision-making problem. The method is capable to handle evaluations of interdependent relationships to establish which elements are more critical by means of a visual structural model [31]. Over the last decade, it has been successfully applied for solving complicated system problems in various research areas [32]. However, a lack of applications in the field of microbial control and management strategies in drinking water systems exist. With this recognition, it is proposed DEMATEL may be used as an effective tool for the analysis and establishment of relations of interdependence among the most important factors measured in DWDS. Such understanding could contribute to the creation of more suitable environmental conditions in water networks, since variations in parameters characterised by a higher degree of interdependence may be related to key aspects needed to manage the microbiology of these systems.
The fuzzy technique for order preference by similarity to ideal solution (FTOPSIS) [33] is an extension of the traditional TOPSIS [34] methodology under a fuzzy environment. It allows ranking of huge numbers of alternatives according to various criteria suitably weighted, on the basis of the compromise solution concept [35]. The advantage of using fuzzy instead of crisp numbers is represented by the possibility of taking into account the uncertainty often characterising parameter evaluations [36]. Palczewski and Sałabun [37] led a comprehensive literature review analysing FTOPSIS applications over the past decade. They highlighted six main areas of application: supply chain management, environment and energy, energy, healthcare, business and others. Using this classification, a lack of applications of the FTOPSIS method is revealed in the drinking water sector. The study also notes FTPOSIS has been integrated with other MCDM techniques, the DEMATEL among them, as presented in this work. DEMATEL and TOPSIS/FTOPSIS techniques have been and continued to be used to support various issues, such as supplier selection [38], financial services evaluation [39], educational model design [40] and medical tourism development [41].
Literature reviews have failed to identify MCDM approaches combining DEMATEL and FTOPSIS in the field of microbial evaluation in DWDS. Further novelty exists also in considering as evaluation criteria the specific type of pipe material, each one characterised by different values of parameters such as temperature or pH, that lead to the presence in different concentrations of elements responsible for discolouration or corrosion phenomena including iron, manganese or aluminium [42]. Moreover, regarding DEMATEL application, a modification within the framework of the methodology is herein proposed, aimed at reducing vagueness of evaluations.
The present research proposes a two-fold approach. It first investigates the possibility of exploring interrelations existing among the main elements of the process of microbial evaluation by applying the DEMATEL technique. The second objective, given the wide microbial diversity of the data obtained from the case study, consists of treating problems of large size and managing uncertainty affecting input data through the FTPOSIS method. The outcome aims to provide water utilities with a structured methodology capable to first collect an understanding about which elements have higher influence on the others and, second, easily identify the presence of dominant members of microbial communities according to pipe material used in the studied DWDS.
2. Aim and Structure
In this paper the applicability of MCDM methods is investigated to study the dependencies that exist among the main factors of the microbial evaluation problem (that are water quality parameters and bacteria classes) and the degree of relative microbial presence in DWDS. With this aim, a case study was undertaken using data from a DWDS in the UK, where flushing trials were performed to study the microbial composition of material attached to plastic and cast iron pipes supplied by surface water. The DEMATEL methodology applied to this data may be suitable to approach biofilm-related issues by water utilities and the FTOPSIS to evaluate microbial presence according to the type of pipe material.
The paper is organised as follows. Section 3 refers to materials and methods of the research. In particular, Section 3.1 details the approach proposed to manage the process of microbial evaluation, as well as the main elements we are going to take into account. Section 3.2 describes the MCDM-approach supporting the problem of interest, by providing objectives and concise descriptions of DEMATEL and FTOPSIS. Section 3.3 presents the case study applied to a real DWDS. Section 4 reports the results and also a sensitivity analysis performed to check robustness and to derive practical management implications. Conclusions and possible further developments of the present research are lastly provided in Section 5.
3. Materials and Methods
3.1. The Problem of Microbial Evaluation for DWDSs
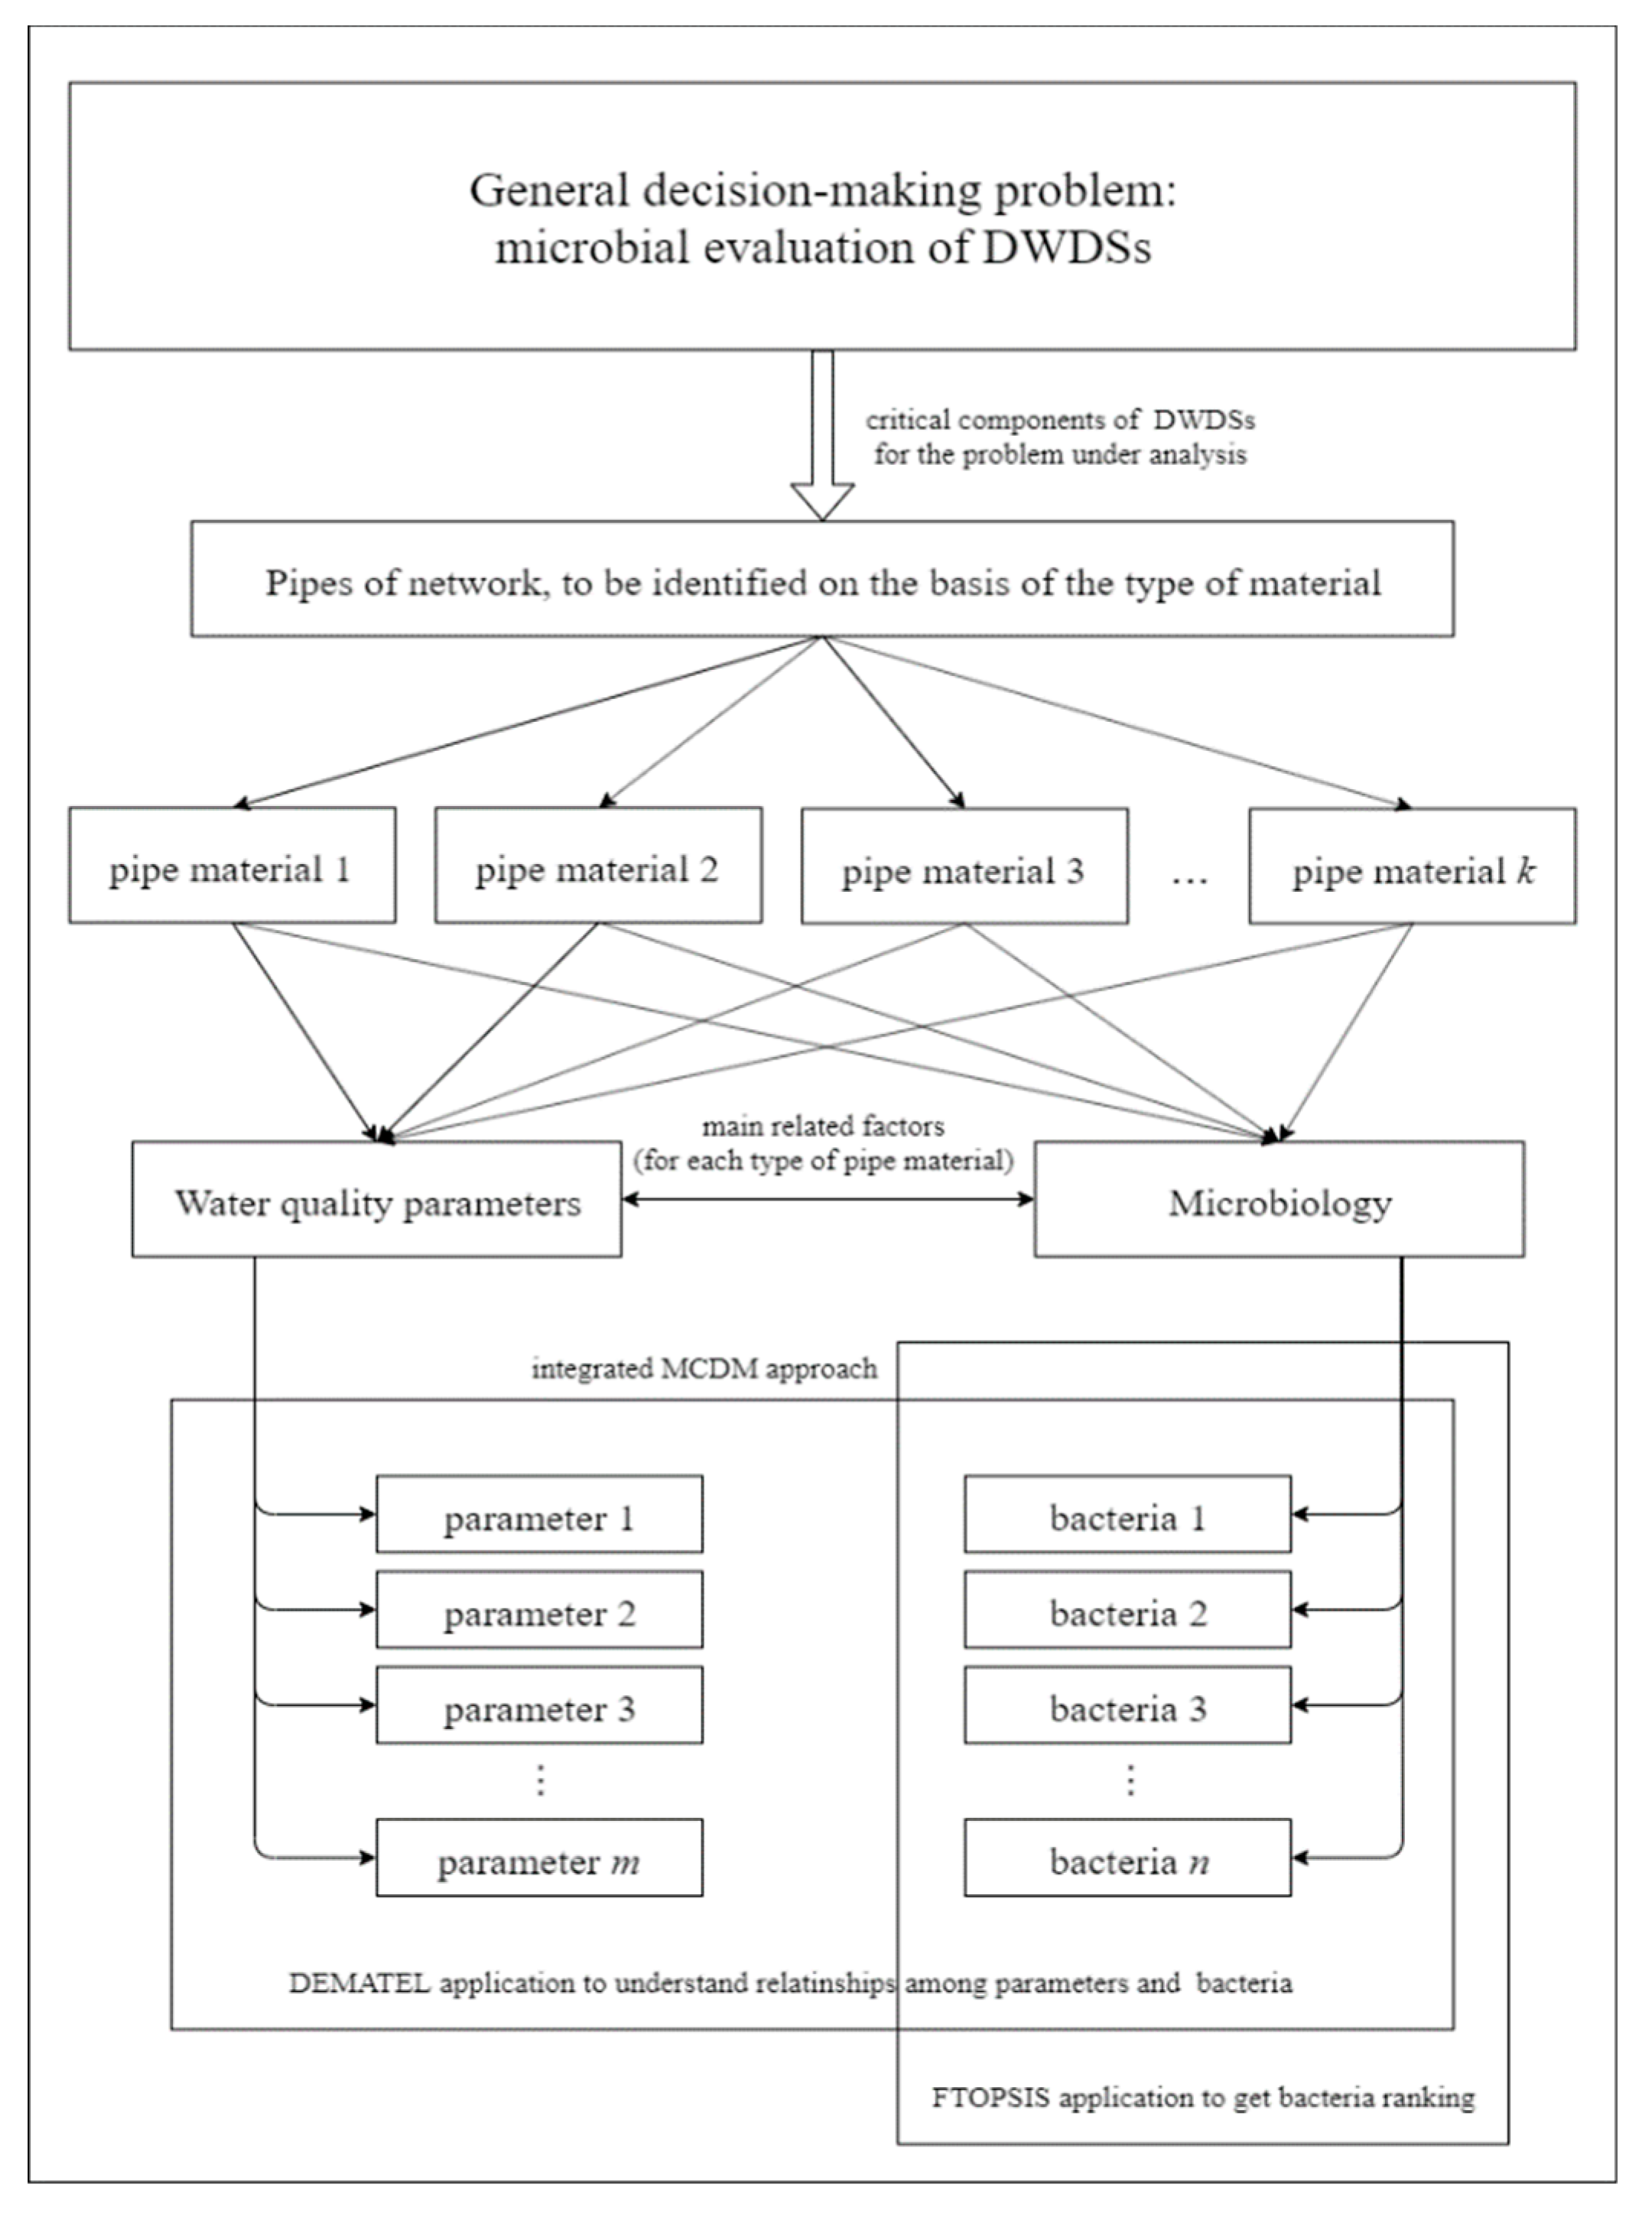
The decision-making problem tackled in the present paper involves carrying out a process of DWDS microbial evaluation through the support of a MCDM-based analysis. As highlighted by Zhu et al. [43], drinking water quality directly depends on pipe condition, thus this is considered as the main critical component in the present context of analysis. In relation to the specific type of pipe material, it is possible to quantitatively measure the various water quality parameters (such as turbidity or residual chlorine), as well as microbiology, the latter in terms of relative abundance of bacteria determined using a next generation sequencing method. These two factors (water quality parameters and microbiology) are strictly correlated so that studying their mutual relationships is crucial to pursue effective management. This information can improve understanding how general environmental conditions may change by varying one or more of the most influencing factors, since their variations have a direct or indirect impact on all the other factors of analysis.
By coupling this with a posteriori analysis of the types of bacteria detected in pipes of different materials, a final ranking of bacteria is proposed, showing their degree of relative abundance by assuming as the main criteria of analysis the pipe materials used in DWDS. The decision criteria may be additionally weighted based on which material is mostly used in a network, leading to different bacteria rankings. Getting a clear vision or the relations of interdependencies among factors and microbial distribution in water pipes represents the main stage from which an effective management strategy can be planned and implemented. Figure 1 details the proposed approach for the process of microbial evaluation management.
3.2. Integrated MCDM Approach
This subsection describes the joint MCDM-based approach proposed to deal with the microbial evaluation problem under analysis with the next two subsections describing the two methodologies used. First, DEMATEL is applied to a set of input data using water quality parameters and microbial classifications in order to show which elements have most influence on the others.
A modification of the traditional DEMATEL technique is then proposed, related to the stage of input data collection. This modification aims to make more trustworthy the whole analysis as subjective expert evaluations are substituted for measured parameters with statistical correlations. The FTOPSIS technique is then applied to show which types of bacteria exhibit higher or lower relative abundance in DWDS pipes, considering pipe material as the evaluation criteria.
3.2.1. Modified DEMATEL to Establish Relationships of Influence among Elements
Decision-making about drinking water supply systems require consideration of the mutual dependence existing between key factors and what may be effectively achieved by means of a DEMATEL-based application [44]. Indeed, if dependencies are not taken into account, decision-making results would be compromised. The DEMATEL technique is herein applied to understand the degree of intensity of the relationships existing among the most important quality parameters and the microbiological components characterising DWDS pipes of different materials.
To achieve this, the classical DEMATEL approach requires the support of a team of experts in the field to get a better understanding about the problem under analysis. However, in this case, influence relations among elements can be directly measured by performing suitable statistical analyses. This approach is of great interest to minimise uncertainty derived from expert subjectivity, a main limitation of the DEMATEL approach [45]. After defining the general goal of the decision-making problem under analysis and the set of elements to be evaluated, the main steps implementing the modified technique are described in the following.
- Collecting the non-negative input matrix, , whose cells give the relation of influence of one element, , over another one, , according to the following linguistic evaluation scale: 0 (no influence), 1 (very low influence), 2 (low influence), 3 (high influence), 4 (very high influence). The main diagonal of the matrix will be zeroes, since one element has no influence on itself.
- According to the traditional DEMATEL procedure [29,30], the previous stage is carried out by involving a decision-making group and by asking each expert to fill in their own input matrix. All these matrices are then aggregated into one, the so called direct relation matrix, (output of the third stage of the procedure), with the aim to treat the set of input data in a way as balanced and reliably as possible. In this paper, a single input matrix is used, in which, instead of subjective expert evaluations, the relations of influence for each pair of elements are derived from the related values of measured Spearman correlations. Hence, the direct relation matrix coincides with a single input matrix .
- Calculating the normalised direct relation matrix as:being a positive number slightly smaller thanMatrix shows the initial influence that elements exert on and receive from the others. The next step consists of obtaining a continuous decrease of indirect effects among factors in terms of consecutive powers of .
- Obtaining the total relation matrix, , which collects the total interrelation, including both direct and indirect effects among elements, which can be calculated as the sum of the powers of the normalised direct relation matrix , given by:where is the identity matrix. As observed, for example, in [46], since the spectral radius of is smaller than 1, being bounded by the maximum row and column sum. Then, as shown for instance by Meyer [47], the power series of the normalised direct relation matrix converges to –. Moreover, it has to be noticed that, whereas the main diagonal of matrix is filled with zeroes (expression of no direct effect of each element on itself), the diagonal entries of the total relation matrix collect all the non-direct effects related to their corresponding factors.
- Defining the two vectors and , respectively representing the and vectors of sums of the rows and sums of the columns in the total relation matrix . From these two vectors it is possible to calculate the prominence as the sum , reflecting the general effect of element on all the other elements, and the relation as the subtraction , helping in dividing the elements into classes of cause (if positive) and effect (if negative).
- Drawing up the final ranking of elements, ordered according to their decreasing values of prominence.
3.2.2. FTOPSIS to Rank Bacteria according to the Type of Pipe Material
As expressed by Gerami Seresht and Fayek [48], fuzzy set theory [49] is a powerful tool to deal with subjectivity and uncertain information in a wide variety of contexts.
Fuzzy numbers are associated with a degree of membership varying between 0 and 1 and are commonly used to quantitatively represent linguistic variables. The most common types of fuzzy numbers are characterised by a triangular or a trapezoidal shape.
A generic triangular fuzzy number (TFN) is defined by three numerical values, , and , respectively called the lower, the medium and the upper value of the fuzzy number, being . A generic trapezoidal fuzzy number TrFN is defined by four numerical values, , , and , respectively called the lower, the two medium and the upper values of ; being .
Their corresponding membership functions and are expressed as follows:
It is possible to note that membership functions of TFNs can be split into non-decreasing and non-increasing parts and, in the case of TrFNs, these two parts are linked through the constant function taking the value of 1 [50]. By dealing with fuzzy instead of crisp numbers, as the traditional TOPSIS method does, the FTOPSIS technique is considered more suitable when representing real-life situations.
As expressed in Section 3.1, final decisions about the management of microbiology of DWDS depend on the particular type of pipe material present, each one characterised by different values of water quality parameters and thus different bacteria concentrations. Fuzzy input data is about these aspects (see Section 4). The steps required to apply the FTOPSIS method are the following.
- Defining the fuzzy decision matrix collecting input data:where the generic fuzzy number represents the rating of alternative under criterion j. In the present case, TFNs characterized by ordered triples are taken into account:
- Obtaining matrix by weighting and normalising the fuzzy decision matrix of input with relation to each criterion. Elements of matrix are calculated as:where is the subset of criteria to be maximised, the subset of criteria to be minimised, expresses the weight of criterion , and and are calculated as:
- Computing distances between each alternative and two fuzzy ideal solutions, namely the fuzzy positive ideal solution and the fuzzy negative ideal solution :where and . Chen (2000) proposed to compute distances between each alternative and these points through the vertex method, for which the distance between two TFNs and corresponds to the following crisp value:Then, aggregating with respect to the set of considered criteria, the distances of each alternative from and are:
- Calculating the closeness coefficient to get the final ranking. The mentioned closeness coefficient is calculated as:To get the final ranking it is necessary to sort the values of the closeness coefficient related to each alternative in a decreasing way. The elements with higher values will be selected.
3.3. Case Study
The case study presented is aimed at testing the effectiveness of the proposed MCDM approach by applying it to the process of microbial evaluation and management of a real operational DWDS in the United Kingdom, where the water is disinfected with chlorine.
The present application is carried out by using the input data published by Douterelo et al. [12], by taking into account the measurements of elements (water quality parameters and bacteria relative abundance), from flushing trials repeated four times in one year, of plastic and cast iron pipes.
Flushing trials were undertaken in a sequential unidirectional manner using different duration and flow rates. Some physicochemical parameters like pH, temperature and free chlorine were measured in situ during the trials, and the other parameters were determined by United Utilities Scientific Services in accordance with drinking water regulation requirements. Microbiological samples came from the water taken in the different flushing trials, and represent the microbial communities in the material mobilised from flushing pipes water was filtered through a nitrocellulose membrane filters, and the DNA was extracted and sequenced by Illumina MiSeq sequencing. Nonparametric Spearman’s rank correlation analysis was carried out to establish relationships between physicochemical parameters in the water, bacteriological indicators (richness and diversity), and the relative abundances of the most representative bacterial phyla in the samples. The detailed analysis of sequencing data can be found in Douterelo et al. [12].
The dataset of factors is synthetized and codified in Table 1. Such microbiological factors that might affect water quality, as diversity and richness, are considered as quality parameters. Richness refers to the total number of different operational taxonomic units (OTUs) performed at a 97% sequence similarity cut-off for each sample and diversity refers to the proportional abundance of a particular phylotype relative to the sum of all phylotypes [18].
4. Results and Discussion
As the first stage, use is made of the results derived from the nonparametric Spearman’s rank correlation analysis carried out on the datasets of factors (Figure S1 provided as supplementary material of paper [12]). Correlation results referring to each pair of elements had already been compiled in a symmetric correlation matrix. Accordingly, the input matrix for the DEMATEL application is a symmetric matrix in which 0 corresponds to the elements of the main diagonal and to absolute values of Spearman correlation between 0 and 0.2; 1 to values between 0.2 and 0.4; 2 to values between 0.4 and 0.6; 3 to values between 0.6 and 0.8; 4 to values between 0.8 and 1.
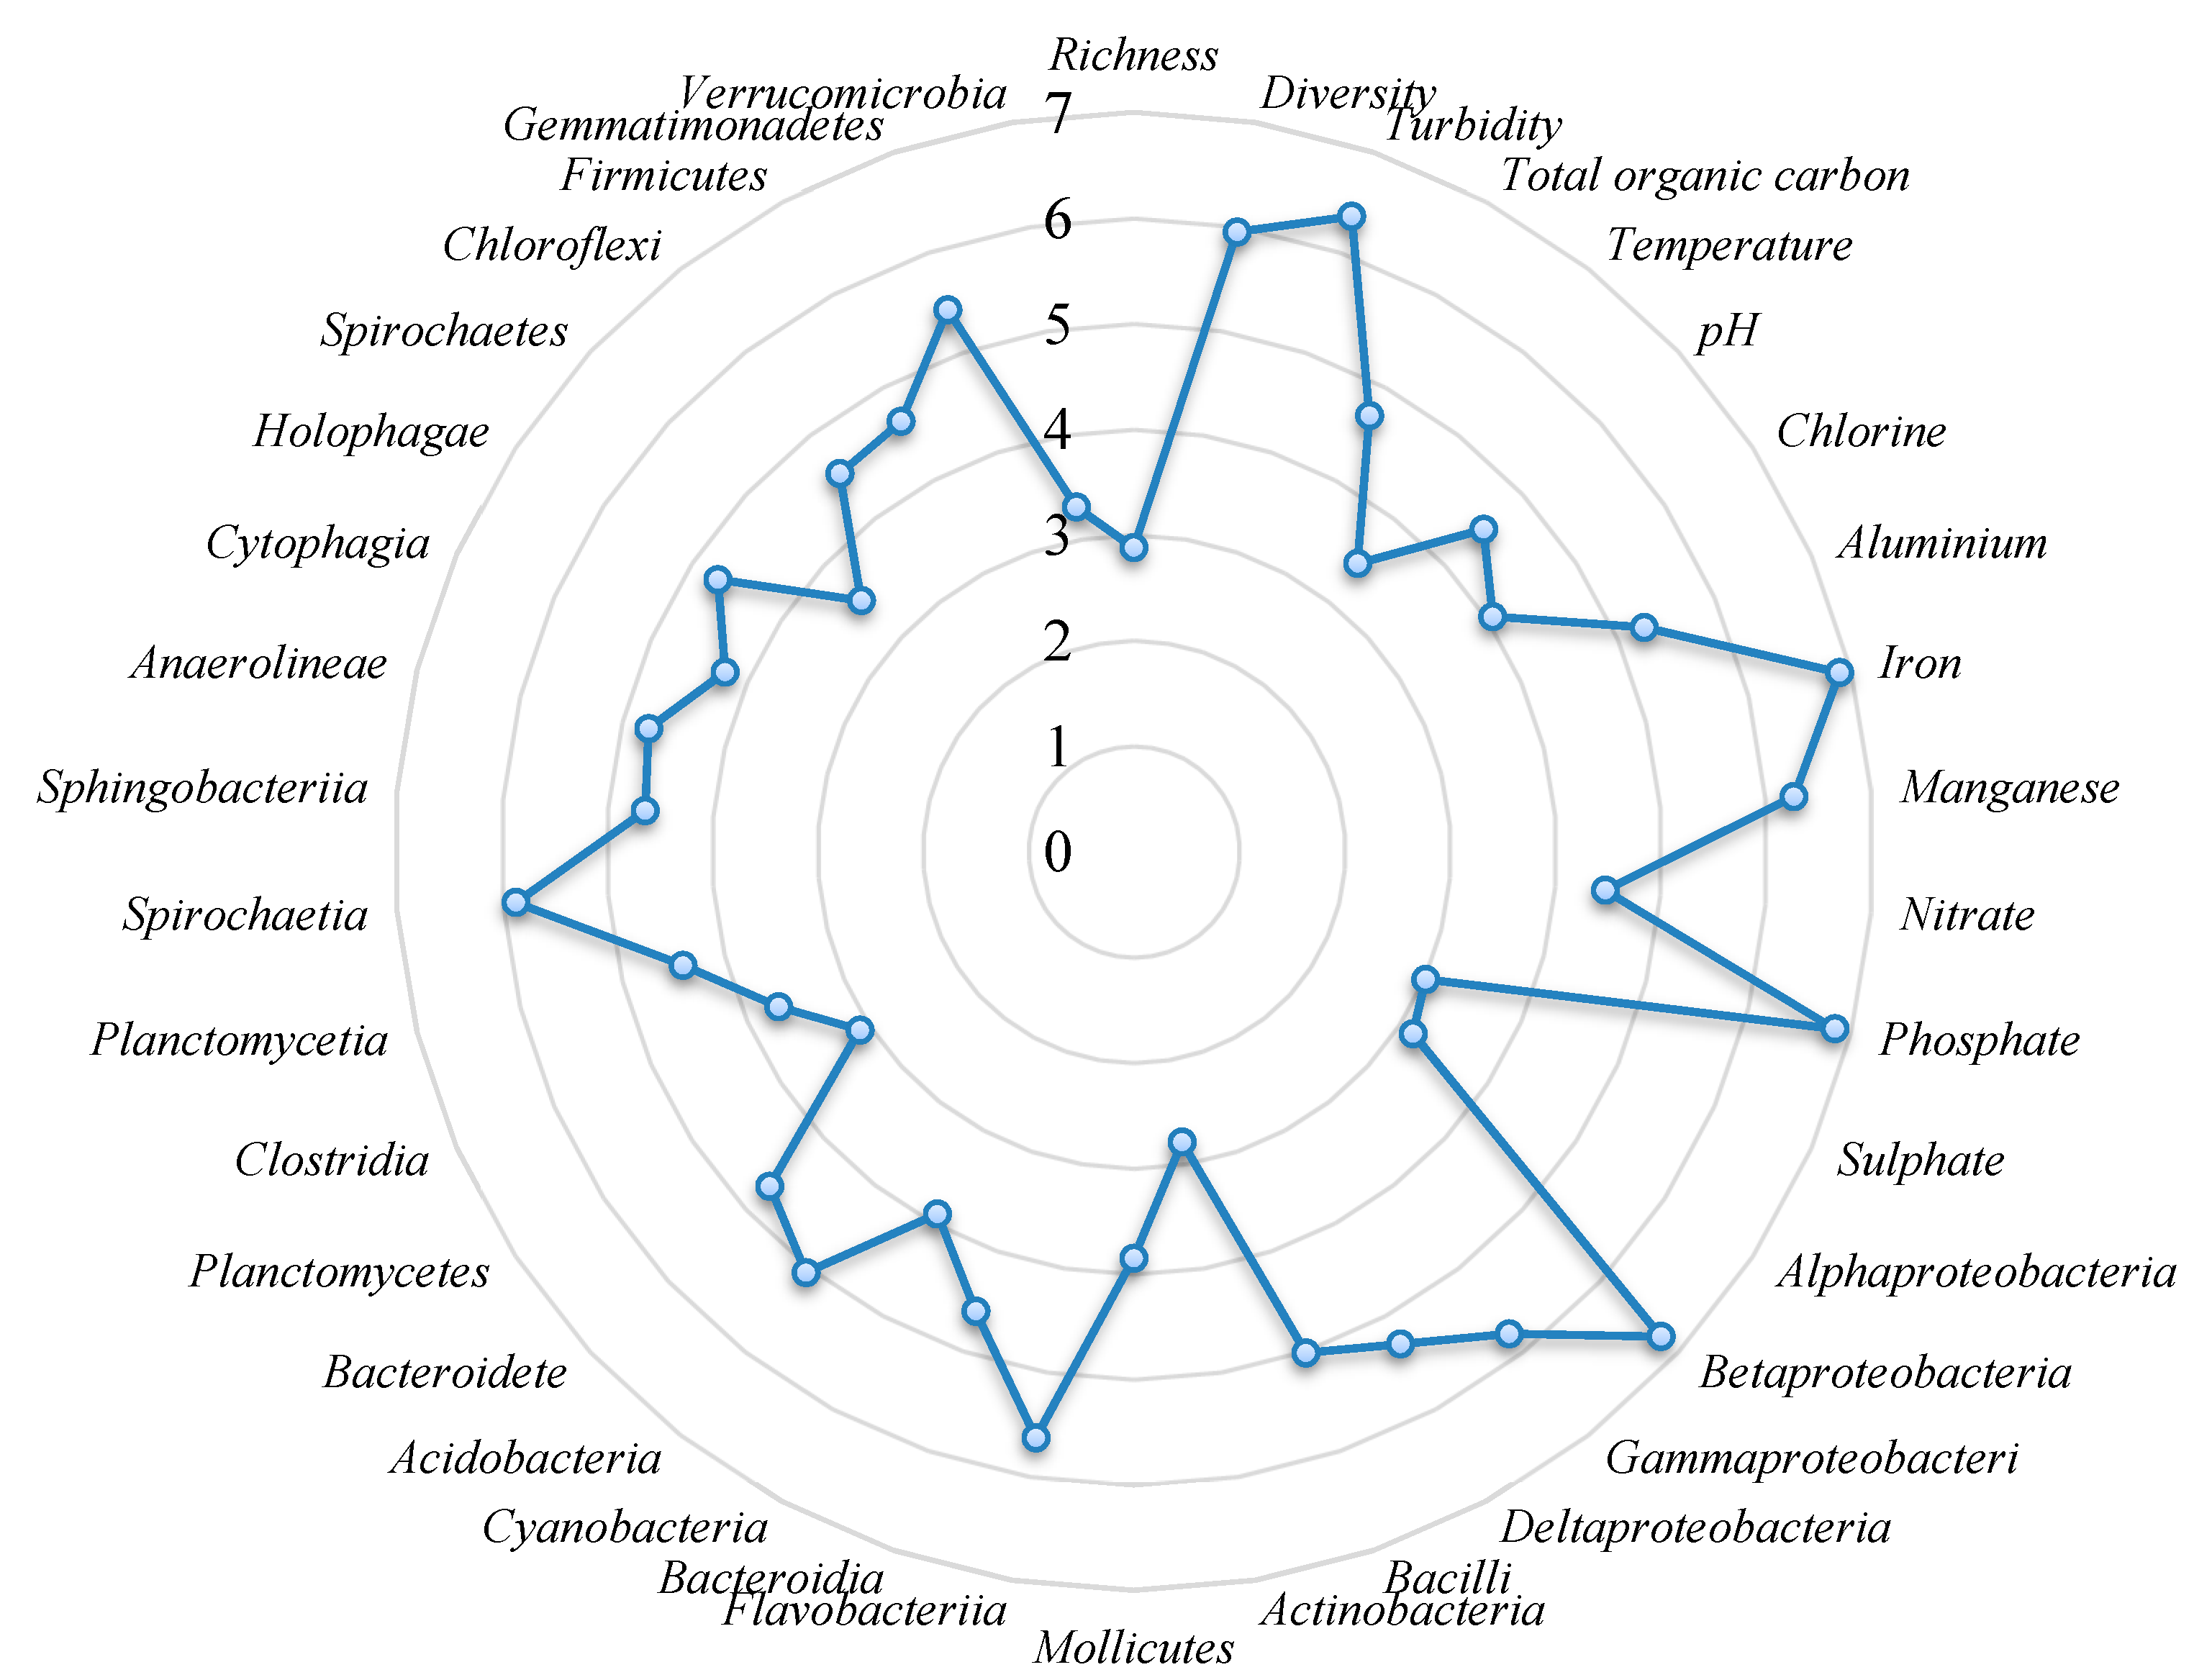
The substitution of subjective evaluations for measured parameters with statistical correlations removes the need for reliance on expert judgement and helps in making more trustworthy the whole analysis. After having calculated the total relation matrix (Table S1, Supplementary Material), Table A1 (Appendix A) shows the values of prominence along with the ranking of considered factors. The factors occupying the first positions of the ranking (such as iron, phosphate, Betaproteobacteria, turbidity and manganese) are those having the highest impact on all the other factors. This means that variations on these parameters may be related to variations of all the other factors. On the contrary, variations on the elements at the bottom of the ranking (Alphaproteobacteria, Planctomycetes, Sulphate, Richness, Actinobacteria) are scarcely responsible to variations on the other aspects.
Figure 2 presents a chart showing the values of prominence necessary to get the final ranking of factors.
After having evaluated the interdependences among water quality parameters and class of bacteria detected, we apply the fuzzy TOPSIS technique to rank the bacteria according to two evaluation criteria, namely the two different types of pipe materials analysed in [12], i.e., plastic (C1) and iron (C2). Bacteria evaluations under the two considered criteria are triangular fuzzy numbers representing the relative abundance of bacteria detected in each type of pipe in a given interval of time. Each fuzzy number gives three values representing the lower, the medium and the higher level of bacteria relative abundance observed from three measurements performed in a given month of observation.
To understand how bacteria ranking changes over a period of observation of one year, the FTOPSIS was applied to four different months (February 2012, June 2012, October 2012, February 2013). Table A2 (Appendix A) gives the fuzzy evaluations of bacteria abundances referred to the first measurement carried out in February 2012, whereas Table A3 (Appendix A) presents the related normalised and weighted fuzzy matrix, in which C1 and C2 are equally weighted. Both criteria have to be minimised since we assume as positive ideal condition the total absence of bacteria both in plastic and cast iron pipes and, as negative ideal condition, the maximum bacteria abundance.
The output of the procedure is a final ranking of bacteria (Table A4, Appendix A), each one associated to a closeness coefficient expressing its distance to the ideal conditions. Higher values of closeness coefficients represent better conditions, because they are expressions of higher distance to the negative ideal condition and lower distance to the positive ideal condition. In other words, by ordering the values of closeness coefficient in an increasing way, the first positions in the ranking (associated with lower values of ) present those types of bacteria to be analysed with priority, having the highest joint (for plastic and cast iron pipes) percentage of concentration.
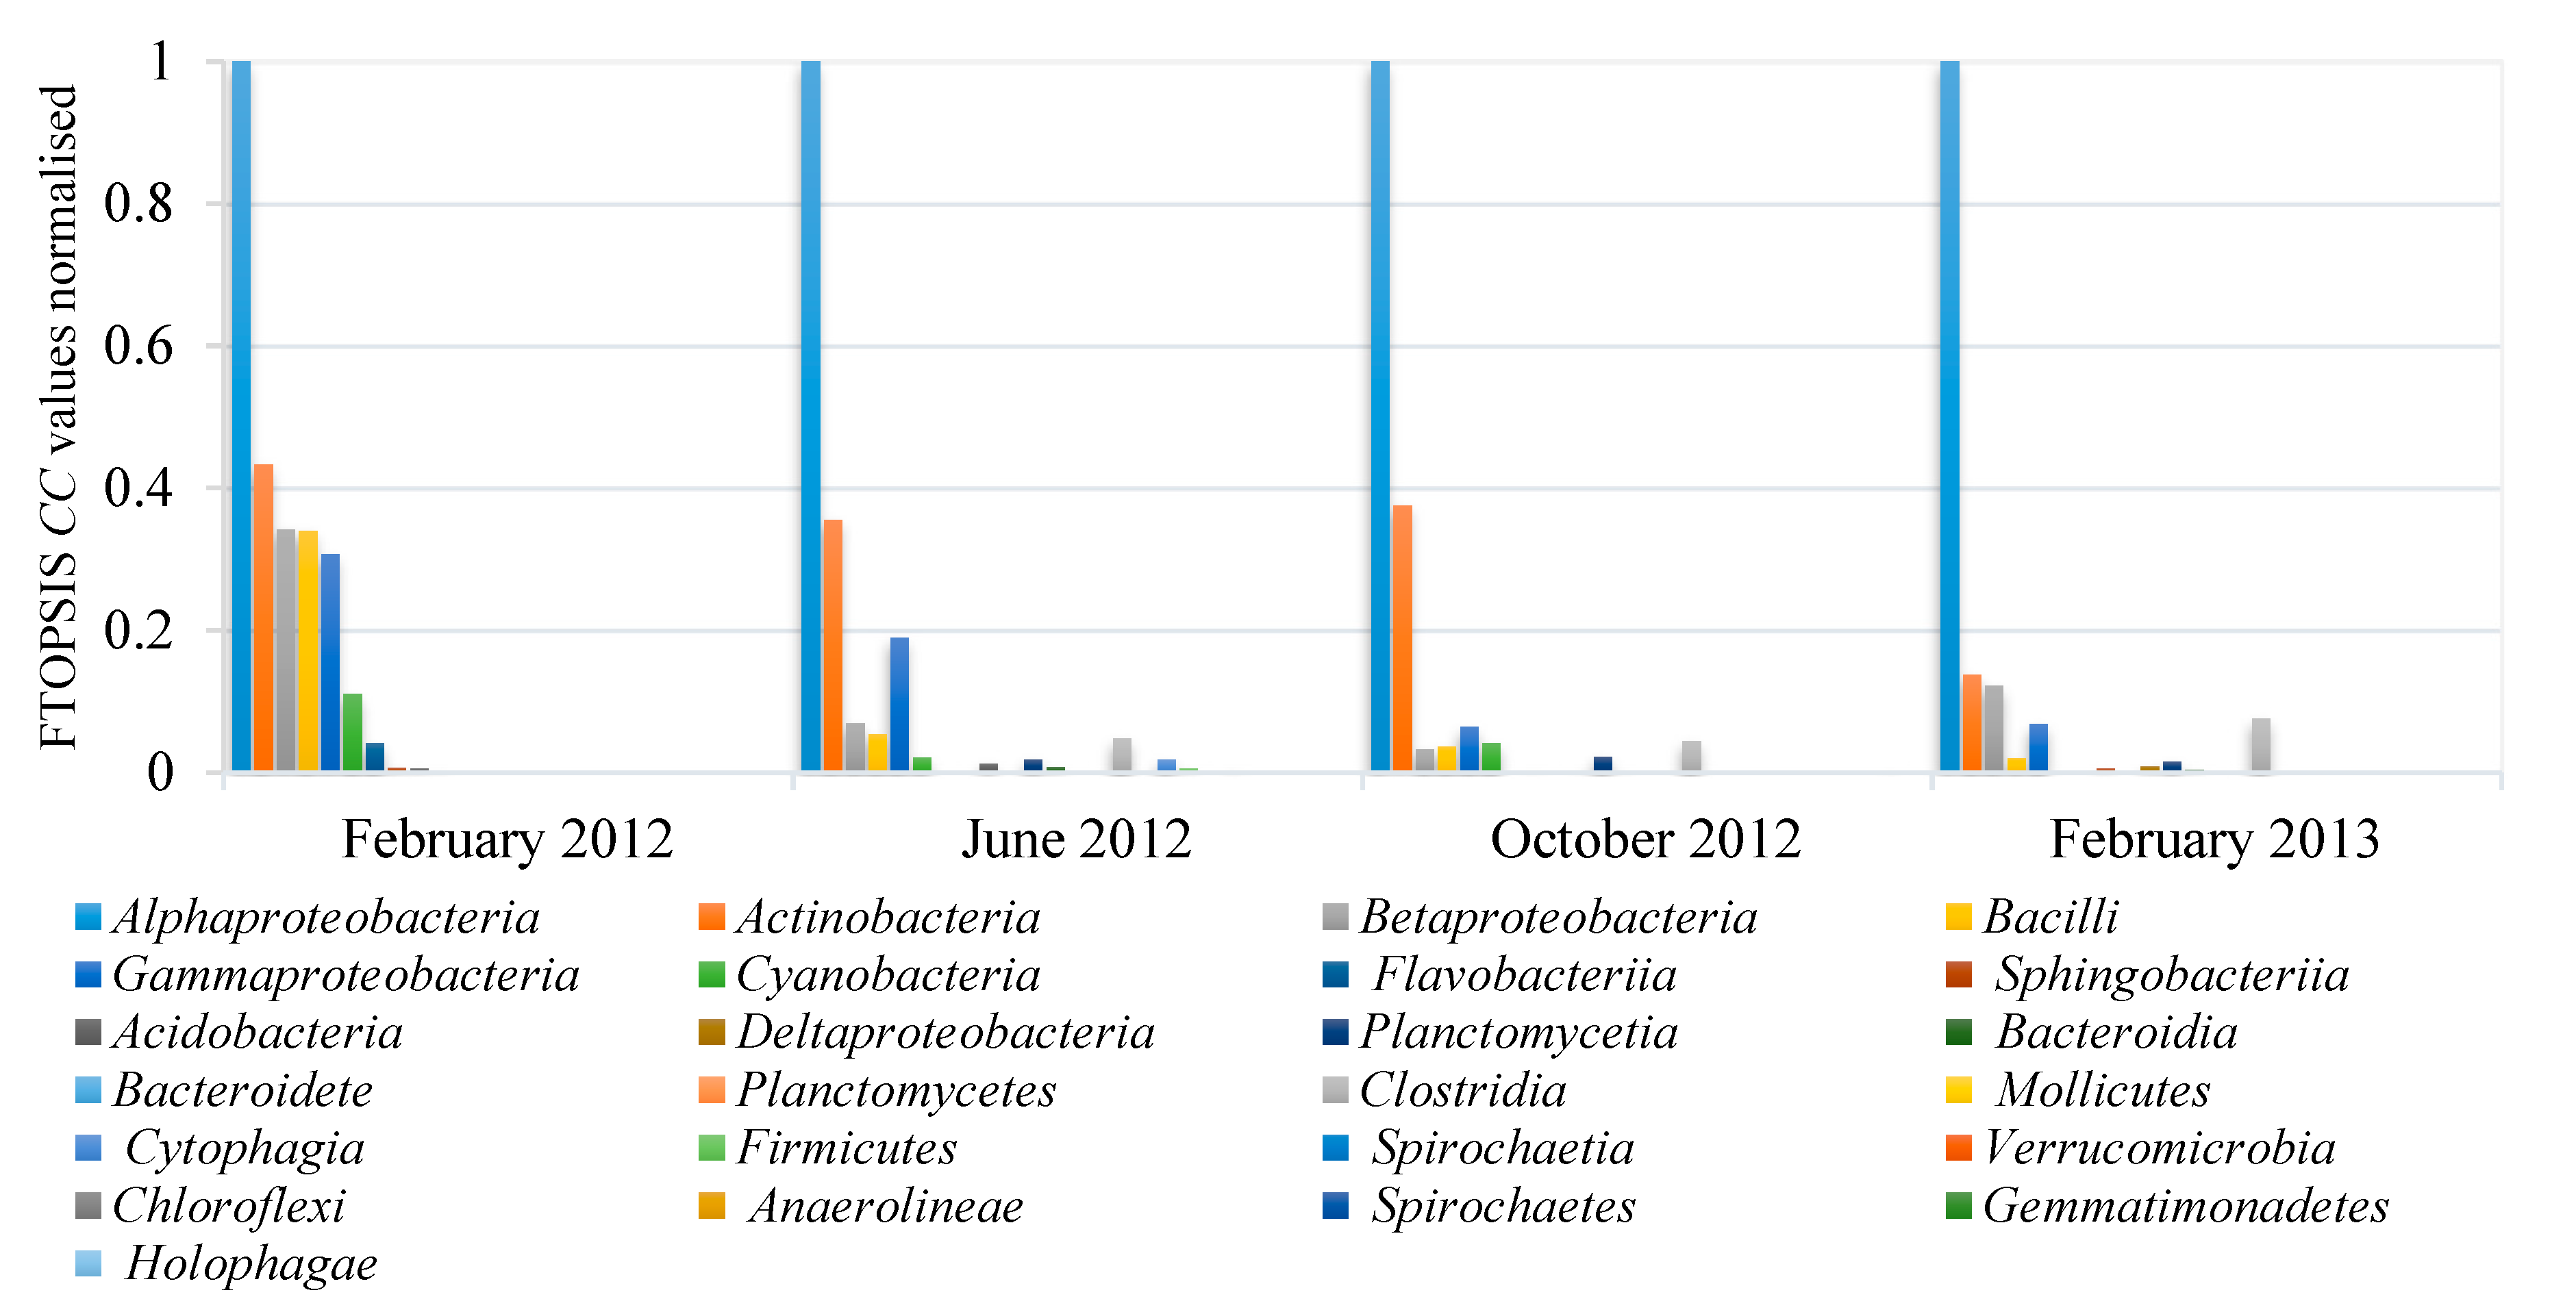
As can be observed in Table A4, the final ranking demonstrates Alphaproteobacteria and Actinobacteria as the two most abundant species in all the four measurements, as Douterelo et al. [12] indicated. Moreover, bacteria less abundant are Holophagae in February 2012, Spirochaetes in June and October 2012, and Mollicutes in February 2013.
Results are summarised in Figure 3, where the set of 25 detected bacteria is categorised for each month of observation. The bars of the graph are related in an inverse way to the values. The values of the referring to bacteria have been normalised with respect to the maximum closeness coefficient evaluated within a specific observation time. It means that the minimum is associated with a value equal to 1 in Figure 3. Thus, taller bars express higher distances to the positive ideal solution, indicating higher bacterial abundances, thus pointing to those species needing attention and action measures.
The methodology agrees with Douterelo et al. [12] in that phosphate, turbidity and metals (iron and manganese) are the most relevant parameters affecting the ecosystem of the DWDS studied (Figure 2). However, it provides us with a new approach about the bacteria influence, highlighting the group of Betaproteobacteria as the microbial group mainly related with the other components, something that Douterelo et al. [12] did not take into account. This is of interest as this group could be displaced from subsequent analyses by other groups such as the Alphaproteobacteria and Actinobacteria (Figure 3) that, despite being more abundant, have a minor impact on the other factors (Figure 2). The new methodology applied, indicates that it may not always be the most abundant microorganism in a system that plays a key role in determining processes taking place in DWDS. The most abundant microorganisms do not always have the highest influence on the other microorganisms and physicochemical parameters. Therefore, data of relative abundance of microorganisms cannot be considered in isolation and other parameters within the system need to be taken into account when decision and control strategies are considered for DWDS. Traditional decision-making strategies and management practices should therefore move away from estimating microbial loads and move towards more useful evaluations of influence of microorganisms with environmental parameters (e.g., phosphate, turbidity and metals) in a specific context.
By taking into consideration the importance of the Betaproteobacteria group, it can lead to a better understanding about relationships among different parameters. For example, it has been reported that Betaproteobacteria contributes positively to enhance biological phosphorus removal under laboratory-scale conditions [51]. Also, in a freshwater reservoir, Betaproteobacteria seems to dominate and outgrow other bacteria when the concentration of inorganic or organic phosphorus increases and then to survive with phosphorus depleted conditions due to cytoplasmic phosphorus storage [52]. Recently, Ferro et al. [53] published a critical review about Betaproteobacteria in drinking water, recommending to put Betaproteobacteria in DWDS among the potentially relevant safety biomarkers, supporting the findings from this work. The authors highlighted the importance of this group in drinking water because of its resistance to chlorine-based disinfection treatments because of its ability to form biofilms and to degrade chlorinated compounds [54]. This disinfection resilience is associated with multidrug resistance (such as antibiotics) and resistance to other stress situations, which, in turn, can increase gene transfer and recombination events between bacterial communities, favouring antimicrobial resistance and the survival of pathogenic species [53].
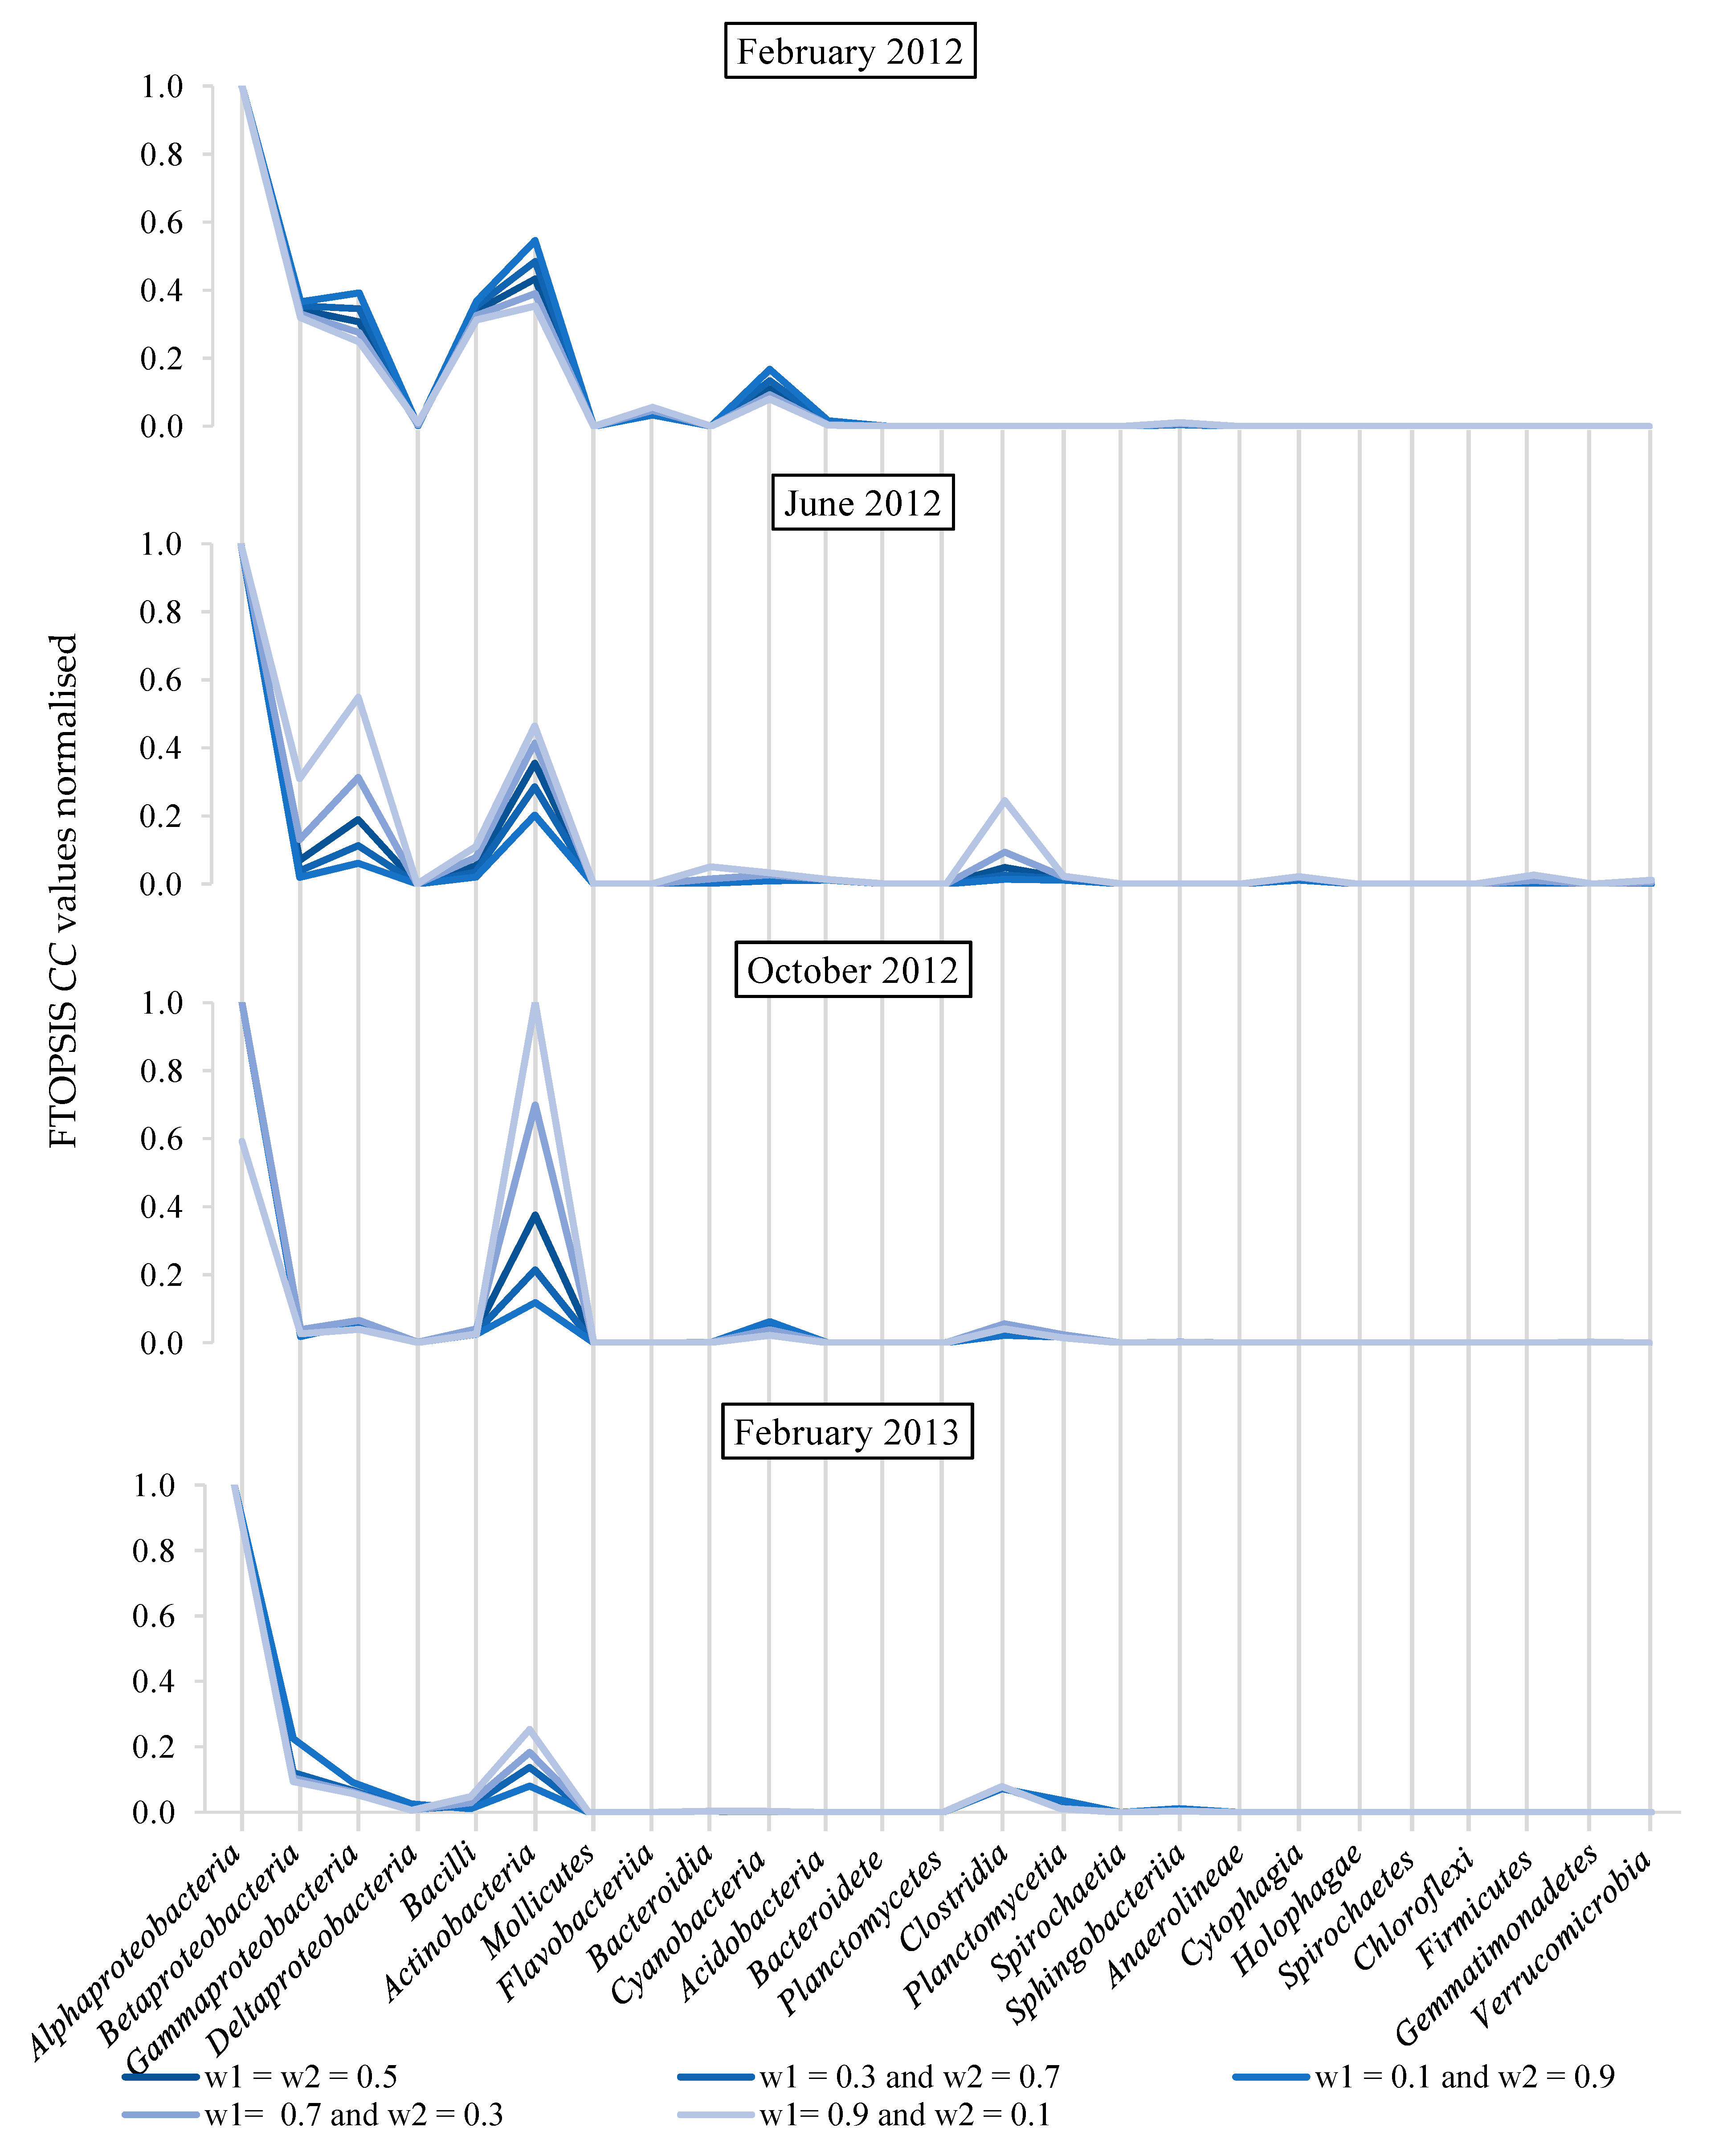
To complete the case study, a sensitivity analysis has been conducted on the normalised values of closeness coefficients (reflecting bacteria abundance). This is achieved by varying criteria weights and in the FTOPSIS application with attribute weights of 30%, 10%, 70% and 90% to the plastic pipe material () and their complements, 70%, 90%, 30% and 10%, to the cast iron pipe material (). Final results are shown in Figure 4, indicating that the abundance of bacteria varies depending on the season, and only seven groups of bacteria (Alphaproteobacteria, Betaproteobacteria, Gammaproteobacteria, Bacilli, Actinobacteria, Cyanobacteria and Clostridia) have a significant relevance throughout the year of sampling. Therefore, these bacterial groups can be considered as core components of microbial communities in material attached to pipes since they persisted in the system. It is considered remarkable that by varying weights attributed to the pipe materials, some groups of bacteria vary with respect to the others. This can be clearly observed in June 2012 with the groups of Betaproteobacteria, Actinobacteria and Clostridia, and in October 2012 with Alphaproteobacteria and Actinobacteria (Figure 4). Also, it seems that higher importance is attributed to the plastic pipe material, with higher relevance of bacteria.
Results reported in Figure 4 indicate that bacterial abundance should not be the only factor taken into consideration by water utilities to establish management strategies. This approach provides water companies with a tool to locate those most relevant factors of the system. For example, from the knowledge of the most important physicochemical and biological factors, these can be altered to promote the proliferation of those microorganisms positively influencing quality of supplied drinking water. This could be achieved by favouring the growth of non-pathogenic microorganisms that, on one hand, are capable to produce natural compounds fundamental to maintain and improve pipe conditions and, on the other hand, to displace opportunistic pathogens with possible associated health risks.
5. Conclusions
For the first time this work has shown that by using a multi-criteria decision-making approach, microbial ecology can be integrated as part of drinking water distribution systems management decisions. Results have shown:
- Mutual interdependencies existing among water quality parameters (e.g., iron, chlorine, phosphate etc.,) and bacterial class can be determined by the decision-making trial and evaluation laboratory, also removing the need for reliance on expert judgement.
- Bacterial classes can be ranked according to their relative abundance depending on pipe materials using the fuzzy technique for order preference by similarity to ideal solution.
- The method reveals that the critical bacterial classes, those that have the most inter-dependencies and therefore potential management impact, may not be the most abundant.
- Initial application of the approach generated new knowledge of the physicochemical and biological parameters that are most likely to influence the presence and relative abundance of bacterial classes, for the limited data set available. Such knowledge will allow water companies to inform management strategies to promote favourable bacterial communities and hence help to safeguard drinking water quality.
Supplementary Materials
The following are available online at https://www.mdpi.com/2073-4441/12/5/1247/s1. Table S1: Total relation matrix resulting from the decision-making trial and evaluation laboratory (DEMATEL) application.
Author Contributions
Conceptualization: S.C., G.D.O. and I.D.; methodology, software and validation: S.C. and J.I., formal analysis and investigation: S.C., G.D.O., J.I., S.H., J.B., I.D.; resources and data curation: S.H., J.B., I.D., writing—original draft preparation: S.C. and G.D.O.; writing—review and editing: J.I., S.H., J.B., I.D. All authors have read and agreed to the published version of the manuscript.
Funding
This research received no external funding.
Acknowledgments
The research reported here was supported by the UK Engineering and Physical Sciences Research Council (EPSRC), EPSRC-LWEC Challenge Fellowship EP/N02950X/1. We also would like to thank United Utilities for sampling sites, field work and physicochemical sample analysis.
Conflicts of Interest
The authors declare no conflict of interest.
Appendix A. DEMATEL and FTOPSIS Results

Table A1.
Values of prominence for each factor and final ranking of dependencies.
| Factor | r = c | Prominence | Order | Ranking | |
|---|---|---|---|---|---|
| P1 | 1.437216965 | 2.87443393 | 37 | P12 | Iron |
| P2 | 2.973143464 | 5.946286928 | 6 | P3 | Phosphate |
| P3 | 3.17935789 | 6.358715781 | 4 | P9 | Betaproteobacteria |
| P4 | 2.345268204 | 4.690536408 | 17 | P10 | Turbidity |
| P5 | 1.726788409 | 3.453576818 | 32 | B2 | Manganese |
| P6 | 2.251308008 | 4.502616016 | 23 | B8 | Diversity |
| P7 | 2.030897355 | 4.06179471 | 27 | B4 | Spirochaetia |
| P8 | 2.640276655 | 5.280553311 | 12 | B16 | Gammaproteobacteri |
| P9 | 3.448076894 | 6.896153789 | 1 | P2 | Flavobacteriia |
| P10 | 3.137029854 | 6.274059707 | 5 | B15 | Gemmatimonadetes |
| P11 | 2.240798202 | 4.481596404 | 24 | B3 | Deltaproteobacteria |
| P12 | 3.424555671 | 6.849111342 | 2 | B5 | Aluminium |
| P13 | 1.509733521 | 3.019467042 | 36 | P8 | Acidobacteria |
| B1 | 1.58008322 | 3.160166439 | 34 | B21 | Bacilli |
| B2 | 3.393248734 | 6.786497469 | 3 | B9 | Anaerolineae |
| B3 | 2.895992476 | 5.791984953 | 8 | B25 | Holophagae |
| B4 | 2.653556974 | 5.307113947 | 11 | B19 | Total organic carbon |
| B5 | 2.511551785 | 5.02310357 | 14 | B24 | Bacteroidete |
| B6 | 1.395898146 | 2.791796292 | 38 | P4 | Sphingobacteriia |
| B7 | 1.927236046 | 3.854472092 | 29 | B11 | Firmicutes |
| B8 | 2.815970477 | 5.631940955 | 9 | B23 | Bacteroidia |
| B9 | 2.303522588 | 4.607045176 | 21 | B12 | Chloroflexi |
| B10 | 1.953345677 | 3.906691354 | 28 | B7 | pH |
| B11 | 2.528074142 | 5.056148284 | 13 | B10 | Nitrate |
| B12 | 2.341968998 | 4.683937996 | 18 | P6 | Planctomycetia |
| B13 | 1.548426935 | 3.09685387 | 35 | P11 | Cytophagia |
| B14 | 1.835317607 | 3.670635214 | 30 | B17 | Chlorine |
| B15 | 2.201492206 | 4.402984412 | 25 | B20 | Cyanobacteria |
| B16 | 2.93537933 | 5.870758661 | 7 | P7 | Mollicutes |
| B17 | 2.320906655 | 4.64181331 | 19 | B14 | Clostridia |
| B18 | 2.369284818 | 4.738569635 | 15 | B22 | Spirochaetes |
| B19 | 2.112981146 | 4.225962291 | 26 | B13 | Temperature |
| B20 | 2.351855933 | 4.703711866 | 16 | P5 | Verrucomicrobia |
| B21 | 1.752601241 | 3.505202483 | 31 | B26 | Alphaproteobacteria |
| B22 | 2.266608635 | 4.533217271 | 22 | P13 | Planctomycetes |
| B23 | 2.314947689 | 4.629895379 | 20 | P1 | Sulphate |
| B24 | 2.711514009 | 5.423028017 | 10 | B1 | Richness |
| B25 | 1.652805885 | 3.305611769 | 33 | B6 | Actinobacteria |
Table A2.
Fuzzy evaluations of bacteria concentration referred to the February 2012 measurement.
| ID | ||||||
|---|---|---|---|---|---|---|
| B1 | 20.49107931 | 22.98176432 | 35.19847571 | 17.49200859 | 24.68045308 | 25.27149145 |
| B2 | 6.999646706 | 7.151476659 | 9.267970455 | 5.299802556 | 11.94256668 | 15.4431105 |
| B3 | 4.560177834 | 5.074191839 | 15.04694037 | 6.692299699 | 10.77111383 | 13.02206152 |
| B4 | 0.393775802 | 3.161985515 | 3.85331385 | 0.020783539 | 1.1318975 | 1.666710071 |
| B5 | 4.930240006 | 9.649355238 | 21.37821531 | 6.791843538 | 8.375766393 | 9.982707122 |
| B6 | 6.66573253 | 8.351857733 | 11.1596891 | 10.72682492 | 10.88049168 | 22.21760366 |
| B7 | 0 | 0.232199692 | 7.138774214 | 0 | 0.639312477 | 11.86228808 |
| B8 | 1.258611553 | 1.431230859 | 2.229279136 | 0.539747419 | 0.572931587 | 6.131144134 |
| B9 | 0.176647235 | 1.144984687 | 1.390917752 | 0 | 1.582560394 | 12.63639198 |
| B10 | 1.174976183 | 2.40606922 | 8.386327504 | 3.153727962 | 4.574752397 | 5.840174582 |
| B11 | 0 | 0 | 0.749444268 | 0 | 0 | 1.203156332 |
| B12 | 0.039745628 | 0.527151477 | 3.342874872 | 0.463553738 | 0.654681492 | 2.814022952 |
| B13 | 0.080068859 | 0.387424579 | 0.463698993 | 0 | 1.013047215 | 3.018393334 |
| B14 | 0.018015493 | 0.225225225 | 0.381073357 | 0 | 0.317716607 | 1.62972279 |
| B15 | 0.368370911 | 2.295974538 | 5.272919979 | 0 | 0 | 0.005240266 |
| B16 | 0.317561131 | 1.175010509 | 4.107048225 | 0 | 3.143311024 | 5.502279516 |
| B17 | 0.260400127 | 0.980392157 | 1.937666393 | 0 | 0 | 0 |
| B18 | 0.02540489 | 1.801801802 | 2.259943551 | 0 | 1.828172609 | 1.844573704 |
| B19 | 0 | 0.174149769 | 0.251722311 | 0 | 0 | 0 |
| B20 | 0 | 0.04857799 | 0.058049923 | 0 | 0 | 0 |
| B21 | 0 | 0.379791556 | 1.373180936 | 0 | 0.01039177 | 1.294345753 |
| B22 | 0 | 0 | 0 | 0 | 0 | 0 |
| B23 | 0 | 0.002001721 | 0.587352058 | 0 | 0 | 0 |
| B24 | 0 | 0.05404648 | 1.519166225 | 0 | 0 | 0 |
| B25 | 0 | 0.438377004 | 0.507860802 | 0 | 0 | 0.282974375 |
Table A3.
Normalised and weighted fuzzy matrix referred to the February 2012 measurement.
| ID | ||||||
|---|---|---|---|---|---|---|
| B1 | 0.000014205 | 0.000021756 | 0.000024401 | 0.000019785 | 0.000020259 | 0.000028584 |
| B2 | 0.000053949 | 0.000069915 | 0.000071432 | 0.000032377 | 0.000041867 | 0.000094343 |
| B3 | 0.000033229 | 0.000098537 | 0.000109645 | 0.000038396 | 0.000046420 | 0.000074713 |
| B4 | 0.000129758 | 0.000158128 | 0.001269758 | 0.000299992 | 0.000441736 | 0.0240575 |
| B5 | 0.000023388 | 0.000051817 | 0.000101415 | 0.000050087 | 0.000059696 | 0.000073618 |
| B6 | 0.000044804 | 0.000059867 | 0.000075010 | 0.000022504 | 0.000045954 | 0.000046612 |
| B7 | 0.000070040 | 0.002153319 | 1 | 0.000042150 | 0.00078209 | 1 |
| B8 | 0.000224288 | 0.00034935 | 0.000397263 | 0.000081551 | 0.000872705 | 0.000926359 |
| B9 | 0.000359475 | 0.000436687 | 0.0028305 | 0.000039568 | 0.000315944 | 1 |
| B10 | 0.000059621 | 0.000207808 | 0.000425541 | 0.000085614 | 0.000109296 | 0.000158543 |
| B11 | 0.000667161 | 1 | 1 | 0.000415574 | 1 | 1 |
| B12 | 0.000149572 | 0.000948494 | 0.01258 | 0.000177682 | 0.00076373 | 0.001078624 |
| B13 | 0.001078286 | 0.001290574 | 0.006244625 | 0.000165651 | 0.00049356 | 1 |
| B14 | 0.001312083 | 0.00222 | 0.027753889 | 0.000306801 | 0.00157373 | 1 |
| B15 | 0.000094824 | 0.000217772 | 0.001357328 | 0.095415 | 1 | 1 |
| B16 | 0.000121742 | 0.000425528 | 0.0015745 | 0.000090871 | 0.000159068 | 1 |
| B17 | 0.000258042 | 0.00051 | 0.001920122 | 1 | 1 | 1 |
| B18 | 0.000221244 | 0.0002775 | 0.01968125 | 0.000271065 | 0.000273497 | 1 |
| B19 | 0.001986316 | 0.002871092 | 1 | 1 | 1 | 1 |
| B20 | 0.008613276 | 0.010292727 | 1 | 1 | 1 | 1 |
| B21 | 0.000364118 | 0.001316512 | 1 | 0.000386296 | 0.048115 | 1 |
| B22 | 1 | 1 | 1 | 1 | 1 | 1 |
| B23 | 0.000851278 | 0.249785 | 1 | 1 | 1 | 1 |
| B24 | 0.000329128 | 0.009251296 | 1 | 1 | 1 | 1 |
| B25 | 0.000984522 | 0.001140571 | 1 | 0.001766944 | 1 | 1 |
Table A4.
Final bacteria rankings for the four periods of observation.
| February 2012 | June 2012 | October 2012 | February 2013 | ||||
|---|---|---|---|---|---|---|---|
| Ranking | Ranking | Ranking | Ranking | ||||
| 0.000021904 | B1 | 0.000032782 | B1 | 0.000020284 | B1 | 0.000018493 | B1 |
| 0.000050556 | B6 | 0.000092323 | B6 | 0.000054029 | B6 | 0.000134639 | B6 |
| 0.000064015 | B2 | 0.000173322 | B3 | 0.000314969 | B3 | 0.000151797 | B2 |
| 0.000064507 | B5 | 0.000473575 | B2 | 0.000460293 | B14 | 0.000242965 | B14 |
| 0.000071328 | B3 | 0.000609658 | B5 | 0.000489808 | B10 | 0.000273064 | B3 |
| 0.000198617 | B10 | 0.000679344 | B14 | 0.000551176 | B5 | 0.000915538 | B5 |
| 0.000533991 | B8 | 0.001587454 | B10 | 0.000618129 | B2 | 0.001244508 | B15 |
| 0.003518699 | B17 | 0.001798972 | B15 | 0.000916142 | B15 | 0.00212396 | B4 |
| 0.004021346 | B11 | 0.001857045 | B19 | 0.012192723 | B17 | 0.003477588 | B17 |
| 0.007296215 | B4 | 0.002647 | B11 | 0.012280875 | B9 | 0.005532909 | B9 |
| 0.241561775 | B15 | 0.004477637 | B9 | 0.014121489 | B24 | 0.028684001 | B10 |
| 0.241845487 | B9 | 0.006075334 | B23 | 0.014330545 | B4 | 0.241510047 | B19 |
| 0.242680267 | B12 | 0.011889233 | B25 | 0.061908005 | B13 | 0.243271905 | B11 |
| 0.24738986 | B13 | 0.241329775 | B16 | 0.24315878 | B11 | 0.243461954 | B12 |
| 0.349935656 | B14 | 0.241336195 | B4 | 0.2644993 | B8 | 0.243912411 | B8 |
| 0.414398757 | B7 | 0.241677682 | B8 | 0.419032998 | B16 | 0.342153911 | B20 |
| 0.41738494 | B19 | 0.242711521 | B17 | 0.426324756 | B25 | 0.342212028 | B25 |
| 0.50033904 | B23 | 0.414485803 | B20 | 0.432738399 | B19 | 0.342907479 | B22 |
| 0.500513044 | B16 | 0.416274632 | B13 | 0.501509865 | B23 | 0.346318664 | B13 |
| 0.501015736 | B25 | 0.422019615 | B24 | 0.505008398 | B12 | 0.346642736 | B16 |
| 0.659998225 | B22 | 0.500396692 | B12 | 0.506825384 | B18 | 0.500423791 | B18 |
| 0.661057314 | B18 | 0.502661286 | B18 | 0.511728433 | B7 | 0.501795598 | B24 |
| 0.688589598 | B21 | 0.503899708 | B7 | 0.594284831 | B20 | 0.667389964 | B21 |
| 0.763948195 | B24 | 0.659464916 | B22 | 0.660197068 | B22 | 0.759022559 | B23 |
| 1 | B20 | 0.659802486 | B21 | 1 | B21 | 0.759056766 | B7 |
References
- WHO. Guidelines for Drinking Water Quality, 4th Edition, Incorporating the 1st Addendum 2017. Available online: https://www.who.int/water_sanitation_health/publications/drinking-water-quality-guidelines-4-including-1st-addendum/en/ (accessed on 4 November 2019).
- ISO 5667-5:2006. Water Quality-Sampling-Part 5: Guidance on Sampling of Drinking Water from Treatment Works and Piped Distribution Systems. Available online: https://www.iso.org/obp/ui/#iso:std:iso:5667:-5:ed-2:v1:en (accessed on 22 November 2019).
- Deng, W.; Wang, G. A novel water quality data analysis framework based on time-series data mining. J. Environ. 2017, 196, 365–375. [Google Scholar] [CrossRef] [PubMed]
- Bos, R.; Alves, D.; Latorre, C.; Macleod, N.; Payen, G.; Roaf, V.; Rouse, M. Manual on the Human Rights to Safe Drinking Water and Sanitation for Practitioners; IWA Publishing: London, UK, 2016. [Google Scholar]
- McClymont, K.; Keedwell, E.; Savic, D. An analysis of the interface between evolutionary algorithm operators and problem features for water resources problems. A case study in water distribution network design. Environ. Model. Softw. 2015, 69, 414–424. [Google Scholar] [CrossRef] [Green Version]
- Izquierdo, J.; Montalvo, I.; Pérez-García, R.; Matías, A. On the Complexities of the Design of Water Distribution Networks. Math. Probl. Eng. 2011, 2012, 1–25. [Google Scholar] [CrossRef]
- Fox, S.; Shepherd, W.; Collins, R.; Boxall, J. Experimental Quantification of Contaminant Ingress into a Buried Leaking Pipe during Transient Events. J. Hydraul. Eng. 2016, 142, 04015036. [Google Scholar] [CrossRef]
- Mounce, S.; Mounce, R.; Boxall, J. Novelty detection for time series data analysis in water distribution systems using support vector machines. J. Hydroinform. 2011, 13, 672–686. [Google Scholar] [CrossRef]
- Vališ, D.; Hasilová, K.; Forbelská, M.; Vintr, Z. Reliability modelling and analysis of water distribution network based on backpropagation recursive processes with real field data. Measurement 2020, 149, 107026. [Google Scholar] [CrossRef]
- Liu, G.; Bakker, G.L.; Li, S.; Vreeburg, J.H.G.; Verberk, J.Q.J.C.; Medema, G.J.; Liu, W.T.; Van Dijk, J.C. Pyrosequencing reveals bacterial communities in unchlorinated drinking water distribution system: An integral study of bulk water, suspended solids, loose deposits, and pipe wall biofilm. Environ. Sci. Technol. 2014, 48, 5467–5476. [Google Scholar] [CrossRef]
- Donlan, R.M.; Costerton, J.W. Biofilms: Survival mechanisms of clinically relevant microorganisms. Clin. Microbiol. Rev. 2002, 15, 167–193. [Google Scholar] [CrossRef] [Green Version]
- Douterelo, I.; Husband, S.; Loza, V.; Boxall, J. Dynamics of Biofilm Regrowth in Drinking Water Distribution Systems. Appl. Environ. Microbiol. 2016, 82, 4155–4168. [Google Scholar] [CrossRef] [Green Version]
- Wang, H.; Hu, C.; Hu, X.; Yang, M.; Qu, J. Effects of disinfectant and biofilm on the corrosion of cast iron pipes in a reclaimed water distribution system. Water Res. 2012, 46, 1070–1078. [Google Scholar] [CrossRef]
- Husband, S.; Fish, K.E.; Douterelo, I.; Boxall, J.B. Linking discolouration modelling and biofilm behaviour within drinking water distribution systems. Water Sci. Technol. Water Supply 2016, 16, 942–950. [Google Scholar] [CrossRef]
- Wingender, J.; Flemming, H.C. Biofilms in drinking water and their role as reservoir for pathogens. Int. J. Hyg. Environ. Health 2011, 214, 417–423. [Google Scholar] [CrossRef]
- Douterelo, I.; Boxall, J.B.; Deines, P.; Sekar, R.; Fish, K.E.; Biggs, C.A. Methodological approaches for studying the microbial ecology of drinking water distribution systems. Water Res. 2014, 65, 134–156. [Google Scholar] [CrossRef] [Green Version]
- Prakash, B.; Veeregowda, B.M.; Krishnappa, G. Biofilms: A survival strategy of bacteria. Curr. Sci. 2003, 85, 1299–1307. [Google Scholar]
- Douterelo, I.; Sharpe, R.L.; Boxall, J.B. Influence of hydraulic regimes on bacterial community structure and composition in an experimental drinking water distribution system. Water Res. 2013, 47, 503–516. [Google Scholar] [CrossRef] [PubMed]
- European Commission. Council Directive 98/83/EC on the quality of water intended for human consumption. Off. J. Eur. Commun. 1998, 41, 32–54. [Google Scholar]
- Harwani, D. The Great Plate Count Anomaly and the Unculturable Bacteria. Int. J. Sci. 2012, 2, 350–351. [Google Scholar] [CrossRef]
- Ikonen, J.; Pitkänen, T.; Kosse, P.; Ciszek, R.; Kolehmainen, M.; Miettinen, I.T. On-line detection of Escherichia coli intrusion in a pilot-scale drinking water distribution system. J. Environ. Manag. 2017, 198, 384–392. [Google Scholar] [CrossRef]
- Wang, Z.; Chen, Q.; Zhang, J.; Dong, J.; Yan, H.; Chen, C.; Feng, R. Characterization and source identification of tetracycline antibiotics in the drinking water sources of the lower Yangtze River. J. Environ. Manag. 2019, 244, 13–22. [Google Scholar] [CrossRef]
- Yu, J.; Kim, D.; Lee, T. Microbial diversity in biofilms on water distribution pipes of different materials. Water Sci. Technol. 2010, 61, 163–171. [Google Scholar] [CrossRef]
- Rogers, J.W.; Louis, G.E. Risk and opportunity in upgrading the US drinking water infrastructure system. J. Environ. Manag. 2008, 87, 26–36. [Google Scholar] [CrossRef] [PubMed]
- Henriques, J.J.; Louis, G.E. A decision model for selecting sustainable drinking water supply and greywater reuse systems for developing communities with a case study in Cimahi, Indonesia. J. Environ. Manag. 2011, 92, 214–222. [Google Scholar] [CrossRef] [PubMed]
- Ramos-Martínez, E.; Herrera, M.; Gutiérrez-Pérez, J.; Izquierdo, J.; Pérez-García, R. Rehabilitation actions in water supply systems: Effects on biofilm susceptibility. Procedia Eng. 2014, 89, 225–231. [Google Scholar] [CrossRef]
- Ramos-Martínez, E.; Herrera, M.; Izquierdo, J.; Pérez-García, R. Multi-Agent Approach to Biofilm Development in Water Supply Systems. In Proceedings of the Atiner’s Conference Paper Series; Athens Institute for Education and Research: Athina, Greece, 2015; Volume 1693, pp. 3–9. [Google Scholar]
- Ramos-Martínez, E.; Herrera, M.; Izquierdo, J.; Pérez-García, R. A multi-disciplinary procedure to ascertain biofilm formation in drinking water pipes. In Proceedings of the 8th International Congress on Environmental Modelling and Software, Toulouse, France, 10–14 July 2016; Volume 3, pp. 619–626. [Google Scholar]
- Fontela, E.; Gabus, A. DEMATEL, Innovative Methods, Technical Report no. 2, Structural Analysis of the World Problematique; Battelle Geneva Research Institute: Geneva, Switzerland, 1974. [Google Scholar]
- Fontela, E.; Gabus, A. The DEMATEL Observe; Battelle Institute, Geneva Research Center: Geneva, Switzerland, 1976. [Google Scholar]
- Dalvi-Esfahani, M.; Niknafs, A.; Kuss, D.J.; Nilashi, M.; Afrough, S. Social media addiction: Applying the DEMATEL approach. Telemat. Inform. 2019, 43, 101250. [Google Scholar] [CrossRef]
- Si, S.-L.; You, X.-Y.; Liu, H.-C.; Zhang, P. Dematel Technique: A Systematic Review of the State-of-the-Art Literature on Methodologies and Applications. Math. Probl. Eng. 2018, 2018, 3696457. [Google Scholar] [CrossRef] [Green Version]
- Chen, C. Extensions of the TOPSIS for group decision-making under fuzzy environment. Fuzzy Set. Syst. 2000, 114, 1–9. [Google Scholar] [CrossRef]
- Hwang, C.L.; Yoon, K. Multiple Attribute Decision Making: Methods and Applications; Springer: New York, NY, USA, 1981. [Google Scholar]
- Gul, M.; Ak, M.F. A comparative outline for quantifying risk ratings in occupational health and safety risk assessment. J. Clean. Prod. 2018, 196, 653–664. [Google Scholar] [CrossRef]
- Carpitella, S.; Certa, A.; Izquierdo, J.; La Fata, C.M. A combined multi-criteria approach to support FMECA analyses: A real-world case. Reliab. Eng. Syst. Safe 2018, 169, 394–402. [Google Scholar] [CrossRef] [Green Version]
- Palczewski, K.; Sałabun, W. The fuzzy TOPSIS applications in the last decade. Procedia Comput. Sci. 2019, 159, 2294–2303. [Google Scholar] [CrossRef]
- Sarkar, S.; Pratihar, D.K.; Sarkar, B. An integrated fuzzy multiple criteria supplier selection approach and its application in a welding company. J. Manuf. Syst. 2018, 46, 163–178. [Google Scholar] [CrossRef]
- Dinçer, H.; Yüksel, S.; Martínez, L. Interval type 2-based hybrid fuzzy evaluation of financial services in E7 economies with DEMATEL-ANP and MOORA methods. Appl. Soft Comput. 2019, 79, 186–202. [Google Scholar] [CrossRef]
- Chen, J.-K.; Chen, I.-S. Using a novel conjunctive MCDM approach based on DEMATEL, fuzzy ANP, and TOPSIS as an innovation support system for Taiwanese higher education. Expert Syst. Appl. 2010, 37, 1981–1990. [Google Scholar] [CrossRef]
- Nilashi, M.; Samad, S.; Manaf, A.A.; Ahmadi, H.; Rashid, T.A.; Munshi, A.; Almukadi, W.; Ibrahim, O.; Ahmed, O.H. Factors influencing medical tourism adoption in Malaysia: A DEMATEL-Fuzzy TOPSIS approach. Comput. Ind. Eng. 2019, 137, 106005. [Google Scholar] [CrossRef]
- Li, G.; Ma, X.; Chen, R.; Yu, Y.; Tao, H.; Shi, B. Field studies of manganese deposition and release in drinking water distribution systems: Insight into deposit control. Water Res. 2019, 163, 114897. [Google Scholar] [CrossRef] [PubMed]
- Zhu, Y.; Wang, H.; Li, X.; Hu, C.; Yang, M.; Qu, J. Characterization of biofilm and corrosion of cast iron pipes in drinking water distribution system with UV/Cl2 disinfection. Water Res. 2014, 60, 174–181. [Google Scholar] [CrossRef]
- Chiu, Y.J.; Chen, H.C.; Tzeng, G.H.; Shyu, J.Z. Marketing strategy based on customer behavior for the LCD-TV. Int. J. Manag. Decis. Mak. 2006, 7, 143–165. [Google Scholar]
- Du, Y.-W.; Zhou, W. New improved DEMATEL method based on both subjective experience and objective data. Eng. Appl. Artif. Intell. 2019, 83, 57–71. [Google Scholar] [CrossRef]
- Carpitella, S.; Carpitella, F.; Certa, A.; Benítez, J.; Izquierdo, J. Managing human factors to reduce organisational risk in industry. Math. Comput. Appl. 2018, 23, 67. [Google Scholar] [CrossRef] [Green Version]
- Meyer, C. Matrix Analysis and Applied Linear Algebra; SIAM: Philadelphia, PA, USA, 2000. [Google Scholar]
- Gerami Seresht, N.; Fayek, A.R. Computational method for fuzzy arithmetic operations on triangular fuzzy numbers by extension principle. Int. J. Approx. Reason. 2019, 106, 172–193. [Google Scholar] [CrossRef]
- Zadeh, L.A. Fuzzy sets. Inf. Control 1965, 8, 338–353. [Google Scholar] [CrossRef] [Green Version]
- Prokopowicz, P. The use of Ordered Fuzzy Numbers for modelling changes in dynamic processes. Inf. Sci. 2019, 470, 1–14. [Google Scholar] [CrossRef]
- Okunuki, S.; Kawaharasaki, M.; Tanaka, H.; Kanagawa, T. Changes in phosphorus removing performance and bacterial community structure in an enhanced biological phosphorus removal reactor. Water Res. 2004, 38, 2433–2439. [Google Scholar] [CrossRef] [PubMed]
- Rofner, C.; Sommaruga, R.; Pérez, M.T. Phosphate and ATP uptake by lake bacteria: Does taxonomical identity matter? Environ. Microbiol. 2016, 18, 4782–4793. [Google Scholar] [CrossRef] [PubMed] [Green Version]
- Ferro, P.; Vaz-Moreira, I.; Manaia, C.M. Betaproteobacteria are predominant in drinking water: Are there reasons for concern? Crit. Rev. Microbiol. 2019, 45, 649–667. [Google Scholar] [CrossRef]
- Ertekin, E.; Hatt, J.K.; Konstantinidis, K.T.; Tezel, U. Similar microbial consortia and genes are involved in the biodegradation of benzalkonium chlorides in different environments. Environ. Sci. Technol. 2016, 50, 4304–4313. [Google Scholar] [CrossRef]
Figure 1.
Flowchart representing the proposed approach.

Figure 2.
Prominence values for all the considered factors.

Figure 3.
FTOPSIS results with bars heights normalised to the max value (varying between 0 and 1).

Figure 4.
Sensitivity analysis on normalised values by varying criteria weights.

Table 1.
Factors taken into account for the multi-criteria decision-making (MCDM) analysis.
| Water Quality Parameter | Bacterial Class | ||||
|---|---|---|---|---|---|
| P1 | Richness | B1 | Alphaproteobacteria | B14 | Clostridia |
| P2 | Diversity | B2 | Betaproteobacteria | B15 | Planctomycetia |
| P3 | Turbidity | B3 | Gammaproteobacteri | B16 | Spirochaetia |
| P4 | Total organic carbon | B4 | Deltaproteobacteria | B17 | Sphingobacteriia |
| P5 | Temperature | B5 | Bacilli | B18 | Anaerolineae |
| P6 | pH | B6 | Actinobacteria | B19 | Cytophagia |
| P7 | Chlorine | B7 | Mollicutes | B20 | Holophagae |
| P8 | Aluminium | B8 | Flavobacteriia | B21 | Spirochaetes |
| P9 | Iron | B9 | Bacteroidia | B22 | Chloroflexi |
| P10 | Manganese | B10 | Cyanobacteria | B23 | Firmicutes |
| P11 | Nitrate | B11 | Acidobacteria | B24 | Gemmatimonadetes |
| P12 | Phosphate | B12 | Bacteroidete | B25 | Verrucomicrobia |
| P13 | Sulphate | B13 | Planctomycetes | ||
© 2020 by the authors. Licensee MDPI, Basel, Switzerland. This article is an open access article distributed under the terms and conditions of the Creative Commons Attribution (CC BY) license (http://creativecommons.org/licenses/by/4.0/).
Share and Cite
MDPI and ACS Style
Carpitella, S.; Del Olmo, G.; Izquierdo, J.; Husband, S.; Boxall, J.; Douterelo, I. Decision-Making Tools to Manage the Microbiology of Drinking Water Distribution Systems. Water 2020, 12, 1247. https://doi.org/10.3390/w12051247
AMA Style
Carpitella S, Del Olmo G, Izquierdo J, Husband S, Boxall J, Douterelo I. Decision-Making Tools to Manage the Microbiology of Drinking Water Distribution Systems. Water. 2020; 12(5):1247. https://doi.org/10.3390/w12051247
Chicago/Turabian StyleCarpitella, Silvia, Gonzalo Del Olmo, Joaquín Izquierdo, Stewart Husband, Joby Boxall, and Isabel Douterelo. 2020. "Decision-Making Tools to Manage the Microbiology of Drinking Water Distribution Systems" Water 12, no. 5: 1247. https://doi.org/10.3390/w12051247
Note that from the first issue of 2016, this journal uses article numbers instead of page numbers. See further details here.