Interannual Variations of Evapotranspiration and Water Use Efficiency over an Oasis Cropland in Arid Regions of North-Western China


1
Key Laboratory of Remote Sensing of Gansu Province, Heihe Remote Sensing Experimental Research Station, Northwest Institute of Eco-Environment and Resources, Chinese Academy of Sciences, Lanzhou 730000, China
2
National Tibetan Plateau Data Center, Institute of Tibetan Plateau Research, Chinese Academy of Sciences, Beijing 100101, China
3
CAS Center for Excellence in Tibetan Plateau Earth Sciences, Chinese Academy of Sciences, Beijing 100101, China
*
Author to whom correspondence should be addressed.
Water 2020, 12(5), 1239; https://doi.org/10.3390/w12051239
Submission received: 15 March 2020
/
Revised: 16 April 2020
/
Accepted: 22 April 2020
/
Published: 26 April 2020
(This article belongs to the Special Issue Evapotranspiration and Plant Irrigation Strategies)
Abstract
:The efficient use of limited water resources and improving the water use efficiency (WUE) of arid agricultural systems is becoming one of the greatest challenges in agriculture production and global food security because of the shortage of water resources and increasing demand for food in the world. In this study, we attempted to investigate the interannual trends of evapotranspiration and WUE and the responses of biophysical factors and water utilization strategies over a main cropland ecosystem (i.e., seeded maize, Zea mays L.) in arid regions of North-Western China based on continuous eddy-covariance measurements. This paper showed that ecosystem WUE and canopy WUE of the maize ecosystem were 1.90 ± 0.17 g C kg−1 H2O and 2.44 ± 0.21 g C kg−1 H2O over the observation period, respectively, with a clear variation due to a change of irrigation practice. Traditional flood irrigation generally results in over-irrigation, providing more water than actual crop requirements. Unlike flood irrigation, which can infiltrate into deep soil layers, drip irrigation can only influence the shallow soil moisture, which can lead to decreases of soil moisture of approximately 27–32% and 36–42% compared with flood irrigation for shallow and deep layers, respectively. Additionally, drip irrigation decreases evapotranspiration by 13% and transpiration by 11–14%, leading to increases in ecosystem and canopy WUE of 9–14% and 11%, respectively, compared to the traditional irrigation practice. Therefore, the drip irrigation strategy is an effective method to reduce irrigation water use and increase crop WUE in arid regions. Our study provides guidance to water-saving cultivation systems and has implications for sustainable water resources management and agriculture development in water-limited regions.
1. Introduction
Water shortages are threatening the survival of human beings. Water resources per capita are decreasing in the world, while the population is increasing [1]. There are wide concerns about whether current available water resources will meet food demands in the future with the growth of the population. Water is a fundamental natural resource to agriculture production in arid regions and therefore affects global food security. Water availability dominantly controls the spatial variability of the carbon cycle in arid and semiarid regions [2]. Irrigated agriculture accounts for approximately 40% of the world crop production [3], which is crucial for global food security [4]. Since precipitation is less than potential evapotranspiration (ET) in arid and semiarid regions, surface water supply is extremely limited. Irrigation from groundwater is therefore an important source of water availability for croplands and other vegetation in water-limited regions [5]. This limited groundwater resource has resulted in the overexploitation of groundwater and the degradation of vegetation in arid regions [6]. Therefore, the efficient use of water resources by rational irrigation practice is of great significance to water-saving agriculture production and the sustainable development of water resources in regions of water scarcity.
Water use efficiency (WUE), the ratio of carbon gain to water consumption [7,8,9,10], is usually recognized as an important characteristic of ecosystem function that refers to the connections between carbon assimilation and water cycles [8,11]. WUE is also regarded as an important index in assessing the reasonable utilization of water resources for agricultural production. ET comprises vegetation transpiration (T) and soil evaporation (E), and is identified as an important component of the terrestrial ecosystem’s water and energy cycle [12]. The transpiration fraction of the ET (T/ET) is vital to examine the hydrological responses of vegetation dynamics and climate changes [13]. Realizing water-saving techniques to reduce the E loss from soil and increasing the WUE of croplands is highly important to the implementation of precision agriculture and to realize sustainable agriculture management under conditions of water scarcity in arid regions [14,15]. Therefore, quantifying the temporal variations and the effects of irrigation practices on ET and WUE in the main cropland ecosystems in arid regions is fundamentally important to accurate prediction of grain production and the sustainable development of water resources in water-limited regions [16]. However, this issue is not yet well understood in arid regions globally, especially those of western China, which lack advanced experience in agricultural management. Previous studies recognized no significant differences in WUE in different years over rain-fed crop systems [17,18,19], while water management strategies differ for irrigated and rain-fed crops [20]. How different climatic regimes and agricultural water use practices in arid regions potentially affect the seasonal and inter-annual variations in ecosystem ET components and WUE, and hence the terrestrial water and energy balances of crop systems, is not well understood [21]. ET partitioning approaches including in situ measurements, such as the use of a lysimeter, sap flow and stable isotopes, and the eddy covariance (EC) technique [22], each have limitations, and no consensus has been reached regarding the best method [23]. Additionally, models, which are also an important tool for partitioning ET components, can simulate the ET and its components with multiple temporal and spatial scales [12,24,25]. Among these, two source models (e.g., the improved Penman–Monteith methods) have been proven to be effective and have been widely developed in estimating ET and its components at different scales [26,27,28,29,30].
Optimizing irrigation practices is an important way of utilizing the limited irrigation water efficiently. Higher WUE with appropriate irrigation strategies can be achieved by producing higher grain yield or consuming less water [31]. Some studies indicated that deficit irrigation or reduced irrigation frequency could result in higher WUE [31,32] and increase 10–50% of water productivity [33]. Traditional irrigation methods (e.g., flood irrigation) cannot easily control the amount of irrigation, inducing over-irrigation and a waste of water used [34]. It has been reported that several water-saving management practices, such as plastic film mulching [35,36] and drip irrigation [33], could reduce irrigation water and promote crop production, has and have been widely used in orchards, vegetables, and wide-row crops. However, some studies also found an increased crop transpiration (T) in mulching fields due to an increase of leaf area index (LAI), thus resulting in increased ET [37,38]. Therefore, further study of the impacts of irrigation technology, such as drip irrigation, on ET and WUE of croplands in arid regions is needed.
The study area located in the middle reaches of the Heihe River Basin (HRB), which constitutes a unique oasis-desert system in an arid region [2]. The oasis agriculture system is widely distributed in the oasis-desert transition regions of North-Western China, which is characterized by water scarcity, higher ET potential, and lower precipitation. Because of the significant water shortages and dry periods, the agricultural and domestic water supplied in this region mainly comes from river irrigation and groundwater exchanges [2]. Our study area (i.e., Zhangye) has adequate radiation resources and appropriate climate conditions suitable to plant seed corn. In recent years, seed corn production acts as the cornerstone industry in Zhangye [6,22]. Zhangye has become the largest base of seed corn production in China, producing 450 million kilograms of corn seeds annually, representing more than 50% of country’s production. This region suffers from water shortages, with precipitation typically less than 150 mm per year [39]. The water supply for farmland is mainly from irrigation, which constitutes more than 80% of the total available water resource in HRB [40,41]. Farmland close to the river is irrigated by surface water, while others depending on extracting groundwater. Previous study has revealed that the conflicts between water scarcity and available water resources are increasing due to the expansion of farmland and the increasing demand of water [42]. The over-exploitation of groundwater and excessive water diversion has resulted in lots of eco-environmental problems, such as the degradation of wetlands in certain places in the middle oasis of the HRB in recent decades [6]. Consequently, it is crucial to adopt water-saving techniques in agriculture to achieve an increase of WUE with limited water. To resolve the tension between the shortage of water resources and the development of modern agriculture, the government of Zhangye has recently promoted efficient water-saving techniques for agricultural production, including drip irrigation under film mulch. Previous studies in the oasis regions of HRB concentrated on ET and water productivity at the field scale, with the soil water balance method and other models [41]. However, few studies have assessed the impact of irrigation strategies on interaunnal variations of ET and agriculture WUE of cropland ecosystems using the continuous measurements of flux towers in oasis regions.
In this study, we established continuous measurements of carbon and water fluxes over the cropland ecosystem in the HRB with the EC technique, and calculated the WUE of the cropland ecosystem during the period from 2012 to 2018 with different irrigation practices in different years. We intended to investigate the interannual trends of evapotranspiration and WUE and their responses of biophysical factors and water utilization strategies in arid regions of North-Western China. Here, we had the following objectives: (1) to explore the magnitude and interannual variations of ET components and WUE of a cropland ecosystem in different years, and (2) to investigate the determinants of temporal variability of ET components and WUE under different water use strategies, and their implications for agriculture management in arid regions.
2. Materials and Methods
2.1. Site Description
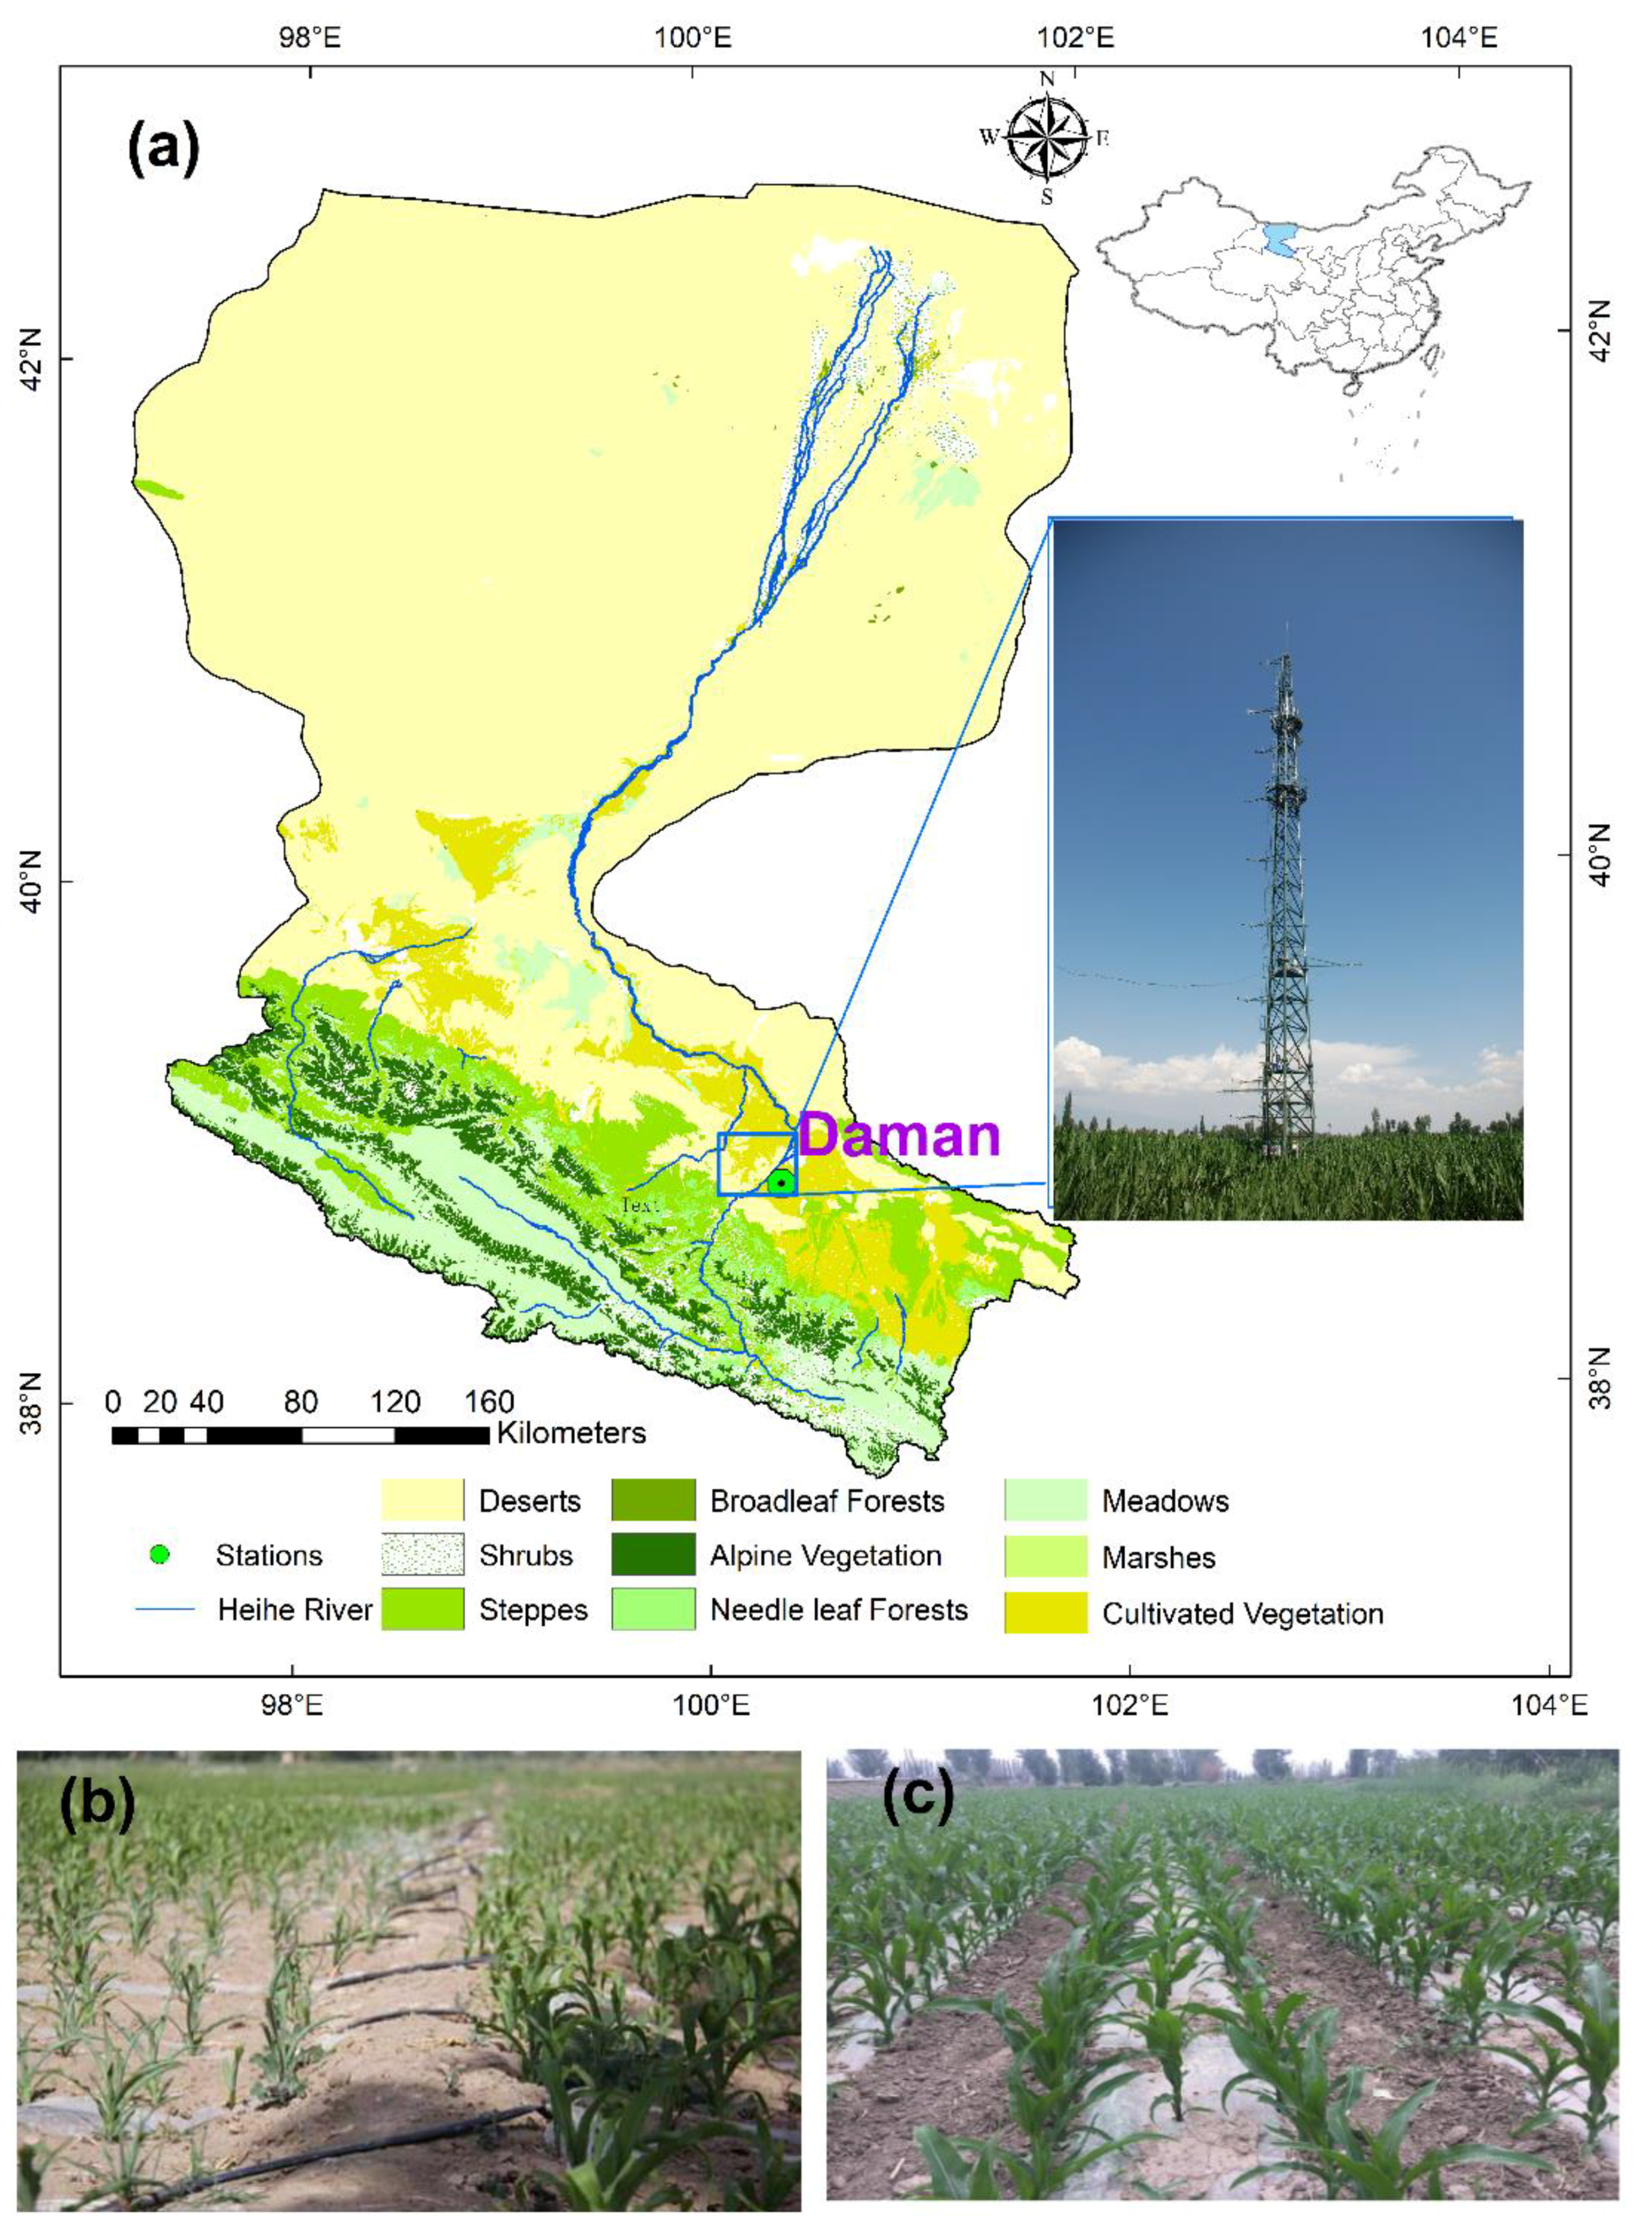
The study site was located in a typical desert–oasis region in an arid endorheic basin—the Heihe River Basin (HRB)—which is located in the Hexi Corridor of China (37.7–42.7° N, 97.1–102.0° E) [43,44]. As one of the most arid regions in the world, the desert-oasis system of HRB is widespread in North-Western China [45,46]. The flux tower at the Daman (DMZ) site is operated in an artificial oasis-desert compound in the middle reaches of the HRB (Figure 1), located in an arid environment with cold winters and hot summers. The vegetation type of DMZ is seed corn (Zea mays L.), a common crop type in this area. The 57-year (1960–2016) mean precipitation in this region is 128.50 mm per year [2]. The average mean temperature is 7.55 °C and solar radiation in the growing season is more than 200 W/m2, which is highly suitable for the growth of seed corn. The growing season typically starts around 1 May and ends around 31 September. Since the average air temperature of the study area is below zero °C during winter, the soil is frozen in the most periods in the non-growing seasons.
2.2. Field Management Practices
The growth of crop at this site is mainly dependent on irrigation due to low precipitation. To reduce soil evaporation, the site was planted with plastic mulching film more than 10 years ago. In winter, there is typically one period of irrigation for soil water conservation. The spring irrigation occurs typically before sowing (mid-to-end of March), which can leach the surface salt to groundwater in the deep layers. Meanwhile, our study region located in the middle area of the river basin, excessive irrigation from the Heihe River dissolves carbonate in soil and transport the surface water into the downstream of the river basin. These techniques make the salinization in our study area is not a serious problem. Prior to 2017, DMZ was flood-irrigated four to five times during the growing season, with more than 100 mm irrigation each time. Since the beginning of the growing season in 2017, the irrigation technique of DMZ was changed to drip irrigation, which has been the main form of irrigation. However, the intensity and frequency of the drip irrigation in certain periods in 2017 were higher than that in 2018. In our study, we used the data of both 2018 and 2017–2018 for the periods of drip irrigation.
2.3. Flux Measurements and Data Processing
Time series of water and carbon dioxide fluxes were obtained from the open-path EC (OPEC) system since May of 2012. The eddy covariance system includes an infrared gas analyzer (Li-7500A, Li-Cor Inc., USA) and a 3D sonic anemometer (CSAT-3 Campbell Scientific Instruments Inc., USA), which can continuously measure the carbon and water vapor fluxes. The raw flux data were recorded with a sampling frequency of 10 Hz, which were carefully processed using the Eddypro software [48]. The flux data processing and quality checks information were conducted as described in the literature [2,47,48]. The energy balance closure ratio of the DMZ site was 0.90 [49]. Gross primary productivity (GPP) and ecosystem respiration (Reco) were derived from net ecosystem exchange (NEE) measurements by a flux partitioning method based on the REddyProc processing procedure [50]. The meteorological variables were measured simultaneously, including air temperature (Ta, °C), soil temperature (Ts, °C), precipitation (P, mm), solar radiation (Rg, W m−2), and soil moisture (SM, %).
2.4. Satellites Data and Processing
The satellite-derived vegetation index (e.g., enhanced vegetation index (EVI) derived from the moderate resolution imaging spectroradiometer (MODIS)) is empirically related to the growth of vegetation. We therefore also used the MODIS reflectance products (V006 MCD43A4) to obtain the vegetation greenness (i.e., EVI), and examine the seasonal similarities and correlations between carbon fluxes and vegetation greenness. In order to correct the inferior values due to the clouds and aerosols, the Savitzky–Golay (SG) filter algorithm was used to reconstruct the original time series vegetation index data [51]. In addition, we also extracted the MODIS leaf area index (LAI) products (V006 MOD15A2H) to examine the seasonal variations of plant growth.
2.5. Ecosystem Water Use Efficiency (WUE), Canopy WUE and Water Availability Index
Both ecosystem WUE (g C kg−1 H2O) and canopy WUE were used in this study. The ecosystem WUE (WUEe) was defined as WUEe = GPP/ET, where GPP (g C m−2 day−1) is gross primary productivity and ET (kg H2O m−2 day−1) is evapotranspiration. ET were obtained from the eddy covariance measured latent heat flux (LE, W m−2). The canopy WUE was defined as WUEc = GPP/T [52], where T is transpiration. The T was partitioned from the ET measurements, which are introduced in detail in Section 2.6. WUE was analyzed for daily, monthly, and annual time-steps. The monthly and annual WUE were derived from the summation of GPP and ET components with corresponding time scales.
The relative extractable water content (REW) was used to define water scarcity. In general, we assumed occurring the soil water stress when REW decreased below 0.4 [53,54]. However, dripped irrigation will affect the temporal variations of soil moisture (SM). In this study, we used the REW to describe the effects of irrigation techniques. Daily REW was calculated as [54]: REW = (SM − SMmin)/ (SMmax − SMmin), where SMmin and SMmax are the minimum and maximum soil moisture during the study periods, respectively. Additionally, we also used the water availability index (WAI), the ratio of actual to potential ET, to examine the available water conditions [55]. The WAI, ranging from 0 to 1, represents the range from a well-watered condition to a water-stressed condition. The actual ET and potential ET were derived from the EC measurements and by the Penman–Monteith equation without resistance [56], respectively.
Similar with the reference [57], we established the multiple relationships between ET, GPP, and WUE and biophysical variables, and analysis the related statistics results to explain their relationships between carbon-water fluxes and climatic parameters (i.e., Ta, P, SM, WAI, EVI). To remove the confounding effects between these climatic parameters, we used the partial correlations analysis in our study, which could remove the effects of the third climate parameter on the carbon-water fluxes (e.g., GPP, ET, and WUE) when we considered the correlations between the carbon-water fluxes and the other variables. The partial correlation coefficients reflect the direct effects of the individual independent variables (i.e., climatic parameters) on dependent variables (ET, GPP, and WUE) respectively, which could remove the indirect influences of the other variables.
2.6. Evapotranspiration Partitioning Methods Using a Remote Sensing-Based Model
Three partitioning methods were used to partition ET components. The isotope method uses the theory of different isotopic composition of foliage transpiration (δT) and soil evaporation (δE). T/ET is derived from the difference between the isotopic compositions of ET (δET), soil evaporation (δE) and foliage transpiration (δT). The isotopic composition of surface air water vapor was measured with a water vapor isotope analyzer (Model L1102-i, Picarro Inc.), which was calibrated in every three hours [22]. The lysimeter measured the daily E from soil during the growing season in 2012. T/ET can be determined by combining the lysimeter measured E with the EC measured from ET fluxes. The detailed measurements and process of the isotope and lysimeter measurements at the DMZ site were described in the previous study [22]. Since the above two measurements were only measured during the growing season of maize in 2012, here, we mainly used these data to validation a remote sensing-based ET partitioning model. In this study, we used an improved Penman–Monteith (PM) method [29,30] to partition the ET components (called the PM–Leuning model hereafter). The model used a simple physical-based model to parameterize the surface conductance of the PM model. Similar with the previous studies [27,29], the total λET is the sum of λTc [27] and λEs [28]. This provided reliable estimates of ET and its components over different ecosystems and regions in the world [30]. Detailed descriptions of the PM–Leuning model can be found in [27,29,30]. The model was validated by the EC measured water fluxes and the lysimeter and isotope observed ET components (Figure 2). Good performance was found according to the validation results. All of the water fluxes be consistent well with high R2 (0.87–0.90) for ET and T components validated with different methods.
3. Results
3.1. Seasonal and Interannual Dynamics of Biophysical Factors
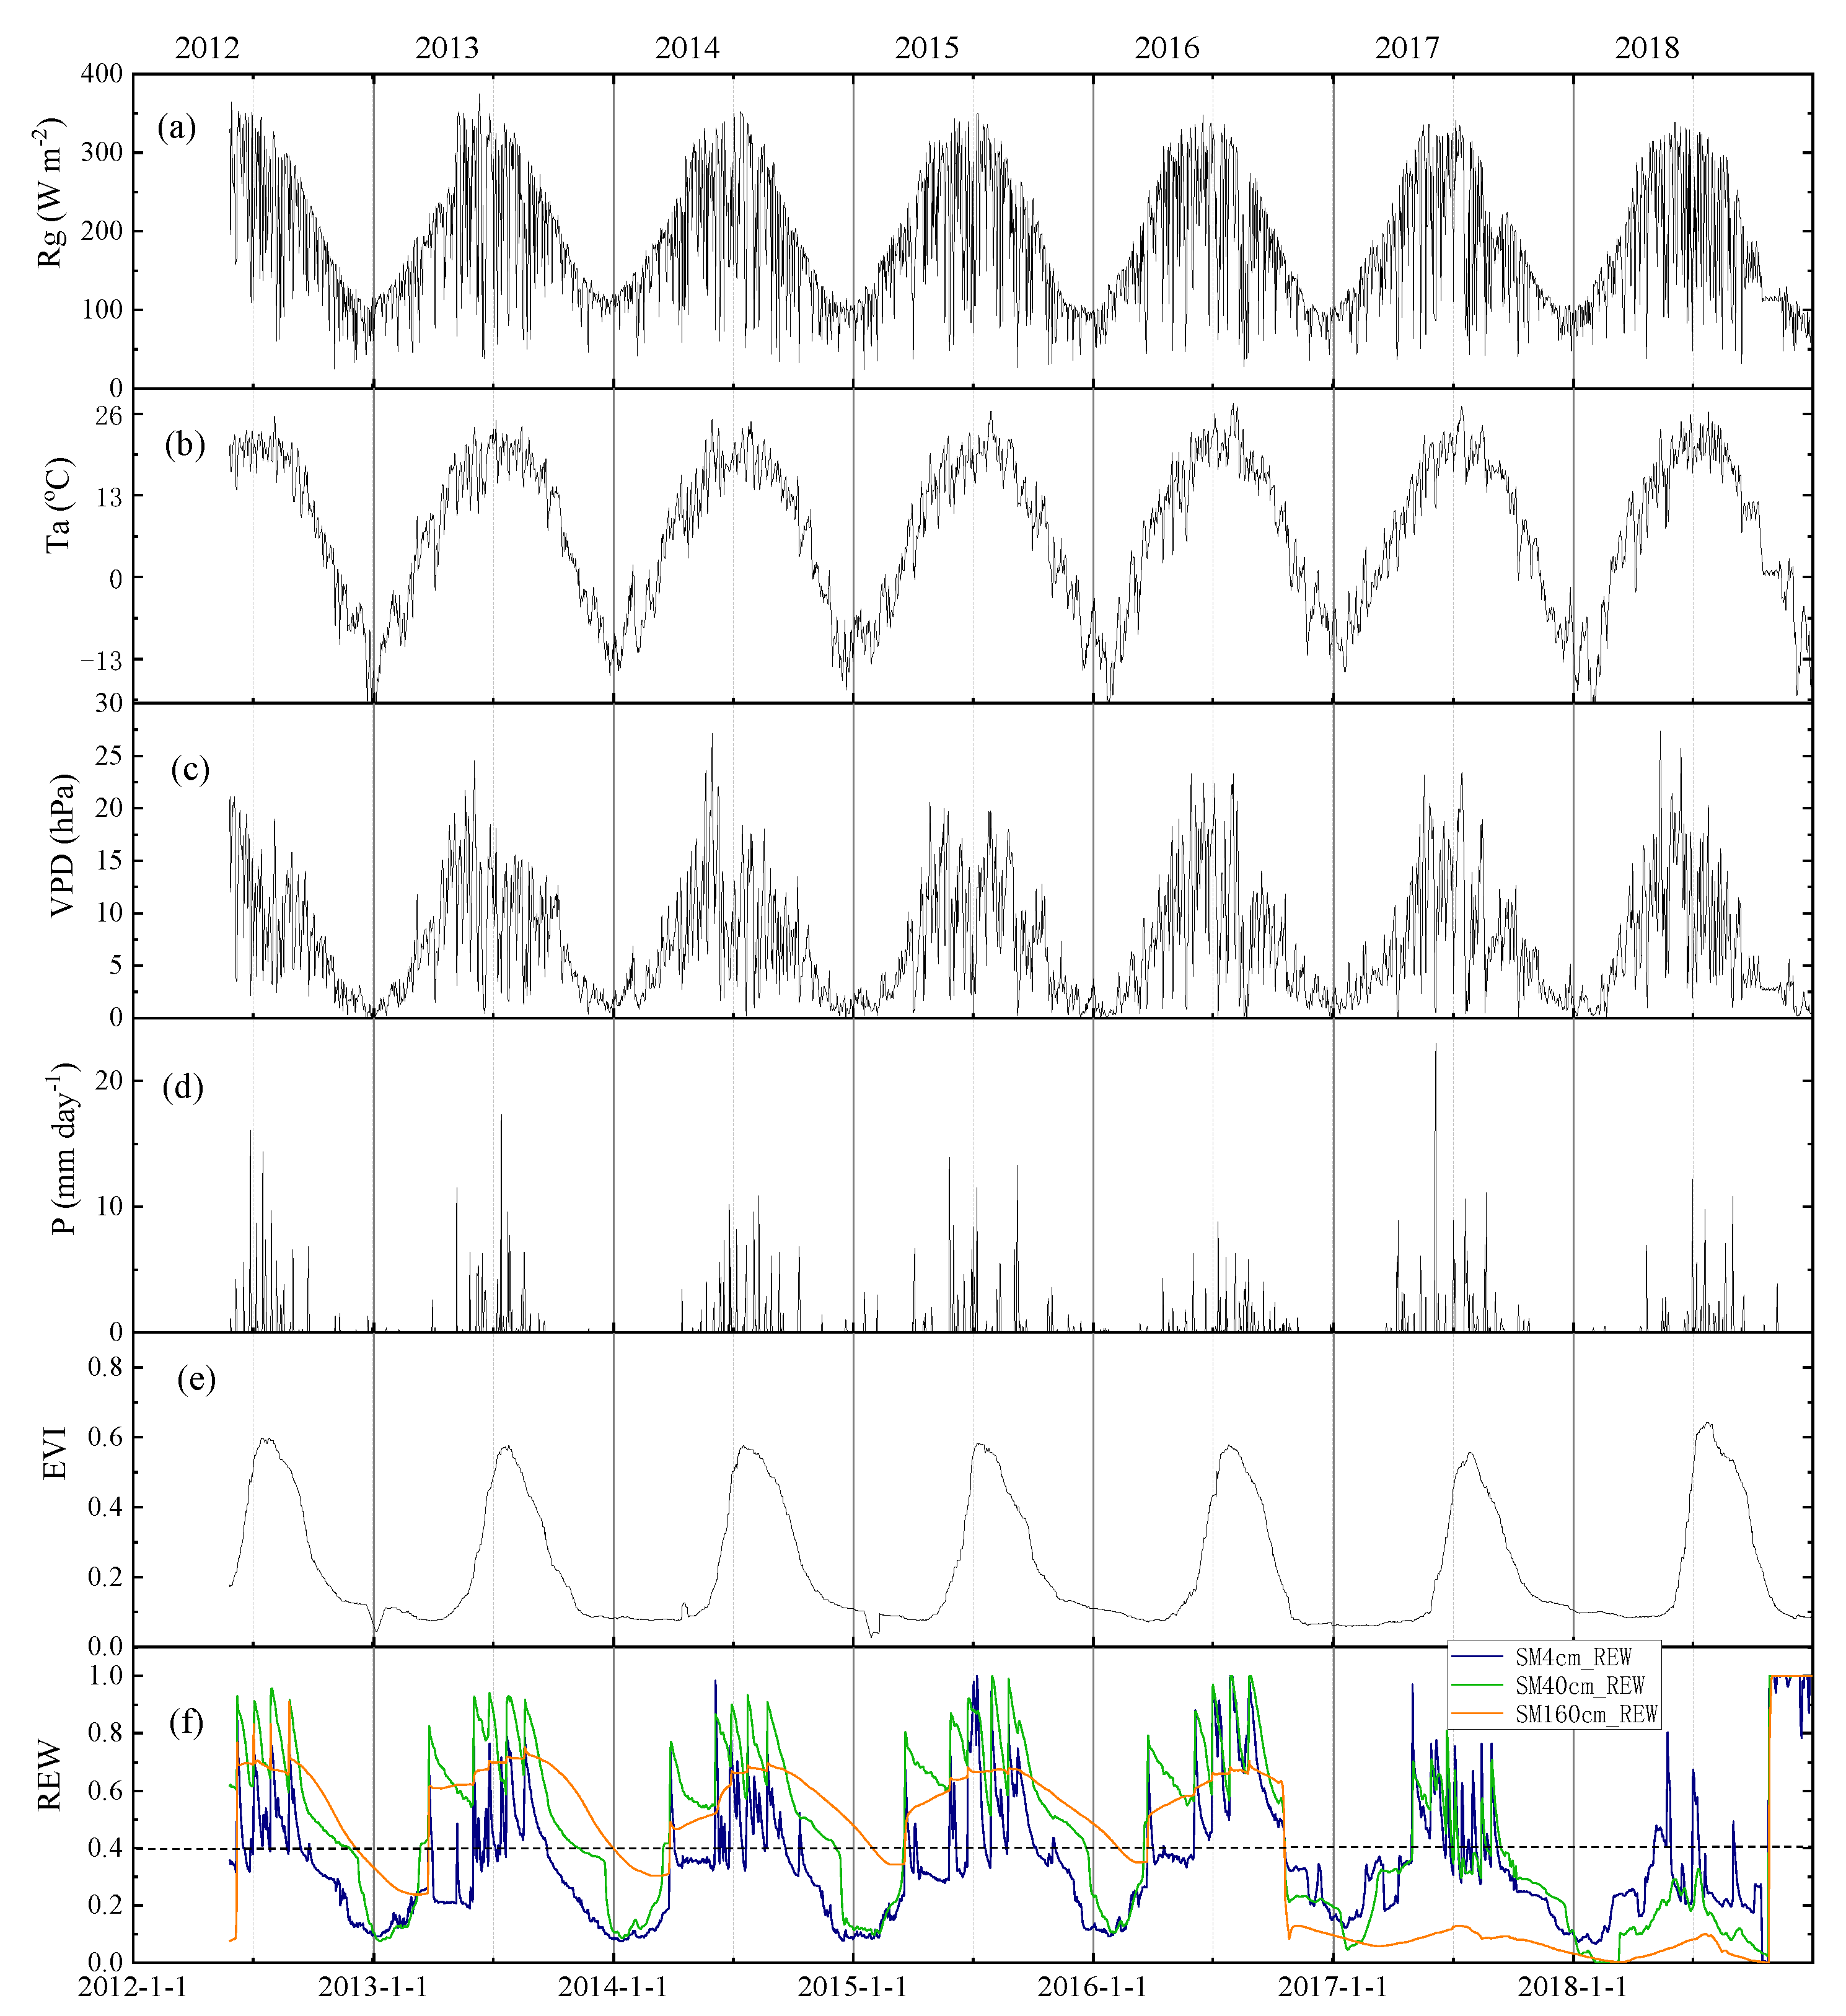
Clear seasonal characteristics of biophysical factors are shown in Figure 3. Seasonal dynamic patterns of Rg, Ta, and vapor pressure deficit (VPD) were very similar with high values during the growing seasons, and low values during the non-growing seasons across the study periods. Daily mean Rg peaked in mid-summer, ranging from 169.32 W m−2 in 2018 to 183.52 W m−2 in 2013, with an average of 176.22 W m−2 during the period (Table 1). Daily mean Rg ranged from 217.29 to 235.58 during the growing seasons (i.e, May–September) in 2018 and 2013, respectively. The daily mean Ta ranged from −22.77 to 27.68 °C annually during the study period. In different seasons of the study period, the daily mean Ta ranged from approximately 17.04 °C (2014) to 18.67 °C (2016) in growing seasons, and −0.31 °C to −1.84 °C in non-growing seasons. The mean annual temperature (MAT) ranged from 6.44 °C (2018) to 7.21 °C (2017) during the period of 2012–2018, with an average of 6.90 °C, which is slightly lower than the 57-year (1960–2016 period) average of 7.55 °C. Annual mean VPD ranged from 6.55 to 7.26 hPa in 2018 and 2013. The daily mean VPD is relatively high (10.61 hPa) in the growing seasons, while it is only 4.14 hPa in the non-growing seasons.
Daily precipitation (P) showed clear seasonal patterns (Figure 3c), and was mainly distributed in the growing seasons (approximately 84% of annual precipitation), with little precipitation in winter and spring during the non-growing seasons. There were large variations in annual precipitation in the study period, ranging from 102 mm (2016) to 187 mm (2018), with an average value of 140 mm, for 2013–2018; this was higher than the mean precipitation (128.50 mm) in the period of 1960–2016. The seasonal patterns of EVI represented the growth phases of the cropland (Figure 3d). There are also clear seasonal dynamics in EVI. EVI increased rapidly in early summer, reached its maximum in the mid-growing seasons, and then decreased in autumn. The pattern of EVI is consistent with the precipitation and radiation during the six-year period.
Soil moisture (SM) patterns varied with the seasonal patterns of precipitation and irrigation (Figure 3f). There were significant different patterns for SM in different layers under different irrigation strategies. For the period before 2017, since flood irrigation was conducted, the soil moisture at different layers was sufficient for the growth of the cropland during the growing seasons, and the REW in both surface and bottom layers were greater than 0.4. However, after the implementation of drip irrigation in 2017, the REW in the deep layer (SM at 160 cm) was less than 0.4 during the whole year except the winter irrigation period. The magnitude of the drip irrigation is high in the periods of 2017, which had some impacts on the surface soil moisture for some periods in 2017 (REW > 0.4), however, the REW during most of the periods in 2018 was less than 0.4. The relatively low soil moisture in the non-growing seasons of the study area is caused by the freezing processes in the soil with soil temperature typically below zero degree in winters.
3.2. Seasonal and Interannual Dynamics of Carbon and Water Fluxes and Water Use Efficiency
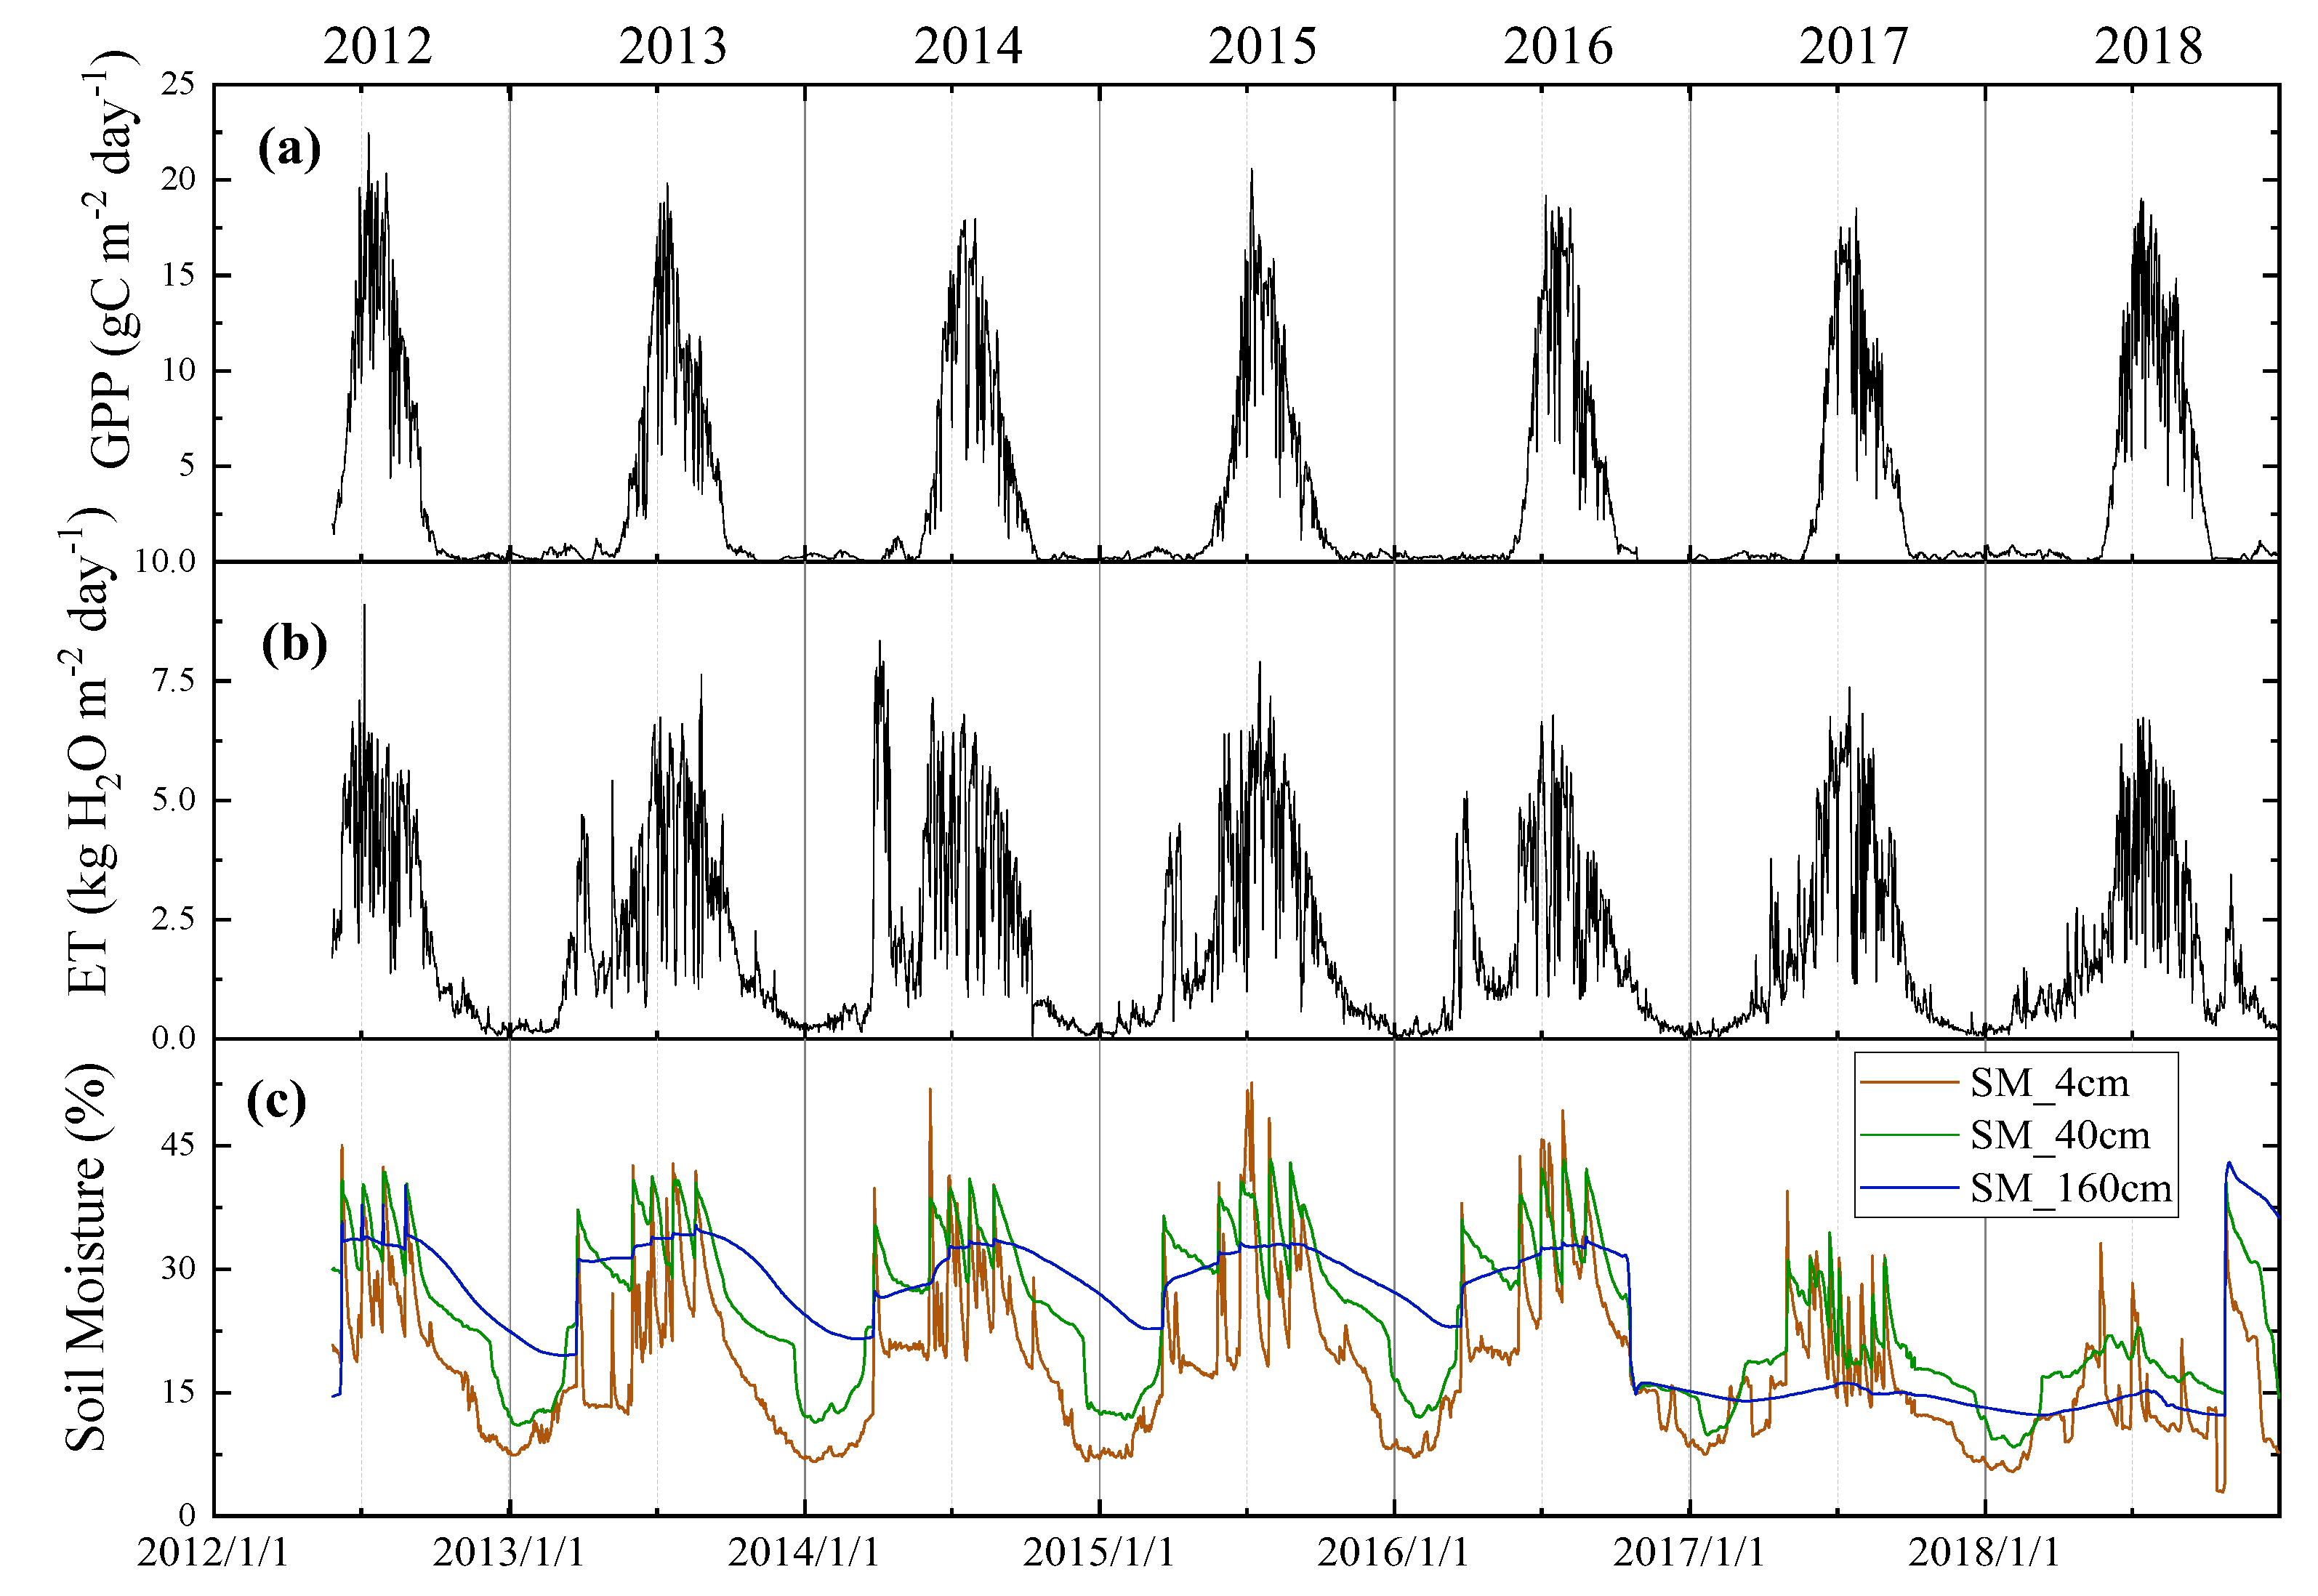
Seasonal dynamics characteristics of GPP varied with the air temperature and radiation (Figure 3 and Figure 4), and were generally consistent with the EVI seasonal patterns. GPP reached its peak values (approximately 19.7 g C m−2 day−1 on average) in July during the growing seasons. Daily GPP peak values varied from 17.97 to 22.45 g C m−2 day−1 for 2012–2018. The overall seasonal dynamics of GPP were similar across different years although there were some variations in the amplitude of GPP.
Compared with the similarity of GPP seasonal patterns, the ET seasonal patterns varied over different years following the seasonal dynamics of irrigation and precipitation (Figure 4). During the growing seasons, ET reached its peak values as the crop growth peak values ranged from 6.73 to 9.10 kg H2O m−2 day−1, with an average of 7.7 kg H2O m−2 day−1. As there was no film mulching in the field in the non-growing seasons, the spring irrigation before planting increases the evaporation (E) component, and thus increases the ET greatly. This phenomenon generally occurred in the period of 2012−2016 prior to the use of the drip irrigation technique, while it did not occur after 2017.
Following the precipitation and irrigation patterns, soil moisture for the study periods was generally low in spring and high in the growing seasons. During every irrigation period before 2017, when flood irrigation was performed, the soil moisture increased sharply both in shallow and deep layers. After 2017, with the use of drip irrigation under film mulch, the soil moisture decreased significantly, especially in the deep layer of the soil. With the exception of the winter irrigation in 2018, the soil moisture in the deep layer were less than 20% in the entire period.
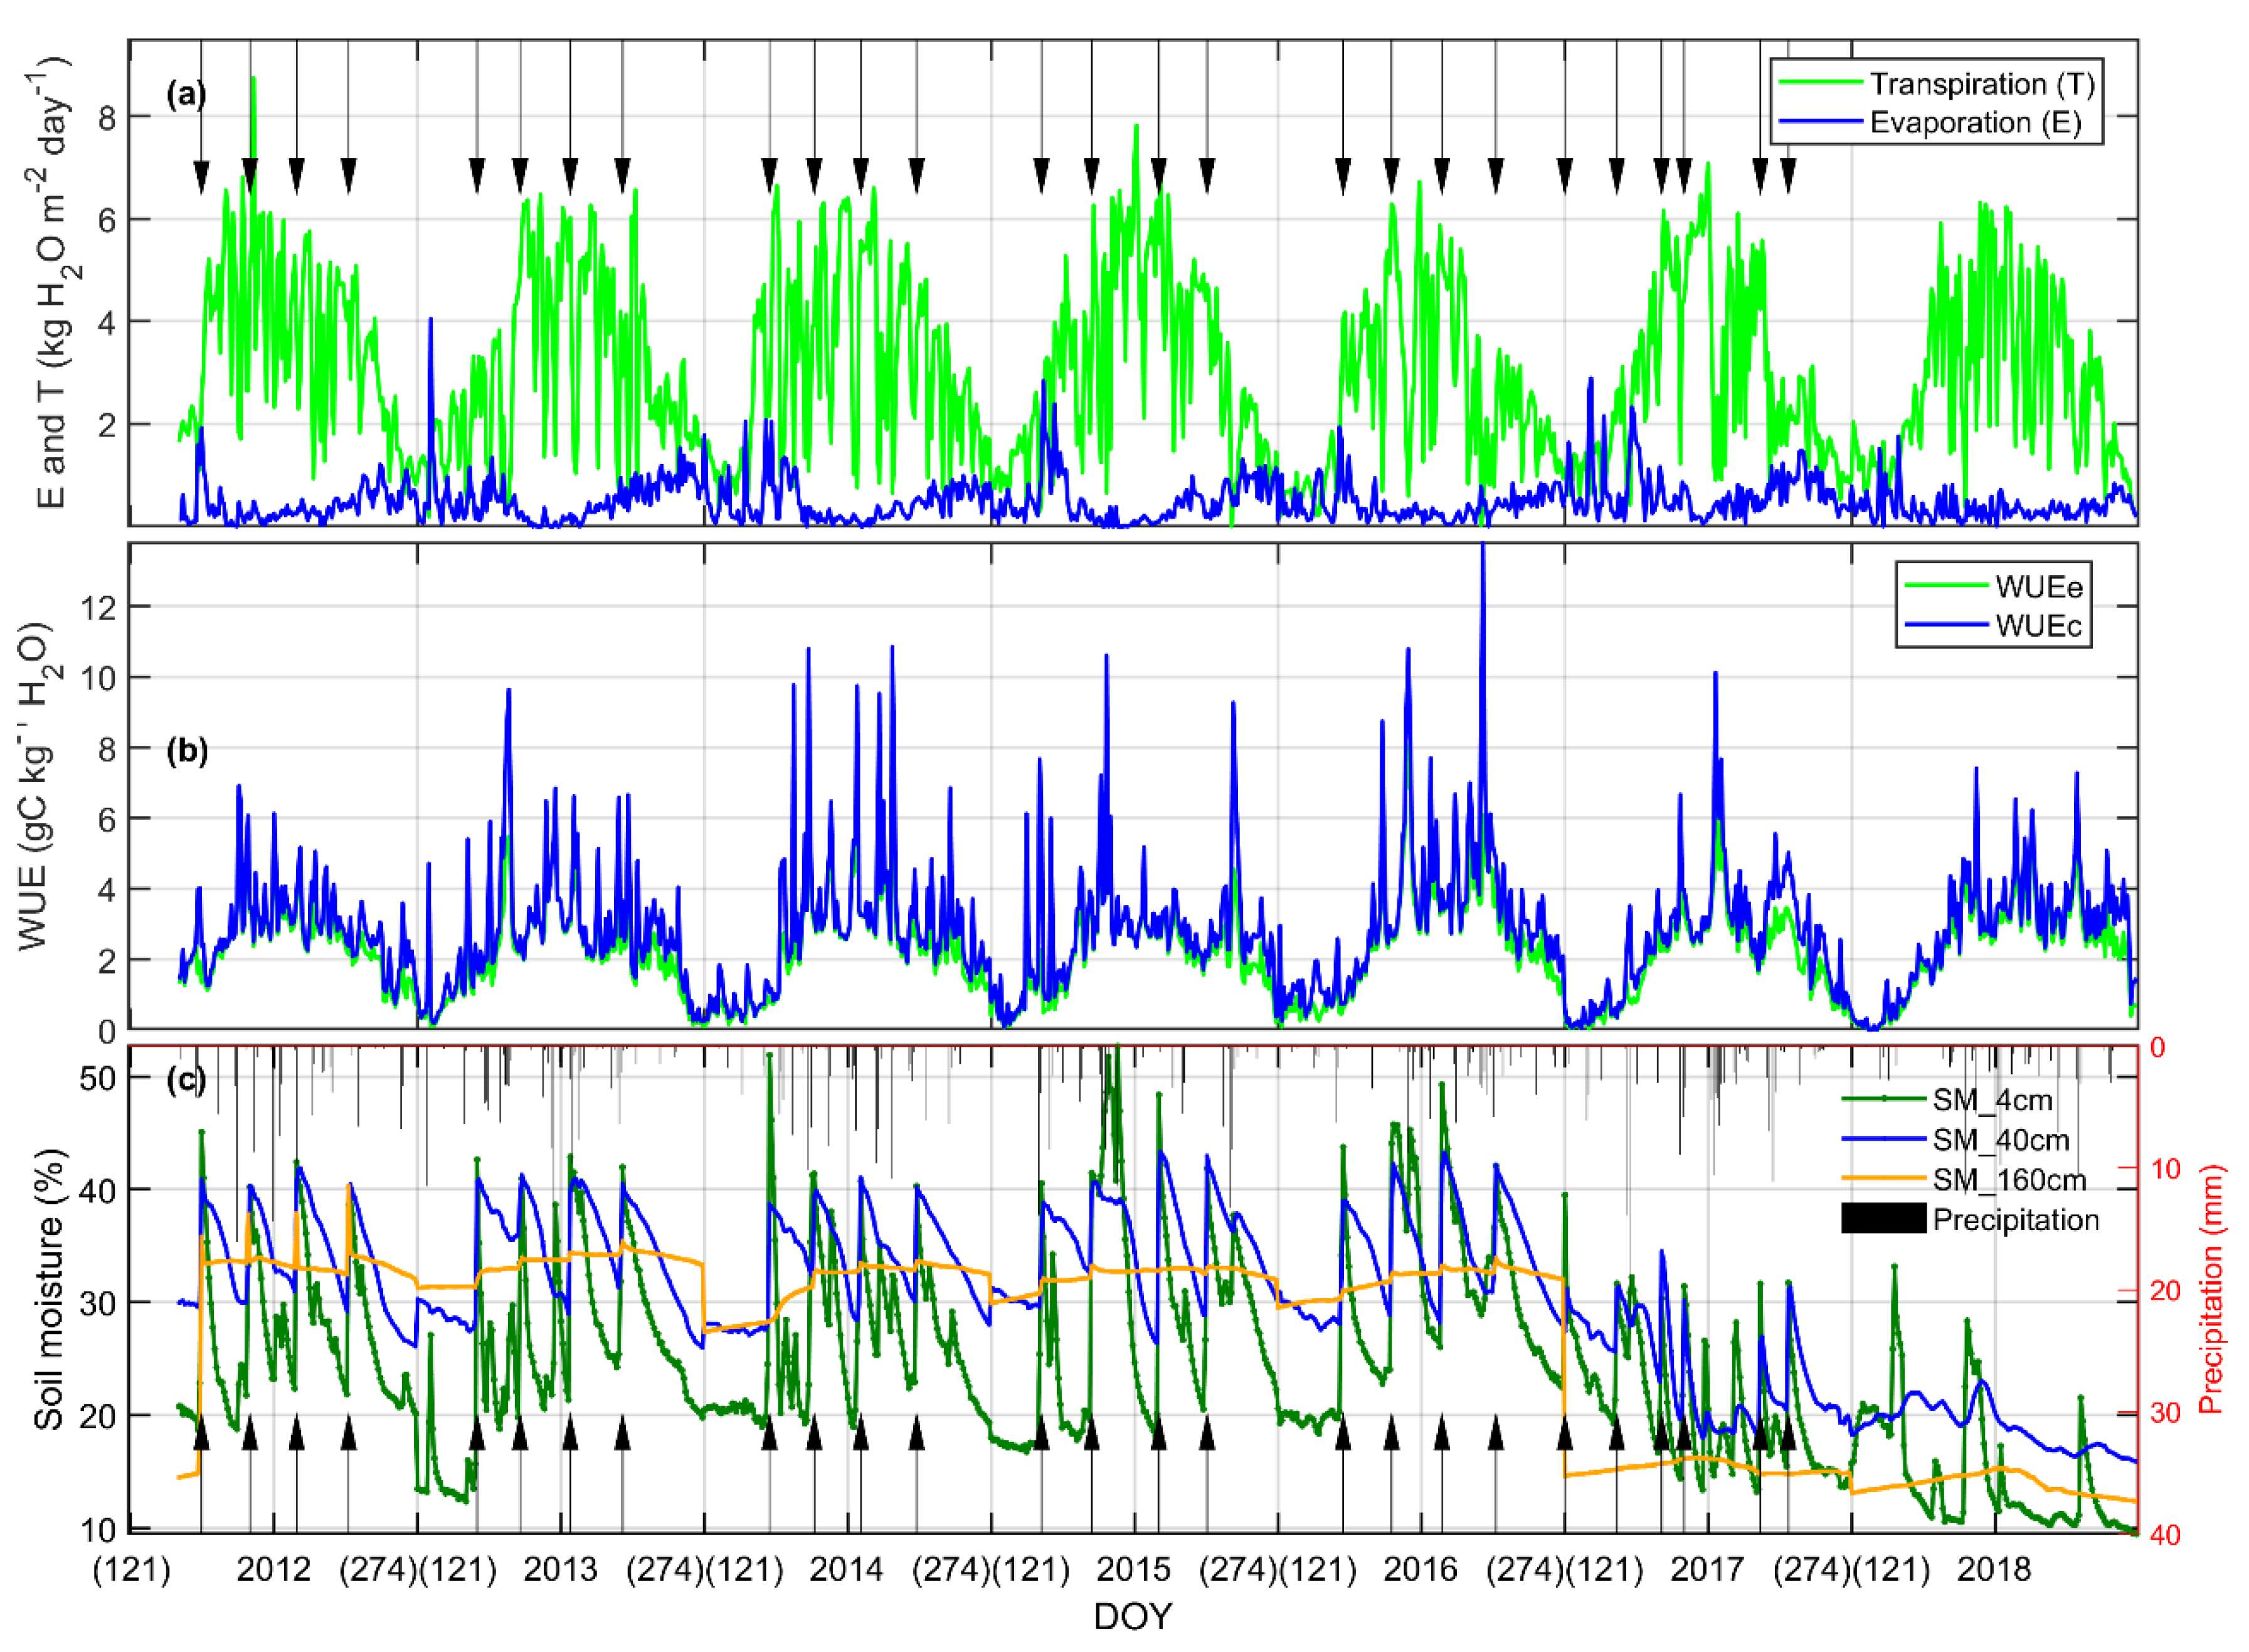
To further analyze the impacts of irrigation on ET components and WUE of the cropland, we also analyzed the ET components and WUE seasonal variations as irrigation events occurred during the growing seasons (Figure 5). During the early stage of the growing seasons, the canopy cover of the cropland is low, and soil evaporation dominates the ET. As the plant grows, transpiration becomes the main part of ET. At the end of the growing seasons, when the maize withers and falls, ET drops in line with transpiration and evaporation. T ranged from 386.0 (2017) to 484.7 kg H2O m−2 (2015) during the growing seasons over the six-year period, with an average of 442.4 kg H2O m−2, which accounted for 85.1% of ET on average for the growing seasons in 2013–2018. The seasonal variations of ecosystem and canopy WUE are consistent with the seasonal patterns of the ET components. During 2012–2016, soil moisture in the shallow layers generally increased sharply following irrigation events (Figure 5c), which increased E and therefore also increased ET. The irrigation events can also increase the soil moisture in the middle and deep layers. However, since the drip irrigation was applied after 2017, the soil moisture in both surface and deep layers decreased abruptly. Drip irrigation with deficient water irrigation had little effect on the soil moisture of the deep layer.
Taking 2012 as an example, according to the measurements of the lysimeter and isotope method, and the model result during the growing season in the study period (Figure 2), the relative contribution of T to ET was approximately 0.85, 0.88, and 0.90 (average 0.88), respectively. Such a high T/ET is mainly because of the application of film mulching (which covered approximately 60% of the soil surface) and the vegetation covering of maize during the growing season. We observed the irrigation according to the channel flow measurements in the growing season of 2012. There were four irrigation events during the growing seasons with irrigation amounts of 111.6 (day of year [DOY] 158), 141.9 (DOY 184), 149.7 (DOY 210), and 149.7 mm (DOY 238), respectively. The total irrigation amount (552.9 mm) and precipitation (114.5 mm) were far more than the actual water demand of the growth of maize, which was 447.4 mm during the entire growing season (DOY 147–274) of 2012.
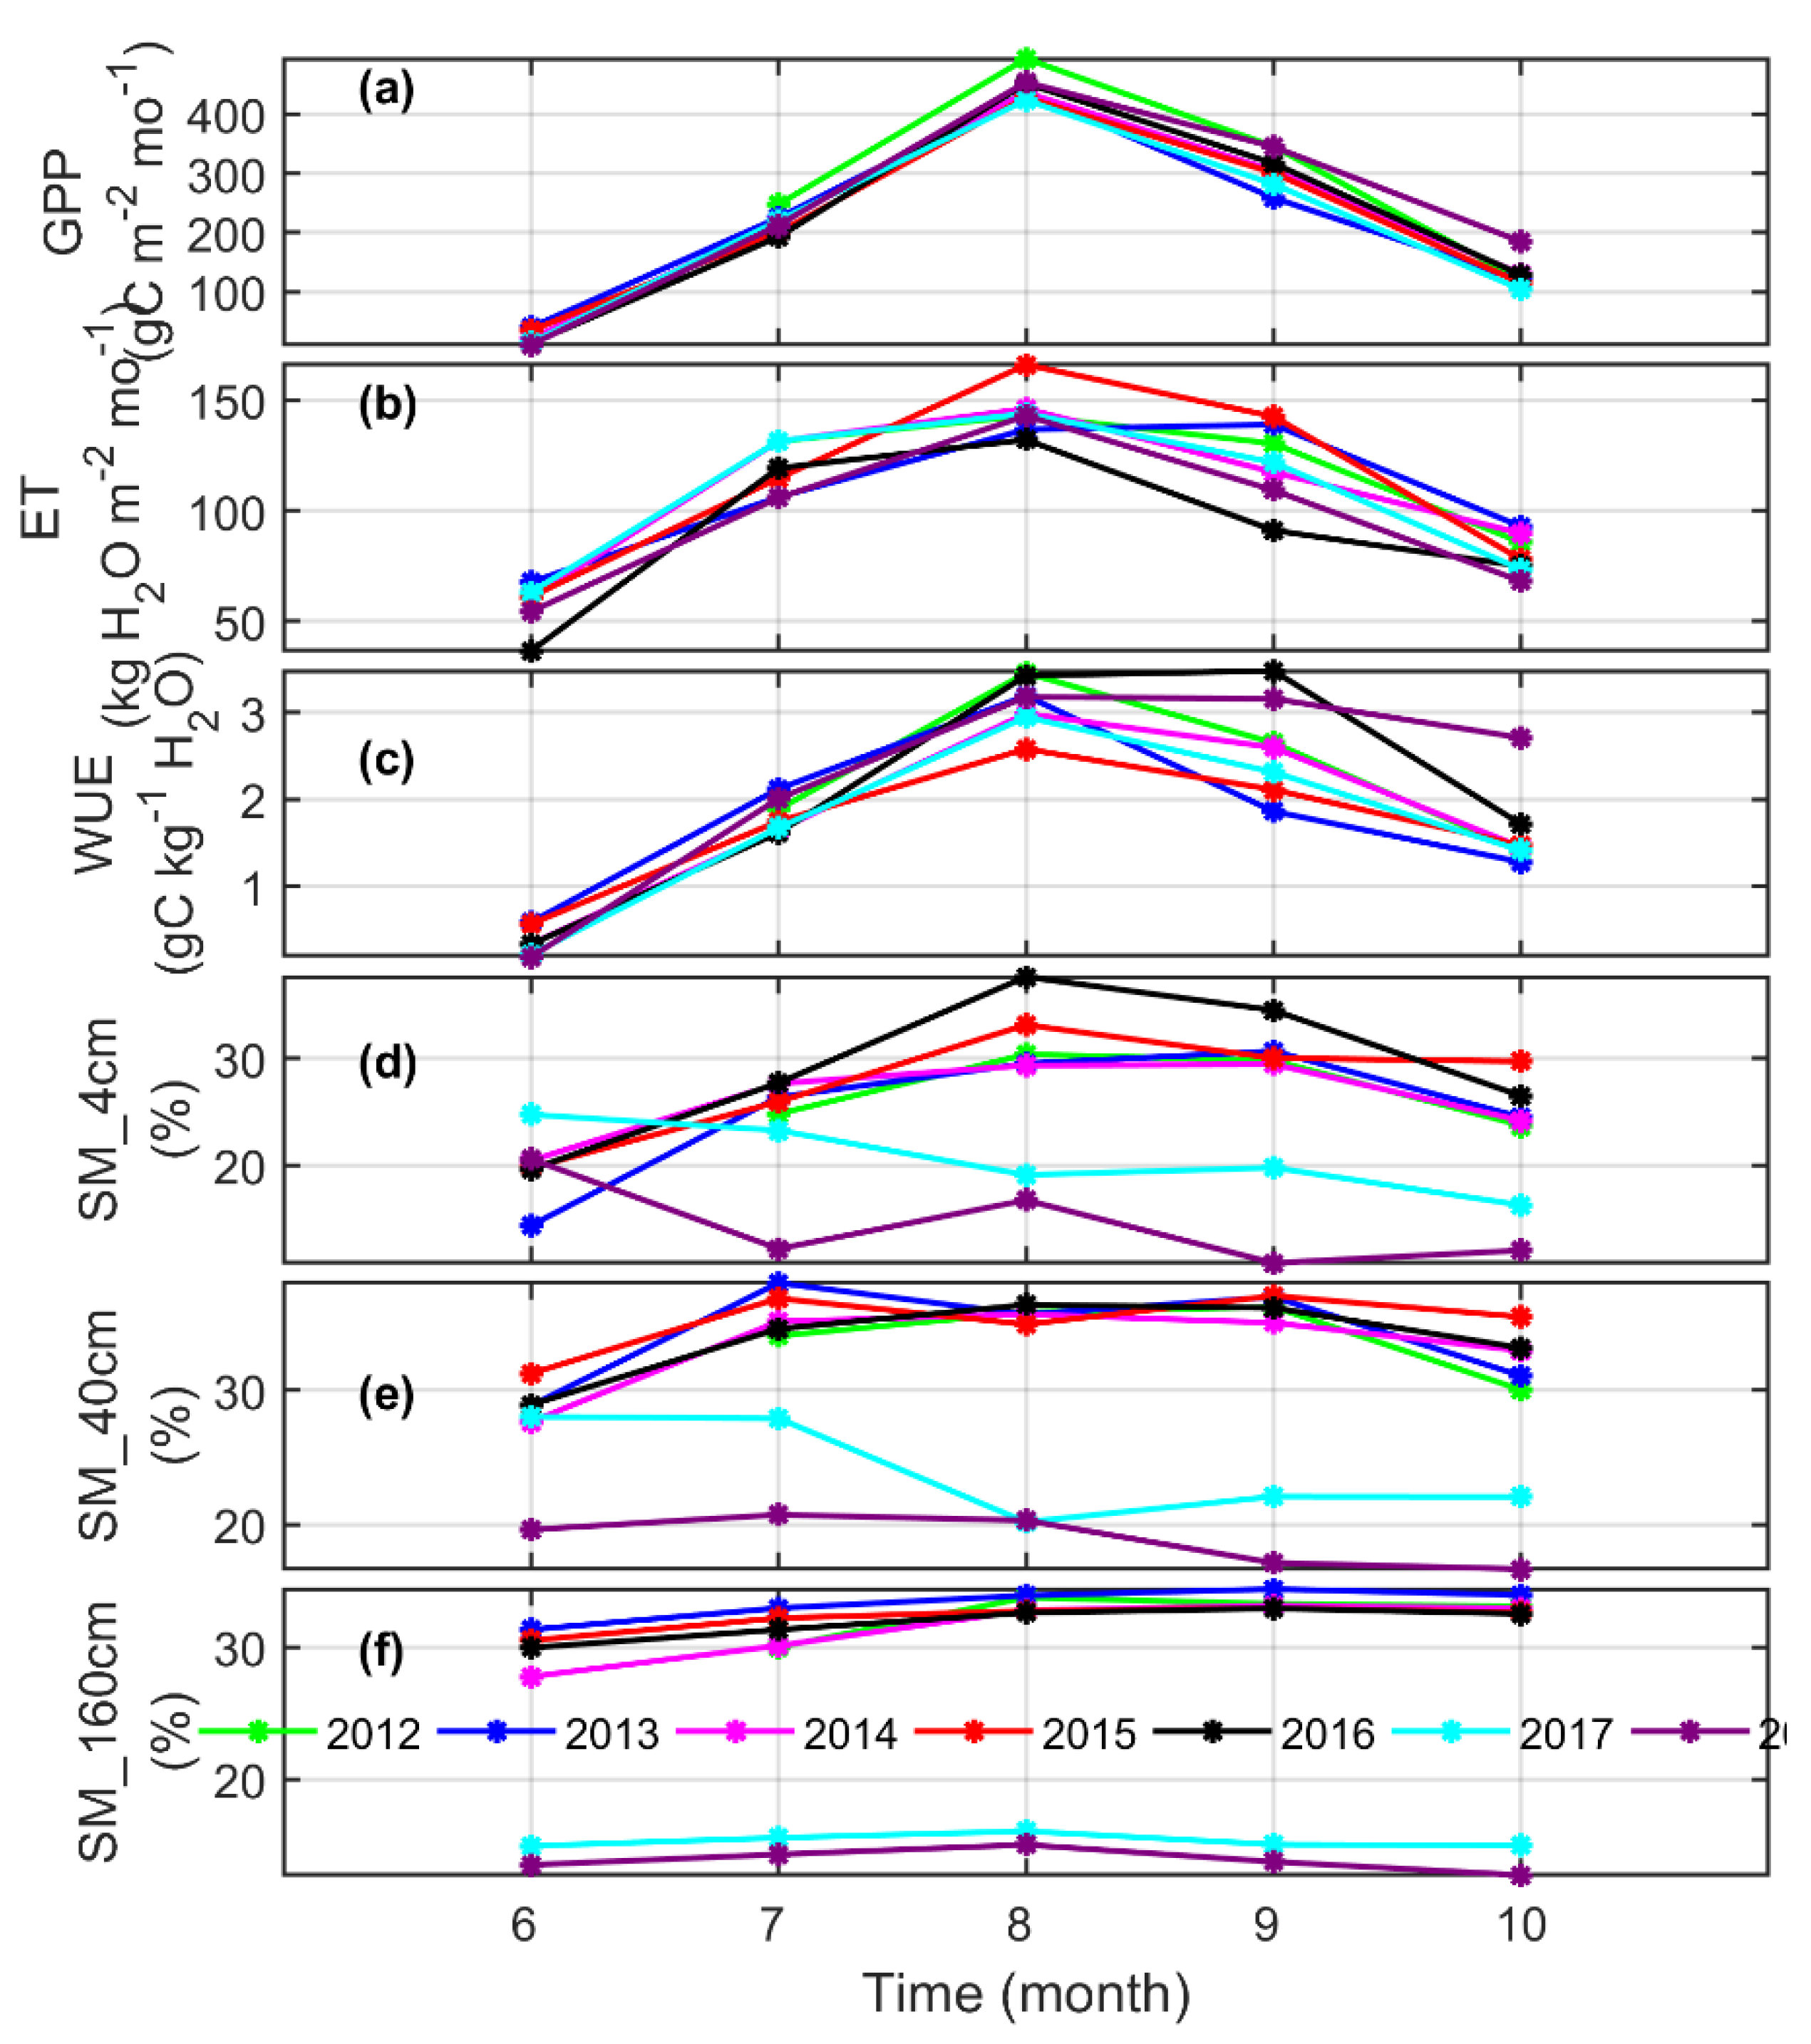
Monthly GPP, ET, and WUE peaked in July over the six-year period (Figure 6). Unlike GPP, there are clear inter-annual variations of monthly ET, WUE, and soil moisture. There were significantly decreased trends for soil moisture in 2017 and 2018 after the change of irrigation practice, especially for the deep layers. Also shown in Figure 4 and Figure 5, the monthly average soil moisture of both surface and middle layers in the growing seasons was still occasionally affected by a relatively large amount of irrigation in 2017. However, this had no significant effects on the soil moisture in 2018.
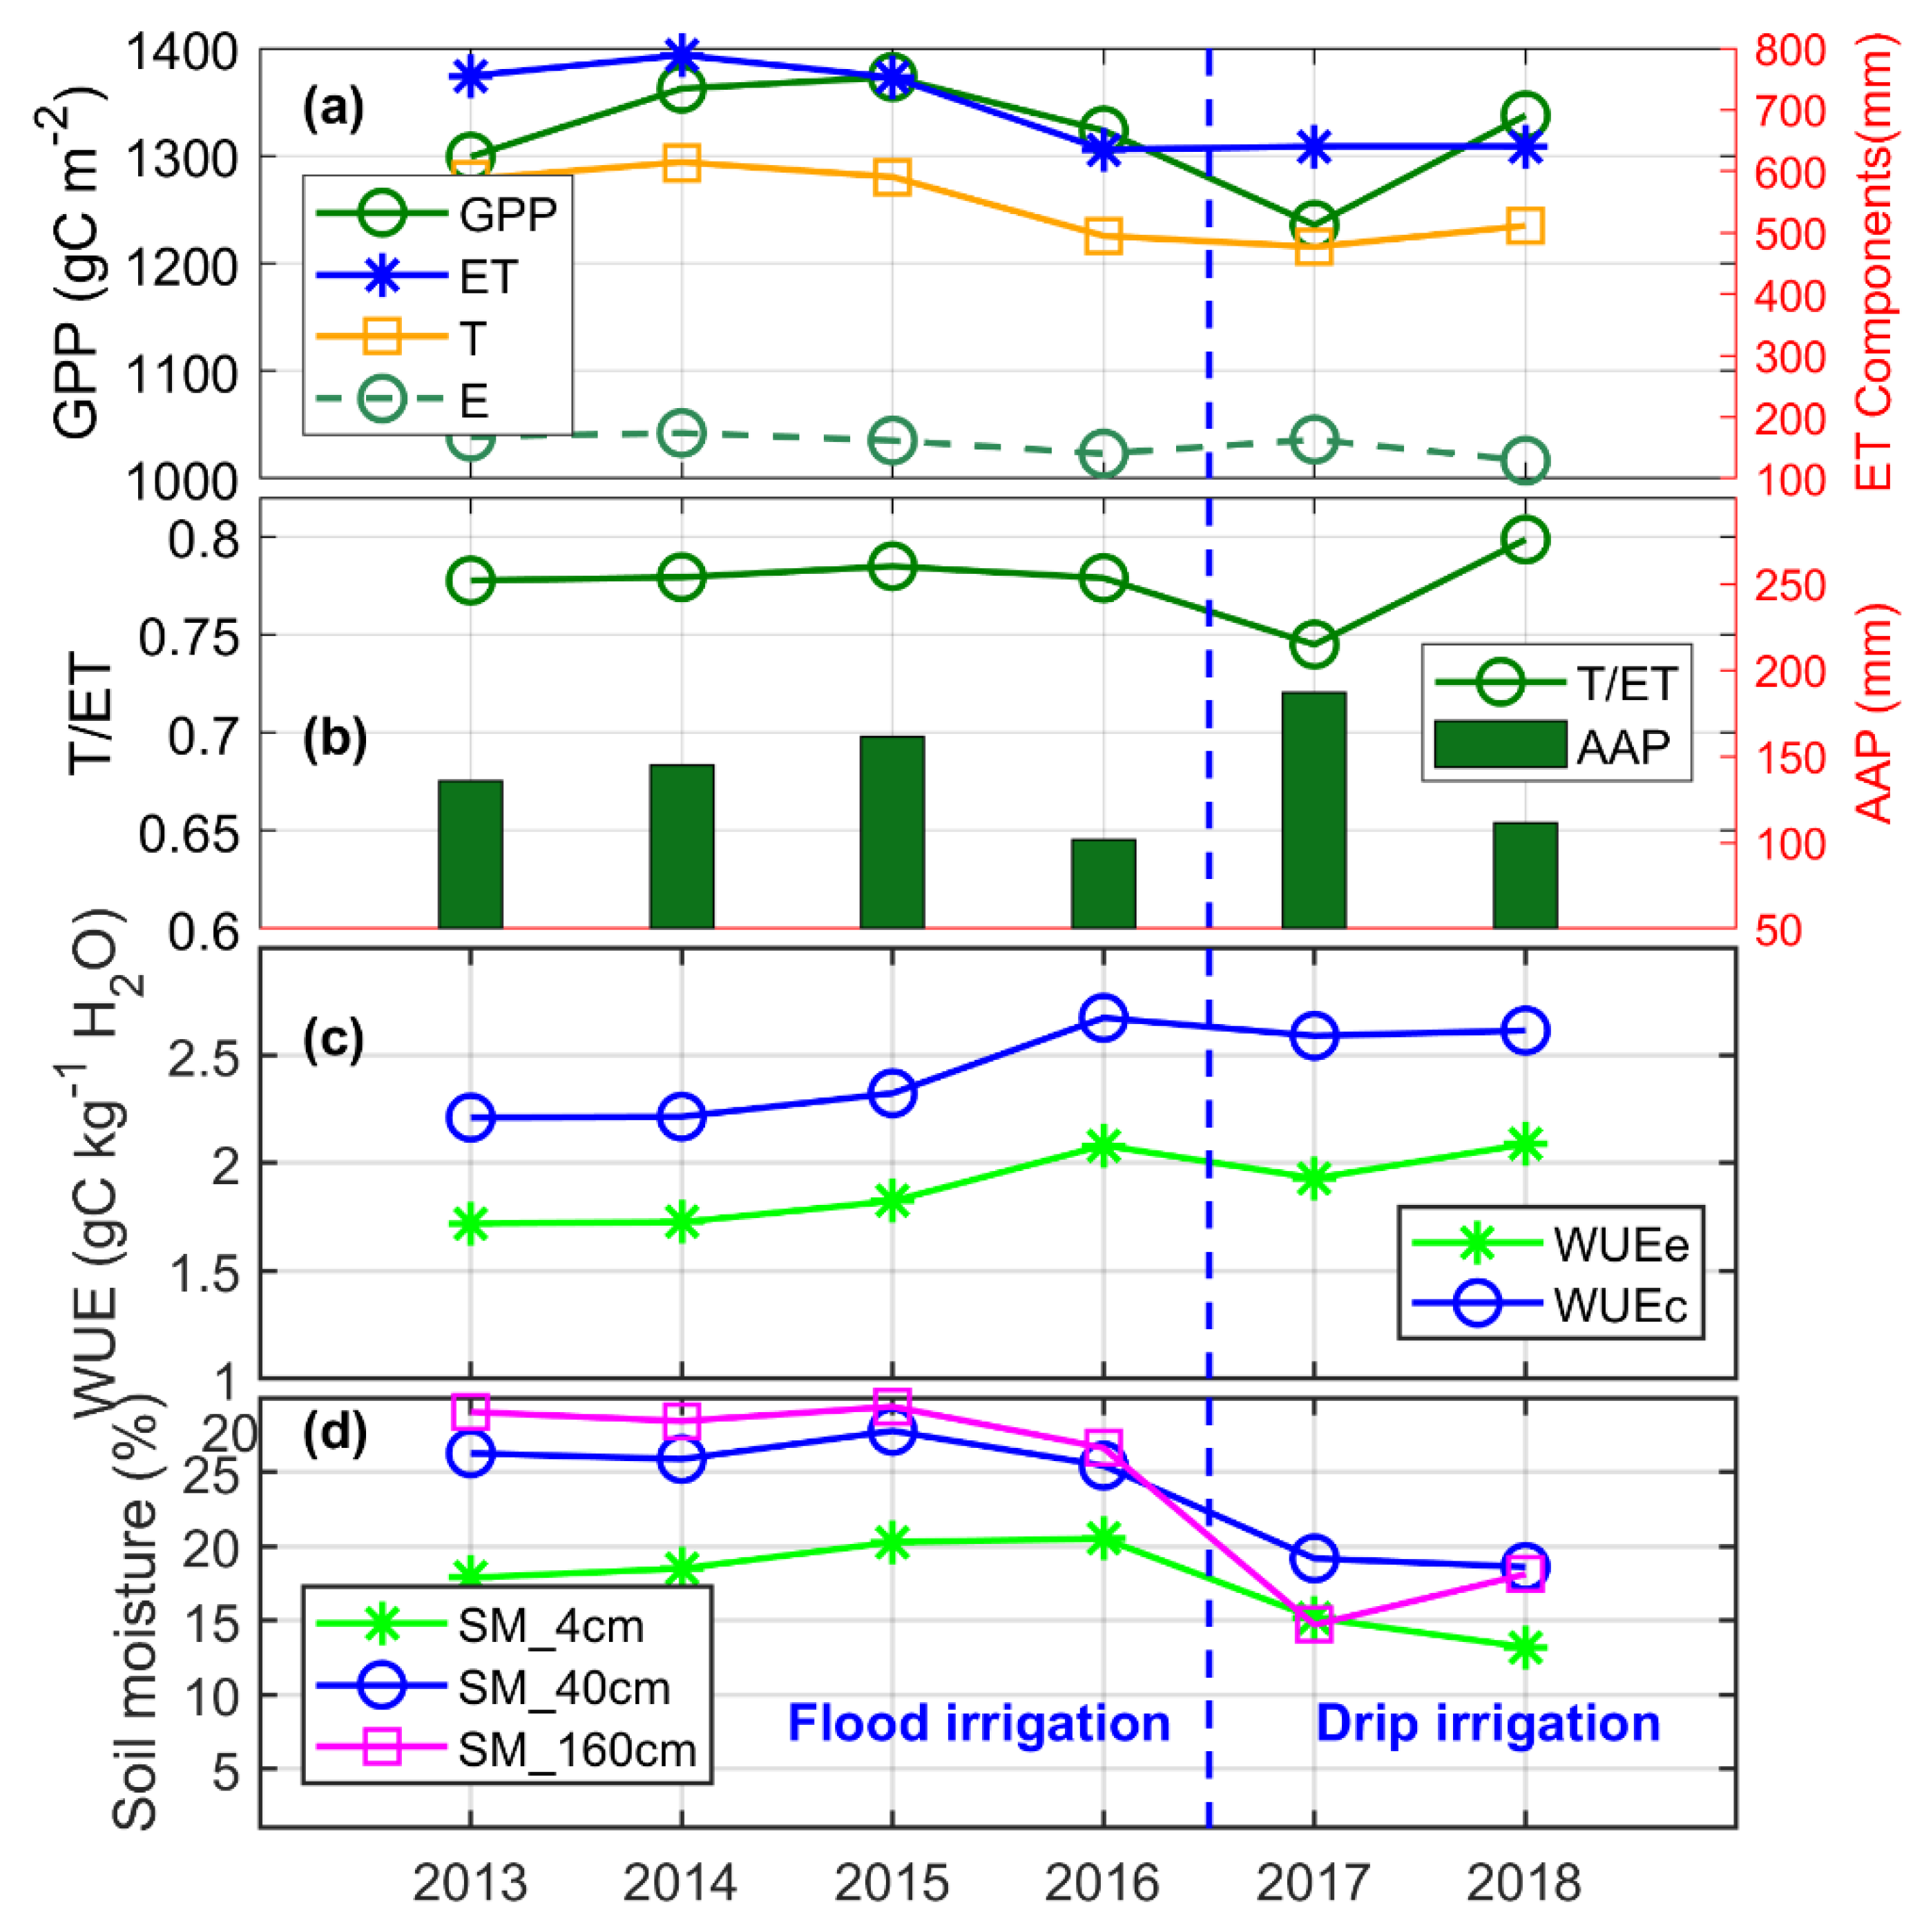
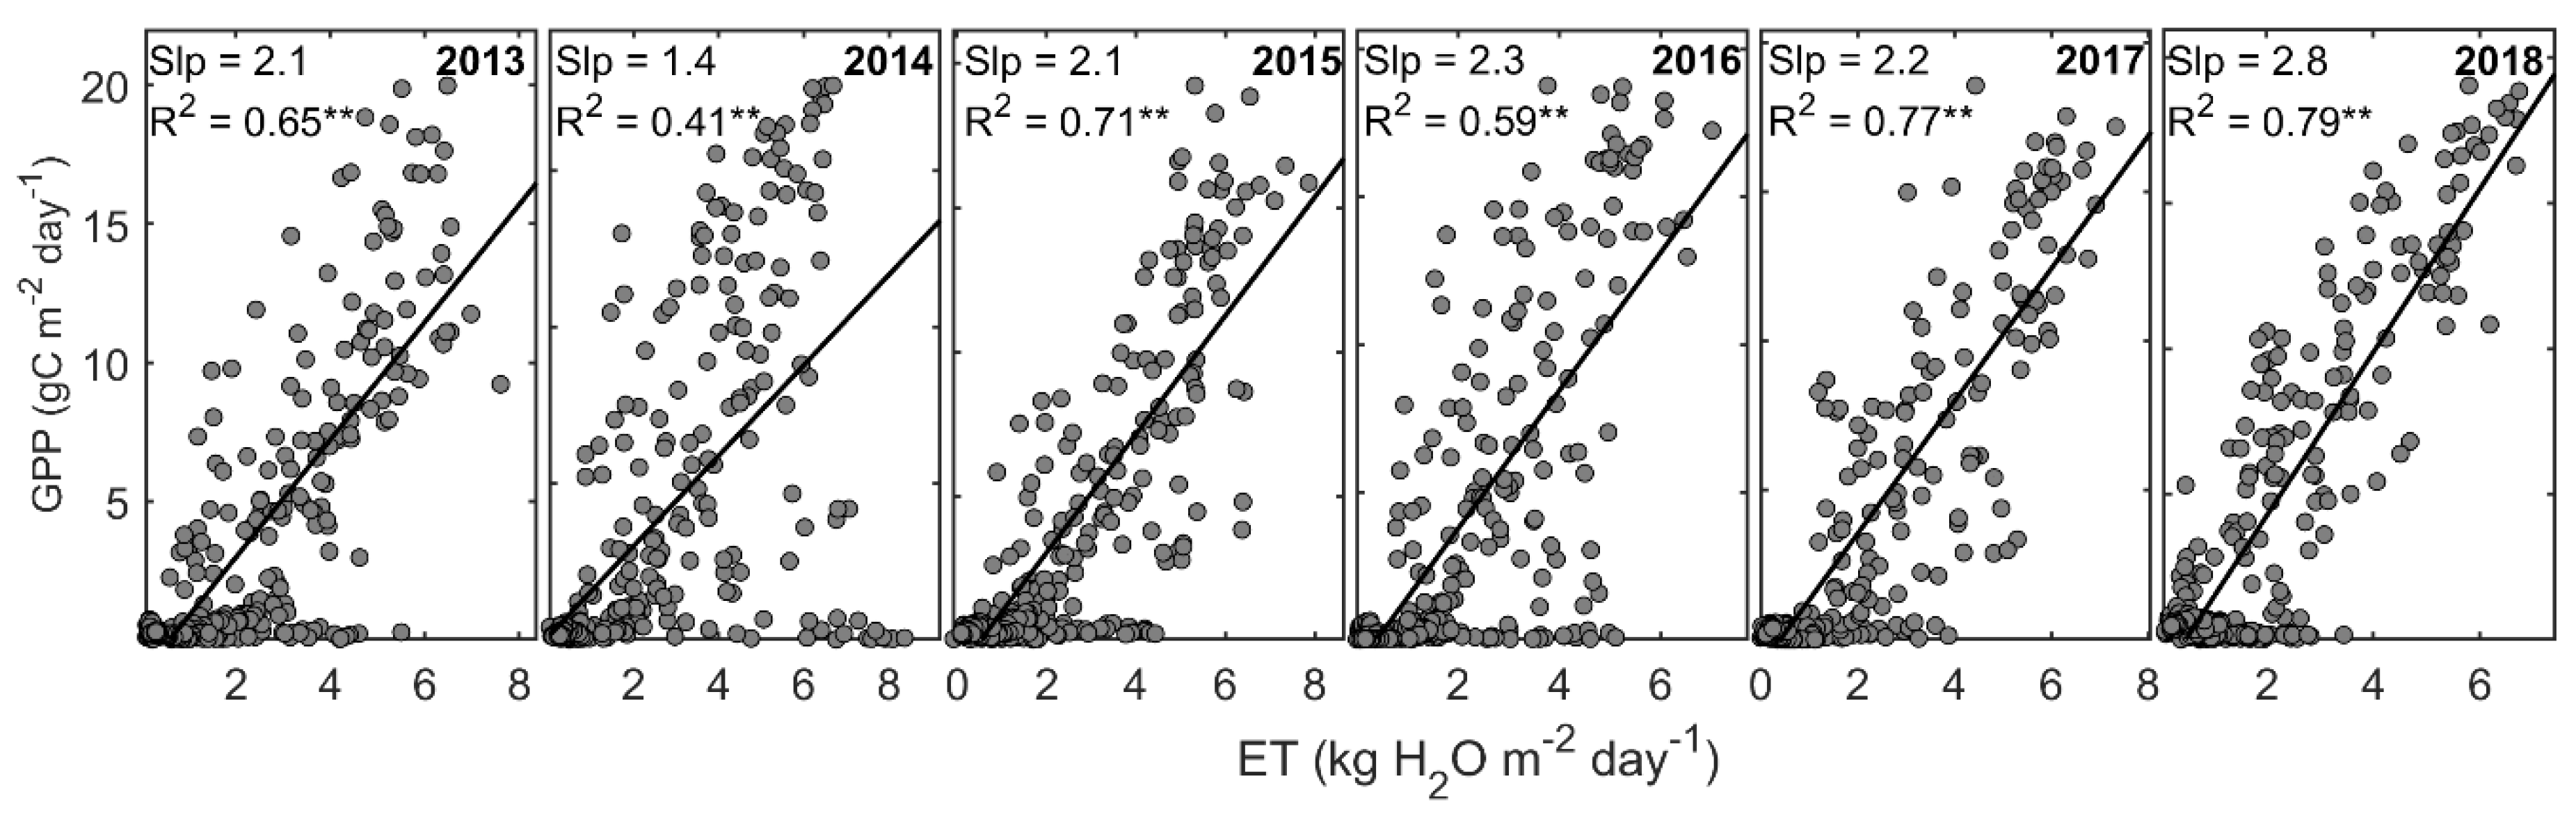
There were no obvious variations of annual GPP across the study period (Figure 7). Annual GPP only changed by 0.16–3.96% when the drip irrigation was applied (Table 2). Unlike for the annual GPP dynamics, there was a clear abrupt change of ET from 2013 to 2018 (Figure 7). Annual ET ranged from 636 to 789 kg H2O m−2 for 2013–2018, with averages of 733 and 640 kg H2O m−2 before and after the implementation of drip irrigation, respectively. The annual trends of GPP and ET contributed to an increased trend of WUE during the period, which increased by 9.3–13.59% and 10.46–10.98% for the ecosystem and canopy ecosystems, respectively, as a result of using a drip irrigation strategy (Table 2). We also found a higher decreasing rate of E compared with T after using the drip irrigation practice (using the data of 2018), which indicates that drip irrigation can decrease evaporation greatly. Soil moisture also decreased remarkably in both shallow and deep layers. Additionally, daily GPP and ET were linearly correlated over the period of 2013–2018 (Figure 8), and the slope of the relationship also represented values close to the annual WUE values. From the slope of the GPP-ET relationship, we also found an increasing trend after implementing the drip irrigation strategy.
3.3. Biophysical Regulations of the Temporal Variations of Gross Primary Production, Evapotranspiration and Water Use Efficiency
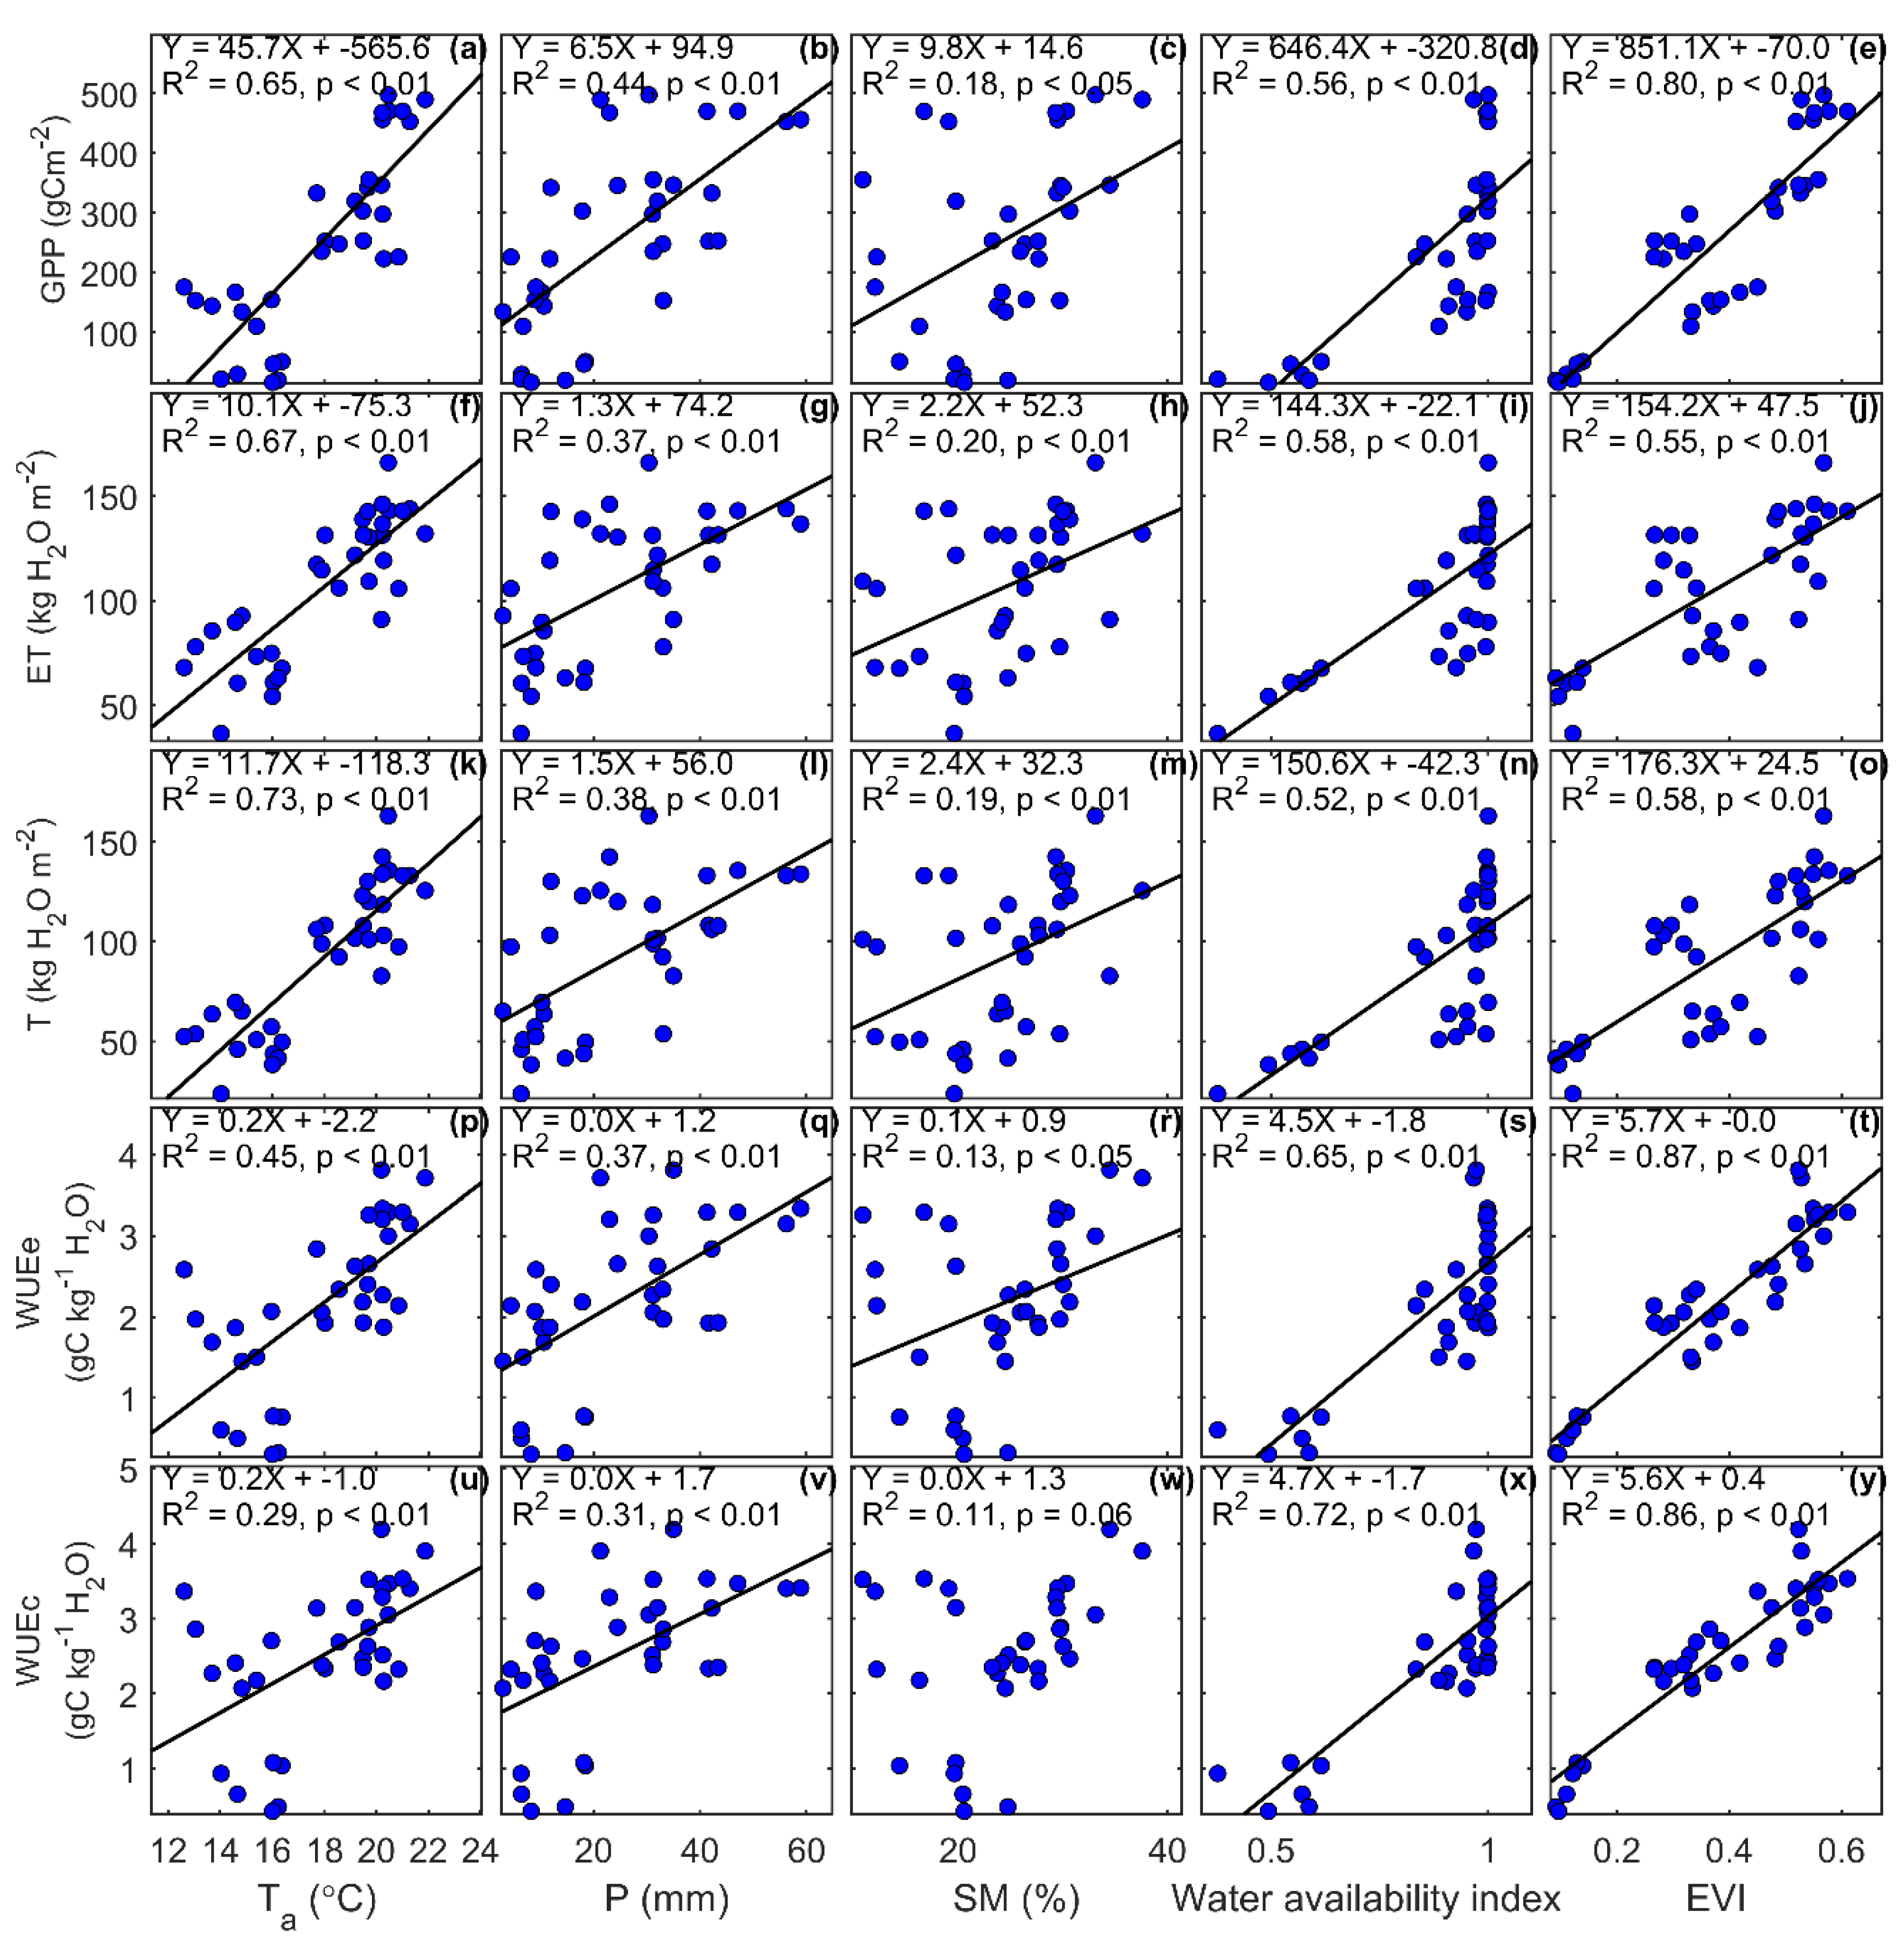
The carbon and water fluxes (i.e., GPP, ET, T), and WUE had different relationships with the climatic variables with monthly time scale (Figure 9). For the seasonal timescale, monthly GPP, ET, and WUE increased linearly with the rising of Ta, P, SM, and EVI (p values all less than 0.05 except for the relationship between the canopy WUE (WUEc) and soil moisture in the growing seasons). Unlike the GPP and ET components, WUE (both WUEe and WUEc) showed a strong and positive relationship with EVI and the water available index (WAI), which can better explain (>50%) the temporal variability in GPP, ET components, and WUE than other climatic variables during the growing season periods. Soil moisture cannot effectively explain the temporal variations of the WUE because of its rapid variations after irrigation and precipitation.
According to the results of multiple linear regression and the partial correlation analysis between the carbon-water fluxes and climatic factors (Table 3), the simulation performance was generally good with a relatively high multiple R2. However, the importance of climatic variables was different in controlling the temporal variability of carbon and water fluxes. Generally, the air temperature and EVI were the dominant factors in explaining the temporal variability of GPP, ET and WUE. There was little effect of SM on carbon-water fluxes. For GPP, Ta, P, and EVI were the primary controlling parameters, while for ET, Ta and WAI were the primary factors. For the T, only Ta was the dominant factor, while for the WUE, EVI played an important role.
4. Discussion
4.1. Wate Use Efficiency Variations of Cropland Ecosystems and their Biophysical Influencing Factors
Annual ranges of ecosystem WUE (1.72–2.09 g C kg−1 H2O) in our study were within the annual range of 0.92–4.02 reported for other cropland ecosystems [8,58,59]. The mean WUE during the growing season was 2.38 ± 0.21 g C kg−1 H2O, which was generally lower than for similar cropland at AmeriFlux sites [8,60]. This phenomenon also occurred in the analysis of underlying WUE at this site [61], which is probably attributed to the climate differences in these places. The species in the HRB is adapted to the local climate and location in an oasis-desert system in arid regions, where a large amount of ET can be observed in the oasis (i.e., oasis–desert effects) during the growing season [62]. Our study also showed strong positive linear correlations between carbon and water fluxes for different years. The slope of the linear relationship can be used to estimate ecosystem WUE [9]. The response in GPP and ET to biophysical variables determined the time variations in WUE. We found the seasonal dynamic patterns in ecosystem WUE was mainly determined by biological factors, such as vegetation dynamics (i.e., vegetation index) and climatic factors (e.g., air temperature), which is consistent with other reported results [10,53,62]. Additionally, this study also found that water variability (e.g., soil moisture and the water availability index) greatly influenced the temporal variations of ET and GPP.
4.2. Effects of Irrigation Practice on soil Moisture Dynamics, Evapotranspiration Components, and Water Use Efficiency in Arid Agricultural Systems
Our results revealed that traditional flood irrigation had the problem of excessive irrigation, which irrigated using a larger amount of water with limited irrigation frequency. The over-irrigation percolated into deep soil layers and was lost to drainage below the root zone since the maize was a shallow-rooted cropland and typically utilized the surface layer soil water [63]. The excessively irrigated water depth may lead to nutrient loss and soil salinization [64], and the over-exploitation of groundwater and river water resources. This would result in a decrease of the groundwater level and the water allocation into downstream regions of the river basin, thus leading to degradation of the environment [6]. However, drip irrigation with a deficient amount and higher frequency decreased the wetting depth and deep percolation process (the deep soil moisture level decreased by 42% compared with the flood irrigation in our study). This study confirmed that drip irrigation can significantly save water in oasis irrigation agriculture.
Our study also highlighted that water use strategies play a significant role in regulating ET and WUE in cropland ecosystems. Drip irrigation under plastic film mulching can significantly reduce the transpiration of the cropland, thus reducing the ET into the atmosphere and increasing the agriculture WUE. Plant transpiration can be a better indicator of actual plant water requirements during the growing season compared with the conventional uses of ET in water use management [61]. Through ET partitioning, we can obtain the plant water requirements at different stages to guide the optimization of irrigation practice. According to our study, traditional flood irrigation exceeded the actual water requirements of the plant during the growing season, leading to a large loss of soil evaporation and deep layer drainage, especially for irrigation at the early stage of growing seasons and the non-growing seasons. However, drip irrigation with deficient water use can reduce the loss due to soil evaporation, and therefore reduce the ET and increase the WUE of plants.
4.3. Potential Implications for Agricultural Water Resource Managements in Arid Regions
With limited precipitation in arid and semiarid climate systems, the high water demand of agricultural vegetation growth during the growing seasons is mainly fed by irrigation and ground water supply. For example, agricultural water consumes more than 80% of the available water resource in the oasis regions of the HRB [40]. Therefore, previous study has suggested that the groundwater level has decreased significantly in some agricultural regions of the river basin that largely depend on exploiting groundwater [6]. As a result, the degradation of above-ground vegetation has accelerated due to the serious over-exploitation of groundwater, resulting in the desertification and the degradation of wetlands [6]. Consequently, the exploitation of groundwater needs to be strictly limited or prohibited and the use of water-saving irrigation approaches encouraged to manage oasis agriculture sustainably.
This study highlighted that drip irrigation technique is an effective way of water-saving in oasis agriculture compared with traditional irrigation, which over-irrigates and wastes large amounts of water. Drip irrigation under film mulch reduced ET and increased WUE in the arid cropping systems, thus providing the scientific basis for extending the water-saving technique in arid regions. Arid and semiarid regions account for more than one-third of the terrestrial surface in the world [65]. Because of the scarcity of precipitation, agriculture mainly relies on irrigation in arid and semiarid regions. Therefore, promoting water-saving techniques is of great importance for the food safety and sustainability of water resources in these regions. Our study area, Zhangye, is the country’s largest seed maize production base, with approximately 0.21 million ha of cropping land. Although the government has vigorously promoted efficient water-saving techniques in recent years, until 2018, approximately half of irrigated farmland utilized water-saving technology (e.g., drip irrigation under film, sprinkler irrigation, and seepage irrigation), which greatly improves the efficiency of irrigation water in oasis agriculture. However, considering the scarcity of water resources and the large potential of promoting agricultural water-saving techniques in arid regions, water-saving irrigation techniques should be extended into additional regions.
5. Conclusions
Based on a continuous flux observation tower, we investigated the interannual dynamic patterns of ET components and WUE under different irrigation management practices in an oasis cropland in the arid region of North-Western China. In the seven-year observation period, the ecosystem WUE and canopy WUE of the maize ecosystem were 1.90 ± 0.17 g C kg−1 H2O and 2.44 ± 0.21 g C kg−1 H2O, respectively. Flooding irrigation can infiltrate into the deep soil layer, thereby influencing both shallow and deep soil moisture, while higher-frequency drip irrigation results in a lower irrigation amount and wetting depth, and a shallower percolation process, which only influences the shallow soil moisture. Drip irrigation can lead to decreases of soil moisture of approximately 27–32% and 36–42% compared with flood irrigation for shallow and deep layers, respectively. Additionally, drip irrigation decreases ET by 13% and T by 11–14%, which thus increases ecosystem and canopy WUE by 9–14% and 11%, respectively, compared to traditional irrigation practice. In this study, WUE decreased significantly with increases in water availability and precipitation during the growing seasons. Our results provide direct field evidence that drip irrigation technique is an effective method of water-saving and increasing WUE of arid agricultural systems. Given the large potential of promoting water-saving techniques in oasis agriculture, our results have implications for agricultural water resource management in water-limited regions.
Author Contributions
H.W. and X.L. conceived and designed the research. H.W., and J.T. processed and analyzed the data. All authors reviewed and edited the manuscript. All authors have read and agreed to the published version of the manuscript.
Funding
This study was funded by the Strategic Priority Research Program of the Chinese Academy of Sciences: grant No. XDA20100104; and the National Natural Science Foundation of China: grant Nos. 41871250, 41701420 and 41401412; and the Longyuan Young Innovative Talents Program (2020).
Acknowledgments
We thank Shaomin Liu, Ziwei Xu, Yang Zhang and Zhiguo Ren for collection and processing of the flux measurements. We are grateful for the distribution of the MODIS products by the Oak Ridge National Laboratory (ORNL) Distributed Active Archive Center (DAAC). We also thank the reviewers for useful comments and suggestions.
Conflicts of Interest
The authors declare no conflict of interest.
References
- Dinar, A.; Tieu, A.; Huynh, H. Water scarcity impacts on global food production. Glob. Food Secur. 2019, 23, 212–226. [Google Scholar] [CrossRef] [Green Version]
- Wang, H.; Li, X.; Xiao, J.; Ma, M.; Tan, J.; Wang, X.; Geng, L. Carbon fluxes across alpine, oasis, and desert ecosystems in northwestern China: The importance of water availability. Sci. Total Environ. 2019, 697, 133978. [Google Scholar] [CrossRef] [PubMed]
- Vereecken, H.; Burauel, P.; Groeneweg, J.; Klumpp, E.; Mittelstaedt, W.; Narres, H.D.; Pütz, T.; van der Kruk, J.; Vanderborght, J.; Wendland, F. Research at the Agrosphere Institute: From the Process Scale to the Catchment Scale. Vadose Zone J. 2009, 8, 664–669. [Google Scholar] [CrossRef]
- McLaughlin, D.; Kinzelbach, W. Food security and sustainable resource management. Water Resour. Res. 2015, 51, 4966–4985. [Google Scholar] [CrossRef]
- Liu, B.; Guan, H.; Zhao, W.; Yang, Y.; Li, S. Groundwater facilitated water-Use efficiency along a gradient of groundwater depth in arid northwestern China. Agric. For. Meteorol. 2017, 233, 235–241. [Google Scholar] [CrossRef]
- Wang, H.; Ma, M. Impacts of Climate Change and Anthropogenic Activities on the Ecological Restoration of Wetlands in the Arid Regions of China. Energies 2016, 9, 166. [Google Scholar] [CrossRef] [Green Version]
- Liu, Y.; Xiao, J.; Ju, W.; Zhou, Y.; Wang, S.; Wu, X. Water use efficiency of China’s terrestrial ecosystems and responses to drought. Sci. Rep. 2015, 5, 13799. [Google Scholar] [CrossRef]
- Beer, C.; Ciais, P.; Reichstein, M.; Baldocchi, D.; Law, B.E.; Papale, D.; Soussana, J.F.; Ammann, C.; Buchmann, N.; Frank, D.; et al. Temporal and among-Site variability of inherent water use efficiency at the ecosystem level. Glob. Biogeochem. Cycles 2009, 23, GB2018. [Google Scholar] [CrossRef]
- Law, B.E.; Falge, E.; Gu, L.; Baldocchi, D.D.; Bakwin, P.; Berbigier, P.; Davis, K.; Dolman, A.J.; Falk, M.; Fuentes, J.D.; et al. Environmental controls over carbon dioxide and water vapor exchange of terrestrial vegetation. Agric. For. Meteorol. 2002, 113, 97–120. [Google Scholar] [CrossRef] [Green Version]
- Yu, G.; Song, X.; Wang, Q.; Liu, Y.; Guan, D.; Yan, J.; Sun, X.; Zhang, L.; Wen, X. Water-Use efficiency of forest ecosystems in eastern China and its relations to climatic variables. New Phytol. 2008, 177, 927–937. [Google Scholar] [CrossRef]
- Keenan, T.F.; Hollinger, D.Y.; Bohrer, G.; Dragoni, D.; Munger, J.W.; Schmid, H.P.; Richardson, A.D. Increase in forest water-use efficiency as atmospheric carbon dioxide concentrations rise. Nature 2013, 499, 324–327. [Google Scholar] [CrossRef] [PubMed]
- Su, Z. The Surface Energy Balance System (SEBS) for estimation of turbulent heat fluxes. Hydrol. Earth Syst. Sci. 2002, 6, 85–100. [Google Scholar] [CrossRef]
- Wang, H.; Ma, M.; Yu, W.; Huang, G. Estimation of evapotransipiration of grassland and cropland ecosystems in arid region based on MODIS satellite data and Penman-Monteith equation. In Proceedings of the IEEE International Geoscience and Remote Sensing Symposium—IGARSS, Melbourne, VIC, Australia, 21–26 July 2013; pp. 1763–1766. [Google Scholar]
- Katerji, N.; Mastrorilli, M.; Rana, G. Water use efficiency of crops cultivated in the Mediterranean region: Review and analysis. Eur. J. Agron. 2008, 28, 493–507. [Google Scholar] [CrossRef]
- Kühling, I.; Atoev, S.; Trautz, D. Sustainable Intensification in Dryland Cropping Systems—Perspectives for Adaptions across the Western Siberian Grain Belt. Agriculture 2018, 8, 63. [Google Scholar] [CrossRef] [Green Version]
- Bremer, D.J.; Auen, L.M.; Ham, J.M.; Owensby, C.E. Evapotranspiration in a Prairie Ecosystem: Effects of Grazing by Cattle. Agron. J. 2001, 93, 338–348. [Google Scholar] [CrossRef] [Green Version]
- Chen, C.; Wang, E.; Yu, Q. Modelling the effects of climate variability and water management on crop water productivity and water balance in the North China Plain. Agric. Water Manag. 2010, 97, 1175–1184. [Google Scholar] [CrossRef]
- Suyker, A.E.; Verma, S.B. Coupling of carbon dioxide and water vapor exchanges of irrigated and rainfed maize–Soybean cropping systems and water productivity. Agric. For. Meteorol. 2010, 150, 553–563. [Google Scholar] [CrossRef] [Green Version]
- Suyker, A.E.; Verma, S.B. Evapotranspiration of irrigated and rainfed maize–Soybean cropping systems. Agric. For. Meteorol. 2009, 149, 443–452. [Google Scholar] [CrossRef] [Green Version]
- Zwart, S.J.; Leclert, L.M.C. A remote sensing-based irrigation performance assessment: A case study of the Office du Niger in Mali. Irrig. Sci. 2010, 28, 371–385. [Google Scholar] [CrossRef] [Green Version]
- Hussain, M.Z.; Hamilton, S.K.; Bhardwaj, A.K.; Basso, B.; Thelen, K.D.; Robertson, G.P. Evapotranspiration and water use efficiency of continuous maize and maize and soybean in rotation in the upper Midwest U.S. Agric. Water Manag. 2019, 221, 92–98. [Google Scholar] [CrossRef]
- Wen, X.; Yang, B.; Sun, X.; Lee, X. Evapotranspiration partitioning through in-Situ oxygen isotope measurements in an oasis cropland. Agric. For. Meteorol. 2016, 230–231, 89–96. [Google Scholar] [CrossRef] [Green Version]
- Schlesinger, W.H.; Jasechko, S. Transpiration in the global water cycle. Agric. For. Meteorol. 2014, 189–190, 115–117. [Google Scholar] [CrossRef]
- Monteith, J.L. Evaporation and environment. Symp. Soc. Exp. Biol. 1965, 19, 205–234. [Google Scholar]
- Shuttleworth, W.J.; Wallace, J.S. Evaporation from sparse crops-An energy combination theory. Q. J. R. Meteorol. Soc. 1985, 111, 839–855. [Google Scholar] [CrossRef]
- Cleugh, H.A.; Leuning, R.; Mu, Q.; Running, S.W. Regional evaporation estimates from flux tower and MODIS satellite data. Remote Sens. Environ. 2007, 106, 285–304. [Google Scholar] [CrossRef]
- Leuning, R.; Zhang, Y.Q.; Rajaud, A.; Cleugh, H.; Tu, K. A simple surface conductance model to estimate regional evaporation using MODIS leaf area index and the Penman-Monteith equation. Water Resour. Res. 2008, 44, W10419. [Google Scholar] [CrossRef]
- Fisher, J.B.; Tu, K.P.; Baldocchi, D.D. Global estimates of the land–Atmosphere water flux based on monthly AVHRR and ISLSCP-II data, validated at 16 FLUXNET sites. Remote Sens. Environ. 2008, 112, 901–919. [Google Scholar] [CrossRef]
- Song, Y.; Jin, L.; Zhu, G.; Ma, M. Parameter estimation for a simple two-Source evapotranspiration model using Bayesian inference and its application to remotely sensed estimations of latent heat flux at the regional scale. Agric. For. Meteorol. 2016, 230–231, 20–32. [Google Scholar] [CrossRef]
- Wang, H.; Ma, M. Estimation of transpiration and evaporation of different ecosystems in an inland river basin using remote sensing data and the Penman-Monteith equation. Acta Ecol. Sin. 2014, 34, 5617–5626. [Google Scholar]
- Zhang, X.; Qin, W.; Chen, S.; Shao, L.; Sun, H. Responses of yield and WUE of winter wheat to water stress during the past three decades—A case study in the North China Plain. Agric. Water Manag. 2017, 179, 47–54. [Google Scholar] [CrossRef]
- Xu, C.; Tao, H.; Tian, B.; Gao, Y.; Ren, J.; Wang, P. Limited-Irrigation improves water use efficiency and soil reservoir capacity through regulating root and canopy growth of winter wheat. Field Crops Res. 2016, 196, 268–275. [Google Scholar] [CrossRef]
- Jensen, C.R.; Ørum, J.E.; Pedersen, S.M.; Andersen, M.N.; Plauborg, F.; Liu, F.; Jacobsen, S.-E. A Short Overview of Measures for Securing Water Resources for Irrigated Crop Production. J. Agron. Crop Sci. 2014, 200, 333–343. [Google Scholar] [CrossRef]
- Sezen, S.M.; Yazar, A.; Eker, S. Effect of drip irrigation regimes on yield and quality of field grown bell pepper. Agric. Water Manag. 2006, 81, 115–131. [Google Scholar] [CrossRef]
- Wen, Y.; Shang, S.; Yang, J. Optimization of irrigation scheduling for spring wheat with mulching and limited irrigation water in an arid climate. Agric. Water Manag. 2017, 192, 33–44. [Google Scholar] [CrossRef]
- Filipović, V.; Romić, D.; Romić, M.; Borošić, J.; Filipović, L.; Mallmann, F.J.K.; Robinson, D.A. Plastic mulch and nitrogen fertigation in growing vegetables modify soil temperature, water and nitrate dynamics: Experimental results and a modeling study. Agric. Water Manag. 2016, 176, 100–110. [Google Scholar] [CrossRef] [Green Version]
- Xie, Z.; Wang, Y.; Li, F. Effect of plastic mulching on soil water use and spring wheat yield in arid region of northwest China. Agric. Water Manag. 2005, 75, 71–83. [Google Scholar] [CrossRef]
- Chen, Y.; Liu, T.; Tian, X.; Wang, X.; Li, M.; Wang, S.; Wang, Z. Effects of plastic film combined with straw mulch on grain yield and water use efficiency of winter wheat in Loess Plateau. Field Crops Res. 2015, 172, 53–58. [Google Scholar] [CrossRef]
- Li, X.; Cheng, G.; Ge, Y.; Li, H.; Han, F.; Hu, X.; Tian, W.; Tian, Y.; Pan, X.; Nian, Y.; et al. Hydrological Cycle in the Heihe River Basin and Its Implication for Water Resource Management in Endorheic Basins. J. Geophys. Res. Atmos. 2018, 123, 890–914. [Google Scholar] [CrossRef]
- Zeng, Z.; Liu, J.; Koeneman, P.H.; Zarate, E.; Hoekstra, A.Y. Assessing water footprint at river basin level: A case study for the Heihe River Basin in northwest China. Hydrol. Earth Syst. Sci. 2012, 16, 2771–2781. [Google Scholar] [CrossRef] [Green Version]
- Zhao, W.; Liu, B.; Zhang, Z. Water requirements of maize in the middle Heihe River basin, China. Agric. Water Manag. 2010, 97, 215–223. [Google Scholar] [CrossRef]
- Hu, X.; Lu, L.; Li, X.; Wang, J.; Guo, M.J.P.O. Land Use/Cover Change in the Middle Reaches of the Heihe River Basin over 2000–2011 and Its Implications for Sustainable Water Resource Management. PLoS ONE 2015, 10, e0128960. [Google Scholar] [CrossRef] [PubMed]
- Liu, S.; Li, X.; Xu, Z.; Che, T.; Xiao, Q.; Ma, M.; Liu, Q.; Jin, R.; Guo, J.; Wang, L.; et al. The Heihe Integrated Observatory Network: A Basin-Scale Land Surface Processes Observatory in China. Vadose Zone J. 2018, 17, 180072. [Google Scholar] [CrossRef]
- Wang, H.; Ma, M. Comparing the seasonal variation of parameter estimation of ecosystem carbon exchange between alpine meadow and cropland in Heihe River Basin, northwestern China. Sci. Cold Arid Reg. 2015, 7, 216–228. [Google Scholar]
- Li, X.; Cheng, G.; Liu, S.; Xiao, Q.; Ma, M.; Jin, R.; Che, T.; Liu, Q.; Wang, W.; Qi, Y.; et al. Heihe Watershed Allied Telemetry Experimental Research (HiWATER): Scientific Objectives and Experimental Design. Bull. Am. Meteorol. Soc. 2013, 94, 1145–1160. [Google Scholar] [CrossRef]
- Wang, H.; Li, X.; Ma, M.; Geng, L. Improving Estimation of Gross Primary Production in Dryland Ecosystems by a Model-Data Fusion Approach. Remote Sens. 2019, 11, 225. [Google Scholar] [CrossRef] [Green Version]
- Liu, S.M.; Xu, Z.W.; Wang, W.Z.; Jia, Z.Z.; Zhu, M.J.; Bai, J.; Wang, J.M. A comparison of eddy-Covariance and large aperture scintillometer measurements with respect to the energy balance closure problem. Hydrol. Earth Syst. Sci. 2011, 15, 1291–1306. [Google Scholar] [CrossRef] [Green Version]
- Xu, Z.; Liu, S.; Li, X.; Shi, S.; Wang, J.; Zhu, Z.; Xu, T.; Wang, W.; Ma, M. Intercomparison of surface energy flux measurement systems used during the HiWATER-MUSOEXE. J. Geophys. Res. Atmos. 2013, 118, 13140–13157. [Google Scholar] [CrossRef]
- Zhou, Y.; Li, X. Energy balance closures in diverse ecosystems of an endorheic river basin. Agric. For. Meteorol. 2019, 274, 118–131. [Google Scholar] [CrossRef]
- Wutzler, T.; Lucas-Moffat, A.; Migliavacca, M.; Knauer, J.; Sickel, K.; Šigut, L.; Menzer, O.; Reichstein, M. Basic and extensible post-Processing of eddy covariance flux data with REddyProc. Biogeosciences 2018, 15, 5015–5030. [Google Scholar] [CrossRef] [Green Version]
- Geng, L.; Ma, M.; Wang, X.; Yu, W.; Jia, S.; Wang, H. Comparison of Eight Techniques for Reconstructing Multi-Satellite Sensor Time-Series NDVI Data Sets in the Heihe River Basin, China. Remote Sens. 2014, 6, 2024–2049. [Google Scholar] [CrossRef] [Green Version]
- Niu, S.; Xing, X.; Zhang, Z.; Xia, J.; Zhou, X.; Song, B.; Li, L.; Wan, S. Water-Use efficiency in response to climate change: From leaf to ecosystem in a temperate steppe. Glob. Chang. Biol. 2011, 17, 1073–1082. [Google Scholar] [CrossRef]
- Granier, A.; Reichstein, M.; Bréda, N.; Janssens, I.A.; Falge, E.; Ciais, P.; Grünwald, T.; Aubinet, M.; Berbigier, P.; Bernhofer, C.; et al. Evidence for soil water control on carbon and water dynamics in European forests during the extremely dry year: 2003. Agric. For. Meteorol. 2007, 143, 123–145. [Google Scholar] [CrossRef]
- Ma, J.; Jia, X.; Zha, T.; Bourque, C.P.A.; Tian, Y.; Bai, Y.; Liu, P.; Yang, R.; Li, C.; Li, C.; et al. Ecosystem water use efficiency in a young plantation in Northern China and its relationship to drought. Agric. For. Meteorol. 2019, 275, 1–10. [Google Scholar] [CrossRef]
- Su, Z.; Yacob, A.; Wen, J.; Roerink, G.; He, Y.; Gao, B.; Boogaard, H.; van Diepen, C. Assessing relative soil moisture with remote sensing data: Theory, experimental validation, and application to drought monitoring over the North China Plain. Phys. Chem. Earth Parts A/B/C 2003, 28, 89–101. [Google Scholar] [CrossRef]
- Allen, R.G.; Pereira, L.S.; Raes, D.; Smith, M. Crop Evapotranspiration-Guidelines for Computing Crop Water Requirements-FAO Irrigation and Drainage Paper 56; FAO: Rome, Italy, 1998. [Google Scholar]
- Aguilos, M.; Stahl, C.; Burban, B.; Hérault, B.; Courtois, E.; Coste, S.; Wagner, F.; Ziegler, C.; Takagi, K.; Bonal, D. Interannual and Seasonal Variations in Ecosystem Transpiration and Water Use Efficiency in a Tropical Rainforest. Forests 2019, 10, 14. [Google Scholar] [CrossRef] [Green Version]
- Xiao, J.; Sun, G.; Chen, J.; Chen, H.; Chen, S.; Dong, G.; Gao, S.; Guo, H.; Guo, J.; Han, S.; et al. Carbon fluxes, evapotranspiration, and water use efficiency of terrestrial ecosystems in China. Agric. For. Meteorol. 2013, 182–183, 76–90. [Google Scholar] [CrossRef]
- Zhu, X.J.; Yu, G.R.; Wang, Q.F.; Hu, Z.M.; Zheng, H.; Li, S.G.; Sun, X.M.; Zhang, Y.P.; Yan, J.H.; Wang, H.M.; et al. Spatial variability of water use efficiency in China’s terrestrial ecosystems. Glob. Planet. Chang. 2015, 129, 37–44. [Google Scholar] [CrossRef]
- Zhan, L.; Yang, H.; Lei, H. Analysis of corn water consumption, carbon assimilation and ecosystem water use efficiency based on flux observations. Trans. Chin. Soc. Agric. Eng. 2016, 32, 88–93. [Google Scholar]
- Li, X.; Yang, K.; Zhou, Y. Progress in the study of oasis-Desert interactions. Agric. For. Meteorol. 2016, 230–231, 1–7. [Google Scholar] [CrossRef]
- Hu, Z.; Yu, G.; Fu, Y.; Sun, X.; Li, Y.; Shi, P.; Wang, Y.; Zheng, Z. Effects of vegetation control on ecosystem water use efficiency within and among four grassland ecosystems in China. Glob. Chang. Biol. 2008, 14, 1609–1619. [Google Scholar] [CrossRef]
- Yang, B.; Wen, X.; Sun, X. Irrigation depth far exceeds water uptake depth in an oasis cropland in the middle reaches of Heihe River Basin. Sci. Rep. 2015, 5, 15206. [Google Scholar] [CrossRef] [PubMed] [Green Version]
- Silburn, D.M.; Foley, J.L.; Biggs, A.J.W.; Montgomery, J.; Gunawardena, T.A.J.C.; Science, P. The Australian Cotton Industry and four decades of deep drainage research: A review. Crop Pasture Sci. 2013, 64, 1049–1075. [Google Scholar] [CrossRef] [Green Version]
- Wang, H.; Ma, M.; Geng, L. Monitoring the recent trend of aeolian desertification using Landsat TM and Landsat 8 imagery on the north-east Qinghai–Tibet Plateau in the Qinghai Lake basin. Nat. Hazards 2015, 79, 1753–1772. [Google Scholar] [CrossRef]
Figure 1.
Location of the study site (Daman) in the Heihe River Basin (HRB) and in the North-Western China. The right figure shows the flux tower measurement in the Daman (a). The below figures show drip irrigation under mulch film (b,c).
Figure 1.
Location of the study site (Daman) in the Heihe River Basin (HRB) and in the North-Western China. The right figure shows the flux tower measurement in the Daman (a). The below figures show drip irrigation under mulch film (b,c).

Figure 2.
Comparisons of different evapotranspiration partitioning methods with the Penman-Monteith-Leuning model and measurements of lysimeter and isotope methods. The performance of the model was validated by using the flux tower measured Evapotranspiration (ET) (a,c), and the lysimeter and isotope observed transpiration (T) (b,d). (a,b) showed the time series results of the validation, while (c,d) showed the scatter plot of the validated results.

Figure 3.
Temporal variations in daily mean solar radiation (Rg, W m−2) (a), air temperature (Ta, °C) (b), vapor pressure deficit (VPD, hpa) (c), daily integrated precipitation (P, mm) (d), enhanced vegetation index (EVI) (e), and relative extractable water (REW) (f) at different depths.
Figure 3.
Temporal variations in daily mean solar radiation (Rg, W m−2) (a), air temperature (Ta, °C) (b), vapor pressure deficit (VPD, hpa) (c), daily integrated precipitation (P, mm) (d), enhanced vegetation index (EVI) (e), and relative extractable water (REW) (f) at different depths.

Figure 4.
Temporal variations in daily gross primary production (GPP) (a), evapotranspiration (ET) (b), and soil moisture (SM) (c) at different depths. Before 2017, flood-irrigation were used in the study site, while the drip irrigation were performed since the beginning of growing season in 2017.
Figure 4.
Temporal variations in daily gross primary production (GPP) (a), evapotranspiration (ET) (b), and soil moisture (SM) (c) at different depths. Before 2017, flood-irrigation were used in the study site, while the drip irrigation were performed since the beginning of growing season in 2017.

Figure 5.
Evaluation of irrigation events on (a) ET components and (b) water use efficiency (WUE) during the growing seasons before (2012–2016) and after (2017–2018) the use of a drip irrigation strategy. The black arrows represent irrigation events during the growing seasons. WUEe and WUEc represent ecosystem and canopy WUE, respectively. The tick labels of the time axis represented the time series of every year during the growing seasons (i.e., numbers that labeled in the middle of the time axis without brackets), while the numbers that labeled with brackets showed the beginning and ending of the growing seasons in each year.

Figure 6.
Monthly variations of gross primary production (GPP) (a), evapotranspiration (ET) (b), ecosystem water use efficiency (WUEe) (c), and soil moisture (SM) at different layers during the growing seasons (i.e., periods from May to September) (d–f).
Figure 6.
Monthly variations of gross primary production (GPP) (a), evapotranspiration (ET) (b), ecosystem water use efficiency (WUEe) (c), and soil moisture (SM) at different layers during the growing seasons (i.e., periods from May to September) (d–f).

Figure 7.
Annual variations of gross primary production (GPP) (a), evapotranspiration (ET) components (i.e., vegetation transpiration (T) and soil evaporation (E)), T fraction of the ET (T/ET) and accumulated annual precipitation (AAP) (b), water use efficiency (WUE) at both ecosystem and canopy levels (i.e., WUEe and WUEc) (c), and soil moisture (SM) at different layers (d).

Figure 8.
Relationship between daily gross primary production (GPP) and evapotranspiration (ET) during the periods of 2013–2018. The symbol ** indicates the statistical significance level of 0.01.
Figure 8.
Relationship between daily gross primary production (GPP) and evapotranspiration (ET) during the periods of 2013–2018. The symbol ** indicates the statistical significance level of 0.01.

Figure 9.
Relationship of monthly gross primary production (GPP) (a–e), evapotranspiration (ET) (f–j), transpiration (T) (k–o), water use efficiency at ecosystem level (WUEe) (p–t) and canopy level (WUEc) (u–y) with environment variables that including monthly mean air temperature (Ta), precipitation (P), soil moisture at 4 cm layer (SM), water availability index, and EVI during the growing seasons (i.e., periods from May to September).


Table 1.
Statistics of annual climatic variables in Daman site during 2013–2018.
| Variables | 2013 | 2014 | 2015 | 2016 | 2017 | 2018 | Average |
|---|---|---|---|---|---|---|---|
| Solar radiation (Rg, W m−2) | 183.52 | 178.57 | 179.53 | 174.32 | 172.06 | 169.32 | 176.22 ± 4.45 |
| Air temperature (Ta, °C) | 7.05 | 6.45 | 7.08 | 7.14 | 7.21 | 6.44 | 6.90 ± 0.3 |
| Precipitation (P, mm) | 136 | 145 | 161 | 102 | 187 | 112 | 140 ± 27 |
| Vapor pressure deficit (VPD, hpa) | 7.26 | 6.66 | 6.80 | 6.92 | 6.82 | 6.55 | 6.84 ± 0.21 |
| 4 cm soil moisture (SM_4cm, %) | 17.88 | 18.49 | 20.27 | 20.50 | 15.16 | 13.19 | 17.58 ± 2.44 |
| 40 cm soil moisture (SM_40cm, %) | 26.26 | 25.87 | 27.76 | 25.43 | 19.17 | 18.60 | 23.85 ± 3.32 |
| 160 cm soil moisture (SM_160cm, %) | 29.04 | 28.42 | 29.40 | 26.62 | 14.70 | 18.11 | 24.38 ± 5.37 |
| Enhanced vegetation index (EVI) | 0.24 | 0.27 | 0.26 | 0.23 | 0.26 | 0.27 | 0.26 ± 0.01 |
Table 2.
Statistics of annual gross primary production (GPP), evapotranspiration (ET) components (i.e., vegetation transpiration (T) and soil evaporation (E)), and water use efficiency (WUE) before and after using the drip irrigation strategy. The symbols “+” and “−” represent increased and decreased, respectively. Since the different intensity and frequency of drip irrigation practice in different years (the data had a relatively large amount of irrigation in 2017), we used both the data of 2018 and the average data of 2017–2018 (the bold number in brackets) to represent the effects of the drip irrigation strategy. Soil moisture (SM) at different layers were used.
| Variables | Flood Irrigation | Drip Irrigation | Change Values | Change Ratios (%) |
|---|---|---|---|---|
| GPP (g C m−2) | 1339.72 | 1337.62 (1286.71) | −2.09 (−53.01) | −0.16 (−3.96) |
| ET (kg H2O m−2) | 733.15 | 640.48 (640.39) | −92.67 (−92.76) | −12.64 (−12.65) |
| T (kg H2O m−2) | 572.01 | 511.45 (494.22) | −60.57 (−77.80) | −10.59 (−13.60) |
| E (kg H2O m−2) | 161.14 | 129.03 (146.17) | −32.11 (−14.96) | −19.92 (−9.29) |
| WUEe (g C kg−1 H2O) | 1.84 | 2.09 (2.01) | +0.25 (+0.17) | +13.59 (+9.28) |
| WUEc (g C kg−1 H2O) | 2.36 | 2.62 (2.60) | +0.26 (+0.25) | +10.98 (+10.46) |
| SM_4cm (%) | 19.28 | 13.19 (14.17) | −6.10 (−5.11) | −31.62 (−26.49) |
| SM_40cm (%) | 26.33 | 18.60 (18.88) | −7.73 (−7.45) | −29.37 (−28.28) |
| SM_160cm (%) | 28.37 | 18.11 (16.40) | −10.26 (−11.97) | −36.18 (−42.19) |
Table 3.
Statistics of partial correlation analysis and the multiple regression models. The symbol ** indicates the statistical significance level of 0.01 for each variable. The climatic parameters included monthly mean air temperature (Ta), precipitation (P), soil moisture at 4 cm layer (SM), water availability index (WAI), and enhanced vegetation index (EVI) during the growing seasons (i.e., periods from May to September). GPP, ET and T represent gross primary production, evapotranspiration and transpiration, respectively. WUEe and WUEc represent ecosystem and canopy water use efficiency (WUE), respectively. The best model represented the multiple models that removing the redundant variables.
| Dependent Variable | Multiple R2 | Ta | P | SM | WAI | EVI | Best Model |
|---|---|---|---|---|---|---|---|
| GPP | 0.96 | 0.86 ** | 0.48 ** | 0.29 | 0.14 | 0.86 ** | GPP = f (Ta, P, EVI) |
| ET | 0.87 | 0.76 ** | 0.17 | 0.21 | 0.54 ** | 0.02 | ET = f (Ta, WAI) |
| T | 0.89 | 0.80 ** | 0.15 | 0.23 | 0.33 | 0.29 | T= f (Ta) |
| WUEe | 0.92 | 0.49 ** | 0.25 | −0.02 | 0.10 | 0.80 ** | WUEe = f (Ta, EVI) |
| WUEc | 0.89 | 0.05 | 0.21 | −0.09 | 0.35 | 0.72 ** | WUEc = f (EVI) |
© 2020 by the authors. Licensee MDPI, Basel, Switzerland. This article is an open access article distributed under the terms and conditions of the Creative Commons Attribution (CC BY) license (http://creativecommons.org/licenses/by/4.0/).
Share and Cite
MDPI and ACS Style
Wang, H.; Li, X.; Tan, J. Interannual Variations of Evapotranspiration and Water Use Efficiency over an Oasis Cropland in Arid Regions of North-Western China. Water 2020, 12, 1239. https://doi.org/10.3390/w12051239
AMA Style
Wang H, Li X, Tan J. Interannual Variations of Evapotranspiration and Water Use Efficiency over an Oasis Cropland in Arid Regions of North-Western China. Water. 2020; 12(5):1239. https://doi.org/10.3390/w12051239
Chicago/Turabian StyleWang, Haibo, Xin Li, and Junlei Tan. 2020. "Interannual Variations of Evapotranspiration and Water Use Efficiency over an Oasis Cropland in Arid Regions of North-Western China" Water 12, no. 5: 1239. https://doi.org/10.3390/w12051239
Note that from the first issue of 2016, this journal uses article numbers instead of page numbers. See further details here.